
3D Multi-Parameter Geological Modeling and Knowledge Findings for Mo Oxide Orebodies in the Shangfanggou Porphyry–Skarn Mo (–Fe) Deposit, Henan Province, China

 ,
,
Abstract
:1. Introduction
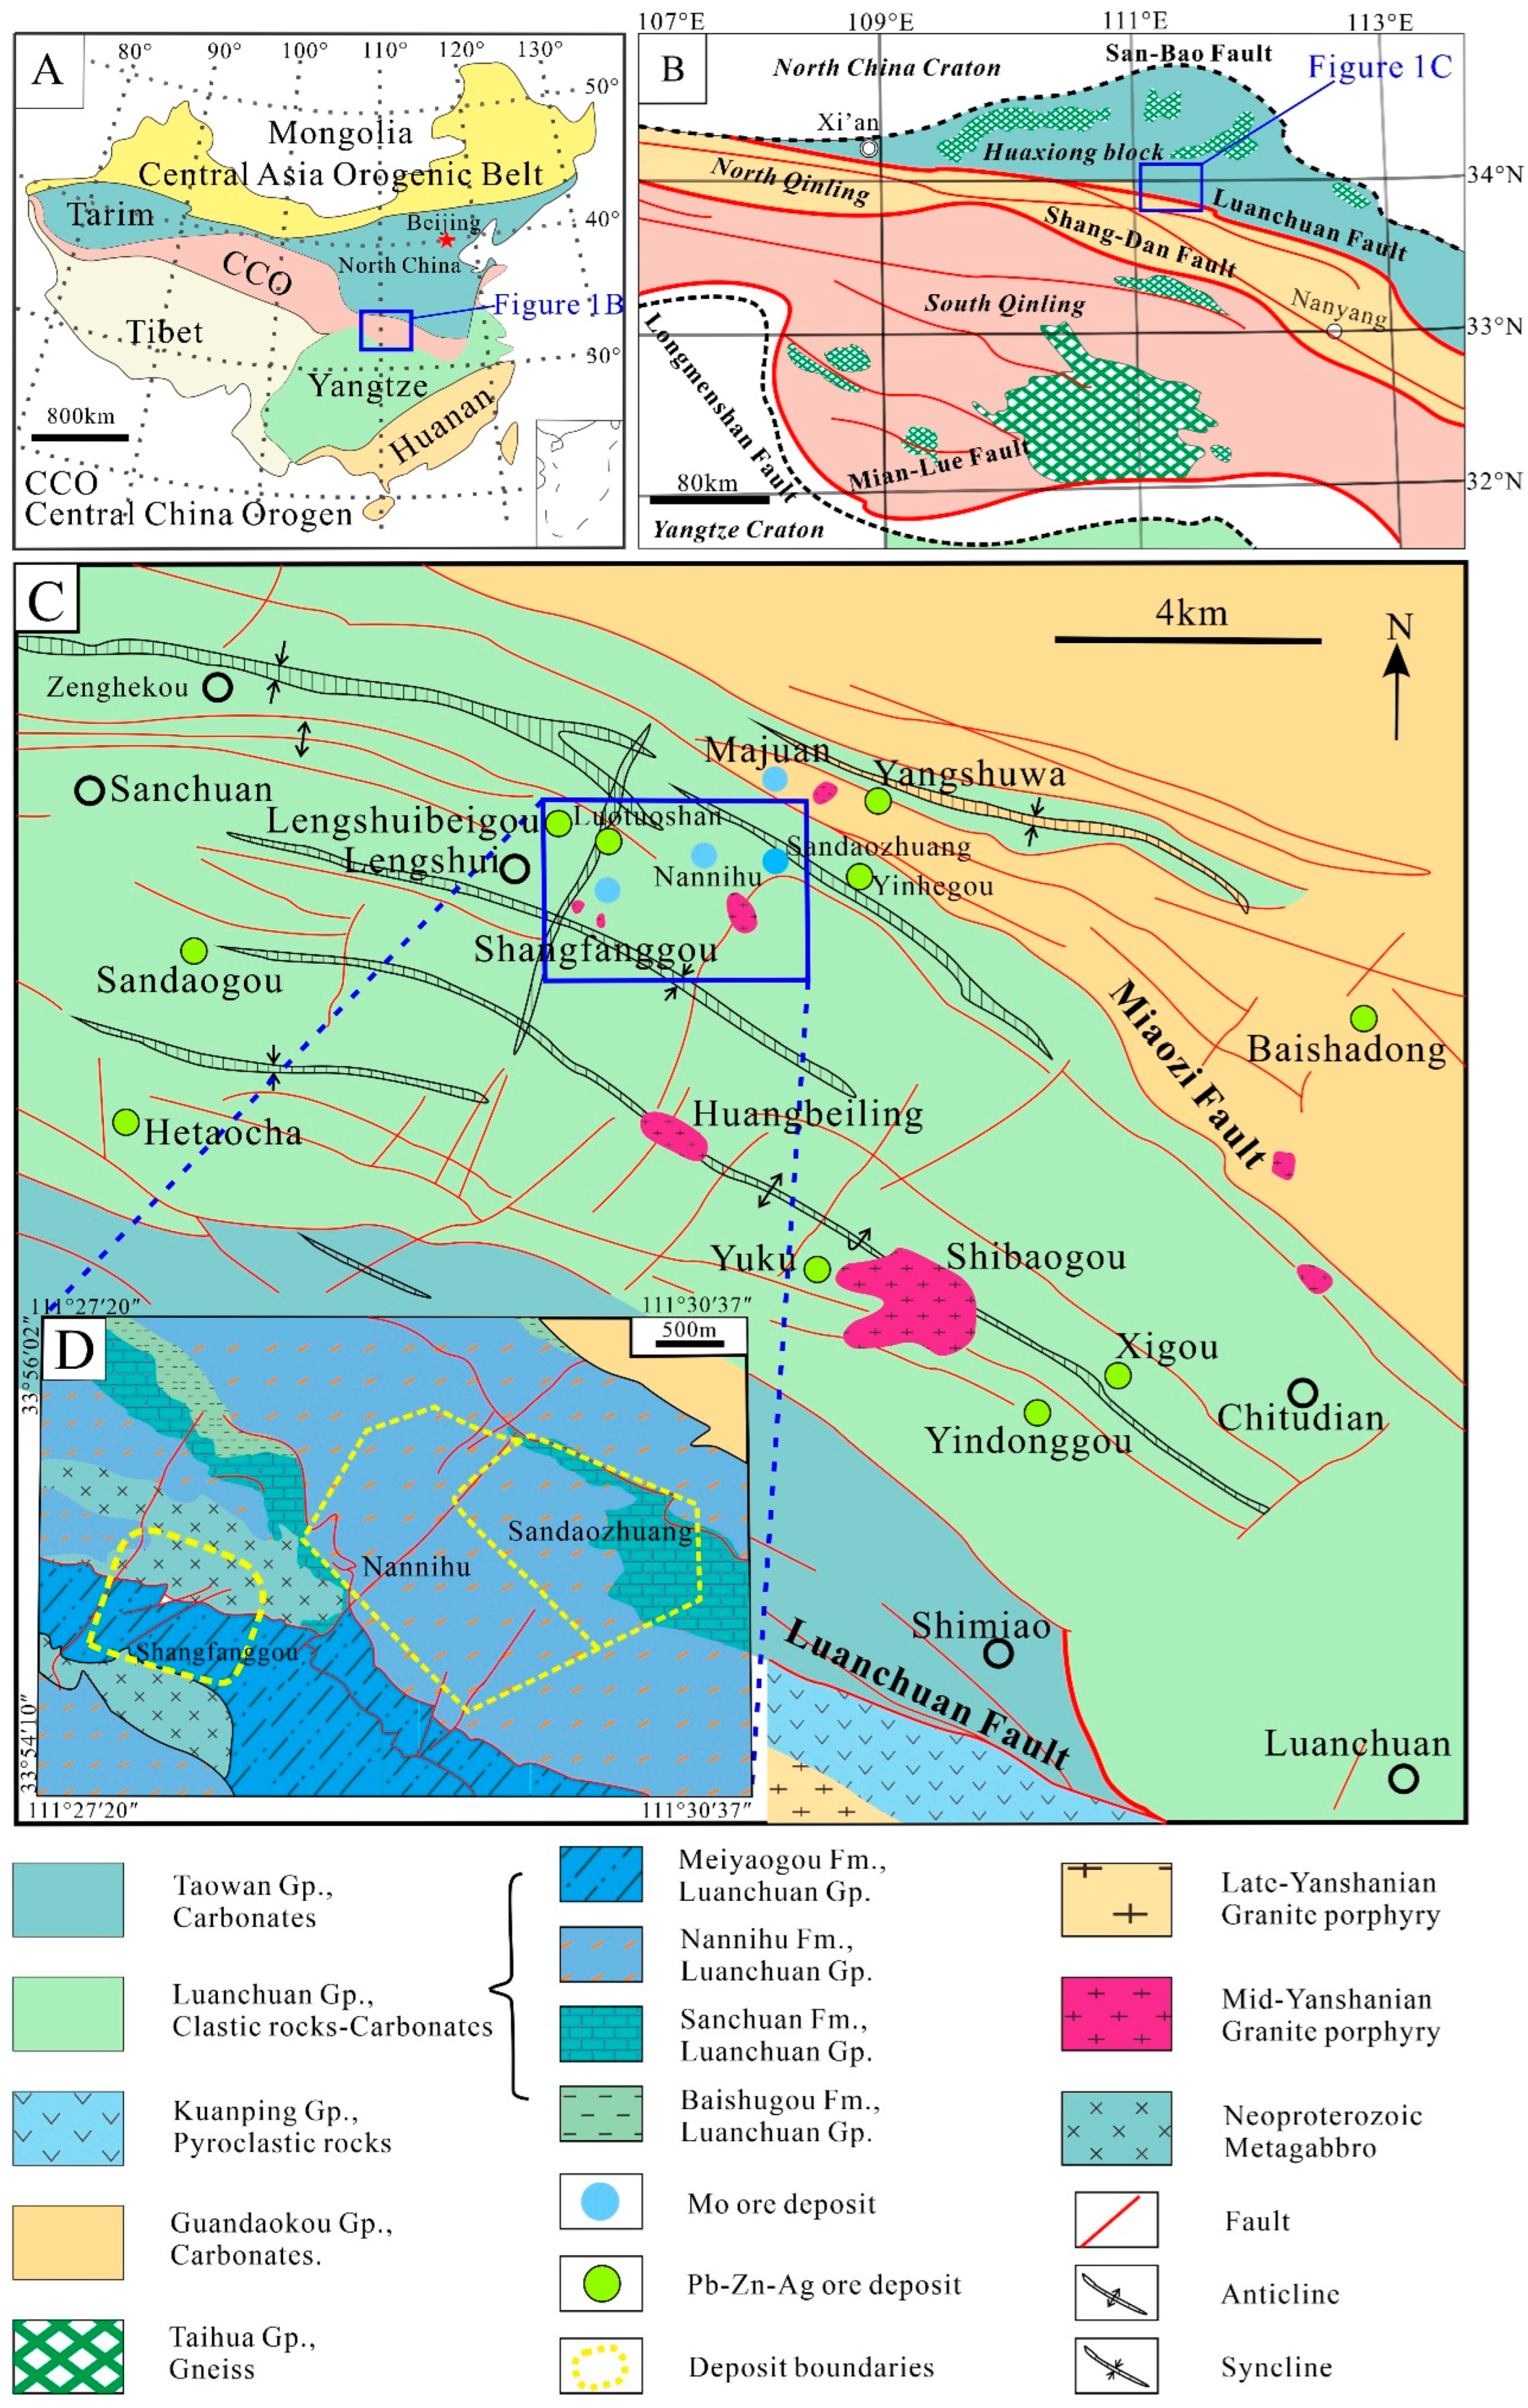
2. Geological Setting
2.1. Regional Geology

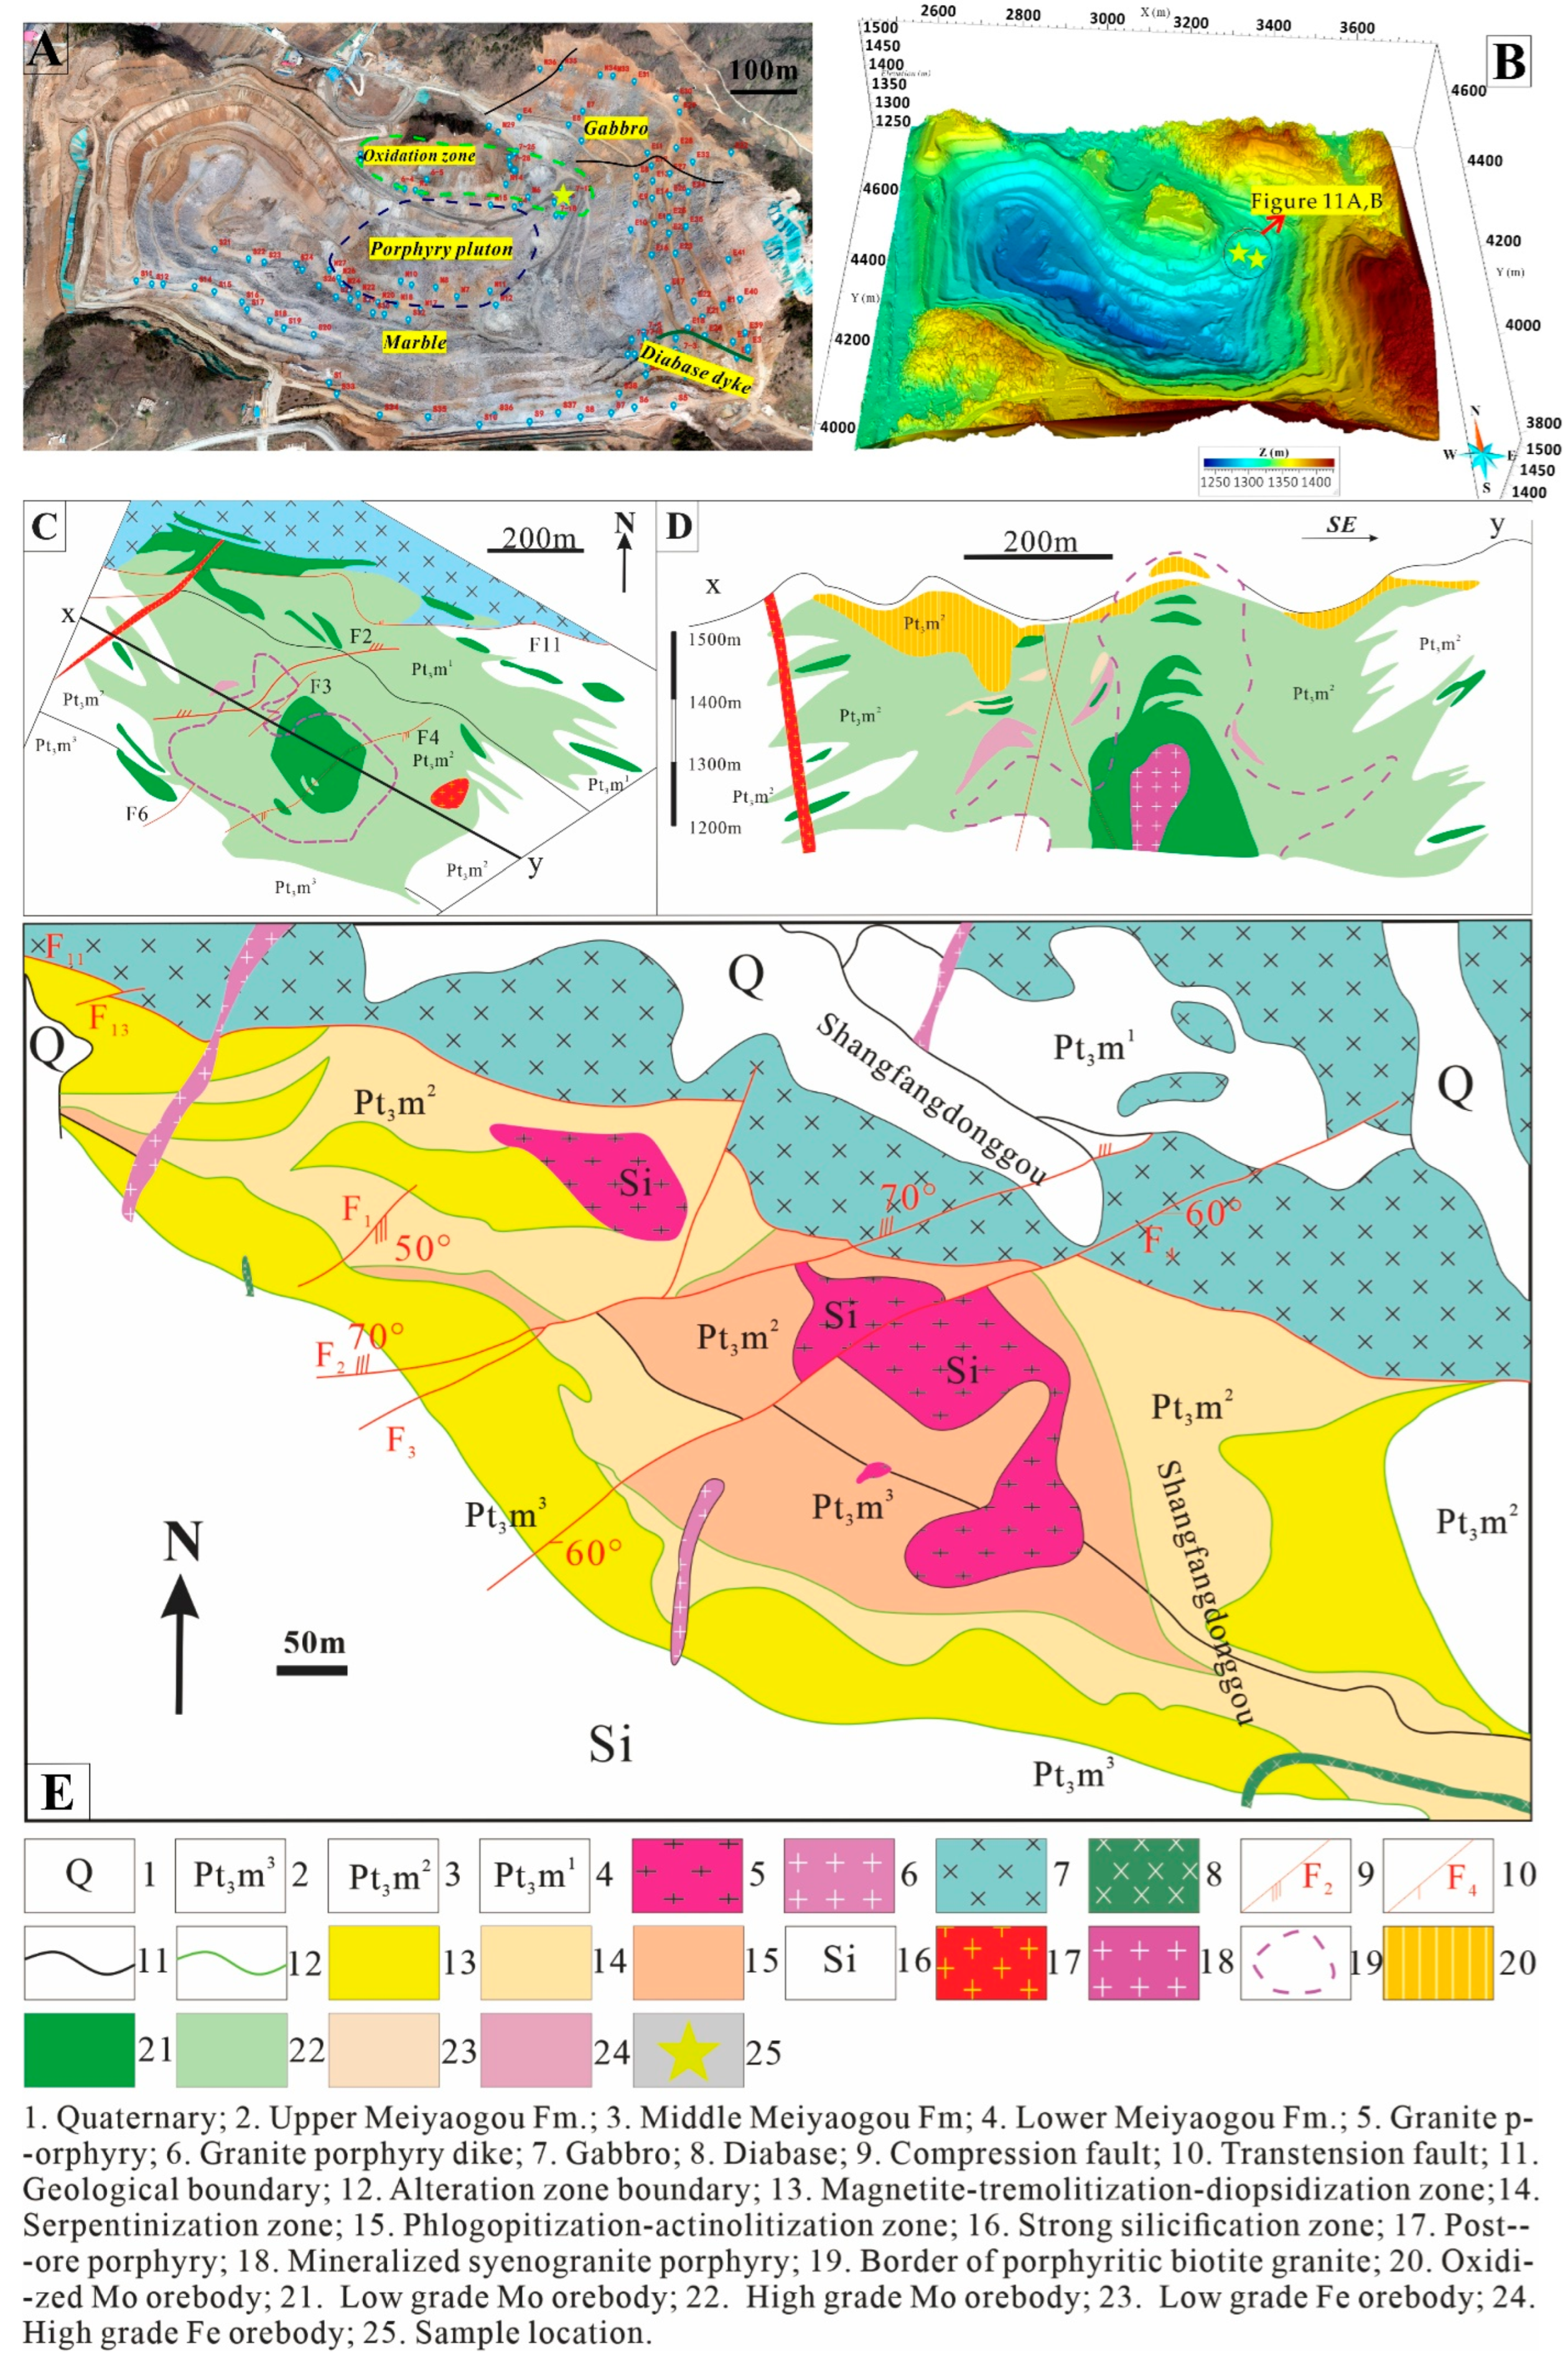
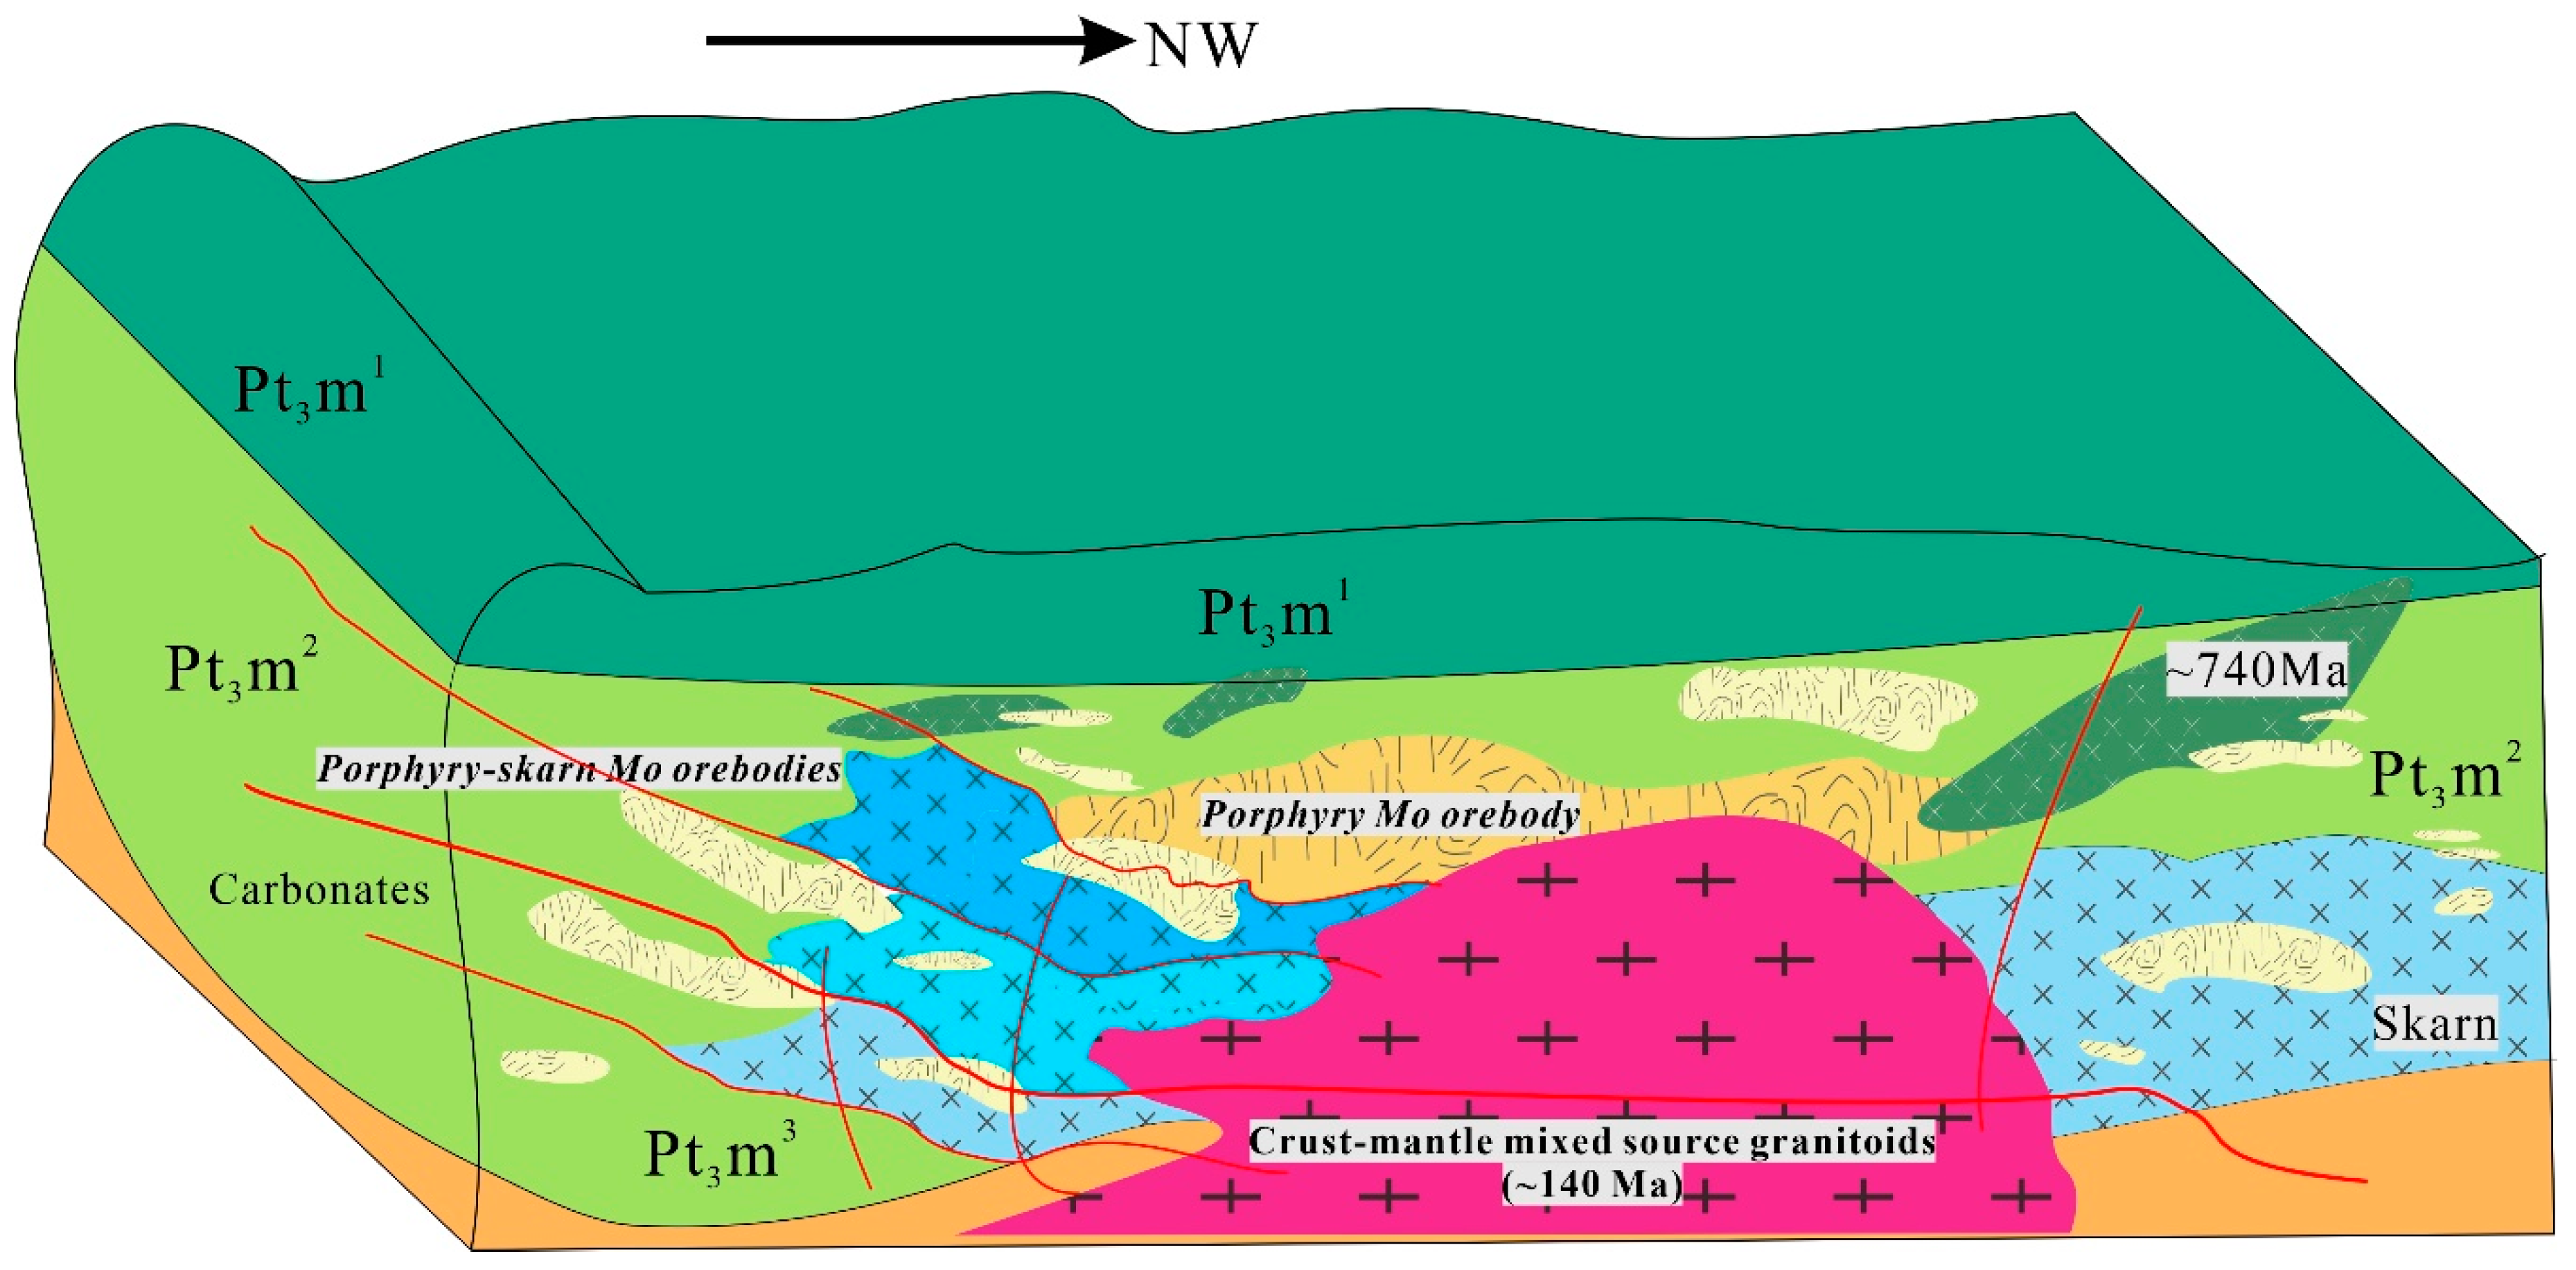
2.2. Deposit Geology


3. 3D Geological Modeling
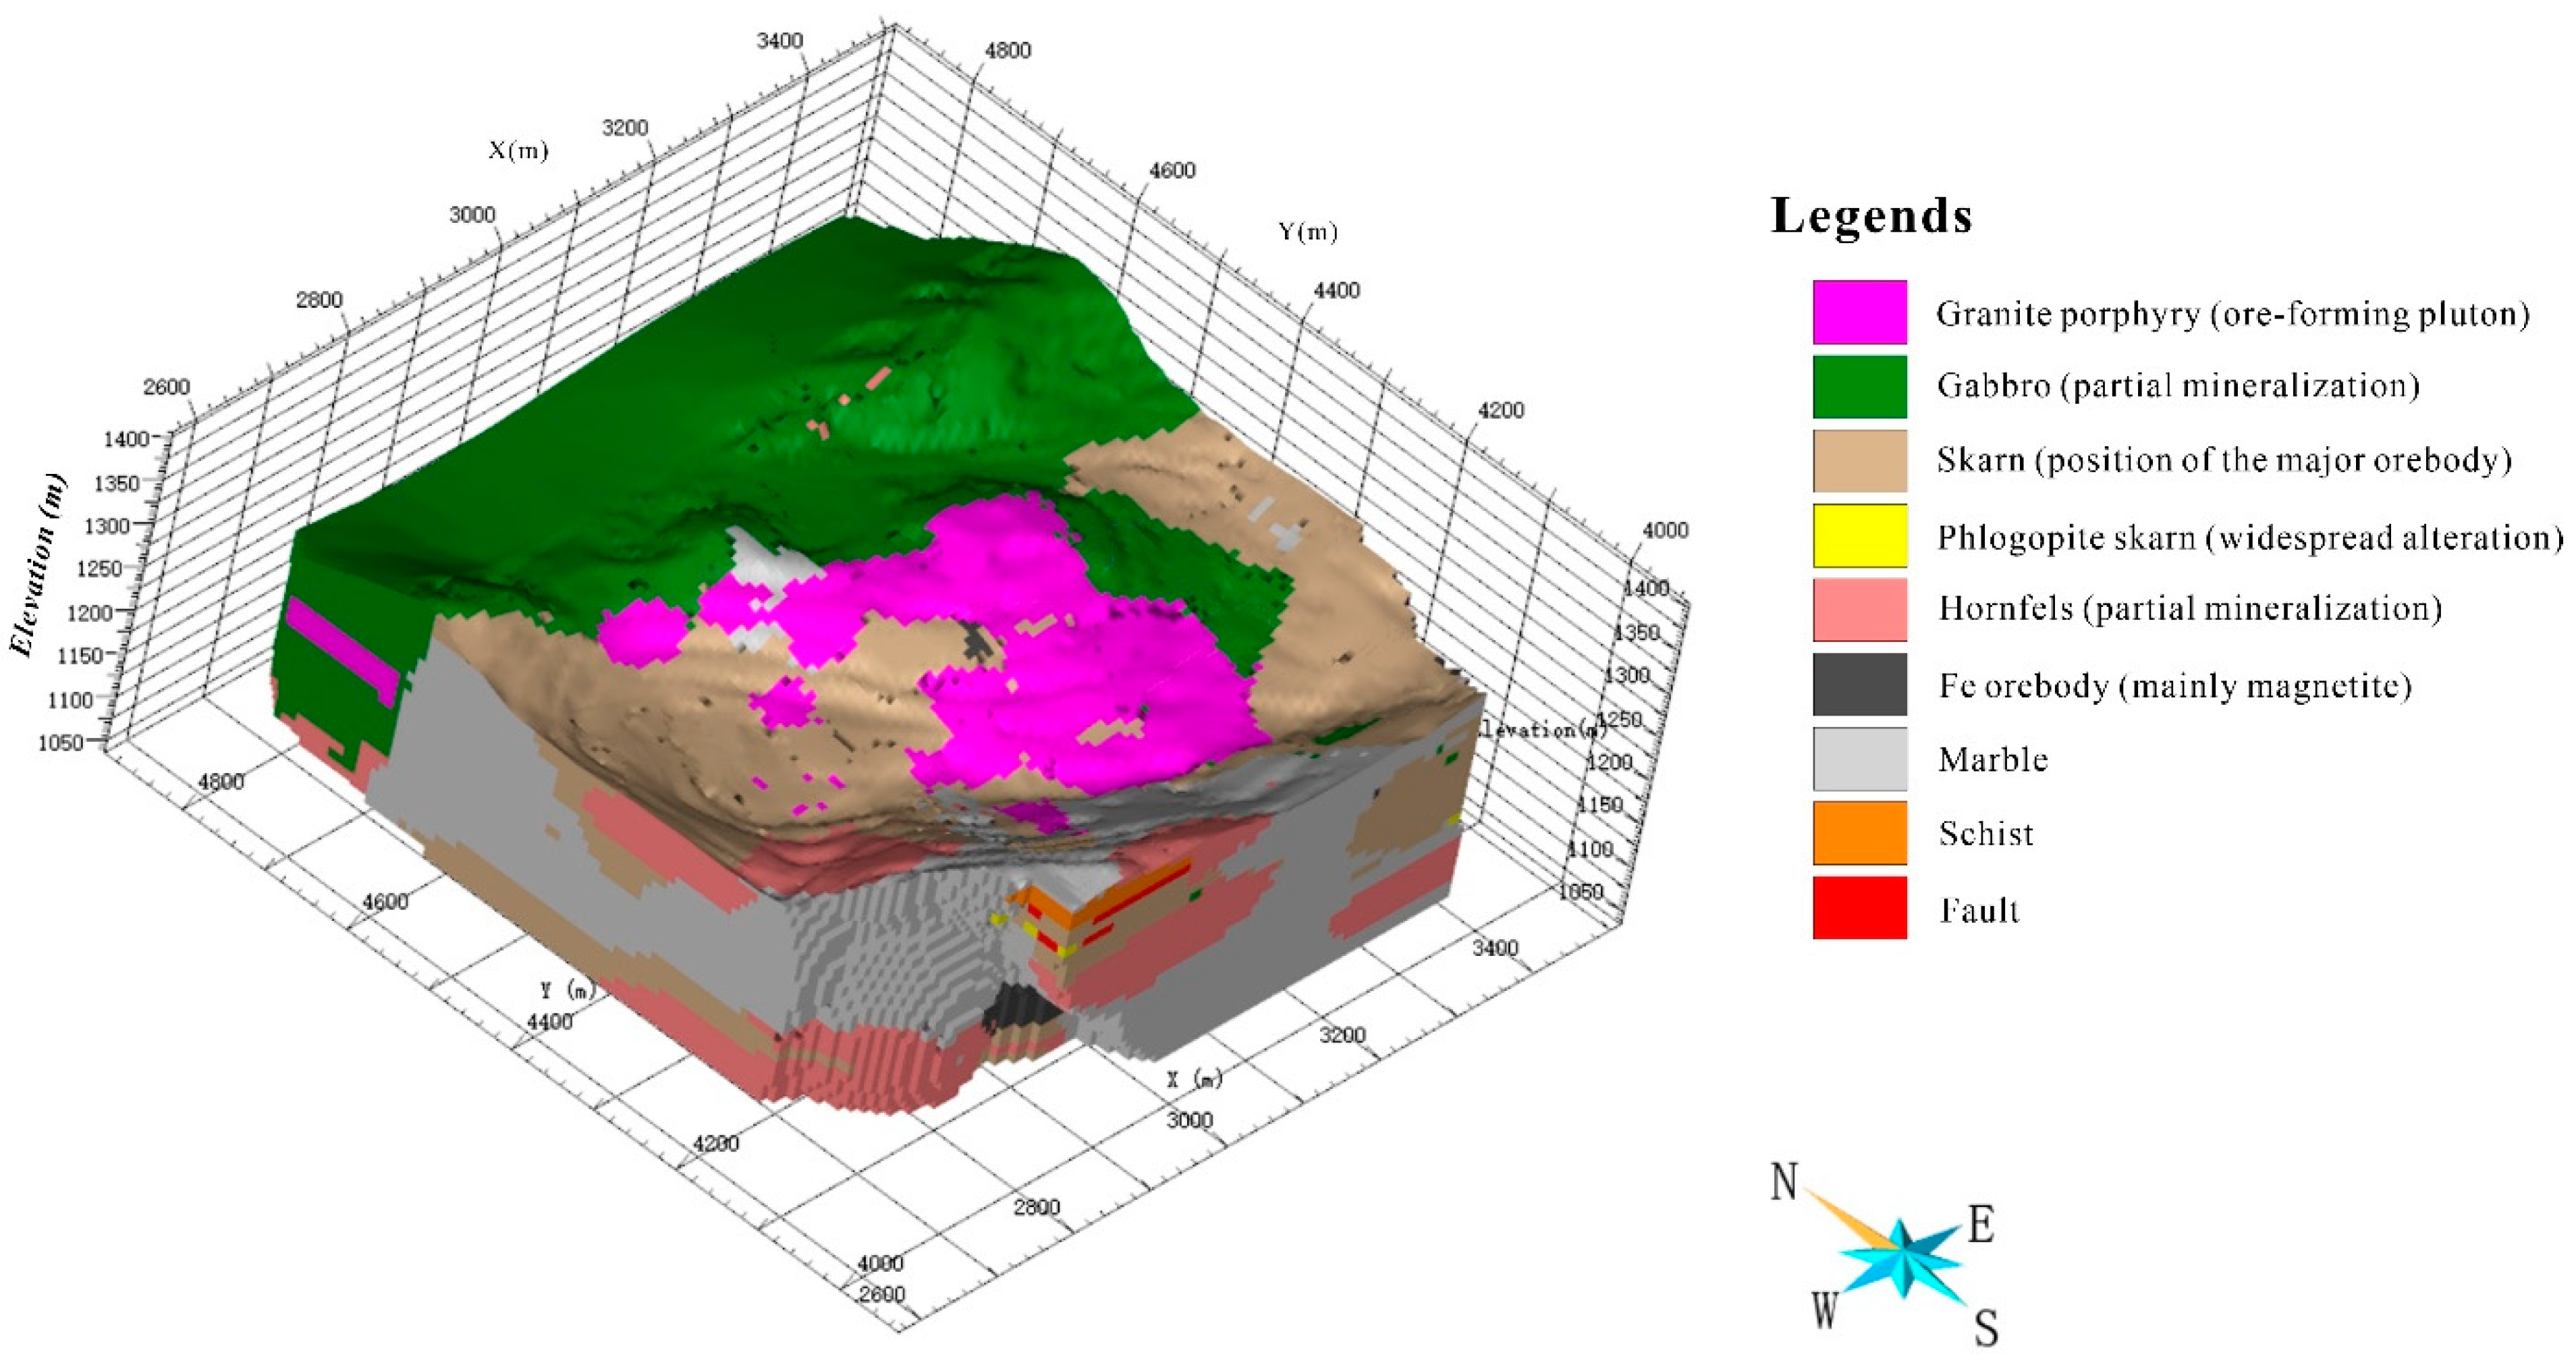
3.1. 3D Lithology Modeling
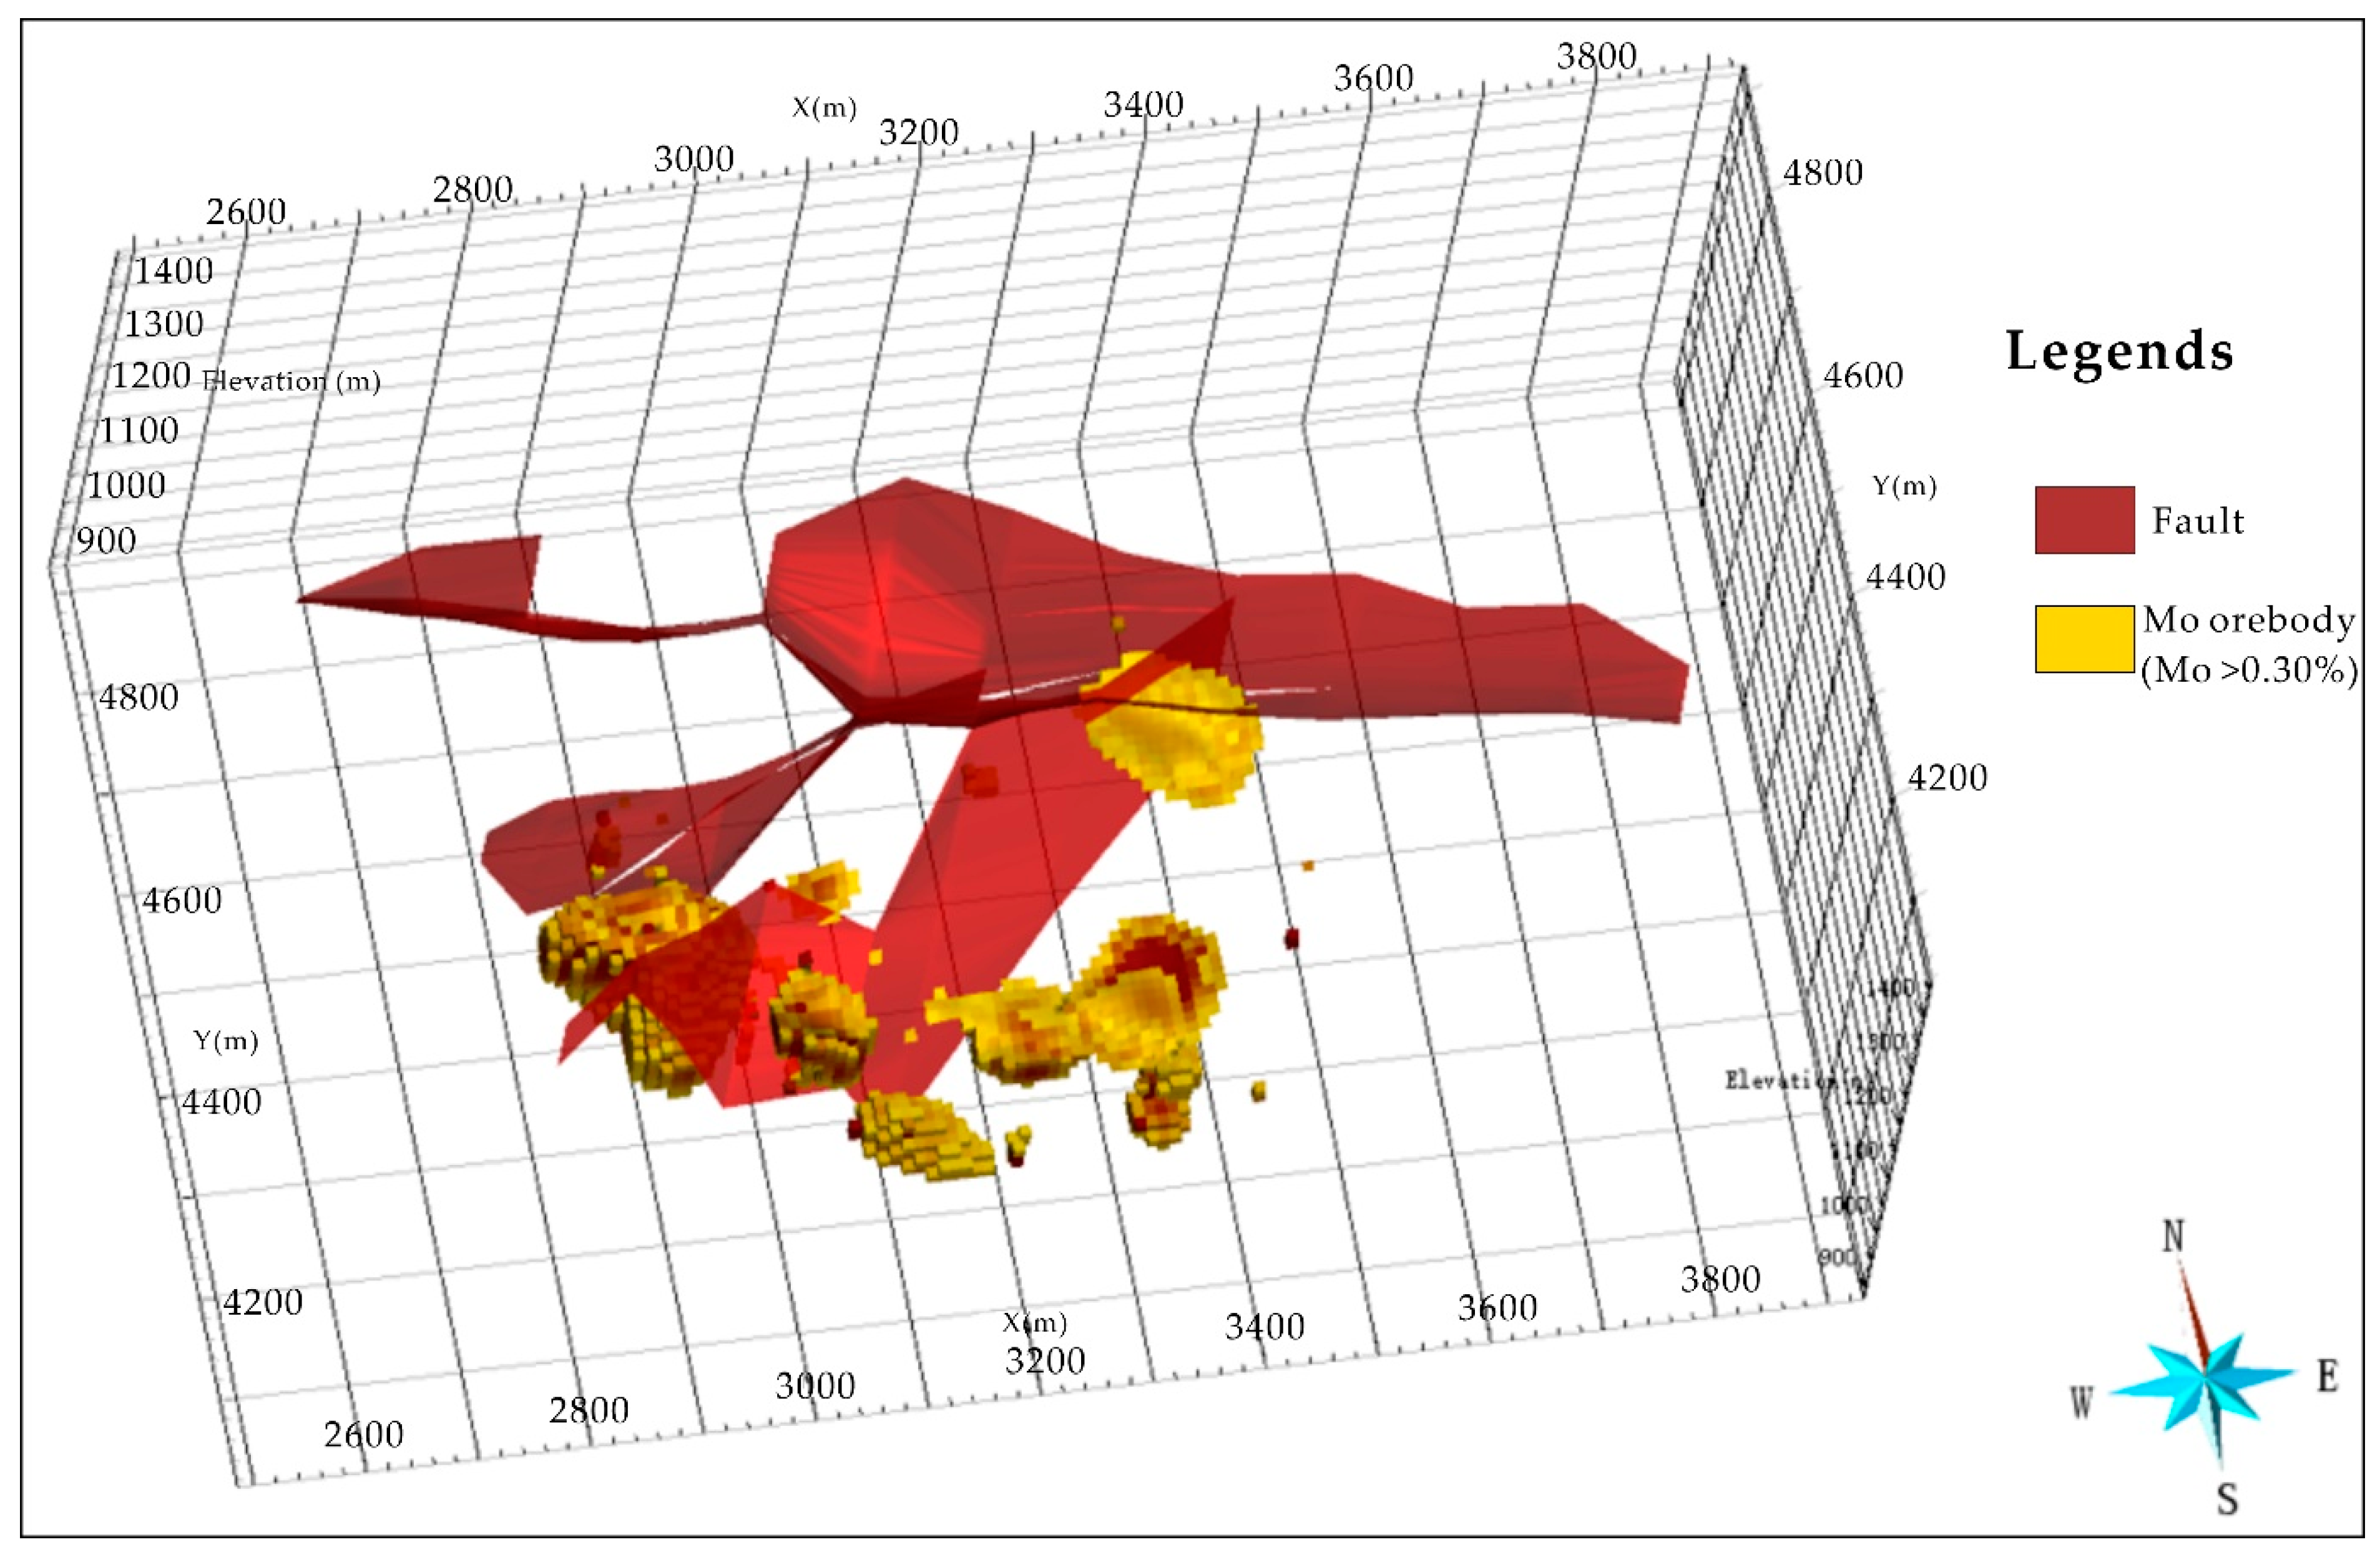
3.2. 3D Structural Model
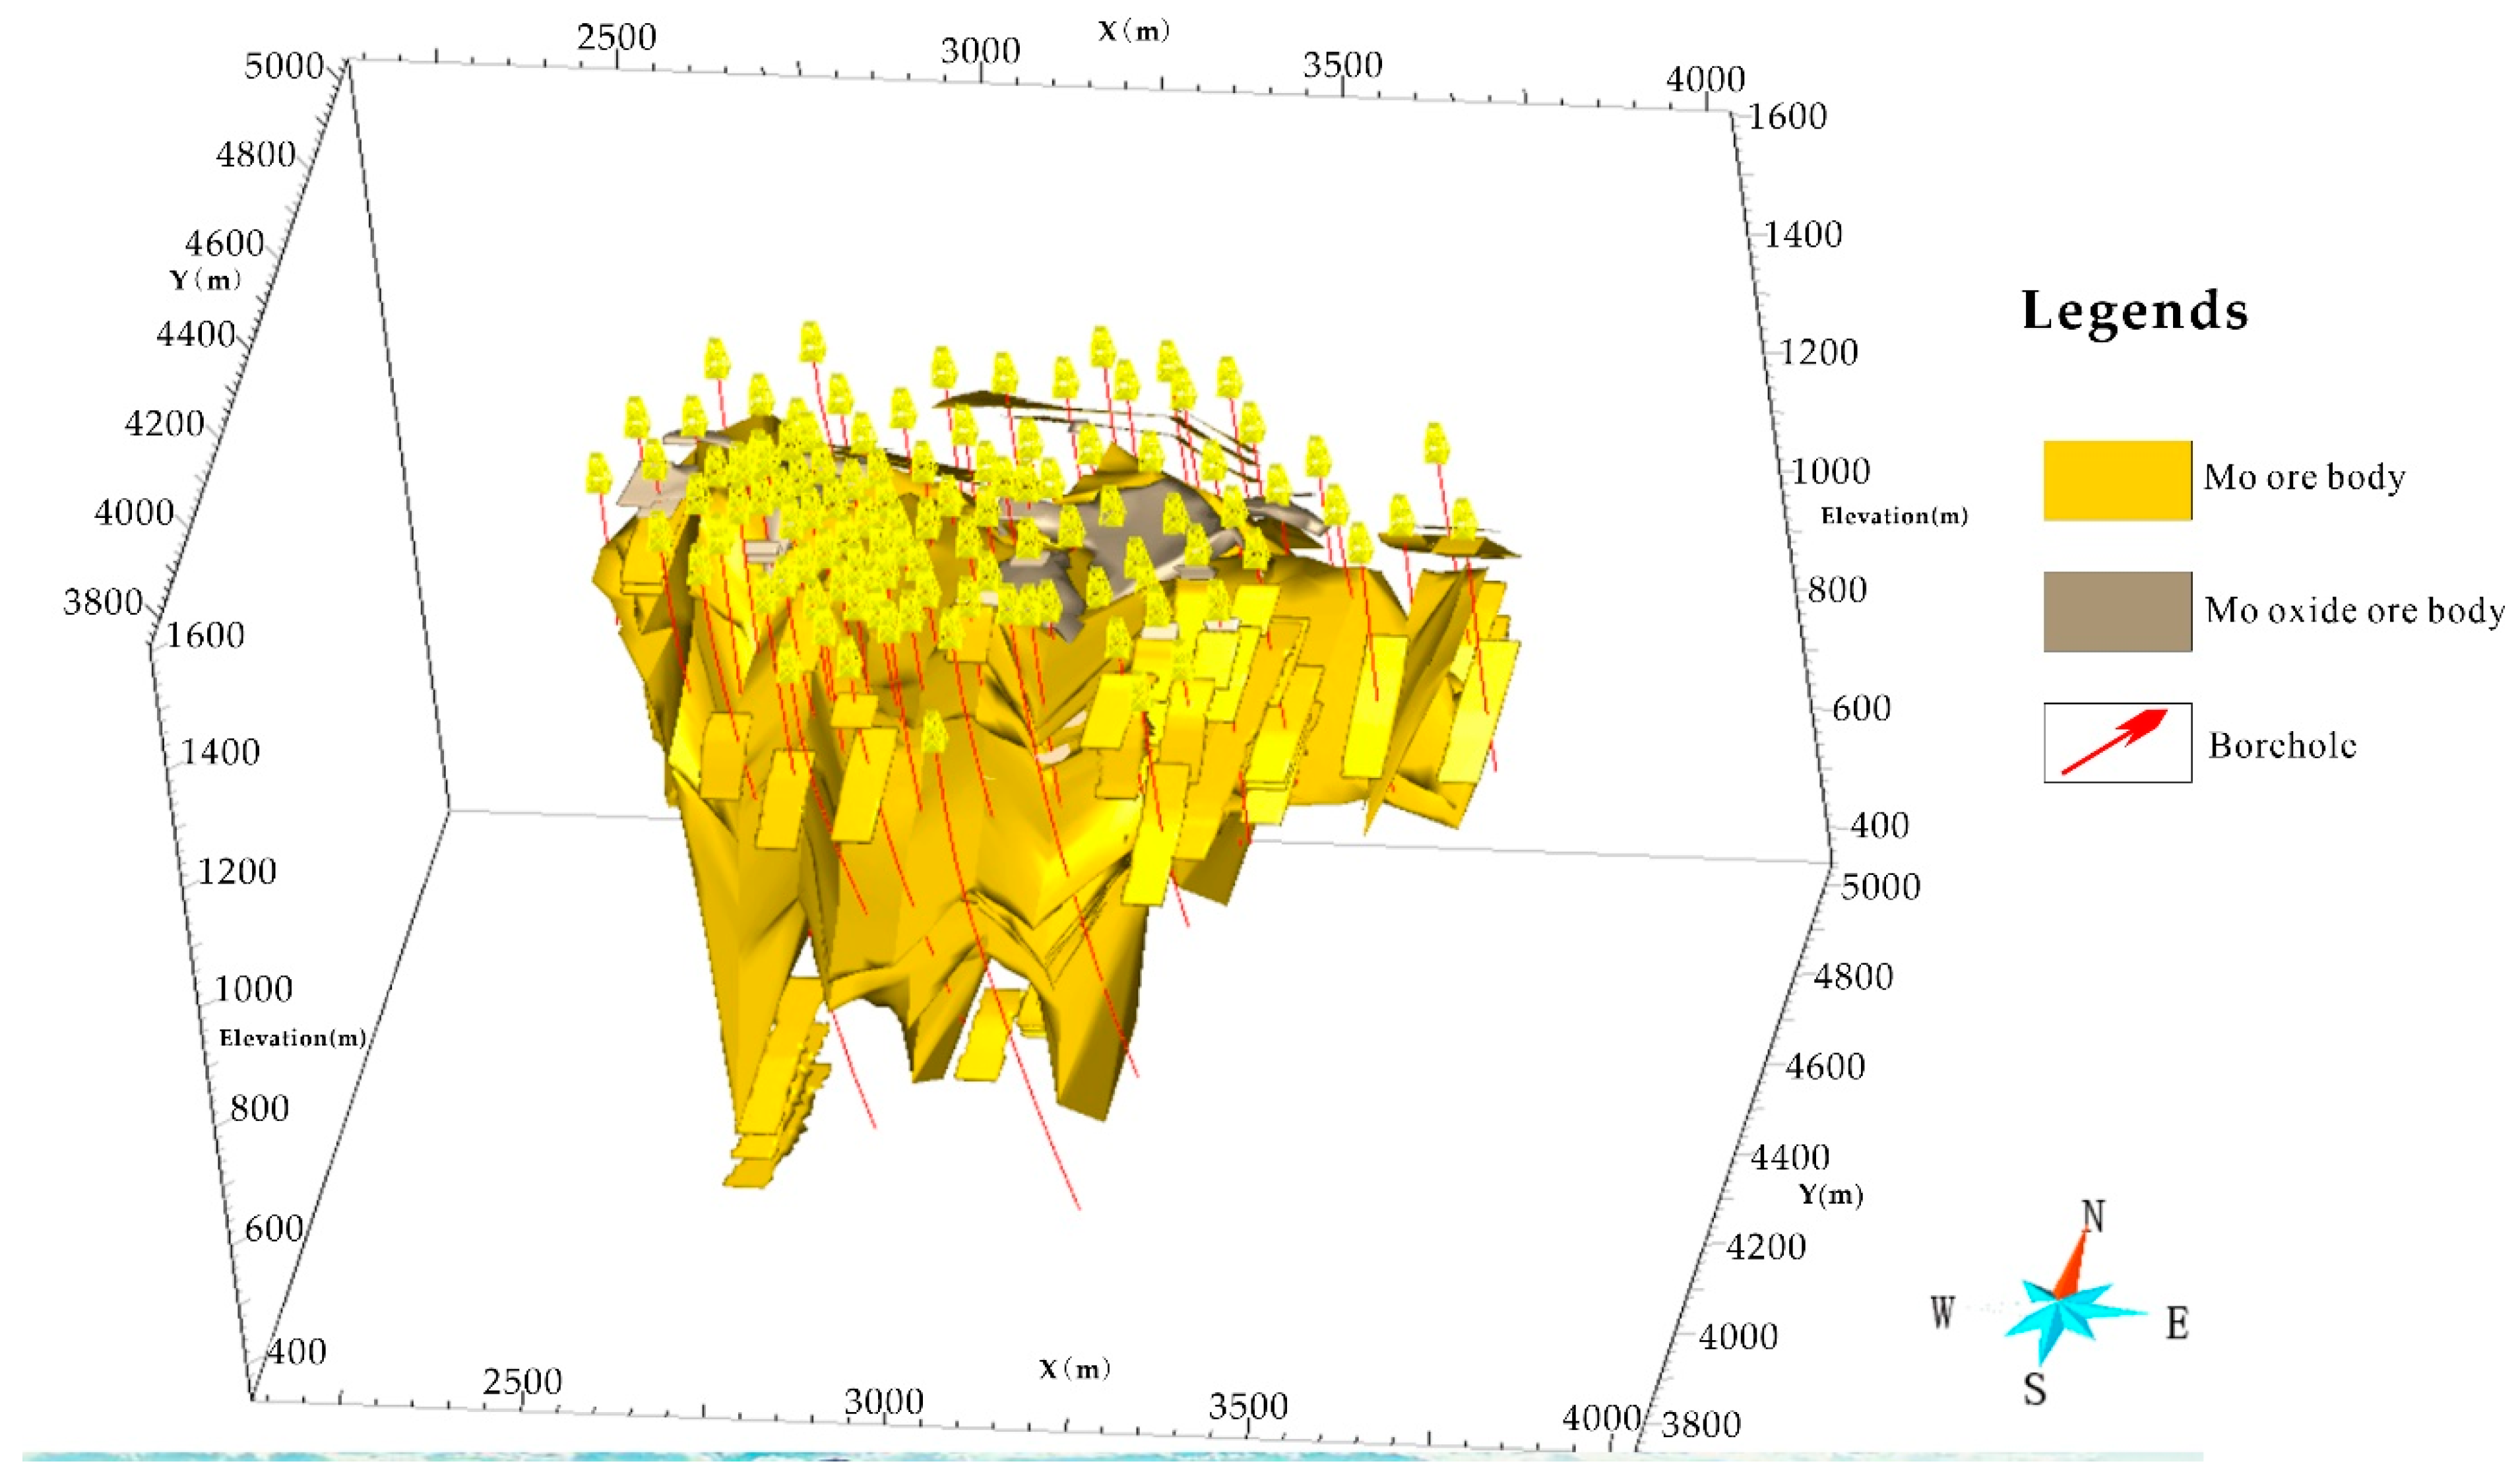
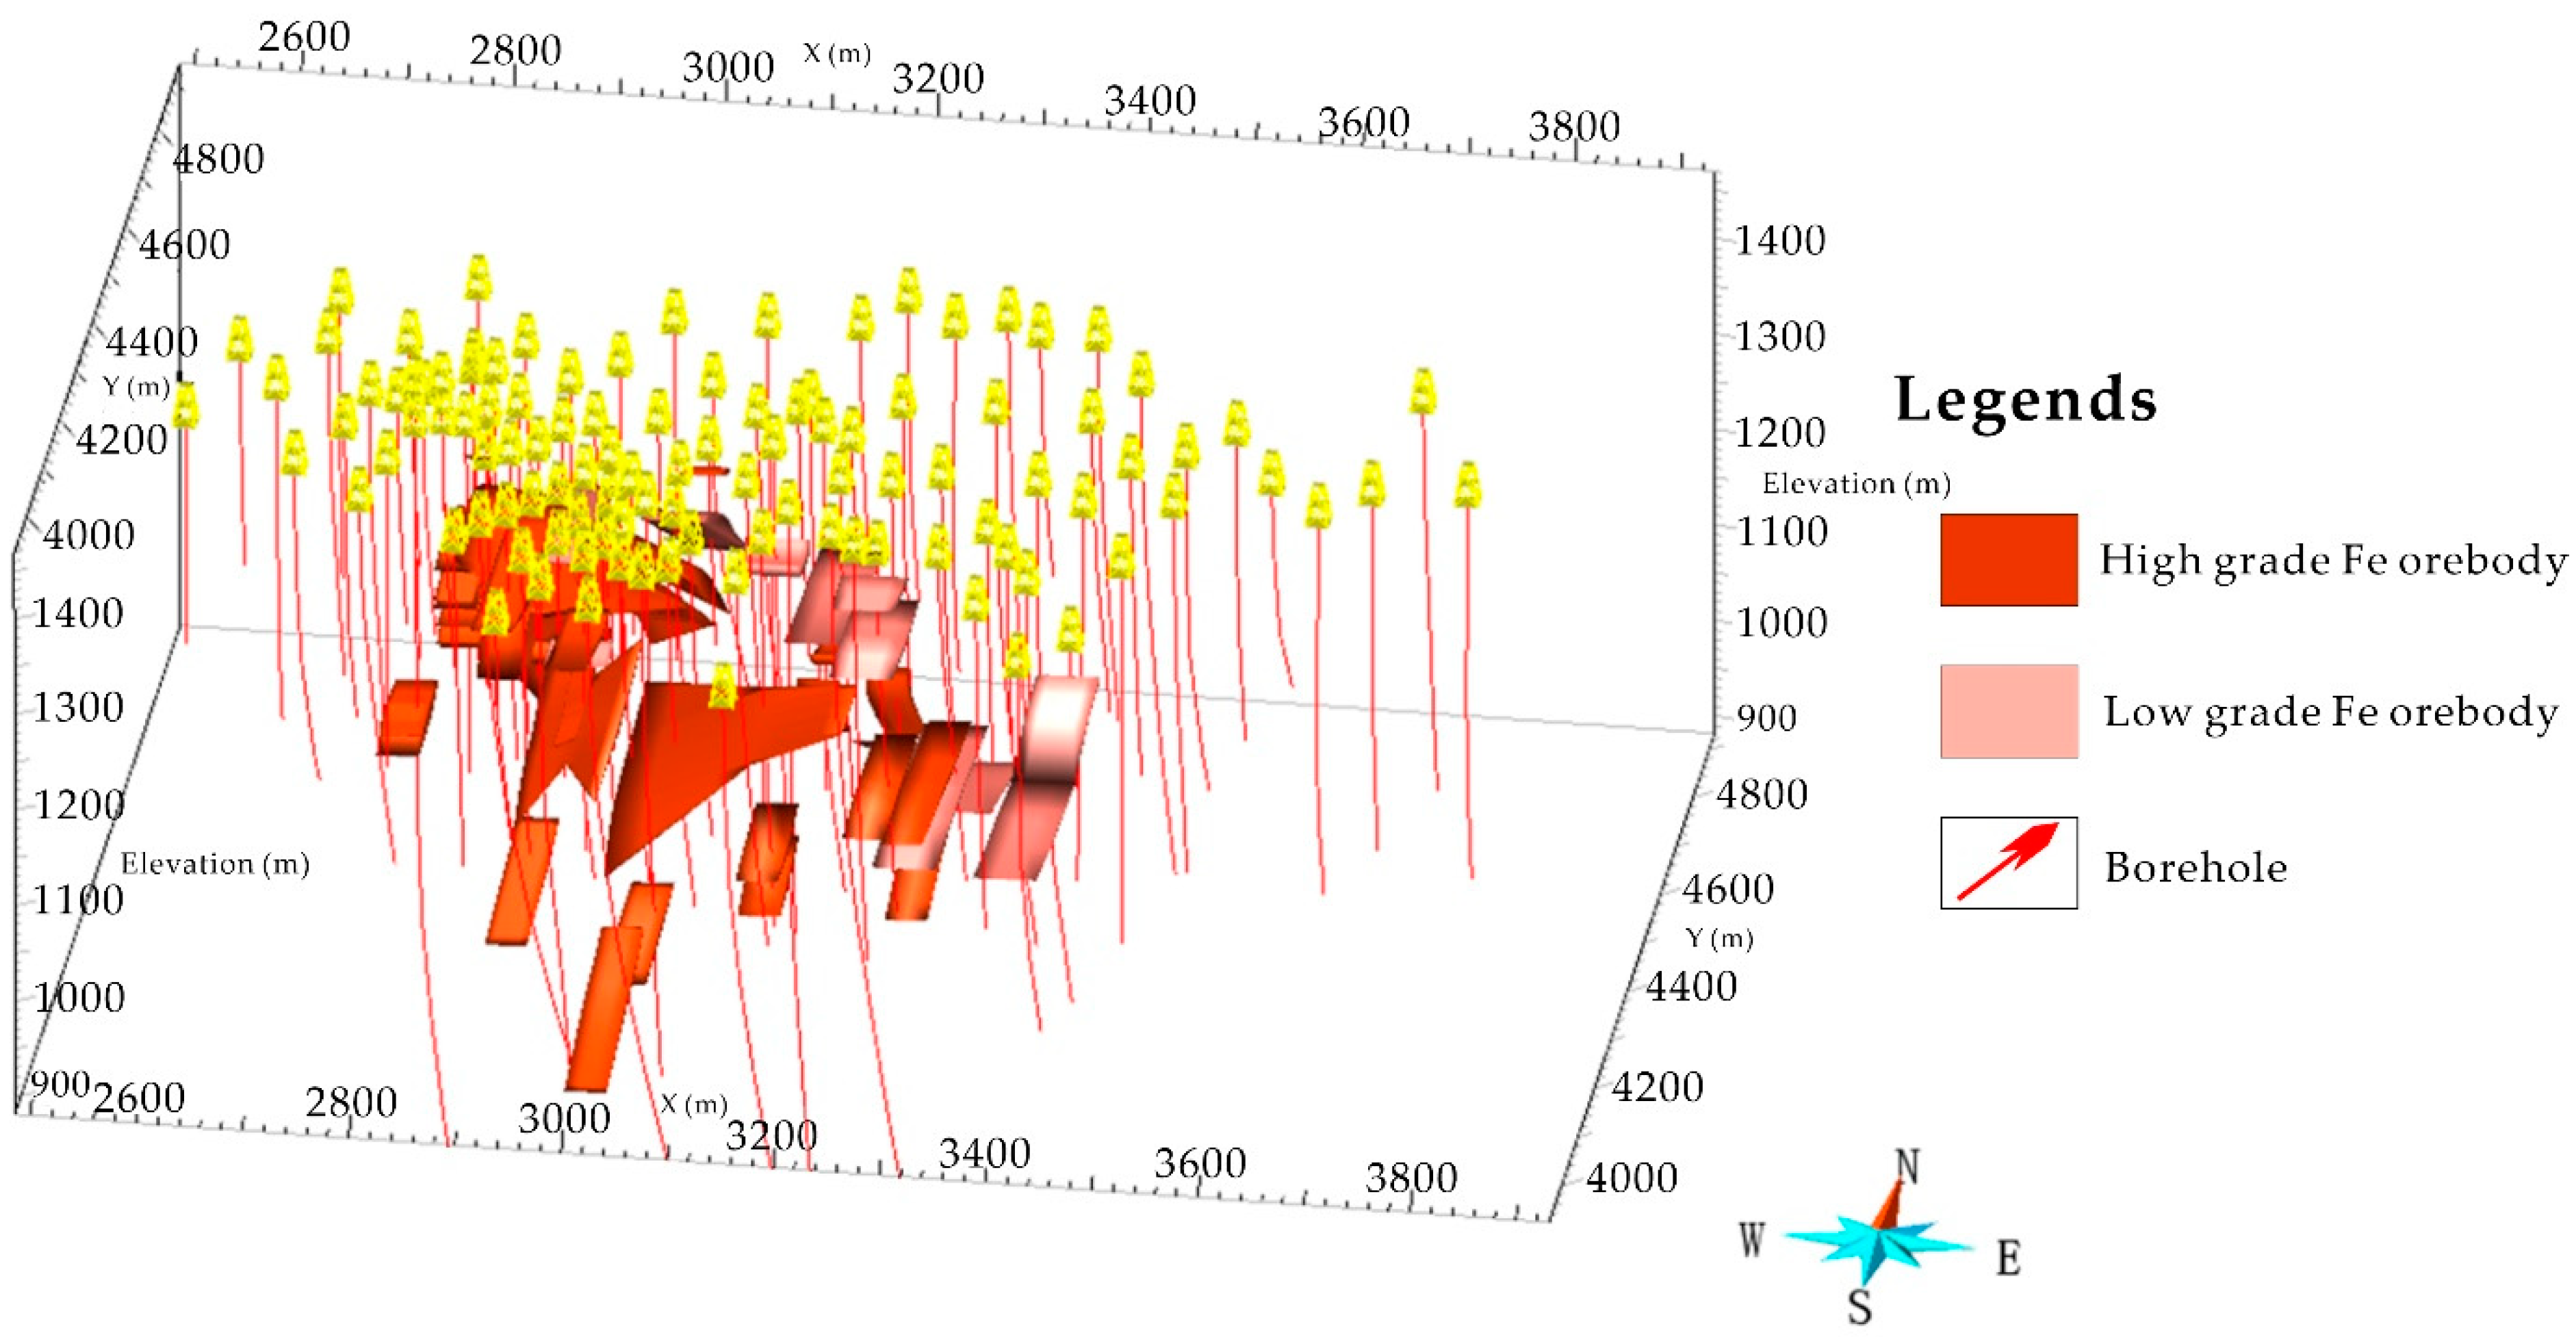
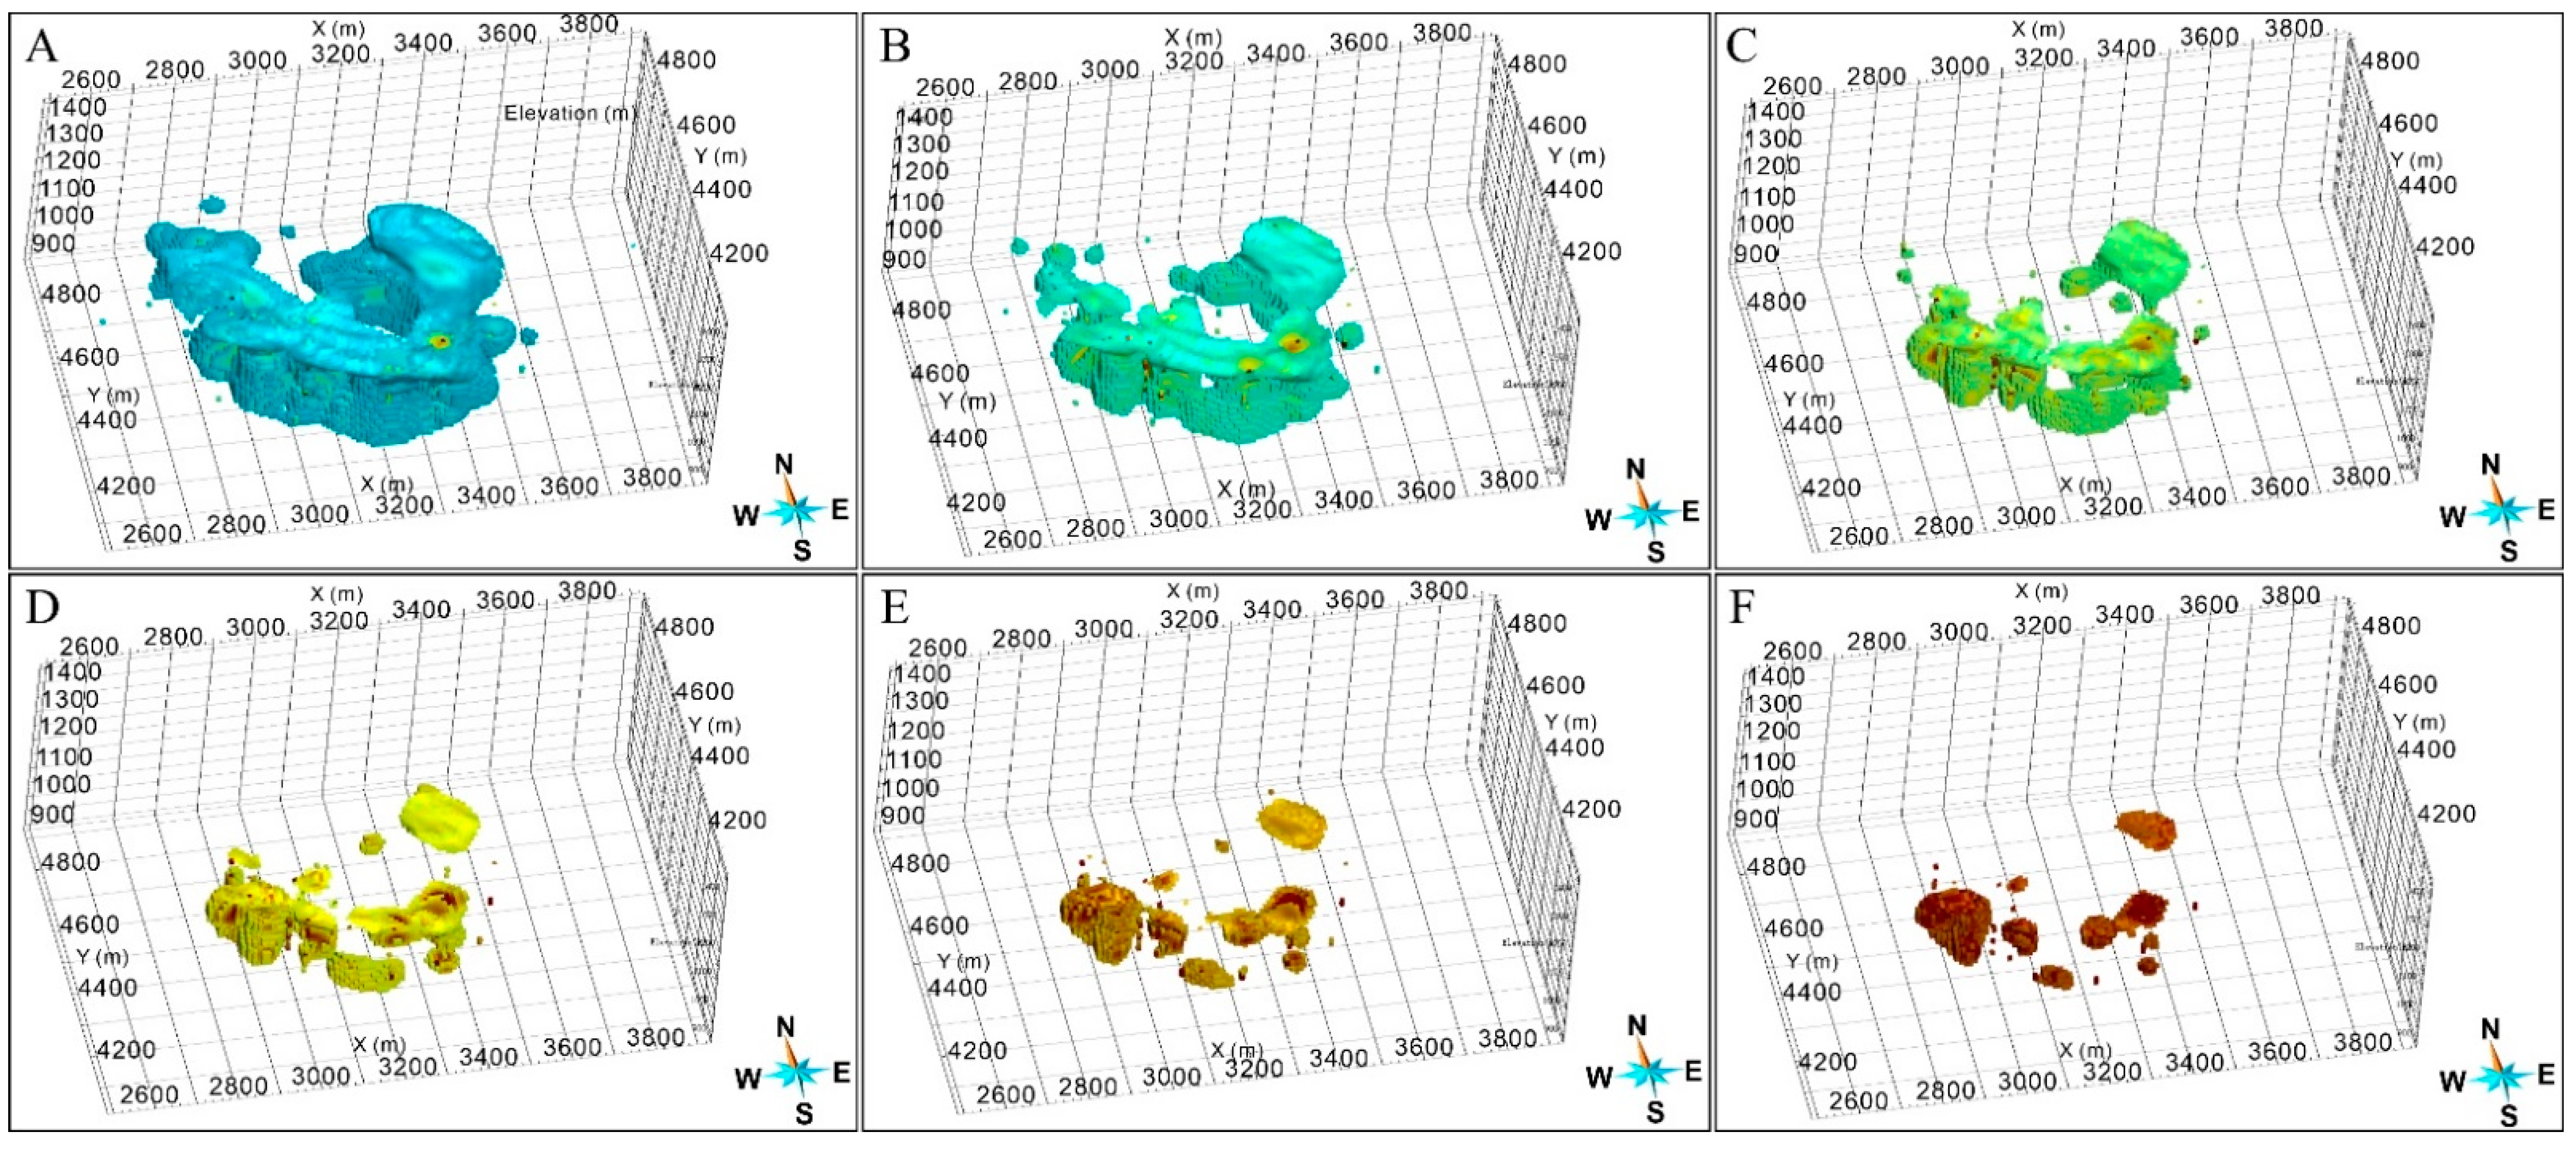
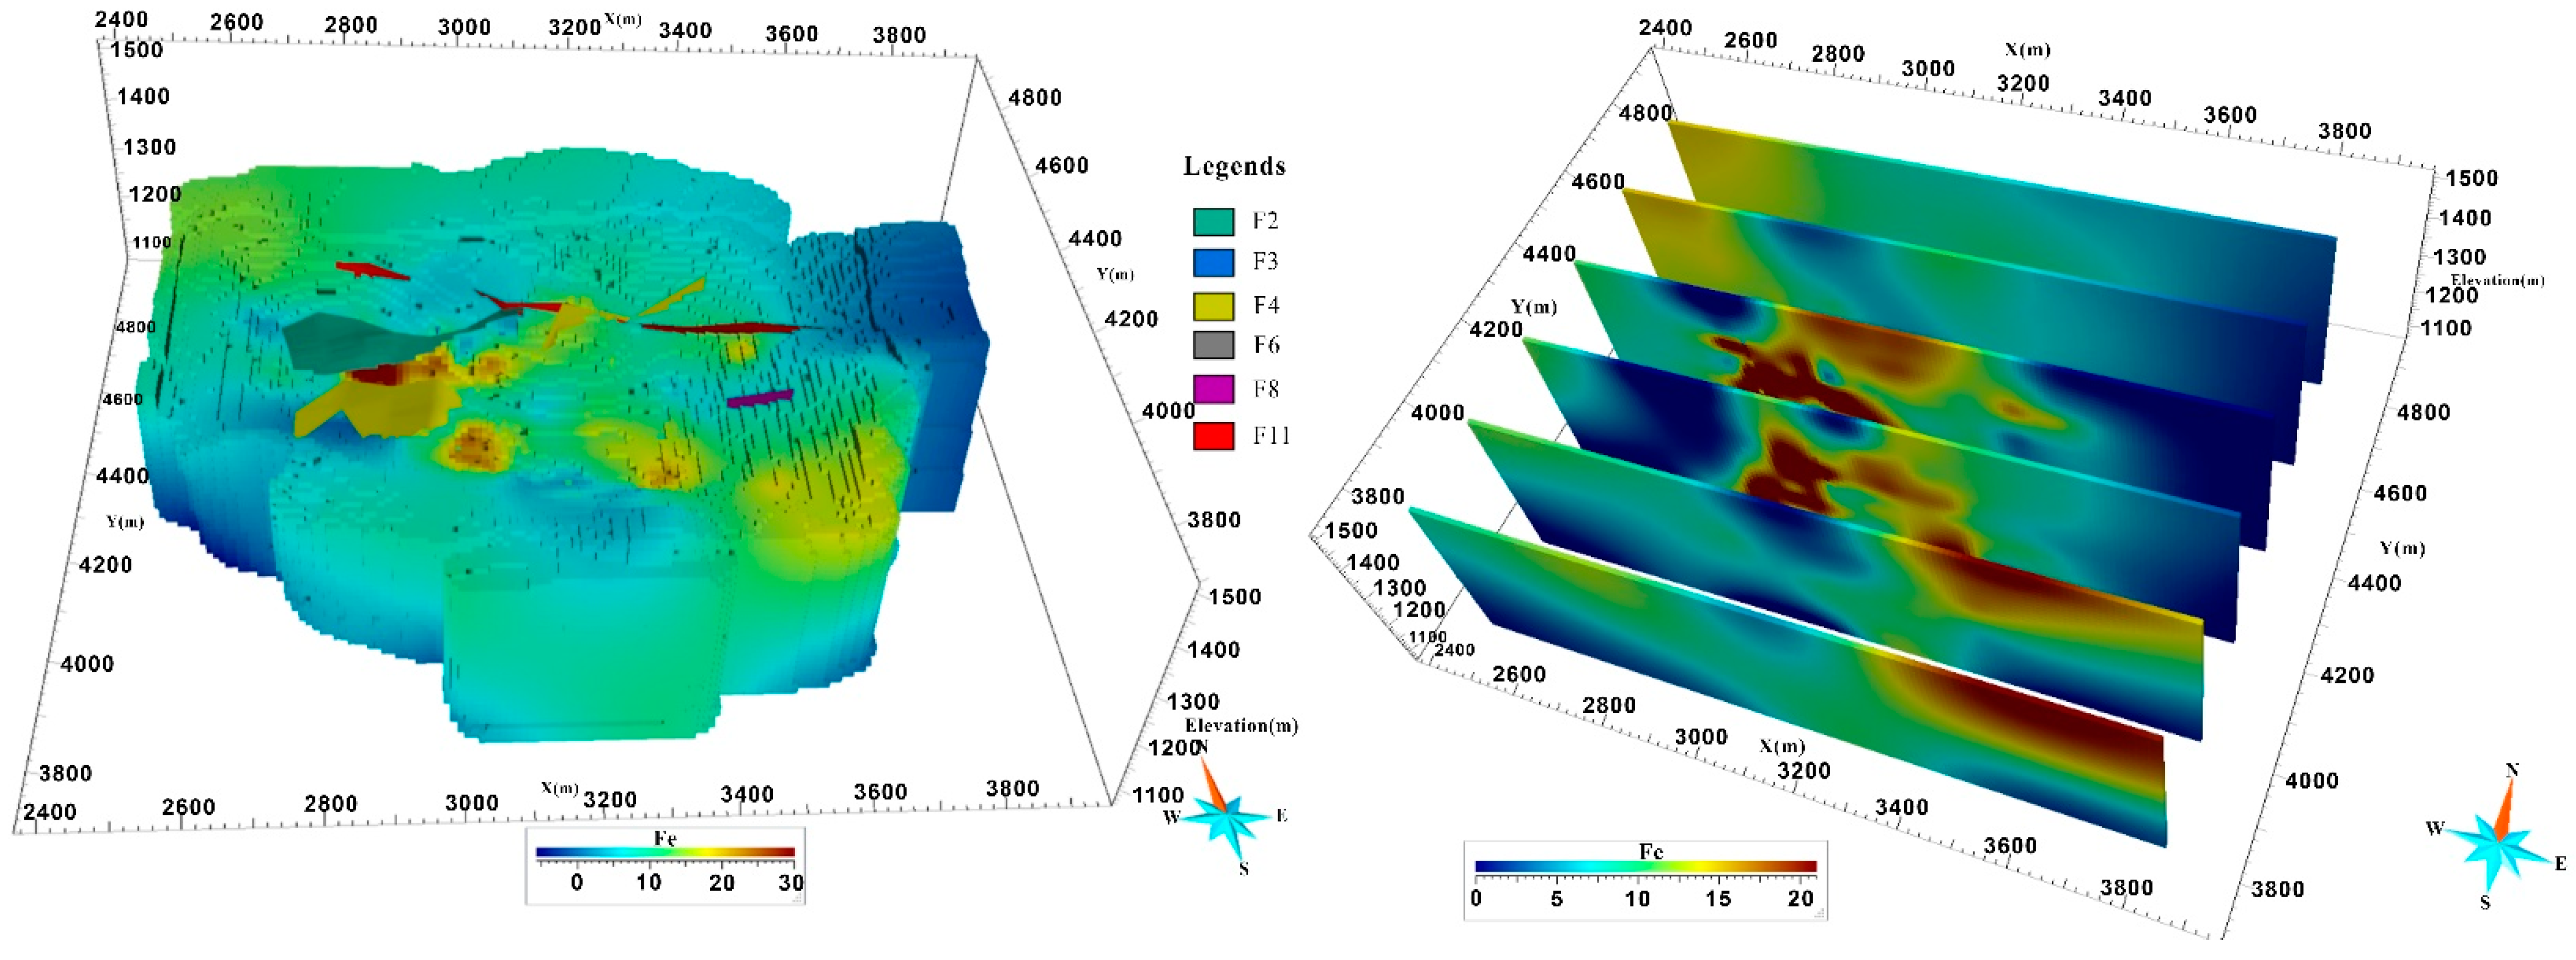
3.3. 3D Orebodies and Grade Modeling
4. Sampling and Analysis Methods
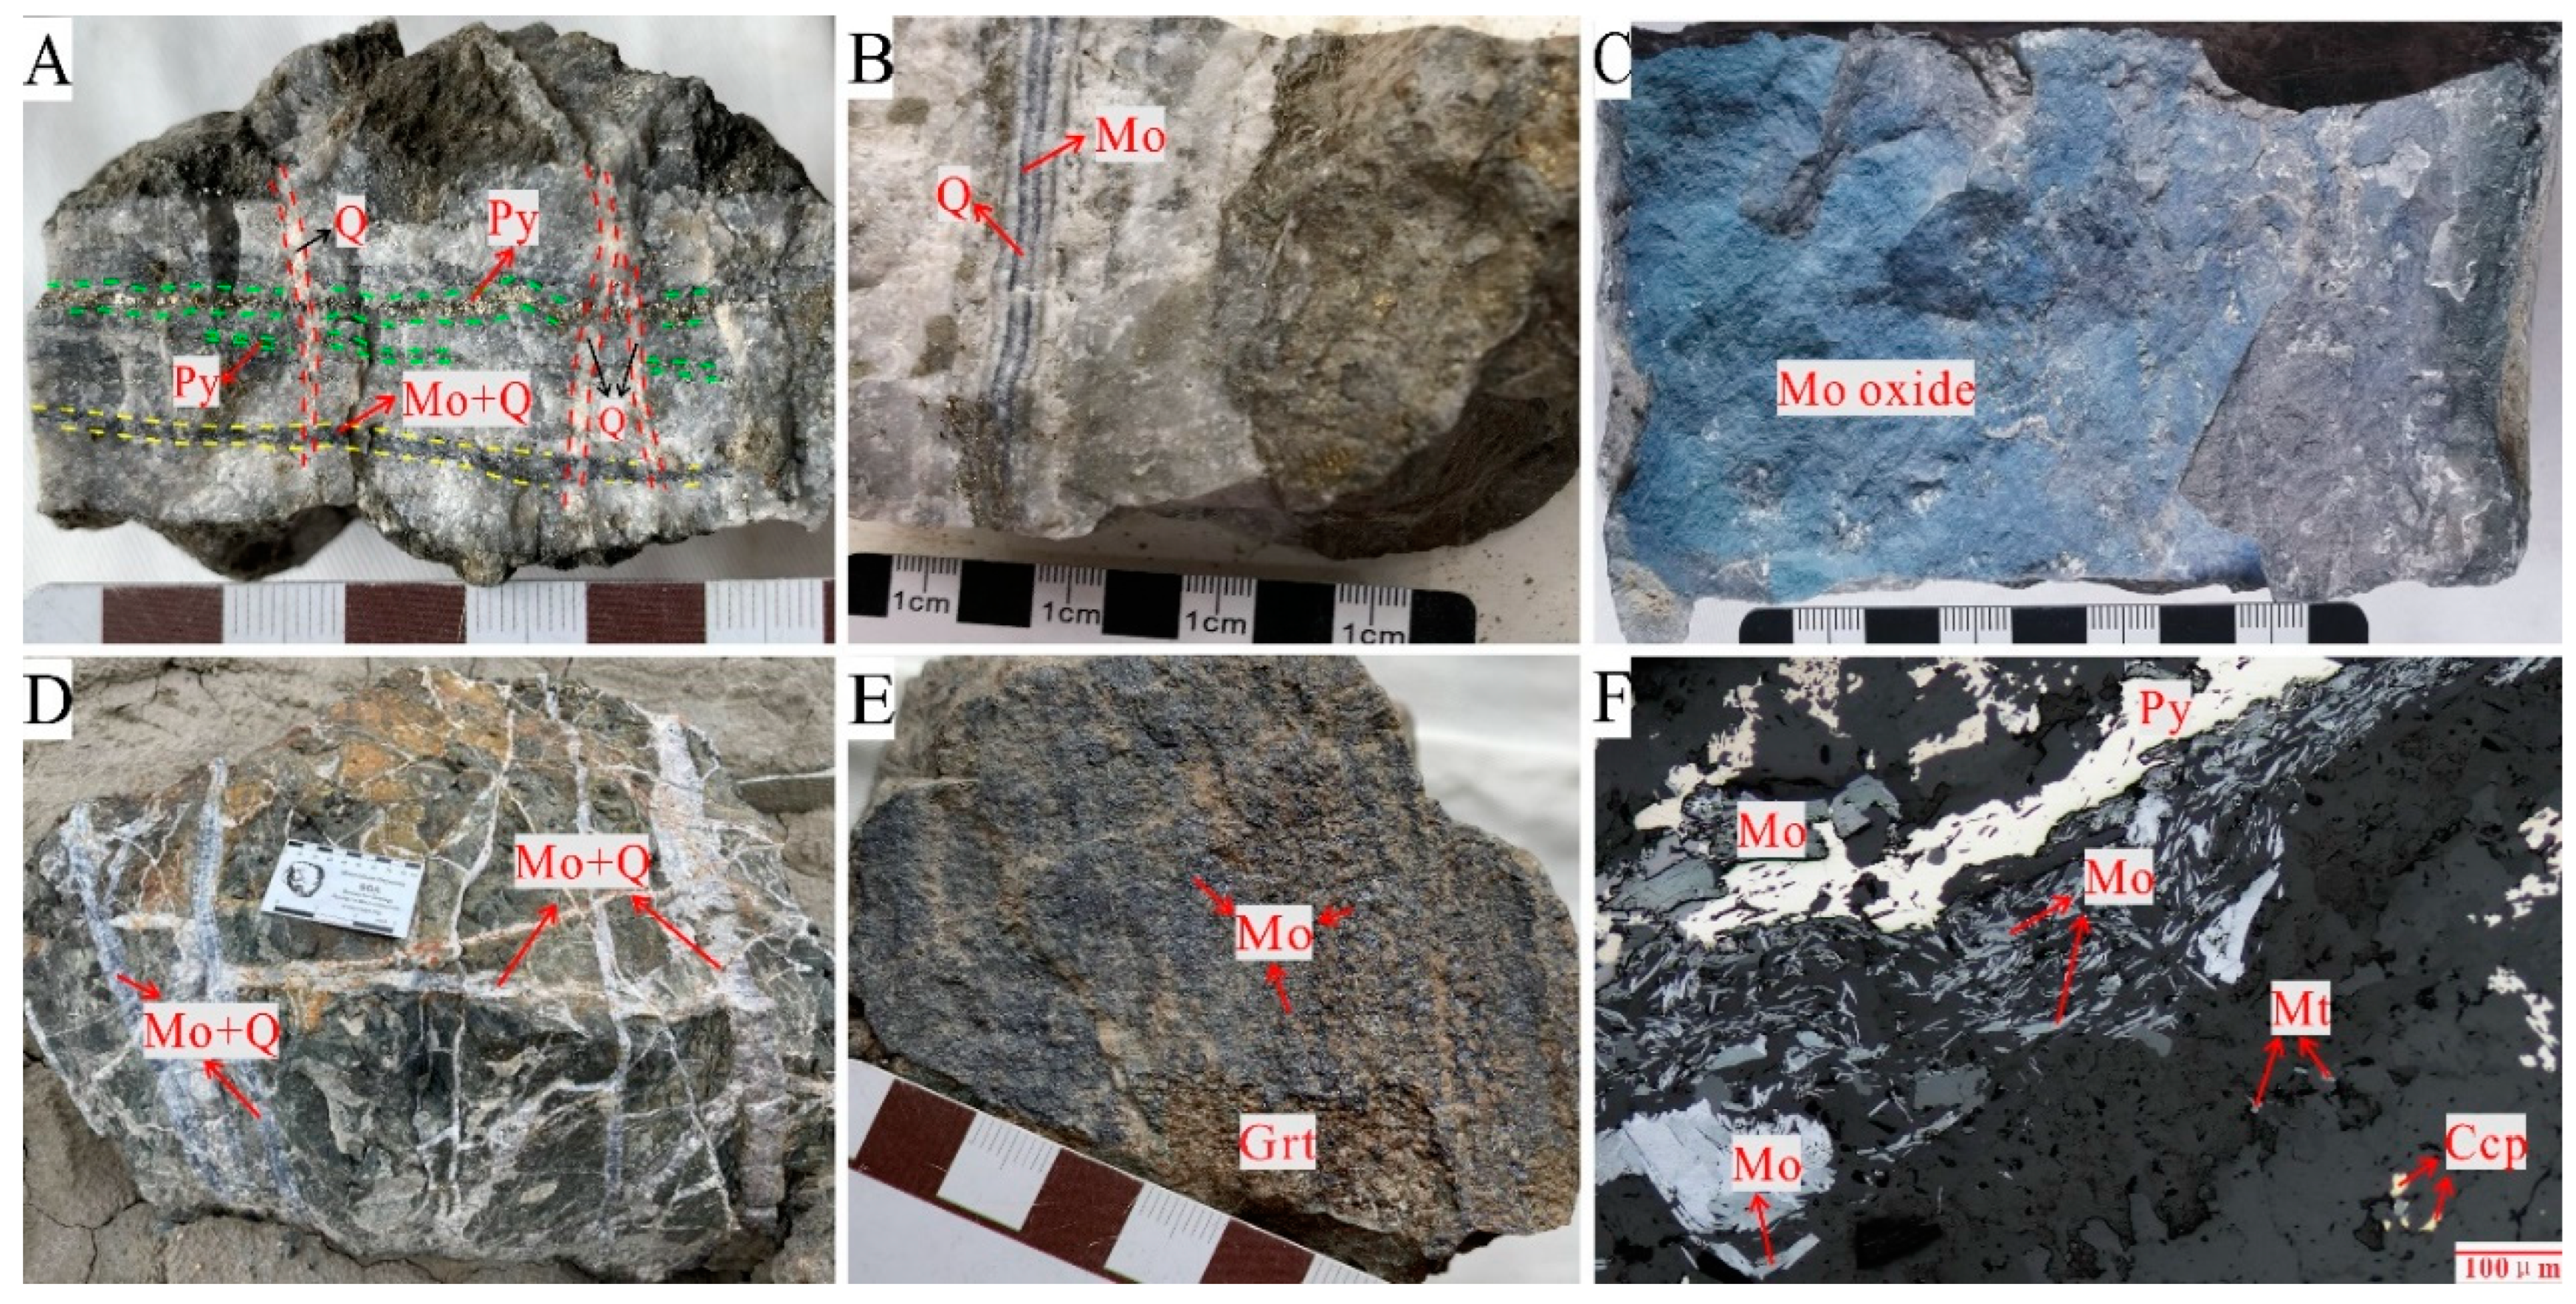
4.1. Sampling
4.2. SEM-EDS
4.3. EPMA
5. Discussion
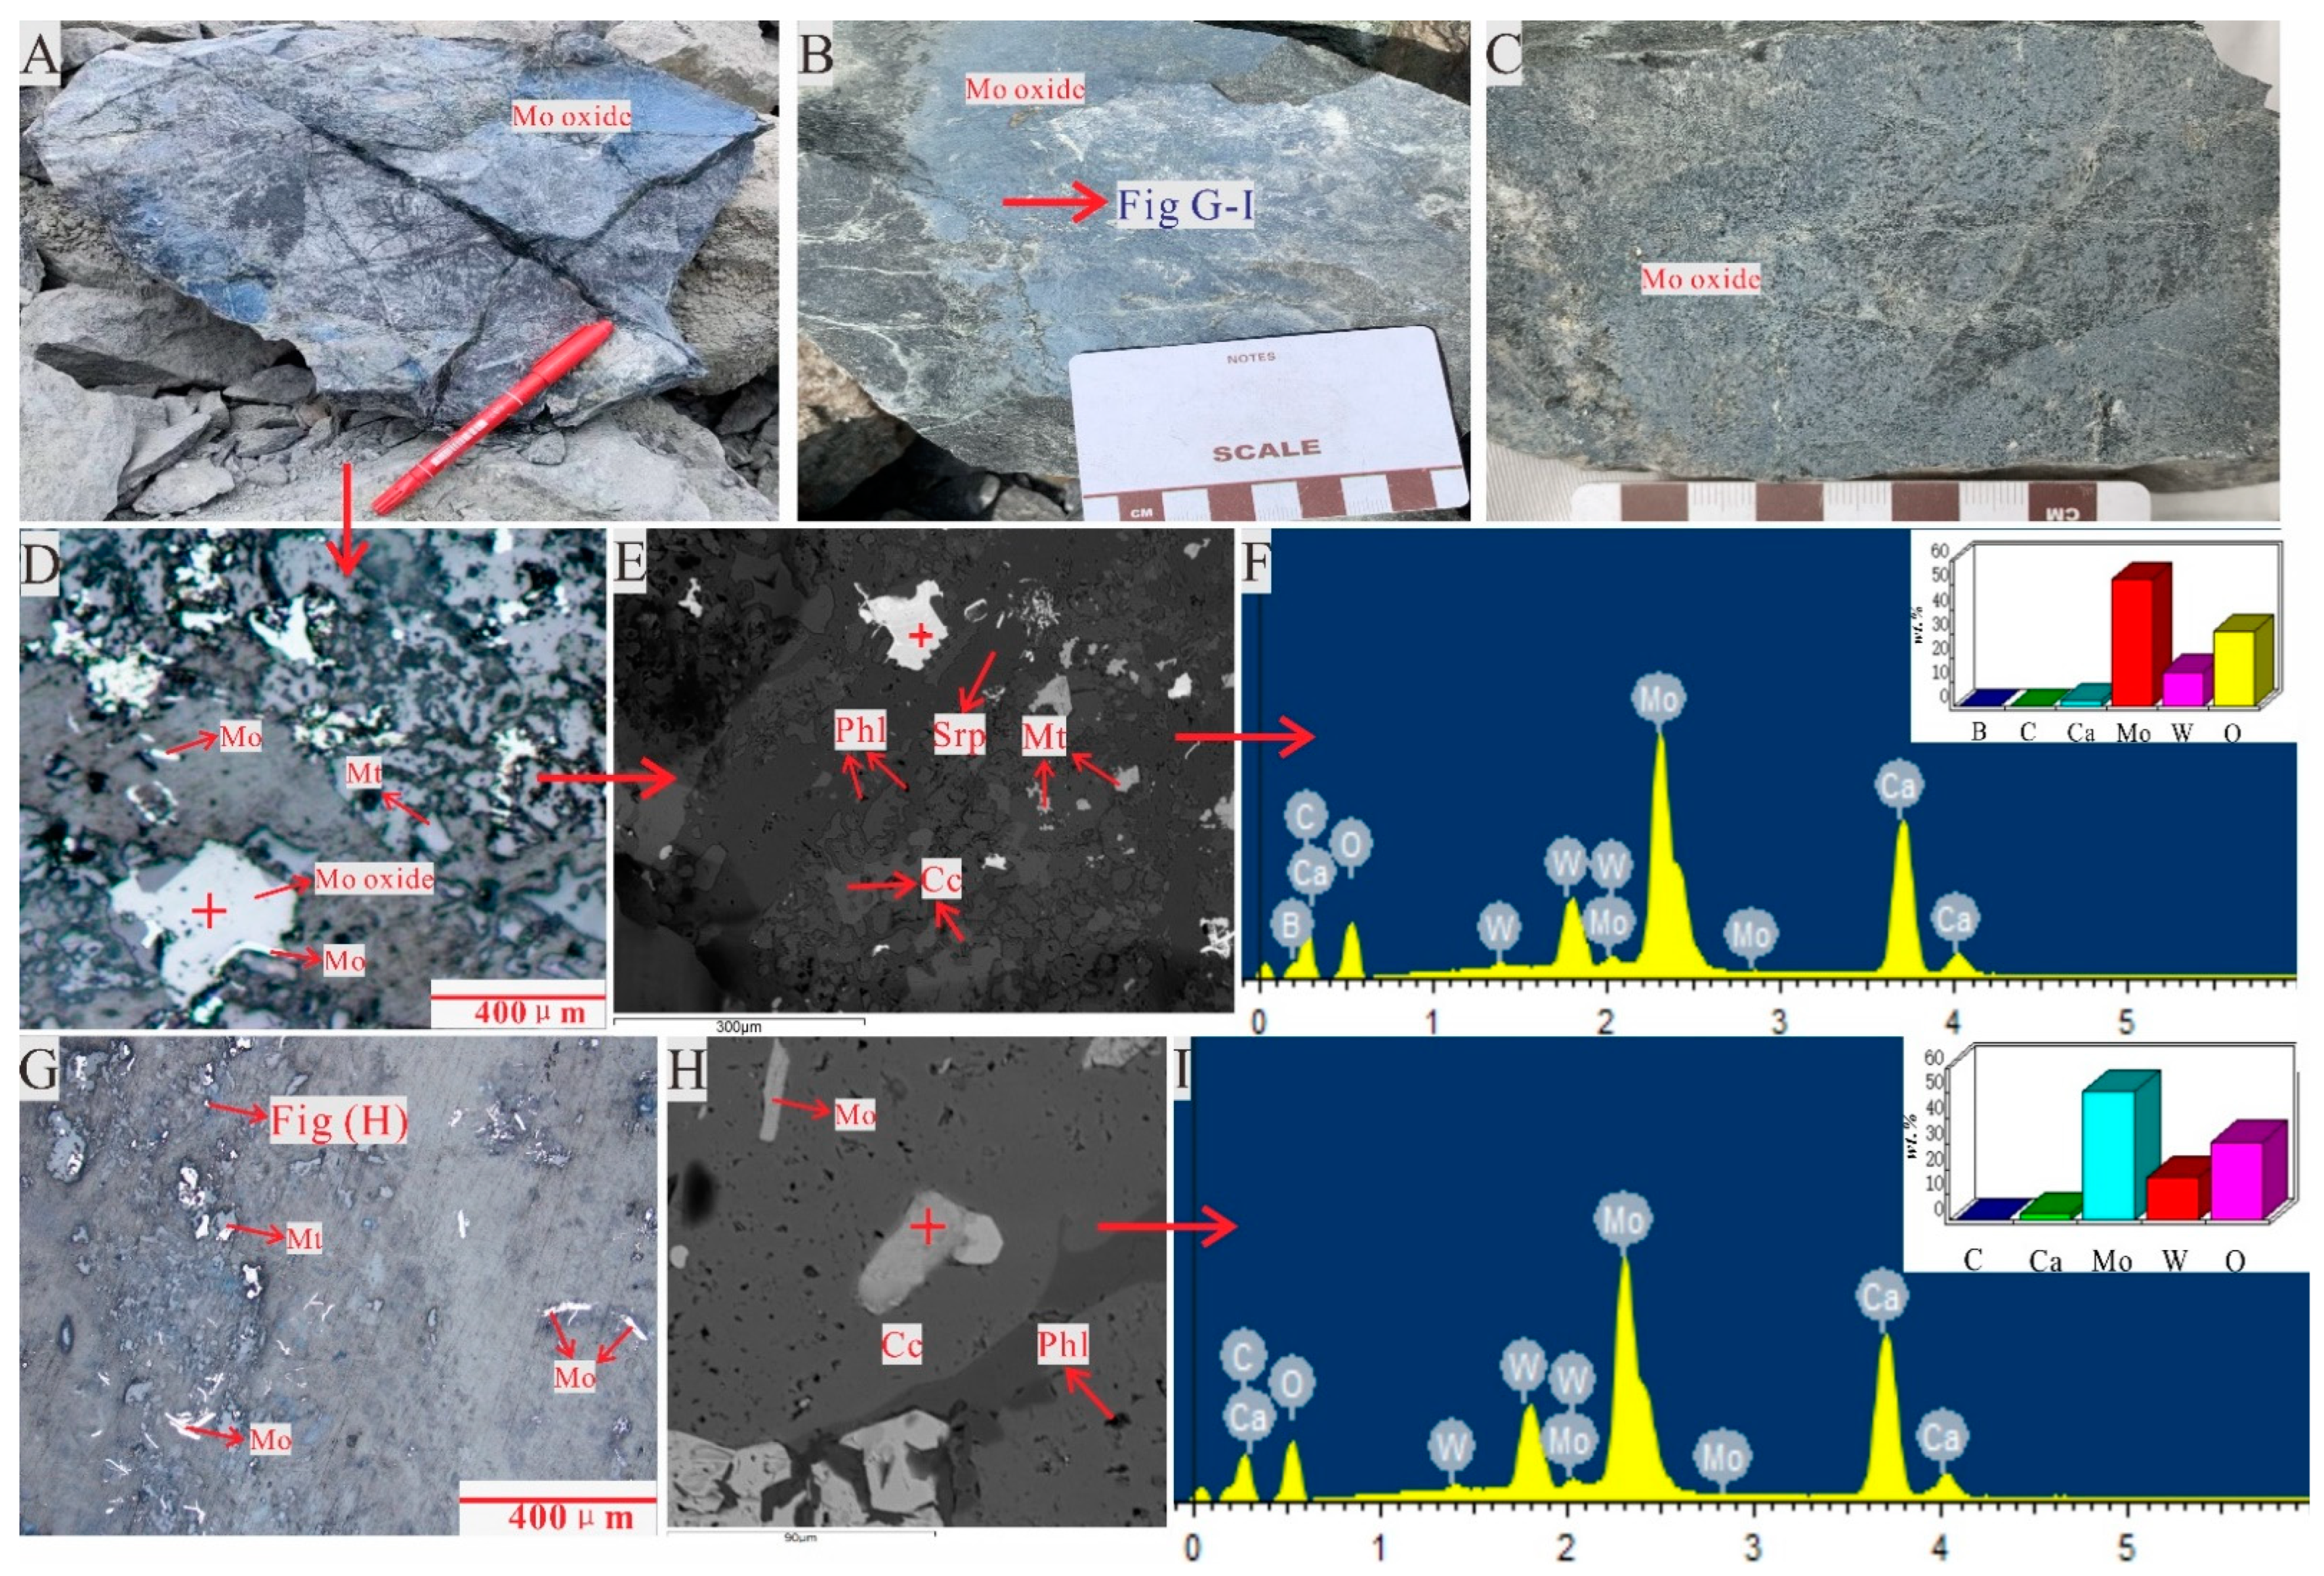
5.1. Compositions
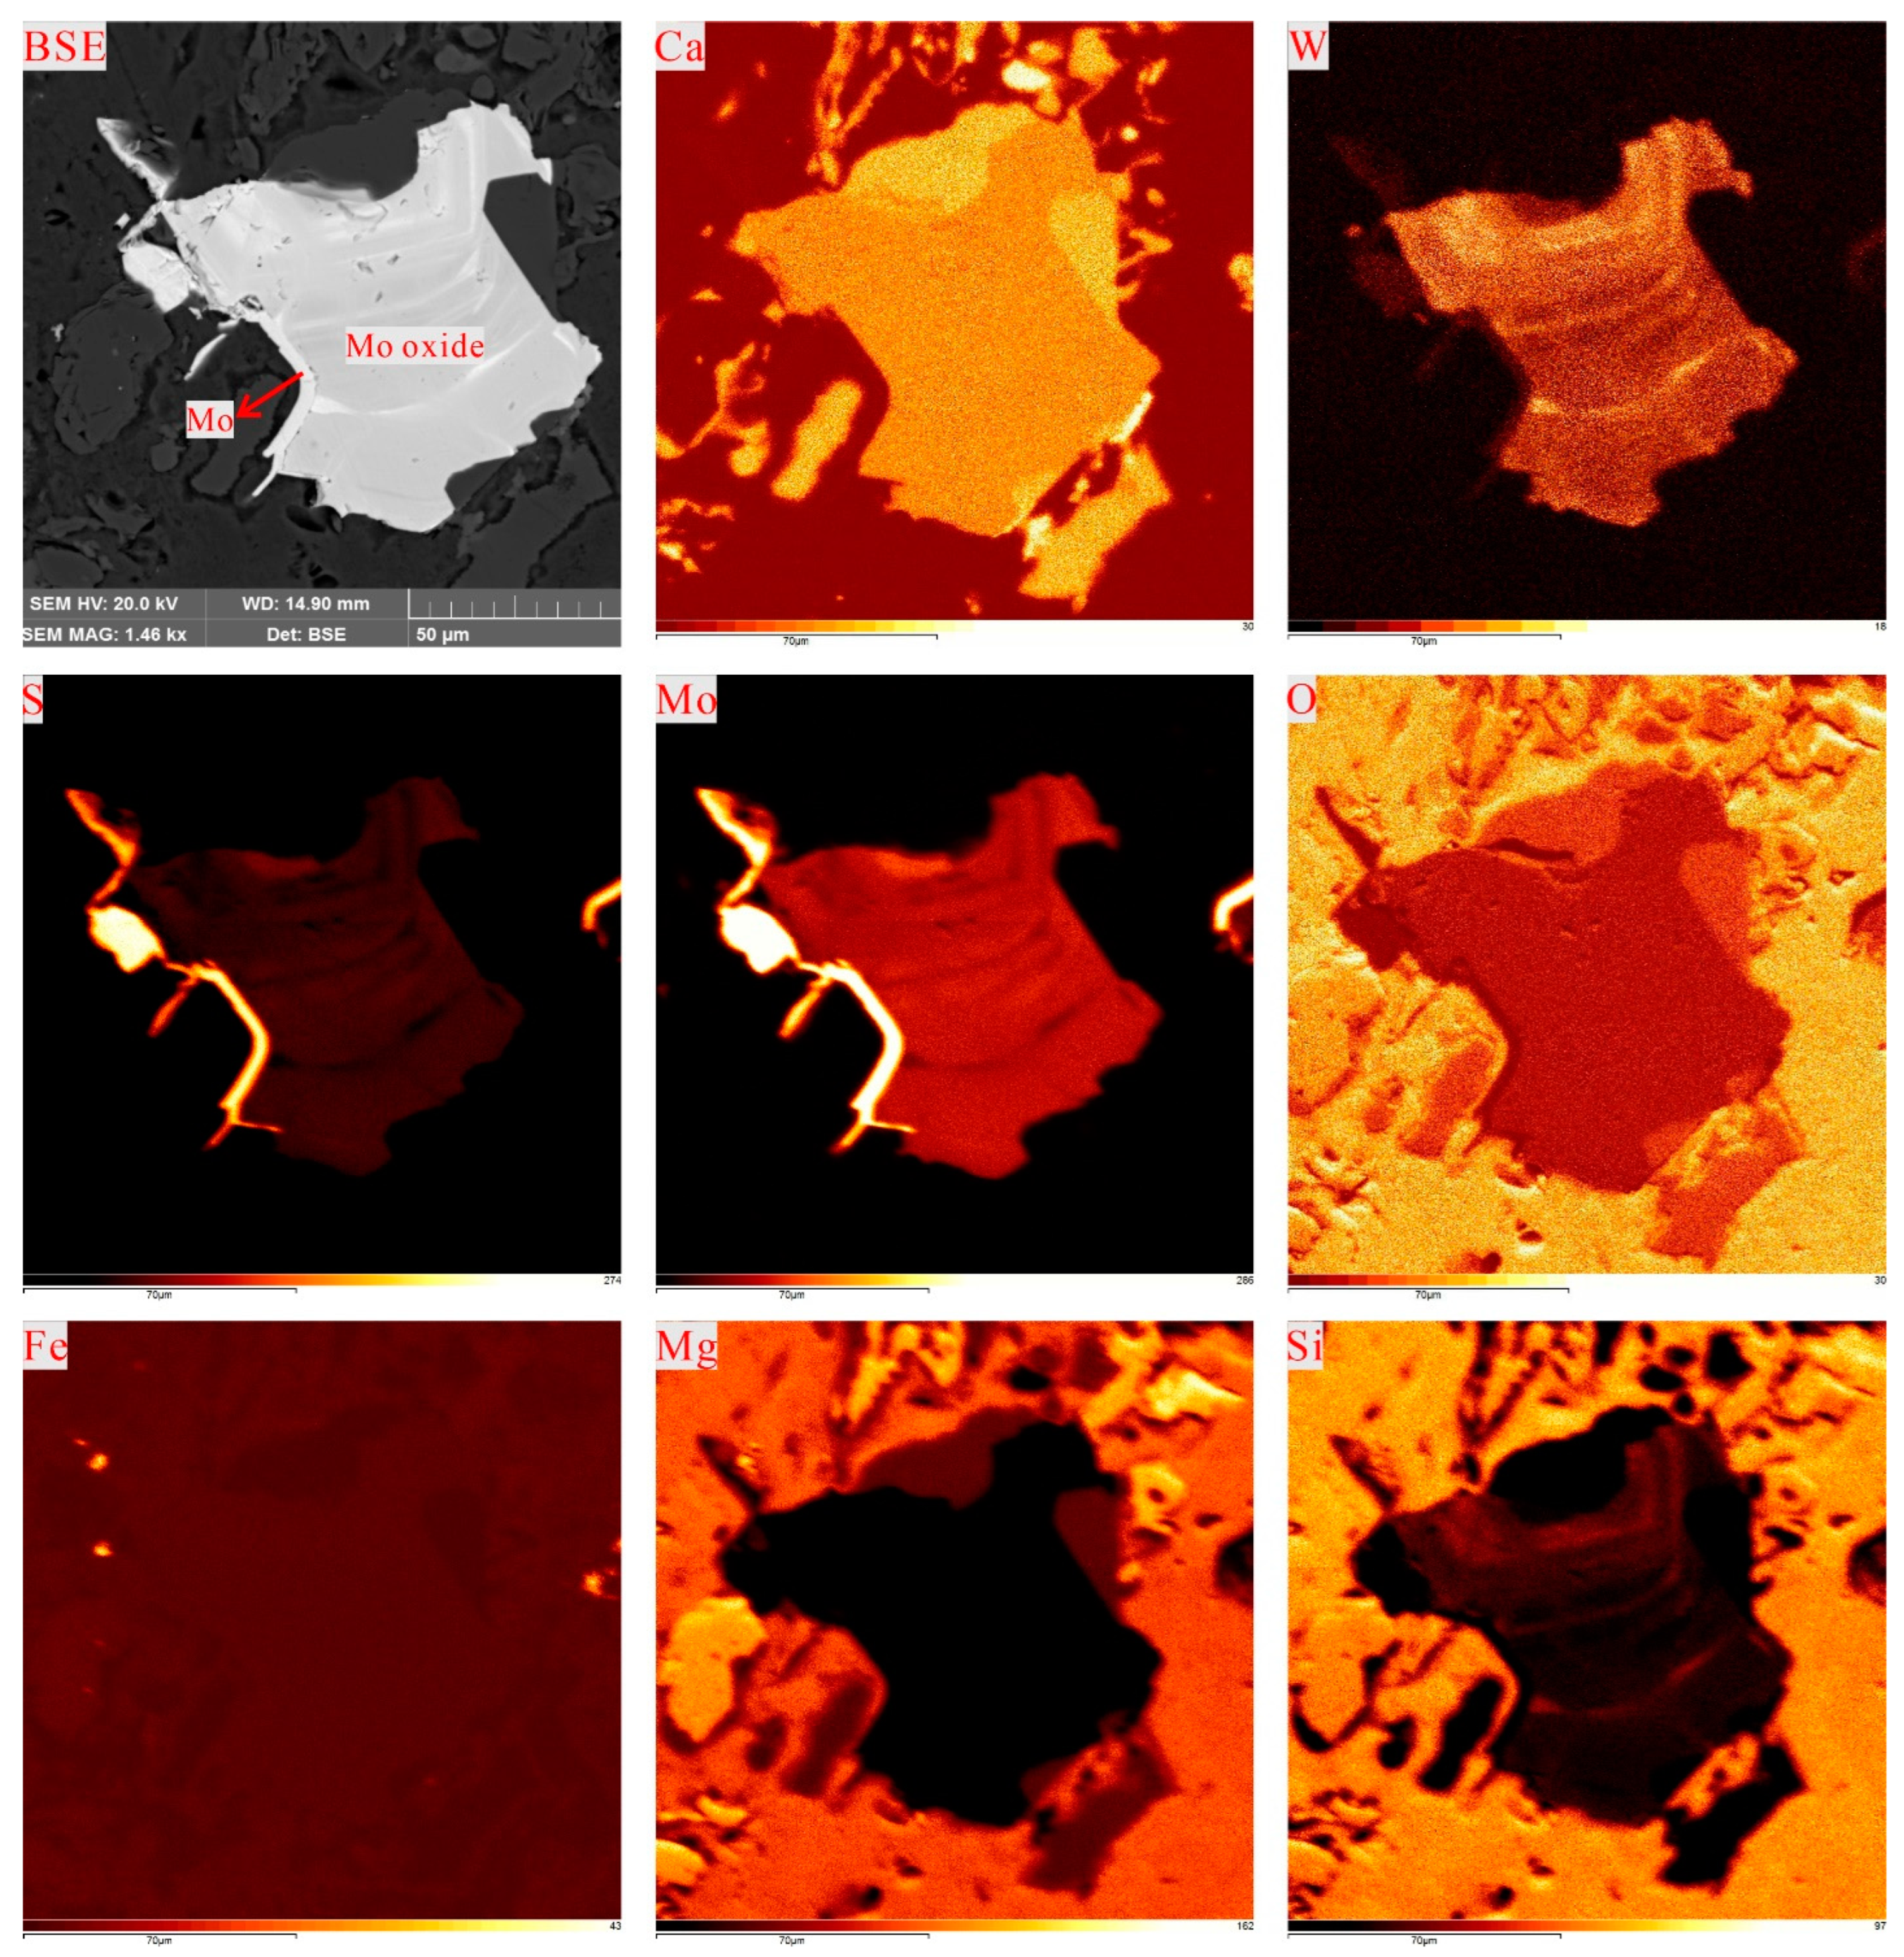
5.1.1. EPMA
5.1.2. SEM-EDS


5.2. Mineralization and Supergene Oxidation Process
6. Conclusions
Author Contributions
Funding
Data Availability Statement
Acknowledgments
Conflicts of Interest
References
- Wang, G.W.; Zhang, S.T.; Yan, C.H.; Song, Y.W.; Sun, Y.; Li, D.; Xu, F.M. Mineral potential targeting and resource assessment based on 3D geological modeling in Luanchuan region, China. Comput. Geosci. 2011, 37, 1976–1988. [Google Scholar] [CrossRef]
- Wang, G.W.; Ma, Z.B.; Li, R.X.; Song, Y.W.; Qu, J.A.; Zhang, S.T.; Yan, C.H.; Han, J.W. Integration of multi-source and multi-scale datasets for 3D structural modeling for subsurface exploration targeting, Luanchuan Mo-polymetallic district, China. J. Appl. Phys. 2017, 139, 269–290. [Google Scholar] [CrossRef]
- Alizadeh, A.A.; Guliyev, I.S.; Kadirov, F.A.; Eppelbaum, L.V. Geosciences in Azerbaijan. In Economic Minerals and Applied Geophysics, 2nd ed.; Springer: Heidelberg, Germany, 2017; Volume 2, p. 340. [Google Scholar]
- Smirnoff, A.; Boisvert, E.; Serge, J. Support vector machine for 3D modelling from sparse geological information of various origins. Comput. Geosci. 2008, 34, 127–143. [Google Scholar] [CrossRef]
- Arias, M.; Nunez, P.; Arias, D.; Gumiel, P.; Castanon, C.; Fuertes-Blanco, J.; Martin-Izard, A. 3D Geological Model of the Touro Cu Deposit, A World-Class Mafic-Siliciclastic VMS Deposit in the NW of the Iberian Peninsula. Minerals 2021, 11, 85. [Google Scholar] [CrossRef]
- Olivier, K.; Thierry, M. 3D geological modelling from boreholes, cross-sections and geological maps, application over former natural gas storages in coal mines. Comput. Geosci. 2008, 34, 278–290. [Google Scholar] [CrossRef]
- Fallara, F.; Legault, M.; Rabeau, O. 3-D Integrated Geological Modeling in the Abitibi Subprovince (Quebec, Canada): Techniques and Applications. Explor. Min. Geol. 2006, 15, 27–43. [Google Scholar] [CrossRef]
- Calcagno, P.; Chilès, J.P.; Courrioux, G.; Guillen, A. Geological modelling from field data and geological knowledge: Part I. Modelling method coupling 3D potential-field interpolation and geological rules. Phys. Earth Planet. Inter. 2008, 171, 147–157. [Google Scholar] [CrossRef]
- Caumon, G.; Collon-Drouaillet, P.; Le Carlier de Veslud, C.; Viseur, S.; Sausse, J. Surface-Based 3D Modeling of Geological Structures. Math. Geosci. 2009, 41, 927–945. [Google Scholar] [CrossRef] [Green Version]
- Sprague, K.; De Kemp, E.; Wong, W.; McGaughey, J.; Perron, G.; Barrie, T. Spatial targeting using queries in a 3-D GIS environment with application to mineral exploration. Comput. Geosci. 2006, 32, 396–418. [Google Scholar] [CrossRef]
- De Kemp, E.; Monecke, T.; Sheshpari, M.; Girard, E.; Lauzière, K.; Grunsky, E.; Schetselaar, E.; Goutier, J.; Perron, G.; Bellefleur, G. 3D GIS as a support for mineral discovery. Geochem. Explor. Environ. Anal. 2011, 11, 117–128. [Google Scholar] [CrossRef]
- Yunsel, T.Y.; Ersoy, A. Geological Modeling of Gold Deposit Based on Grade Domaining Using Plurigaussian Simulation Technique. Nat. Resour. Res. 2011, 20, 231–249. [Google Scholar] [CrossRef]
- Mammo, T. Geophysical Models for the Cu-Dominated VHMS Mineralization in Katta District, Western Ethiopia. Nat. Resour. Res. 2013, 22, 5–18. [Google Scholar] [CrossRef]
- Wang, G.W.; Pang, Z.S.; Boisvert, J.B.; Hao, Y.L.; Cao, Y.X.; Qu, J.N. Quantitative assessment of mineral resources by combining geostatistics and fractal methods in the Tongshan porphyry Cu deposit (China). J. Geochem. Explor. 2013, 134, 85–98. [Google Scholar] [CrossRef]
- Hamedani, M.L.; Plimer, I.R.; Xu, C. Orebody Modelling for Exploration: The Western Mineralisation, Broken Hill, NSW. Nat. Resour. Res. 2012, 21, 325–345. [Google Scholar] [CrossRef]
- Lindsay, M.D.; Aillères, L.; Jessell, M.W.; De Kemp, E.; Betts, P.G. Locating and quantifying geological uncertainty in three-dimensional models: Analysis of the Gippsland Basin, southeastern Australia. Tectonophysics 2012, 546–547, 10–27. [Google Scholar] [CrossRef]
- Mejía-Herrera, P.; Royer, J.J.; Caumon, G.; Cheilletz, A. Curvature Attribute from Surface-Restoration as Predictor Variable in Kupferschiefer Copper Potentials. Nat. Resour. Res. 2015, 24, 275–290. [Google Scholar] [CrossRef]
- Zanchi, A.; Francesca, S.; Stefano, Z.; Simone, S.; Graziano, G. 3D reconstruction of complex geological bodies: Examples from the Alp. Comput. Geosci. 2009, 35, 49–69. [Google Scholar] [CrossRef]
- Li, N.; Chen, Y.J.; Zhang, H.; Zhao, T.P.; Deng, X.H.; Wang, Y.; Ni, Z.Y. Molybdenum deposits in east Qinling. Earth Sci. Front. 2007, 14, 186–198, (In Chinese with English Abstract). [Google Scholar]
- Chen, Y.; Zhai, M.; Jiang, S. Significant achievements and open issues in study of orogenesis and metallogenesis surrounding the North China continent. Acta Petrol. Sin. 2009, 25, 2675–2726, (In Chinese with English Abstract). [Google Scholar]
- Subsurface Mineral Prospecting Report in the Luanchuan Ore District; Henan Institute of Geological Survey: Zhengzhou, China, 2015. (Unpublished materials not intended for publication). (In Chinese)
- Exploration Report of the Sandaozhuang Mo–W Deposit, Luanchuan County; Geological Survey Team 1 of Henan Bureau of Geology: Luoyang, China, 1980. (Unpublished materials not intended for publication). (In Chinese)
- Exploration Report of the Nannihu Mo (-W) Deposit, Luanchuan County; Geological Survey Team 1 of Henan Bureau of Geology: Luoyang, China, 1985. (Unpublished materials not intended for publication). (In Chinese)
- Jiang, D.M.; Fu, Z.G.; Gao, S.H.; Kong, D.C. The analysis of occurrence state for the ore-forming material in Nannihu molybdenum mine field. China Molybdenum Ind. 2008, 32, 23–31, (In Chinese with English Abstract). [Google Scholar]
- Wang, G.W.; Zhu, Y.Y.; Zhang, S.T.; Yan, C.H.; Song, Y.W.; Ma, Z.B.; Hong, D.M.; Chen, T.Z. 3D geological modeling based on gravitational and magnetic data inversion in the Luanchuan ore region, Henan Province, China. J. Appl. Geophys. 2012, 80, 1–11. [Google Scholar] [CrossRef]
- Zhang, Z.Q.; Wang, G.W.; Ma, Z.B.; Gong, X.Y. Interactive 3D Modeling by Integration of Geoscience Datasets for Exploration Targeting in Luanchuan Mo Polymetallic District, China. Nat. Resour. Res. 2018, 27, 315–346. [Google Scholar] [CrossRef]
- Chen, Y.J.; Li, C.; Zhang, J.; Li, Z.; Wang, H.H. Sr and O isotopic characteristics of porphyries in the Qinling molybdenum deposit belt and their implication to genetic mechanism and type. Sci. China Earth Sci. 2000, 43, 82–94. [Google Scholar] [CrossRef]
- Chen, Y.J.; Pirajno, F.; Li, N.; Guo, D.S.; Lai, Y. Hide Researcher Isotope systematics and fluid inclusion studies of the Qiyugou breccia pipe-hosted gold deposit, Qinling Orogen, Henan province, China: Implications for ore genesis. Ore Geol. Rev. 2009, 35, 245–261. [Google Scholar] [CrossRef]
- Ye, H.S. The Mesozoic Tectonic Evolution and Pb-Zn-Ag Metallogeny in the South Margin of North China Craton. Ph.D. Thesis, Chinese Academy of Geological Sciences, Beijing, China, 2006. [Google Scholar]
- Yan, C.H. Internal Structure of Pb-Zn-Ag Metallogenic System in East Qinling, 1st ed.; Geological Publishing House: Beijing, China, 2004; pp. 1–11. (In Chinese) [Google Scholar]
- Shi, Q.Z.; Tao, Z.Q.; Pang, J.Q.; Qu, M.X. Study on Luanchuan Group in the South Margin of North China Plate. J. Geol. Miner. Res. North CHN 1996, 1, 51–59, (In Chinese with English Abstract). [Google Scholar]
- Yan, C.H.; Liu, G.Y.; Peng, Y.; Song, Y.W.; Wang, J.Z.; Zhao, R.J.; Zeng, X.Y.; Lv, W.D.; Yao, X.N.; Ma, H.W.; et al. Metallogenic Regularity of Pb-Zn-Ag in Southwest Henan Province, 1st ed.; Geological Publishing House: Beijing, China, 2009; pp. 70–72. (In Chinese) [Google Scholar]
- Bao, Z.W.; Zeng, Q.S.; Zhao, T.P.; Yuan, Z.L. Geochemistry and petrogenesis of the ore-related Nannihu and Shangfanggou granite porphyries from east Qinling belt and their constaints on the molybdenum mineralization. Acta Petrol. Sin. 2009, 25, 2523–2536, (In Chinese with English Abstract). [Google Scholar]
- Bao, Z.W.; Sun, W.D.; Zartman, R.E.; Yao, J.M.; Gao, X.Y. Recycling of subducted upper continental crust: Constraints on the extensive molybdenum mineralization in the Qinling-Dabie orogen. Ore Geol. Rev. 2017, 81, 451–465. [Google Scholar] [CrossRef]
- Li, N.; Chen, Y.J.; Pirajno, F.; Gong, H.J.; Mao, S.D.; Ni, Z.Y. LA-ICP-MS zircon U-Pb dating, trace element and Hf isotope geochemistry of the Heyu granite batholith, eastern Qinling, central China: Implications for Mesozoic tectono-magmatic evolution. Lithos 2012, 142–143, 34–47. [Google Scholar] [CrossRef]
- Li, N.; Pirajno, F. Early Mesozoic Mo mineralization in the Qinling Orogen: An overview. Ore Geol. Rev. 2017, 81, 431–450. [Google Scholar] [CrossRef]
- Zhang, G.W.; Zhang, B.R.; Xiao, Q.H. Qinling Orogenic Belt and Continental Dynamics, 1st ed.; Science Press: Beijing, China, 2001; pp. 162–320. [Google Scholar]
- Duan, S.G.; Xue, C.J.; Yan, C.H.; Liu, G.Y.; Song, Y.W.; Zhang, D.H. Comparison of Pb-Zn metallogenic characteristics between northern and southern margins of North China Landmass. Miner. Depos. 2008, 3, 383–398. [Google Scholar]
- Qi, J.P.; Chen, Y.J.; Ni, P.; Lai, Y.; Ding, J.Y.; Song, Y.W.; Tang, G.J. Fluid inclusion constraints on the origin of the Lengshuibeigou Pb-Zn-Ag deposit, Henan province. Acta Petrol. Sin. 2007, 23, 2119–2130, (In Chinese with English Abstract). [Google Scholar]
- Luo, M.J.; Zhang, F.M.; Dong, Q.Y.; Xu, Y.R.; Li, S.M.; Li, K.H. Molybdenum Deposits in China; Henan Sci. & Tech. Press: Zhengzhou, China, 1991; p. 452. (In Chinese) [Google Scholar]
- Weng, J.C.; Gao, S.H.; Shi, C.; Wang, Y.M.; Xu, C.Z. Study on the alteration zoning law of Shangfanggou huge-large molybdenum ore deposit. China Molybdenum Ind. 2008, 3, 16–24, (In Chinese with English Abstract). [Google Scholar]
- Mao, J.W. Mesozoic molybdenum deposits in the east Qinling–Dabie orogenic belt: Characteristics and tectonic settings. Ore Geol. Rev. 2011, 43, 264–293. [Google Scholar] [CrossRef]
- Jian, X.L.; Zhang, S.Y.; Pang, Y.C. Henan Province. Verification Report of Mo-Fe Mineral Resource Reserve in the Shangfanggou Mine Area, Luanchuan County. 2012. (Unpublished materials not intended for publication) (In Chinese) [Google Scholar]
- Jiang, G.Q.; Zhou, H.R. Sequence, sedimentary environment and tectonic palaeogeographic significance of Luanchuan Group in Luanchuan area, western Henan, Province. Geoscience 1994, 4, 430–440, (In Chinese with English Abstract). [Google Scholar]
- Wang, X.L.; Jiang, S.Y.; Dai, B.Z.; Griffin, W.L.; Dai, M.N.; Yang, Y.H. Age, geochemistry and tectonic setting of the Neoproterozoic (ca 830 Ma) gabbros on the southern margin of the North China Craton. Precambrian Res. 2011, 190, 35–47. [Google Scholar] [CrossRef]
- Chen, Y.J.; Fu, S.G. Metallogenic Regularity of Gold Deposits in Western Henan, Province, 1st ed.; Seismological Press: Beijing, China, 1992; pp. 1–6. (In Chinese) [Google Scholar]
- Cao, Y.; He, Y.Q.; Zhang, H.; Wang, D.; Hou, S.Z.; Li, Y.T. Geological Characteristics, Mineralization Enrichment Regularity and Prospecting Direction of Shangfanggou Molybdenum Iron Mine in Luanchuan County. China Molybdenum Ind. 2021, 45, 16–21, (In Chinese with English Abstract). [Google Scholar]
- Deutsch, C.V. Geostatistical Reservoir Modeling; Oxford University Press: New York, NY, USA, 2002; p. 336. [Google Scholar]
- Afzal, P.; Alghalandis, Y.F.; Khakzad, A.; Moarefvand, P.; Omran, N.R. Delineation of mineralization zones in porphyry Cu deposits by fractal concentration–volume modeling. J. Geochem. Explor. 2011, 108, 220–232. [Google Scholar] [CrossRef]
- Qu, J.N. Mineral Resources Quantitative Evaluation Based on 3D Geological Modeling: A Case Study on Nannihu Ore Field. Master’s Dissertation, China University of Geosciences, Beijing, China, 2013. [Google Scholar]
- Yang, Y.; Zhang, J.; Yang, Y.F.; Shi, Y.X. Characteristics of fluid inclusions and its geological implication of the Shangfanggou Mo deposit in Luanchuan county, Henan province. Acta Petrol. Sin. 2009, 25, 2563–2574, (In Chinese with English Abstract). [Google Scholar]
- Yang, Y.F.; Li, N.; Yang, Y. Fluid inclusion study of the Nannihu porphyry Mo-W deposit, Luanchuan county, Henan province. Acta Petrol. Sin. 2009, 25, 2550–2562, (In Chinese with English Abstract). [Google Scholar]
- Deng, X.H.; Yao, J.M.; Li, J.; Liu, G.F. Fluid inclusion and Re-Os isotopic constraints on the timing and origin of the Shimengou Mo deposit, Xixia County, Henan Province. Acta Petrol. Sin. 2011, 27, 1439–1452, (In Chinese with English Abstract). [Google Scholar]
- Zhang, S.T.; Wang, G.W.; Tang, L.; Guo, B.; Han, J.W.; Li, D. Metallogenic Background Process and Quantitative Evaluation of Large-Super Large Deposit in Luanchuan Mo-Pb-Zn Polymetallic Ore District, 1st ed.; Geological publishing house: Beijing, China, 2021; pp. 38–55. (In Chinese) [Google Scholar]
- Institute of Geological Sciences; Henan Bureau of Geology and Mineral Resources; Geological Survey Team 1 of Henan Bureau of Geology; Luoyang, Henan Province; Department of Earth Sciences; Nanjing University. Geology and Mineralization of the North and South China Paleo-Plate Convergence Zone: A Case Study of the East Qinling-Tongbai Area, 1st ed.; Nanjing University Press: Nanjing, China, 1988; pp. 442–465. (In Chinese) [Google Scholar]
- Li, X.Z.; Yan, Z.; Lu, X.X. Qinling-Dabie Mountain Granite; Geological Publishing House: Beijing, China, 1993; pp. 10–27. (In Chinese) [Google Scholar]
- Ma, Z.D. A preliminary research on the genesis and the tectonic setting of molybdenum metallogenetic zone in the East Qinling, western Henan in accordance with lead-isotopic composition characters. Earth Sci. 1984, 4, 57–64, (In Chinese with English Abstract). [Google Scholar]
- Mao, J.W.; Ye, H.S.; Wang, R.Y.; Dai, J.Z.; Jian, W.; Xiang, J.F.; Zhou, K.; Meng, F. Mineral deposit model of Mesozoic porphyry Mo and vein-type Pb-Zn-Ag ore deposits in the eastern Qinling, Central China and its implication for prospecting. Geol. Bull. China 2009, 1, 72–79, (In Chinese with English Abstract). [Google Scholar]
- Li, Y.F.; Mao, J.W.; Bai, F.J.; Li, J.P.; He, Z.J. Re-Os Isotopic dating of Molybdenites in the Nannihu Molybdenum (Tungsten) orefield in the Eastern Qinling and its geological significane. Geol Rev. 2003, 6, 652–660, (In Chinese with English Abstract). [Google Scholar]
- Li, Y.F.; Mao, J.W.; Hu, H.B.; Guo, B.J.; Bai, F.J. Geology, distribution, types and tectonic settings of Mesozoic molybdenum deposits in East Qinling area. Mineral. Depos. 2005, 3, 292–304, (In Chinese with English Abstract). [Google Scholar]
- Tang, C.H. The Comparative Study of Petrogenesis and Metallogeny for Nannihu and Shangfanggou in Luanchuan Ore-Concentration Area. Master’s Thesis, China University of Geosciences, Beijing, China, 2015. [Google Scholar]


| Stages | Minerals |
|---|---|
| Protolith | Dolomite, K-feldspar, plagioclase, quartz, biotite, ilmenite, wollastonite |
| Late magmatism (silicification and potassic alteration) stage (1) | K-feldspar, quartz, biotite … |
| Early skarn stage (2) | Garnet, diopside, forsterite … |
| Late skarn stage (3) | Tremolite, magnetite, phlogopite, serpentine, calcite, actinolite, chlorite, talc, fluorite, serpentine … |
| Hydrothermal stage (4) | Quartz, pyrite, molybdenite, K-feldspar, chalcopyrite, galena, sphalerite, epidote, scheelite, fluorite, pyrrhotite … |
| Supergene stage (5) | Molybdite, ilsemannite, scheelite, limonite, tungsten–powellite … |
| Points | 1 | 2 | 3 | 4 | 5 | 6 | 7 | 8 | 9 | 10 | 11 | 12 | 13 | 14 | 15 |
|---|---|---|---|---|---|---|---|---|---|---|---|---|---|---|---|
| F | / | / | / | / | / | / | / | / | / | / | / | / | / | / | / |
| SiO2 | / | / | / | / | / | / | / | / | / | / | / | / | / | / | / |
| WO3 | 12.59 | 32.40 | 32.24 | 14.11 | 23.93 | 17.32 | 11.21 | 17.67 | 28.22 | 30.08 | 27.38 | 18.55 | 29.50 | 25.17 | 31.76 |
| SO3 | 1.66 | 1.26 | 1.41 | 1.49 | 1.33 | 1.64 | 1.48 | 1.49 | 1.18 | 1.24 | 1.19 | 1.45 | 1.34 | 1.35 | 1.93 |
| Al2O3 | / | / | / | 0.02 | / | / | / | / | / | / | / | / | / | 0.02 | / |
| MgO | / | / | / | / | / | / | / | / | / | / | / | 0.13 | / | / | / |
| MoO3 | 58.51 | 40.91 | 40.65 | 57.55 | 48.86 | 53.66 | 60.03 | 54.21 | 43.81 | 42.54 | 45.56 | 51.85 | 43.74 | 47.59 | 39.80 |
| CaO | 26.73 | 24.35 | 24.37 | 26.36 | 25.07 | 26.69 | 27.08 | 26.05 | 25.97 | 25.29 | 25.03 | 26.77 | 24.18 | 25.17 | 24.80 |
| SeO2 | 0.10 | 0.63 | 0.66 | 0.14 | 0.51 | 0.26 | 0.13 | 0.31 | 0.44 | 0.77 | 0.64 | 0.34 | 0.54 | 0.60 | 0.63 |
| FeO | 0.07 | 0.10 | 0.05 | 0.03 | 0.12 | 0.03 | / | 0.06 | 0.11 | 0.07 | 0.07 | 0.14 | 0.20 | 0.09 | 0.06 |
| Cl | 0.16 | 0.08 | 0.11 | 0.19 | 0.15 | 0.14 | 0.13 | 0.16 | 0.14 | 0.10 | 0.12 | 0.13 | 0.14 | 0.12 | 0.07 |
| MnO | / | / | 0.04 | / | / | / | / | / | 0.04 | 0.07 | 0.03 | 0.04 | / | / | / |
| P2O5 | / | / | / | / | / | / | 0.06 | / | / | / | / | / | / | / | / |
| CuO | / | / | / | / | / | / | / | / | / | / | / | / | / | / | / |
| PbO | / | / | / | / | / | / | / | / | / | / | / | / | / | / | / |
| TeO2 | / | / | / | / | / | / | / | / | / | / | / | / | / | / | / |
| Total | 99.82 | 99.73 | 99.53 | 99.89 | 99.97 | 99.74 | 100.12 | 99.95 | 99.91 | 100.16 | 100.02 | 99.40 | 99.64 | 100.11 | 99.05 |
Publisher’s Note: MDPI stays neutral with regard to jurisdictional claims in published maps and institutional affiliations. |
© 2022 by the authors. Licensee MDPI, Basel, Switzerland. This article is an open access article distributed under the terms and conditions of the Creative Commons Attribution (CC BY) license (https://creativecommons.org/licenses/by/4.0/).
Share and Cite
Liu, Z.; Zuo, L.; Xu, S.; He, Y.; Wang, C.; Wang, L.; Yang, T.; Wang, G.; Zeng, L.; Mou, N.; et al. 3D Multi-Parameter Geological Modeling and Knowledge Findings for Mo Oxide Orebodies in the Shangfanggou Porphyry–Skarn Mo (–Fe) Deposit, Henan Province, China. Minerals 2022, 12, 769. https://0-doi-org.brum.beds.ac.uk/10.3390/min12060769
Liu Z, Zuo L, Xu S, He Y, Wang C, Wang L, Yang T, Wang G, Zeng L, Mou N, et al. 3D Multi-Parameter Geological Modeling and Knowledge Findings for Mo Oxide Orebodies in the Shangfanggou Porphyry–Skarn Mo (–Fe) Deposit, Henan Province, China. Minerals. 2022; 12(6):769. https://0-doi-org.brum.beds.ac.uk/10.3390/min12060769
Chicago/Turabian StyleLiu, Zhifei, Ling Zuo, Senmin Xu, Yaqing He, Chunyi Wang, Luofeng Wang, Tao Yang, Gongwen Wang, Linggao Zeng, Nini Mou, and et al. 2022. "3D Multi-Parameter Geological Modeling and Knowledge Findings for Mo Oxide Orebodies in the Shangfanggou Porphyry–Skarn Mo (–Fe) Deposit, Henan Province, China" Minerals 12, no. 6: 769. https://0-doi-org.brum.beds.ac.uk/10.3390/min12060769