Article

Ballen Quartz in Jänisjärvi Impact Melt Rock with High Concentrations of Fe, Mg, and Al: EPMA, EDS, EBSD, CL, and Raman Spectroscopy

by
Daria A. Zamiatina
*,
Dmitry A. Zamyatin
and
Georgii B. Mikhalevskii
The Zavaritsky Institute of Geology and Geochemistry, Ural Branch of the Russian Academy of Sciences, 620016 Ekaterinburg, Russia
*
Author to whom correspondence should be addressed.
Submission received: 23 March 2022 / Revised: 30 June 2022 / Accepted: 9 July 2022 / Published: 14 July 2022

Abstract

:
Ballen quartz is a spherical aggregate that is typical for impactites. Previous studies of ballen quartz in different impact structures have revealed the presence of Fe, K, Al, Mg, and Ca in the contact zone between individual ballen only. In the present study, we describe ballen quartz found in a sample from a Jänisjärvi impact structure with a high concentration of Al2O3 (up to 4.56 wt.%), FeO (6.43 wt.%), and MgO (2.12 wt.%) in individual ballen. Microbeam methods: EPMA (Electron Probe Microanalysis), EDS (Energy-Dispersive Spectroscopy), BSE (Back-scattered Electrons), EBSD (Electron Backscatter Diffraction), CL (Cathodoluminescence), and Raman spectroscopy were used to understand the atypical compositions of ballen quartz and its formation processes. Ballen quartz in our sample consists of unaltered quartz (domain A), which was formed as a result of shock heating, and hydrothermally altered quartz (domain B). The abundance of Fe, Mg, and Al in domain B is associated with submicron-sized inclusions of chlorite or other Fe-Mg minerals. Misorientations in subgrains in ballen quartz type A and B reach 1° and 7°, respectively. The micrometer-sized orientational inhomogeneity in ballen quartz type B is comparable in size to the micrometer-sized blocks separated by the grid of microfractures. The new data obtained expand the diversity of the ballen quartz studied and could be used for an understanding the mechanisms of their formation.

1. Introduction

Craters on planets are formed by meteorite-impact events when extreme pressures and temperatures reach sufficient levels for the complete melting of the target material. Quartz is a common mineral found in most terrestrial meteorite craters. Due to the high pressure and temperature effects of the impact process, the quartz in the target rocks undergoes phase transitions and forms diaplectic glass at pressures above 35 GPa. Quartz melts at pressures above 50 GPa [1]. “Ballen-like” textural features are produced in experiments by using high-temperature annealing of diaplectic quartz glass at about 1200 °C [2,3].
Ballen silica is a spherical aggregate of quartz and/or cristobalite typical of impacted rocks. Ballen quartz has been found in impactites of various impact structures (e.g., Deep Bay, Canada [2]; Ries, Germany [4,5,6,7]; Jänisjärvi, Russia [8]; Lappajärvi, Finland [9]; Chicxulub, Mexico [10]; Kara, Russia [11]; and others (for a review, see Reference [6]).
The classifications of ballen quartz are based on the optical properties and crystal structure of the SiO2 constituent of the ballen [6,9]. Ferrière and coauthors [6] identified five types of ballen silica: formed from α-cristobalite with uniform optical extinction (type I); from α-quartz with uniform extinction, where all single ballen have a common extinction (type II); from α-quartz with heterogeneous extinction, where each individual ballen has uniform extinction (type III); from α-quartz with intra-ballen recrystallization, which has heterogeneous extinction within one ballen (type IV); and silicon-like recrystallized ballen α-quartz, where the boundaries of an individual ballen are not easily distinguished in polarized light (type V). According to Reference [12], ballen quartz in Jänisjärvi impactites belongs to types III and IV.
The mechanism for the formation of aggregates of ballen quartz remains debatable. The existing models are mainly based on the evidence of phase transformations of silica, such as the transformation of lechatelierite or diaplectic quartz glass to cristobalite and subsequent transition to α-quartz [9,13]. According to Reference [6], α-quartz in ballen is the product of the inverse transformation of β-quartz and/or α-cristobalite. In contrast, Reference [7] suggested that ballen quartz represents former quartz grains enriched in inclusions, transformed into shock-induced amorphous phase, and subsequently recrystallized into a set of ballen upon dehydration. This assumption is based on the fact that ballen resembles globular perlite microstructures as known from cristobalite in andesitic to rhyolitic volcanics and hydrated glass (see References [14,15]). Based on experimental evidence, Reference [16] explained the formation of perlite structures by the solidification of hydrous silica-rich melts with hindered dehydration. They consider that the formation of perlitic glasses was accompanied by the swelling of the glass during dehydration and development of the conchoidal partings and the capillary channels typical of perlite [16].
Previous studies of ballen quartz in various impact structures did not reveal the presence of non-formula elements in individual ballen. The presence of Fe, K, Al, Mg, and Ca in significant amounts was noted only in the contact zone between ballen [6,7]. Current studies are devoted to the study of ballen quartz in the sample from the Jänisjärvi impact structure with a high concentration of non-formula elements in individual ballen, using the microanalysis and microscopy methods (EPMA, EDS, BSE, EBSD, CL, and Raman spectroscopy). Therefore, the goal of this study was to unravel the sequence of its transformations, thereby refining our understanding of the atypical chemical composition of ballen quartz.

2. Materials and Methods

The 682 ± 4 Ma Jänisjärvi impact structure [17] is located 25 km north of Lake Ladoga, Karelia, Russia (Figure 1a). The crater is filled with water forming a Jänisjärvi lake (Figure 1b). The diameter of the crater is 14 km. Impactites are exposed on the islands found in the center of the lake and on the western cape, represented by impact melt rocks and suevites. The target rocks are composed of the Lower Proterozoic quartz-biotite schists of the Ladoga Series (Pälkjärvi and Naatselkä formation). These are composed of quartz, biotite, garnet, staurolite, andalusite, and cordierite [18]. The mineral composition of impactites is characterized by quartz, plagioclase, sanidine, staurolite, garnet, biotite, hypersthene, and cordierite [18,19,20]. Ballen quartz has been observed in cryptocrystalline melt breccias and in impact melt rocks [8,21]. Thin sections of 20 different samples of impact melt rocks were studied. Ballen quartz was found in polished thin sections from three samples: Jl-01 and Jl-05 are from Cape Leppiniemi, and Jh-06 is from island Hopeasaari (Figure 1b). Here, we present a detailed study of one polished thin section of an impact melt rock sample Jl-01 from Cape Leppiniemi (Figure 1c). The mechanical polishing was performed by using diamond powders, and the final polishing of a thin section was performed by using a suspension of colloidal silica in an active rotary-head polishing machine from Struers for 2 h.
The preparation and characterization of the sample by using optical and electron microscopy and microanalysis were carried out at the Geoanalitik shared research facilities at the Zavaritsky Institute of Geology and Geochemistry of the Ural Branch of the Russian Academy of Sciences (Ekaterinburg). Optical microscopy was performed under plain-polarized and cross-polarized transmitted light, using an Olympus BX-51 microscope.
The electron probe microanalyzer Cameca SX100 (EPMA), with an accelerating voltage of 15 kV and probe current of 40 nA, was used to measure the chemical composition of mineral phases. The microanalyzer is equipped with five wave dispersive spectrometers and crystals, used in diffraction with 2d spacings of 25.745 Å (TAP crystal), 8.75 Å (PET), 4.26 Å (LIF). Standard deviations are below 0.14, 0.22, 0.20, 0.05, 0.70, 0.96, 0.14, 0.20, 0.61, and 0.42 wt.% for Na, Mg, K, Ca, Cr, Fe, Mn, Al, Ti, and Si, respectively. Detection limit for elements Na (0.03–0.09 wt.%); Mg (0.02–0.09 wt.%); K (0.02–0.12 wt.%); Ca (0.02–0.03 wt.%); Fe (0.11–0.48 wt.%); Cr (0.06–0.35 wt.%); Ti (0.04–0.07 wt.%); Mn (0.04–0.05 wt.%); Si (0.07–0.42 wt.%); and Al (0.02–0.14 wt.%).
The electron backscattered diffraction (EBSD) map was obtained by using the scanning electron microscope (SEM) TESCAN MIRA LMS equipped with an Oxford NordlysNano EBSD detector. The chemical maps were obtained by using an Oxford Instruments X-Max 80 Energy-dispersion spectrometer (EDS) detector. The data were processed by using Aztec v3.2 and Channel5 software.
Cathodoluminescence (CL) spectra were obtained by using a HORIBA H-CLUE iHR500 spectrometer installed on the scanning electron microscope JEOL JSM-6390LV. CL spectra were recorded in the range of 180–950 nm, at an accelerating voltage of 20 kV, using diffraction grating of 150 gr/mm.
The hyperspectral Raman maps were obtained in the spectral range of 0–1200 cm−1, using He-laser excitation of 633 nm, a diffraction grating of 600 gr/mm, and Olympus BX-FM microscope with 100× objective. The arrays of Raman spectra were processed in LabSpec software by subtracting the background and applying the noise reduction function. The phase ratio maps were created by using Raman bands of distinguished phases: 464 cm−1 (quartz); 485 and 510 cm−1 (sanidine); and 416 cm−1 (cristobalite). The Raman spectra were compared with the selected corresponding Raman spectra of minerals from the database RRUFF.info [22].

3. Results

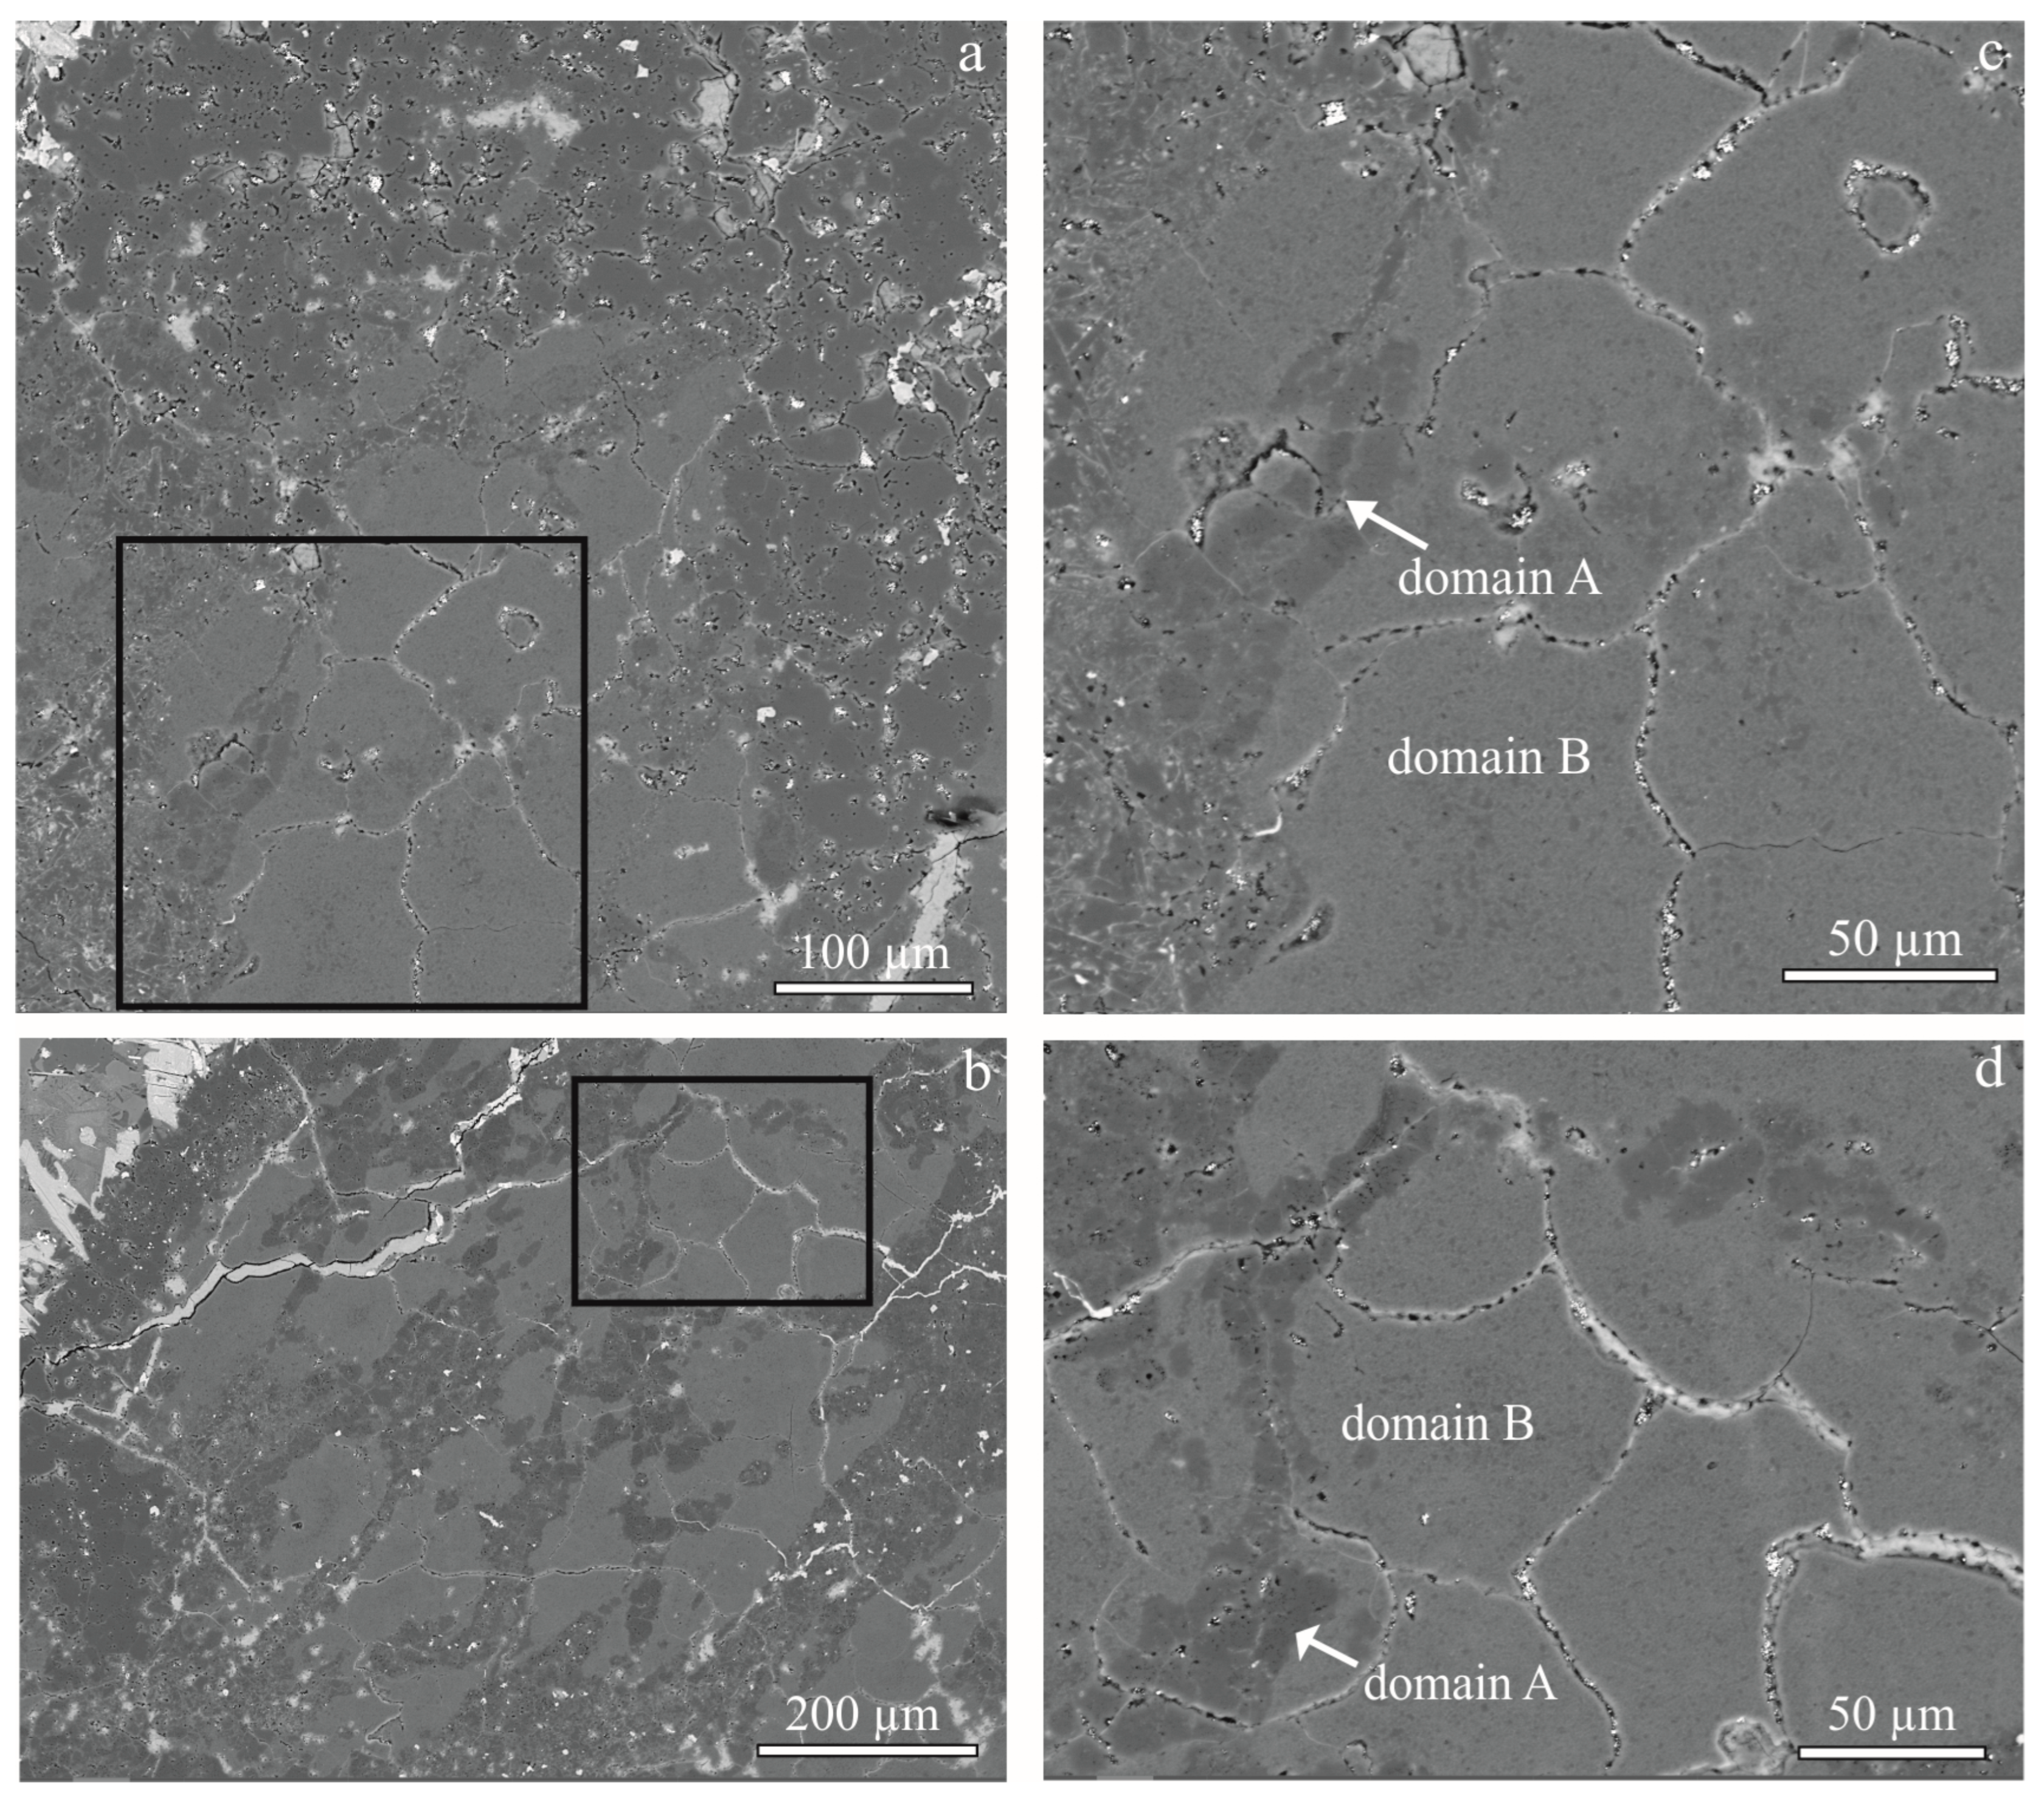
3.1. The Internal Texture of Ballen Quartz

Ballen quartz was found in two samples from Cape Leppiniemi (Jl-01, Jl-05) and one sample from island Hopeasaari (Jh-06). The studied samples belong to impact melt rocks, and they have a dark greenish-gray color and an aphanitic texture. The rocks contain lithic clasts (1–5%), are 1–10 mm in size, and are composed of the same minerals as the rock matrix. The impact melt rocks are composed of quartz, cordierite, plagioclase, sanidine, chlorite, biotite, ilmenite, and cristobalite. Ballen silica is represented by quartz, which occurs as clusters of spherical aggregates (Figure 2 and Figure 3). Cristobalite was not found in aggregates of ballen quartz. Individual ballen can have both homogeneous and heterogeneous extinction, which allows it to be assigned to type III, and IV in classification of Reference [6], as reported in the work of Reference [12]. Two types of domains (A and B) are well distinguished in ballen quartz by intensities in BSE (Figure 2, Figure 3 and Figure 4) and CL images (Figure 2d).
Domains of type A have low BSE intensity when compared to domains of type B. A higher intensity is caused by the presence of non-formula elements in domains of type B that allows these domains to be shown quickly in BSE images. The electron channeling effect in our case is a secondary effect. The contrast of the BSE images is adjusted in such a way that the channeling effect does not appear in the image. The difference in the BSE brightness in domains of type A and type B is due to the presence of elements in microfractures, as confirmed by elemental maps (Figure 2e–h). The enlarged BSE image shows that the impurities are not uniformly distributed in domain B, but in the form of a grid that divides the individual ballen into micrometer-sized blocks with round or rectangular shapes (Figure 4b–d). Domain A has a porous structure, while domain B has a system of microfractures. The size of pores and inclusions in domain A is several times larger than in domain B (Figure 4b,c). The domains of type A are located closer to the outer edge of the aggregates of ballen quartz and presented as veinlets among domains of type B in several cases (Figure 3 and Figure 4).

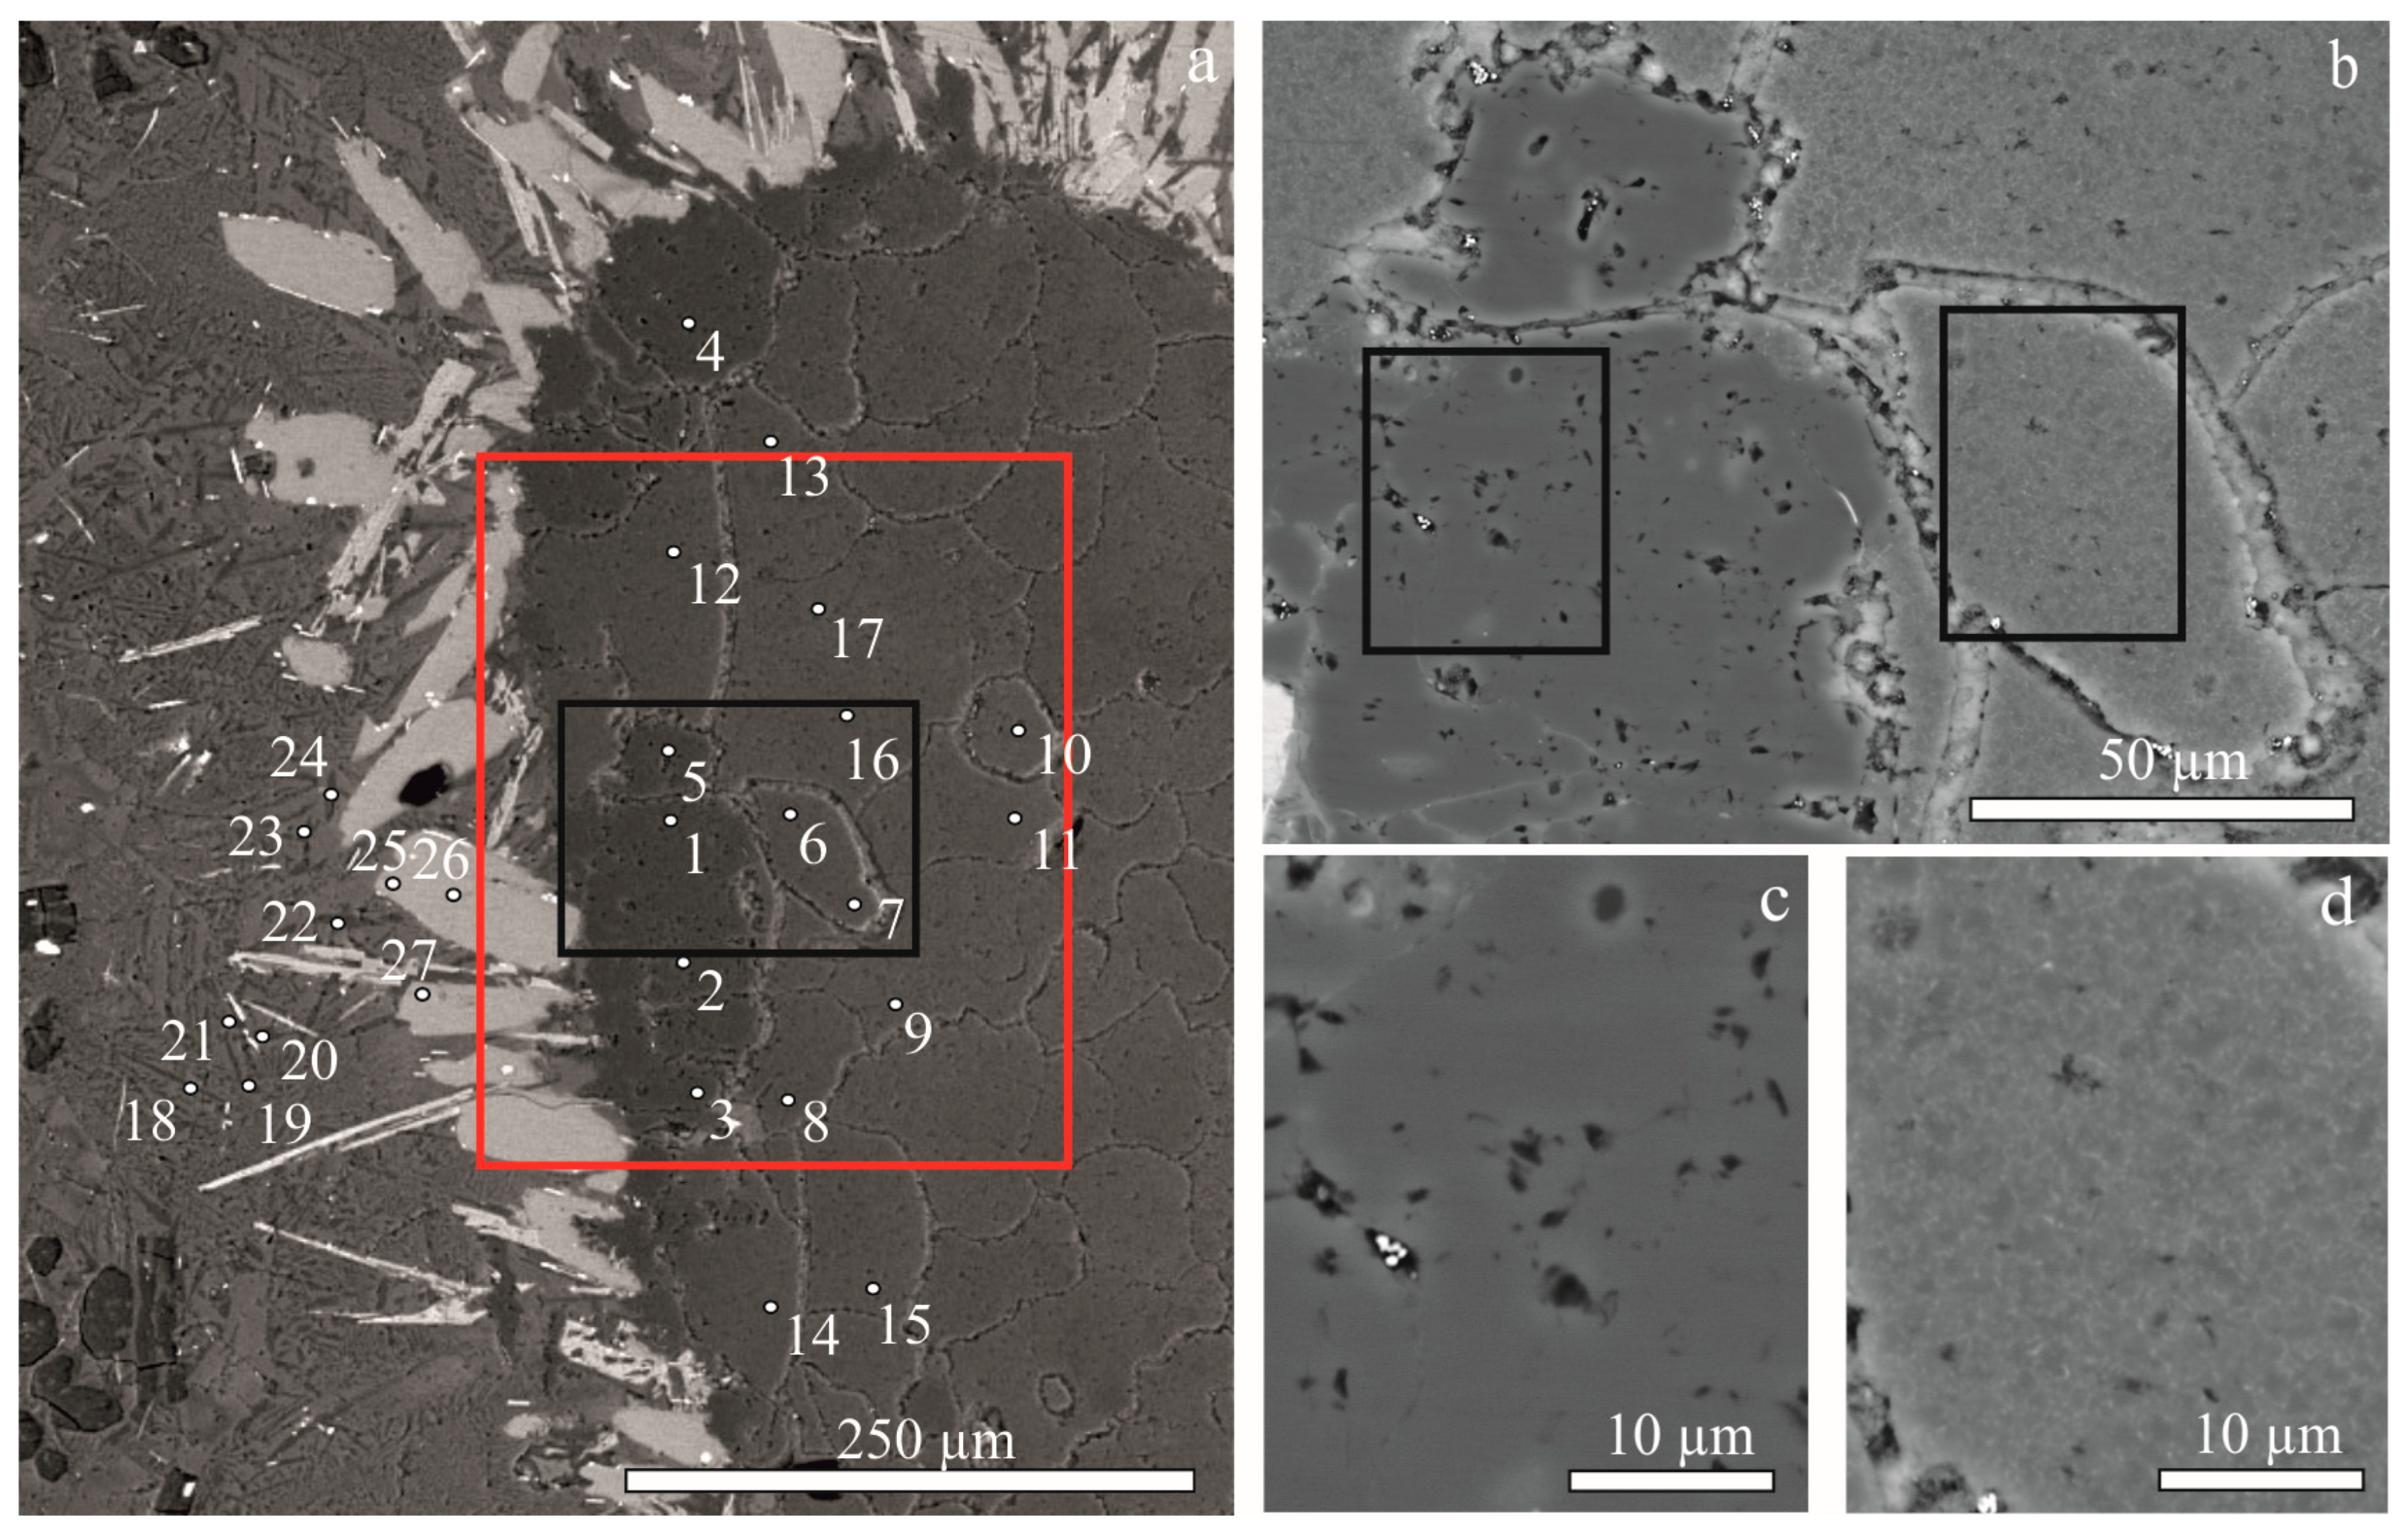
3.2. EPMA, Raman, and CL Data

The chemical mapping shows a high concentration of Mg, Fe, and Al in ballen quartz. The space between single ballen is also enriched with these elements (Figure 2f–h). In EDS maps, domains of type A appear to be depleted in Mg, Fe, and Al, and domains of type B are enriched in these elements (Figure 2f–h). Domains of type A and type B do not differ in K content due to low concentration (Figure 2i). Domains of type A appear unaltered and located mainly at the boundary of ballen quartz. EPMA results show that domains of type A contain up to 0.88 wt.% of Al2O3 and 0.33 wt.% of FeO (Figure 4a and Table 1). Domains of type B contain up to 4.56 wt.% of Al2O3, 6.43 wt.% of FeO, and 2.12 of wt.% MgO (Figure 4a and Table 1). Domains of type B are also characterized by low totals (up to 3.5 wt.%, Table 1).
Table 1. Chemical composition of ballen quartz in domains A and B and cristobalite in the rim of ballen quartz, as determined by EPMA.
Mineral#Na2OMgOK2OCaOFeOCr2O3TiO2MnOAl2O3SiO2Total
Quartz
domains of type A
1bdlbdlbdlbdl0.14bdlbdlbdl0.29100.12100.55
20.11bdlbdlbdl0.21bdlbdlbdl0.8897.2998.49
3bdlbdlbdlbdl0.33bdlbdlbdl0.4499.55100.32
4bdl0.03bdlbdl0.23bdlbdlbdl0.30100.01100.57
50.06bdlbdlbdl0.31bdlbdlbdl0.8196.6797.85
Quartz
domains of type B
6bdl1.010.060.073.70bdlbdl0.072.6491.7999.34
70.041.320.060.103.47bdlbdl0.033.0988.4296.53
8bdl0.720.040.052.39bdlbdlbdl1.8593.3798.42
9bdl2.120.080.136.43bdlbdlbdl4.5683.8397.15
10bdl1.500.060.084.25bdlbdlbdl3.4587.2096.54
11bdl1.150.060.123.71bdlbdlbdl2.8390.4998.36
12bdl1.160.040.074.03bdlbdlbdl2.5791.3799.24
13bdl0.930.060.063.01bdlbdlbdl2.2992.1398.48
14bdl0.970.050.072.95bdlbdlbdl2.3492.1098.48
15bdl1.240.050.073.93bdlbdlbdl2.7989.5597.63
160.050.950.050.052.90bdlbdlbdl2.4490.7997.23
17bdl0.930.050.072.83bdlbdlbdl2.3891.9298.18
Cristobalite in rim180.440.111.050.04bdl0.460.25bdl2.9593.0898.38
190.22bdl0.590.05bdlbdl0.21bdl1.5597.0099.62
200.12bdl0.09bdl0.69bdl0.1bdl0.7198.70100.41
210.520.051.730.070.19bdl0.28bdl3.9291.7898.54
220.11bdlbdl0.040.440.5bdlbdl1.3996.0998.57
230.100.170.170.050.79bdl0.19bdl1.8596.3599.67
240.170.430.460.090.84bdlbdlbdl3.1192.6097.70
Chlorite in rim25bdl11.220.060.2226.320.53bdl0.1131.9014.8185.29
26bdl12.690.040.1827.531.25bdl0.0731.3413.8086.96
27bdl10.400.070.2326.380.590.100.1231.4315.3884.71
Measured EPMA data, wt.%; bdl = below the detection limit. The serial number corresponds to the point number in Figure 4.
Domains A and B could also be distinguished by using panchromatic CL images (Figure 2d). The bright CL response is typical for domains of type A. The color of CL in domains of type A is blueish, and in domains of type B, it is reddish. The CL spectra of the domains of type A consist of wide bands positioned at 252, 353, 426, 491, and 630 nm (Figure 5a). The regions with low CL intensities correspond to domains of type B, where the CL spectra show two peaks at 460 nm and the main one at 647 nm (Figure 5b).
According to the Raman spectroscopy data, the aggregate of ballen consists of quartz (Figure 6a,c,e). Raman spectra in domains of type A are presented by typical bands at 128, 204, 264, 356, 394, 465, and 798 cm−1; domains of type B at 128, 208, 264, 356, 394, 464, and 802 cm−1; and the intergrain space at 128, 204, 265, 394, and 464 cm−1. Raman mapping by the most intensive band, 464 cm−1, shows that the domain A has a higher intensity compared to domain B. No Raman spectra of other minerals were found in the aggregates of ballen quartz.
The rims around the aggregates of ballen quartz are composed of chlorite, titanite, cristobalite, sanidine, and quartz (Figure 2). The Raman mapping of the rim shows the presence of a quartz, sanidine, and cristobalite mixture with a micropegmatitic texture (Figure 6b,d,f). The phases were identified by combining BSE images with Raman maps. Raman spectra in quartz contain low-intensity bands of cristobalite and sanidine (Figure 6f). The spectra are characterized by the typical bands of quartz at 128, 206, 355, and 464 cm−1. The Raman spectra of cristobalite have three typical bands of 111, 228, and 415 cm1 and show the presence of low intense sanidine bands. The Raman spectra of sanidine have characteristic bands of 162, 286, 474, and 514 cm1, and cristobalite bands appear. According to EPMA data, cristobalite is enriched in Na2O (0.1–0.5 wt.%), K2O (0.1–1.7 wt.%), FeO (0.2–0.8 wt.%), and Al2O3 (0.7–3.9 wt.%) (Figure 4a and Table 1). Since the cristobalite grains are 1–5 µm thick (Figure 6b,d), in some cases, elevated values of Na2O, K2O, and Al2O3 can be measured at points near sanidine. Chlorite in the rim contains up to 12,69 wt.% MgO, 27,53 FeO, and 31,90 Al2O3 (Table 1).

3.3. EBSD Data

The EBSD maps show that ballen quartzes are misoriented from one another. Even individual ballen are presented by one or several misoriented subgrains of quartz (Figure 7a,c). Misorientations of subgrains are up to several degrees (Figure 7a). The subgrains form color-coded orientation clusters in pole figures (Figure 7b).
A comparison of EBSD maps (Figure 7) and BSE images (Figure 4) shows that the misorientation of grains is not visible in BSE images (Figure 4b). The chemical composition of domains of type A and type B is a primary effect in comparison with the orientation effect on BSE intensity (Figure 2 and Figure 3). In contrast, it is expected that the chemical composition of individual domains of type A is a secondary effect in comparison with orientation effect on BSE intensity due to high misorientation. Probably, in order to distinguish subgrains in domain A with different orientations (Figure 7a) in the BSE image, higher contrast is required.
Misorientation maps were created for each subgrain in the individual domain (Figure 7c) relative to internal points (red asterisk). The domains of type B appear more misoriented than the domains of type A. The misorientations in subgrains of ballen quartz type A do not exceed 1°. The misorientations in subgrains of ballen quartz type B are limited by 7°. The micrometer-sized orientational inhomogeneity visible in domain B is comparable in size to the micrometer-sized blocks visible in the BSE image (Figure 7d).

4. Discussion

4.1. The Reasons of High Concentration of Fe, Mg, and Al in Ballen Quartz

The most prominent feature of ballen quartz from the Jänisjärvi impact structure is the inhomogeneity and the high concentration of Al, Fe, and Mg in individual ballen (Figure 4a and Table 1). To the best of our knowledge, ballen quartz with such high abundances of trace elements has not been previously found in impactites. The abundance of these trace elements at several wt.% is not typical for the crystal structure of quartz. Due to the close ionic radii of Si4+ and Al3+, the most typical trace element for quartz is Al (up to several 1000 ppm) [23], whereas Fe3+ has a relatively large ionic radius and can enter the structure at the crystal rims [24]. The presence of trace elements in ballen quartz type B, as documented in our sample by EPMA and SEM–EDS (Figure 2 and Figure 4; Table 1), is possibly caused by the presence of submicron-size mineral inclusions. Studies of ballen quartz in various impact structures have not shown a significant abundance of any trace elements, although the presence of Fe, K, Al, Mg, and Ca has been documented in the contact zones between ballen [6,7]. According to Reference [6], the mineral filling the space between ballen belongs to the smectite group (Al/Si ratio, 0.4–0.5; Al/Fe ratio, 2.2–2.3). It is probably deposited in the space between the individual ballen or obtained as a result of alteration of the glassy phase under the water fluid presence. In ballen quartz from the Jänisjärvi impact structure, the high concentration of Al, Fe, and Mg inside individual ballen is associated with other mineral inclusions (see below).

4.2. Hydrothermal Origin of High Fe, Mg, and Al Abundance in Ballen Quartz

The chlorite rim around the aggregate of ballen quartz contains up to 15.38 wt.% of Al2O3, 27.53 wt.% of FeO, and 12.69 wt.% of MgO (Table 1). The deficit of the totals is 14–16 wt.%. The element abundance ratios of this chlorite are close to ratios of non-formula elements in domains type B of the ballen quartz (Table 1). Based on EPMA data, BSE and CL images, and CL spectra, as well as EDS mapping (Figure 2, Figure 3, Figure 4 and Figure 5; Table 1), we can conclude that 1–5 wt.% of Al, Fe, and Mg in domains of type B is associated with inclusions of chlorite or another Fe-Mg mineral of submicron size. The absence of Raman bands of chlorite in domains B could be due to the low intensity of the chlorite spectra compared to quartz spectra (Figure 6).
The CL spectra in domains A have a main peak at 420–450 nm spectra region (Figure 5a). This is typical for primary igneous or shock quartz and lechatelierite [25]. The origin of the main 420 nm emission band is associated with an inherent defect caused by irradiation [26]. According to CL data, the 650 nm luminescent band in domains of type B (Figure 5b) is typical for hydrothermally transformed quartz [25,26]. The 650 nm band usually refers to non-bridged hole oxygen centers (NBOHCs) [27]. They could be formed due to thermal breakage of the OH groups which are part of the composition in quartz. We assume that domain B is darker in CL because of the high concentration of trace elements, especially Fe ions, which strongly absorb luminescence.
Chlorite is a typical hydrothermal mineral in all hydrothermally altered craters. Evidence of hydrothermal activity has been found in many impact structures on Earth, such as [28] Chicxulub, Kara, Popigai, Puchezh-Katunki, Siljan, Sudbury, Jänisjärvi, and others. Such activity is triggered by the interaction of impact melt and/or heated rocks with H2O in the near-surface region of the impact crater. The interaction creates a circulation system of hot water which can dissolve, transport, and precipitate various minerals [29]. We can assume that chlorite inclusions occur as a result of hydrothermal alteration and do not affect domains of type A. After the impact, the water which is released from hydrous minerals (or surface water) circulated through the fractures. Chlorite is formed in the fractures between ballen and in the system of microfractures in domains of type B. The high concentration of Fe, Mg, and Al in ballen quartz type B and their absence in ballen quartz type A are regulated by an interconnected system of microfractures. According to modern geothermal systems, the temperature intervals of chlorite crystallization are estimated at 180–350 °C [24].

4.3. Formation of the Internal Structural Domains of Ballen Quartz

We suggest that the textural features of domains of type A (with a porous structure) and type B (with a microfracturing system) are associated with the heterogeneity of the diaplectic glass or lechatelierite from which the ballen quartz was formed. In domains of type B, we observe misorientation within each subgrain of up to 7° (Figure 7), represented by several identically oriented micrometer-sized blocks. In domains of type B, plastic and then brittle deformations occurred. Probably, the appearance of misorientations of microblocks arose when the microfractures were filled with chlorite. There were no fracturing and filling with chlorite in the domains of type A.

4.4. Formation of the Ballen Quartz Rim

The presence of a quartz, sanidine, and cristobalite mixture with micropegmatitic texture forming the rim around the ballen quartz indicates a metastable crystallization process (Figure 4a and Figure 6b,d). Cristobalite in the rim of ballen quartz has also been documented in impactites from the Ries crater (see References [4,5,6,7]). The presence of non-formula elements in cristobalite in our sample is in accordance with the values obtained for cristobalite in the rim of ballen quartz in impactites from the Ries crater, namely Na2O (0.4–0.7 wt.%) and Al2O3 (1.4–1.7 wt.%) [7]. Trepmann and coauthors [7] suggest that cristobalite crystallized directly from a volatile-rich melt. We assume that cristobalite and sanidine located in the rim were crystallized from the melt. It is possible that some grains of cristobalite in the rim transformed into quartz due to the temperature decrease.

5. Conclusions

Two types of domains (A and B) were distinguished in ballen quartz in an impact melt rock sample from the Jänisjärvi impact structure. According to the BSE data, CL images, CL spectra, and EDS maps, abundances of Al2O3, FeO, and MgO up to 4.56, 6.43, and 2.12 wt.%, correspondingly, are associated with submicron-sized inclusions of chlorite or another Fe-Mg mineral in domains of type B. These inclusions were formed as a result of hydrothermal alteration, which did not affect the domains of type A. The textural differences between the domains of type A and type B are caused by the heterogeneity of the diaplectic glass or lechatelierite from which ballen quartz was formed. Misorientations in subgrains in ballen quartz type B are limited by 7° and comparable in size to the micrometer-sized blocks separated by the grid of microfractures. The new data expand the diversity of the studied ballen quartz and could be used to better understand the mechanisms of their formation.

Author Contributions

Conceptualization, D.A.Z. (Daria A. Zamiatina) and D.A.Z. (Dmitry A. Zamyatin); methodology, G.B.M.; software, G.B.M.; validation, D.A.Z. (Daria A. Zamiatina) and D.A.Z. (Dmitry A. Zamyatin); formal analysis, G.B.M.; investigation, D.A.Z. (Daria A. Zamiatina) and D.A.Z. (Dmitry A. Zamyatin); resources, D.A.Z. (Daria A. Zamiatina) and D.A.Z. (Dmitry A. Zamyatin); data curation, D.A.Z. (Daria A. Zamiatina); writing—original draft preparation, D.A.Z. (Daria A. Zamiatina); writing—review and editing, D.A.Z. (Daria A. Zamiatina) and D.A.Z. (Dmitry A. Zamyatin); visualization, D.A.Z. (Daria A. Zamiatina); supervision, D.A.Z. (Daria A. Zamiatina) and D.A.Z. (Dmitry A. Zamyatin); project administration, D.A.Z. (Dmitry A. Zamyatin); funding acquisition, D.A.Z. (Dmitry A. Zamyatin). All authors have read and agreed to the published version of the manuscript.

Funding

This work was supported by the Russian Science Foundation (project N21-77-10019, https://rscf.ru/project/21-77-10019/). The authors are grateful to government assignment No. AAAA-A19-119071090011-6 for IGG UB RAS supported by the Ministry of Science and Higher Education of the Russian Federation. The study was carried out in IGG UB RAS, using the Geoanalitik shared research facilities. The re-equipment and comprehensive development of the Geoanalitik was supported by the Ministry of Science and Higher Education of the Russian Federation (Agreement No. 075-15-2021-680).

Data Availability Statement

Not applicable.

Acknowledgments

The authors are grateful to three reviewers and editors for their constructive comments that improved this manuscript. The authors are grateful to V.A. Bulatov for the help with EPMA measurements and N.S. Chebikin for the help with the EBSD mapping.

Conflicts of Interest

The authors declare no conflict of interest. The funders had no role in the design of the study; in the collection, analyses, or interpretation of data; in the writing of the manuscript; or in the decision to publish the results.

References

  1. Stöffler, D.; Hamann, C.; Metzler, K. Shock metamorphism of planetary silicate rocks and sediments: Proposal for an updated classification system. Meteorit. Planet. Sci. 2018, 53, 5–49. [Google Scholar] [CrossRef]
  2. Short, N.M. Progressive shock metamorphism of quartzite ejecta from the Sedan nuclear explosion crater. J. Geol. 1970, 78, 705–732. [Google Scholar] [CrossRef] [Green Version]
  3. Rehfeldt-Oskierski, A.; Stöffler, D.; Hornemann, U. Deformation, transformation, and thermal annealing of experimentally shocked single crystal quartz. In Proceedings of the 17th Lunar and Planetary Science Conference, Houston, TX, USA, 17–21 March 1986. [Google Scholar]
  4. Engelhardt, W. Shock produced rock glasses from the Ries crater. Contrib. Mineral. Petrol. 1972, 36, 265–292. [Google Scholar] [CrossRef]
  5. Osinski, G.R. Impact melt rocks from the Ries impact structure, Germany: An origin as impact melt flows? Earth Planet. Sci. Lett. 2004, 226, 529–543. [Google Scholar] [CrossRef]
  6. Ferrière, L.; Koeberl, C.; Reimold, W.U. Characterisation of ballen quartz and cristobalite in impact breccias: New observations and constraints on ballen formation. Eur. J. Mineral. 2009, 21, 203–217. [Google Scholar] [CrossRef] [Green Version]
  7. Trepmann, C.A.; Dellefant, F.; Kaliwoda, M.; Hess, K.U.; Schmahl, W.W.; Hölzl, S. Quartz and cristobalite ballen in impact melt rocks from the Ries impact structure, Germany, formed by dehydration of shock-generated amorphous phases. Meteorit. Planet. Sci. 2020, 55, 2360–2374. [Google Scholar] [CrossRef]
  8. Muller, N.; Hartung, J.B.; Jessberger, E.K.; Reimold, W.U. 40Ar–39Ar ages of Dellen, Jänisjärvi, and Sääksjärvi impact craters. Meteoritics 1990, 25, 1–10. [Google Scholar] [CrossRef]
  9. Bischoff, A.; Stöffler, D. Chemical and structural changes induced by thermal annealing of shocked feldspar inclusions in impact melt rocks from Lappajarvi crater, Finland. J. Geophys. Res. 1984, 89, 645–656. [Google Scholar] [CrossRef]
  10. Stöffler, D.; Artemieva, N.A.; Ivanov, B.A.; Hecht, L.; Kenkmann, T.; Schmitt, R.T.; Tagle, R.A.; Wittmann, A. Origin and emplacement of the impact formations at Chicxulub, Mexico, as revealed by the ICDP deep drilling at Yaxcopoil-1 and by numerical modeling. Meteorit. Planet. Sci. 2004, 39, 1035–1067. [Google Scholar] [CrossRef]
  11. Schmieder, M.; Buchner, E. Is ‘‘ballen quartz’’ diagnostic for shock metamorphism? Geochim. Cosmochim. Acta 2007, 71, 897. [Google Scholar]
  12. Ferrière, L.; Koeberl, C.; Libowitzky, E.; Reimold, W.U.; Greshake, A.; Brandstätter, F. Ballen quartz and cristobalite in impactites: New investigations. Geol. Soc. Am. Spec. Pap. 2010, 465, 609–618. [Google Scholar]
  13. Carstens, H. Thermal history of impact melt rocks in the Fennoscandian shield. Contrib. Mineral. Petrol. 1975, 50, 145–155. [Google Scholar] [CrossRef]
  14. Swanson, S.E.; Naney, M.T.; Westrich, H.R.; Eichelberger, J.C. Crystallization of Obsidian Dome, Inyo Domes, California. Bull. Volcanol. 1989, 51, 161–176. [Google Scholar] [CrossRef]
  15. Horwell, C.J.; Williamson, B.J.; Llewellin, E.W.; Damby, D.E.; Le Blond, J.S. The nature and formation of cristobalite at the Soufriere Hills volcano, Montserrat: Implications for the petrology and stability of silicic lava domes. Bull. Volcanol. 2013, 75, 696. [Google Scholar] [CrossRef] [Green Version]
  16. Marakushev, A.A.; Persikov, E.S.; Bukhtiarov, P.G. Endogenic nature of perlites. In Proceedings of the 2nd International Conference on Natural Glasses, Charles University, Prague, Czech Republic, 21–25 September 1988. [Google Scholar]
  17. Jourdan, F.; Renne, P.R.; Reimold, W.U. High-precision 40Ar/39Ar age of the Jänisjärvi impact structure (Russia). Earth Planet. Sci. Lett. 2008, 265, 438–449. [Google Scholar] [CrossRef]
  18. Masaitis, V.L. Impact structures of the northeast of Eurasia: The territories of Russia and neighboring countries. Meteorit. Planet. Sci. 1999, 34, 691–711. [Google Scholar] [CrossRef]
  19. Sazonova, L.V.; Feldman, V.I.; Shcherbovsky, E.Y. Features of the chemical composition and optical properties of the rock-forming minerals of the tagamites from Jänisjärvi astrobleme. Dokl. Akad. Nauk SSSR 1985, 281, 138–142. (In Russian) [Google Scholar]
  20. Fel’dman, V.I.; Sazonova, L.V.; Kozlov, E.A. Shock metamorphism of some rock-forming minerals: Experimental results and natural observations. J. Petrol. 2006, 14, 540–566. [Google Scholar] [CrossRef]
  21. Marakushev, A.A. (Ed.) Impactites; Moscow State University: Moscow, Russia, 1981; p. 240. [Google Scholar]
  22. Lafuente, B.; Downs, R.T.; Yang, H.; Stone, N. The Power of Databases: The RRUFF Project. In Highlights in Mineralogical Crystallography; De Gruyter, W., Ed.; Walter de Gruyter GmbH & Co KG: Berlin, Germany, 2015; pp. 1–30. [Google Scholar]
  23. Götze, J. Chemistry, textures and physical properties of quartz—Geological interpretation and technical application. Mineral. Mag. 2009, 73, 645–671. [Google Scholar] [CrossRef]
  24. Götze, J.; Plötze, M. Investigation of trace-element distribution in detrital quartz by Electron Paramagnetic Resonance (EPR). Eur. J. Mineral. 1997, 9, 529–537. [Google Scholar] [CrossRef] [Green Version]
  25. Gucsik, A. (Ed.) Cathodoluminescence and its Application in the Planetary Sciences; Springer: Berlin/Heidelberg, Germany, 2009; p. 160. [Google Scholar]
  26. Götze, J.; Plötze, M.; Habermann, D. Origin, spectral characteristics and practical applications of the cathodoluminescence (CL) of quartz—A review. Mineral. Petrol. 2001, 71, 225–250. [Google Scholar] [CrossRef]
  27. Kalceff, M.A.S.; Phillips, M.R. Cathodoluminescence microcharacterization of the defect structure of quartz. Phys. Rev. 1995, 52, 3122–3134. [Google Scholar] [CrossRef]
  28. Naumov, M.V. Principal features of impact-generated hydrothermal circulation systems: Mineralogical and geochemical evidence. Geofluids 2005, 5, 165–184. [Google Scholar] [CrossRef]
  29. Osinski, G.R. Hydrothermal activity associated with the Ries impact event, Germany. Geofluids 2005, 5, 202–220. [Google Scholar] [CrossRef]
Figure 1. The geographical location (a). Schematic geological map (b) of the Jänisjärvi structure and sample Jl-01 (c). Crater position is marked with red cycle; sampling locations Jl and Jh are marked with red asterisks. 1—Pälkjärvi formation; 2–5—Naatselkä formation (2—undivided, 3—lower, 4—middle, and 5—upper); 6—Early/Middle Proterozoic rocks; 7—gabbrodiabase; 8—impactites; 9—faults. Modified after Reference [21].
Minerals 12 00886 g001
Figure 2. Images of the Jänisjärvi impact melt rock of ballen quartz: microphotographs under plane-polarized light (a) and cross-polarized light (b); BSE image (white square shows an area where EDS element distribution mapping was performed, black rectangle (1,2) mark areas where Raman mapping (Figure 6) was performed), A—domains of type A (c); CL image (d); EDS element distribution maps (Si Kα, Fe Kα, Al Kα, Mg Kα, and K Kα X-ray lines) (ei). Crs, cristobalite; cl, chlorite; qtz, quartz; sa, sanidine.
Minerals 12 00886 g002
Figure 3. BSE images of ballen quartz obtained in thin section of sample (Jl-05) of impact melt rock from the Jänisjärvi impact structure. Black rectangles in (a) and (b) show positions of panels (c) and (d), respectively.
Minerals 12 00886 g003
Figure 4. BSE images of a typical internal region of ballen quartz (same area as in Figure 2): image with EPMA analytical points, the results of which are shown in Table 1, the numbers in the figure correspond to the numbers in the table (a); black rectangle outlines the position of area shown in (b); red rectangle shows area where EBSD mapping (Figure 7) was performed; enlarged fragment with domain A and domain B (b); black rectangles represent enlarged areas shown in (c) and (d), respectively.
Minerals 12 00886 g004
Figure 5. CL spectra of ballen quartz: (a) domains of type A and (b) domains of type B.
Minerals 12 00886 g005
Figure 6. (a) BSE image of ballen bulk; (b) BSE image of ballen rim; white boxes show Raman spectrum measurement area; (c,d) maps of phase distribution based on Raman band intensities (red, quartz Raman band 464 cm–1; blue, sanidine band 514 cm–1; green, cristobalite band 415 cm–1), white circle, rectangle, and square show Raman spectrum measurement area; (e,f) Raman spectra; qtz, quartz; sa, sanidine; crs, cristobalite.
Minerals 12 00886 g006
Figure 7. EBSD data characterizing an aggregate of ballen quartz. (a) EBSD orientation inverse pole figure map showing differently oriented subgrains in domains. Curved lines show boundaries of domains of type A (red) and type B (white). (b) Equal-area upper hemisphere projection pole figures for quartz, color-coded as in (a). (c) Relative misorientation EBSD map created for each subgrain in domains of type A (red dotted outline) and B (white dotted outline); user-selected reference points of misorientation maps are placed inside each subgrain (red star), and the rectangle marks the position of an enlarged area presented in (d). (d) Enlarged area of misorientation map (c) and BSE image showing micrometer-sized block structure.
Minerals 12 00886 g007
Publisher’s Note: MDPI stays neutral with regard to jurisdictional claims in published maps and institutional affiliations.

