
A Quantitative Relationship between Oxidation Index and Chalcopyrite Flotation Recovery
by
 ,
,
Xu Yang
1,2, 
Yubiao Li
1,2,*,
Wen Chen
2,3,*,
Wanqing Duan
1,2,
Qing Xiao
2 and
Tingting Jiang
1,2 1
Hubei Key Laboratory of Mineral Resources Processing & Environment, Wuhan University of Technology, Wuhan 430070, China
2
School of Resources and Environmental Engineering, Wuhan University of Technology, Wuhan 430070, China
3
Changsha Research Institute of Mining and Metallurgy Co., Ltd., Changsha 410012, China
*
Authors to whom correspondence should be addressed.
Minerals 2022, 12(7), 888; https://0-doi-org.brum.beds.ac.uk/10.3390/min12070888
Submission received: 19 June 2022
/
Revised: 8 July 2022
/
Accepted: 11 July 2022
/
Published: 15 July 2022
(This article belongs to the Special Issue Seawater Flotation)
Abstract
:The surface oxidation of chalcopyrite is one of the most important factors affecting its flotation performance. In this study, a critical oxidation degree is proposed to define “slight” and “significant” oxidation in terms of surface species and chalcopyrite flotation recovery. Slight oxidation enhanced chalcopyrite hydrophobicity, but significant oxidation reduced its recovery apparently. Microthermokinetic measurements indicated that the apparent activation energy (Ea) of chalcopyrite oxidation was reduced from around 173 kJ·mol−1 to 163 kJ·mol−1 when the reaction changed from slight oxidation to significant oxidation when applying H2O2. The surface oxidation degree was defined as the ratio of hydrophilic species to hydrophobic species. The highest recovery (94.8%) and contact angle (93°) were achieved at a concentration of 0.1 vol.% H2O2, with the lowest oxidation degree of 0.388 being observed. The oxidation degree was correlated to the flotation recovery, with a quantitative relationship (y = −298.81x + 213.05, y and x represent flotation recovery and oxidation degree, respectively, 0.388 ≤ x ≤ 0.618) being established, thereby giving a guideline to better manage chalcopyrite flotation by controlling its surface oxidation and SBX adsorption on chalcopyrite surfaces.
1. Introduction
Chalcopyrite, as the most abundant and widespread copper-bearing mineral (accounting for nearly 70% of the Earth’s copper), is a primary source of copper [1,2,3]. Froth flotation is the most often used method to obtain chalcopyrite from natural ores due to its natural floatability stemming from different surface properties [4,5]. However, surface oxidation due to exposure to air or solution during the flotation process may alter the surface wettability of chalcopyrite, thereby influencing the adsorption of collectors and the subsequent separation from gangue minerals [6]. It is generally believed that significantly oxidized chalcopyrite has a low flotation recovery due to the formation of hydrophilic metal hydroxides [5,6,7]. Barzyk et al. [8] reported that the floatability of chalcocite was reduced with increasing surface oxidation. In contrast, appropriate oxidation might enhance the flotation recovery of sulfide minerals. For instance, Suyantara et al. [9] suggested that H2O2 promoted the adsorption of PAX onto chalcopyrite surface at a low concentration of H2O2 (0.1 mM). In addition, the surface oxidation of chalcopyrite is significantly increased in pulp containing various ions, especially in seawater. For instance, Yang et al. [10] reported that the recovery (58%) of chalcopyrite oxidized with 0.1 vol.% H2O2 in seawater was 37% lower than that (95%) in pure water due to the greater oxidation of chalcopyrite in seawater. Based on these findings, many researchers [7,11,12] have attempted to enhance the separation selectivity of chalcopyrite via applying surface oxidation treatments, such as plasma and the addition of oxidants.
Therefore, the investigation on the effect of oxidized species on the chalcopyrite surface is essential to better understand its flotation mechanisms. For instance, the dissolution of copper and iron ions from the chalcopyrite surface may produce a sulfur-rich surface [6]. However, these ions may hydrolyze to form hydroxide species (Equations (1) and (2)) which are pH-dependent, e.g., pH 7–10 and 3–7.5, for the formation of positively charged cupric and ferric hydroxide species that tend to adsorb onto negatively charged sulfur sites (-S−), resulting in a hydrophilic chalcopyrite surface (Equations (3) and (4)). The -S− stands for S atoms with broken bonds on the chalcopyrite surface. The dissolution of Fe and Cu may result in the formation of and in the solution. The formation of -S−-Fe(OH)n(3−n)+ and -S−-Cu(OH)n(2−n)+ stands for the bonding between the iron and copper hydroxides and S atoms on the chalcopyrite surface.
Previous studies show that the effect of surface oxidation on chalcopyrite floatability is critical, i.e., slight oxidation can enhance chalcopyrite hydrophobicity due to the dissolution of metals into the solution to form hydrophobic species, such as elemental sulfur and polysulfides [5,13]. In contrast, the formation and adsorption of metal hydroxide precipitates may produce a hydrophilic surface [6]. Buckley et al. [14] proposed that iron atoms migrate to the surface to form an iron hydroxide overlayer when chalcopyrite is exposed to air. Mielczarski et al. [15] and Chander [16] reported the dissolution of copper and iron ions from chalcopyrite surfaces, leaving a metal-deficient, sulfur-rich surface in alkaline solution at pH 10.
Moimane et al. [5] quantified the degree of surface oxidation as the ratio of hydrophilic species to hydrophobic species, providing a critical degree of oxidation. Fairthorne et al. [6] proposed the concept of “mild oxidation” and “significant oxidation”; however, little attention has been paid to the relationship between oxidation degree and chalcopyrite flotation recovery. In addition, no quantitative relationship has been established for “mild oxidation” and “significant oxidation”.
The purpose of this study is to define slight oxidation and significant oxidation in the presence of hydrogen peroxide (H2O2) and find the critical point between the two statuses for chalcopyrite flotation. Moreover, the quantitative relationship between the oxidation degree of chalcopyrite recovery is established, revealing a mathematical model to predict the flotation recovery based on surface oxidation.
2. Materials and Methods
2.1. Materials and Reagents
The chalcopyrite crystal sample was supplied from GEO discoveries, Australia. The macroscopic impurity mineral particles were removed manually after crushing to obtain a high-purity chalcopyrite sample, with 34.3% Cu, 30.4% Fe, and 33.2% S, and an impurity of 2.1%. The X-ray diffraction (XRD) spectra [17] further indicated a high purity of this chalcopyrite sample. This sample was prepared via crushing, grounding and wet sieving to obtain particles in a size range of 75–150 μm for flotation tests. Ultrasonic operation was carried out in order to remove the fine particles in the ethanol solution. In order to reduce sample oxidation, chalcopyrite particles were dried in a vacuum oven and stored in a freezer.
Butyl sodium xanthate was used as a collector in this study. pH was adjusted using sodium hydroxide in all the tests. The oxidizing agent hydrogen peroxide (H2O2) (30 v/v %, AR grade) was used as the oxidizer. Analytical-grade reagents including NaOH, HCl and H2O2 were purchased from China Sinopharm Chemical Reagent Co., Ltd., Shanghai, China. Ultrapure water with a resistivity of 18.2 MΩ·cm, prepared using Millipore®® ultrapure water (Billerica, MA, USA), was used in all the experiments.
2.2. Methods
2.2.1. H2O2 Treatment
The chalcopyrite powder sample was added to the ultrapure water solution (25 mL) at pH 8. Afterwards, the H2O2 was added as an oxidant into the slurry under constant stirring at 1200 rpm. The concentration of H2O2 in the suspension varied from 0.05% to 2.0% (v/v). Subsequent to the addition of H2O2, the pH of the slurry was controlled at pH 8 for 20 min by adding NaOH. The suspension was then filtered and freeze-dried to prevent further oxidation, prior to the flotation experiments and further analyses.
2.2.2. Flotation Experiments
Flotation experiments were performed in a mechanical agitation flotation machine (XFG II-type, Wuhan Exploration Machinery Factory, Wuhan, China) with a 40 mL flotation cell at an impeller speed of 1200 rev/min. An amount of 1 g of the untreated or oxidized chalcopyrite sample was transferred into a 25 mL flotation solution. The collector of sodium butyl xanthate (SBX) was added and conditioned for 4 min prior to the pH adjustment to pH 8 using 0.1 M NaOH for 6 min. It is worth noting that pH 8 was selected in this study to avoid the formation of precipitation (e.g., Mg(OH)2, Ca(OH)2) under a high-alkali environment (pH > 10) in the presence of the inevitable ions Ca2+ and Mg2+ in the solution. Flotation was operated at an air flow rate of 0.1 L/min to collect the floatable chalcopyrite in the froth within the related flotation time (i.e., 1, 3, 5, 7 and 10 min), with the cumulatively collected froth products being filtrated, dried and weighted to calculate chalcopyrite recovery. Each flotation test was carried out at least three times, and the average value was presented as the final recovery with the standard deviation being used as an error bar.
2.2.3. Contact Angle Measurements
The contact angle measurements were conducted to estimate the hydrophobicity after the oxidation treatment using H2O2. The chalcopyrite sample was cut as a flat surface, which was further polished by following the procedures described in Li et al. [18]. The polished surface was then treated with H2O2 and SBX for 6 min and 4 min, respectively. A contact angle measuring instrument (JC2000C1, Shanghai Zhongchen Digital Technology Company, Shanghai, China) was applied for the determination of the contact angle which was repeated twice and carried out by following the procedures described in previous work [19].
2.2.4. X-ray Photoelectron Spectroscopy (XPS)
X-ray Photoelectron Spectroscopy (XPS) measurements were conducted using the Thermo Fisher ESCALAB 250Xi spectrometer (Waltham, MA, USA). Untreated and H2O2-treated chalcopyrite samples with a size range of 75–150 μm were used for XPS tests. The concentrations of H2O2 were 0.06, 0.1, 0.14 and 1 vol.% (v/v). The XPS survey spectra were collected with a pass energy of 100 eV and a step size of 1.0 eV from 1350 to 0 eV [10] while the high-resolution XPS spectra were collected with a dwell time of 0.1 s and 5 sweeps, with a step size of 0.1 eV and a pass energy of 30 eV [17]. The Avantage 5.9 software was used for data analysis. The charge compensation for all spectra was calibrated based on the C 1s binding energy at 284.8 eV.
2.2.5. Microcalorimetric Measurements
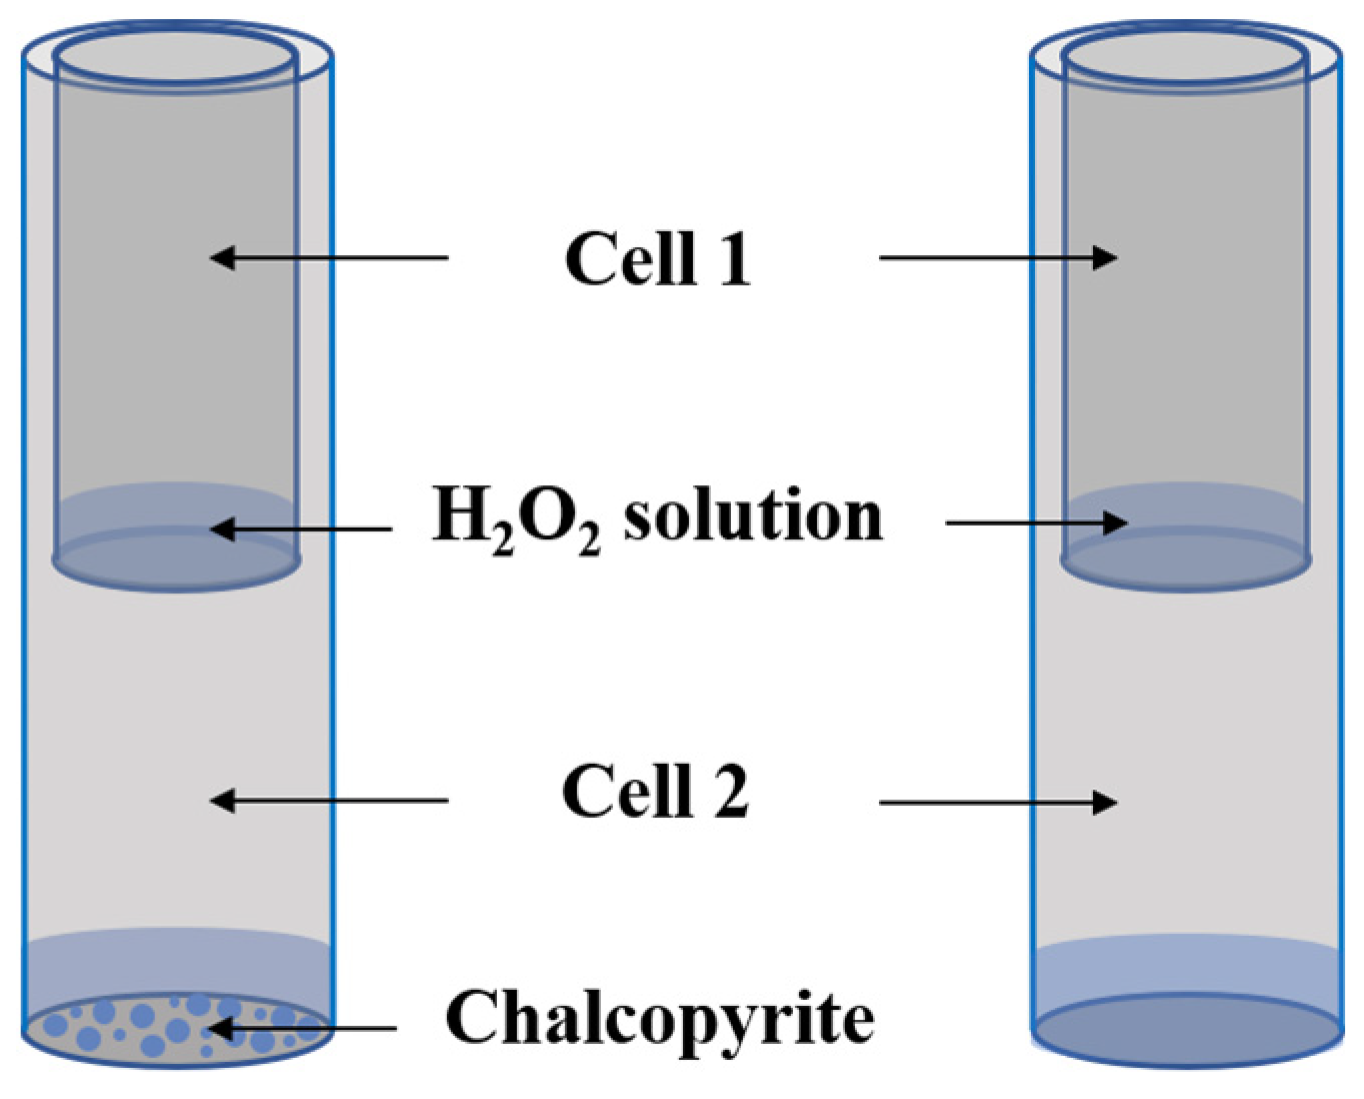
The microcalorimetric measurements were accomplished with a RD496–2000-type microcalorimeter (Mianyang CP Thermal Analysis Instrument Co, Ltd., Mianyang, China). H2O2 solution and pure water were adjusted to pH 8 using NaOH. Then, 1 mL H2O2 solution and 0.1 g chalcopyrite sample together with 1 mL pure water were injected into a sample cell 1 (3 mL) and sample cell 2 (6 mL), respectively (Figure 1). Once the sample cells reached an isothermal condition at a stable baseline, cell 1 was pierced and H2O2 solution was flowed into cell 2. The thermal effect was then automatically recorded.
3. Results and Discussion
3.1. Flotation Results
Figure 2 shows the flotation recoveries of untreated and H2O2-treated chalcopyrite. Untreated chalcopyrite displayed a good flotation performance with a recovery of 93.1%, which was increased to 94.8% in the presence of 0.1% H2O2. However, the recovery decreased dramatically with increasing H2O2 concentration, achieving a recovery of about 7.93% at 2 v/v % H2O2.
As shown in Figure 2, the optimum oxidation degree to promote chalcopyrite flotation was achieved at 0.1% H2O2, indicating slightly positive influence on chalcopyrite flotation due to the formed hydrophobic species (S22−, Sn2−, S0) and increased surface hydrophobicity at this H2O2 concentration [6]. However, hydrophilic oxidation products (SO32−, SO42−, Fe–O/OH) increased at a greater H2O2 concentration, thereby decreasing flotation recovery. Suyantara et al. [9] reported a decreased chalcopyrite flotation recovery in the presence of a low concentration of H2O2 due to the increased fraction of hydrophilic oxidation species coatings on chalcopyrite surfaces [5]. In addition, these hydrophilic species hindered the adsorption of the collector. Previous studies have applied oxidizing strategies to enhance the recovery and separation of chalcopyrite [7,12].
3.2. Contact Angle Results
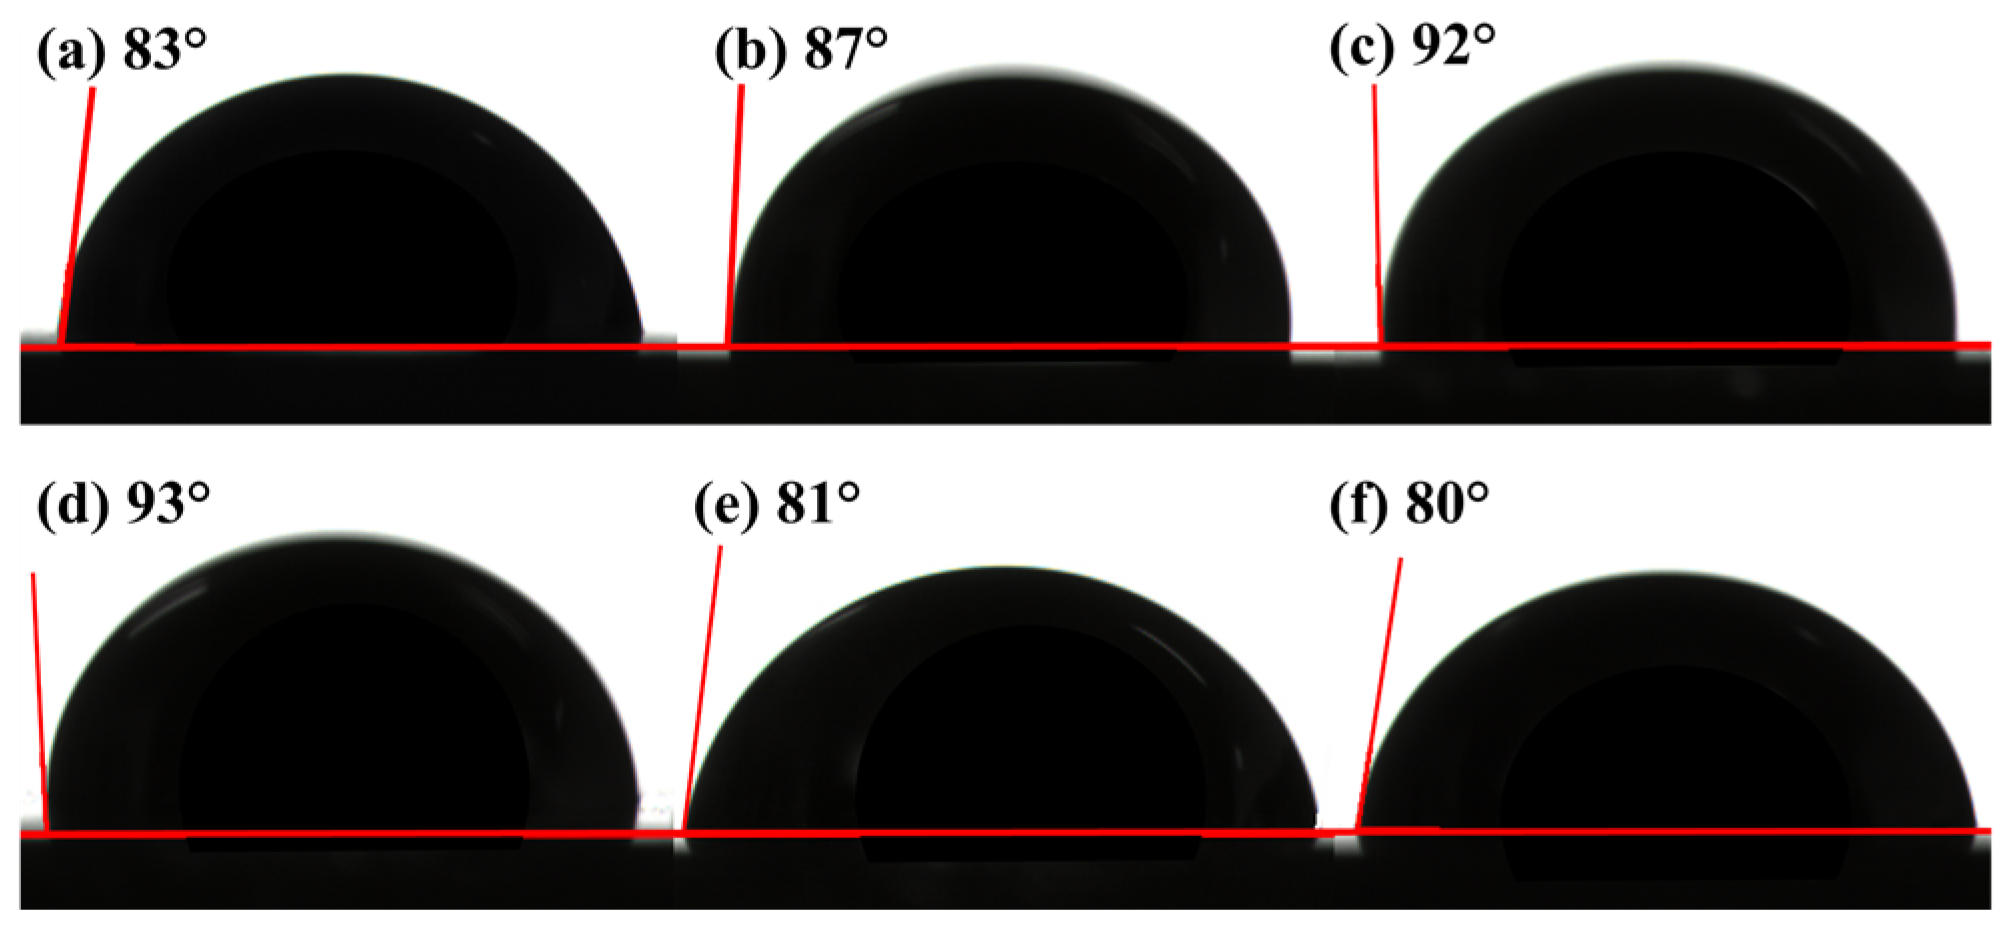
Figure 3 shows the effect of various concentrations of H2O2 on the contact angles of chalcopyrite. The contact angle increased with increasing H2O2 concentration when lower than 0.1%, achieving the highest contact angle of 93° at 0.1 vol.%. However, the contact angle was reduced obviously with a further increment of H2O2 concentration, e.g., a contact angle of 80° at a H2O2 concentration of 0.14%. The evolution of the contact angle was due to the change in hydrophobic/hydrophilic substances on its surface. Therefore, the relationship between the degree of oxidation and the hydrophobicity of the chalcopyrite surface needs to be quantified at different oxidation conditions.
3.3. XPS Results
Table 1 shows the XPS spectra collected for the chalcopyrite sample treated with H2O2 at a concentration of 0, 0.06, 0.1, 0.14 and 1 vol.% (v/v) at pH 8 in the absence of xanthate. The atomic percent of O on the chalcopyrite surface increased appreciably with the increased H2O2 concentration due to increased oxidation products. According to Table 1, the atomic concentrations of O 1s increased from 32.61% to 40.73% at 0.06% H2O2. With increased H2O2 concentration to 0.1, 0.14 and 1%, O 1s content increased to 42.21, 48.53 and 54.89%, respectively.
Figure 4a shows the high-resolution S 2p spectra collected from chalcopyrite treated without and with H2O2 at a concentration of 0.06, 0.1, 0.14 and 1 vol.% (v/v) at pH 8 in the absence of xanthate. The binding energy (BE) at 161.4 eV is attributed to S2− species [20,21] while the S 2p3/2 peaks located at 162.2 and 163.2–163.7 eV match the S22− and Sn2−/S0 species, respectively [3,14,22]. The peaks at 166.3 and 168.8 eV belong to the species of SO32− and SO42− [14,23], which increased as the oxidation process proceeded. The BE at 165.1 eV is assigned to an energy loss feature (S 3p → Fe 3d) [24,25].
Figure 4b shows four O species on chalcopyrite surfaces, e.g., oxide (O2−, 530.2eV), hydroxide/sulfate (OH-/SO42−, 531.3 eV), chemisorbed H2O (532.1 eV), and physiosorbed H2O (533.4 eV) [22,25,26,27]. For untreated chalcopyrite, the Fe 2p3/2 spectrum was deconvoluted into three peaks, i.e., the peak at 707.8 eV was assigned to iron in chalcopyrite and the 710.8 eV peak was due to iron oxides, while the peak at 713.8 eV was related to iron sulfides [7,22,25,28,29,30]. The peaks located at 717.6 eV, 721.3 eV, and 725.0 eV could be assigned to the Fe 2p1/2 peaks of CuFeS2, iron oxides and iron sulfides [28]. Figure 4d shows a Cu 2p3/2 spectrum consisting of a strong single peak at 932.3–932.5 eV (e.g., Figure 4d), with no distinct shakeup satellite contribution, typically present at 7–10 eV above the main peak, suggesting that the oxidation state of copper in chalcopyrite remained at +1 during the oxidation process.
3.4. Microcalorimetry Results
Figure 5 shows the evolved thermoelectric potential (E) over time when H2O2 reacts with chalcopyrite at 30, 35 and 40 °C. The height of the curve represents the instantaneous thermoelectric potential generated due to the chemical reaction, with the area enclosed by the curve and the horizontal axis being the heat released. Therefore, a larger and stronger intensity indicates increased heat released due to the reaction.
When chalcopyrite was treated with 0.14 vol.% H2O2, peak intensity increased significantly and shifted to the left at 30 °C (Figure 5a), indicating that a higher concentration of H2O2 facilitated the oxidation between chalcopyrite and H2O2, i.e., an easier oxidation may occur on the chalcopyrite surface. In addition, the oxidation reaction time was significantly shortened as the temperature rose, i.e., from about 80,000 s at 30 °C to less than 20,000 s at 40 °C, indicating that a higher temperature increased oxidation rate. Moreover, the maximum thermoelectric potential increased with the increment of temperature, suggesting a more violent reaction at a higher temperature.
4. Discussion
4.1. Roles of “Slight Oxidation” and “Significant Oxidation”
Chalcopyrite was naturally hydrophobic [6,31,32,33] due to the “slight oxidation” that generated hydrophobic species [12]. Gardner et al. [31] concluded that the anodic oxidation of the chalcopyrite surfaces was responsible for hydrophobicity from an electrochemical point of view. Hayes et al. [32] pointed out that the natural floatability of sulfide minerals was related to their ease of oxidation and the stability of hydrophobic species produced by oxidation. Kelebek et al. [33] ascribed the natural floatability of sulfide minerals to the amount of surface sulfur species. To date, there still remains debate on the properties of the oxidation products of sulfide minerals, e.g., sulfur-rich surfaces, metal-deficient sulfide lattices, and metal sulfide polysulfides [14,34,35]. In order to better understand the changes in the chemical composition of chalcopyrite surfaces during oxidation, the elemental quantification of chalcopyrite surface species normalized to Cu, Fe and S was conducted based on the XPS results, as shown in Table 2.
After treating chalcopyrite surface using 0.06, 0.1, and 0.14 vol.% H2O2, the atomic concentration of Fe in chalcopyrite was reduced by 1.97%, 0.51% and 0.02%, respectively, indicating the dissolution of iron from the chalcopyrite lattice (Equation (5)). As shown in Table 2, the Fe–O/OH content of chalcopyrite surface increased by 0.74%, 0.24% and 0.09% after 0.06 vol.%, 0.1 vol.% and 0.14% vol.% H2O2 treatment, respectively, probably due to the hydrolyzation of dissolved iron into ferric hydroxide species, as shown in Equation (6) [6]. The increased Fe–O/OH content during low-concentration H2O2 oxidation treatment was probably due to the electrostatic adsorption of positively charged iron hydroxide on the negatively charged chalcopyrite surface, as shown in Equation (3).
With the further increase in H2O2 to 1%, the atomic concentration of Fe in chalcopyrite was reduced but the Fe–O/OH content increased, indicating the dissolution of iron from the surface and the adsorption of iron hydroxide. It is worth noting that, compared with the untreated chalcopyrite, 0.1 vol.% H2O2 increased the Fe–O/OH content on the chalcopyrite surface by 0.98%. However, 1 vol.% H2O2 only increased the Fe–O/OH content by 0.77%, indicating that a smaller amount of Fe–O/OH formed due to significant oxidation.
As no peaks around 942.2 eV attributing to Cu(II) shake-up satellites were observed for chalcopyrite treated under all H2O2 concentrations applied, the surface copper was mainly in a cuprous state with the most intense band at around 932.3 eV attributed to Cu(I) in the sulfide lattice.
Compared to the unoxidized sample, S2− decreased from 34.17% to 21.13%, but S22− increased from 4.30% to 15.11% after 0.1 vol% H2O2 treatment. The Sn2−/S0 content (14.81% and 14.85%) of the chalcopyrite surface treated by 0.06 and 0.1 vol.% H2O2 was slightly higher than that without H2O2 treatment (14.05%), indicating that the hydrophobic entity on the chalcopyrite surface was S22− and Sn2−/S0, under slight oxidation conditions, as shown in Equations (7)–(9) [6,34].
Due to 0.14 vol.% H2O2 treatment, the S2−, S22− and Sn2−/S0 on the chalcopyrite surface decreased by 0.6%, 1.76% and 2.96%, respectively, compared with 0.1 vol.% H2O2 treatment. In addition, the atomic concentration of SO42− on the chalcopyrite surface treated with H2O2 was gradually increased at an increased H2O2 concentration. However, the content of SO32− remained basically unchanged. Therefore, changes in S species content were more significant than changes in Fe and Cu, illustrating that with the increase in oxidation degree, the most important reaction process is the oxidation of the low S oxidation state (S2−, S22− and Sn2−/S0) to SO42−.
The activation energy (Ea) of complex reactions can only be measured experimentally and is called the apparent activation energy. Based on the microcalorimetry curves shown in Figure 5, the Ea and other thermokinetic parameters of oxidation reaction can be obtained from Equations (10)–(12) [36,37]:
where t is the reaction time; H0 is the total heat of reaction; Hi is the reaction heat at time t; dHi/dt is the rate of heat production at time t (its value can be obtained by dHi/dt = E/S; E is the thermoelectric potential and S is the sensitivity of the calorimeter); k is the rate constant; n is the reaction order; A is the pre-exponent; Ea is the apparent activation energy; R is the gas constant; T is the absolute temperature in Kelvin; N is the Avogadro constant; h is the Planck constant; Δ is the activation enthalpy; and Δ is the activation entropy; kB is the Boltzmann constant.
When the values of ln() are plotted as a function of ln() values, the intercept and slope are present in k and n, respectively. The least squares regression to Equation (11) was applied based on the rate coefficient k at different temperatures, the apparent activation energy Ea (slope) and the pre-exponent A (intercept) of the reaction. Table 3 shows the thermokinetic parameters for the reaction between chalcopyrite and H2O2.
The Q decreased as temperature increased, indicating an exothermic reaction. The reaction rate constant k increased with the increased H2O2 concentration and temperature. According to the transition state theory [38,39,40], a higher temperature and H2O2 concentration leads to more activated molecules per unit volume, more effective collisions between molecules, and faster chemical reaction rates. As the reaction order was approximately 1 with R2 being over 0.98, the oxidation reaction followed the first order.
According to Table 3, the Ea at 0.06 and 0.1 vol.% H2O2 were very close, i.e., 172.07 and 173.27 kJ/mol, respectively. When the concentration of H2O2 was 0.14 vol.%, Ea decreased to 162.87 kJ/mol. In addition, Δ and Δ also changed significantly when the H2O2 concentration increased to 0.14 vol.%. Referring to the theoretical calculations and the experimental results in previous studies, Ea is independent of reactant concentration, but is influenced by the change in reactants and the products of the oxidation reaction [39,41,42,43,44]. It is therefore reasonable to infer according to the changes in Ea that when the H2O2 concentration is further increased to 0.14 vol.%, easier oxidation between chalcopyrite and H2O2 can occur.
Therefore, when the H2O2 concentration is lower than 0.1 vol.%, the slight oxidation mechanism dominates with the main reaction process being the oxidation and dissolution of Fe, forming F–O/OH and Fe-SO species on the chalcopyrite surface. In addition, the surface S is readily oxidized to form S22− and Sn2−/S0. However, when H2O2 concentration is greater than 0.14 vol.%, the significant oxidation mechanism dominates with the main reaction process being the oxidation of surface S to form SO42−. It should be noted that within the scope of the oxidation degree covered herein, Cu remains univalent and non-oxidized. The schematic diagram of the mechanisms of the oxidation process is shown in Figure 6.
4.2. The Critical Degree of “Slight Oxidation” and “Significant Oxidation”
The degree of surface oxidation of chalcopyrite was further calculated using the atomic concentrations of surface species. In the collectorless system, the exact nature of the hydrophobic entity was determined as a sulfur-rich surface (metal-deficient sulfide lattice or metal polysulfide) produced by the dissolution of iron or copper from the surface [14,34,35]. In collector-based systems, metal xanthate is essential to sustain the hydrophobic properties of the chalcopyrite surface [45]. Xanthate adsorption occurs at unoxidized metal ionic (Fe/Cu in CuFeS2) sites [45]. In contrast, the oxides and hydroxides formed on the surface of chalcopyrite are hydrophilic compounds unfavorable to flotation. It is therefore essential to determine the proper oxidation degree for chalcopyrite flotation.
As shown in Table 3, the hydrophilic species of Fe–O/OH/SO, SO32− and SO42−, and the hydrophobic species of Fe/Cu in CuFeS2 and S22− and Sn2−/S0 were identified. The oxidation index can be defined as the ratio between the hydrophilic species to the hydrophobic species. Figure 7 shows the oxidation index of chalcopyrite surface as a function of H2O2 concentration. The oxidation index of the unoxidized chalcopyrite treatment was 0.407, which decreased as the concentration of H2O2 increased within 0.1 v/v %, achieving the lowest oxidation index of 0.388 at 0.1 v/v %. However, the oxidation index increased with a further increase in H2O2 concentration, e.g., 0.451 and 0.618 at 0.14 v/v % and 1 v/v %, respectively.
As defined, the higher the oxidation index, the higher the content of hydrophilic substances. The oxidation index, therefore, establishes a quantitative relationship between the elements and the components on the chalcopyrite surface and hydrophilicity, or even flotation recovery. As the relative content of hydrophilic substances on chalcopyrite surface reduced and then increased with the increase in H2O2 concentration, an optimal oxidation index can be defined to obtain the highest flotation recovery, e.g., 0.388 at 0.1 v/v % H2O2.
A good linear fitting was found between flotation recovery and oxidation index, as shown in Figure 8, i.e., a fitted curve of y = −298.81x + 213.05 (y and x represent the recovery and oxidation index, respectively, 0.388 ≤ x ≤ 0.618), with an R2 of 0.9972. According to the curve, it can be estimated that when the theoretical recovery was 100%, the corresponding oxidation index was 0.378. Therefore, the oxidation index corresponding to the optimal oxidation point should be ranging from 0.378 to 388. It should also be noted that chalcopyrite flotation recovery is positively related to the adsorption density of SBX on the chalcopyrite surface. In other words, the highest chalcopyrite flotation recovery (the optimal oxidation points ranging from 0.378 to 0.388) can be regarded as the highest SBX adsorption on chalcopyrite surface, although the actual adsorption density is not measured herein. However, further oxidation on chalcopyrite due to higher H2O2 concentration is negative to the adsorption of SBX on chalcopyrite, thereby decreasing chalcopyrite flotation.
4.3. Verification of the Quantitative Equation
In order to verify the applicability of this equation, the fitted curve of y = −298.81x + 213.05 shown in Figure 8 was applied to the published studies [12,19,46,47], showing a good prediction of this method (Table 4). For instance, Suyantara et al. [12] investigated the effects of a Fenton-like reagent on the surface hydrophobicity and floatability of chalcopyrite, observing hydrophobic S0, S8 and hydrophilic FeOOH, CuO/Cu(OH)2, and Fe2(SO4)3 on the untreated chalcopyrite surface. An oxidation index of 0.511 was calculated based on the data shown in that paper. In addition, a theoretical recovery of 60.66% was predicted using our model proposed in Section 4.2, which was very close to the experimental recovery of 62.65% reported in Suyantara et al. [12]. Moreover, an oxidation index of 0.444 was calculated based on the data shown in Moimane et al. [5] where the floatability of oxidized chalcopyrite was investigated. A chalcopyrite recovery of 80.38% was predicted which was close to the experimental recovery of 89.3%. Suyantara et al. [47] enhanced chalcopyrite oxidation using ferrous sulfate (FeSO4) in the presence of H2O2 via the Fenton-like reaction. The oxidation index was calculated as 0.528 with a theoretical recovery of 55.28%, which is very close to the recovery shown in that paper (i.e., 57%). According to our published paper [19], the oxidation index and recovery of the untreated chalcopyrite were 0.411 and 88%, respectively. The theoretical recovery calculated by the fitting equation was 90.23%. Therefore, the comparisons between the published papers verify the good applicability of our model presented herein, thereby showing an important practical significance.
5. Conclusions
A quantitative relationship between chalcopyrite flotation and surface oxidation index involving the ratio of hydrophilic to hydrophobic surface species has been established in this study. The Ea of slight oxidation was greater than that of significant oxidation, indicating different reactants and products due to different H2O2 concentrations. Slight oxidation produced hydrophobic S22− and Sn2−/S0 and large amounts of F–O/OH/SO, while significant oxidation produced hydrophilic SO42− and small amounts of F–O/OH/SO.
The degree of surface oxidation was quantified as the ratio of hydrophilic species to hydrophobic species for the first time, with the lowest oxidation index of 0.388 being observed at 0.1 vol.% H2O2. A quantitative relationship between oxidation index and chalcopyrite flotation recovery was established, i.e., y = − 298.81x + 213.05, where y and x represent the recovery and oxidation indexes, respectively (0.388 ≤ x ≤ 0.618). In addition, the optimal oxidation index of chalcopyrite was identified as between 0.378 and 0.388, which was related to the highest adsorption density of SBX on the chalcopyrite surface. Therefore, this study provides a novel way to predict the optimal chalcopyrite flotation recovery via oxidation treatments using H2O2.
Author Contributions
Conceptualization, Y.L.; methodology, X.Y.; validation, Q.X.; formal analysis, W.D.; investigation, X.Y.; data curation, X.Y. and W.D.; writing—original draft preparation, X.Y.; writing—review and editing, Y.L. and W.C.; visualization, T.J.; supervision, Y.L.; project administration, Y.L.; funding acquisition, Y.L. All authors have read and agreed to the published version of the manuscript.
Funding
This research was funded by [the National Natural Science Foundation of China] grant number [51974215, 51774223].
Acknowledgments
The authors acknowledge financial supports from the National Natural Science Foundation of China under the projects of 51974215, 51774223, and Hubei Key Laboratory of Mineral Resources Processing & Envi-ronment (ZHJJ202001). The State Key Laboratory of Complex Nonferrous Metal Resources Clean Utiliza-tion, Kunming University of Science and Technology (CNMRCUKF2103).
Conflicts of Interest
The authors declare no conflict of interest.
References
- Habashi, F. Chalcopyrite. In Its Chemistry and Metallurgy; McGraw-Hill: New York, NY, USA, 1978. [Google Scholar]
- Córdoba, E.M.; Muñoz, J.A.; Blázquez, M.L.; González, F.; Ballester, A. Leaching of chalcopyrite with ferric ion. Part I: General aspects. Hydrometallurgy 2008, 93, 81–87. [Google Scholar] [CrossRef]
- Li, Y.; Kawashima, N.; Li, J.; Chandra, A.P.; Gerson, A.R. A review of the structure, and fundamental mechanisms and kinetics of the leaching of chalcopyrite. Adv. Colloid Interface Sci. 2013, 197–198, 1–32. [Google Scholar] [CrossRef] [PubMed]
- Hirajima, T.; Suyantara, G.P.W.; Ichikawa, O.; Elmahdy, A.M.; Miki, H.; Sasaki, K. Effect of Mg2+ and Ca2+ as divalent seawater cations on the floatability of molybdenite and chalcopyrite. Miner. Eng. 2016, 96–97, 83–93. [Google Scholar] [CrossRef]
- Moimane, T.; Plackowski, C.; Peng, Y. The critical degree of mineral surface oxidation in copper sulphide flotation. Miner. Eng. 2020, 145, 106075. [Google Scholar] [CrossRef]
- Fairthorne, G.; Fornasiero, D.; Ralston, J. Effect of oxidation on the collectorless flotation of chalcopyrite. Int. J. Miner. Process. 1997, 49, 31–48. [Google Scholar] [CrossRef]
- Hirajima, T.; Miki, H.; Suyantara, G.P.W.; Matsuoka, H.; Elmahdy, A.M.; Sasaki, K.; Imaizumi, Y.; Kuroiwa, S. Selective flotation of chalcopyrite and molybdenite with H2O2 oxidation. Miner. Eng. 2017, 100, 83–92. [Google Scholar] [CrossRef]
- Barzyk, W.; Malysa, K.; Pomianowski, A. The influence of surface oxidation of chalcocite on its floatability and ethyl xanthate sorption. Int. J. Miner. Process. 1981, 8, 17–29. [Google Scholar] [CrossRef]
- Suyantara, G.P.W.; Hirajima, T.; Miki, H.; Sasaki, K.; Kuroiwa, S.; Aoki, Y. Effect of H2O2 and potassium amyl xanthate on separation of enargite and tennantite from chalcopyrite and bornite using flotation. Miner. Eng. 2020, 152, 106371. [Google Scholar] [CrossRef]
- Yang, X.; Li, Y.; Fan, R.; Duan, W.; Huang, L.; Xiao, Q. Separation mechanism of chalcopyrite and pyrite due to H2O2 treatment in low-alkaline seawater flotation system. Miner. Eng. 2022, 176, 107356. [Google Scholar] [CrossRef]
- Hirajima, T.; Mori, M.; Ichikawa, O.; Sasaki, K.; Miki, H.; Farahat, M.; Sawada, M. Selective flotation of chalcopyrite and molybdenite with plasma pre-treatment. Miner. Eng. 2014, 66–68, 102–111. [Google Scholar] [CrossRef]
- Suyantara, G.P.W.; Hirajima, T.; Miki, H.; Sasaki, K.; Yamane, M.; Takida, E.; Kuroiwa, S.; Imaizumi, Y. Effect of Fenton-like oxidation reagent on hydrophobicity and floatability of chalcopyrite and molybdenite. Colloids Surf. A Physicochem. Eng. Asp. 2018, 554, 34–48. [Google Scholar] [CrossRef]
- Heyes, G.W.; Trahar, W.J. The natural flotability of chalcopyrite. Int. J. Miner. Process. 1977, 4, 317–344. [Google Scholar] [CrossRef]
- Buckley, A.N.; Woods, R. An X-ray photoelectron spectroscopic study of the oxidation of chalcopyrite. Aust. J. Chem. 1984, 37, 2403–2413. [Google Scholar] [CrossRef]
- Mielczarski, J.A.; Cases, J.M.; Alnot, M.; Ehrhardt, J.J. XPS characterization of chalcopyrite, tetrahedrite, and tennantite surface products after different conditioning. 1. aqueous solution at pH 10. Langmuir 1996, 12, 2519–2530. [Google Scholar] [CrossRef]
- Chander, S. Electrochemistry of sulfide flotation: Growth characteristics of surface coatings and their properties, with special reference to chalcopyrite and pyrite. Int. J. Miner. Process. 1991, 33, 121–134. [Google Scholar] [CrossRef]
- Li, Y.; Zhu, H.; Li, W.; Zhu, Y. A fundamental study of chalcopyrite flotation in sea water using sodium silicate. Miner. Eng. 2019, 139, 105862. [Google Scholar] [CrossRef]
- Li, Y.; Li, W.; Xiao, Q.; He, N.; Ren, Z.; Lartey, C.; Gerson, A.R. The influence of common monovalent and divalent chlorides on chalcopyrite flotation. Minerals 2017, 7, 111. [Google Scholar] [CrossRef] [Green Version]
- Li, W.; Li, Y.; Xiao, Q.; Wei, Z.; Song, S. The influencing mechanisms of sodium hexametaphosphate on chalcopyrite flotation in the presence of MgCl2 and CaCl2. Minerals 2018, 8, 150. [Google Scholar] [CrossRef] [Green Version]
- Nakai, I.; Izawa, M.; Sugitani, Y.; Niwa, Y. X-ray photoelectron spectroscopic study of copper minerals. Miner. J. 1976, 8, 135–138. [Google Scholar] [CrossRef] [Green Version]
- Mccarron, J.J.; Walker, G.W.; Buckley, A.N. An X-ray photoelectron spectroscopic investigation of chalcopyrite and pyrite surfaces after conditioning in sodium sulfide solutions. Int. J. Miner. Process. 1990, 30, 1–16. [Google Scholar] [CrossRef]
- Li, Y.; Chandra, A.P.; Gerson, A.R. Scanning photoelectron microscopy studies of freshly fractured chalcopyrite exposed to O2 and H2O. Geochim. Et Cosmochim. Acta 2014, 133, 372–386. [Google Scholar] [CrossRef]
- Descostes, M.; Mercier, F.; Thromat, N.; Beaucaire, C.; Gautier-Soyer, M. Use of XPS in the determination of chemical environment and oxidation state of iron and sulfur samples: Constitution of a data basis in binding energies for Fe and S reference compounds and applications to the evidence of surface species of an oxidized pyrite in a carbonate medium. Appl. Surf. Sci. 2000, 165, 288–302. [Google Scholar]
- Harmer, S.L.; Thomas, J.E.; Fornasiero, D.; Gerson, A.R. The evolution of surface layers formed during chalcopyrite leaching. Geochim. Et Cosmochim. Acta 2006, 70, 4392–4402. [Google Scholar] [CrossRef]
- Acres, R.G.; Harmer, S.L.; Beattie, D.A. Synchrotron XPS, NEXAFS, and ToF-SIMS studies of solution exposed chalcopyrite and heterogeneous chalcopyrite with pyrite. Miner. Eng. 2010, 23, 928–936. [Google Scholar] [CrossRef]
- Ghahremaninezhad, A.; Dixon, D.G.; Asselin, E. Electrochemical and XPS analysis of chalcopyrite (CuFeS2) dissolution in sulfuric acid solution. Electrochim. Acta 2013, 87, 97–112. [Google Scholar] [CrossRef]
- Li, Y.; Qian, G.; Li, J.; Gerson, A.R. Kinetics and roles of solution and surface species of chalcopyrite dissolution at 650 mV. Geochim. Et Cosmochim. Acta 2015, 161, 188–202. [Google Scholar] [CrossRef]
- Wang, X.; Gao, P.; Liu, J.; Gu, X.; Han, Y. Adsorption performance and mechanism of eco-friendly and efficient depressant galactomannan in flotation separation of chalcopyrite and molybdenite. J. Mol. Liq. 2021, 326, 115257. [Google Scholar] [CrossRef]
- Yin, Q.; Kelsall, G.H.; Vaughan, D.J.; England, K. Atmospheric and electrochemical oxidation of the surface of chalcopyrite (CuFeS2). Geochim. Et Cosmochim. Acta 1995, 59, 1091–1100. [Google Scholar] [CrossRef]
- Langevoort, J.C.; Sutherland, I.; Hanekamp, L.J.; Gellings, P. On the oxide formation on stainless steels AISI 304 and incoloy 800H investigated with XPS. Appl. Surf. Sci. 1987, 28, 167–179. [Google Scholar] [CrossRef] [Green Version]
- Gardner, J.R.; Woods, R. An electrochemical investigation of the natural flotability of chalcopyrite. Int. J. Miner. Process. 1979, 6, 1–16. [Google Scholar] [CrossRef]
- Hayes, R.A.; Ralston, J. The collectorless flotation and separation of sulphide minerals by Eh control. Int. J. Miner. Process. 1988, 23, 55–84. [Google Scholar] [CrossRef]
- Kelebek, S.; Smith, F.W. Collectorless flotation of galena and chalcopyrite: Correlation between flotation rate and the amount of extracted sulfur. Min. Metall. Explor. 1989, 6, 123–129. [Google Scholar] [CrossRef]
- Buckley, A.N.; Riley, K.W. Self-induced floatability of sulfide minerals—Examination of recent evidence for elemental sulfur as the hydrophobic entity. Surf. Interface Anal. 1991, 17, 655–659. [Google Scholar] [CrossRef]
- Zachwieja, J.B.; McCarron, J.J.; Walker, G.W.; Buckley, A.N. Correlation between the surface composition and collectorless flotation of chalcopyrite. J. Colloid Interface Sci. 1989, 132, 462–468. [Google Scholar] [CrossRef]
- Gao, S.; Chen, S.; Hu, R.; Li, H.Y.; Shi, Q.Z. Derivation and application of thermodynamic equations. Chin. J. Inorg. Chem. 2002, 18, 362–366. [Google Scholar]
- Zhai, L.; Yang, K.-W.; Liu, C.-C.; Xu, K.-Z.; Yang, X.; Gao, H.-Z.; Shi, Y.; Feng, L.; Jia, C.; Zhou, L.-S.; et al. Exploring antibiotic resistance based on enzyme hydrolysis by microcalorimetry. J. Therm. Anal. Calorim. 2013, 111, 1657–1661. [Google Scholar] [CrossRef]
- Wulf, O. Evidence of the existence of activated molecules in a chemical reaction. Proc. Natl. Acad. Sci. USA 1926, 12, 129–132. [Google Scholar] [CrossRef] [Green Version]
- Truhlar, D.G.; Garrett, B.C.; Klippenstein, S.J. Current Status of Transition-State Theory. J. Phys. Chem. 1996, 100, 12771–12800. [Google Scholar] [CrossRef]
- Truhlar, D.G.; Hase, W.L.; Hynes, J.T. Current status of transition-state theory. J. Phys. Chem. 1983, 87, 2664–2682. [Google Scholar] [CrossRef]
- Fielitz, P.; Borchardt, G. Oxygen exchange at gas/oxide interfaces: How the apparent activation energy of the surface exchange coefficient depends on the kinetic regime. Phys. Chem. Chem. Phys. 2016, 18, 22031–22038. [Google Scholar] [CrossRef]
- Mekhtiev, A.D.; Alkenova, A.; Isagulov, A.; Zhumashev, K.; Portnov, V. On the possibility of the reaction (CuMoO4 + C), using the apparent activation energy method. Metalurgija 2015, 54, 519–522. [Google Scholar]
- Li, P.; Tang, J.; Chen, X.; Bai, Y.; Li, Q. Effect of temperature and pH on early hydration rate and apparent activation energy of alkali-activated slag. Adv. Mater. Sci. Eng. 2019, 1, 3531543. [Google Scholar] [CrossRef] [Green Version]
- Calderón-Cárdenas, A.; Paredes-Salazar, E.A.; Varela, H. Apparent activation energy in electrochemical multistep reactions: A description via sensitivities and degrees of rate control. ACS Catal. 2020, 10, 9336–9345. [Google Scholar] [CrossRef]
- Zhang, Y.; Cao, Z.; Cao, Y.; Sun, C. FTIR studies of xanthate adsorption on chalcopyrite, pentlandite and pyrite surfaces. J. Mol. Struct. 2013, 1048, 434–440. [Google Scholar] [CrossRef]
- Chen, Y.; Feng, B.; Guo, Y.; Wang, T.; Zhang, L.; Zhong, C.; Wang, H. The role of oxidizer in the flotation separation of chalcopyrite and galena using sodium lignosulfonate as a depressant. Miner. Eng. 2021, 172, 107160. [Google Scholar] [CrossRef]
- Suyantara, G.P.W.; Hirajima, T.; Miki, H.; Sasaki, K.; Yamane, M.; Takida, E.; Kuroiwa, S.; Imaizumi, Y. Selective flotation of chalcopyrite and molybdenite using H2O2 oxidation method with the addition of ferrous sulfate. Miner. Eng. 2018, 122, 312–326. [Google Scholar] [CrossRef]
Figure 1.
Schematic diagram of experiment cell (left) and control cell (right) set-up.

Figure 2.
Flotation recovery of chalcopyrite as a function of H2O2 concentration in the presence of butyl xanthate.
Figure 2.
Flotation recovery of chalcopyrite as a function of H2O2 concentration in the presence of butyl xanthate.

Figure 3.
Contact angles of (a) untreated chalcopyrite and treated chalcopyrite with (b) 0.06% H2O2, (c) 0.08% H2O2, (d) 0.1% H2O2, (e) 0.12% H2O2, and (f) 0.14% H2O2 in pure water at pH 8, with 200 g/t butyl xanthate.
Figure 3.
Contact angles of (a) untreated chalcopyrite and treated chalcopyrite with (b) 0.06% H2O2, (c) 0.08% H2O2, (d) 0.1% H2O2, (e) 0.12% H2O2, and (f) 0.14% H2O2 in pure water at pH 8, with 200 g/t butyl xanthate.

Figure 4.
XPS spectra of chalcopyrite conditioned with various concentrations of H2O2, (a) S 2p, (b) O 1s, (c) Fe 2p, and (d) Cu 2p.
Figure 4.
XPS spectra of chalcopyrite conditioned with various concentrations of H2O2, (a) S 2p, (b) O 1s, (c) Fe 2p, and (d) Cu 2p.


Figure 5.
Thermokinetic curves of chalcopyrite react with different concentrations of H2O2 at (a) 30 °C, (b) 35 °C and (c) 40 °C; E represents thermoelectric potential.
Figure 5.
Thermokinetic curves of chalcopyrite react with different concentrations of H2O2 at (a) 30 °C, (b) 35 °C and (c) 40 °C; E represents thermoelectric potential.

Figure 6.
The mechanism of slight oxidation and significant oxidation of chalcopyrite.

Figure 7.
Surface oxidation index of chalcopyrite at different H2O2 concentrations.

Figure 8.
Chalcopyrite flotation recovery as a function of surface oxidation index.


Table 1.
The atomic concentration of each species on the chalcopyrite surface.
| Species | BE (eV) | Conditions (H2O2 Concentration, v/v %) | ||||
|---|---|---|---|---|---|---|
| 0% | 0.06% | 0.1% | 0.14% | 1% | ||
| S 2p | 161.4 | 39.22 | 34.15 | 32.47 | 28.35 | 25.87 |
| O 1s | 532.1 | 32.61 | 40.73 | 42.21 | 48.53 | 54.89 |
| Fe 2p | 710.8 | 14.17 | 12.74 | 12.29 | 11.03 | 10.20 |
| Cu 2p | 932.6 | 14.00 | 12.38 | 13.03 | 12.09 | 9.04 |
Table 2.
The atomic concentration of species S 2p, Fe 2p and Cu 2p on chalcopyrite surfaces treated by H2O2.
Table 2.
The atomic concentration of species S 2p, Fe 2p and Cu 2p on chalcopyrite surfaces treated by H2O2.
| Species | BE (eV) | FWHM (eV) | Conditions (H2O2 Concentration, v/v%) | ||||
|---|---|---|---|---|---|---|---|
| 0% | 0.06% | 0.1% | 0.14% | 1% | |||
| S2− | 161.4 | 0.7–0.8 | 34.17 | 25.61 | 21.13 | 21.68 | 21.08 |
| S22− | 162.2 | 0.7–0.9 | 4.30 | 11.68 | 15.11 | 13.35 | 11.86 |
| Sn2−/S0 | 163.2–163.7 | 1.1–1.3 | 14.05 | 14.81 | 14.85 | 11.89 | 11.54 |
| SO32− | 166.3 | 1.1–1.3 | 0.70 | 0.17 | 0.42 | 0.31 | 0.71 |
| SO42− | 168.8 | 1.5–1.6 | 2.60 | 2.99 | 3.56 | 5.30 | 8.91 |
| Energy loss | 165.1 | 1.4–1.7 | 2.37 | 2.31 | 1.11 | 2.55 | 3.23 |
| Total S 2p | 58.19 | 57.57 | 56.18 | 55.08 | 57.33 | ||
| Fe in CuFeS2 | 706.1 | 2.1 | 5.98 | 4.01 | 3.50 | 3.48 | 3.33 |
| Fe-O/OH | 710.8 | 1.4 | 9.38 | 10.12 | 10.36 | 10.45 | 11.13 |
| Fe-SO | 713.8 | 2.1 | 5.67 | 7.39 | 7.41 | 7.50 | 8.16 |
| Total Fe 2p | 21.03 | 21.52 | 21.27 | 21.43 | 22.62 | ||
| Cu in CuFeS2 | 932.2 | 1.2 | 20.78 | 20.91 | 22.55 | 23.49 | 20.05 |
| Total Cu 2p | 20.78 | 20.91 | 22.55 | 23.49 | 20.05 | ||
| ∑ SO32− + SO42− + Fe–O/OH/SO | 18.35 | 20.67 | 21.75 | 23.56 | 28.91 | ||
| ∑ S22− + Sn2−/S0 + Fe/Cu in CuFeS2 | 45.11 | 51.41 | 56.01 | 52.21 | 46.78 | ||
| Oxidation degree | 0.407 | 0.402 | 0.388 | 0.451 | 0.618 | ||
Table 3.
Thermokinetic parameters for the reaction between chalcopyrite and H2O2.
| Conditions | T(K) | Q(mJ) | k(×10−3 s−1) | n | R2 |
|---|---|---|---|---|---|
| 0.06 vol.% H2O2 | 303.15 | −8239.9 | 0.0337 | 0.918 | 0.991 |
| 308.15 | −7856.4 | 0.1108 | 1.0589 | 0.998 | |
| 313.15 | −7423.6 | 0.2979 | 1.1295 | 0.986 | |
| 0.1 vol.% H2O2 | 303.15 | −10,468.9 | 0.0352 | 1.056 | 0.9994 |
| 308.15 | −8146.9 | 0.1184 | 1.1508 | 0.9841 | |
| 313.15 | −7865.1 | 0.3159 | 0.8435 | 0.991 | |
| 0.14 vol.% H2O2 | 303.15 | −15,560.5 | 0.0452 | 0.8455 | 0.9959 |
| 308.15 | −15,122.7 | 0.1256 | 1.0657 | 0.9857 | |
| 313.15 | −14,775.4 | 0.3560 | 0.9708 | 0.9896 | |
| H2O2 concentration (vol.%) | lnA (s−1) | Ea (kJ·mol−1) | Δ (kJ·mol−1) | Δ (J·K−1·mol−1) | |
| 0.06 | 64.909 | 172.07 | 169.51 | 420.16 | |
| 0.1 | 64.941 | 173.27 | 169.47 | 420.43 | |
| 0.14 | 61.164 | 162.87 | 179.74 | 455.70 | |
“−” means the reaction is exothermic.
Table 4.
The oxidation index and theoretical recovery calculated by the method proposed in this paper.
Table 4.
The oxidation index and theoretical recovery calculated by the method proposed in this paper.
| Literatures | Recovery (Experimental) | Oxidation Index (Theoretical) | Recovery (Theoretical) |
|---|---|---|---|
| Suyantara et al. [12] | 62.65% | 0.511 | 60.66% |
| Moimane et al. [5] | 89.30% | 0.444 | 80.38% |
| Suyantara et al. [47] | 57.00% | 0.528 | 55.28% |
| Li et al. [19] | 88.00% | 0.411 | 90.23% |
Publisher’s Note: MDPI stays neutral with regard to jurisdictional claims in published maps and institutional affiliations. |
© 2022 by the authors. Licensee MDPI, Basel, Switzerland. This article is an open access article distributed under the terms and conditions of the Creative Commons Attribution (CC BY) license (https://creativecommons.org/licenses/by/4.0/).
Share and Cite
MDPI and ACS Style
Yang, X.; Li, Y.; Chen, W.; Duan, W.; Xiao, Q.; Jiang, T. A Quantitative Relationship between Oxidation Index and Chalcopyrite Flotation Recovery. Minerals 2022, 12, 888. https://0-doi-org.brum.beds.ac.uk/10.3390/min12070888
AMA Style
Yang X, Li Y, Chen W, Duan W, Xiao Q, Jiang T. A Quantitative Relationship between Oxidation Index and Chalcopyrite Flotation Recovery. Minerals. 2022; 12(7):888. https://0-doi-org.brum.beds.ac.uk/10.3390/min12070888
Chicago/Turabian StyleYang, Xu, Yubiao Li, Wen Chen, Wanqing Duan, Qing Xiao, and Tingting Jiang. 2022. "A Quantitative Relationship between Oxidation Index and Chalcopyrite Flotation Recovery" Minerals 12, no. 7: 888. https://0-doi-org.brum.beds.ac.uk/10.3390/min12070888
Note that from the first issue of 2016, this journal uses article numbers instead of page numbers. See further details here.