
Coal Feed-Dependent Variation in Fly Ash Chemistry in a Single Pulverized-Combustion Unit
 , , and
Abstract
:1. Introduction
2. Methods
2.1. Sample Sources
2.2. Basic Chemistry and X-ray Fluorescence
2.3. Inductively Coupled Plasma-Mass Spectroscopy
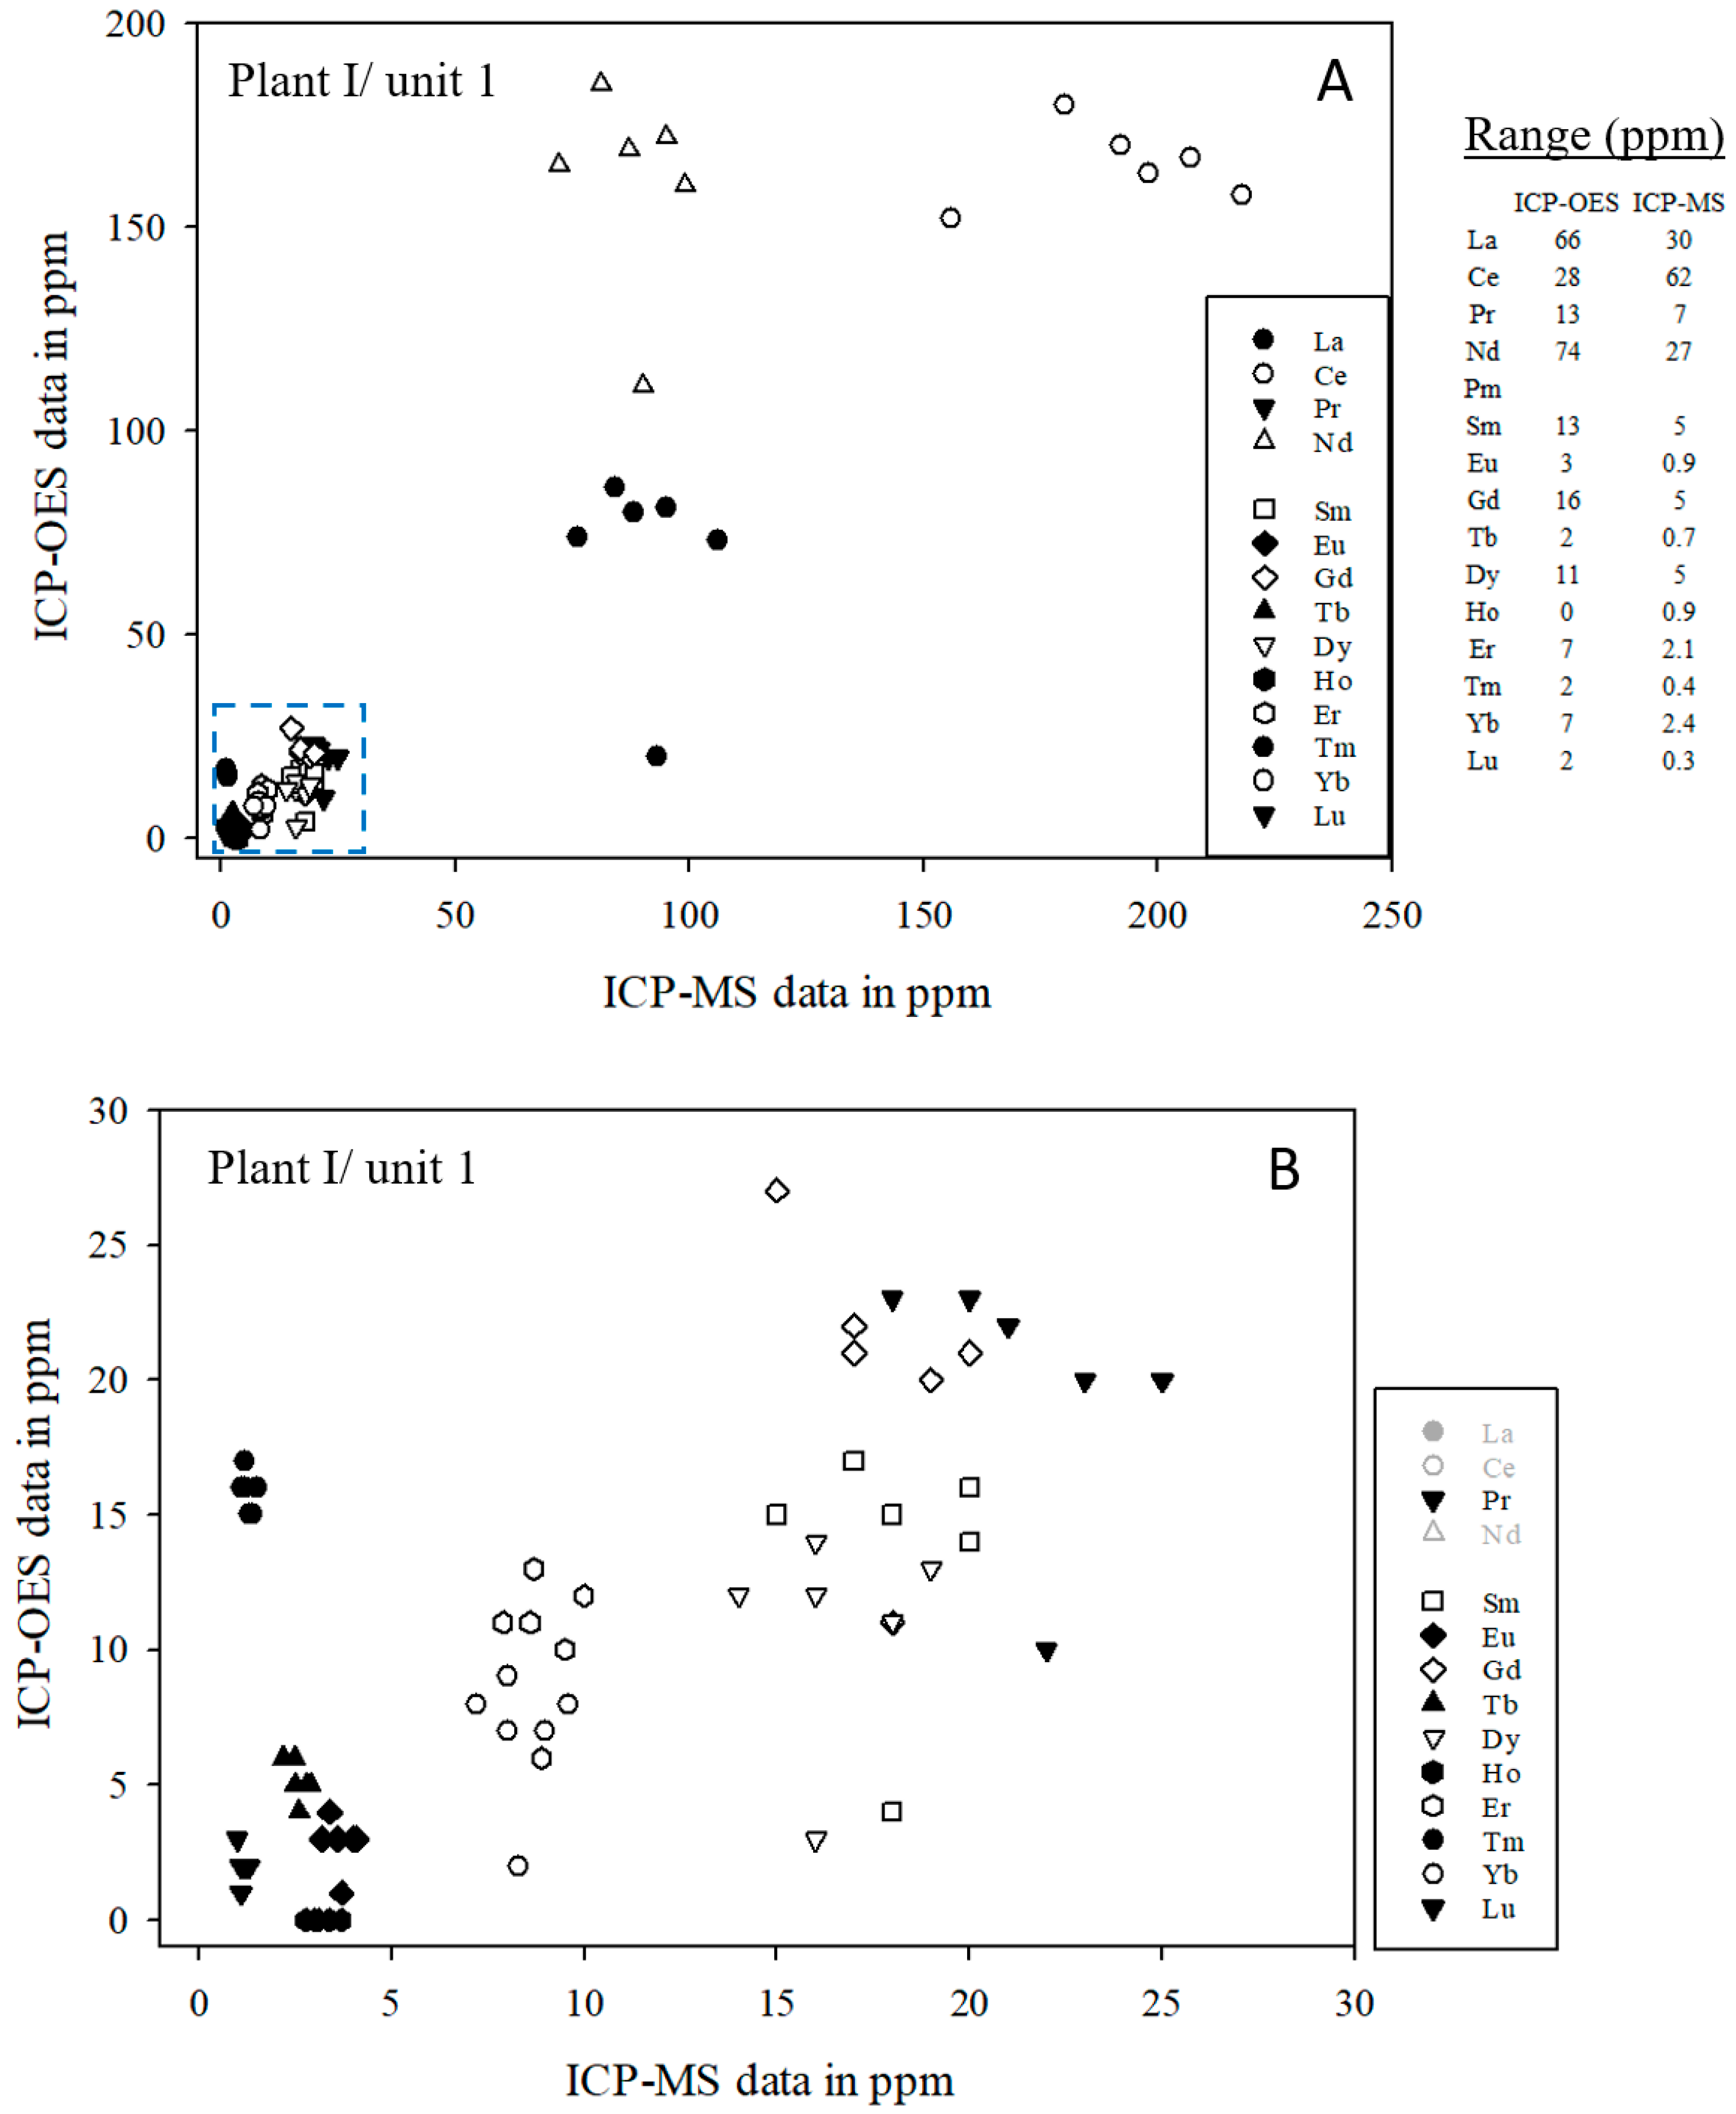
2.4. Notes on the Comparison of ICP Methods
2.5. Notes on Rare Earth Nomenclature, Normalization, and the Expressions of Normalized Data
3. Results and Discussion
3.1. Basic Element Trends
3.2. Principal Components Analysis on REY and Selected Major Oxides and Minor Elements
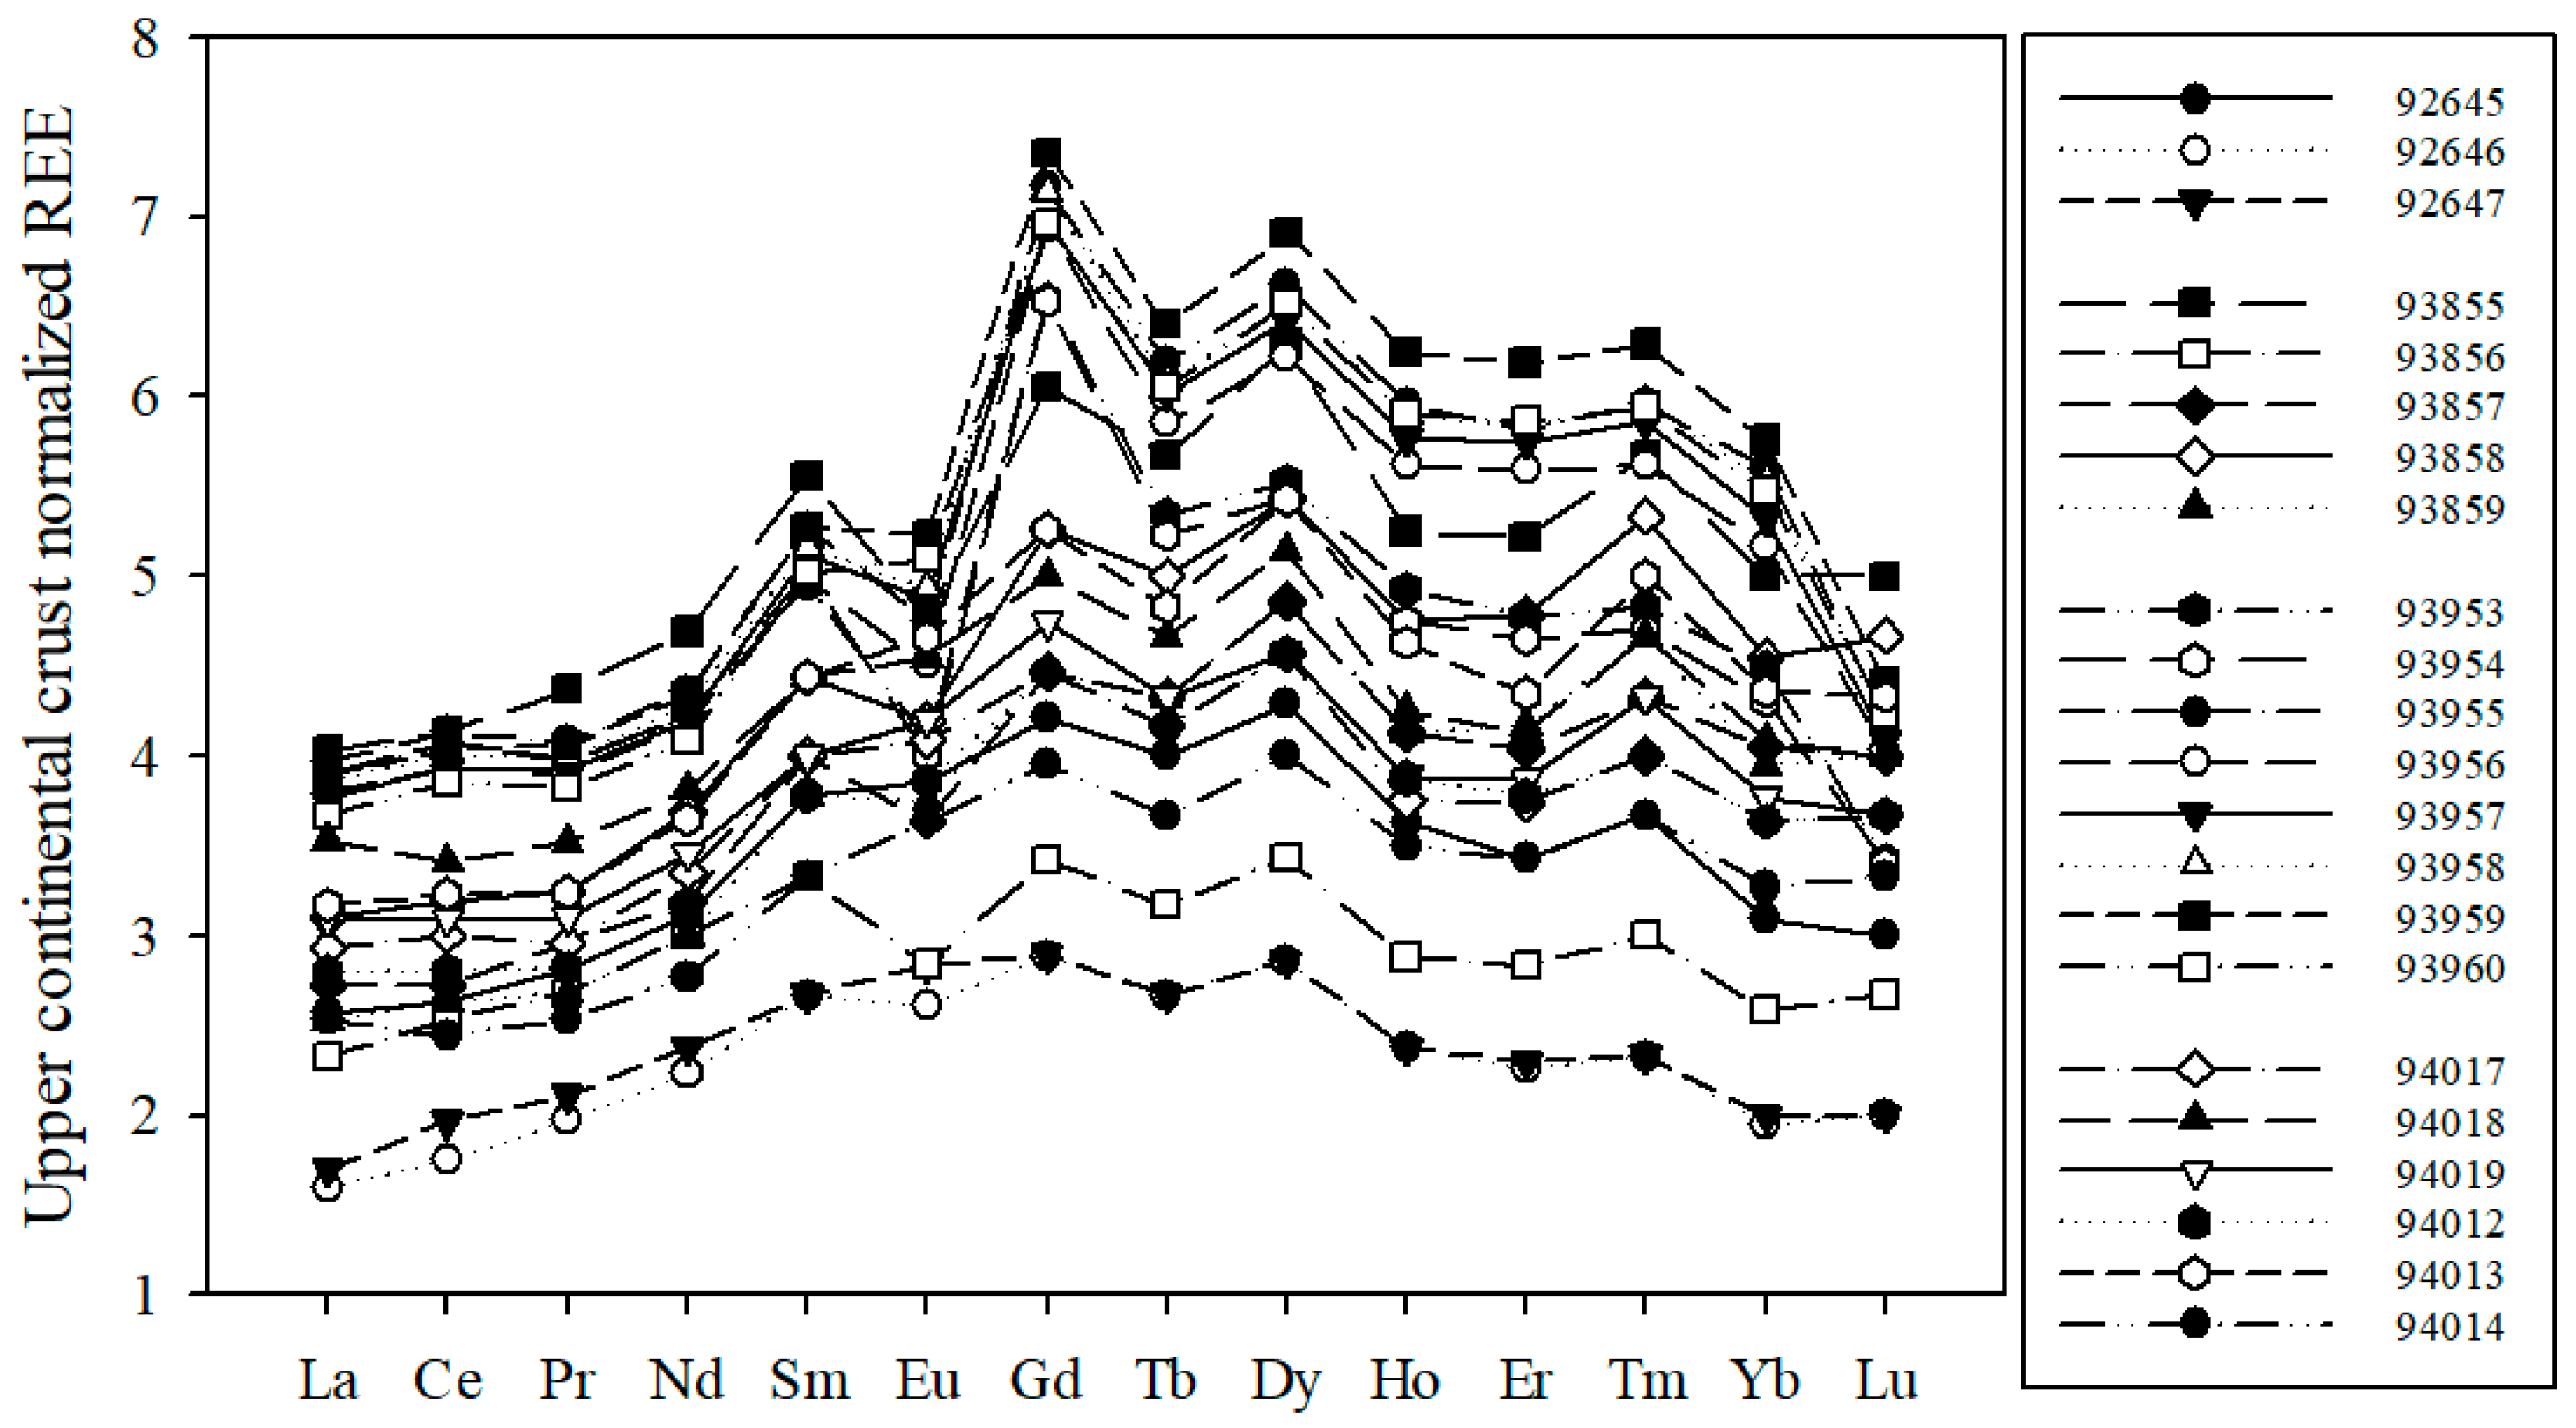
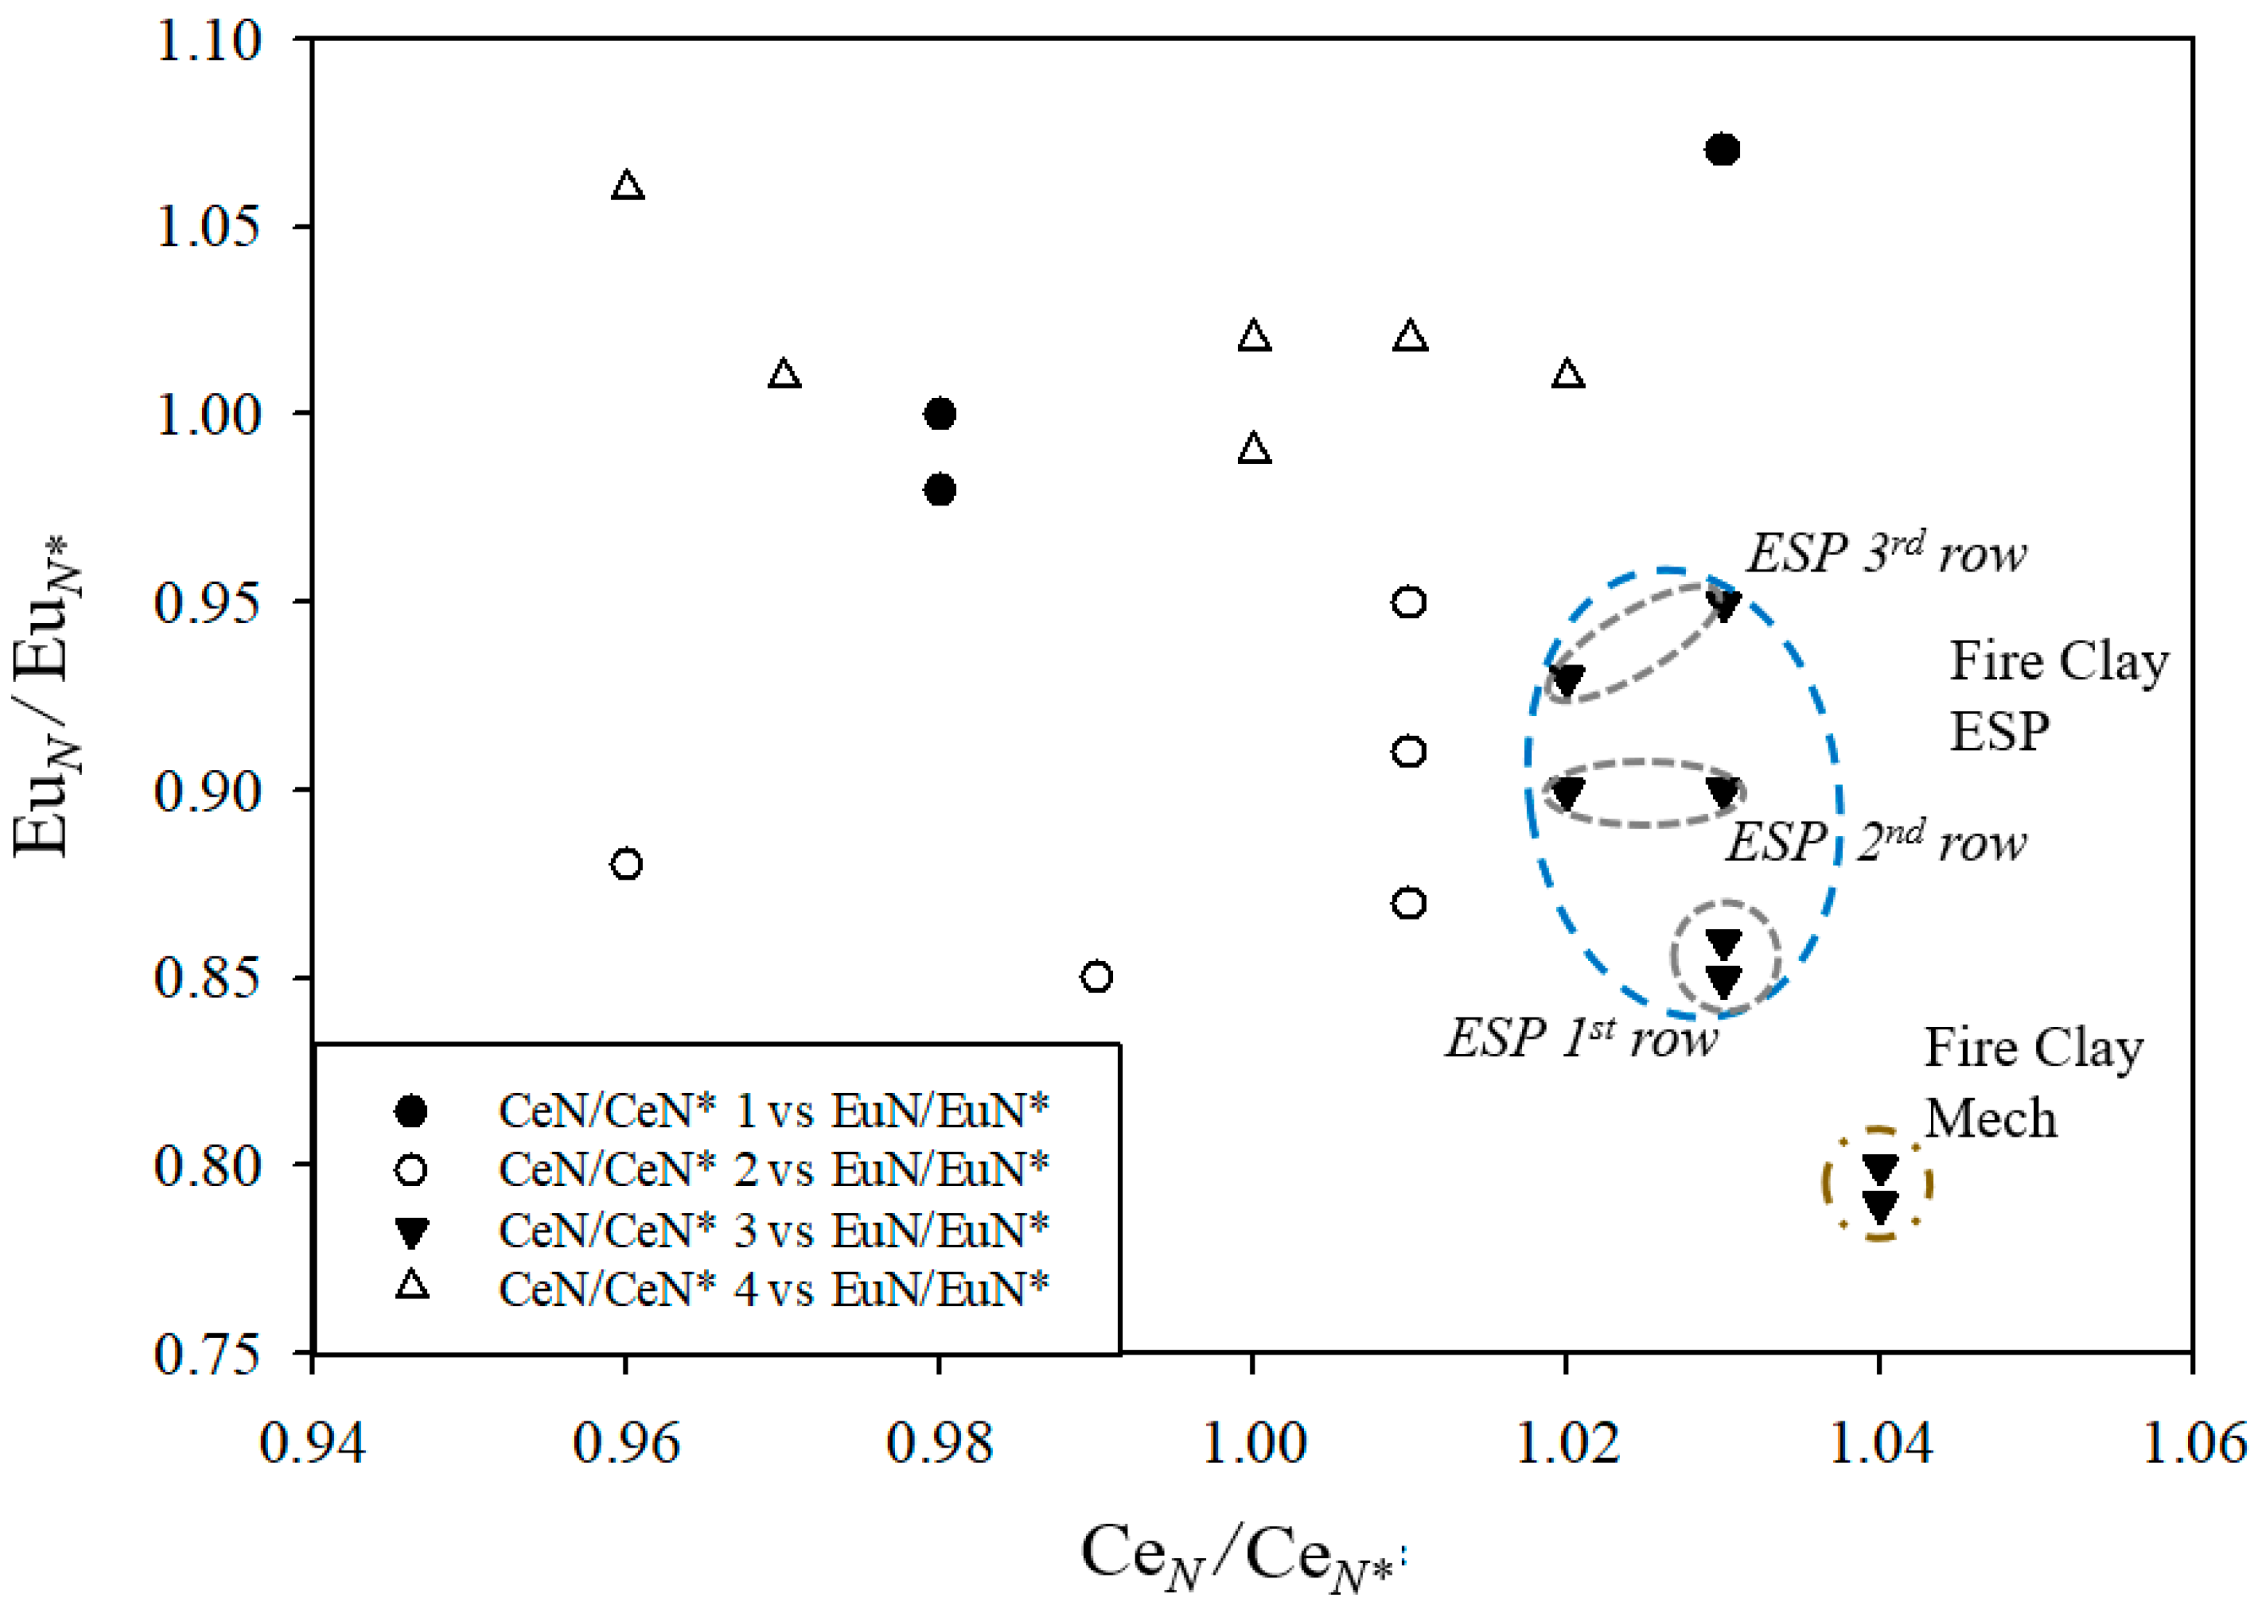
3.3. Lanthanide Elements
3.4. Discussion
4. Summary
Supplementary Materials
Author Contributions
Funding
Acknowledgments
Conflicts of Interest
Disclaimer
References
- Arroyo, F.; Font, O.; Fernandez-Pereira, C.; Querol, X.; Juan, R.; Ruiz, C.; Coca, P. Ion flotation of germanium from fly ash aqueous leachates. J. Hazard. Mater. 2009, 167, 582–588. [Google Scholar] [CrossRef] [PubMed]
- Arroyo, F.; Font, O.; Chimenos, J.M.; Fernandez-Pereira, C.; Querol, X.; Coca, P. IGCC fly ash valorisation. Optimisation of Ge and Ga recovery for an industrial application. Fuel Process. Technol. 2014, 124, 222–227. [Google Scholar] [CrossRef]
- Hower, J.C.; Groppo, J.G.; Joshi, P.; Preda, D.V.; Gamliel, D.P.; Mohler, D.T.; Wiseman, J.D.; Hopps, S.D.; Morgan, T.D.; Beers, T.; et al. Distribution of Lanthanides, Yttrium, and Scandium in the pilot-scale beneficiation of fly ashes derived from eastern Kentucky coals. Minerals 2020, 10, 105. [Google Scholar] [CrossRef]
- Hower, J.C.; Groppo, J.G.; Jewell, R.F.; Wiseman, J.D.; Duvallet, T.Y.; Oberlink, A.E.; Hopps, S.D.; Morgan, T.D.; Henke, K.R.; Joshi, P.; et al. Distribution of Rare earth elements in the pilot-scale processing of fly ashes derived from eastern Kentucky coals: Comparisons of the feed and processed ashes. Fuel 2021, 295, 120562. [Google Scholar] [CrossRef]
- Rybak, A.; Rybak, A. Characteristics of some selected methods of rare earth recovery from coal fly ashes. Metals 2021, 11, 142. [Google Scholar] [CrossRef]
- Seredin, V.V.; Dai, S.; Sun, Y.; Chekryzhov, I.Y. Coal deposits as promising sources of rare metals for alternative power and energy-efficient technologies. Appl. Geochem. 2013, 31, 1–11. [Google Scholar] [CrossRef]
- Dai, S.; Seredin, V.V.; Ward, C.R.; Jiang, J.; Hower, J.C.; Song, X.; Jiang, Y.; Wang, X.; Gornostaeva, T.; Li, X.; et al. Composition and modes of occurrence of minerals and elements in coal combustion products derived from high-Ge coals. Int. J. Coal Geol. 2014, 121, 79–97. [Google Scholar] [CrossRef]
- Erickson, B. From Coal, a New Source of Rare Earths. C&EN 2018. 8 July 2018. Available online: https://0-cen-acs-org.brum.beds.ac.uk/materials/inorganic-chemistry/coal-new-source-rare-earths/96/i28 (accessed on 6 July 2022).
- Patel, M.; Karamalidis, A.K. Germanium: A review of its US demand, uses, resources, chemistry, and separation technologies. Sep. Purif. Technol. 2021, 275, 118981. [Google Scholar] [CrossRef]
- Meij, R. Trace element behavior in coal-fired power plants. Fuel Process. Technol. 1994, 39, 199–217. [Google Scholar] [CrossRef]
- Liu, J.; Dai, S.; He, X.; Hower, J.C.; Sakulpitakphon, T. Size-dependent variations in fly ash trace-element chemistry: Examples from a Kentucky power plant and with emphasis on rare earth elements. Energy Fuels 2017, 31, 438–447. [Google Scholar] [CrossRef]
- Sakulpitakphon, T.; Hower, J.C.; Trimble, A.S.; Schram, W.H.; Thomas, G.A. Mercury capture by fly ash: Study of the combustion of a high-mercury coal at a utility boiler. Energy Fuels 2000, 14, 727–733. [Google Scholar] [CrossRef]
- Hower, J.C.; Thomas, G.A.; Hopps, S.G. Trends in coal utilization and coal-combustion product production in Kentucky: Results of the 2012 survey of power plants. Coal Combust. Gasif. Prod. 2014, 6, 35–41. [Google Scholar]
- Taggart, R.K.; Hower, J.C.; Dwyer, G.S.; Hsu-Kim, H. Trends in the rare-earth element content of U.S.-based coal combustion fly ashes. Environ. Sci. Technol. 2016, 50, 5919–5926. [Google Scholar] [CrossRef]
- ASTM Standard D4239-18e1; Standard Test Method for Sulfur in the Analysis Sample of Coal and Coke Using High-Temperature Tube Furnace Combustion. ASTM International: West Conshohocken, PA, USA, 2018.
- ASTM Standard D3176-15; Standard Practice for Ultimate Analysis of Coal and Coke. ASTM International: West Conshohocken, PA, USA, 2015.
- Hower, J.C.; Bland, A.E. Geochemistry of the Pond Creek Coal Bed, Eastern Kentucky Coalfield. Int. J. Coal Geol. 1989, 11, 205–226. [Google Scholar] [CrossRef]
- ASTM D6357-21b; Standard Test Methods for Determination of Trace Elements in Coal, Coke, and Combustion Residues from Coal Utilization Processes by Inductively Coupled Plasma Atomic Emission Spectrometry, Inductively Coupled Plasma Mass Spectrometry, and Graphite Fur. ASTM International: West Conshohoken, PA, USA, 2021.
- Bank, T.; Roth, E.; Tinker, P.; Granite, E. Analysis of Rare Earth Elements in Geologic Samples using Inductively Coupled Plasma Mass Spectrometry; US DOE Topical Report–DOE/NETL-2016/1794; National Energy Technology Lab: Pittsburgh, PA, USA, 2016. [Google Scholar]
- Dai, S.; Graham, I.T.; Ward, C.R. A review of anomalous rare earth elements and yttrium in coal. Int. J. Coal Geol. 2016, 159, 82–95. [Google Scholar] [CrossRef]
- Ketris, M.P.; Yudovich, Y.E. Estimations of Clarkes for carbonaceous biolithes: World average for trace element contents in black shales and coals. Int. J. Coal Geol. 2009, 78, 135–148. [Google Scholar] [CrossRef]
- ASTM D6357-11; Test Methods for Determination of Trace Elements in Coal, Coke, & Combustion Residues from Coal Utilization Processes by Inductively Coupled Plasma Atomic Emission, Inductively Coupled Plasma Mass, & Graphite Furnace Atomic Absorption Spectrometry. ASTM International: West Conshohocken, PA, USA, 2011.
- ASTM Standard D4503; Standard Practice for Dissolution of Solid Waste by Lithium Metaborate Fusion. ASTM International: West Conshohocken, PA, USA, 2012.
- Zygarlicke, C.J.; Folkedahl, B.C.; Nyberg, C.M.; Feole, I.K.; Kurz, B.A.; Theakar, N.L.; Benson, S.A.; Hower, J.C.; Eble, C.F. Rare-Earth Elements (REES) in U.S. Coalbased Resources: Sampling, Characterization, and Round-Robin Interlaboratory Study. Available online: https://edx.netl.doe.gov/dataset/rare-earth-elements-in-u-s-coal-based-resources,rfp-10982-fe0029007-final-report-RRIS-UND.pdf (accessed on 24 January 2020).
- Seredin, V.V. Rare earth element-bearing coals from the Russian Far East deposits. Int. J. Coal Geol. 1996, 30, 101–129. [Google Scholar] [CrossRef]
- Hower, J.C.; Ruppert, L.F.; Eble, C.F. Lanthanide, Yttrium, and Zirconium anomalies in the Fire Clay coal bed, Eastern Kentucky. Int. J. Coal Geol. 1999, 39, 141–153. [Google Scholar] [CrossRef]
- Taylor, S.R.; McLennan, S.M. The Continental Crust—Its Composition and Evolution; Blackwell Scientific Publishers: Boston, MA, USA, 1985; p. 312. [Google Scholar]
- Seredin, V.V.; Dai, S. Coal deposits as potential alternative sources for lanthanides and yttrium. Int. J. Coal Geol. 2012, 94, 67–93. [Google Scholar] [CrossRef]
- Bau, M.; Dulski, P. Distribution of yttrium and rare-earth elements in the Penge and Kuruman Iron-Formations, Transvaal Supergroup, South Africa. Precambrian Res. 1996, 79, 37–55. [Google Scholar] [CrossRef]
- Dai, S.; Xie, P.; Jia, S.; Ward, C.R.; Hower, J.C.; Yan, X.; French, D. Enrichment of U-Re-V-Cr-Se and rare earth elements in the Late Permian coals of the Moxinpo Coalfield, Chongqing, China: Genetic implications from geochemical and mineralogical data. Ore Geol. Rev. 2017, 80, 1–17. [Google Scholar] [CrossRef]
- Dai, S.; Xie, P.; Ward, C.R.; Yan, X.; Guo, W.; French, D.; Graham, I.T. Anomalies of rare metals in Lopingian super-high-organic-sulfur coals from the Yishan coalfield, Guangxi, China. Ore Geol. Rev. 2017, 88, 235–250. [Google Scholar] [CrossRef]
- Mardon, S.M.; Hower, J.C. Impact of coal properties on coal combustion by-product quality: Examples from a Kentucky power plant. Int. J. Coal Geol. 2004, 59, 153–169. [Google Scholar] [CrossRef]
- Hower, J.C.; Sakulpitakphon, T.; Trimble, A.S.; Thomas, G.A.; Schram, W.H. Major and Minor Element Distribution in Fly Ash from a Coal-fired Utility Boiler in Kentucky. Energy Sources 2006, 28, 79–95. [Google Scholar] [CrossRef]
- Hood, M.M.; Groppo, J.G.; Johnston, M.N.; Hower, J.C.; Clack, H.C.; de Medeiros, D.S.; Taffarel, S.R.; Cutruneo, C.M.N.L.; Silva, L.F.O. Influence of coal-fired power plant emissions regulations and consequent engineering controls and coal-supply modifications on fly ash chemistry and petrology: Examples from Kentucky power plants. Coal Combust. Gasif. Prod. 2016, 8, 8–18. [Google Scholar]
- Hower, J.C.; Senior, C.L.; Suuberg, E.M.; Hurt, R.H.; Wilcox, J.L.; Olson, E.S. Mercury capture by native fly ash carbons in coal-fired power plants. Prog. Energy Combust. Sci. 2010, 36, 510–529. [Google Scholar] [CrossRef]
- Fu, B.; Sun, R.; Hower, J.C.; Yuan, J.; Luo, G.; Yao, H.; Hu, H.; Mardon, S.M.; Tang, Q. Mercury stable isotope fractionation during gaseous elemental mercury adsorption onto coal fly ash particles: Experimental and field observations. J. Hazard. Mater. 2021, 405, 124280. [Google Scholar] [CrossRef]
- Hower, J.C.; Qian, D.; Briot, N.J.; Hood, M.M.; Eble, C.F. Nano-scale mineralogy of a Rare earth element-rich Manchester coal lithotype, Clay County, Kentucky. Int. J. Coal Geol. 2020, 220, 103413. [Google Scholar] [CrossRef]
- Hower, J.C.; Eble, C.F.; Backus, J.S.; Xie, P.; Liu, J.; Fu, B.; Hood, M.M. Aspects of Rare Earth Element enrichment in Central Appalachian coals. Appl. Geochem. 2020, 120, 104676. [Google Scholar] [CrossRef]
- Hower, J.C.; Eble, C.F.; Dai, S.; Belkin, H.E. Distribution of rare earth elements in eastern Kentucky coals: Indicators of multiple modes of enrichment? Int. J. Coal Geol. 2016, 160, 73–81. [Google Scholar] [CrossRef]


| %; Mois—As-Rec., Others—Dry Basis | ||||||||||||
|---|---|---|---|---|---|---|---|---|---|---|---|---|
| Series | Sample | Type | Row | Date | Coal | Ash | Mois. | C | H | N | S | O |
| 1 | 92645 | ESP | 2 | May-99 | Manchester | 90.01 | 6.93 | |||||
| 1 | 92646 | ESP | 3 | May-99 | 92.25 | 5.96 | ||||||
| 1 | 92647 | ESP | 3 | May-99 | 91.05 | 6.53 | ||||||
| 2 | 93855 | mech | 1 | Dec-12 | blend | 93.75 | 0.10 | 1.83 | 0.11 | dl | 0.10 | 4.21 |
| 2 | 93856 | mech | 1 | Dec-12 | 92.41 | 0.12 | 9.74 | 0.62 | 0.73 | 0.12 | dl | |
| 2 | 93857 | ESP | 1 | Dec-12 | 94.71 | 0.20 | 6.16 | 0.24 | 0.05 | 0.26 | dl | |
| 2 | 93858 | ESP | 2 | Dec-12 | 94.57 | 0.32 | 6.03 | 0.24 | 0.01 | 0.36 | dl | |
| 2 | 93859 | ESP | 3 | Dec-12 | 94.85 | 0.76 | 3.83 | 0.22 | dl | 1.05 | 0.05 | |
| 3 | 93953 | mech | 1 | Oct-14 | Fire Clay | 94.46 | 0.09 | 8.23 | 0.30 | dl | 1.09 | dl |
| 3 | 93954 | mech | 1 | Oct-14 | 93.19 | 0.08 | 9.85 | 0.25 | dl | 1.09 | dl | |
| 3 | 93955 | ESP | 1 | Oct-14 | 93.34 | 0.22 | 8.11 | 0.27 | dl | 1.49 | dl | |
| 3 | 93956 | ESP | 1 | Oct-14 | 92.39 | 0.23 | 9.35 | 0.29 | dl | 1.36 | dl | |
| 3 | 93957 | ESP | 2 | Oct-14 | 94.00 | 0.26 | 7.82 | 0.35 | dl | 1.47 | dl | |
| 3 | 93958 | ESP | 2 | Oct-14 | 92.57 | 0.20 | 8.52 | 0.27 | dl | 1.63 | dl | |
| 3 | 93959 | ESP | 3 | Oct-14 | 91.98 | 0.55 | 8.26 | 0.34 | dl | 1.92 | dl | |
| 3 | 93960 | ESP | 3 | Oct-14 | 94.27 | 0.35 | 6.05 | 0.33 | dl | 1.94 | dl | |
| 4 | 94017 | mech | 1 | Dec-16 | blend | 94.56 | dl | 5.94 | 0.09 | dl | 0.04 | dl |
| 4 | 94018 | mech | 1 | Dec-16 | 92.61 | dl | 8.11 | 0.1 | 0.01 | 0.1 | dl | |
| 4 | 94019 | mech | 1 | Dec-16 | 91.29 | dl | 8.83 | 0.09 | dl | 0.09 | dl | |
| 4 | 94012 | ESP | 1 | Dec-16 | 92.87 | dl | 6.48 | 0.13 | dl | 0.37 | 0.15 | |
| 4 | 94013 | ESP | 1 | Dec-16 | 92.59 | dl | 6.58 | 0.1 | 0.01 | 0.18 | 0.54 | |
| 4 | 94014 | ESP | 2 | Dec-16 | 85.05 | 1.24 | 6.66 | 0.17 | dl | 1.61 | 6.51 | |
| %; Ash Basis | ||||||||||||
|---|---|---|---|---|---|---|---|---|---|---|---|---|
| Sample | Type | Row | Na2O | MgO | Al2O3 | SiO2 | P2O5 | K2O | CaO | TiO2 | Fe2O3 | SO3 |
| 92645 | ESP | 2 | 0.78 | 0.23 | 25.50 | 47.40 | 0.33 | 2.45 | 1.88 | 1.43 | 13.67 | 0.13 |
| 92646 | ESP | 3 | 0.63 | 0.20 | 25.99 | 48.13 | 0.26 | 2.50 | 1.87 | 1.45 | 14.39 | 0.14 |
| 92647 | ESP | 3 | 0.72 | 0.15 | 24.99 | 46.49 | 0.59 | 2.39 | 3.82 | 1.40 | 14.26 | 0.07 |
| 93855 | mech | 1 | 0.14 | 1.14 | 28.56 | 53.08 | 0.13 | 2.57 | 0.98 | 1.17 | 13.35 | dl |
| 93856 | mech | 1 | 0.11 | 1.14 | 28.84 | 51.88 | 0.13 | 2.57 | 0.98 | 1.18 | 13.15 | dl |
| 93857 | ESP | 1 | 0.20 | 1.27 | 30.58 | 52.46 | 0.27 | 2.91 | 1.09 | 1.25 | 10.22 | dl |
| 93858 | ESP | 2 | 0.21 | 1.32 | 29.83 | 50.42 | 0.32 | 3.01 | 1.12 | 1.23 | 10.71 | 0.08 |
| 93859 | ESP | 3 | 0.19 | 1.24 | 30.03 | 49.54 | 0.50 | 2.85 | 1.29 | 1.40 | 10.34 | 0.89 |
| 93953 | mech | 1 | 0.18 | 0.78 | 30.10 | 54.21 | 0.26 | 1.75 | 1.46 | 1.68 | 9.27 | dl |
| 93954 | mech | 1 | 0.18 | 0.77 | 30.02 | 54.60 | 0.25 | 1.72 | 1.51 | 1.66 | 9.30 | dl |
| 93955 | ESP | 1 | 0.25 | 0.94 | 30.76 | 52.81 | 0.52 | 1.90 | 1.72 | 1.75 | 7.54 | 0.12 |
| 93956 | ESP | 1 | 0.24 | 0.93 | 30.74 | 55.96 | 0.52 | 1.96 | 1.76 | 1.78 | 7.58 | 0.06 |
| 93957 | ESP | 2 | 0.26 | 0.98 | 30.60 | 52.59 | 0.67 | 1.99 | 1.84 | 1.81 | 8.31 | 0.27 |
| 93958 | ESP | 2 | 0.26 | 0.99 | 30.65 | 53.32 | 0.69 | 2.01 | 1.87 | 1.81 | 8.22 | 0.22 |
| 93959 | ESP | 3 | 0.27 | 1.01 | 30.22 | 51.29 | 0.77 | 1.99 | 1.92 | 1.83 | 9.18 | 0.51 |
| 93960 | ESP | 3 | 0.28 | 1.04 | 29.56 | 50.12 | 0.89 | 2.02 | 2.01 | 1.78 | 9.87 | 0.96 |
| 94017 | mech | 1 | 0.23 | 1.07 | 28.80 | 55.54 | 0.58 | 2.37 | 1.68 | 1.48 | 9.62 | 0.08 |
| 94018 | mech | 1 | 0.23 | 1.08 | 29.04 | 55.56 | 0.60 | 2.35 | 1.72 | 1.49 | 9.50 | 0.09 |
| 94019 | mech | 1 | 0.23 | 1.06 | 28.87 | 55.20 | 0.60 | 2.32 | 1.74 | 1.49 | 9.63 | 0.09 |
| 94012 | ESP | 1 | 0.29 | 1.16 | 29.89 | 52.64 | 1.36 | 2.44 | 2.04 | 1.59 | 8.41 | 0.22 |
| 94013 | ESP | 1 | 0.28 | 1.15 | 29.67 | 52.49 | 1.22 | 2.44 | 2.01 | 1.56 | 8.34 | 0.38 |
| 94014 | ESP | 2 | 0.24 | 0.93 | 23.46 | 43.26 | 0.67 | 2.04 | 1.50 | 1.29 | 26.05 | 1.69 |
| ppm; Ash Basis | ||||||||||||||||
| Sample | Type | Row | V | Cr | Mn | Co | Ni | Cu | Zn | Ga | Ge | As | Rb | Sr | Zr | |
| 92645 | ESP | 2 | 471 | 266 | 322 | 168 | 328 | 284 | 124 | 118 | 576 | 196 | ||||
| 92646 | ESP | 3 | 82 | 73 | 361 | 140 | ||||||||||
| 92647 | ESP | 3 | 456 | 258 | 325 | 176 | 339 | 253 | 102 | 90 | 420 | 157 | ||||
| 93855 | mech | 1 | 322 | 133 | 200 | 48 | 110 | 120 | 182 | 53 | 19 | 112 | 46 | 911 | 313 | |
| 93856 | mech | 1 | 331 | 135 | 200 | 47 | 110 | 120 | 190 | 44 | 16 | 96 | 41 | 954 | 269 | |
| 93857 | ESP | 1 | 416 | 160 | 227 | 44 | 134 | 161 | 353 | 74 | 35 | 284 | 13 | 1211 | 229 | |
| 93858 | ESP | 2 | 448 | 168 | 278 | 46 | 144 | 161 | 417 | 100 | 51 | 463 | 13 | 1147 | 246 | |
| 93859 | ESP | 3 | 557 | 191 | 243 | 52 | 180 | 431 | 410 | 134 | 64 | 491 | 14 | 1352 | 207 | |
| 93953 | mech | 1 | 461 | 149 | 111 | 45 | 88 | 178 | 74 | 51 | 57 | 369 | 964 | 365 | ||
| 93954 | mech | 1 | 440 | 151 | 108 | 41 | 121 | 160 | 64 | 45 | 45 | 390 | 928 | 366 | ||
| 93955 | ESP | 1 | 622 | 203 | 132 | 75 | 147 | 271 | 183 | 143 | 218 | dl | 1035 | 327 | ||
| 93956 | ESP | 1 | 639 | 206 | 131 | 74 | 149 | 282 | 174 | 136 | 212 | dl | 1261 | 391 | ||
| 93957 | ESP | 2 | 713 | 233 | 149 | 90 | 173 | 331 | 236 | 179 | 325 | dl | 1297 | 381 | ||
| 93958 | ESP | 2 | 723 | 234 | 148 | 90 | 179 | 322 | 234 | 180 | 325 | dl | 1312 | 384 | ||
| 93959 | ESP | 3 | 814 | 259 | 175 | 96 | 196 | 392 | 289 | 223 | 550 | dl | 1359 | 403 | ||
| 93960 | ESP | 3 | 831 | 265 | 196 | 103 | 210 | 398 | 333 | 215 | 582 | dl | 1254 | 359 | ||
| 94017 | mech | 1 | 374 | 137 | 130 | 44 | 92 | 116 | 81 | 33 | 9 | 64 | 380 | 1500 | 198 | |
| 94018 | mech | 1 | 375 | 136 | 127 | 45 | 89 | 115 | 79 | 44 | 14 | 81 | 376 | 1550 | 277 | |
| 94019 | mech | 1 | 372 | 136 | 127 | 45 | 89 | 119 | 79 | 35 | 10 | 66 | 412 | 1507 | 210 | |
| 94012 | ESP | 1 | 496 | 182 | 149 | 67 | 142 | 190 | 206 | 72 | 22 | 270 | dl | 1767 | 185 | |
| 94013 | ESP | 1 | 480 | 180 | 148 | 66 | 135 | 185 | 202 | 86 | 27 | 312 | dl | 1560 | 214 | |
| 94014 | ESP | 2 | 433 | 214 | 1086 | 67 | 180 | 248 | 233 | 84 | 31 | 249 | dl | 910 | 179 | |
| ppm; Ash Basis | ppm; Whole Sample | |||||||||||||||
| Sample | Type | Row | Nb | Mo | Cd | Sb | Ba | Pb | Th | U | Se | Hg | ||||
| 92645 | ESP | 2 | 29 | 16 | 461 | 391 | 0.45 | |||||||||
| 92646 | ESP | 3 | 21 | 0.52 | ||||||||||||
| 92647 | ESP | 3 | 25 | 17 | 460 | 400 | 0.92 | |||||||||
| 93855 | mech | 1 | 36 | 35 | 1 | 3 | 885 | 74 | ||||||||
| 93856 | mech | 1 | 28 | 37 | 1 | 2 | 875 | 75 | ||||||||
| 93857 | ESP | 1 | 28 | 63 | 1 | 1 | 1029 | 173 | ||||||||
| 93858 | ESP | 2 | 29 | 63 | 1 | 1 | 1107 | 218 | ||||||||
| 93859 | ESP | 3 | 28 | 67 | 1 | 1 | 1349 | 262 | ||||||||
| 93953 | mech | 1 | 140 | dl | 6 | 1139 | 82 | 44 | 16 | 13 | 0.27 | |||||
| 93954 | mech | 1 | 142 | dl | 6 | 1113 | 79 | 45 | 15 | 13 | 0.24 | |||||
| 93955 | ESP | 1 | 122 | dl | dl | 1573 | 149 | 49 | 31 | 61 | 1.36 | |||||
| 93956 | ESP | 1 | 188 | dl | 6 | 1601 | 135 | 46 | 29 | 59 | 1.82 | |||||
| 93957 | ESP | 2 | 193 | 1 | 6 | 1913 | 196 | 47 | 36 | 67 | 1.42 | |||||
| 93958 | ESP | 2 | 195 | 1 | 6 | 1908 | 198 | 48 | 37 | 76 | 1.90 | |||||
| 93959 | ESP | 3 | 209 | 1 | 7 | 2502 | 247 | 50 | 46 | 110 | 2.31 | |||||
| 93960 | ESP | 3 | 168 | 1 | 4 | 2583 | 224 | 43 | 44 | 215 | 0.94 | |||||
| 94017 | mech | 1 | 26 | 120 | dl | 9 | 1726 | 77 | ||||||||
| 94018 | mech | 1 | 40 | 118 | dl | 9 | 1734 | 78 | ||||||||
| 94019 | mech | 1 | 29 | 110 | dl | 8 | 1735 | 73 | ||||||||
| 94012 | ESP | 1 | 25 | 117 | dl | 6 | 2112 | 183 | ||||||||
| 94013 | ESP | 1 | 29 | 103 | dl | 4 | 2010 | 172 | ||||||||
| 94014 | ESP | 2 | 25 | dl | 2 | 8 | 1634 | 150 | ||||||||
| ppm; Ash Basis | |||||||||||||||||||
|---|---|---|---|---|---|---|---|---|---|---|---|---|---|---|---|---|---|---|---|
| Sample | Type | Row | 550 Ash | Sc | Y | La | Ce | Pr | Nd | Sm | Eu | Gd | Tb | Dy | Ho | Er | Tm | Yb | Lu |
| 92645 | ESP | 2 | 90.74 | 26 | 65 | 77 | 168 | 20 | 81 | 17 | 3.4 | 16 | 2.4 | 15 | 2.9 | 7.9 | 1.1 | 6.8 | 0.9 |
| 92646 | ESP | 3 | 93.29 | 10 | 21 | 48 | 112 | 14 | 58 | 12 | 2.3 | 11 | 1.6 | 10 | 1.9 | 5.2 | 0.7 | 4.3 | 0.6 |
| 92647 | ESP | 3 | 91.67 | 14 | 25 | 51 | 126 | 15 | 62 | 12 | 2.5 | 11 | 1.6 | 10 | 1.9 | 5.3 | 0.7 | 4.4 | 0.6 |
| 93855 | mech | 1 | 93.43 | 39 | 81 | 121 | 265 | 31 | 122 | 25 | 4.2 | 23 | 3.4 | 22 | 4.2 | 12.0 | 1.7 | 11.0 | 1.5 |
| 93856 | mech | 1 | 92.44 | 17 | 29 | 70 | 162 | 19 | 78 | 15 | 2.5 | 13 | 1.9 | 12 | 2.3 | 6.5 | 0.9 | 5.7 | 0.8 |
| 93857 | ESP | 1 | 94.89 | 30 | 65 | 82 | 175 | 21 | 83 | 18 | 3.2 | 17 | 2.6 | 17 | 3.3 | 9.3 | 1.3 | 8.9 | 1.2 |
| 93858 | ESP | 2 | 94.50 | 38 | 81 | 93 | 204 | 23 | 96 | 20 | 3.7 | 20 | 3 | 19 | 3.8 | 11.0 | 1.6 | 10.0 | 1.4 |
| 93859 | ESP | 3 | 95.28 | 32 | 66 | 76 | 168 | 19 | 78 | 17 | 3.3 | 17 | 2.6 | 17 | 3.3 | 9.6 | 1.4 | 8.7 | 1.2 |
| 93953 | mech | 1 | 40 | 106 | 117 | 261 | 28 | 110 | 22 | 3.6 | 25 | 3.4 | 19 | 3.9 | 11.0 | 1.6 | 9.9 | 1.5 | |
| 93954 | mech | 1 | 39 | 102 | 117 | 261 | 28 | 110 | 23 | 3.5 | 25 | 3.4 | 19 | 3.8 | 10.7 | 1.6 | 9.5 | 1.5 | |
| 93955 | ESP | 1 | 53 | 129 | 119 | 265 | 29 | 113 | 24 | 4.2 | 27 | 4.0 | 23 | 4.8 | 13.4 | 2.0 | 12.3 | 1.8 | |
| 93956 | ESP | 1 | 52 | 127 | 114 | 252 | 28 | 109 | 22 | 4.0 | 26 | 3.7 | 22 | 4.5 | 12.9 | 1.9 | 11.4 | 1.7 | |
| 93957 | ESP | 2 | 55 | 130 | 113 | 252 | 28 | 109 | 23 | 4.3 | 26 | 3.9 | 22 | 4.6 | 13.2 | 1.9 | 11.7 | 1.8 | |
| 93958 | ESP | 2 | 55 | 133 | 116 | 257 | 28 | 111 | 23 | 4.3 | 27 | 3.9 | 23 | 4.7 | 13.4 | 2.0 | 12.2 | 1.8 | |
| 93959 | ESP | 3 | 57 | 138 | 117 | 259 | 29 | 113 | 24 | 4.6 | 28 | 4.1 | 24 | 5.0 | 14.2 | 2.1 | 12.7 | 1.9 | |
| 93960 | ESP | 3 | 54 | 132 | 110 | 246 | 27 | 106 | 23 | 4.5 | 26 | 3.9 | 23 | 4.7 | 13.5 | 2.0 | 12.0 | 1.8 | |
| 94017 | mech | 1 | 94.41 | 25 | 62 | 88 | 192 | 21 | 87 | 18 | 3.6 | 17 | 2.5 | 16 | 3.0 | 8.6 | 1.2 | 8.0 | 1.1 |
| 94018 | mech | 1 | 93.87 | 39 | 95 | 106 | 218 | 25 | 99 | 20 | 4 | 19 | 2.8 | 18 | 3.4 | 9.5 | 1.4 | 9.0 | 1.2 |
| 94019 | mech | 1 | 92.92 | 24 | 59 | 93 | 198 | 22 | 90 | 18 | 3.7 | 18 | 2.6 | 16 | 3.1 | 8.9 | 1.3 | 8.3 | 1.1 |
| 94012 | ESP | 1 | 92.50 | 28 | 61 | 84 | 180 | 20 | 81 | 17 | 3.4 | 17 | 2.5 | 16 | 3.1 | 8.7 | 1.2 | 8.0 | 1.1 |
| 94013 | ESP | 1 | 92.18 | 34 | 75 | 95 | 207 | 23 | 95 | 20 | 4.1 | 20 | 2.9 | 19 | 3.7 | 10.0 | 1.5 | 9.6 | 1.3 |
| 94014 | ESP | 2 | 87.69 | 26 | 54 | 76 | 156 | 18 | 72 | 15 | 3.2 | 15 | 2.2 | 14 | 2.8 | 7.9 | 1.1 | 7.2 | 1.0 |
| UCC-Normalized REE | ||||||||||||||||
|---|---|---|---|---|---|---|---|---|---|---|---|---|---|---|---|---|
| La | Ce | Pr | Nd | Sm | Eu | Gd | Tb | Dy | Ho | Er | Tm | Yb | Lu | |||
| Sample | Type | Row | 30 | 64 | 7.1 | 26 | 4.5 | 0.9 | 3.8 | 0.6 | 3.5 | 0.8 | 2.3 | 0.3 | 2.2 | 0.32 |
| 92645 | ESP | 2 | 2.57 | 2.63 | 2.82 | 3.12 | 3.78 | 3.86 | 4.21 | 4.00 | 4.29 | 3.63 | 3.43 | 3.67 | 3.09 | 3.00 |
| 92646 | ESP | 3 | 1.60 | 1.75 | 1.97 | 2.23 | 2.67 | 2.61 | 2.89 | 2.67 | 2.86 | 2.38 | 2.26 | 2.33 | 1.95 | 2.00 |
| 92647 | ESP | 3 | 1.70 | 1.97 | 2.11 | 2.38 | 2.67 | 2.84 | 2.89 | 2.67 | 2.86 | 2.38 | 2.30 | 2.33 | 2.00 | 2.00 |
| 93855 | mech | 1 | 4.03 | 4.14 | 4.37 | 4.69 | 5.56 | 4.77 | 6.05 | 5.67 | 6.29 | 5.25 | 5.22 | 5.67 | 5.00 | 5.00 |
| 93856 | mech | 1 | 2.33 | 2.53 | 2.68 | 3.00 | 3.33 | 2.84 | 3.42 | 3.17 | 3.43 | 2.88 | 2.83 | 3.00 | 2.59 | 2.67 |
| 93857 | ESP | 1 | 2.73 | 2.73 | 2.96 | 3.19 | 4.00 | 3.64 | 4.47 | 4.33 | 4.86 | 4.13 | 4.04 | 4.33 | 4.05 | 4.00 |
| 93858 | ESP | 2 | 3.10 | 3.19 | 3.24 | 3.69 | 4.44 | 4.20 | 5.26 | 5.00 | 5.43 | 4.75 | 4.78 | 5.33 | 4.55 | 4.67 |
| 93859 | ESP | 3 | 2.53 | 2.63 | 2.68 | 3.00 | 3.78 | 3.75 | 4.47 | 4.33 | 4.86 | 4.13 | 4.17 | 4.67 | 3.95 | 4.00 |
| 93953 | mech | 1 | 3.90 | 4.07 | 3.97 | 4.23 | 4.96 | 4.09 | 6.54 | 5.34 | 5.53 | 4.93 | 4.78 | 4.83 | 4.49 | 3.42 |
| 93954 | mech | 1 | 3.89 | 4.08 | 3.98 | 4.23 | 5.03 | 4.00 | 6.53 | 5.23 | 5.44 | 4.75 | 4.65 | 4.70 | 4.31 | 3.40 |
| 93955 | ESP | 1 | 3.97 | 4.14 | 4.08 | 4.36 | 5.27 | 4.75 | 7.17 | 6.19 | 6.62 | 5.96 | 5.82 | 5.96 | 5.60 | 4.21 |
| 93956 | ESP | 1 | 3.79 | 3.94 | 3.90 | 4.18 | 4.99 | 4.51 | 6.94 | 5.85 | 6.22 | 5.62 | 5.59 | 5.62 | 5.16 | 4.03 |
| 93957 | ESP | 2 | 3.77 | 3.94 | 3.92 | 4.20 | 5.12 | 4.87 | 6.97 | 6.02 | 6.42 | 5.77 | 5.75 | 5.86 | 5.32 | 4.08 |
| 93958 | ESP | 2 | 3.86 | 4.01 | 3.99 | 4.28 | 5.16 | 4.93 | 7.14 | 6.08 | 6.52 | 5.90 | 5.83 | 5.96 | 5.53 | 4.18 |
| 93959 | ESP | 3 | 3.89 | 4.04 | 4.06 | 4.34 | 5.27 | 5.23 | 7.35 | 6.40 | 6.91 | 6.25 | 6.19 | 6.29 | 5.76 | 4.41 |
| 93960 | ESP | 3 | 3.67 | 3.85 | 3.82 | 4.09 | 5.02 | 5.10 | 6.96 | 6.05 | 6.52 | 5.90 | 5.86 | 5.94 | 5.47 | 4.23 |
| 94017 | mech | 1 | 2.93 | 3.00 | 2.96 | 3.35 | 4.00 | 4.09 | 4.47 | 4.17 | 4.57 | 3.75 | 3.74 | 4.00 | 3.64 | 3.67 |
| 94018 | mech | 1 | 3.53 | 3.41 | 3.52 | 3.81 | 4.44 | 4.55 | 5.00 | 4.67 | 5.14 | 4.25 | 4.13 | 4.67 | 4.09 | 4.00 |
| 94019 | mech | 1 | 3.10 | 3.09 | 3.10 | 3.46 | 4.00 | 4.20 | 4.74 | 4.33 | 4.57 | 3.88 | 3.87 | 4.33 | 3.77 | 3.67 |
| 94012 | ESP | 1 | 2.80 | 2.81 | 2.82 | 3.12 | 3.78 | 3.86 | 4.47 | 4.17 | 4.57 | 3.88 | 3.78 | 4.00 | 3.64 | 3.67 |
| 94013 | ESP | 1 | 3.17 | 3.23 | 3.24 | 3.65 | 4.44 | 4.66 | 5.26 | 4.83 | 5.43 | 4.63 | 4.35 | 5.00 | 4.36 | 4.33 |
| 94014 | ESP | 2 | 2.53 | 2.44 | 2.54 | 2.77 | 3.33 | 3.64 | 3.95 | 3.67 | 4.00 | 3.50 | 3.43 | 3.67 | 3.27 | 3.33 |
| Sample | Type | Row | EuN/EuN* | CeN/CeN* | GdN/GdN* | dist. | REE | REY | REYSc | LREE/HREE |
|---|---|---|---|---|---|---|---|---|---|---|
| 92645 | ESP | 2 | 1.00 | 0.98 | 1.07 | H | 419 | 484 | 510 | 6.44 |
| 92646 | ESP | 3 | 0.98 | 0.98 | 1.09 | H | 282 | 303 | 313 | 6.49 |
| 92647 | ESP | 3 | 1.07 | 1.03 | 1.09 | H | 304 | 329 | 343 | 7.00 |
| 93855 | mech | 1 | 0.85 | 0.99 | 1.08 | H | 647 | 728 | 767 | 6.80 |
| 93856 | mech | 1 | 0.87 | 1.01 | 1.06 | H | 390 | 419 | 436 | 7.54 |
| 93857 | ESP | 1 | 0.88 | 0.96 | 1.06 | H | 443 | 508 | 538 | 5.94 |
| 93858 | ESP | 2 | 0.91 | 1.01 | 1.09 | H | 510 | 591 | 629 | 5.93 |
| 93859 | ESP | 3 | 0.95 | 1.01 | 1.08 | H | 422 | 488 | 520 | 5.59 |
| 93953 | mech | 1 | 0.80 | 1.04 | 1.25 | L | 617 | 723 | 763 | 6.80 |
| 93954 | mech | 1 | 0.79 | 1.04 | 1.26 | L | 616 | 719 | 758 | 6.93 |
| 93955 | ESP | 1 | 0.85 | 1.03 | 1.22 | H | 643 | 772 | 825 | 5.92 |
| 93956 | ESP | 1 | 0.86 | 1.03 | 1.25 | H | 613 | 740 | 792 | 5.95 |
| 93957 | ESP | 2 | 0.90 | 1.03 | 1.22 | H | 616 | 746 | 800 | 5.81 |
| 93958 | ESP | 2 | 0.90 | 1.02 | 1.24 | H | 628 | 761 | 816 | 5.81 |
| 93959 | ESP | 3 | 0.93 | 1.02 | 1.22 | H | 638 | 775 | 833 | 5.60 |
| 93960 | ESP | 3 | 0.95 | 1.03 | 1.22 | H | 604 | 737 | 791 | 5.59 |
| 94017 | mech | 1 | 1.01 | 1.02 | 1.09 | H | 467 | 529 | 554 | 6.66 |
| 94018 | mech | 1 | 1.01 | 0.97 | 1.09 | H | 536 | 631 | 670 | 6.85 |
| 94019 | mech | 1 | 1.02 | 1.00 | 1.12 | H | 484 | 543 | 567 | 6.68 |
| 94012 | ESP | 1 | 0.99 | 1.00 | 1.11 | H | 443 | 504 | 532 | 6.26 |
| 94013 | ESP | 1 | 1.02 | 1.01 | 1.12 | H | 512 | 587 | 621 | 6.10 |
| 94014 | ESP | 2 | 1.06 | 0.96 | 1.11 | H | 391 | 445 | 471 | 6.19 |
Publisher’s Note: MDPI stays neutral with regard to jurisdictional claims in published maps and institutional affiliations. |
© 2022 by the authors. Licensee MDPI, Basel, Switzerland. This article is an open access article distributed under the terms and conditions of the Creative Commons Attribution (CC BY) license (https://creativecommons.org/licenses/by/4.0/).
Share and Cite
Hower, J.C.; Groppo, J.G.; Hopps, S.D.; Morgan, T.D.; Hsu-Kim, H.; Taggart, R.K. Coal Feed-Dependent Variation in Fly Ash Chemistry in a Single Pulverized-Combustion Unit. Minerals 2022, 12, 1071. https://0-doi-org.brum.beds.ac.uk/10.3390/min12091071
Hower JC, Groppo JG, Hopps SD, Morgan TD, Hsu-Kim H, Taggart RK. Coal Feed-Dependent Variation in Fly Ash Chemistry in a Single Pulverized-Combustion Unit. Minerals. 2022; 12(9):1071. https://0-doi-org.brum.beds.ac.uk/10.3390/min12091071
Chicago/Turabian StyleHower, James C., John G. Groppo, Shelley D. Hopps, Tonya D. Morgan, Heileen Hsu-Kim, and Ross K. Taggart. 2022. "Coal Feed-Dependent Variation in Fly Ash Chemistry in a Single Pulverized-Combustion Unit" Minerals 12, no. 9: 1071. https://0-doi-org.brum.beds.ac.uk/10.3390/min12091071