
Numerical Simulation Study of the Effect of Fine View Pore Structure on Rock Burst

Key-Laboratory of In-Situ Property-Improving Mining of Ministry of Education, Taiyuan University of Technology, Taiyuan 030024, China
*
Author to whom correspondence should be addressed.
Minerals 2023, 13(2), 146; https://0-doi-org.brum.beds.ac.uk/10.3390/min13020146
Submission received: 1 December 2022
/
Revised: 4 January 2023
/
Accepted: 10 January 2023
/
Published: 18 January 2023
(This article belongs to the Topic Mining Safety and Sustainability)
Abstract
:With the gradual shift of coal mining to deeper levels in recent years, rock burst has become one of the primary dynamic hazards faced in deep mining. It has been shown that the pore structure in rocks affects the mechanical properties, but the relationship with the rock burst phenomenon still needs to be clarified. In this paper, we investigated the causes and effects of pore structure on impact mechanical properties using RFPA2D numerical simulation software, established several numerical models with different porosities and pore diameters, and analyzed the stress-strain curves, the relationships between porosity and pore diameter and each the bursting liability indices of the coal rock body were elaborated, and the fitting equations in the range of porosity (0%~10%) and pore diameter (0.25~2.0 mm) were obtained. The results showed that the increase in porosity and pore diameter effectively attenuated the bursting ability of coal rocks, which has some reference significance for the study of early warning and prevention of rock burst phenomenon.
1. Introduction
As a typical dynamic disaster in the coal mining process, rock burst involves the release of a large amount of energy, making it very likely to cause casualties, equipment damage, and roadway deformation, thus posing a severe threat to coal mine safety [1,2,3,4,5,6]. Over the years, many scholars have conducted in-depth studies on the mechanism underlying the occurrence of rock burst phenomena, and scholars from Germany, the Soviet Union, and Poland have proposed strength theory [7], stiffness theory [8,9,10], energy theory [11,12,13], and bursting liability theory [14,15,16], thus laying the theoretical cornerstone for explaining rock burst phenomena. On this basis, researchers have studied the mechanism and prediction of rock burst, in terms of coal rock body strength, stress, energy, brittleness index, and critical depth, and have made progress in this regard [17,18,19,20,21,22,23,24,25,26,27]. Proposed evaluation indices and methods to measure whether coal rock is liable to burst, and the associated probability have significantly impacted the study of early warning prediction for rock burst dynamic hazard.
As a natural porous mineral, the large number of pore structures inside the coal rock body directly affect its macroscopic physical and mechanical properties. Therefore, it is of great practical significance to explore the intrinsic connection between the pore structure and the macroscopic mechanical properties of coal rock for the early warning and prevention of rock burst in mines. To date, many scholars have studied the influence of pore structure characteristics on the macroscopic physical and mechanical properties of rocks, and many results have been obtained. For example, Al-Harthi et al. [28] determined the porosity of porous basalt using image analysis techniques, and they established the relationships between uniaxial compressive strength, elastic modulus, and Poisson’s ratio of basalt with porosity. Palchik [29] developed an empirical model based on experiments, in order to predict the coupled effects of porosity, elastic modulus, and grain size on the uniaxial compressive strength in high-porosity soft sandstones (27%–47% porosity). Chang et al. [30] established an empirical equation for the relationship between compressive strength and pore content for rocks without lateral confinement using an experimental approach. Nambiar et al. [31] investigated the effect of factors such as pore size on strength and found that materials with smaller pore sizes were more robust. Schaefer et al. [32] investigated the effects of porosity and pore shape characteristics on the engineering properties and mechanical strength of basalt specimens from Pacaya volcano (Guatemala) using an experimental method. Hilal et al. [33] argued that larger volumes of pores in materials are more likely to be connected when subjected to external forces, reducing the material’s strength significantly. Jamshidi, A et al. [34] find out the effect of density and porosity on the correlation between Uniaxial compressive strength and P-wave velocity of eighteen limestone samples by multivariate regression analysis. He et al. [35] showed that the pore size and distribution affect the material’s physical and mechanical properties to a large extent. Namiki, A et al. [36] measured the rheology and strength of high porosity rhyolitic magma at 500–950 degrees C, measurements show that the elastic energy originated by deformations avoids attenuation and is stored in the bubbly magma until released by fracturing. Hughes, A et al. [37] use variably porous synthetic glass samples (8, 19, and 30% porosity) to explore the frictional behavior and development of wear in geomaterials at low normal stresses (≤1 MPa), it was concluded that the porosity of the material, and the resulting coefficient of friction, work, and wear rate, can influence slip dynamics in events such as shallow crustal faults or mass movements. Mineo, S et al. [38] prediction of rock porosity through infrared thermography for non-destructive testing procedures for natural stones and prediction equations were developed from statistical analysis, establishing a standardized, non-destructive, and quick alternative to the common procedures currently used in the laboratory for measuring porosity. Zengin, E et al. [39] investigated the effect of porosity and pore parameters on rock materials’ failure behavior using experimental approaches involving unconfined and confined stress conditions.
Physical experiments are undoubtedly the most direct method to study the relationship between pore structure characteristics and rock mechanical properties; however, the non-homogeneity of the microstructure and the complexity of the pore structure in coal and rock masses prevent large-scale parametric investigations. In contrast, numerical techniques have been shown to be a powerful tool for studying the mechanics of sub-surface rocks [40].
Bubeck et al. [41] determined the shape characteristics of pores in rocks using CT scanning techniques and investigated the effect of different pore shapes on the strength of rocks using numerical simulation methods. Griffiths et al. [42] used RFPA2D software to investigate the effect of pores with different shapes and distribution orientations on the mechanical behavior of rocks under uniaxial compression test conditions. Obara et al. [43] developed a fine-scale numerical model of concrete and jointed rock masses using CT scanning techniques, and they conducted numerical tests to study the damage characteristics of the specimens. Heap et al. [44] investigated the effect of porosity and pore shape on the brittle strength of volcanic rocks under compressive loading conditions using numerical experimental methods. Nguyen et al. [45] proposed the use of a combined numerical and experimental method to characterize the mechanical behavior of concrete. They showed that the pore distribution has a negligible effect on the bearing capacity of the material. Zhu et al. [46] studied the static compressive strength of PMMA microporous foam materials and found that porosity had the most significant effect on the static compressive strength. Zhang et al. [47] found that reducing a foam material’s porosity or pore size can increase its compressive strength through experimental tests and finite element model (FEM) simulations. Wang et al. [48,49] used a Monte Carlo method to generate a random aggregate structure combined with a finite element method to simulate the crack expansion process in concrete materials; furthermore, the effects of different pore structure characteristics on the damage pattern, peak strength, and crack expansion pattern of Brazilian disc specimens were investigated using the RFPA3D software. Liang et al. [50,51] used RFPA3D finite element software to construct a direct tensile numerical model that can characterize the three-dimensional fine-scale pore structure of basalt, and they investigated the effects of rock inhomogeneity and pre-existing defects on three-dimensional crack generation and extension. Yuexiang Lin et al. [52] proposed a systematic approach for generating stochastic void geometry with controllable shape features, the effects of the void morphology, including the void aspect ratio, orientation and their coupling effects, on the mechanical and fracturing behaviors of porous rocks are discussed.
Although the studies mentioned above have elucidated the laws of the influence of pore structure on mechanical rock properties from different perspectives and with various methods, few scholars have established a link between the pore structure and bursting liability of coal rock bodies, and few studies have constructed mathematical relationships between the pore structure characteristics of coal rock and bursting liability indices.
In this paper, focusing on the intrinsic factors of rock burst in coal bodies, based on indicators to determine whether a coal body possesses bursting liability or not, numerical simulation experiments were conducted regarding the uniaxial compressive strength, impact energy index, and elastic energy index of a coal rock model by establishing numerical models with different porosity and pore size. In this way, we could explore the relationship between the impact damage index of a coal body and its pore structure, in order to derive the influence law and mathematical relationship between different pore structures and impact mechanical properties. This paper provides theoretical reference for early warning, as well as prevention and control, of rock burst phenomena.
2. Establishment of the Numerical Model
For a natural mineral, non-homogeneity is a fundamental characteristic, which is manifested by the varying composition and the inhomogeneity of particle size and location distribution, the complex and various connection methods, and the difference in the mechanical properties of internal elements under the action of external load leading to the inhomogeneous distribution of stress and displacement fields, affecting the damage and rupture evolution process in coal rock. The calculation method of RFPA numerical simulation software is based on the finite element theory, and the simulation of non-homogeneity of natural rock-like materials is realized by embedding statistical distribution functions, and the numerical model established can highly restore the mechanical properties of natural minerals. When subjected to load, the damage occurs when the stress of the internal element reaches the Mohr-Coulomb damage criterion, the stiffness of the damaged unit is degraded, and the change of mechanical properties in the damaged unit is irreversible so that the numerical simulation of the damage process of non-homogeneous materials is realized so that the RFPA numerical simulation software can restore the damage process of the original coal body under load to a high degree. In this paper, the relationship between the impact damage index of a coal body and the pore structure in a coal rock body is investigated in the form of numerical simulation by setting different porosity and pore size based on the indexes for determining the impact propensity of coal body and using RFPA2D numerical simulation software. The influence law of different pore structures on their impact mechanical properties is derived from providing the theoretical basis for the early warning and prevention of impact ground pressure phenomenon.
2.1. Parameters and Boundary Conditions of the Coal Rock Model
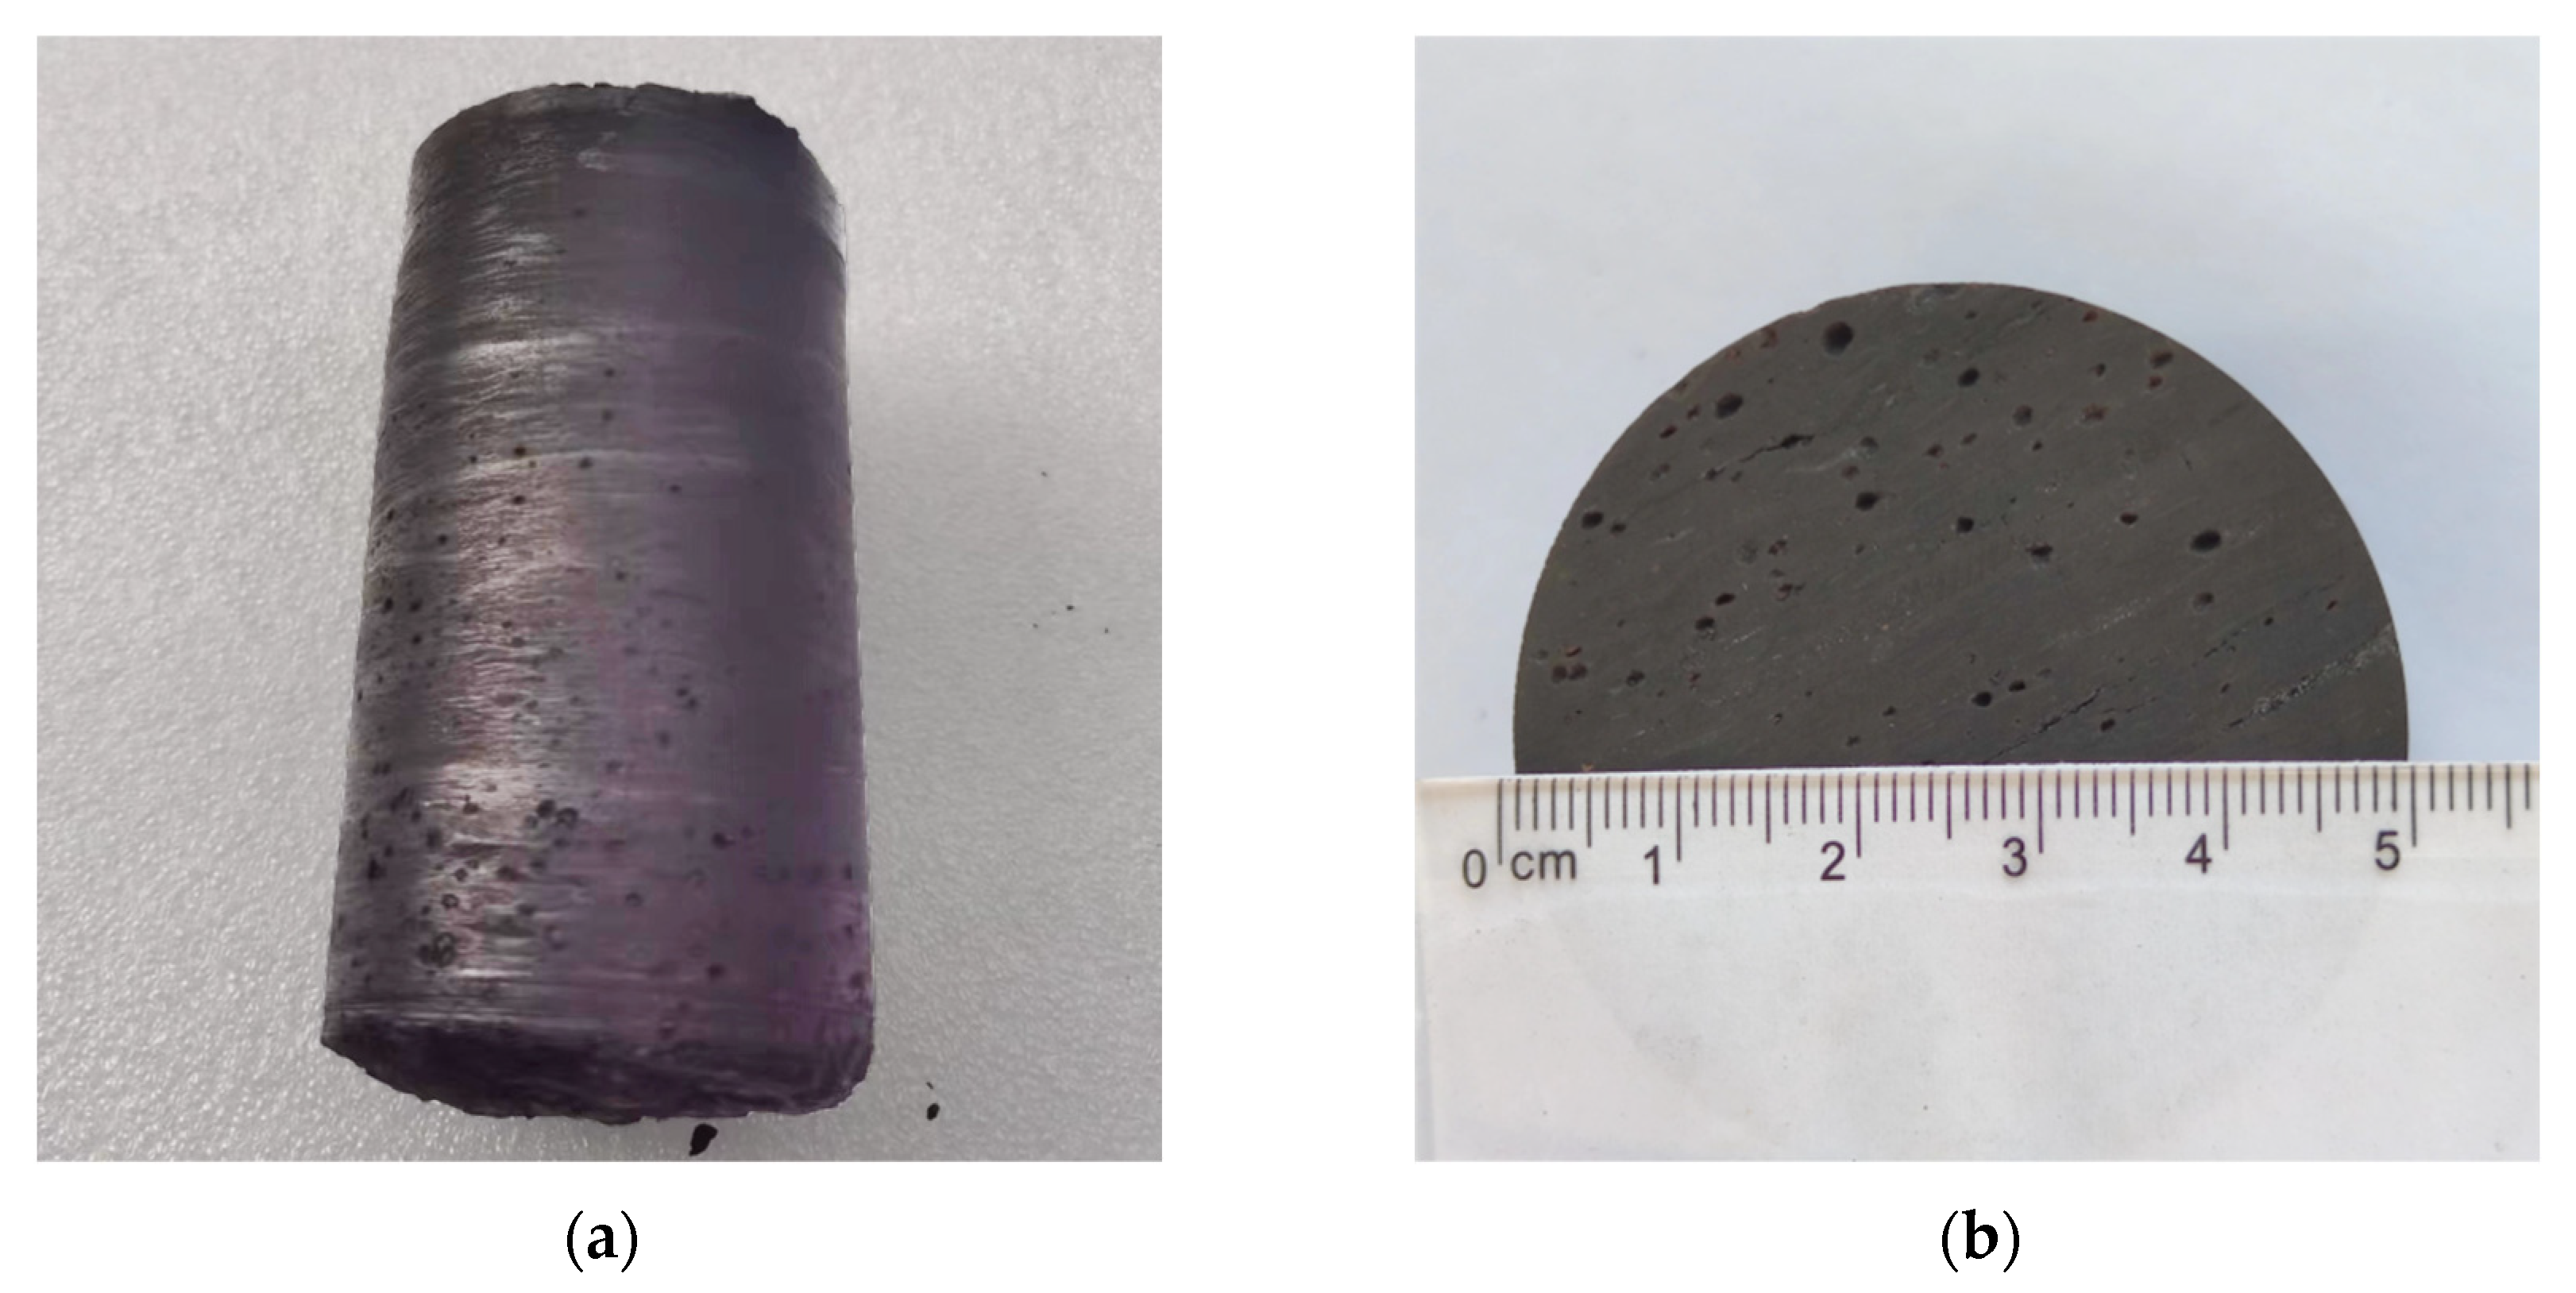
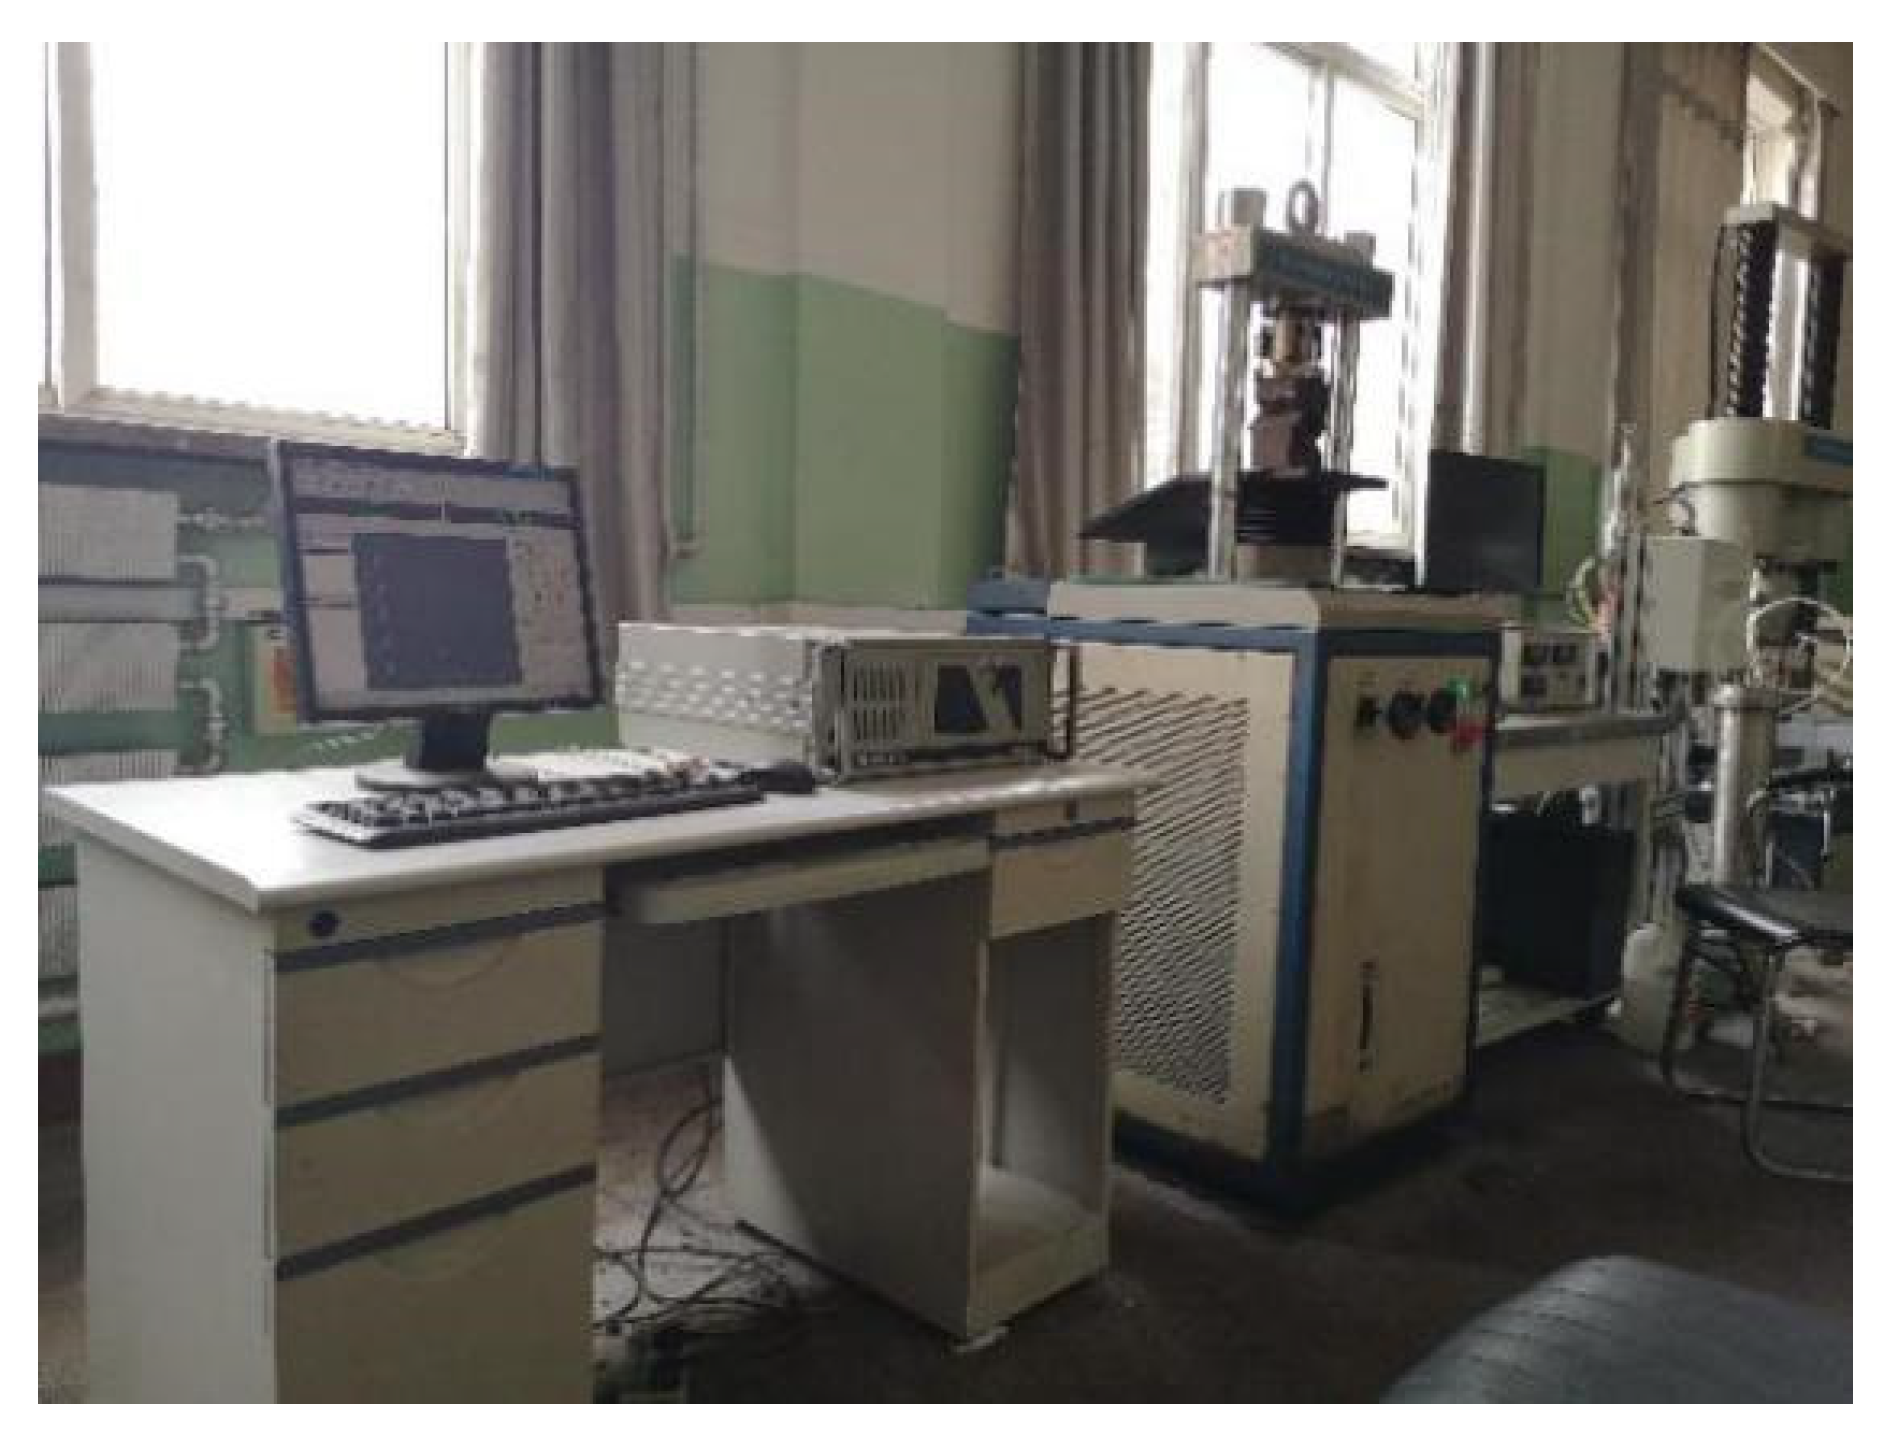
The experimental coal samples were selected from a mine in Shanxi Province. During the field survey, it was found that the two gangs of the roadway were shifted to a high degree, the bottom drum phenomenon was obvious, and the mine pressure appeared to be serious, which hinted at the potential of impact phenomena, posing a safety hazard to both equipment and personnel. Figure 1 shows the photos of the coal samples taken in the field, and it can be seen that there are a large number of pore structures in the specimens. The physical and mechanical properties of coal samples were tested by using WDW-100 kN microcomputer-controlled electronic universal testing machine (Figure 2), and the test results are shown in Table 1.
The macroscopic mechanical parameters measured in the laboratory were converted into exemplary parameters, according to the RFPA2D macroscopic conversion formula, and the physical and mechanical parameters of the pore structure were set as detailed in Table 2.
In order to numerically simulate the experimental conditions, the coal rock model size was set as a rectangular section of 100 mm × 50 mm, as shown in Figure 3, and 200 × 100 = 20,000 quadrilateral cells of the same size were used to discretize and mesh the model. The Mohr-Coulomb strength criterion can reflect the strength properties of rocks more comprehensively (e.g., the tensile strength of rocks and soils is much smaller than the compressive strength), so the Mohr-Coulomb strength criterion is chosen to simulate the coal rock model for the experiments.
The simulated experiment used a plane strain model, the loading type was set to displacement loading, and the side of the model was a free surface without enclosing pressure. When loading, an axial load with a single step increment of 0.01 mm was applied to the upper end of the specimen, and the specimen was continuously loaded it was damaged.
2.2. Setting of Pore Position
The principle of using C language to generate random numbers is as follows: ① Set the random number seed, time(null), to get the time stamp, representing the current time from January 1, 1970, (in terms of how many seconds), as a way to obtain a changing number. The unsigned int time(null) is then used to obtain the value of an unsigned integer, for which the statement srand ((unsigned int)time(null)) is used to convert the return value of time(null) into an unsigned integer to provide a seed for the next operation. ② Obtain a random number using the rand() function, taking the seed provided by srand() as a reference to some recursive formula to derive the result, as the seed value can be considered to be random. The random number changes: rand()%x takes the remainder to control the range of the random number it produces as [0,x−1]. The random pore coordinates can be obtained by randomly generating values for the horizontal and vertical coordinates of the specimen separately.
3. Analysis of the Rupture Process of the Uniaxially Compressed Coal Rock Body
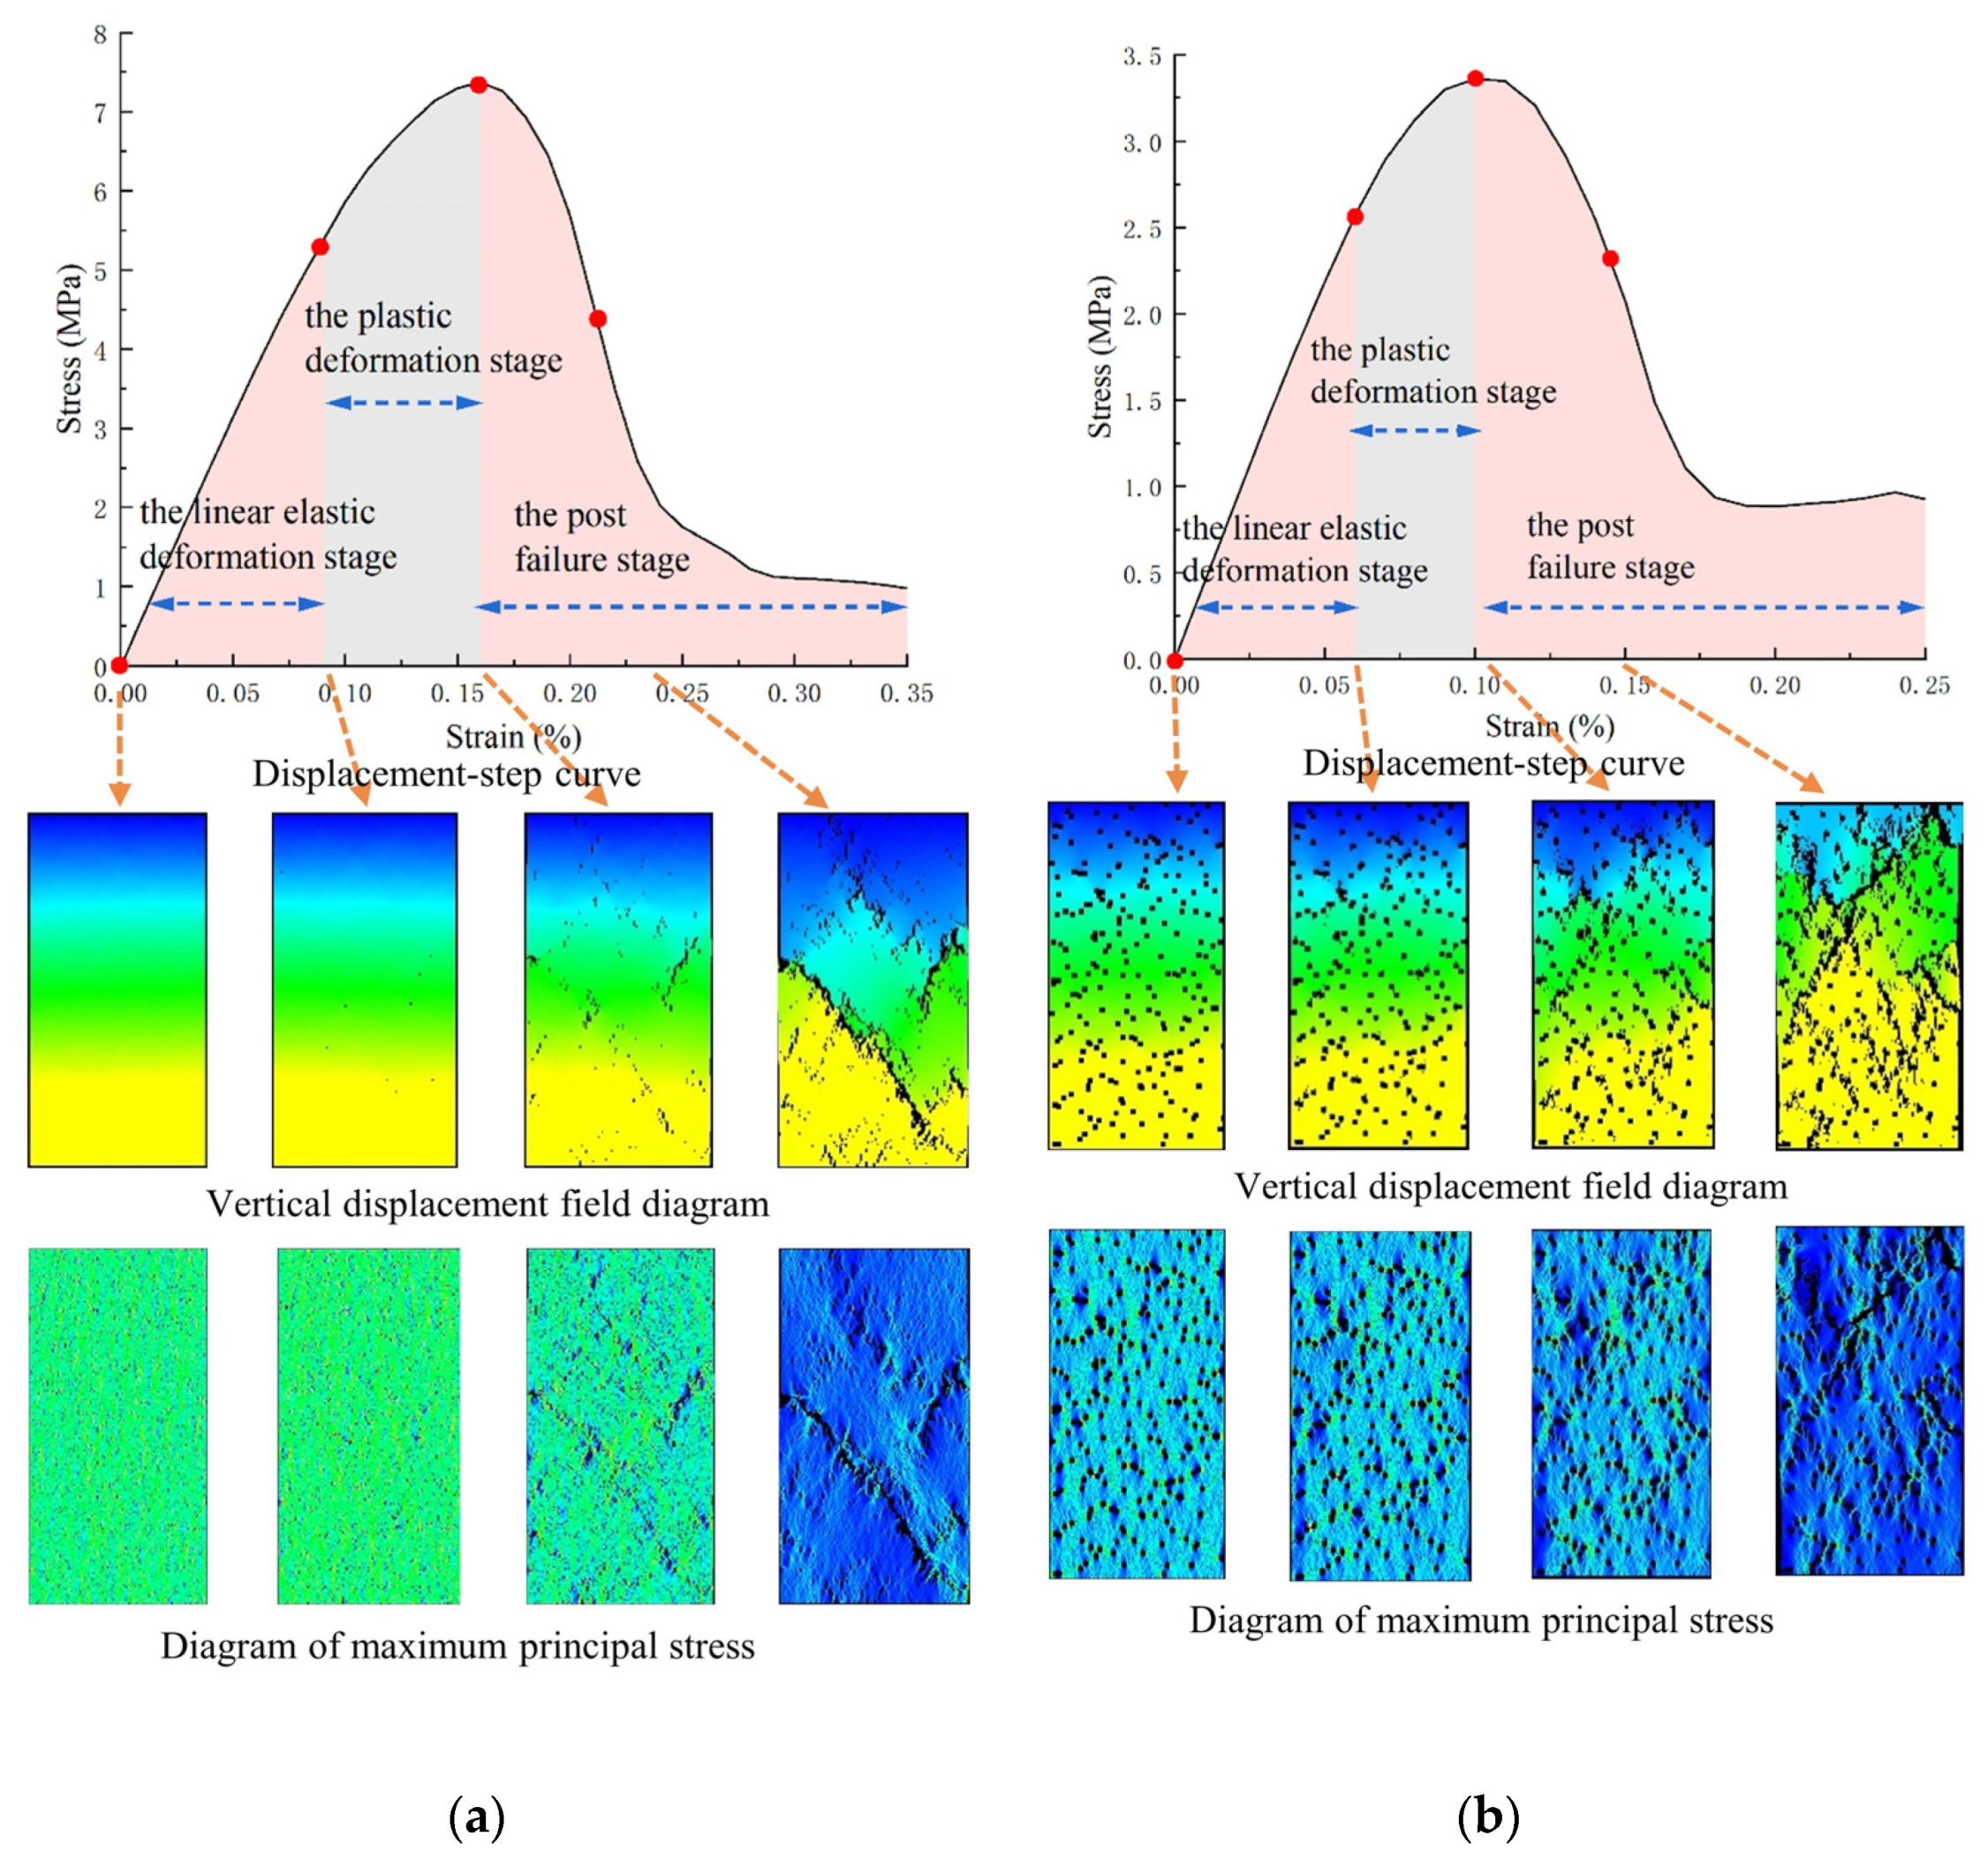
Figure 4 compares the loading process of specimens with 10% porosity and 1.5 mm pore size with that of specimens without pores. By analyzing the evolution law of the stress and displacement fields corresponding to different stress–strain stages, the effect of pore structure on the mechanical properties of specimens can be determined.
It can be seen from Figure 4 that there is no significant change in stress in Figure 4a during the online elastic deformation stage. In contrast, the pore structure in the model of Figure 4b makes the rupture process change significantly. In the linear elastic deformation stage, the stress concentration phenomenon in Figure 4b appears around the pores; the denser the distribution of pores, the more pronounced the stress concentration phenomenon. The AE event rate variation caused by small piece collapsed defects was also noted by Dong et al. [53] in acoustic emission (AE) experiments on granite samples. With further loading, the stress concentration area around the pores gradually expands to form a stress concentration zone. In contrast, the stress concentration zone in the specimen without pores is not apparent. After entering the plastic stage, an evident destabilization phenomenon occurs in the matrix element around the pores in Figure 4b. The stress concentration generated at the crack tip leads to its expansion. After reaching the peak stress point, a central fracture zone is formed, and the stress field rapidly completes re-distribution.
Comparing the displacement field evolution process of two different pore feature models, it can be concluded that, in the linear elastic deformation stage, the displacement field distribution of the specimen without pores is relatively uniform, while the pore structure in Figure 4b has a specific influence on the local displacement field of the specimen. After entering the plastic deformation stage, the destabilized primitives gradually interconnect with each other to form macroscopic cracks, and the distribution of the displacement field changes, with the high displacement area expanding toward the pore aggregation part, thus profoundly affecting the location of crack generation. After reaching the peak stress point, the displacement field quickly completes re-distribution. You et al. [54] used the discrete element method to analyze the damage process of the cubic specimen, and the stress and crack evolution patterns were similar to the results in Figure 4, which also supports the reliability of the experiments in this paper.
It was concluded, from the analysis, that the parts with a higher degree of pore aggregation are potential rupture locations, and the areas around pores form unsafe zones, which are prone to stress concentration, leading to destabilization of the matrix element and the alteration of its mechanical properties. The evolution of the displacement field corresponds to the development of damage deformation inside the model [55]. With continued loading, the cracks around the pores gradually interconnect to form macroscopic cracks, eventually leading to loss of the load-bearing capacity of the specimen.
As can be seen from Figure 4, the strain interval corresponding to the elastic deformation stage of the specimen without pores is (0, 0.09), while the strain interval corresponding to the elastic deformation stage of the specimen with pores is (0, 0.06), which indicates that the pore structure in the specimen makes it easier to produce plastic deformation during the loading process, and the ability of the specimen to accumulate energy in the elastic deformation stage is weakened; in the plastic deformation stage, although The strain intervals corresponding to the plastic deformation stages of the two specimens in Figure 4a,b are (0.09, 0.16) and (0.06, 0.1), respectively, and the non-porous specimen still accumulates a large amount of energy in the plastic deformation stage, which indicates that the pore structure in the specimen weakens its ability to accumulate energy in the plastic deformation stage. In summary, the pore structure in the specimen can greatly reduce its ability to accumulate energy during the plastic deformation stage, and the specific reasons and laws will be discussed in Section 4.2.
4. Impact Damage Index Analysis of Pore Coal Rock Mass
4.1. Uniaxial Compressive Strength Analysis
Uniaxial compressive strength is the load per unit area in the unconfined rock specimen when damage occurs under axial force. Statistical studies have found that uniaxial compressive strength has a good correlation with dynamic damage time, elastic energy index, and impact energy index, and an increase in uniaxial compressive strength of coal rocks often increases their bursting liability substantially, which reveals the interaction between the bursting liability of coal rocks and strength.
4.1.1. Analysis of the Influence Law of Pore Structure on Compressive Strength
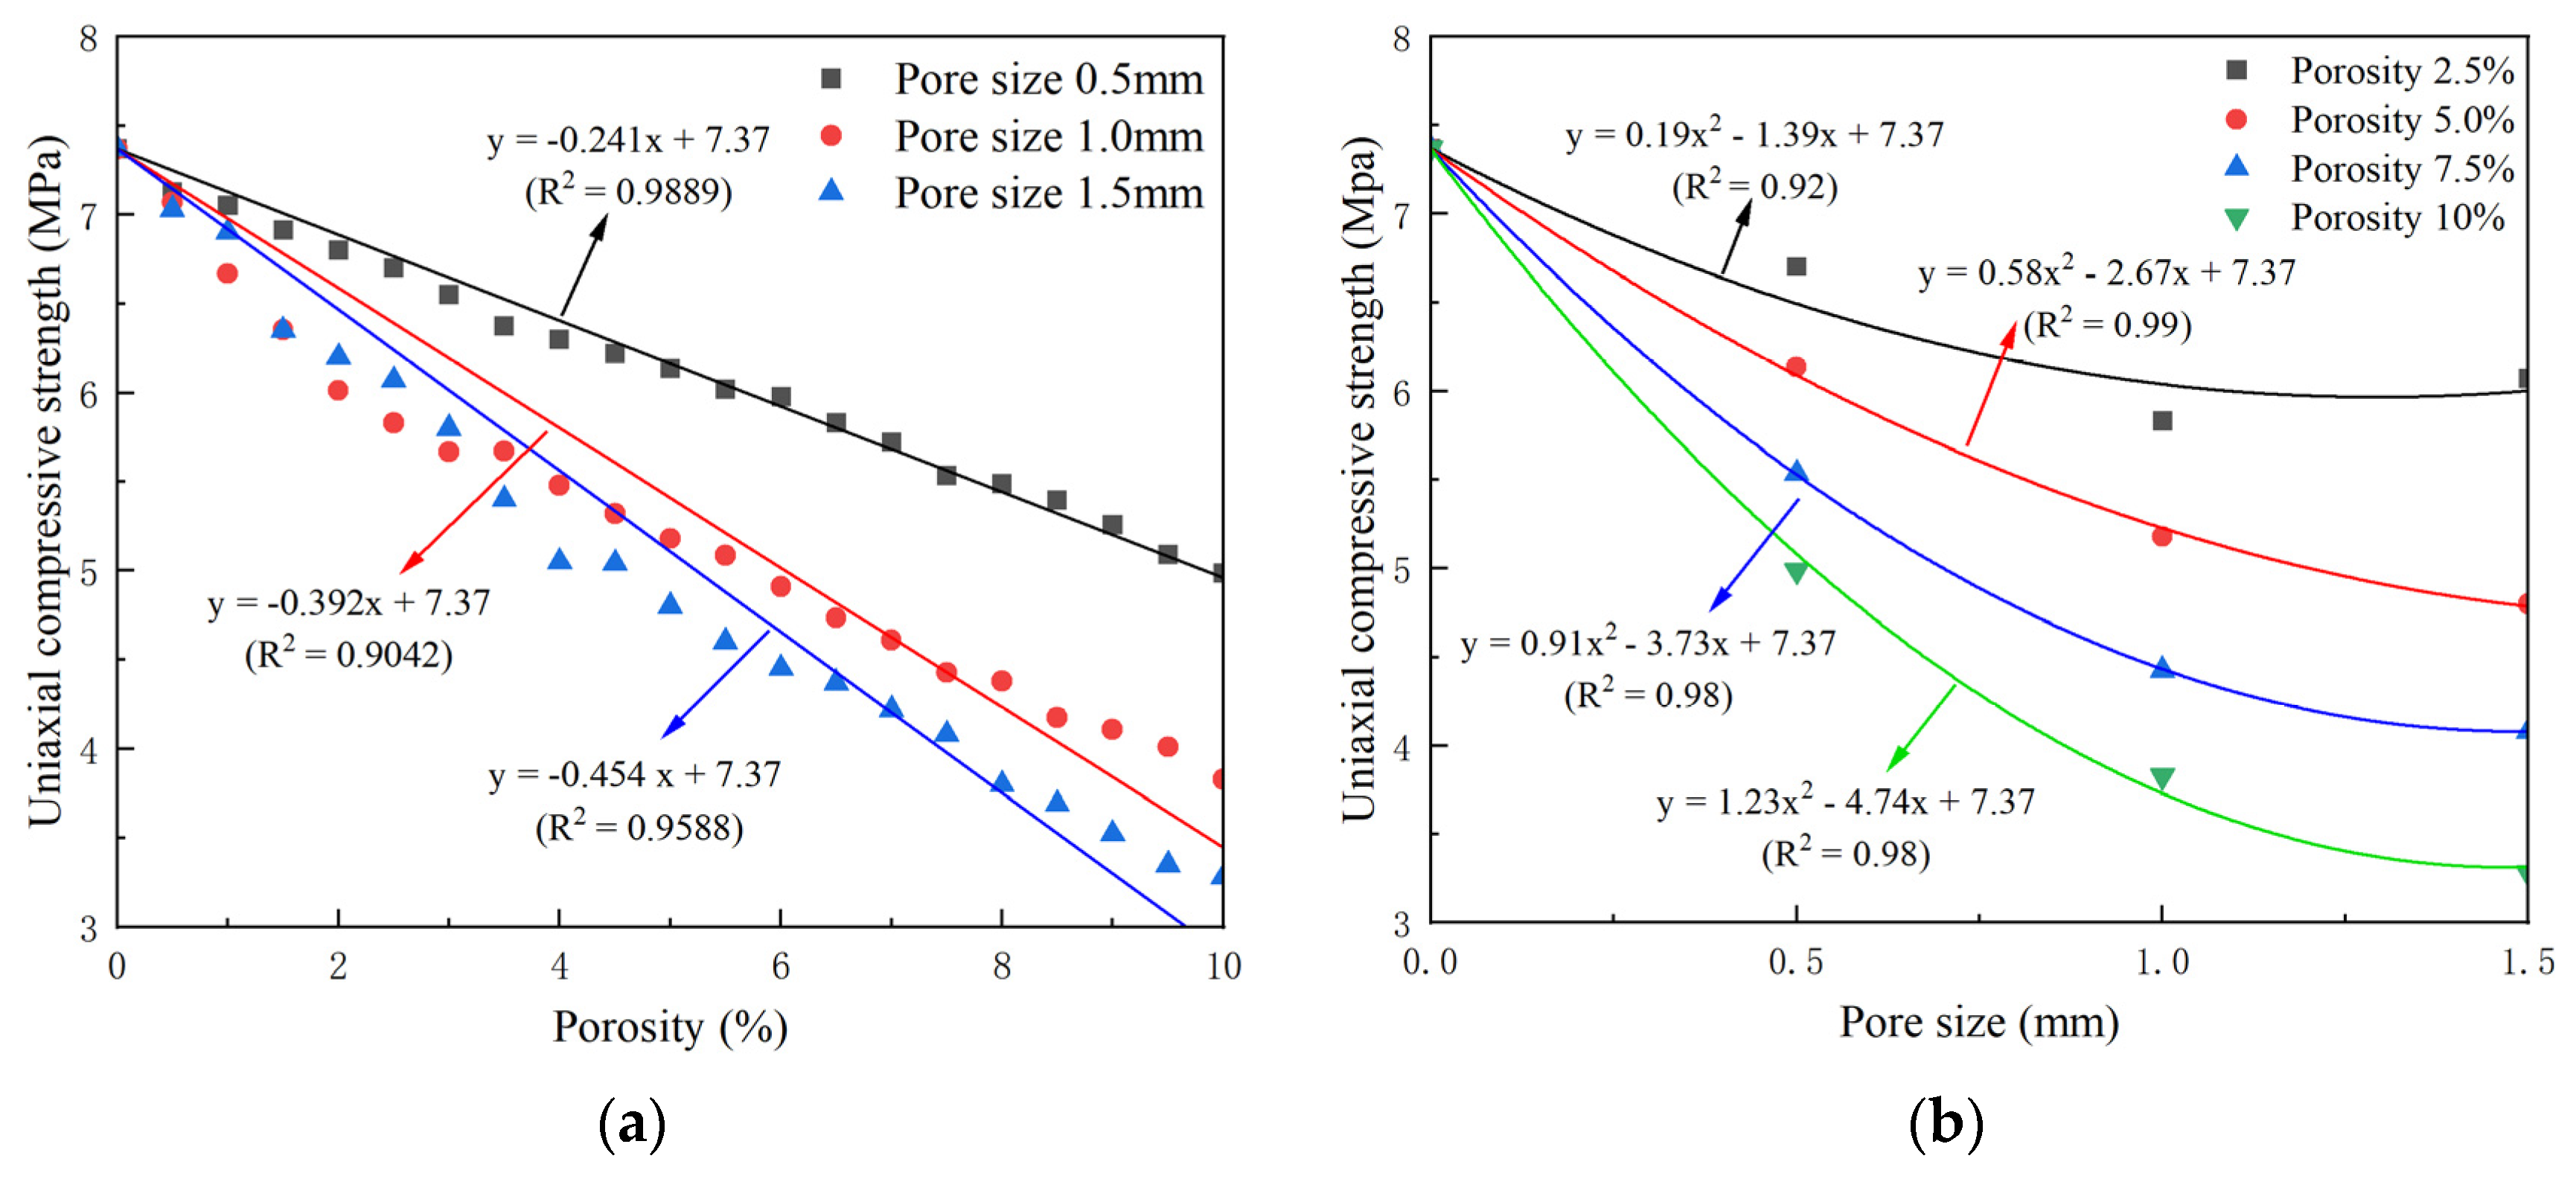
Figure 5 shows the change curve for the compressive strength of specimens under different pore characteristics. Figure 5a visually reflects the action law of porosity on the compressive strength of specimens under different pore sizes. It can be seen that the uniaxial compressive strength of specimens decreased with an increase in porosity, showing a strong linear correlation, this is similar to the relationship between porosity and uniaxial compressive strength of basalt [28]. The compressive strength of specimens at 10% porosity under different pore sizes can be compared with the decay spoke values: at 0.5 mm, 1 mm, 1.5 mm, and 2.5 mm pore sizes, the compressive strength decreased from 7.37 MPa to 4.99 MPa, 3.83 MPa, and 3.29 MPa, respectively, and the decay range reached 32.3%, 48.1%, and 55.4%, respectively, indicating that the porosity led to a more considerable attenuation of the compressive strength of the coal rock model under different pore sizes. It was found that an increase in pore size aggravated the attenuation of compressive strength. The relationship curves between pore size and compressive strength are plotted in Figure 5b, with pore size as the independent variable. Under the conditions of 2.5%, 5%, 7.5%, and 10% porosity, the decreases in compressive strength were 0.87, 0.96, 1.11, and 1.16 MPa when increasing pore size from 0.5 mm to 1 mm, respectively, while the decreases were only −0.24, 0.38, 0.35, and 0.55 MPa when increasing pore size from 1 mm to 1.5 mm, respectively. It can be seen that increasing the pore size under different porosity conditions tends to weaken the effect of the compressive strength gradually, Hilal [33] also concluded in his experiments on foamed concrete that materials with larger pore volumes under the same porosity conditions are more likely to lead to pore continuity, resulting in lower material strength, and the effects of porosity and pore size are not wholly independent; furthermore, the coupling effect between the two also has a significant impact on the calculation results.
The calculation results show that the pore structure in the coal rock model affects its compressive strength. The reasons for this phenomenon may be that, compared with the non-porous specimen, the pore structure in the coal rock model leads to its lack of volume, resulting in its actual volume being less than the theoretically calculated volume under the same external force, such that the natural stress on the model with pores being more significant than that on the non-porous model, resulting in its calculated value being lower. In addition, the randomness of the pore structure distribution in the coal rock model makes it easy to generate stress concentration at the pore aggregations during the uniaxial compression test. Here, damage occurs in advance, compared to other parts. As the loading proceeds, the destabilized primitives are interconnected to generate macroscopic cracks which, in turn, lead to instability of the specimen.
When the experimental porosity was low and the distribution of pores was dispersed, the pores in the model did not produce a large area of connectivity, the stress concentration level of the primitive elements around most of the pores in the model was similar, and there were no conditions to allow for sudden changes in compressive strength; thus, the compressive strength maintained an excellent linear relationship with porosity. However, when the pore distribution was too concentrated and the stress concentration level was significantly higher than in other parts, the early generation of macroscopic fractures inside the model occurs, leading to a sudden reduction in compressive strength in the model. With an increase in pore size, the influence on the compressive strength of the coal rock model gradually weakened. A possible reason for this is that, when the pore size increased from 0.5 mm to 1 mm, the area of individual pores in the two-dimensional numerical model increased by four times, while the area increased only 2.25 times from 1 mm to 1.5 mm; the latter area change is minor in comparison and, so, the influence of the second half of the curve in Figure 5b on the compressive strength is minor. The pore shape and distribution pattern were similar in this series of experiments, so it was presumed that the difference in pore volume in the actual situation will also have different degrees of influence on the compressive strength.
4.1.2. Mathematical Relationship between Pore Structure Characteristics and Compressive Strength
Combined with the above expression of the effect of pore structure on the compressive strength law of the coal rock model, the data in Figure 5 were fitted using polynomials, and the fit was obtained as shown in Figure 6. This process draws on the idea of Taylor’s formula, which approximates some complex functions as simple polynomial functions, and this function of Taylor’s formula to simplify makes it a powerful tool for analyzing and studying many mathematical problems. In Figure 6, R2 indicates the correlation coefficient, calculated as shown in Equation (1), and takes values between 0 and 1. The closer the value of R2 is to 1, the better the fit is.
where is the predicted value obtained by fitting, is the average value, is the actual value, is Explained Sum of Squares, and is the Total Sum of Squares.
In addition, the porosity and pore size variation in this series of experiments follows a particular pattern, so the parameters of different pore characteristic expressions should also present a certain regularity between them. Under careful consideration of correlation coefficients and regularity between parameters, the fitted relational equation in Figure 6 is derived.
According to the analysis of the relationship equation between compressive strength and pore size under different porosity conditions in Figure 6, the mathematical model of compressive strength of the specimen versus pore size is derived as follows:
where is the compressive strength in the coal rock specimen when the pore size is (unit: MPa); is the compressive strength in the non-porous specimen (i.e., matrix; unit: MPa); is the pore size in the specimen (unit, mm); A and B are the coefficients of the quadratic term and the primary term in the mathematical model related to the porosity of the specimen. Figure 7 represents the relationship between the parameter values and the porosity.
According to the fitted curves in Figure 7, the relationship between the parameters A and B and the model porosity can be written as follows:
where is the porosity of the model.
The mathematical relationship between the uniaxial compressive strength of the coal rock model and the porosity and pore size was obtained by combining the above equations:
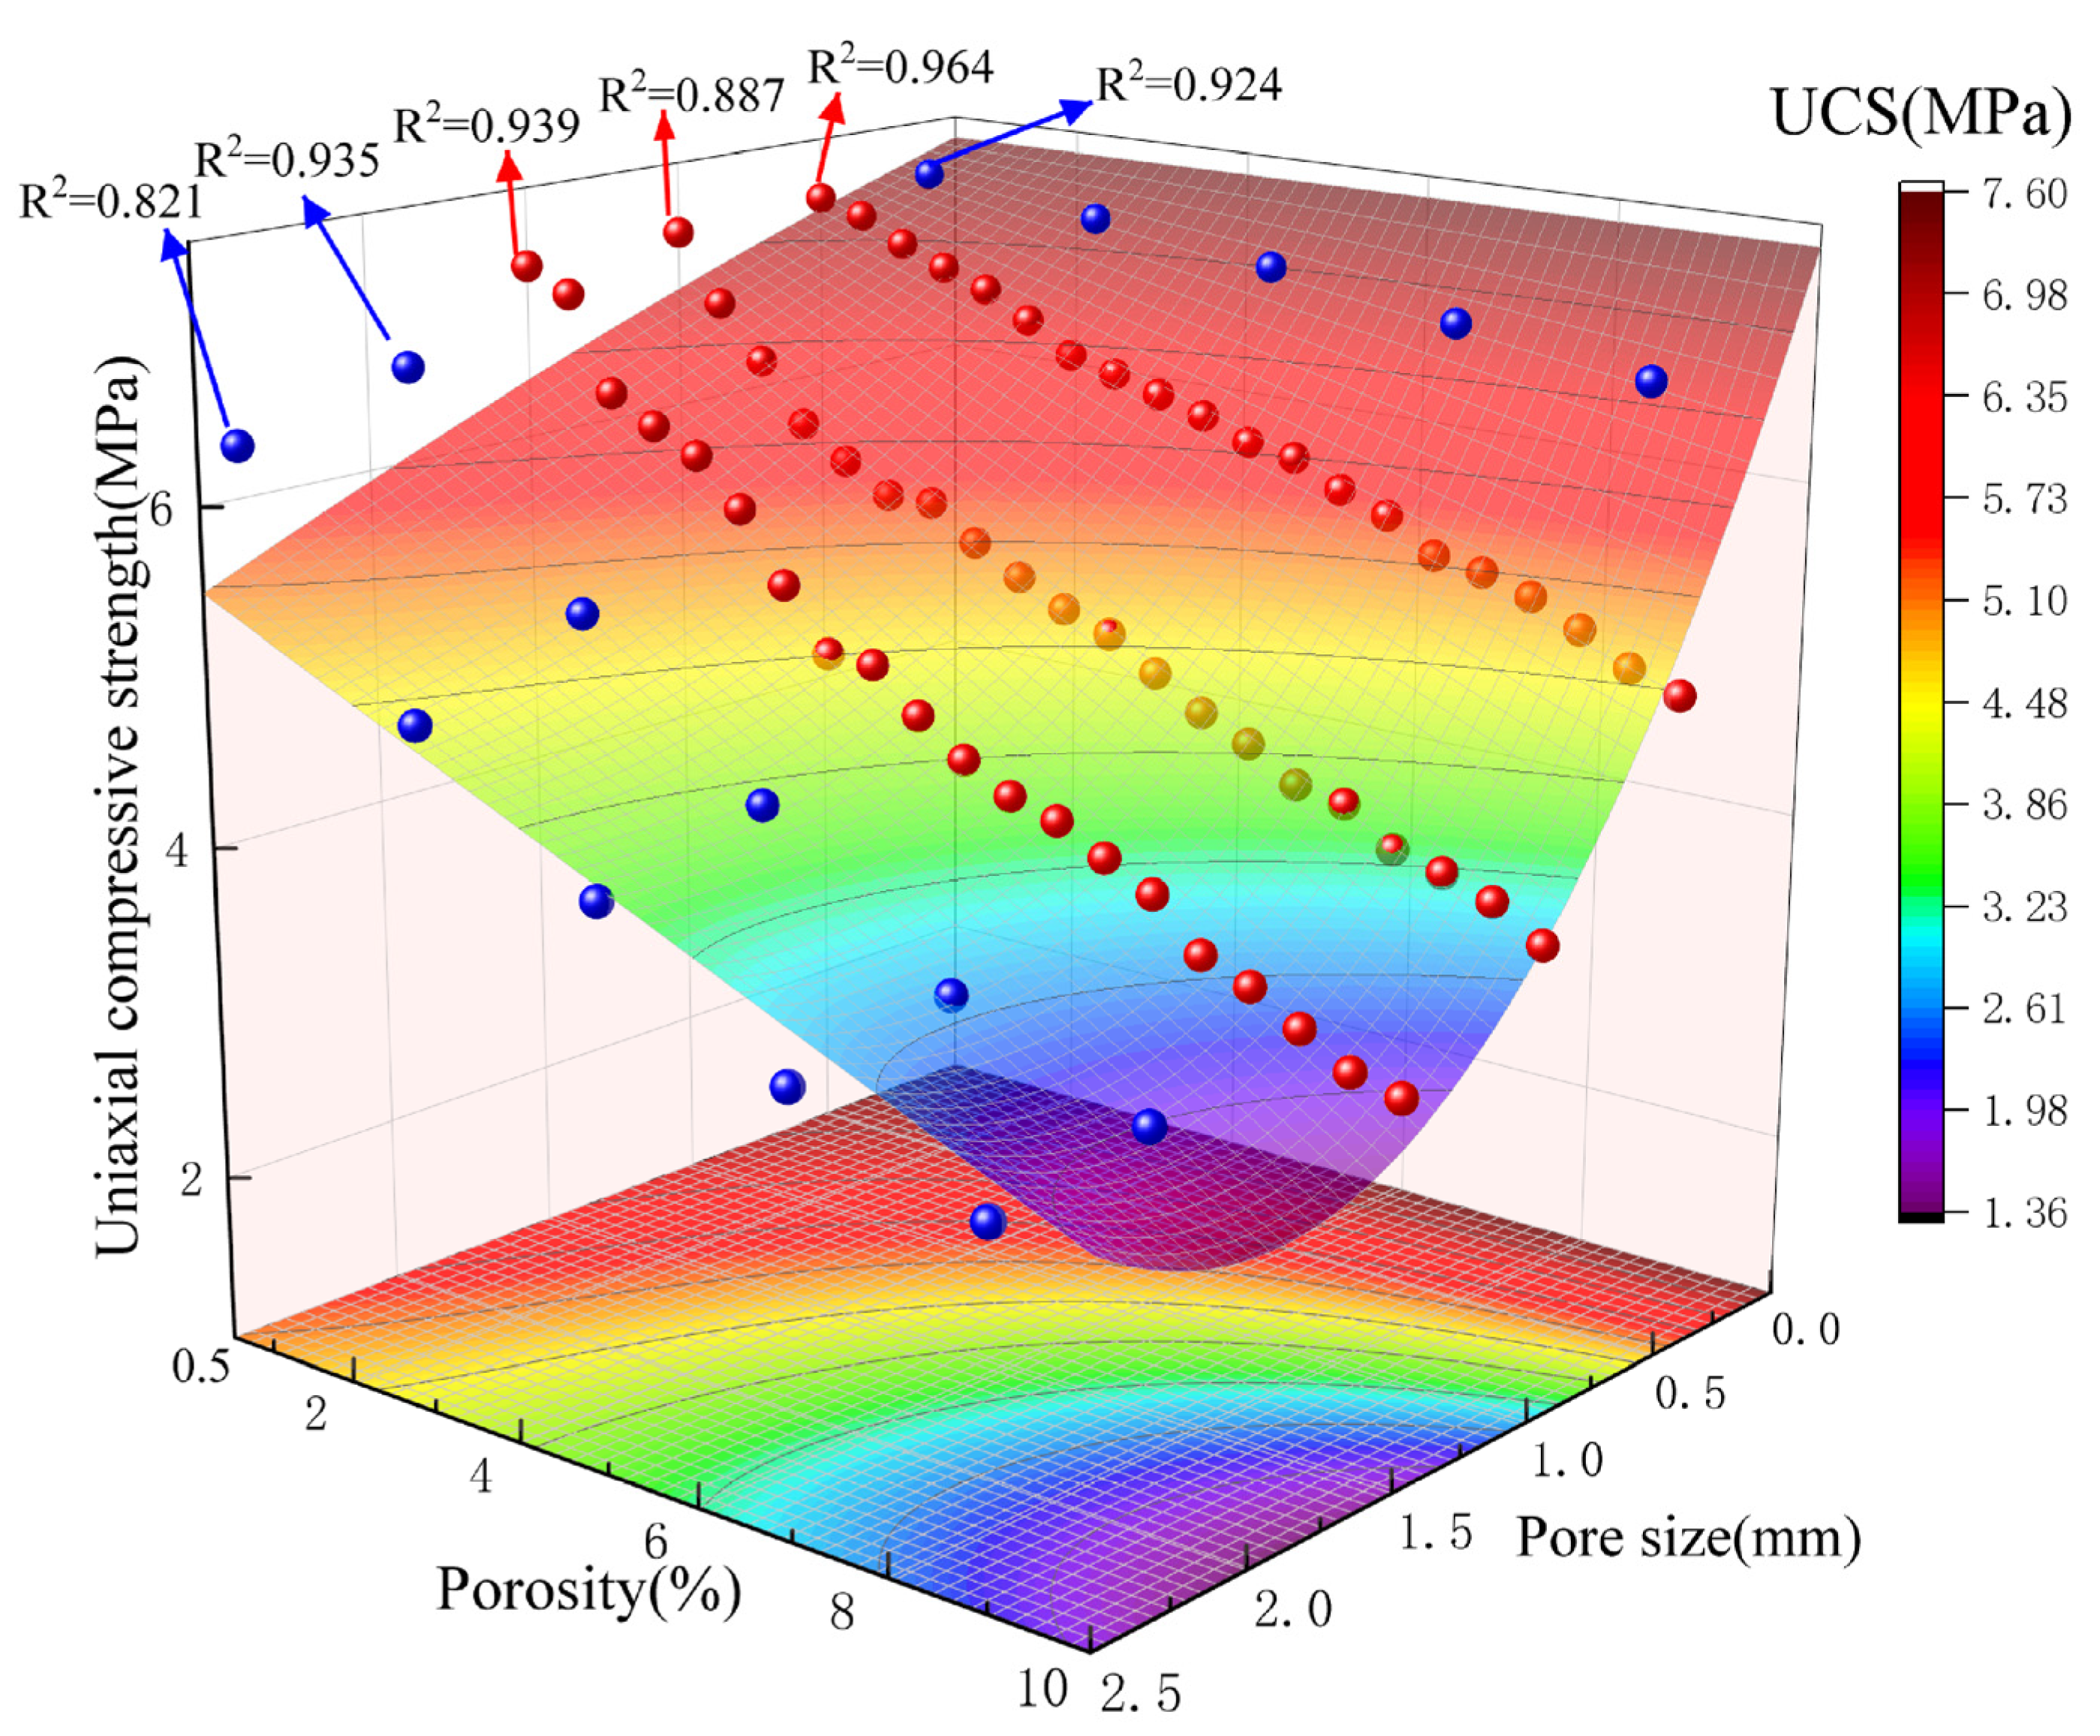
The numerical simulation results of Equation (5) and the compressive strength are fitted, and the fitting effect in the three-dimensional spatial coordinate system is shown in Figure 8.
It can be seen that the correlation coefficients R2 between the surface and the experimental results for pore diameters of 0.5 mm, 1.0 mm, and 1.5 mm are 0.989, 0.904, and 0.959, respectively, all of which have sound-fitting effects. In addition, numerical models with pore diameters of 0.25 mm, 2.0 mm, and 2.5 mm were established to verify the obtained mathematical relations, and blue spheres indicate the results in Figure 8. From the correlation coefficients R2 corresponding to the experimental results of each group, it can be seen that the correlation coefficients R2 for pore diameters of 0.25 mm and 2.0 mm are 0.924 and 0.935, respectively, which is a good fit, indicating that the fitted Equation (5) can be used as a basis for predicting the uniaxial compressive strength of coal rock (single pore diameter pore) within the porosity (0%–10%) and pore diameter (0.25–2.0 mm); however after the pore diameter increased to 2.5 mm, the correlation coefficient R2 decreased to 0.821, and the fitting effect was poor, which indicated that the reliability of the fitting Equation (5) was reduced and the values of each parameter needed to be readjusted.
In fact, there are many pores with different pore sizes in the coal rock, and it is known from the above analysis that the pores with different pore sizes have different degrees of influence on the compressive strength . The calculation method of is shown in Equation (6), so it is necessary to discuss the classification of pores in the coal rock body according to the size of pore sizes and calculate them separately to reduce the calculation error.
where is the uniaxial compressive strength value of the coal rock model under a certain pore size condition derived by fitting Equation (5).
In summary, the relationship between the porosity (0%–10%), pore size (0.25–2.0 mm) range, and the uniaxial compressive strength of the coal rock model was derived as:
where denotes the uniaxial compressive strength of the coal rock model, is parameters indicating the weight of the effect of different pore sizes on the compressive strength.
It should be noted that, for the values obtained in this series of numerical experiments, the pore positions were determined using random numbers, and their shape and distribution were also limited by specific conditions. Equation (7) only considers the effect of porosity and pore diameter changes on compressive strength and, in order to more accurately describe the relationship between the two and compressive strength, in-depth research is required to make appropriate corrections to the various parts of the equation and parameter values.
4.2. Impact Energy Index Analysis
Through the physical process of rock burst conception, occurrence, and manifestation, the uniaxial compression properties of coal rock samples should be divided into the pre-peak stage and post-peak stage. The pre-peak stage coal rock is mainly characterized by compacted density, elastic deformation, and elastic energy accumulation, while the post-peak stage coal rock is mainly characterized by damage accumulation, residual deformation, and energy dissipation. The impact energy index, KE, is the ratio of the deformation energy accumulated before the peak of the full stress-strain curve of the coal sample to the deformation energy consumed after the peak in the uniaxial compression state, which visually and comprehensively reflects the whole process of energy accumulation and energy dissipation and indicates the physical nature of the impact tendency of coal rocks.
4.2.1. Effect of Pore Structure on Elastic and Plastic Softening Modulus
In order to investigate the mechanism of the effect of pore structure on the impact energy index of the coal rock model, specimens with different pore characteristics in the same material were used for comparison. Figure 9 shows the full stress–strain curves of specimens with different pore characteristics. A linear fit to the elastic deformation phase before the peak strength of the total stress-strain curve of each specimen was performed to derive the elastic modulus E. In the damage softening phase, a linear fit to the post-peak damage softening phase was performed to derive the plastic softening modulus, λ, of the specimen, in order to characterize the effect of different pore characteristics on the strength recession rate of the specimen. The calculated results for each specimen are given in Table 3.
As can be seen from Table 3, the pore structure in the model had an enormous impact on both the pre-peak and post-peak moduli of the specimen. In the pre-peak stage, an evident stress concentration phenomenon around the pores in the specimen can be observed from Figure 4. As the loading proceeded, the matrix elements around the pores gradually lost their load-bearing capacity, and the matrix bearing the external force was subsequently reduced, which is more likely to produce deformation when subjected to external forces, compared to the specimen without pores, resulting in the modulus of elasticity of the specimen being reduced, Al-Harthi [28] et al. also concluded in their study of basalt that the modulus of elasticity decreases gradually with increasing porosity. Entering the post-peak stage, the pore structure was gradually compressed and compacted, the stress completed re-distribution, and the specimen obtained a specific load-bearing capacity under the new equilibrium system; at the same time, relative sliding between the cracks in the specimen generated friction and interlocking, thus slowing down the rate of decline of the post-peak stress in the specimen. The stress concentration phenomenon inside the pore specimen made it produce more cracks, and the pore characteristics of high porosity and large pore diameter were more favorable to the development of cracks. Thus, the friction and interlocking phenomena between cracks were more prominent and had a more significant effect on the plastic softening modulus.
4.2.2. Analysis of the Influence Law of Pore Structure on Impact Energy Index
Figure 10 shows the impact energy index curves of the coal rock models with different porosity characteristics. Overall, it seems that the pore structure in the specimens led to different degrees of weakening of the impact energy index. Figure 10a reflects the effect of different porosities on the impact energy index. Comparing the variation of impact energy index of specimens under different pore size conditions, we found that the impact energy indices of the specimens all decreased, to different degrees, with increasing porosity. Under the 5% porosity condition, the impact energy indices for the 0.5 mm, 1 mm, and 1.5 mm pore size models decreased to 1.33, 1.31, and 1.26, respectively, which were at most 7.3% lower, compared with the non-porous model, while the impact energy indices decreased to 1.22, 1.13, and 0.97 after the porosity was increased to 10%, comprising decreases (compared to the 5% porosity model) of 8.3%, 13.7%, and 23%, respectively. It can be seen that, in the second half of the curve, the reduction in the impact energy index increased significantly, and the change of pore size became the dominant factor affecting the impact energy index. From Figure 10b, it can be seen that the impact energy index decreased with the increase in pore size under different porosity conditions, presenting a strong linear correlation.
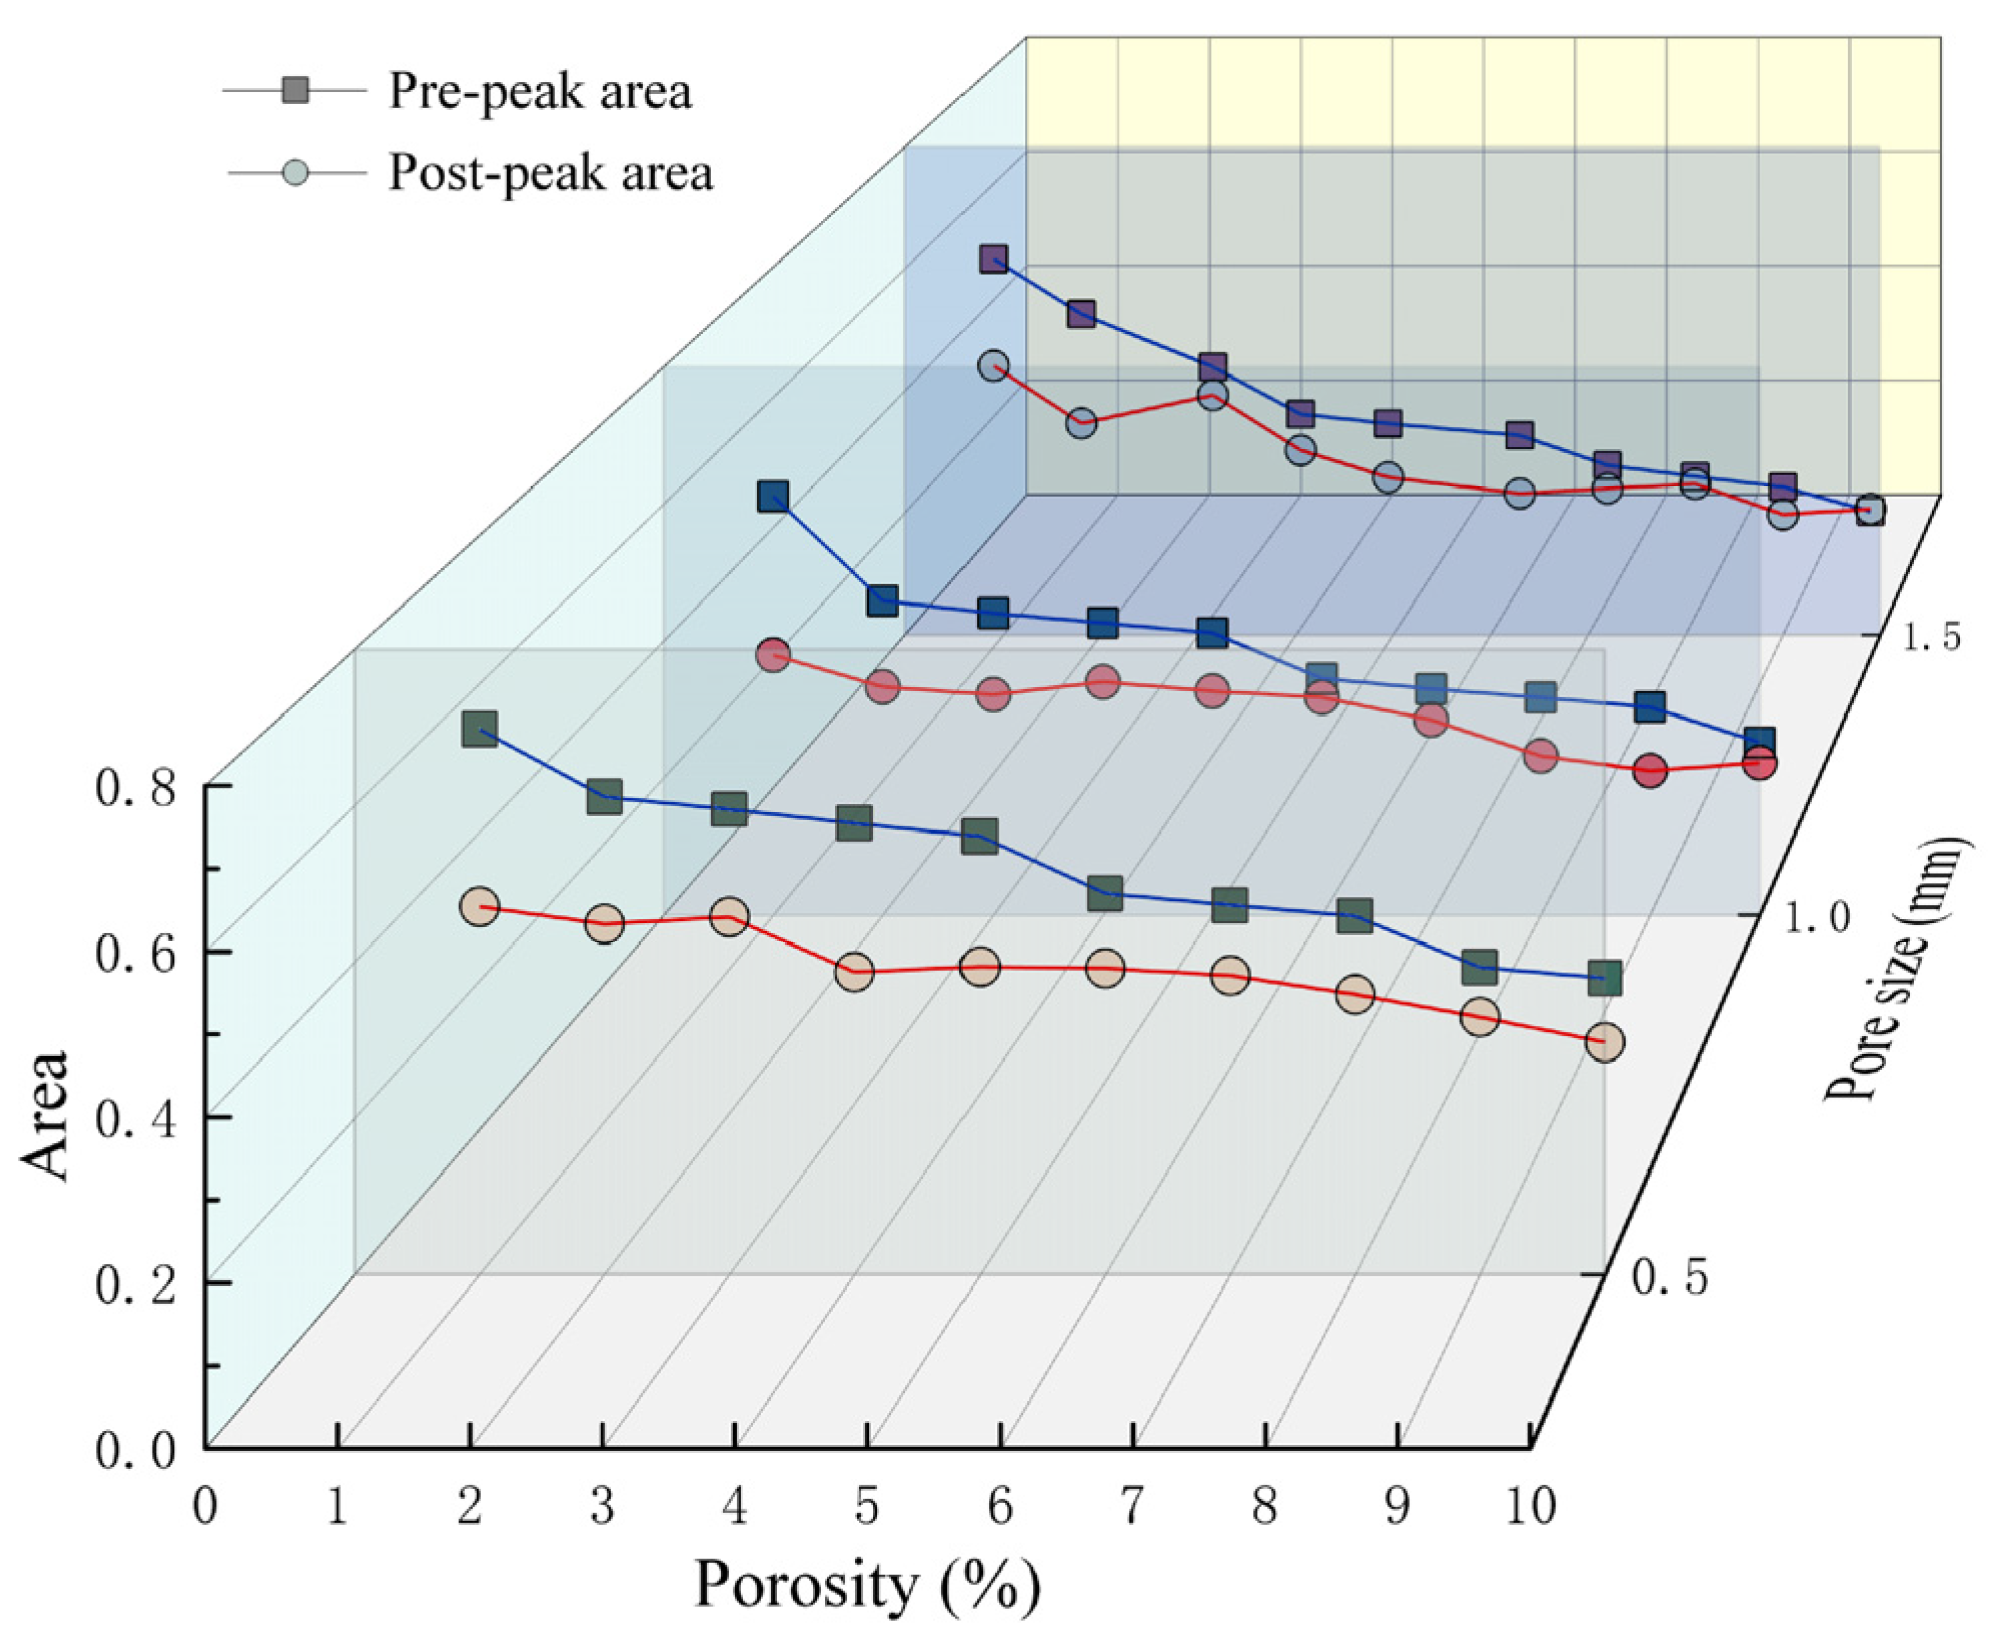
Figure 11 shows the statistics of the pre-peak area and post-peak area of stress-strain curves for specimens with different porosity characteristics, and it can be seen that the difference between the two under different porosity conditions shows a decreasing trend with the increase in porosity. This is because the pore structure in the model reduces the compressive strength, elastic modulus, and plastic modulus, decreasing the area before and after the peak of the curve, while the different degree of influence of the elastic modulus and plastic modulus leads to the rate of decrease in the area before the peak is significantly greater than that after the peak, which makes the ratio of the two change, and the impact energy index of the specimen decreases.
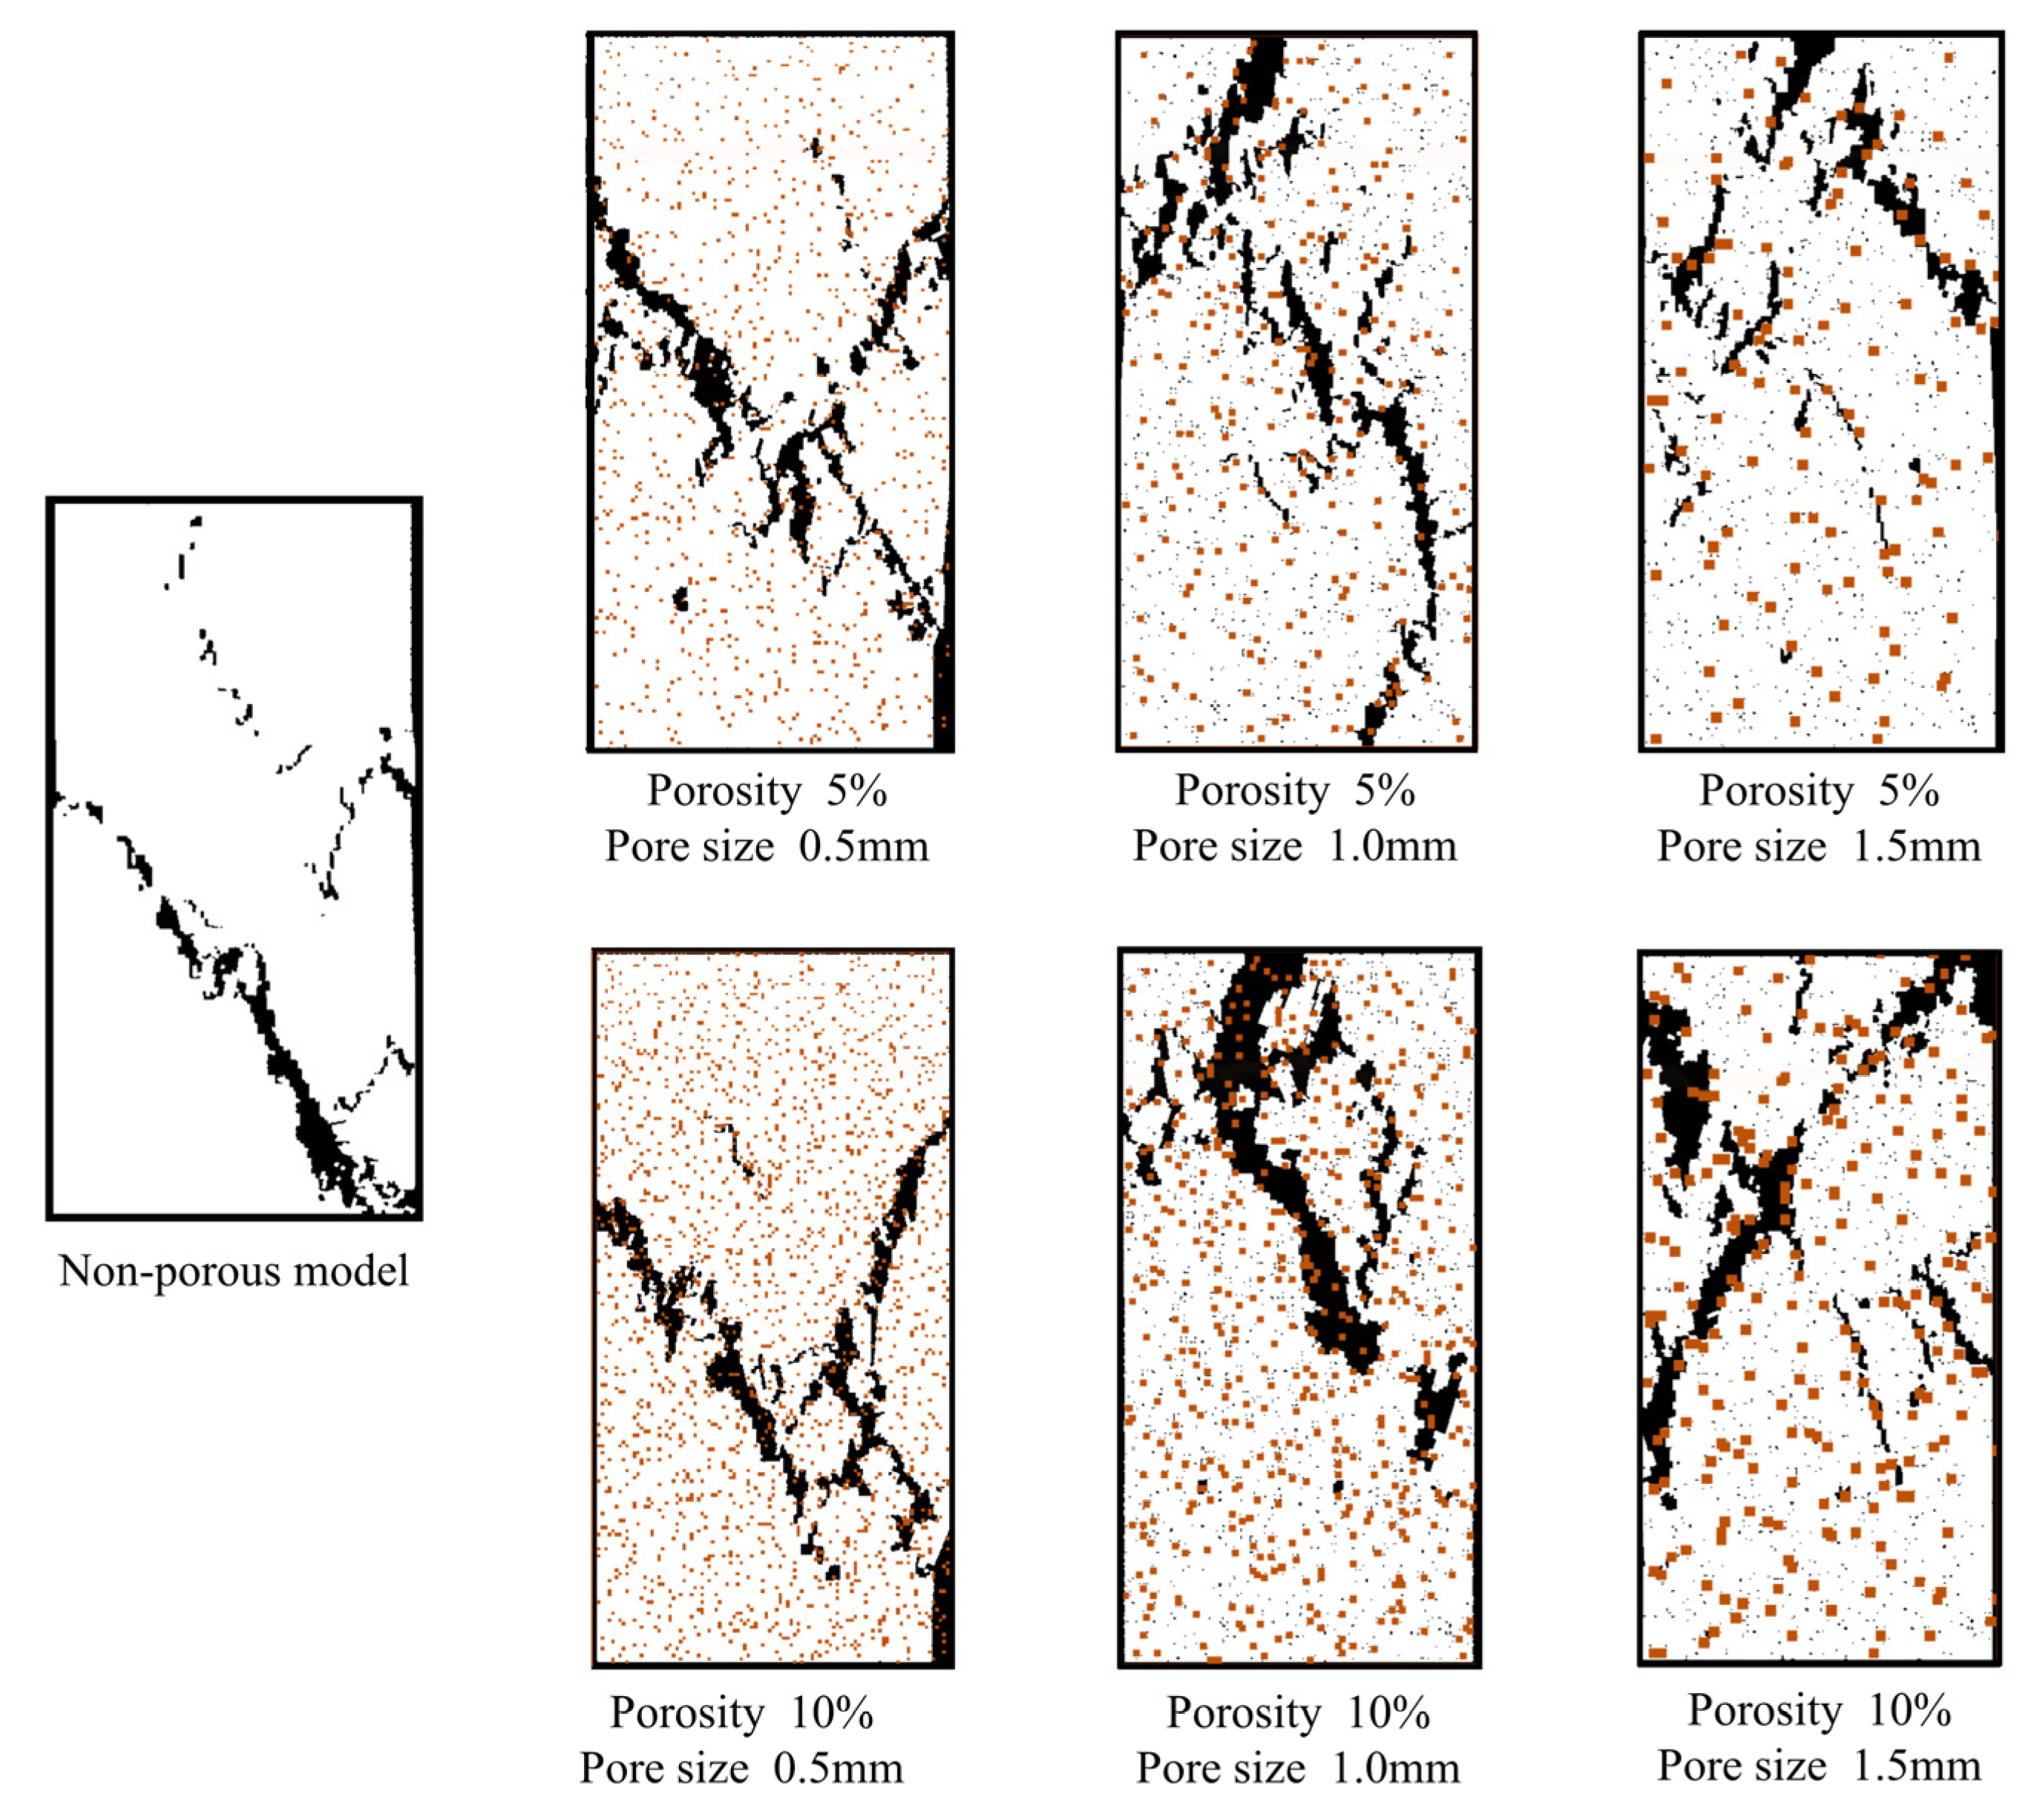
From an energy point of view, in the pre-peak stage, the pore structure dramatically weakened the ability of the coal rock model to accumulate energy, and the maximum energy it could release was severely limited, making the intensity of energy release lower which, in turn, is conducive to weakening the bursting liability of the coal body. Figure 12 shows the distribution of cracks in the models with different pore characteristics after crushing. It can be seen that more initial cracks and secondary cracks were produced in the models with higher pore development as the load increased. In addition to the expansion of the main fracture, the secondary cracks also expanded, to varying degrees. A portion of the deformation energy accumulated before the peak was gradually converted into damage dissipation energy, consumed due to sub-crack expansion, and the remaining energy was converted into kinetic energy when the coal rock was damaged; that is, if the damage dissipation energy is more tremendous during the destruction of coal rocks, less energy will be released, and it the less likely it is that the coal rocks will be violently damaged.
In addition, the distribution, shape, and other characteristics of the pores inside the model may contribute to the dispersion of the experimental data. Uncertainties in the pore distribution, shape, spacing, and other pore characteristics in the specimen may lead to differences in the macroscopic mechanical properties of the specimen under the same experimental conditions, biasing the experimental results.
4.2.3. Mathematical Relationship between Pore Structure and Impact Energy Index
Combined with the description of the effect law of pore size on the impact energy index above, the data in Figure 10b were fitted using a polynomial, as shown in Figure 13. Similar to the fitting process between the pore structure characteristics and compressive strength in the above paper, this fitting also draws on the idea of Taylor’s formula, introduces the correlation coefficient R2, and considers the premise that the parameters of different pore characteristics expressions should show a certain regularity among themselves, resulting in the fitted relationship equation in Figure 13.
According to the relationship between impact energy index and pore diameter under different porosity conditions in Figure 13, the type of function is analyzed, and the mathematical model of impact energy index and pore diameter is derived as follows.:
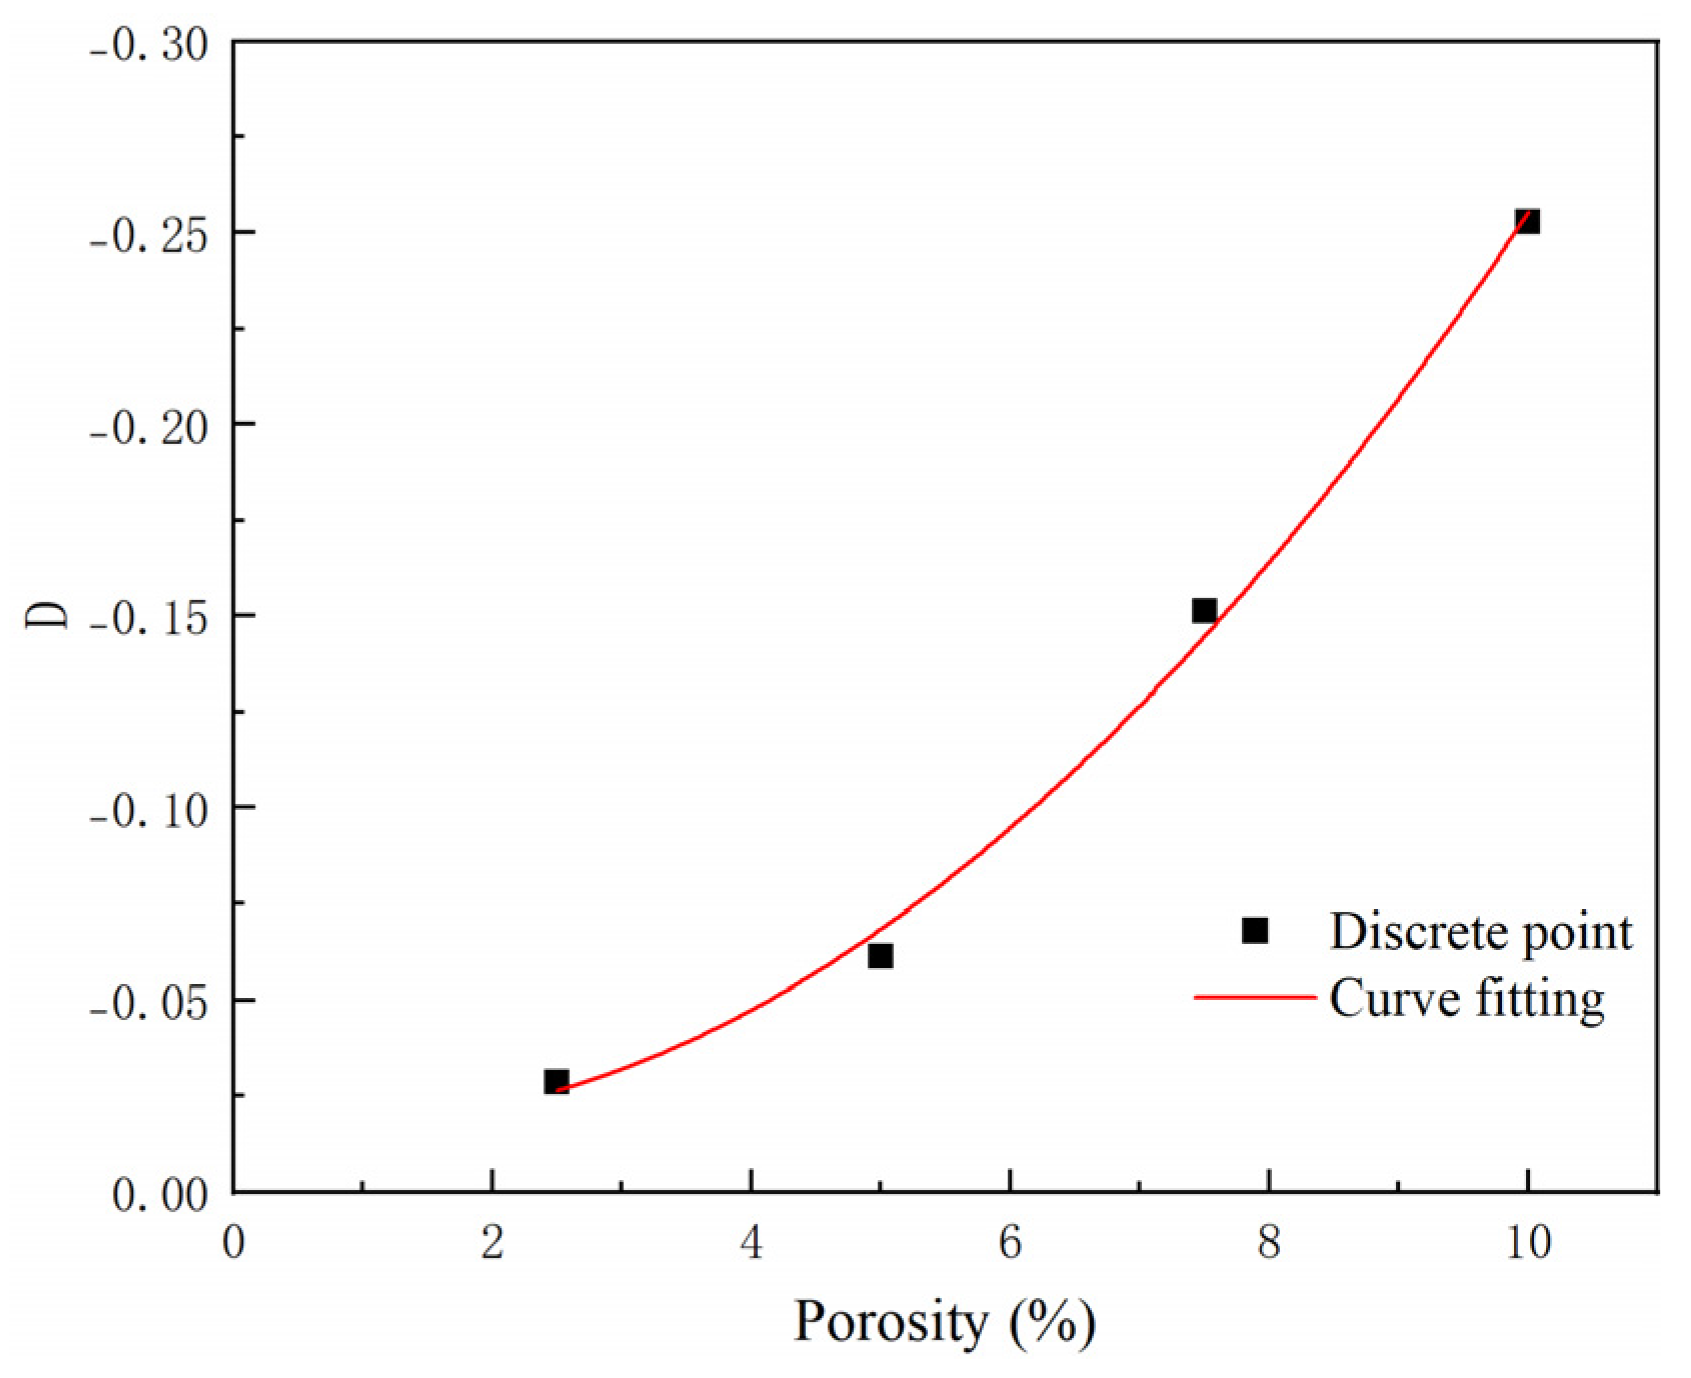
where is the impact energy index in the coal rock specimen when the pore size is , is the impact energy index of the non-porous specimen (i.e., matrix), and is a parameter related to the porosity of the specimen. Figure 14 presents the relationship between the value of the parameter and the porosity.
According to the fitted curve in Figure 14, the relationship between the parameter D and the model porosity was as follows:
The mathematical relationship between the impact energy index of the coal rock model and the porosity and pore size was obtained by combining the above equations:
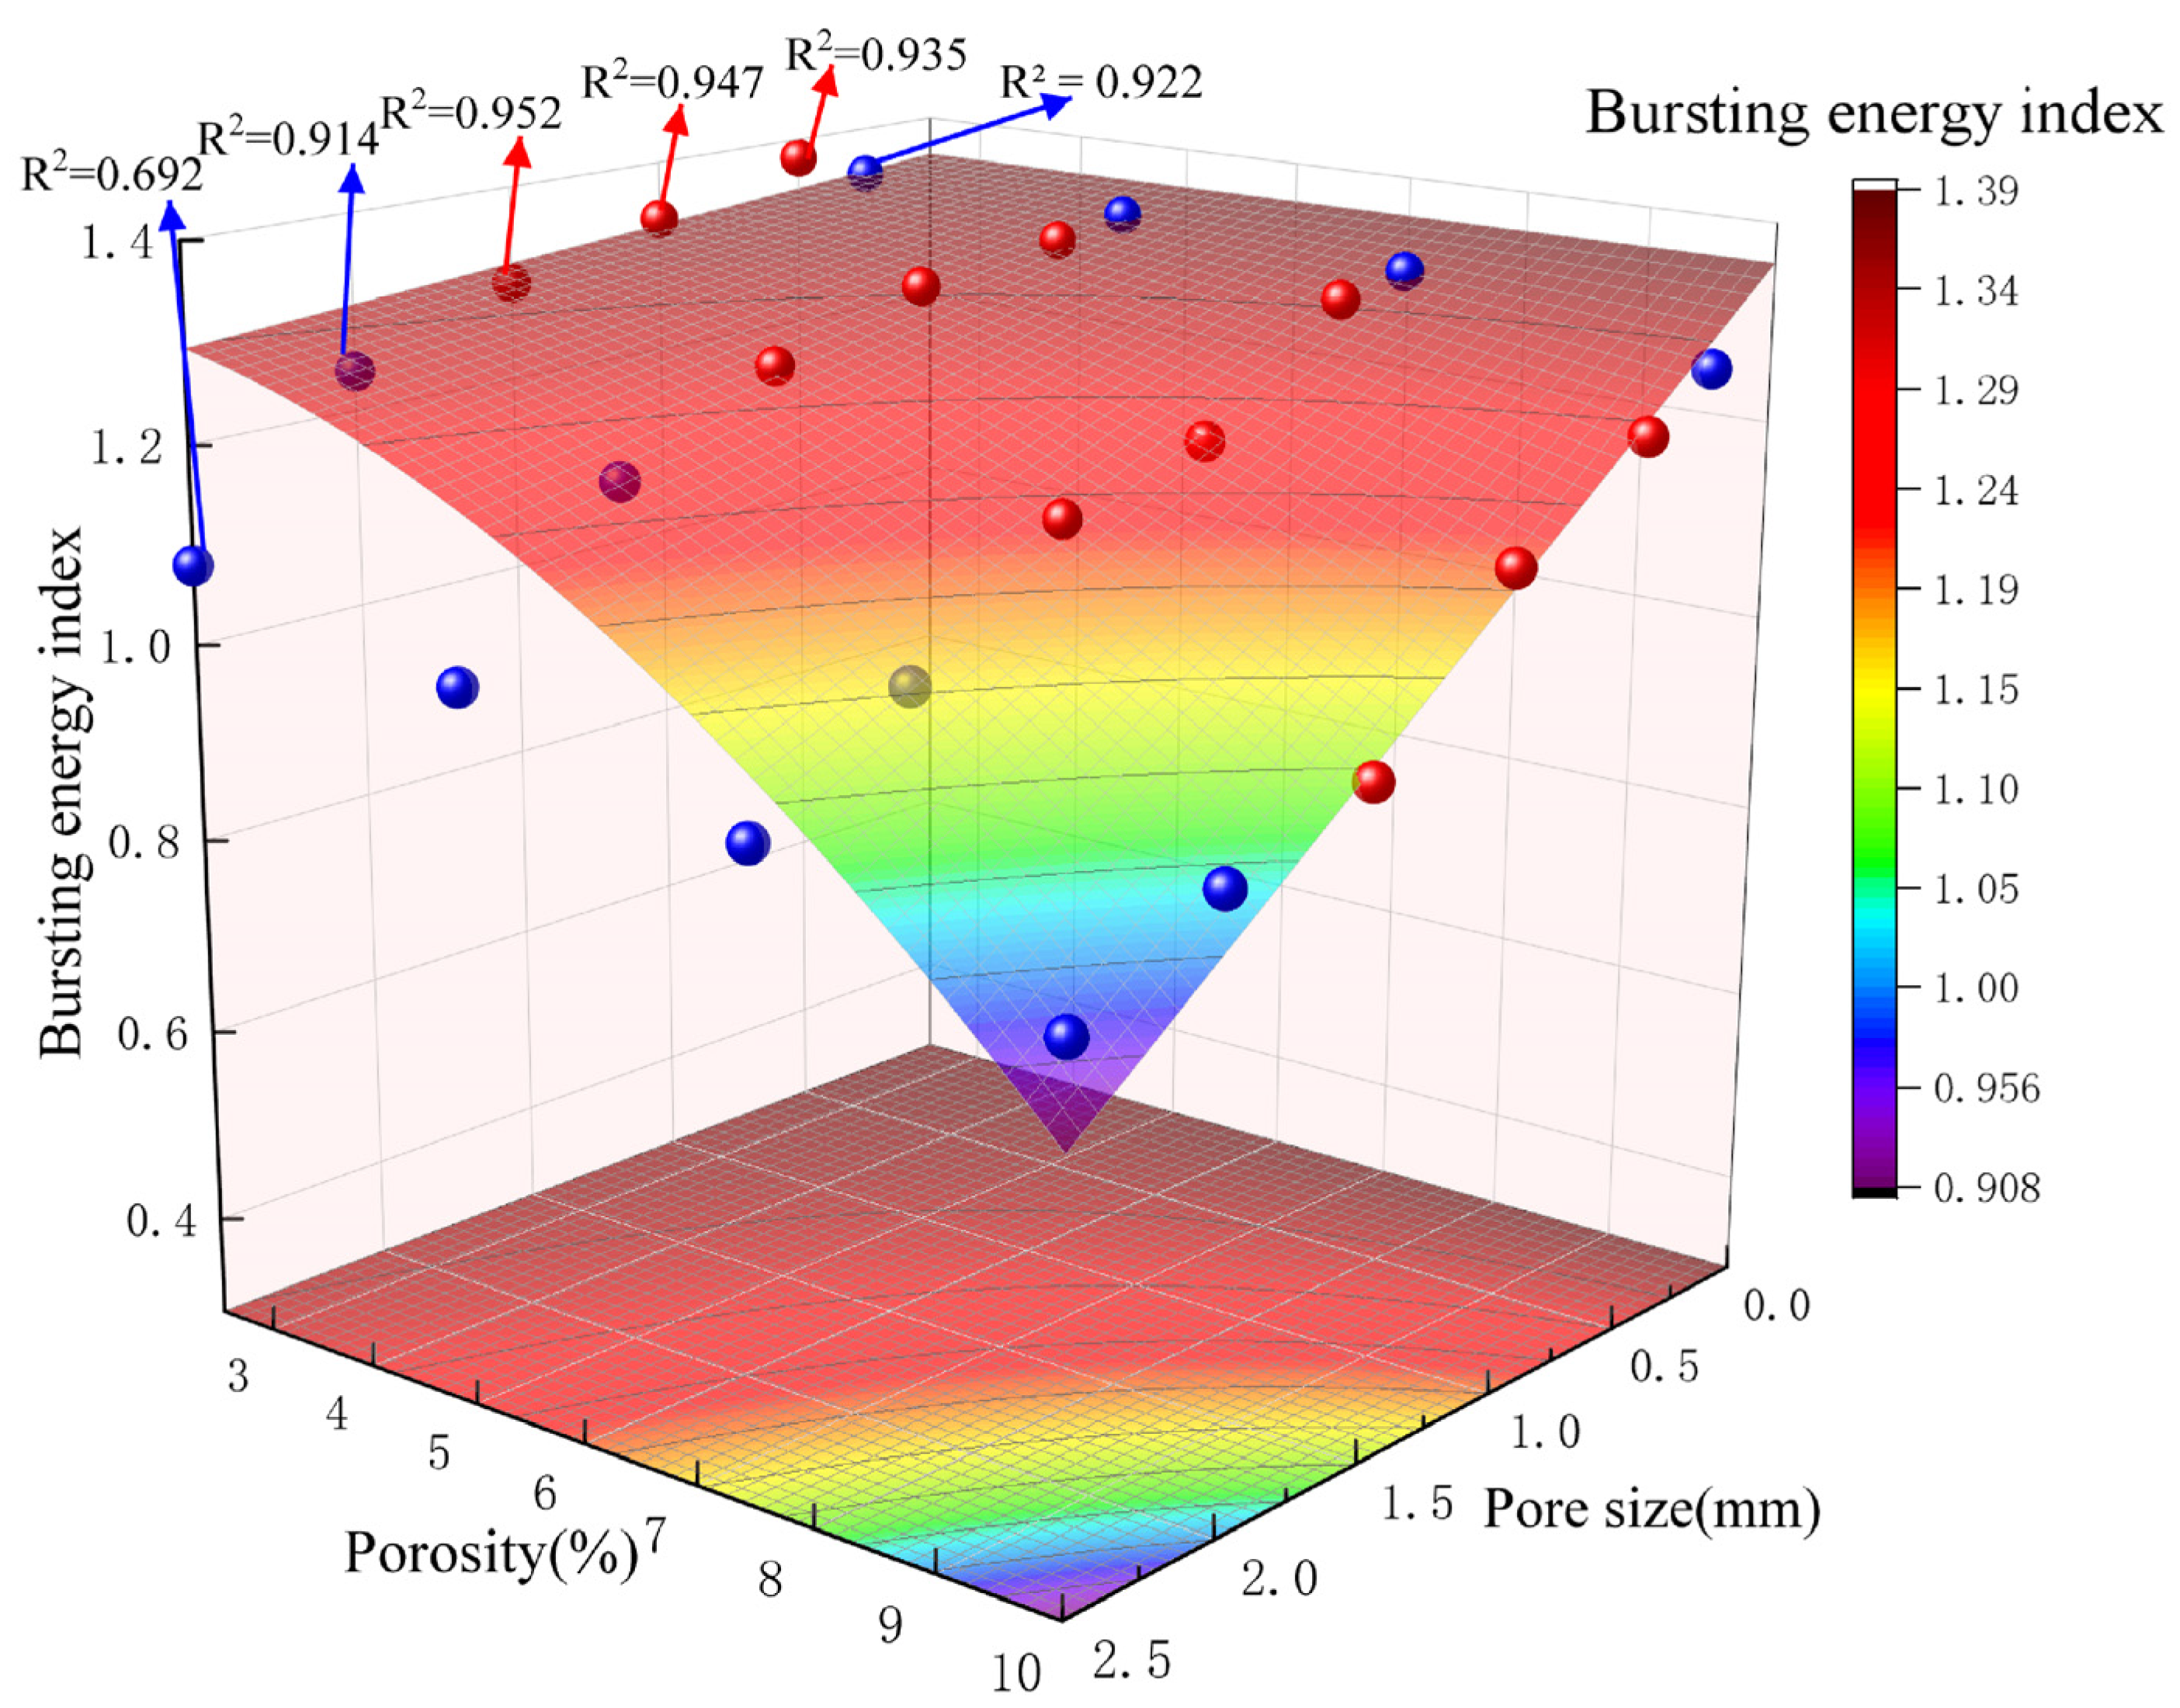
The numerical simulation results of Equation (10) and the impact energy index are fitted, and the fitting effect in the three-dimensional spatial coordinate system is shown in Figure 15.
It can be seen that the correlation coefficients R2 between the surface and the experimental results for pore diameters of 0.5 mm, 1.0 mm, and 1.5 mm are 0.935, 0.947, and 0.952, respectively, all of which have sound fitting effects. In addition, numerical models with pore diameters of 0.25 mm, 2.0 mm, and 2.5 mm were established to verify the obtained mathematical relations, and blue spheres indicate the experimental results in Figure 15. From the correlation coefficients R2 corresponding to the experimental results of each group, it can be seen that the correlation coefficients R2 for pore diameters of 0.25 mm and 2.0 mm are 0.922 and 0.914, respectively, which is a good fit, indicating that the fitted Equation (10) can be used as a basis for predicting the impact energy index of coal rock (single pore diameter pore) within the porosity (0%–10%) and pore diameter (0.25–2.0 mm). However, the correlation coefficient R2 decreases to 0.692 after the pore diameter increases to 2.5 mm, and the fitting effect is poor, which indicates that the fitting Equation (10) is no longer applicable, and the values of each parameter need to be readjusted.
In fact, there are many pores with different pore sizes in the coal rock, and it is known from the above analysis that the pores with different pore sizes influence the impact energy index . The calculation method of is shown in Equation (11), so it is necessary to discuss the classification of pores in the coal rock body according to the pore size and calculate them separately, to reduce the calculation error.
where is the impact energy index value of the coal rock model under a certain pore size condition derived by fitting Equation (10).
In summary, the relationship between the porosity (0%–10%), pore size (0.25–2.0 mm) range, and the impact energy index of the coal rock model was derived as:
where denotes the impact energy index of the coal rock model, is parameters indicating the weight of the effect of different pore sizes on the compressive strength.
It should be noted that, for the values obtained in this series of numerical experiments, the pore positions were determined randomly, and their shape and distribution were also limited by specific conditions. Equation (12) only considers the effect of porosity and pore diameter changes on the impact energy index. In order to more accurately describe the relationship between the two and the impact energy index, in-depth research is required to make appropriate corrections to the various parts of the equation and parameter values.
4.3. Elastic Energy Index Analysis
The elastic energy index is the ratio of the deformation energy accumulated before the coal sample is damaged under uniaxial compression conditions to the energy consumed to produce the plastic deformation. The more energy accumulated, and the less energy consumed, the greater the possibility of rock burst, thus reflecting the bursting liability of coal rock.
Due to the limitations of numerical experiments, in the process of numerical simulation of cyclic loading-unloading of the specimen, it was found that the experimental data were distorted after the instability of the coal rock model, and accurate data were not obtained. Therefore, the ratio of the elastic strain energy to the plastic strain energy before 80% of the peak stress of the specimen was selected to characterize its elastic energy index. Figure 16 shows the test results for the 0.5 mm and 1 mm pore-size coal rock models. It can be seen that the presence of a pore structure inside the model had an attenuating effect on the elastic energy index of coal rock in the range of 2.5–10% porosity; furthermore, the higher the porosity, the larger the pore size, and the more pronounced the effect. After the porosity increased to 7.5%, the effect of porosity on the elastic energy index weakened.
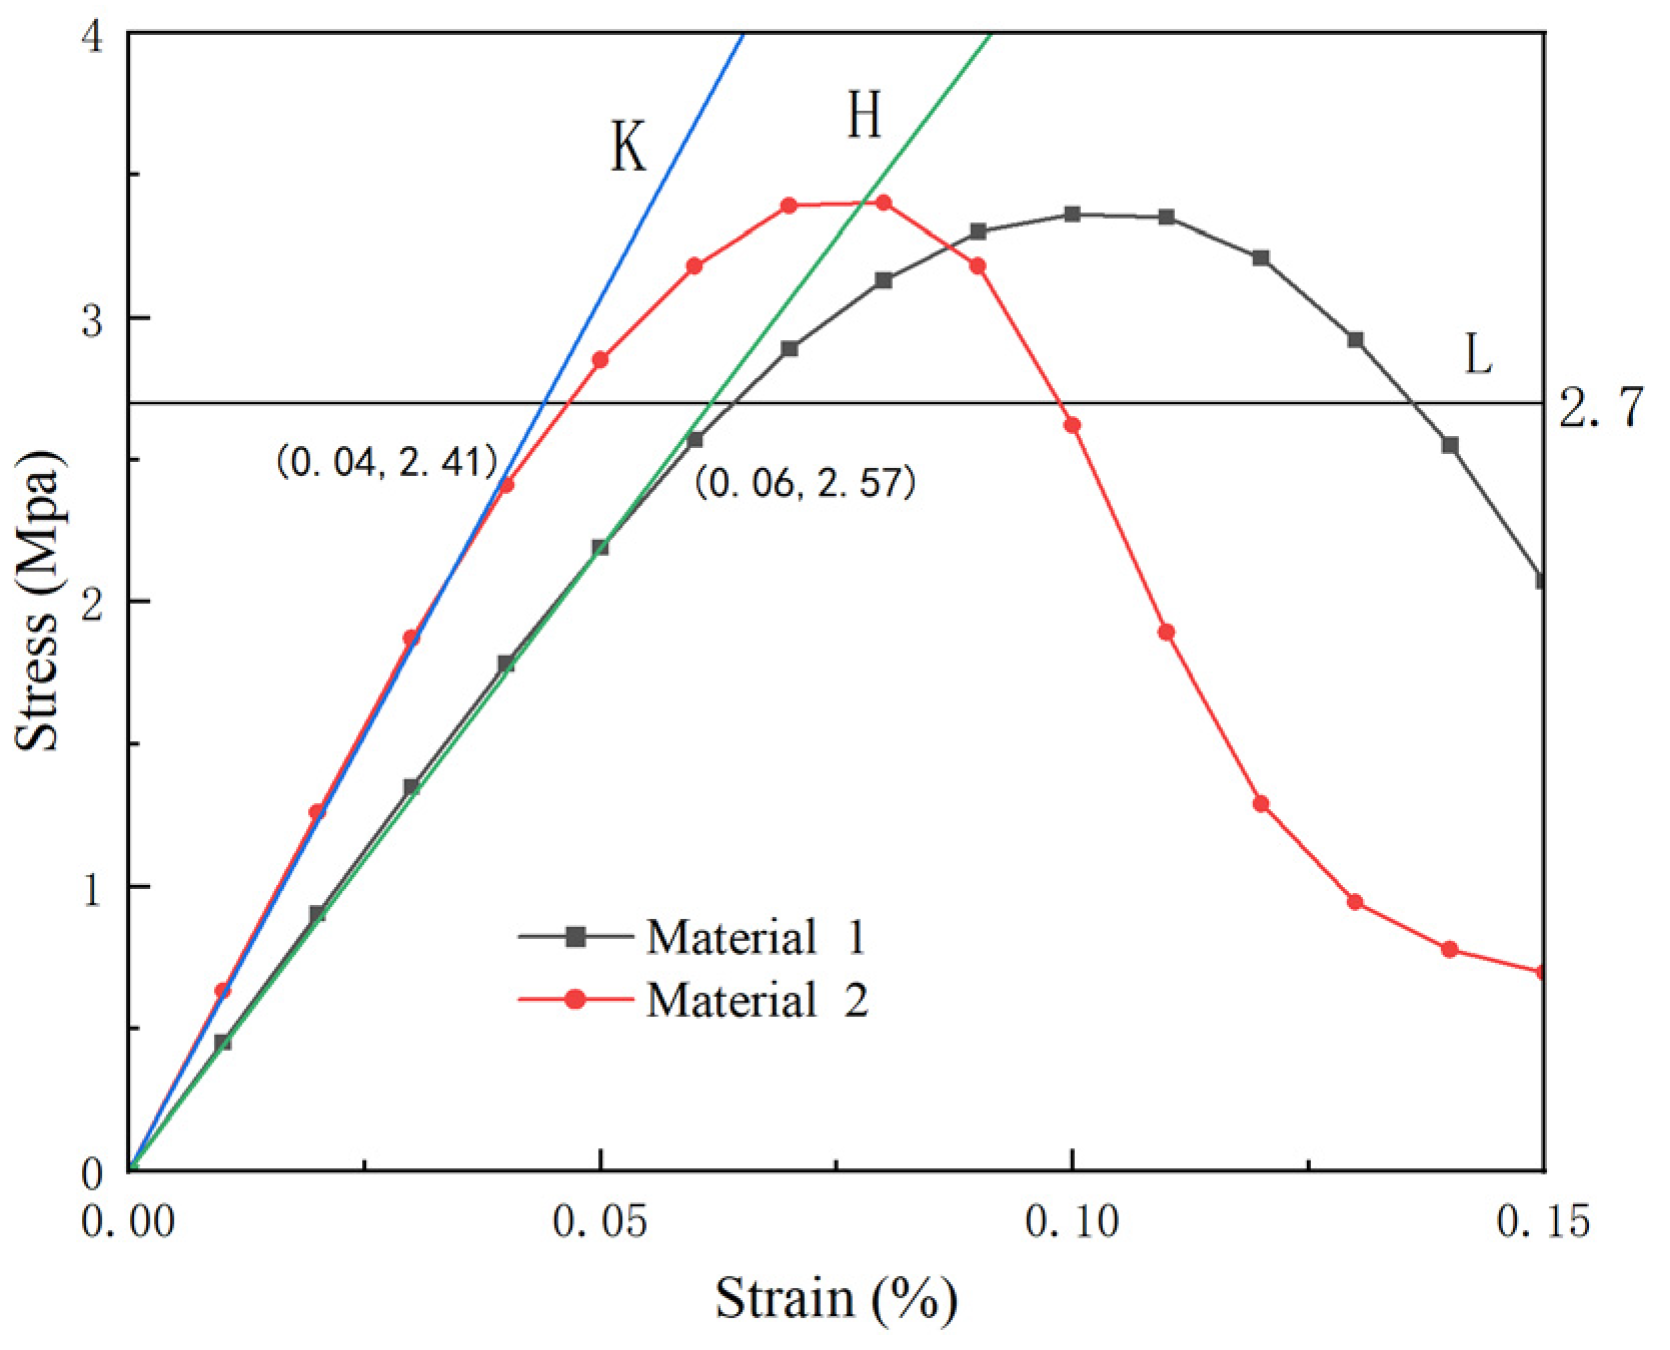
To investigate the mechanism of the effect of pore structure on the impact energy index of coal rock models, elastic energy index tests and uniaxial compression tests were performed on two models with different pore characteristics. Figure 17 shows the test results for the two materials, where the pore characteristics of material 1 were 10% porosity, pore size 1.5 mm, while material 2 was a non-porous numerical model with similar compressive strength. In Figure 17, the area enveloped by the acceleration-unloading curve is the plastic strain energy, which indicates the energy consumed by destruction of the internal material primitive and crack extension. It can be seen that more energy was consumed by material 1. Figure 18 shows the first half of the stress–strain curves of the two materials, where H and K are the extensions of the elastic part of the lines of materials 1 and 2, respectively. The model is considered to start plastic deformation when it starts to separate from the stress–strain curve. L denotes the 80% peak stress line, whose intersection with the stress–strain curve is the extreme value point of the stress during loading in the elastic energy index measurement experiment. Due to the stress concentration phenomenon around the pores inside the model during loading, damage occurred earlier in the primitives around the pores. Figure 18 depicts the earlier plastic deformation of material 1. It can be seen from Figure 18 that the deformation of material 1 was higher after stress loading to 80% of the peak, as material 1 produced more initial and secondary cracks. The damage to the internal primitives was more serious. The damage to the primitives in the material and the generation and expansion of cracks all released a certain amount of energy, dramatically weakening the model’s ability to accumulate deformation energy. In the second half of the experiment, when the stress was unloaded, this part of the damaged primitive lost its ability to recover from the deformation. At the same time, the frictional force between the cracks inside the model inhibited the rebound of the material, such that the deformation of the material could not be fully recovered. Most of the work done by the external force on the model is absorbed by the crack closure and slip and, so, the plastic strain energy of material 1 in Figure 17 was much higher. Compared with the coal rock model with low porosity and small pore size, the high porosity and large pore size model had a more obvious stress concentration phenomenon during loading, and produced more initial cracks and secondary cracks, thus weakening the model’s ability to accumulate energy and rebound to a greater extent and having a more significant impact on the elastic energy index.
5. Discussion
It has been shown that the pore structure in rocks affects their physical and mechanical properties; however, no clear findings have been obtained regarding the effect on the bursting liability of coal rocks. In this paper, the rupture process of coal rock masses was analyzed to visualize the effects caused by the pore structure on the evolution of the stress and displacement fields of the specimen during loading. By analyzing the experimental data, the influence laws of porosity and pore diameter of coal rocks on each bursting liability index were derived, and the mathematical relationships between the pore characteristics (porosity and pore diameter) of coal rocks and uniaxial compressive strength and impact energy index were also established, which is vital for the early warning and prevention of rock burst in the coal mining process.
- (i)
- Relationship between pore structure and uniaxial compressive strength
The relationships between the test results of uniaxial compressive strength and porosity and pore diameter were analyzed, the influence law of different pore characteristics on the compressive strength was clarified, and the intrinsic reasons were analyzed. After that, the mathematical relationship equation between the two and the compressive strength was derived through fitting, and the method for calculating the uniaxial compressive strength with respect to the pore characteristics of a coal body was given. In the existing literature, few scholars have considered the effect of pore size in the influence of porosity on compressive strength when discussing the effect of porosity on compressive strength, and a mathematical relationship between porosity, pore size, and uniaxial compressive strength of coal rocks has not previously been established. Thus, in this paper, we made some progress in this regard, making quantitative calculation of the degree of influence of pore structure on compressive strength possible.
- (ii)
- Relationship between pore structure and impact energy index
The relationships between the impact energy index and porosity and pore size were analyzed, respectively, the influence laws of different pore characteristics on impact energy index were clarified, and the intrinsic reasons were analyzed from the perspective of energy. The mathematical relationship between the two and the impact energy index was then derived by mathematical fitting, and a method for calculating the impact energy index of pore coal bodies was thus given. In the existing literature, only the general law regarding the influence of pore characteristics on the impact energy index has been derived, and the mathematical relationship between the two had not been established. In this paper, we clarified the law between the two and made quantitative calculation of the degree of influence of pore structure on the impact energy index possible.
- (iii)
- Relationship between pore structure and elastic energy index
Based on the experimental results from the numerical simulation, the influence laws of different pore characteristics on the elastic energy index were clarified, and the intrinsic reasons were analyzed according to the stress–strain curves of the materials and the energy perspective. In the existing literature, few scholars have discussed the influence of pore structure characteristics on the elastic energy index of coal rocks. In this paper, we explored this aspect, to some extent, and clarified the law between the two.
We conducted numerical simulations based on the mechanical parameters of coal samples taken from a mine in Shanxi province. The numerical simulation results presented a good fit between the samples and the mathematical relationships, indicating that the obtained equations have some reference significance. The obtained results have essential scientific significance in engineering. When the coal rock body at the engineering site is obtained, its impact damage index can be quickly obtained through assessment of its pore characteristics, which is vital for the early warning and prevention of rock burst in the coal mining process.
According to this research method, other types of rocks can be analyzed to obtain mathematical relationships between them, and the results obtained can be applied to projects such as coal mining and tunneling: By analyzing the pore characteristics of the rock body at the engineering site and obtaining its impact damage index, it is of great significance for the early warning and prevention of rock explosions in mining, tunnel tunneling, and other projects.
The rationality of this study is discussed below.
In RFPA, the non-linearity of materials is simulated by considering the non-uniformity of materials, and the non-continuous behavior of deformation and damage of materials is simulated according to the weakening of cells, which can be used to study the whole process of rock materials, from acceptable view damage to visible damage. The model of rock media is discretized into a numerical model consisting of mesoscopic elements, where the mechanical properties of the units in the model conform to a particular statistical distribution law (i.e., Weibull distribution) establishing a relationship between the mesoscopic and macroscopic mechanical properties. On this basis, the evolution of stress and displacement around the pores in the coal rock mass can be assessed by assigning a null model to some units in the model. Few studies have focused on the effects of both porosity and pore size on mechanical properties and, usually, only one major factor is analyzed. Therefore, the modeling process in this experiment mainly considered the effects of both variations.
In actual engineering, the pore characteristics of different coal species are very different: even for the same coal seam, the pore characteristics of coal rocks at different locations are not the same. Thus, in this paper, we considered a variety of cases to analyze the effects caused by both on the mechanical properties of coal rocks. In particular, we verified that the formula was still applicable when the pore characteristics changed.
However, there were some shortcomings to this paper: taking the porosity and pore size in coal rocks as the research focus simplifies the influence of the remaining pore characteristics (e.g., pore spacing and shape) on mechanical properties and, therefore, there may be some limitations with respect to practical engineering applications. At the same time, we conducted few field and indoor tests, and, in subsequent research, the sampling and testing of various coal rocks will be carried out to further clarify the influence of porosity and pore size on the bursting liability of coal rocks and improve the obtained mathematical relationships. In addition, the influence of the remaining pore characteristics (e.g., pore shape, distribution) on the mechanical properties of coal rocks will be explored. In terms of analysis methods, we will continue to expand the analysis ideas proposed in this paper, try to classify the pores in rock materials by shape and fractal dimension, and derive the relationship between each mechanical property index and the shape and fractal dimension of pores, which together with this paper will form a prediction system for the mechanical property index of pore rock bodies.
6. Conclusions
In this paper, numerical models considering similar pore characteristics and mechanical properties of coal rocks were established using the RFPA2D numerical simulation software, and the effects of porosity and pore size on various physical and mechanical properties of coal rocks were analyzed. The results indicated the following:
- The pore structure in the coal rock profoundly affects the evolution of the stress and displacement fields. The analysis shows that the evolution of the displacement fields corresponds to the development of the internal damage and deformation of the model, the stress concentration around the pores is easy to occur, microcracks are generated, and the expansion of these microcracks causes changes in the mechanical properties of the specimen and weakens its ability to accumulate energy.
- The pore structure in the coal rock leads to the reduction in uniaxial compressive strength. by fitting the porosity and pore diameter to the uniaxial compressive strength of the coal rock model, the relationship between uniaxial compressive strength of coal rock and porosity and pore diameter was obtained in the range of porosity (0%~10%) and pore diameter (0.25~2.0 mm) in Equation (7).
- The pore structure in the model has different degrees of attenuating effects on its compressive strength, elastic modulus, and plastic softening modulus, which in turn affect its energy storage and dissipation processes in the uniaxial compression state. By fitting the porosity, pore diameter, and model impact energy index, the relationship between the pore grouping of different pore sizes and the model impact energy index of coal rock in the range of porosity (0%–10%) and pore diameter (0.25–2.0 mm) was calculated by Equation (12).
- The pore model produces plastic deformation earlier in the experiment, weakening the ability to accumulate deformation; during the unloading process, the matrix element that produces plastic deformation loses the ability to recover the deformation, and the friction between the cracks also inhibits the rebound of the material, making the elastic energy index of the specimen decrease. The numerical simulation results show that the pore size is the dominant factor affecting the elastic energy index.
Author Contributions
H.Y.: Conceptualization, Methodology, Software, formal analysis, investigation, data curation, writing—original draft preparation, writing—review and editing. Q.L.: Validation, investigation, resources, project administration, funding acquisition. J.S.: Validation, investigation, project administration. X.C.: Investigation, data curation. All authors have read and agreed to the published version of the manuscript.
Funding
This research was funded by Natural Science Foundation of Shanxi Province (201901D111071), and Key-Laboratory of In-situ Property-improving Mining of Ministry of Education, Taiyuan University of Technology and College of Mining Engineering, Taiyuan University of Technology.
Data Availability Statement
The data presented in this study are available on request from the corresponding author.
Acknowledgments
The authors appreciate the support of the Key-Laboratory of In-situ Property-improving Mining of Ministry of Education, Taiyuan University of Technology and College of Mining Engineering, Taiyuan University of Technology.
Conflicts of Interest
The authors declare that there is no conflict of interest regarding the publication of this paper.
References
- Cao, A.; Dou, L.; Cai, W.; Gong, S.; Liu, S.; Jing, G. Case Study of Seismic Hazard Assessment in Underground Coal Mining Using Passive Tomography. Int. J. Rock Mech. Min. Sci. 2015, 78, 1–9. [Google Scholar] [CrossRef]
- Jiang, L.; Wu, Q.; Wu, Q.; Wang, P.; Xue, Y.; Kong, P.; Gong, B. Fracture Failure Analysis of Hard and Thick Key Layer and Its Dynamic Response Characteristics. Eng. Fail. Anal. 2019, 98, 118–130. [Google Scholar] [CrossRef]
- Wang, H.; Shi, R.; Lu, C.; Jiang, Y.; Deng, D.; Zhang, D. Investigation of Sudden Faults Instability Induced by Coal Mining. Saf. Sci. 2019, 115, 256–264. [Google Scholar] [CrossRef]
- Wang, C.; Cao, A.; Zhu, G.; Jing, G.; Li, J.; Chen, T. Mechanism of Rock Burst Induced by Fault Slip in an Island Coal Panel and Hazard Assessment Using Seismic Tomography: A Case Study from Xuzhuang Colliery, Xuzhou, China. Geosci. J. 2017, 21, 469–481. [Google Scholar] [CrossRef]
- Vardar, O.; Zhang, C.; Canbulat, I.; Hebblewhite, B. Numerical Modelling of Strength and Energy Release Characteristics of Pillar-Scale Coal Mass. J. Rock Mech. Geotech. Eng. 2019, 11, 935–943. [Google Scholar] [CrossRef]
- Khan, M.; He, X.; Farid, A.; Song, D.; Li, Z.; Tian, X.; Ni, M. A Novel Geophysical Method for Fractures Mapping and Risk Zones Identification in a Coalmine, Northeast, China. Energy Rep. 2021, 7, 3785–3804. [Google Scholar] [CrossRef]
- Romashov, A.N.; Tsygankov, S.S. Generalized Model of Rock Bursts. J. Min. Sci. 1993, 28, 420–423. [Google Scholar] [CrossRef]
- Salamon, M.D.G. Stability, Instability and Design of Pillar Workings. Int. J. Rock Mech. Min. Sci. Geomech. Abstr. 1970, 7, 613–631. [Google Scholar] [CrossRef]
- Chen, Z.H.; Tang, C.A.; Huang, R.Q. A Double Rock Sample Model for Rockbursts. Int. J. Rock Mech. Min. Sci. 1997, 34, 991–1000. [Google Scholar] [CrossRef]
- Ma, T.-H.; Tang, C.-A.; Tang, S.-B.; Kuang, L.; Yu, Q.; Kong, D.-Q.; Zhu, X. Rockburst Mechanism and Prediction Based on Microseismic Monitoring. Int. J. Rock Mech. Min. Sci. 2018, 110, 177–188. [Google Scholar] [CrossRef]
- Singh, S.P. Burst Energy Release Index. Rock Mech. Rock Eng. 1988, 21, 149–155. [Google Scholar] [CrossRef]
- Xu, Y.H.; Cai, M. Influence of Strain Energy Released from a Test Machine on Rock Failure Process. Can. Geotech. J. 2018, 55, 777–791. [Google Scholar] [CrossRef]
- Hudson, J.A.; Crouch, S.L.; Fairhurst, C. Soft, Stiff and Servo-Controlled Testing Machines: A Review with Reference to Rock Failure. Eng. Geol. 1972, 6, 155–189. [Google Scholar] [CrossRef]
- Cai, W.; Dou, L.; Si, G.; Cao, A.; He, J.; Liu, S. A Principal Component Analysis/Fuzzy Comprehensive Evaluation Model for Coal Burst Liability Assessment. Int. J. Rock Mech. Min. Sci. 2016, 81, 62–69. [Google Scholar] [CrossRef]
- Kidybiński, A. Bursting Liability Indices of Coal. Int. J. Rock Mech. Min. Sci. Geomech. Abstr. 1981, 18, 295–304. [Google Scholar] [CrossRef]
- Wang, J.-A.; Park, H.D. Comprehensive Prediction of Rockburst Based on Analysis of Strain Energy in Rocks. Tunn. Undergr. Space Technol. 2001, 16, 49–57. [Google Scholar] [CrossRef]
- Yian, T.; Guangzhong, S.; Zhi, G. A composite index Krb criterion for the ejection characteristics of the burst rock. Chin. J. Geol. 1991, 26, 193–200. [Google Scholar]
- Martin, C.D.; Kaiser, P.K.; McCreath, D.R. Hoek-Brown Parameters for Predicting the Depth of Brittle Failure around Tunnels. Can. Geotech. J. 1999, 36, 136–151. [Google Scholar] [CrossRef]
- Mitri, H.S. Assessment of Horizontal Pillar Burst in Deep Hard Rock Mines. Int. J. Risk Assess. Manag. 2007, 7, 695–707. [Google Scholar] [CrossRef]
- Zhou, J.; Li, X.; Shi, X. Long-Term Prediction Model of Rockburst in Underground Openings Using Heuristic Algorithms and Support Vector Machines. Saf. Sci. 2012, 50, 629–644. [Google Scholar] [CrossRef]
- Liu, Z.; Shao, J.; Xu, W.; Meng, Y. Prediction of Rock Burst Classification Using the Technique of Cloud Models with Attribution Weight. Nat. Hazards 2013, 68, 549–568. [Google Scholar] [CrossRef]
- Cai, W.; Dou, L.; Zhang, M.; Cao, W.; Shi, J.-Q.; Feng, L. A Fuzzy Comprehensive Evaluation Methodology for Rock Burst Forecasting Using Microseismic Monitoring. Tunn. Undergr. Space Technol. 2018, 80, 232–245. [Google Scholar] [CrossRef]
- Sabapathy, R.; Paul, P.S.; Mandal, P.K. Evaluation of Bump-Proneness of Underground Coal Mines Using Burst Energy Coefficient. Arab. J. Geosci. 2019, 12, 1–16. [Google Scholar] [CrossRef]
- Gong, F.; Yan, J.; Li, X.; Luo, S. A Peak-Strength Strain Energy Storage Index for Rock Burst Proneness of Rock Materials. Int. J. Rock Mech. Min. Sci. 2019, 117, 76–89. [Google Scholar] [CrossRef]
- Gong, F.; Wang, Y.; Wang, Z.; Pan, J.; Luo, S. A New Criterion of Coal Burst Proneness Based on the Residual Elastic Energy Index. Int. J. Min. Sci. Technol. 2021, 31, 553–563. [Google Scholar] [CrossRef]
- Dai, L.; Pan, Y.; Li, Z.; Wang, A.; Xiao, Y.; Liu, F.; Shi, T.; Zheng, W. Quantitative Mechanism of Roadway Rockbursts in Deep Extra-Thick Coal Seams: Theory and Case Histories. Tunn. Undergr. Space Technol. 2021, 111, 103861. [Google Scholar] [CrossRef]
- Dai, L.; Pan, Y.; Zhang, C.; Wang, A.; Canbulat, I.; Shi, T.; Wei, C.; Cai, R.; Liu, F.; Gao, X. New Criterion of Critical Mining Stress Index for Risk Evaluation of Roadway Rockburst. Rock Mech. Rock Eng. 2022, 55, 4783–4799. [Google Scholar] [CrossRef]
- Al-Harthi, A.A.; Al-Amri, R.M.; Shehata, W.M. The Porosity and Engineering Properties of Vesicular Basalt in Saudi Arabia. Eng. Geol. 1999, 54, 313–320. [Google Scholar] [CrossRef]
- Palchik, V. Influence of Porosity and Elastic Modulus on Uniaxial Compressive Strength in Soft Brittle Porous Sandstones. Rock Mech. Rock Eng. 1999, 32, 303–309. [Google Scholar] [CrossRef]
- Chang, C.; Zoback, M.D.; Khaksar, A. Empirical Relations between Rock Strength and Physical Properties in Sedimentary Rocks. J. Pet. Sci. Eng. 2006, 51, 223–237. [Google Scholar] [CrossRef]
- Nambiar, E.K.K.; Ramamurthy, K. Air-void Characterisation of Foam Concrete. Cem. Concr. Res. 2007, 37, 221–230. [Google Scholar] [CrossRef]
- Schaefer, L.N.; Kendrick, J.E.; Oommen, T.; Lavallée, Y.; Chigna, G. Geomechanical Rock Properties of a Basaltic Volcano. Front. Earth Sci. 2015, 3, 29. [Google Scholar] [CrossRef] [Green Version]
- Hilal, A.A.; Thom, N.H.; Dawson, A.R. On Void Structure and Strength of Foamed Concrete Made without/with Additives. Constr. Build. Mater. 2015, 85, 157–164. [Google Scholar] [CrossRef]
- Jamshidi, A.; Zamanian, H.; Zarei Sahamieh, R. The Effect of Density and Porosity on the Correlation between Uniaxial Compressive Strength and P-Wave Velocity. Rock Mech. Rock Eng. 2018, 51, 1279–1286. [Google Scholar] [CrossRef]
- He, J.; Gao, Q.; Song, X.; Bu, X.; He, J. Effect of Foaming Agent on Physical and Mechanical Properties of Alkali-Activated Slag Foamed Concrete. Constr. Build. Mater. 2019, 226, 280–287. [Google Scholar] [CrossRef]
- Namiki, A.; Tanaka, Y.; Okumura, S.; Sasaki, O.; Sano, K.; Takeuchi, S. Fragility and an Extremely Low Shear Modulus of High Porosity Silicic Magma. J. Volcanol. Geotherm. Res. 2020, 392, 106760. [Google Scholar] [CrossRef]
- Hughes, A.; Kendrick, J.E.; Lamur, A.; Wadsworth, F.B.; Wallace, P.A.; Di Toro, G.; Lavallée, Y. Frictional Behaviour, Wear and Comminution of Synthetic Porous Geomaterials. Front. Earth Sci. 2020, 8, 562548. [Google Scholar] [CrossRef]
- Mineo, S.; Pappalardo, G. Nondestructive Rock Porosity Estimation by InfraRed Thermography Applied to Natural Stones. Constr. Build. Mater. 2022, 342, 127950. [Google Scholar] [CrossRef]
- Zengin, E.; Erguler, Z.A. Experimental Investigation of Pore-Fracture Relationship on Failure Behaviour of Porous Rock Materials. Bull. Eng. Geol. Environ. 2022, 81, 1–16. [Google Scholar] [CrossRef]
- Cao, A.; Liu, Y.; Jiang, S.; Hao, Q.; Peng, Y.; Bai, X.; Yang, X. Numerical Investigation on Influence of Two Combined Faults and Its Structure Features on Rock Burst Mechanism. Minerals 2021, 11, 1438. [Google Scholar] [CrossRef]
- Bubeck, A.; Walker, R.J.; Healy, D.; Dobbs, M.; Holwell, D.A. Pore Geometry as a Control on Rock Strength. Earth Planet. Sci. Lett. 2017, 457, 38–48. [Google Scholar] [CrossRef]
- Griffiths, L.; Heap, M.J.; Xu, T.; Chen, C.; Baud, P. The Influence of Pore Geometry and Orientation on the Strength and Stiffness of Porous Rock. J. Struct. Geol. 2017, 96, 149–160. [Google Scholar] [CrossRef]
- Obara, Y.; Tanikura, I.; Jung, J.; Shintani, R.; Watanabe, S. Evaluation of Micro-Damage of Concrete Specimens under Cyclic Uniaxial Loading by X-ray CT Method. J. Adv. Concr. Technol. 2016, 14, 433–443. [Google Scholar] [CrossRef] [Green Version]
- Heap, M.J.; Xu, T.; Chen, C. The Influence of Porosity and Vesicle Size on the Brittle Strength of Volcanic Rocks and Magma. Bull. Volcanol. 2014, 76, 1–15. [Google Scholar] [CrossRef]
- Nguyen, T.T.; Bui, H.H.; Ngo, T.D.; Nguyen, G.D. Experimental and Numerical Investigation of Influence of Air-Voids on the Compressive Behaviour of Foamed Concrete. Mater. Des. 2017, 130, 103–119. [Google Scholar] [CrossRef]
- Zhu, Y.; Luo, G.; Zhang, R.; Cao, P.; Liu, Q.; Zhang, J.; Sun, Y.; Li, J.; Shen, Q.; Zhang, L. Numerical Simulation of Static Mechanical Properties of PMMA Microcellular Foams. Compos. Sci. Technol. 2020, 192, 108110. [Google Scholar] [CrossRef]
- Zhang, R.; Chen, J.; Zhu, Y.; Zhang, J.; Luo, G.; Cao, P.; Shen, Q.; Zhang, L. Correlation Between the Structure and Compressive Property of PMMA Microcellular Foams Fabricated by Supercritical CO2 Foaming Method. Polymers 2020, 12, 315. [Google Scholar] [CrossRef] [PubMed]
- Wang, Z.M.; Kwan, A.K.H.; Chan, H.C. Mesoscopic Study of Concrete I: Generation of Random Aggregate Structure and Finite Element Mesh. Comput. Struct. 1999, 70, 533–544. [Google Scholar] [CrossRef]
- Wang, S.Y.; Sloan, S.W.; Tang, C.A. Three-Dimensional Numerical Investigations of the Failure Mechanism of a Rock Disc with a Central or Eccentric Hole. Rock Mech. Rock Eng. 2014, 47, 2117–2137. [Google Scholar] [CrossRef]
- Liang, Z.Z.; Tang, C.A.; Li, H.X.; Xu, T.; Zhang, Y.B. Numerical Simulation of 3-d Failure Process in Heterogeneous Rocks. Int. J. Rock Mech. Min. Sci. 2004, 41, 323–328. [Google Scholar] [CrossRef]
- Liang, Z.Z.; Xing, H.; Wang, S.Y.; Williams, D.J.; Tang, C.A. A Three-Dimensional Numerical Investigation of the Fracture of Rock Specimens Containing a Pre-Existing Surface Flaw. Comput. Geotech. 2012, 45, 19–33. [Google Scholar] [CrossRef]
- Lin, Y.; Li, C.; Ma, J.; Lei, M.; Huang, L. Effects of Void Morphology on Fracturing Characteristics of Porous Rock through a Finite-Discrete Element Method. J. Nat. Gas Sci. Eng. 2022, 104, 104684. [Google Scholar] [CrossRef]
- Dong, L.; Chen, Y.; Sun, D.; Zhang, Y. Implications for Rock Instability Precursors and Principal Stress Direction from Rock Acoustic Experiments. Int. J. Min. Sci. Technol. 2021, 31, 789–798. [Google Scholar] [CrossRef]
- You, W.; Dai, F.; Liu, Y.; Du, H.; Jiang, R. Investigation of the Influence of Intermediate Principal Stress on the Dynamic Responses of Rocks Subjected to True Triaxial Stress State. Int. J. Min. Sci. Technol. 2021, 31, 913–926. [Google Scholar] [CrossRef]
- Hao, Z.; Zuo, Y.; Liu, H.; Zhu, Z.; Lin, J.; Sun, W.; Pan, C.; Zheng, L. Mesoscopic Damage Evolution Characteristics of Jointed Sandstone under Different Loading Conditions. Geomech. Geophys. Geo-Energ. Geo-Resour. 2022, 8, 1–19. [Google Scholar] [CrossRef]
Figure 1.
Photograph of a coal rock sample from a mine in Shanxi. (a) Photographed at 45° above oblique; (b) End view of the coal sample.
Figure 1.
Photograph of a coal rock sample from a mine in Shanxi. (a) Photographed at 45° above oblique; (b) End view of the coal sample.

Figure 2.
Mechanical properties testing of coal samples.

Figure 3.
Numerical simulation model.

Figure 4.
Stress field and displacement field evolution clouds. (a) Cloud diagram of the evolution of stress and displacement fields of specimens without porosity. (b) Cloud diagram of stress and displacement field evolution of pore specimen.
Figure 4.
Stress field and displacement field evolution clouds. (a) Cloud diagram of the evolution of stress and displacement fields of specimens without porosity. (b) Cloud diagram of stress and displacement field evolution of pore specimen.

Figure 5.
Variation curve of compressive strength of specimens under different pore characteristics. (a) Uniaxial compressive strength-porosity relationship diagram; (b) Uniaxial compressive strength-pore size relationship diagram.
Figure 5.
Variation curve of compressive strength of specimens under different pore characteristics. (a) Uniaxial compressive strength-porosity relationship diagram; (b) Uniaxial compressive strength-pore size relationship diagram.

Figure 6.
Fitted curve of compressive strength vs. pore size for coal rock model. (a) Uniaxial compressive strength-porosity fitting curve. (b) Uniaxial compressive strength-porosity fitting curve.
Figure 6.
Fitted curve of compressive strength vs. pore size for coal rock model. (a) Uniaxial compressive strength-porosity fitting curve. (b) Uniaxial compressive strength-porosity fitting curve.

Figure 7.
Fitting curves of parameters A and B vs. porosity. (a) Fitting curve of parameter A and porosity. (b) Fitting curve of parameter B and porosity.
Figure 7.
Fitting curves of parameters A and B vs. porosity. (a) Fitting curve of parameter A and porosity. (b) Fitting curve of parameter B and porosity.

Figure 8.
Uniaxial compressive strength fitting effect.

Figure 9.
Stress–strain curves of materials with different pore characteristics.

Figure 10.
Variation curve of impact energy index of specimens under different pore characteristics. (a) Impact energy index-porosity relationship diagram; (b) Impact energy index-pore size relationship diagram.
Figure 10.
Variation curve of impact energy index of specimens under different pore characteristics. (a) Impact energy index-porosity relationship diagram; (b) Impact energy index-pore size relationship diagram.

Figure 11.
Pre-peak and post-peak area statistics.

Figure 12.
Distribution of fractures after crushing under different pore characteristics.

Figure 13.
The coal rock model impact energy index and pore size fitting curve. (a) Impact energy index-porosity fitting curve. (b) Impact energy index-porosity fitting curve.
Figure 13.
The coal rock model impact energy index and pore size fitting curve. (a) Impact energy index-porosity fitting curve. (b) Impact energy index-porosity fitting curve.

Figure 14.
Fitting curve for parameter D vs. porosity.

Figure 15.
Impact energy index fitting effect.

Figure 16.
Statistical graph of elastic energy index in coal rock model.

Figure 17.
Experimental results for elastic energy index.

Figure 18.
Comparison of elastic and plastic stages.


Table 1.
Elastic Modulus of coal samples.
| Specimen Number | Density | Uniaxial Compressive Strength | Elastic Modulus E/GPa | Poisson’s Ratio | Angle of Internal Friction |
|---|---|---|---|---|---|
| 1 | 1.44 | 6.87 | 6.37 | 0.34 | 28 |
| 2 | 1.53 | 7.54 | 6.23 | 0.27 | 30 |
| 3 | 1.55 | 7.55 | 5.59 | 0.33 | 29.5 |
| 4 | 1.51 | 7.32 | 5.64 | 0.31 | 27 |
| 5 | 1.47 | 7.22 | 6.07 | 0.25 | 32 |
| Average | 1.5 | 7.30 | 5.98 | 0.3 | 30 |
Table 2.
Parameters used in RFPA numerical simulation model.
| Materials | Density | Uniaxial Compressive Strength | Elastic Modulus E/GPa | Poisson’s Ratio | Angle of Internal Friction |
|---|---|---|---|---|---|
| Coal matrix | 1500 | 35.78 | 8.03 | 0.3 | 30 |
| Pore structures | 1 × 10⁻⁸ | 0.1 | 1 × 10⁻¹⁴ | 0.498 | 30 |
Table 3.
Test results for material elastic modulus E and plastic softening modulus λ.
| Specimen Number | Porosity (%) | Pore Size (mm) | Uniaxial Compressive Strength (MPa) | Elastic Modulus E/(MPa) | Plastic Softening Modulus λ/(MPa) |
|---|---|---|---|---|---|
| Program 1 | 0 | 0 | 7.37 | 6330 | 9930 |
| Program 2 | 5 | 0.5 | 6.14 | 5646 | 9360 |
| Program 3 | 10 | 0.5 | 4.99 | 4956 | 9500 |
| Program 4 | 5 | 1 | 5.18 | 5436 | 6780 |
| Program 5 | 10 | 1 | 3.83 | 4580 | 5120 |
| Program 6 | 5 | 1.5 | 4.79 | 5363 | 7590 |
| Program 7 | 10 | 1.5 | 3.29 | 4388 | 4130 |
Disclaimer/Publisher’s Note: The statements, opinions and data contained in all publications are solely those of the individual author(s) and contributor(s) and not of MDPI and/or the editor(s). MDPI and/or the editor(s) disclaim responsibility for any injury to people or property resulting from any ideas, methods, instructions or products referred to in the content. |
© 2023 by the authors. Licensee MDPI, Basel, Switzerland. This article is an open access article distributed under the terms and conditions of the Creative Commons Attribution (CC BY) license (https://creativecommons.org/licenses/by/4.0/).
Share and Cite
MDPI and ACS Style
Yang, H.; Lian, Q.; Shang, J.; Chen, X. Numerical Simulation Study of the Effect of Fine View Pore Structure on Rock Burst. Minerals 2023, 13, 146. https://0-doi-org.brum.beds.ac.uk/10.3390/min13020146
AMA Style
Yang H, Lian Q, Shang J, Chen X. Numerical Simulation Study of the Effect of Fine View Pore Structure on Rock Burst. Minerals. 2023; 13(2):146. https://0-doi-org.brum.beds.ac.uk/10.3390/min13020146
Chicago/Turabian StyleYang, Haoru, Qingwang Lian, Jin Shang, and Xinlin Chen. 2023. "Numerical Simulation Study of the Effect of Fine View Pore Structure on Rock Burst" Minerals 13, no. 2: 146. https://0-doi-org.brum.beds.ac.uk/10.3390/min13020146
Note that from the first issue of 2016, this journal uses article numbers instead of page numbers. See further details here.