Article

Structure Evolution of CaCO3 Precipitates Formed during the Bacillus cereus Induced Biomineralization

by
Lyubov A. Ivanova
1,*,
Darya A. Golovkina
1,
Elena V. Zhurishkina
1,
Yulia E. Gorshkova
2,3,
Alexey D. Yapryntsev
4,
Alexander E. Baranchikov
4,*,
Natalia V. Tsvigun
5,
Gennady P. Kopitsa
1,6,
Anna A. Kulminskaya
1 and
Dmitry V. Lebedev
1
1
Petersburg Nuclear Physics Institute Named by B.P. Konstantinov of National Research Center “Kurchatov Institute”, 1, mkr. Orlova roshcha, 188300 Gatchina, Russia
2
Frank Laboratory of Neutron Physics, Joint Institute for Nuclear Research, Joliot-Curie Str. 6, 141980 Dubna, Russia
3
Institute of Physics, Kazan Federal University, 16a Kremlyovskaya St., 420008 Kazan, Russia
4
Kurnakov Institute of General and Inorganic Chemistry of the Russian Academy of Sciences, 119071 Moscow, Russia
5
Federal Scientific Research Center “Crystallography and Photonics” of the Russian Academy of Sciences, Leninsky pr. 59, 119333 Moscow, Russia
6
Grebenshchikov Institute of Silicate Chemistry of the Russian Academy of Sciences, Adm. Makarova emb., 2, 199034 St. Petersburg, Russia
*
Authors to whom correspondence should be addressed.
Submission received: 15 March 2023 / Revised: 15 May 2023 / Accepted: 26 May 2023 / Published: 30 May 2023

Abstract

:
Biomineralization is a universal process that has implications in a variety of areas, from civil engineering to medicine. While crystallization of amorphous CaCO3 formed in vitro is known to precede the vaterite-calcite/aragonite pathway, this process could be significantly altered when induced by bacteria, particularly within the extracellular matrix (ECM) of microbial cells. We used a combination of SEM, SANS, SAXS, FTIR and XRD methods to investigate the structure of CaCO3 formed during biomineralization induced by planktonic Bacillus cereus. Formation of precipitates in the presence of CaCl2 and urea was observed both during bacterial growth and in the medium devoid of bacteria and ECM (cell-free system). The pathway for polymorphic transformations of CaCO3 from the amorphous phase to vaterite and further to calcite was confirmed for the bacterium-induced mineralization and did not depend on the concentration of Ca2+ and urea. The structure of CaCO3 sediments differed when formed in cell-free and bacterial systems and varied depending on time and the medium composition. The rate of precipitation was accelerated in the presence of DNA, which had little effect on the solid phase structure in the cell-free system, while strongly affecting the structure and polymorphic composition of the precipitates in bacterial culture.

1. Introduction

The process of biomineralization induced by bacterial cells is often considered in the context of civil engineering technologies, for example for the repair of concrete constructions [1,2,3,4,5], or for soil stabilization [3,6,7]. The study of biomineralization is also important for solving clinical problems associated with the stationary urinary catheter incrustation induced by microorganisms that use urea in their metabolic reactions [8,9,10]. Several groups of scientists have shown the relationship of macromolecules in bacterial biofilms with the process of calcium carbonate precipitation. However, most of these works were devoted to models of encrusted biofilms formed on a solid medium surface that are far from being applicable to the above-mentioned technologies [11,12,13,14,15]. In our recent work [16], we showed the key role of extracellular DNA (eDNA) during biomineralization and formation of the extracellular matrix (ECM) in the planktonic culture of the bacterium B. cereus. While not excluding the influence of amyloid proteins and polysaccharides of ECM, our results gave a strong indication that calcium carbonate precipitation depends on the presence of eDNA, which apparently affected the structures of mineral aggregates.
It is well known that during the precipitation of calcium carbonate both in vitro and in vivo (in the cellular environment), amorphous calcium carbonate (ACC) is formed first, followed by crystallization over time [17] along the pathway [18] depending on environmental conditions (pH, concentration of Ca2+ and carbonate ions [19]) and, if the medium contains bacteria, a bacterial strain [20,21]. Recently, a large number of articles have focused specifically on ACC [22,23,24,25,26] because several reports indicated that the further path of crystallization of the mineral directly depends on the formation of its amorphous structure [27]. However, data on the nano- and meso-structure of precipitates formed during bacterial biomineralization are extremely fragmentary and rare. The most comprehensive description of the nano- and meso-structure of ACC synthesized and stabilized in vitro was described by Simon M. Clark et al. [28], who used neutron and X-ray scattering methods to eliminate inconsistencies in the previously reported data on the ACC structure [29]. Stabilization of ACC is necessary since the time of its transition to vaterite and calcite polymorphs in vitro is no more than 2 min at pH 10.5 [30]. J. Tobler et al. showed that an increase in pH contributes to the stabilization of ACC, slowing down the crystallization process and the passage of the vaterite phase in which ACC crystallizes into calcite [30]. In a bacterial environment, the polymorphic transition of CaCO3 takes many hours and occurs at significantly lower pH values (about 7.5 [16,31]). Such stabilization may be explained by the presence of organic inclusions (polysaccharides, eDNA or amyloids) in the extracellular matrix, since the stabilizing role of some macromolecules such as polyaspartic acid, polyethylene glycol and dendrimers was demonstrated in the in vitro system [32], as was stabilization by protein structures for the system in vivo [33].
There are three polymorphic modifications of anhydrous calcium carbonate that crystallizes from ACC: metastable vaterite with a hexagonal substructure, and two stable polymorphs, orthorhombic aragonite (Pmcn) and rhombohedral calcite (R3c) [34]. The ACC crystallization path is largely determined by the polyamorphism or “prestructure” of calcium carbonate [23], that is, the near-order at the nano- or meso-sized structures. To the best of our knowledge, there are no studies of the nano- and meso-sized structures of polymorphs formed during calcium carbonate crystallization or polymorphic transitions in a system containing bacterial cells. However, there are a large number of publications in which the chemical composition of precipitates formed during biomineralization process was characterized by various methods, mainly IR spectroscopy [35,36,37], XRD [31,34,35,36,37,38], SEM, FIB and EDX [31,34]. The above methods were frequently used to describe the morphology [31,34,36] and polymorphic composition of crystals [31,34,35,36]), which varied in different types of bacteria. These might include, besides the widespread phases (vaterite, ACC and calcite), rare aragonite and hydrated crystalline phases of monohydrocalcite, hexahydrocalcite or even ikaite not commonly observed in the in vitro system but occurring in nature [20].
The aim of the present work was to fill in the gap in information about the structural features of calcium carbonate biomineralization. Using a complex of physical methods including IR spectroscopy, XRD, SEM, SANS and SAXS, we further studied the evolution of the crystal and supramolecular structure of calcium carbonate precipitates formed during biomineralization induced by B. cereus planktonic culture [16]. We also investigated the effect of the eDNA removal from ECM on the structure of the bioorganic aggregates and compared the structure and morphology of precipitates formed in bacterial culture and in a cell-free system with and without DNA.

2. Materials and Methods

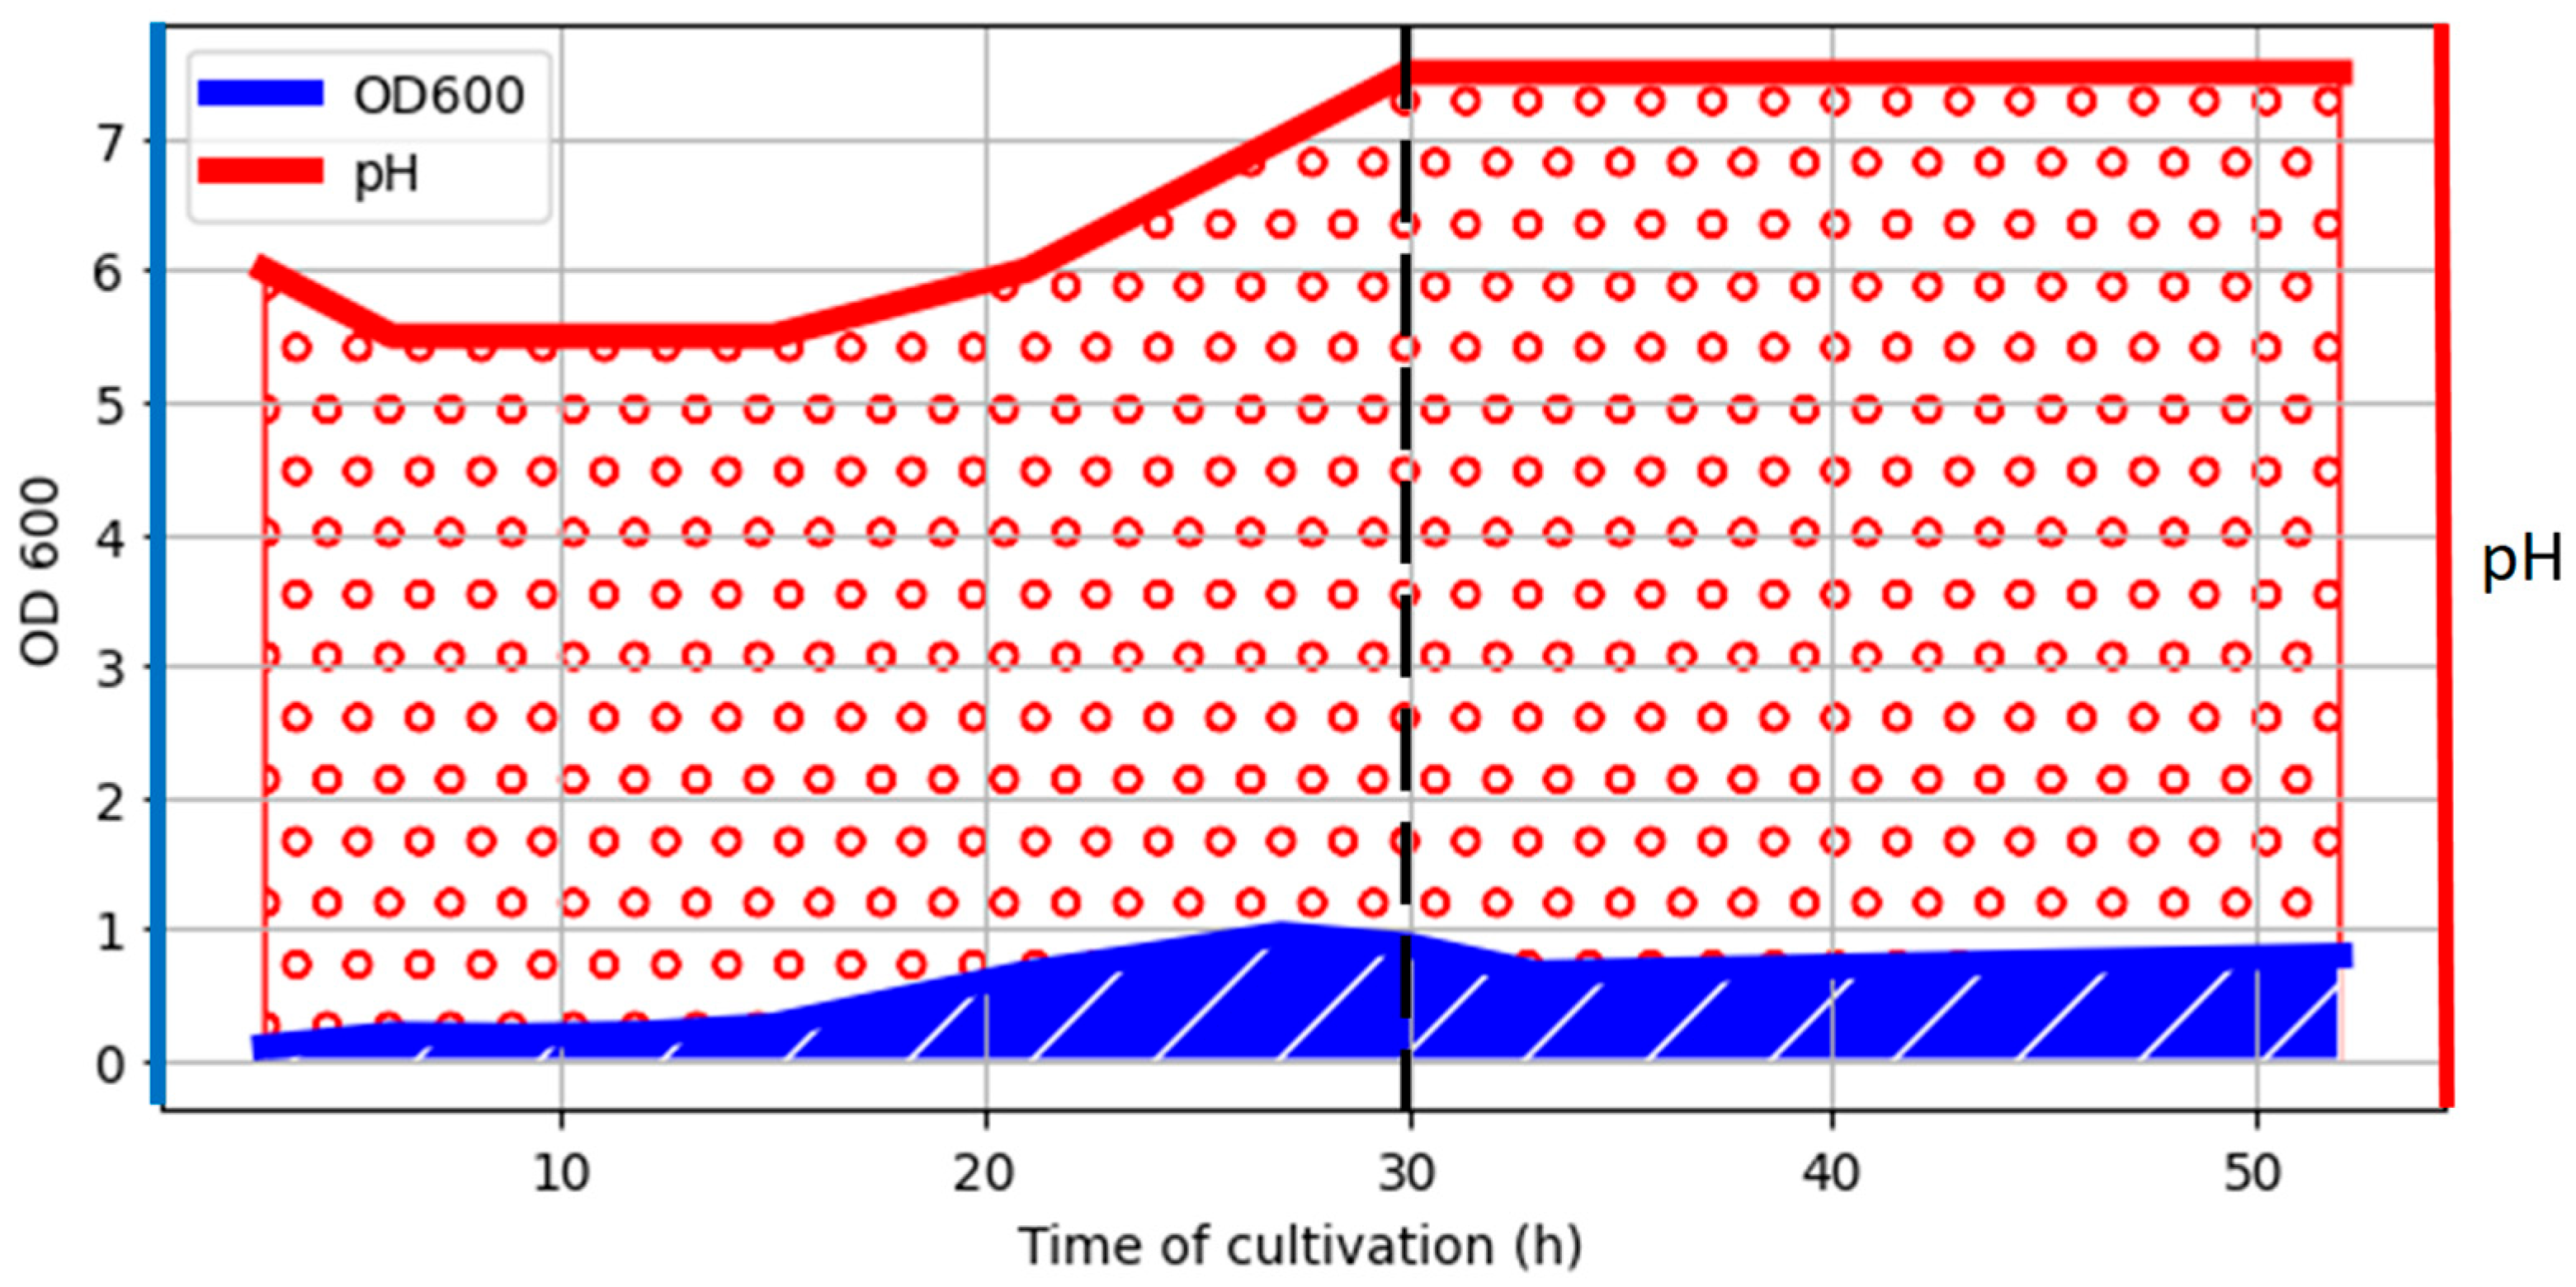
2.1. Bacterium Growth and Sample Preparations

The strain Bacillus cereus 4B (an undomesticated prototrophic strain from our laboratory collection) [39] deposited at the National Bioresource Center “All-Russian Collection of Industrial Microorganisms” under the number B-14265 was maintained on LB medium (peptone 10 g/L, yeast extract 5 g/L and NaCl 10 g/L) containing 1% agar. To assess the influence of the concentration of urea and Ca2+ ions on the structure of CaCO3 precipitation, two variants of standard B4 medium (yeast extract, 2 g/L; glucose, 10 g/L) were used: B4 with urea and CaCl2 when the concentration of both components was 25 g/L, and B4 with urea and CaCl2 when the concentration of both components was 2.5 g/L. In our model system with planktonic culture, high concentrations of calcium and urea were used to produce calcium carbonate crystals, with a high yield required. Pre-sterilized solutions of urea or/and CaCl2 were added separately to the corresponding medium after autoclavation.
The inoculum was preliminary grown in LB medium overnight and transferred into the 500 mL flasks containing 100 mL of the appropriate B4 medium and cultivated for 52 h at 37 °C with shaking at 110 rpm. Two-milliliter aliquots were withdrawn every 3 h followed by cooling to the room temperature (25 °C) for subsequent experiments.
Biomass changes during the cultivation were routinely monitored in all media by measurements of the culture liquid optical absorbance at 600 nm using a spectrophotometer Hitachi U-3310. Values for pH were monitored using a pH-meter (HANNA instruments HI8519N, Smithfield, RI, USA) and pH-indicator strips (Merck KGaA, Darmstadt, Germany) where appropriate.
Samples for research (FTIR, XRD, SANS, SAXS and SEM) were washed to remove the culture medium, bacterial cells and extracellular matrix by repeated reprecipitation in water and were dried in air at a temperature of 37 °C under sterile conditions.

2.2. Cell-Free Experiment

To study the effect of DNA on the precipitation of calcium carbonate in a cell-free system, we used the supernatant obtained after growing B. cereus in B4 medium [16,40] with the addition of an excess of urea (25 g/L or 2.5 g/L). After the pH of the culture medium in each vial reached a value of 8, the cells and their associated ECM were separated from the supernatant (12,000 rpm, 15 min) followed by the addition of calcium chloride (25 g/L or 2.5 g/L) and salmon sperm DNA (30 μg/mL) and were incubated for 2 h at 37 °C. The precipitate was registered spectrophotometrically at 540 nm [41].

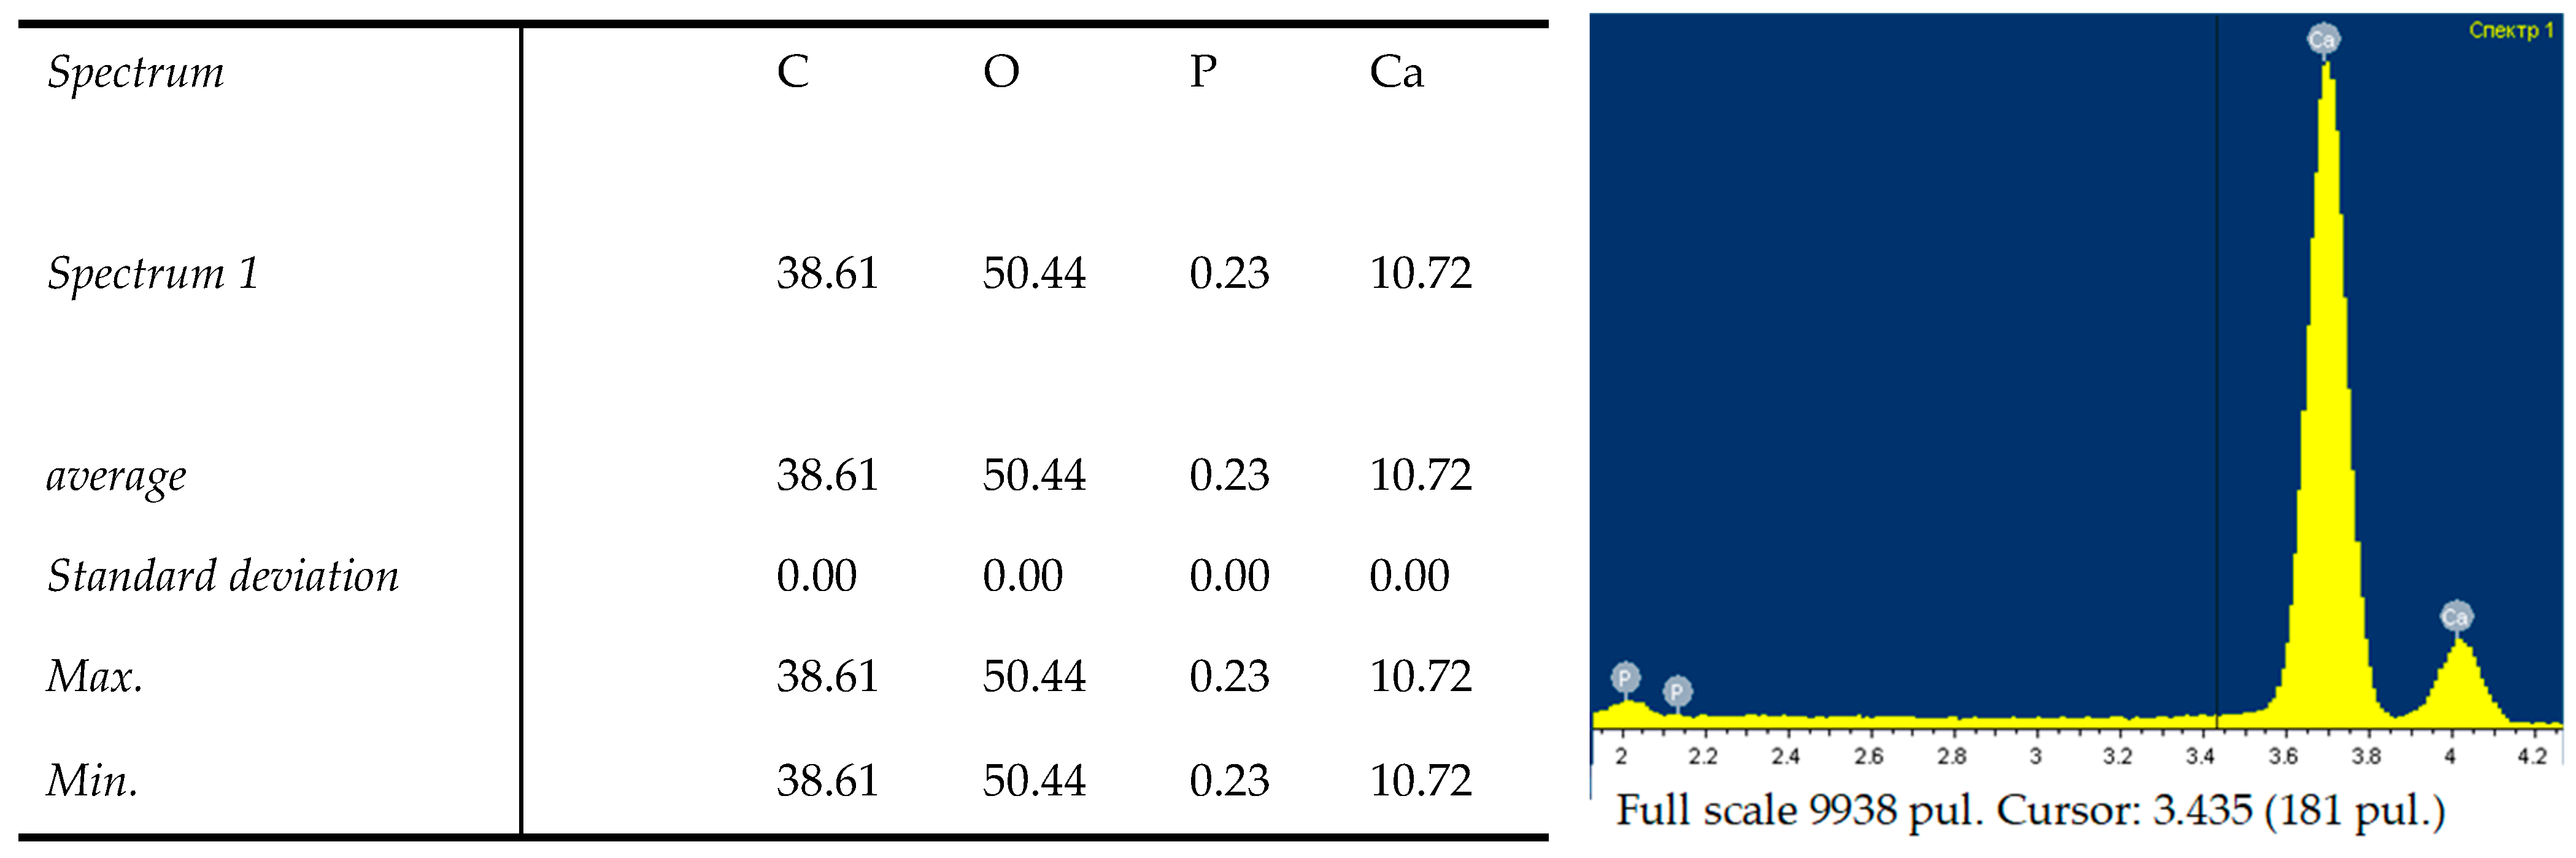
2.3. Scanning Electron Microscopy (SEM) and Energy-Dispersive X-ray (EDX) Analyses

Electron micrographs were obtained using a Carl Zeiss NVision 40 scanning electron microscope with Schottky field emission. The samples were applied in the form of powder on a conductive carbon tape. The samples were not coated. Images were taken at an accelerating voltage of 1 kV, 3.5 mm work distance using a secondary electron detector (Everhart-Thornley) at ×1000−100,000 magnifications. Energy-dispersive X-ray spectroscopy (EDS) was performed using an Oxford Instruments X-Max EDS detector at an accelerating voltage of 20 kV, 5 mm work distance calibrated with a cobalt standard. The EDS results were processed using INCA software.

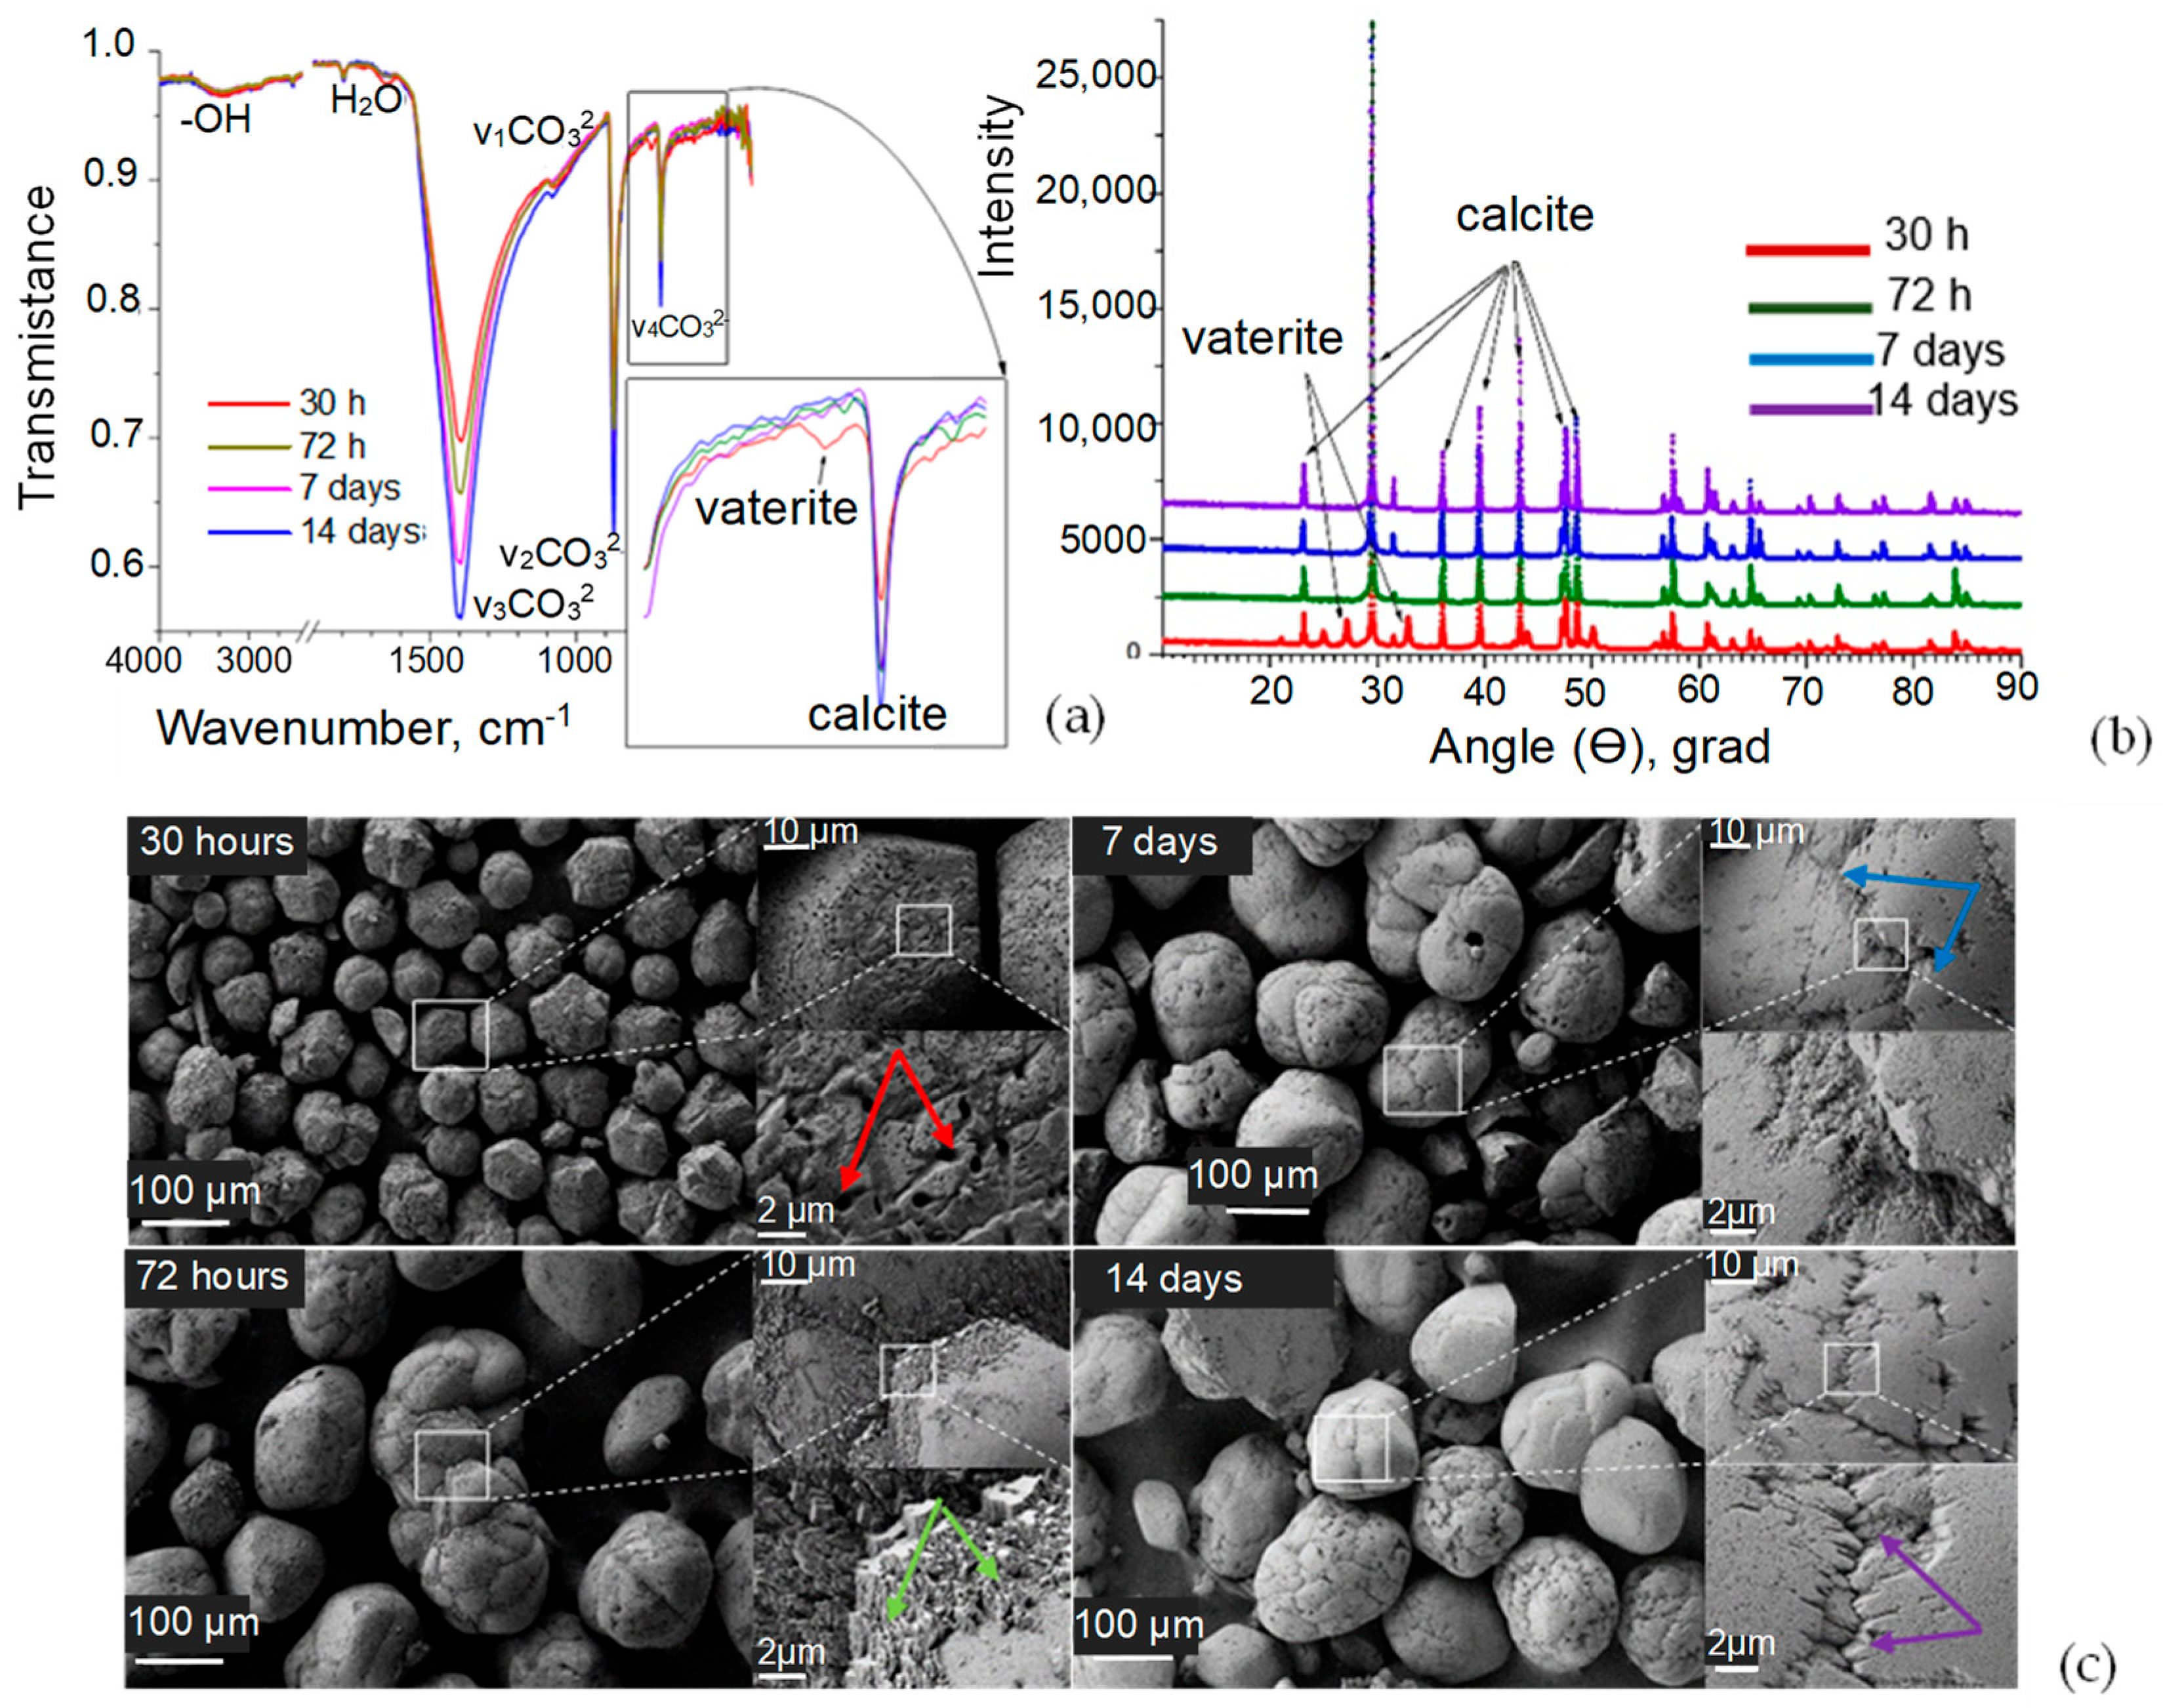
2.4. XRD and FTIR Analyses

Powder X-ray diffraction (XRD) analysis of the samples was performed on a Rigaku Miniflex 600 diffractometer (Bragg–Brentano geometry) with Ni-filtered Cu Kα (λ = 1.5418 Å) radiation and a LYNXEYE detector. Diffraction patterns were recorded in the 10–70° 2θ range, with a step of 0.02° and collection time of 0.3 s/step. Structure models were obtained from the Crystallography Open Database [42].
The Fourier-Transformed Infrared Spectroscopy (FTIR) spectra of samples were recorded on an ALPHA IR Fourier spectrometer (Brucker) in the attenuated total reflectance (ATR) mode in the range of 400–4000 cm−1 with a resolution of 1.5 cm−1. No ATR correction was applied.

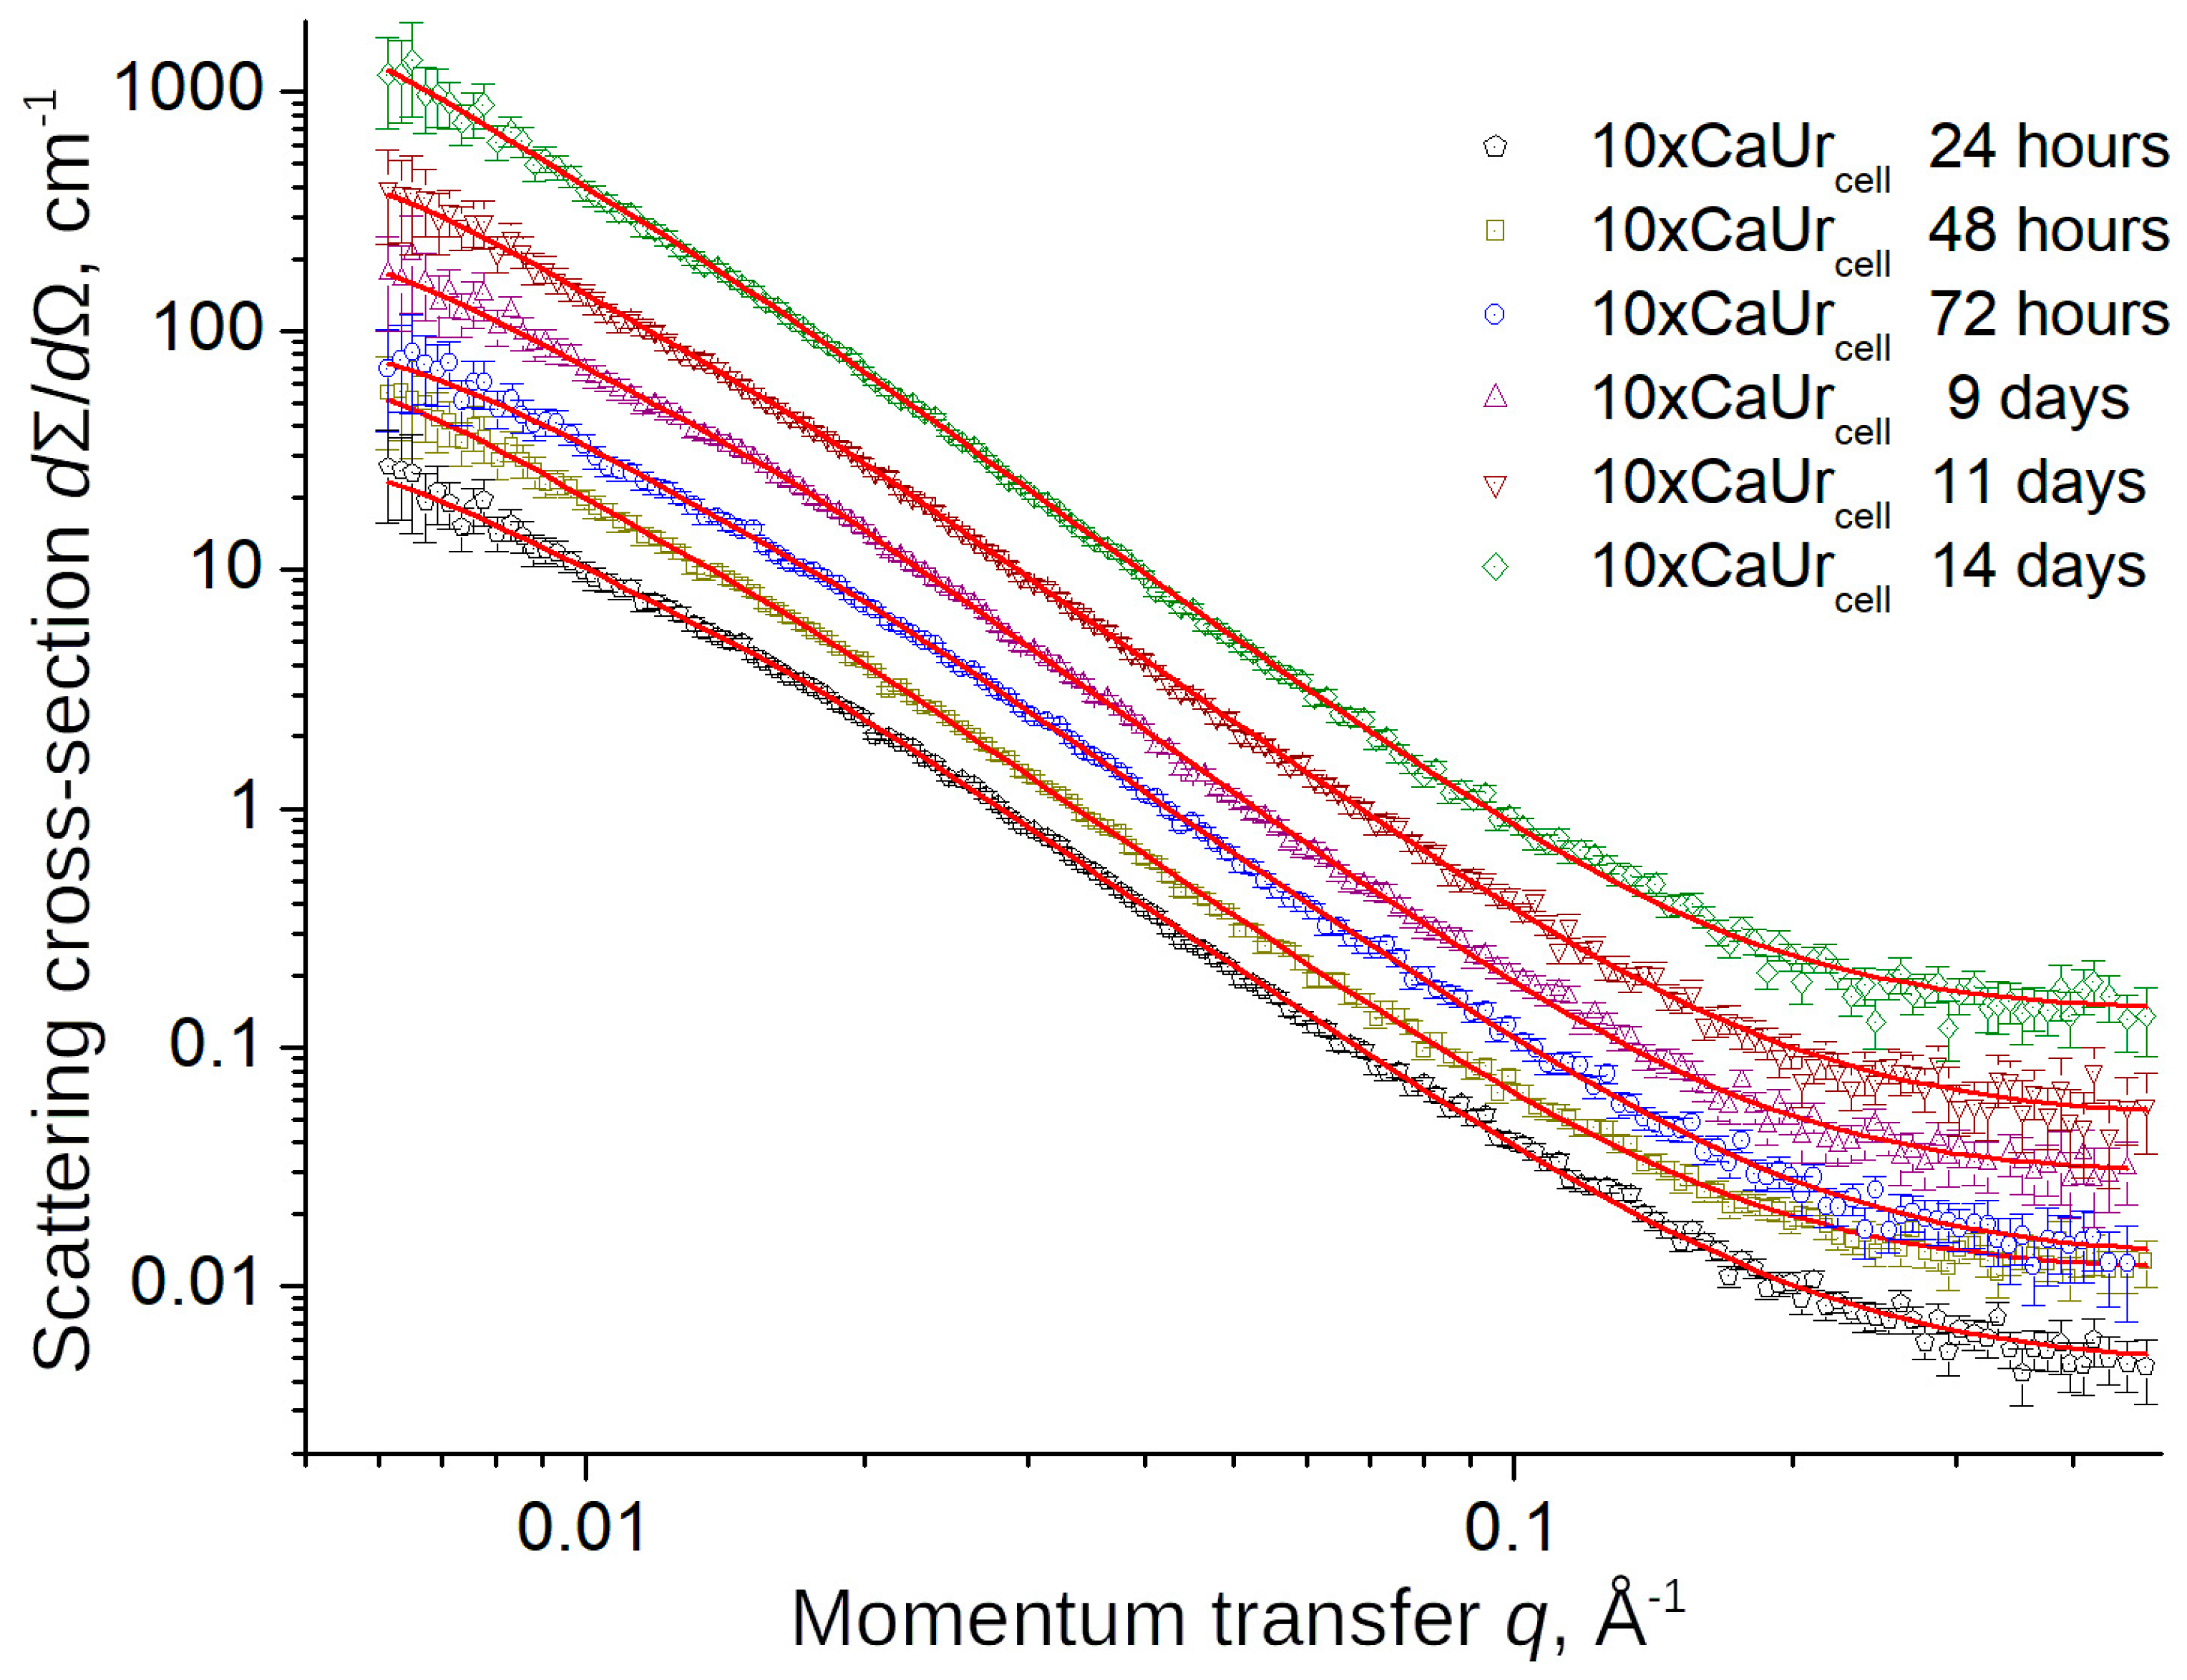
2.5. SAXS and SANS Analyses

SAXS measurements were carried out using a Xeuss 3.0 SAXS/WAXS system (Joint Institute for Nuclear Research, Dubna, Russia) operating in point geometry and using a GeniX 3D microfocus X-ray generator with Cu Kα (λ = 1.54 Å) in the 30 W/30 µm mode. The spectrometer was equipped with an Eiger2 R1 M mobile detector with a sensitive area of 77.1 mm × 79.7 mm (pixel size 75 µm). The measurements were carried out using three distances from the sample to the detector (45, 400 and 4500 mm), in a vacuum at room temperature, to obtain the differential cross section for small-angle scattering (q)/ normalized to amorphous carbon (Glassy Carbon).
Small-angle Neutron Scattering (SANS) analysis of CaCO3 samples was performed using a YuMO time-of-flight spectrometer at the IBR-2 pulsed reactor (Dubna, Moscow region, Russia). Standard data acquisition time per sample was 40 min. Two ring wire He3-detectors at distances of 4 m and 13 m from the sample position were used in our experiments. The scattered intensity (differential cross section per sample volume) was registered as a function of the momentum transfer modulus q = (4π/λ)∙sin(θ/2), where θ is the scattering angle and λ is the incident neutron wavelength. An incident neutron beam distribution provides an available wavelength range of 0.05 ÷ 0.8 nm, which corresponds to a momentum transfer range q of 7∙10 − 2 ÷ 5 nm−1. The raw data treatment was carried out by the SAS program [Available online: https://zenodo.org/record/2561236#.YzqZInZByUk (accessed on 29 May 2023)]. The measured SANS spectra were converted to the absolute scale by normalization to the incoherent scattering cross section of the standard vanadium sample. Additionally, the measured spectra were corrected considering scattering from the setup and the direct beam, as well as the background. The final small-angle neutron scattering curves are presented in the absolute scale with background subtraction.
Small-angle scattering data were fitted to the Beaucage model [43] describing the transition from Guinier behavior to the power law regime for the fractal scatterers with the gyration radii Rg:
d Σ q d Ω = G exp q 2 R g 2 3 + B q ^ n + I i n c ,   where
q ^ = q e r f q R g 6 1 2 3
is the transferred momentum magnitude, normalized to the error function.
Where appropriate, a unified approach [43] was used, assuming two-level hierarchy with the larger scale level represented by Porod approximation for smooth surface scatterers
d Σ q d Ω = G 0 exp q 2 R g 0 2 3 + B 0 q ^ 0 4 + G exp q 2 R g 2 3 + B q ^ n + I i n c ,   where
q ^ 0 = q e r f q R g 0 6 1 2 3
For the case of the volume fractal, the characteristic size of the fractal clusters Rc was calculated using the formula R c = n + 2 n 1 2 R g .

3. Results and Discussion

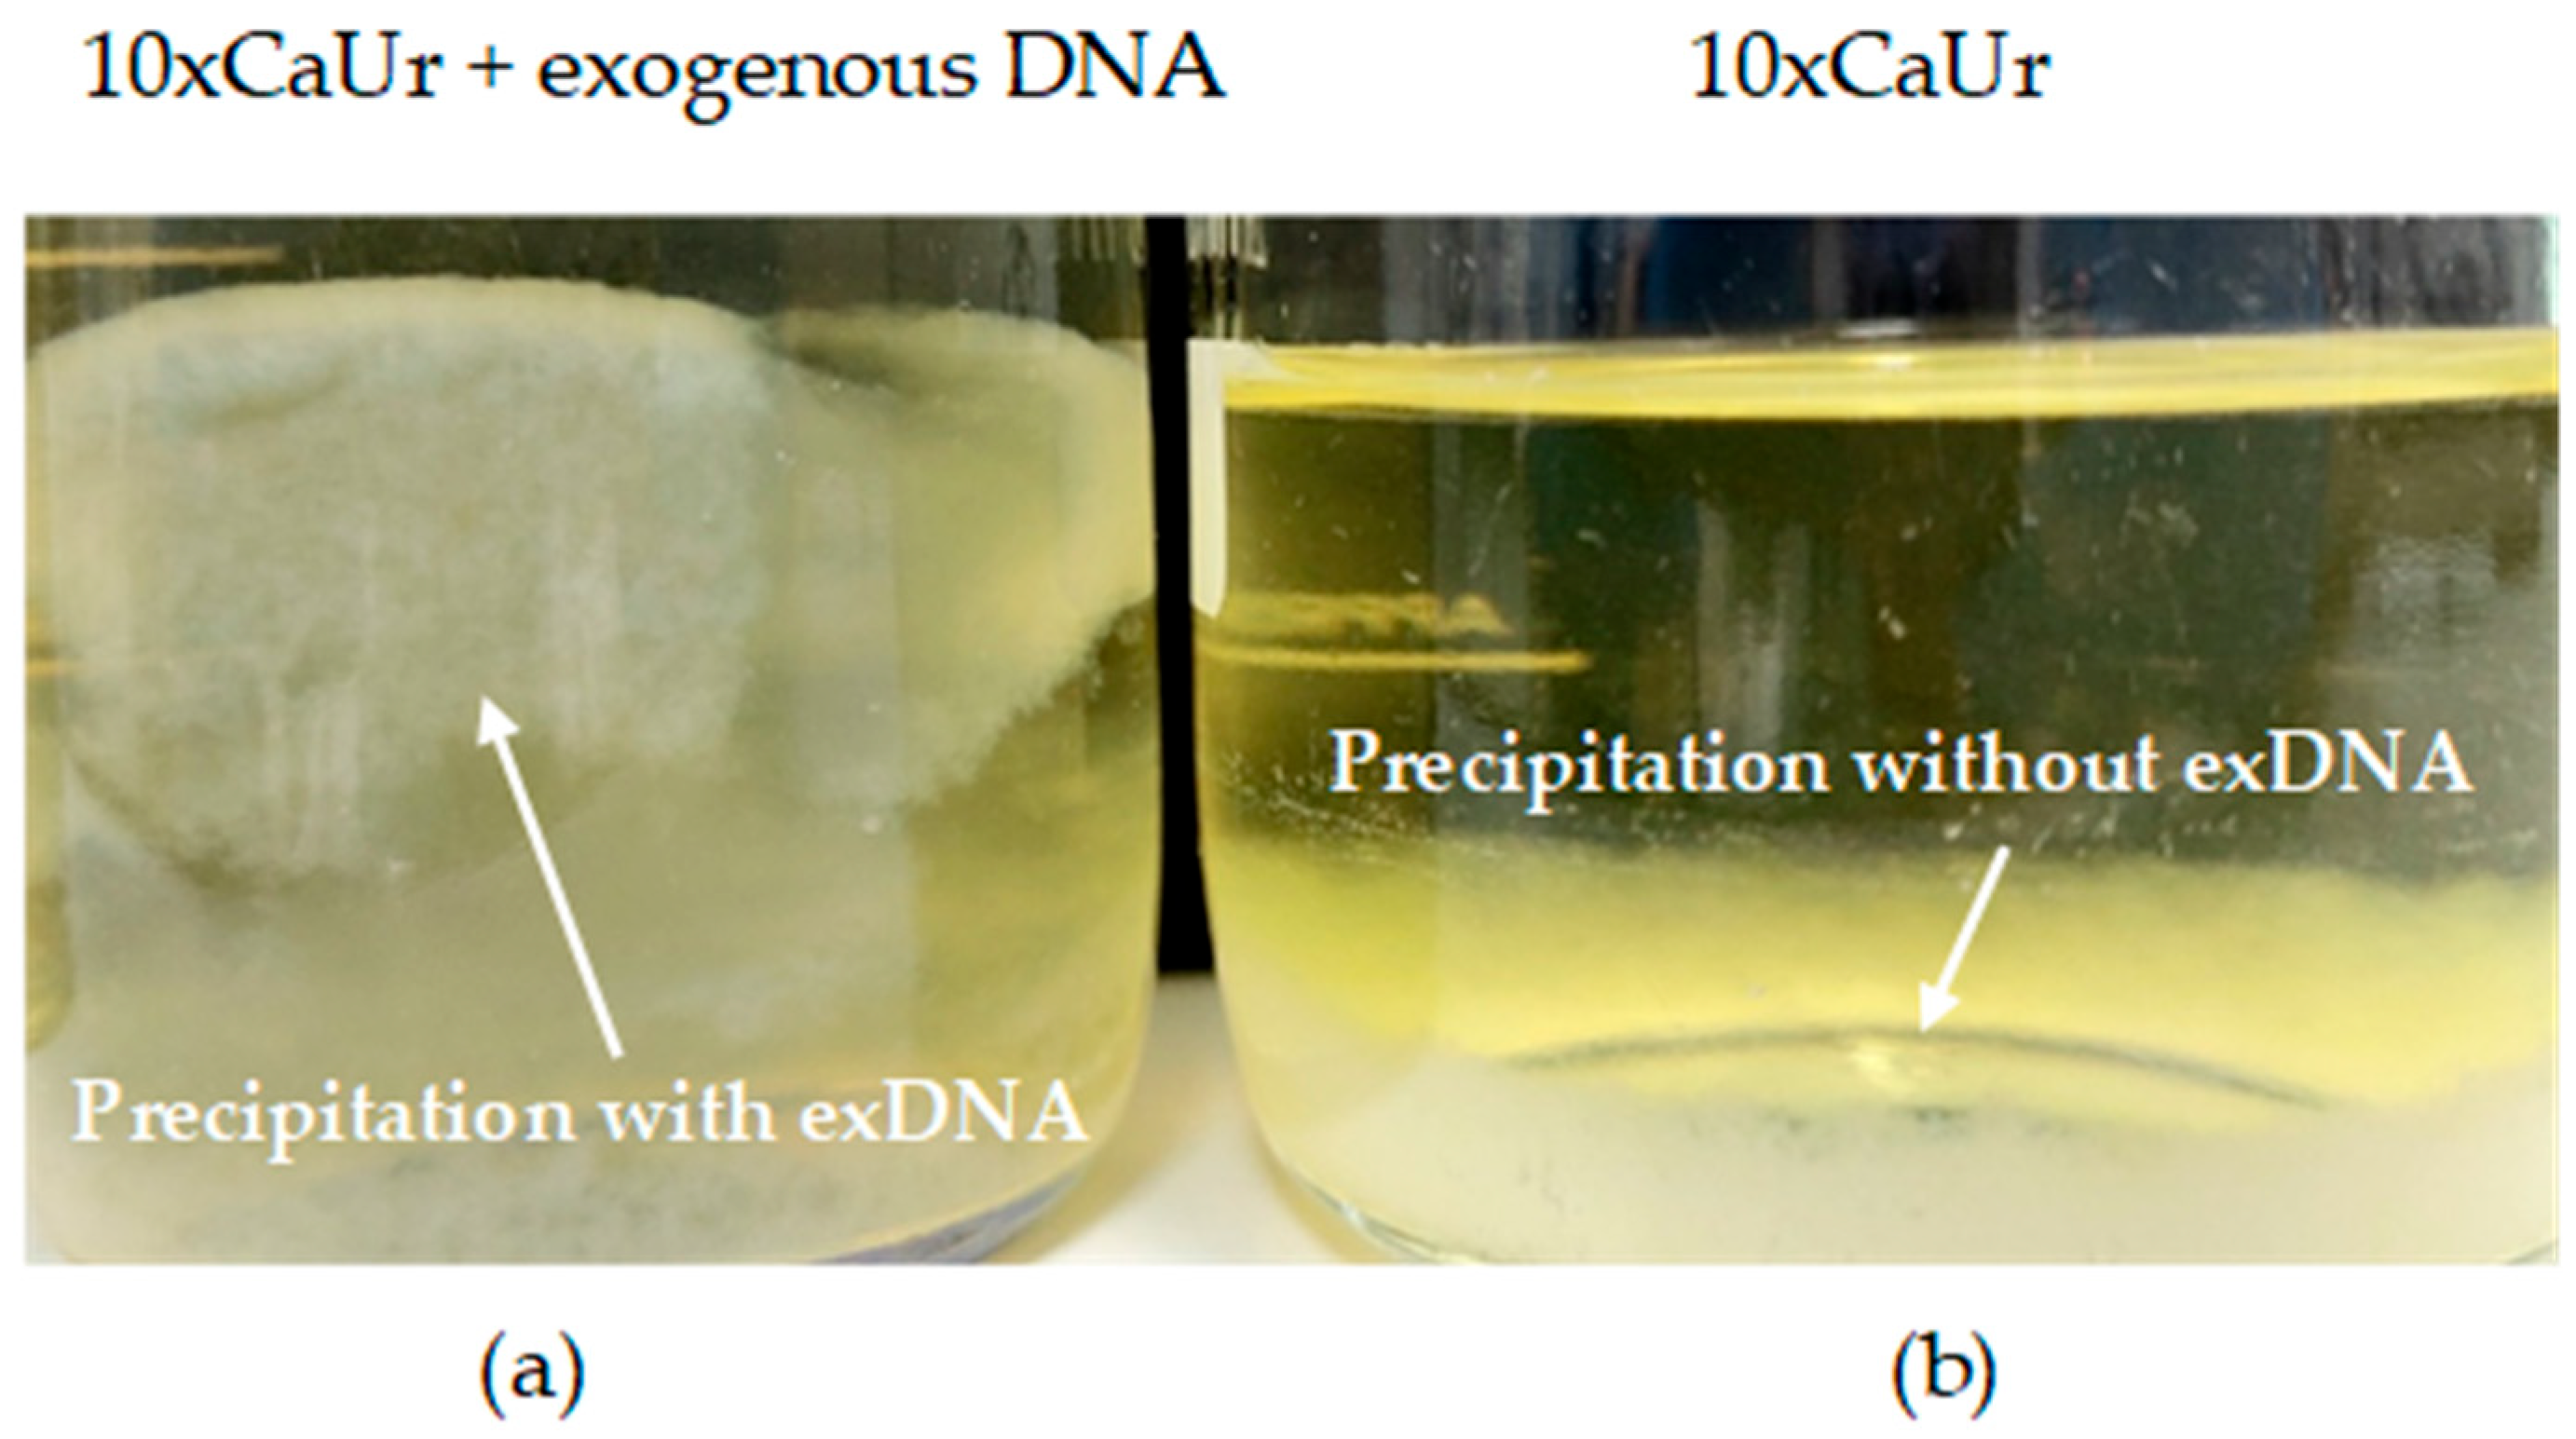
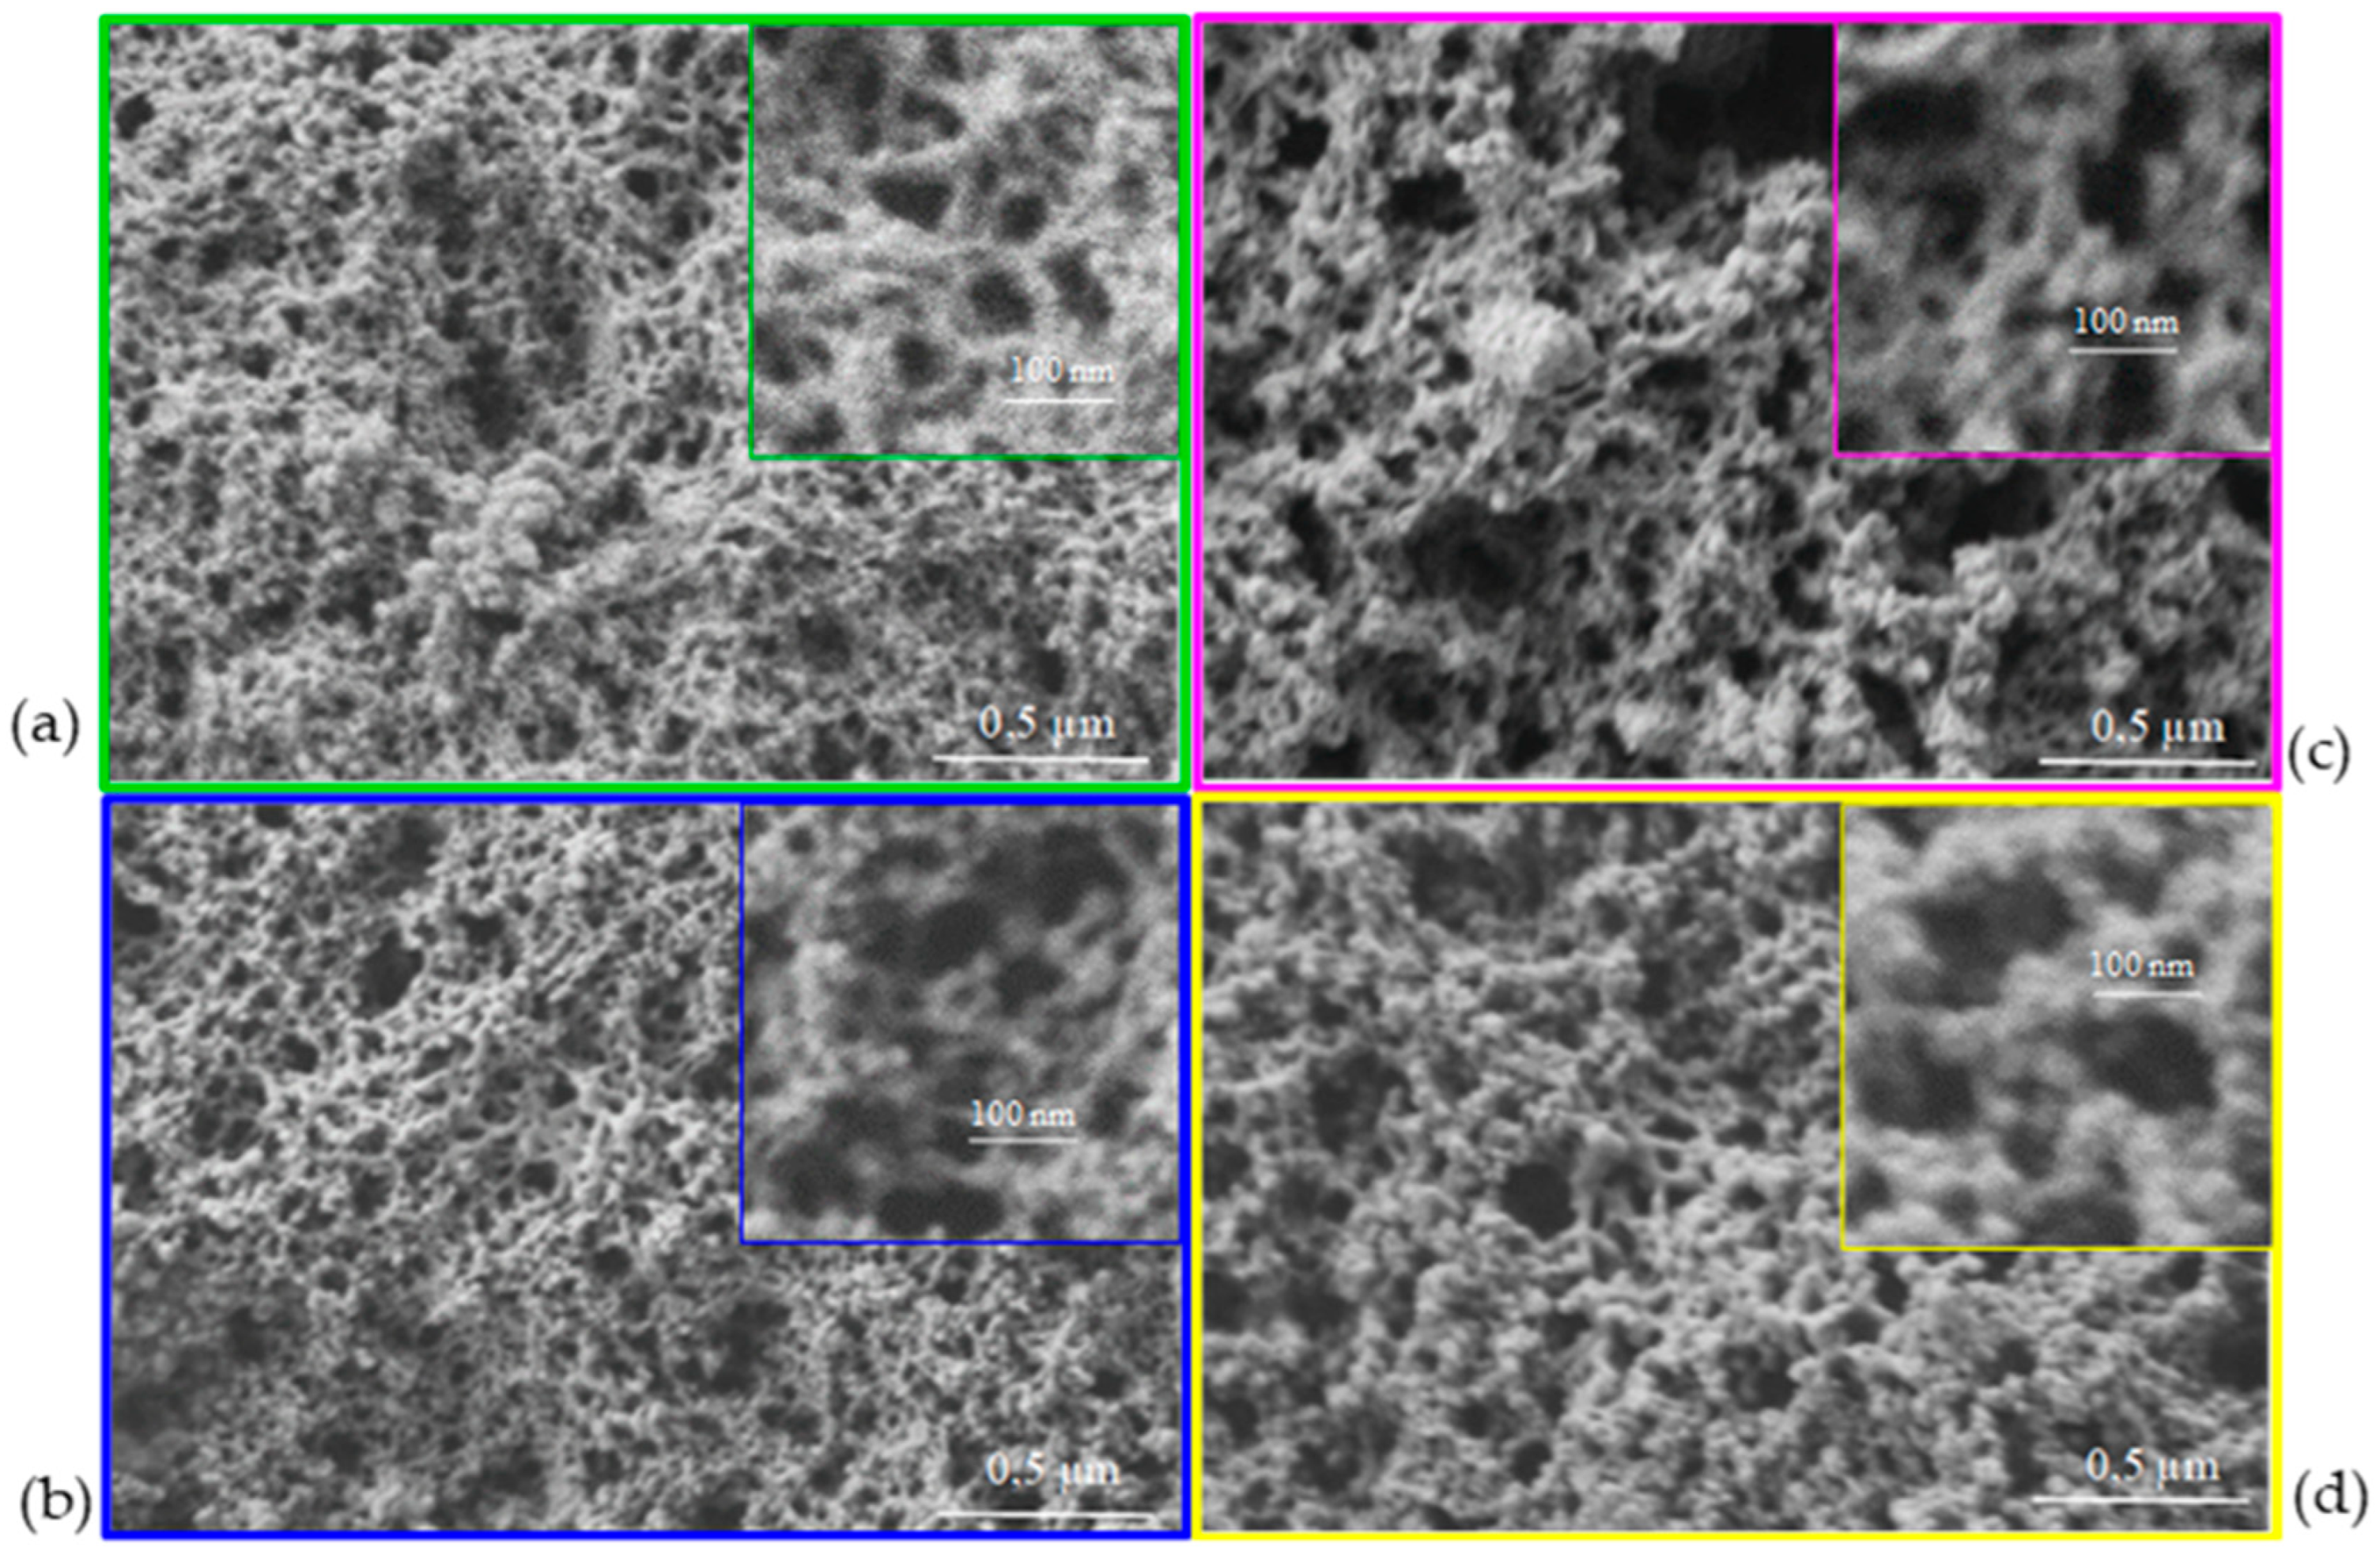
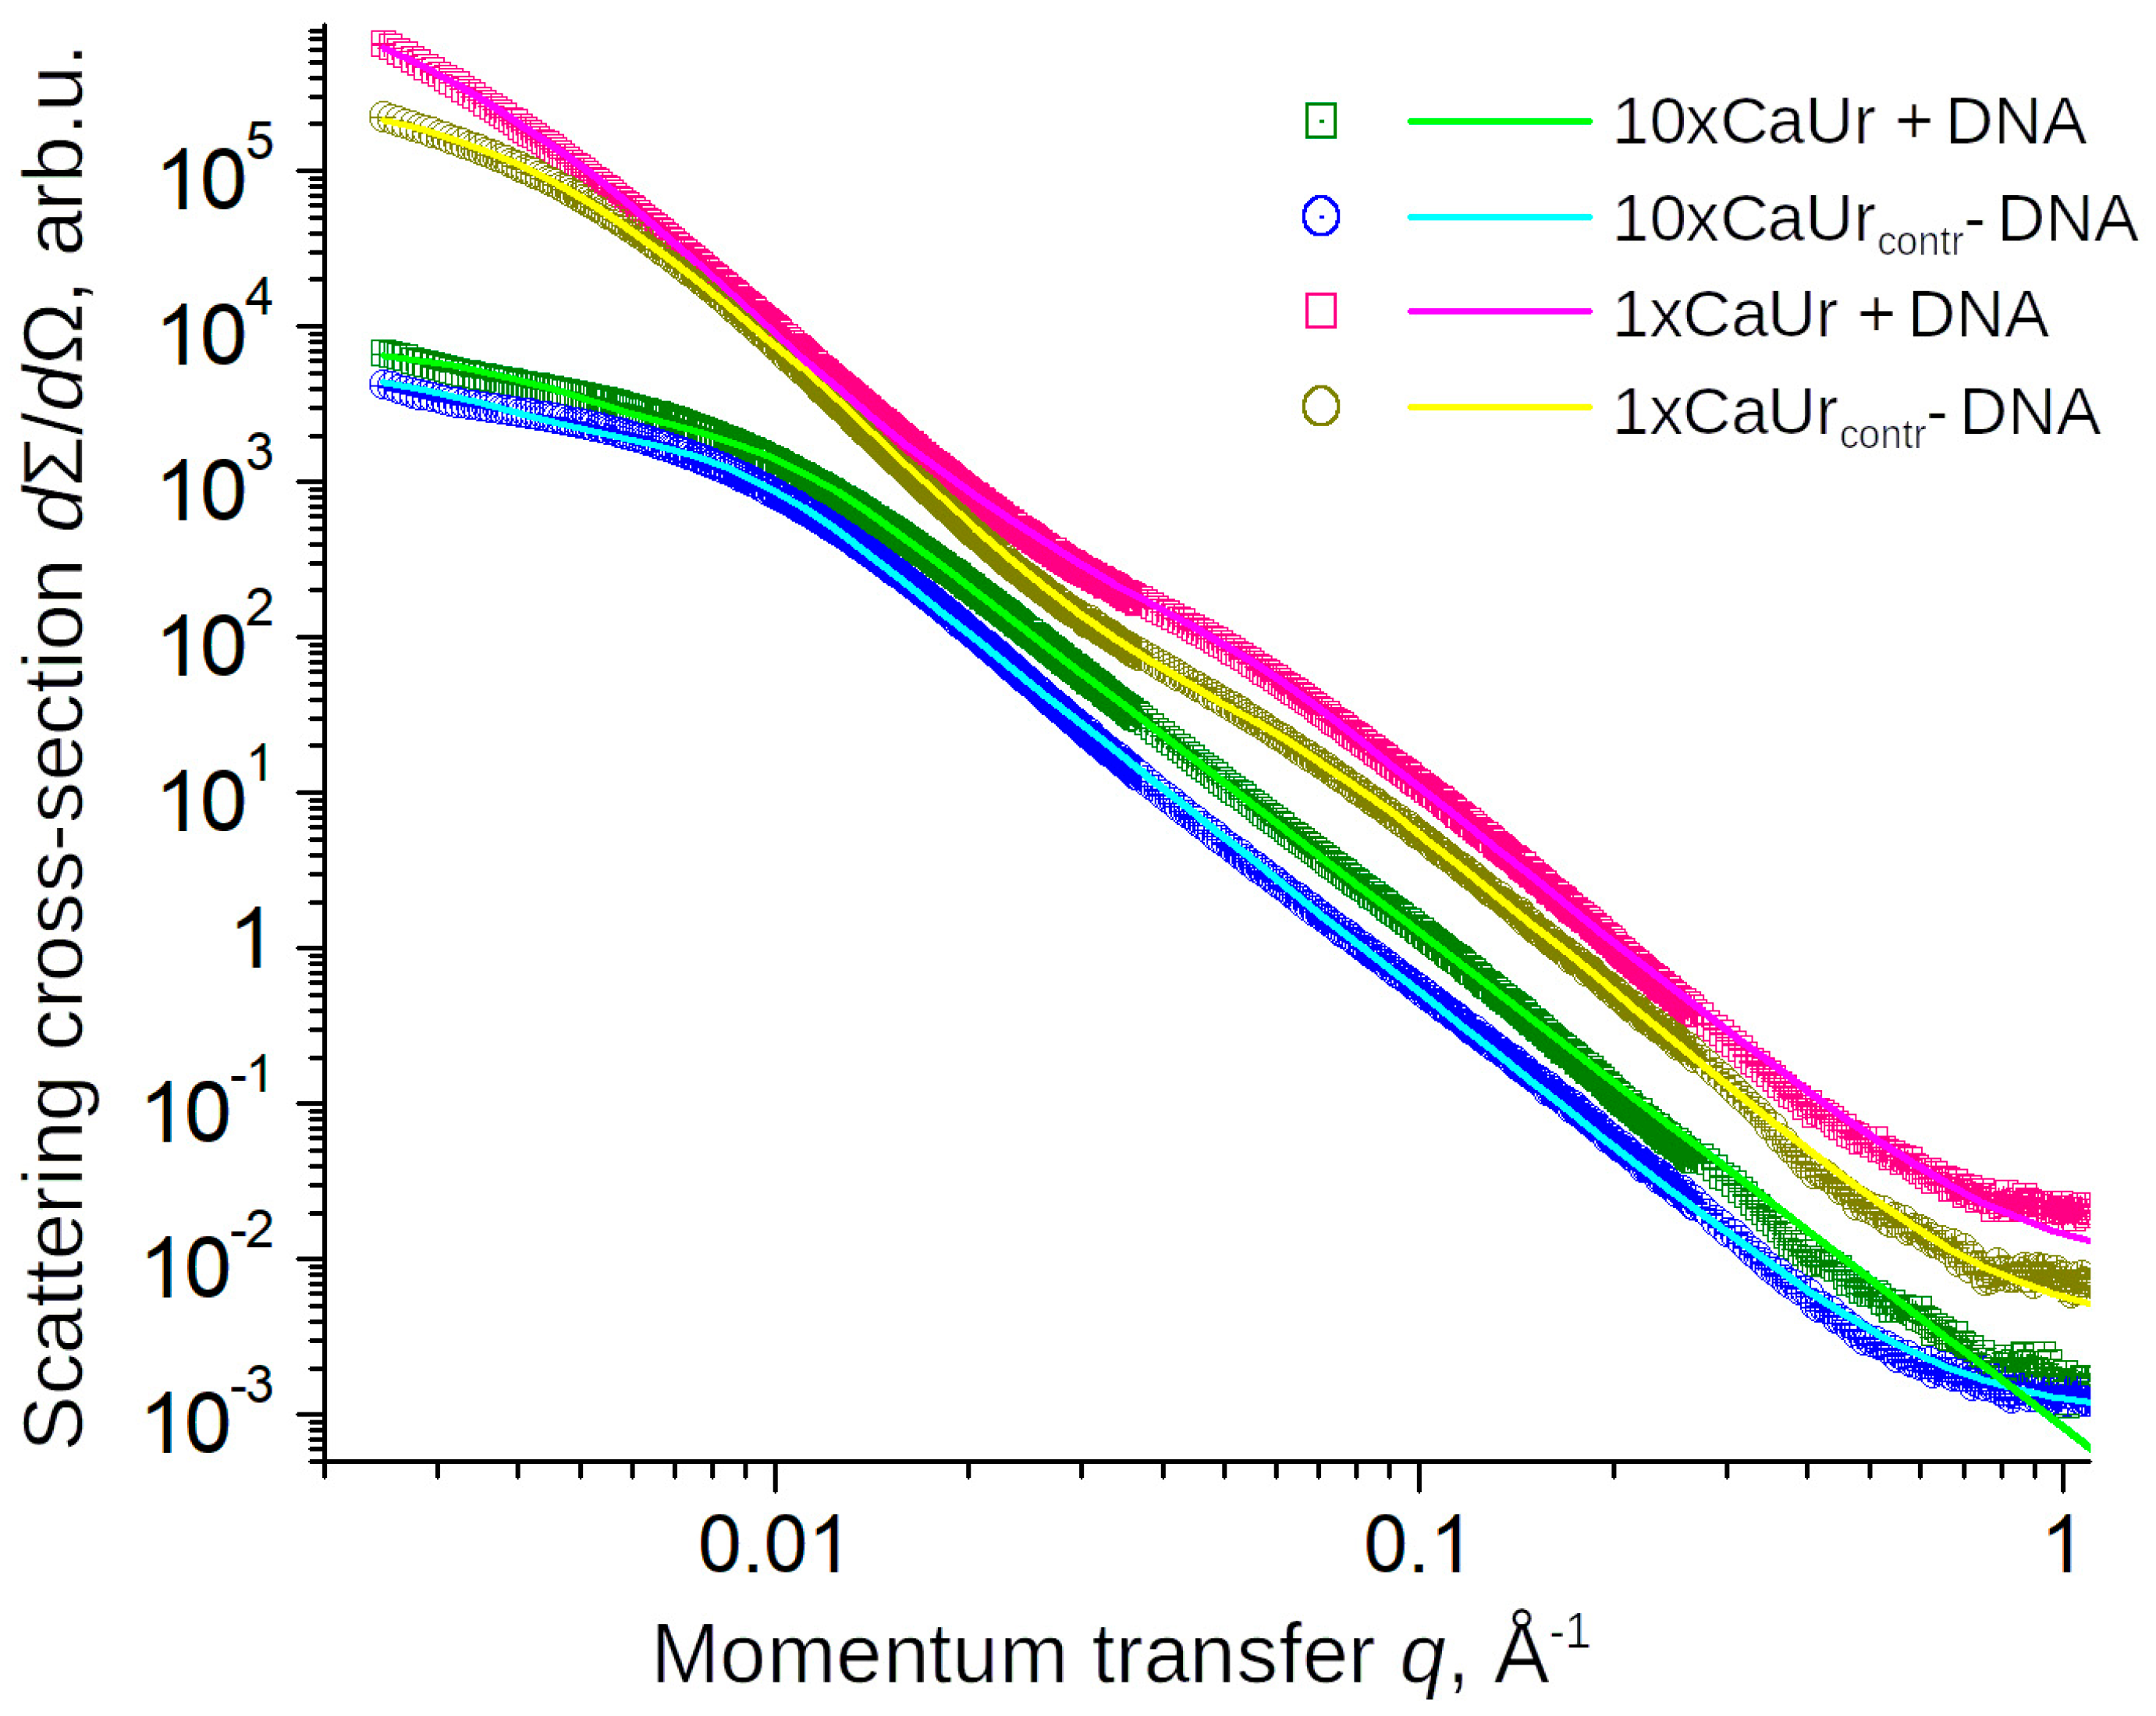
3.1. Cell-Free System

In previous work [16], we have shown that bacterial extracellular DNA (eDNA) found in the forming extracellular matrix (ECM) promotes the mechanism of calcium carbonate biomineralization in the planktonic culture of B. cereus. We also hypothesized that eDNA may be the scaffold for nascent calcium carbonate crystals, being a key player in the complex interaction between the two processes. We demonstrated that in a cell-free system, which was a culture supernatant of B. cereus taken at the point the mineralization began, the addition of exogenous DNA with an excess of CaCl2 (25 g/L) and urea (25 g/L) accelerated biomineralization. However, such a high concentration of CaCl2 did not allow a reliable comparison of the results of experiments in cellular and cell-free media since it was inhibitory for DNase (I), which was used to remove the eDNA from the formed ECM during submerged cultivation of the bacterium. Consequently, in this work we used two concentrations of CaCl2 and urea, (2.5 g/L (1xCaUr) and 25 g/L (10xCaUr)) to elucidate the details of CaCO3 mineralization in the presence of exogenous salmon sperm DNA (exDNA). The addition of exDNA was found to significantly affect the appearance of the forming CaCO3 (Figure 1), yielding a gelatinous-like volumetric precipitation of CaCO3 distributed over the entire space in the vial (Figure 1a).
Unexpectedly, the exogenous DNA only affected the rate of sedimentation and did not affect the mass yield and sediment morphology (Table 1 and Figure 2).
Precipitates formed in the cell-free system 10xCaUr and 1xCaUr appeared to have a similar morphology (Figure 2). Elevated concentrations of Ca and urea appeared to result in denser and less porous precipitates. The size of the pores did not seem to depend on the presence of exDNA and ranged from ca. 200 nm in 10xCaUr (Figure 2a,b) to about half a micron in 1xCaUr medium (Figure 2c,d).
EDX analysis confirmed calcium carbonate as the major component of the precipitates, together with a small amount of phosphorus at a ratio of about 50:1 (Ca/P) (Figure A1), which cannot be unambiguously attributed to inorganic phosphate. The presence of phosphate in the samples was not further detected by either FTIR or XRD. The possibility of phosphate precipitation from the standard B4 medium, which contains organic compounds with phosphorus (yeast extract, peptone), was estimated earlier [40] as highly unlikely.
On the scales below 100 nm, the structure of calcium carbonate precipitates obtained in a cell-free system was further investigated by SAXS. The scattering of the precipitates formed in a cell-free medium containing 25 g/L CaCl2 in the region of momentum transfer magnitudes above 0.02 Å−1 followed the power law dependency with the power exponent of −3.2–−3.3, with transition to Guinier behavior in the lower momentum transfer range (Figure 3). The data could be well fitted to a Beaucage model with a gyration radius parameter of ca. 40 nm and a surface fractal dimension of 2.7–2.8. The presence of DNA had some effect both on the fractal dimension (increase from 2.70 to 2.81) and the size of the structures at the upper limit of the fractal regime (gyration radius decrease from 41 to 35 nm). The formation of precipitates under the conditions of the lower CaCl2 and urea concentrations had a significant effect on their mesoscale structure that exhibited two levels of hierarchy, with the power law at the higher momentum transfer magnitudes limited to the range above 0.2 Å−1. The upper limit of the fractal regime decreased to 7 nm with DNA present and to 3 nm when precipitates were formed without DNA. The surface fractal dimension of the precipitate also decreased to 2.73 and 2.53, respectively. While the data could be well described by the Beaucage unified scattering function for two levels of hierarchy; the power law exponent on the larger scale (momentum transfer range below 0.03 Å−1) could not be determined reliably. The simplest model of Porod law assuming smooth surface interface (power law exponent −4) was therefore used for this level, yielding the gyration radii of the larger-scale scatterers of 68 nm when DNA-induced and 46 nm for self-precipitated.
The data obtained on the morphology and supramolecular structure of the precipitates formed in a cell-free system indicate significant structural differences in CaCO3 precipitates obtained at different calcium concentrations, whereas the addition of DNA, while strongly promoting the precipitation of CaCO3 (according to the kinetic data of Table 1), had little effect on the morphology and only a small effect on the mesoscale structure of the sediment.

3.2. Structure of Precipitates Formed in Cell System

Unlike precipitation in a cell-free system, the biomineralization process in planktonic B. cereus culture takes days to complete and leads to the formation of clusters of mineral nanoparticles with embedded organic material (Figure A2). Both SEM and SAXS data show that the calcium carbonate sediments obtained in the system of planktonic bacterial culture B. cereus (Figure 4) differ from those formed during cell-free precipitation (Figure 2). Moreover, the precipitates isolated and dried at different times of biomineralization show different structural properties. The comparison of SAXS by precipitates formed after 5 and 14 days after the start of cultivation shows an increase in the gyration radius from 7 to 16 nm and in surface fractal dimension from 2.69 to 2.84. In the 14-day samples, a small-scale cut-off for the fractal regime and transition to smooth surface scattering Porod law could be observed in the large momentum transfer region (q > 0.3 Å−1), suggesting that by this time the structure of CaCO3 is predominantly crystalline with a minimal crystal size of several nanometers.
Such fundamental differences in the supramolecular structure of precipitates deposited in in vitro (cell-free) and in vivo (cell) systems are due to a large number of circumstances. For example, the precipitation of calcium carbonate in a bacterial system occurs in a dynamic environment (pH, ionic composition, etc. [16,19]) for much longer and with the participation of high-molecular compounds of the extracellular matrix [13,33] and bacterial cell walls [44]. We assumed that the development of the supramolecular and crystalline structure in the in vivo system would differ significantly from the in vitro system, and therefore tested this hypothesis by describing the evolution of the structure of CaCO3 minerals precipitated in a cell-free bacterial medium.
To study the evolution of the crystalline and supramolecular structure of calcium carbonate sediments deposited by the planktonic culture B. cereus, we relied on the kinetic growth curve (Figure 5, blue graph with stripes) and the dependence of the pH of the medium (concentration of urea and Ca2+ 25 g/L − 10xCaUrcell) on cultivation time (Figure 5, red graph with circles). In Figure 5, the black dotted line marks the growth point at 30 h, which corresponds to the precipitation of CaCO3 in the bacterial medium (crossing with the blue graph) and the pH of the culture medium reaching a plateau of 7.5 (crossing with the red graph) (detailed description of the precipitation process CaCO3 [16].
In our previous work [16], we studied the morphology and polymorphic composition of precipitate samples precipitated for 30 h and 72 h on the cultivation of the B. cereus bacterium by FTIR, XRD and SEM methods. In this work, we used an extended range of physical methods to describe the supramolecular structure of minerals (SANS and SAXS), and also increased the observation time for the evolution of crystals to 14 days.

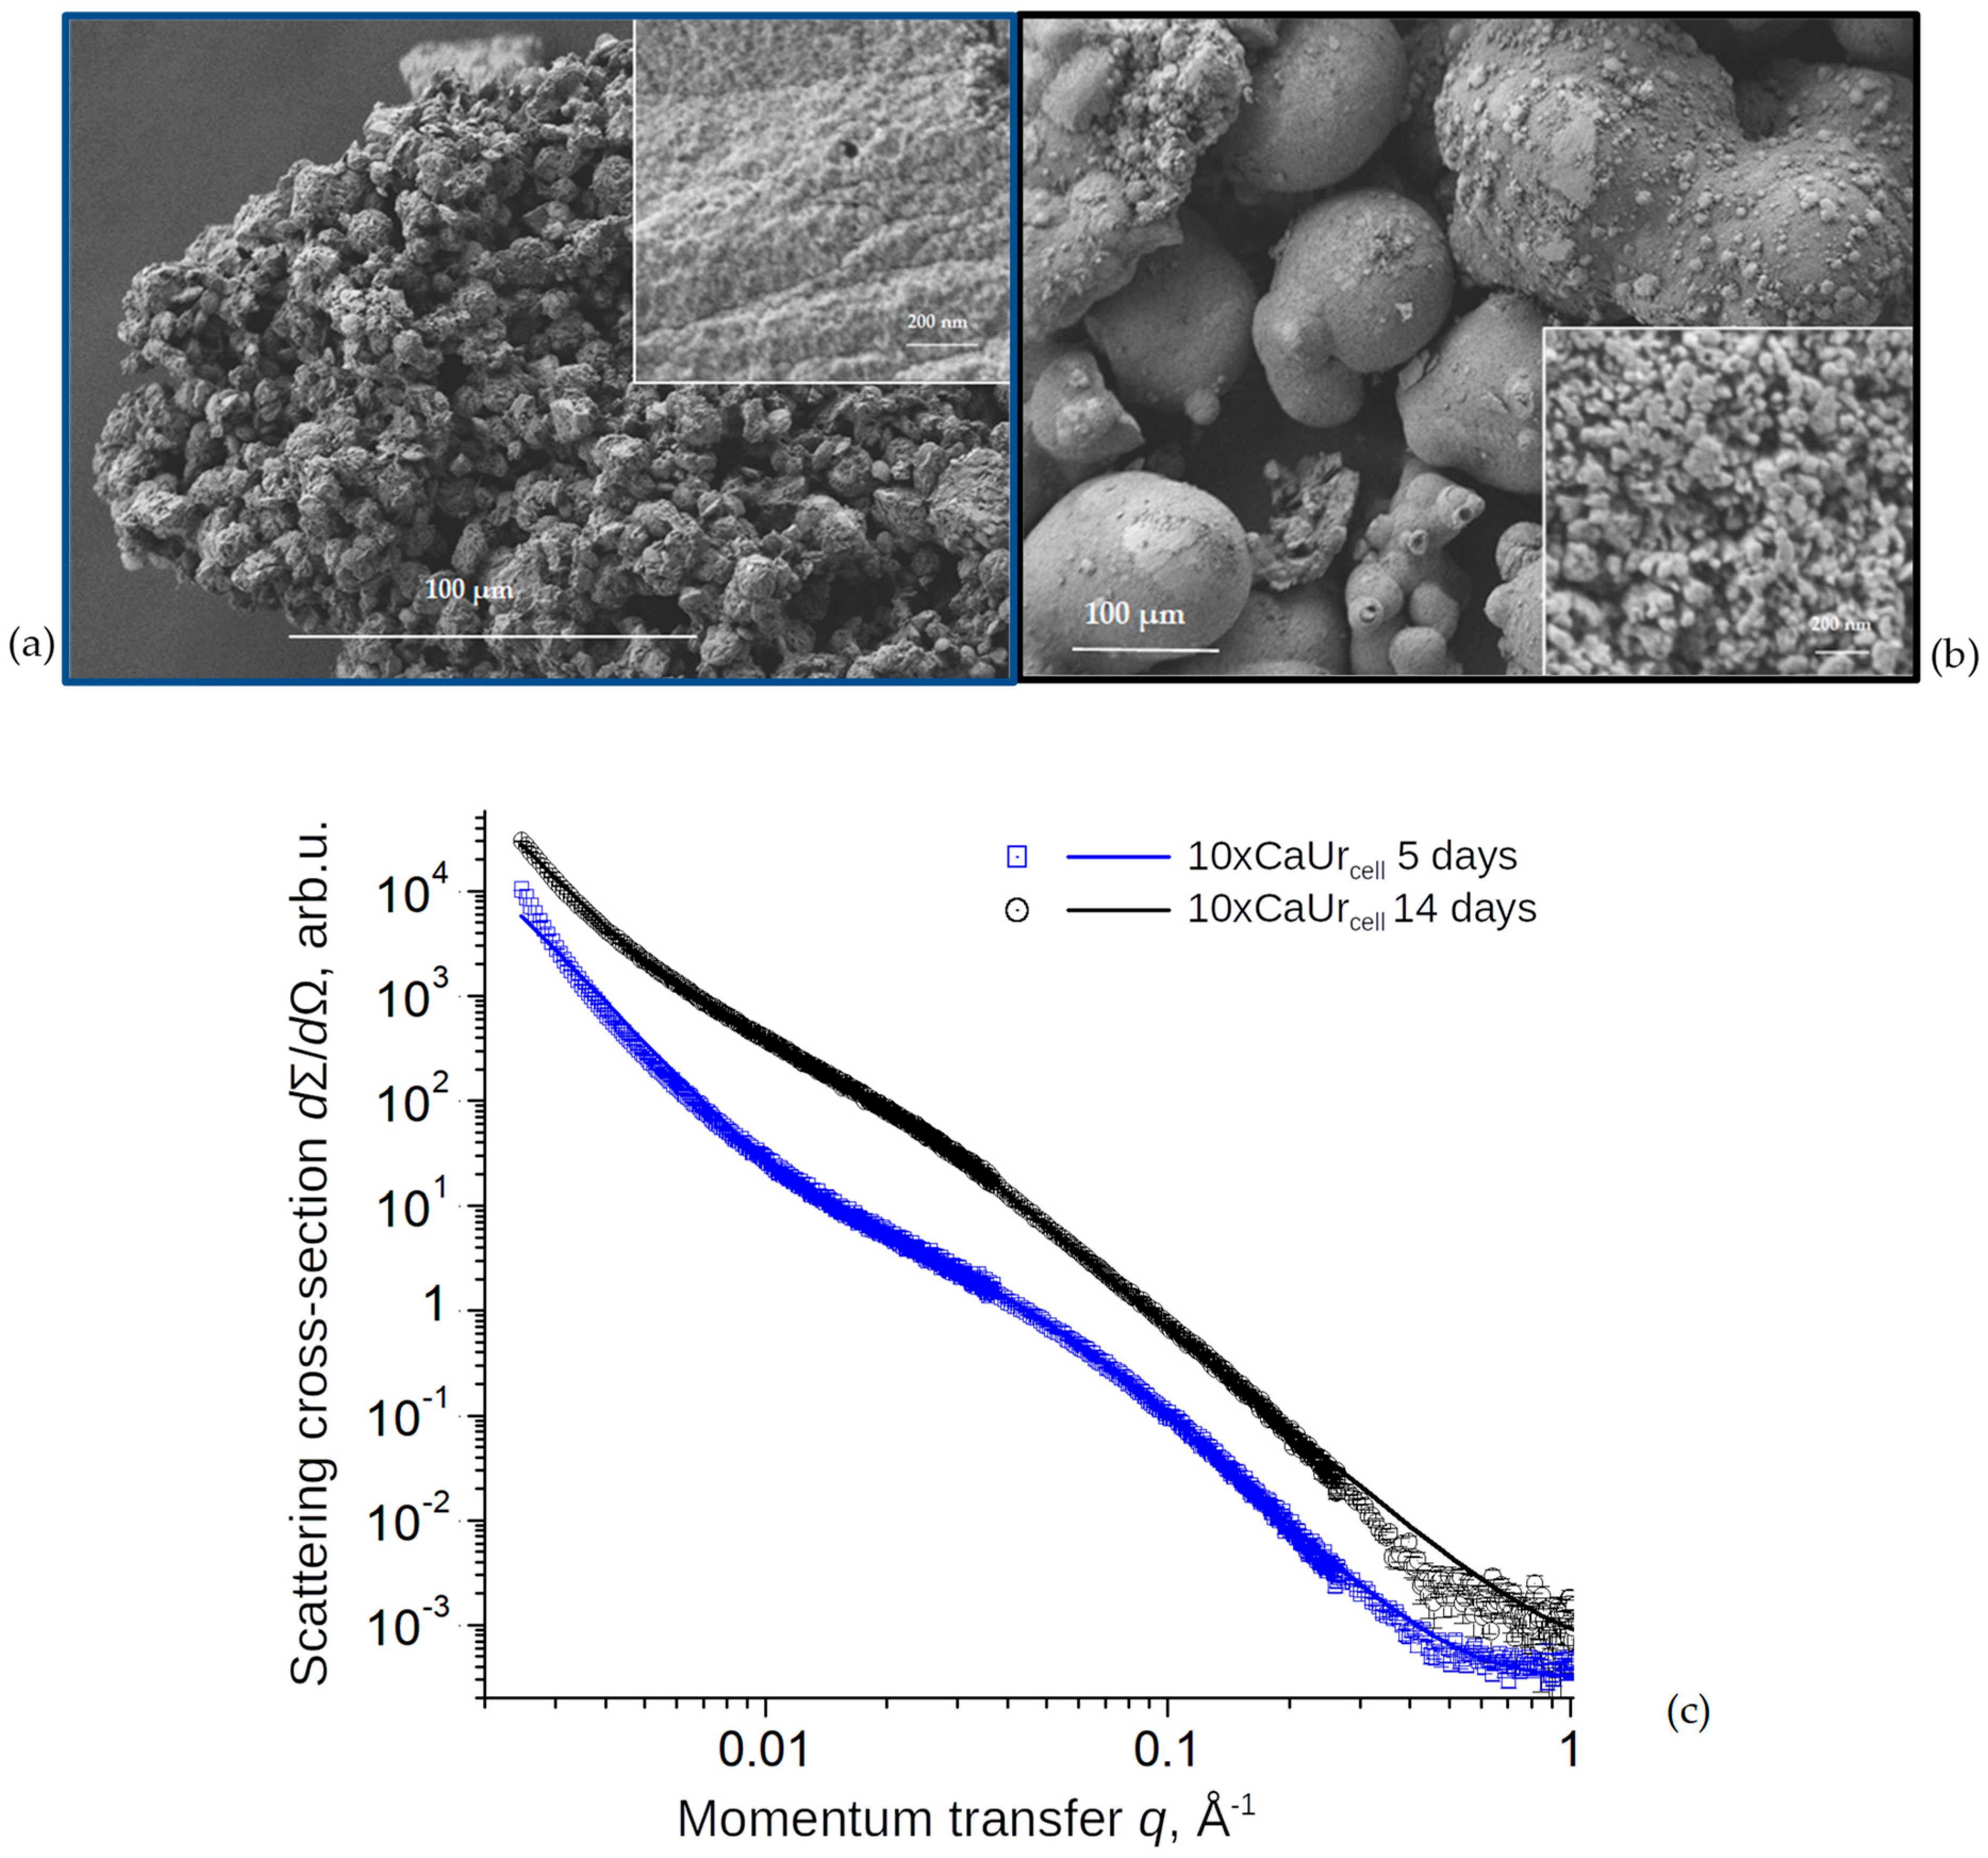
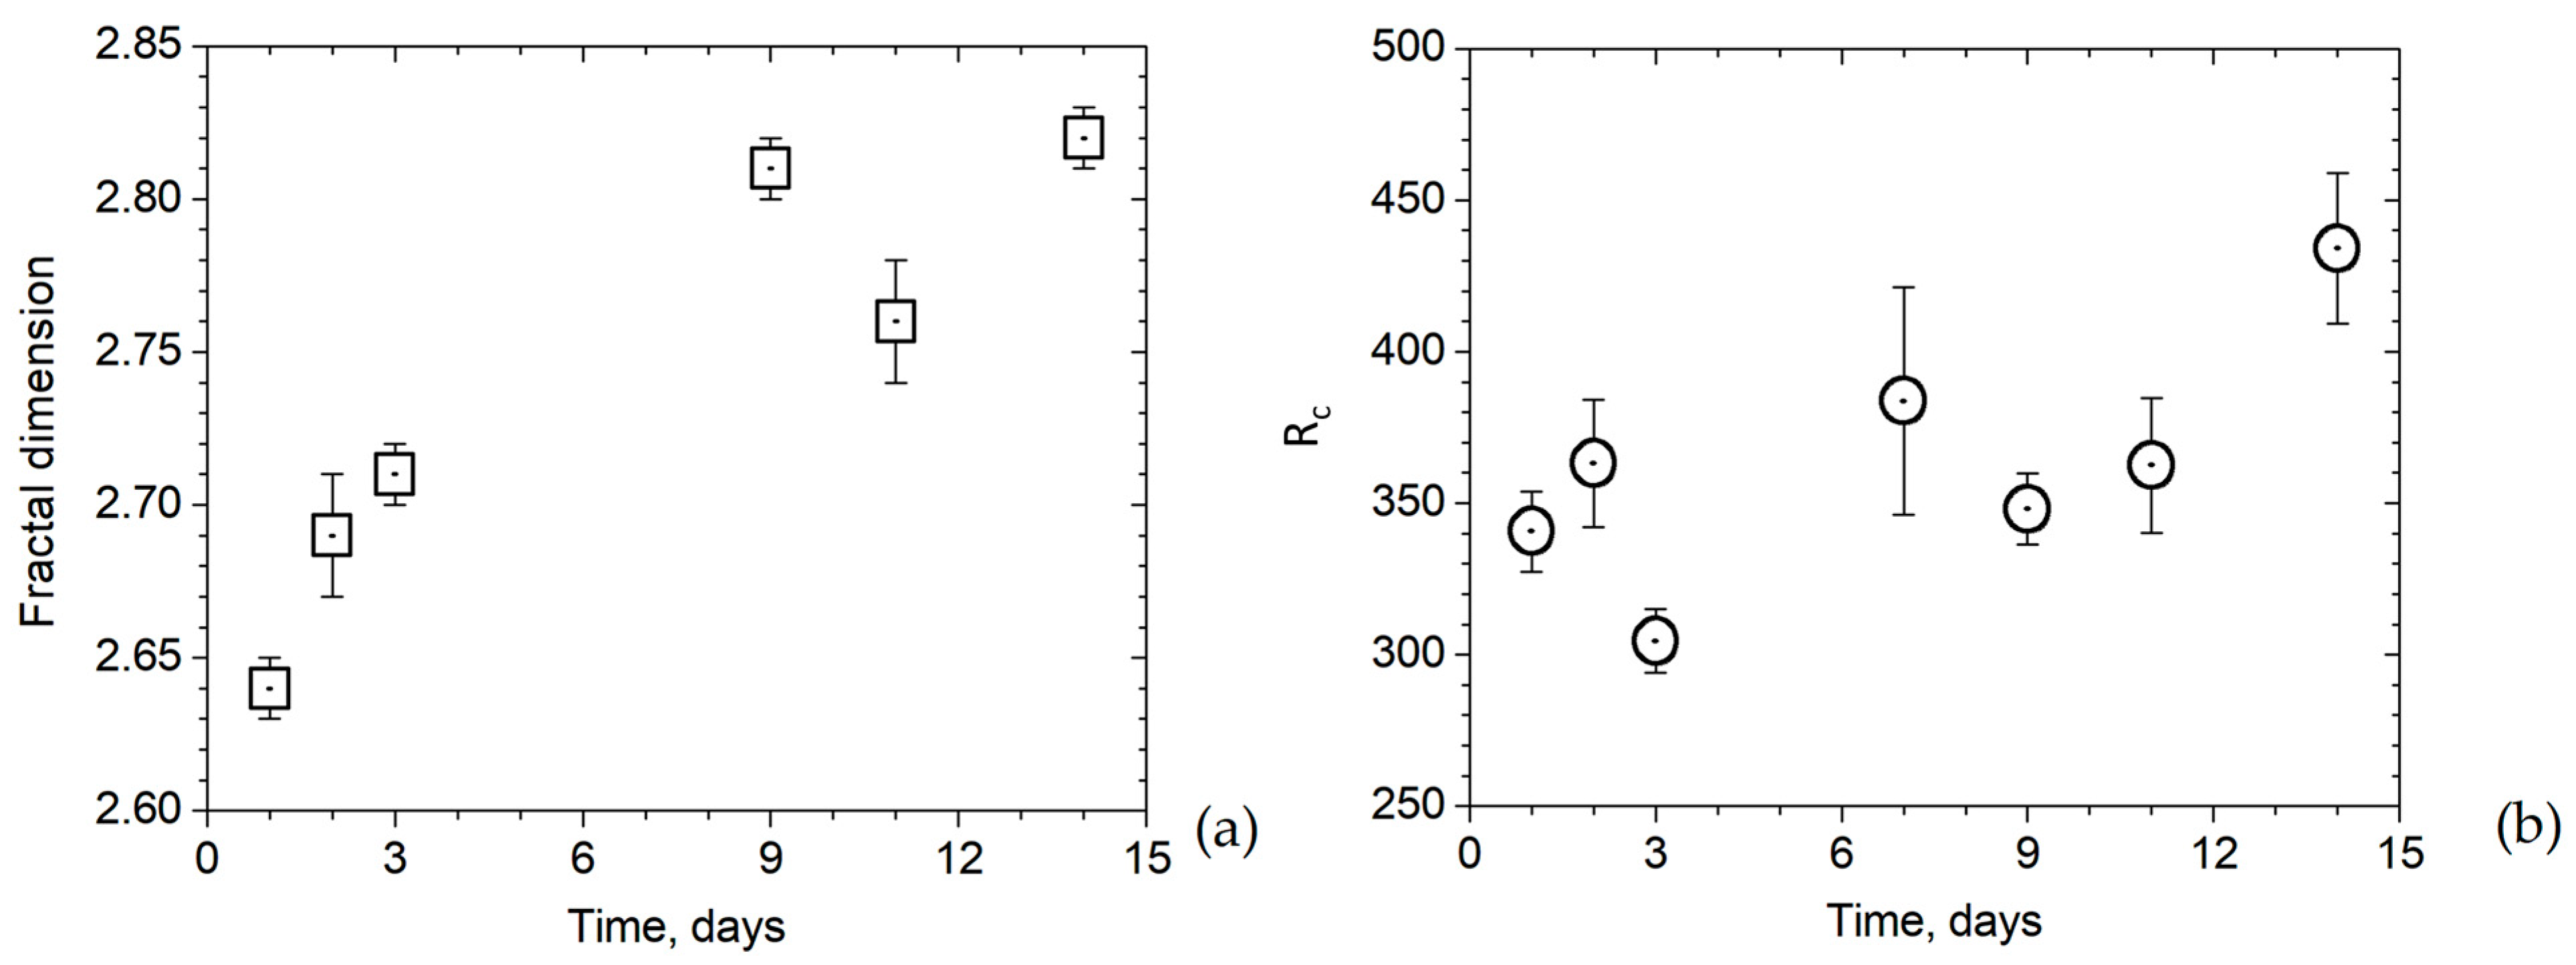
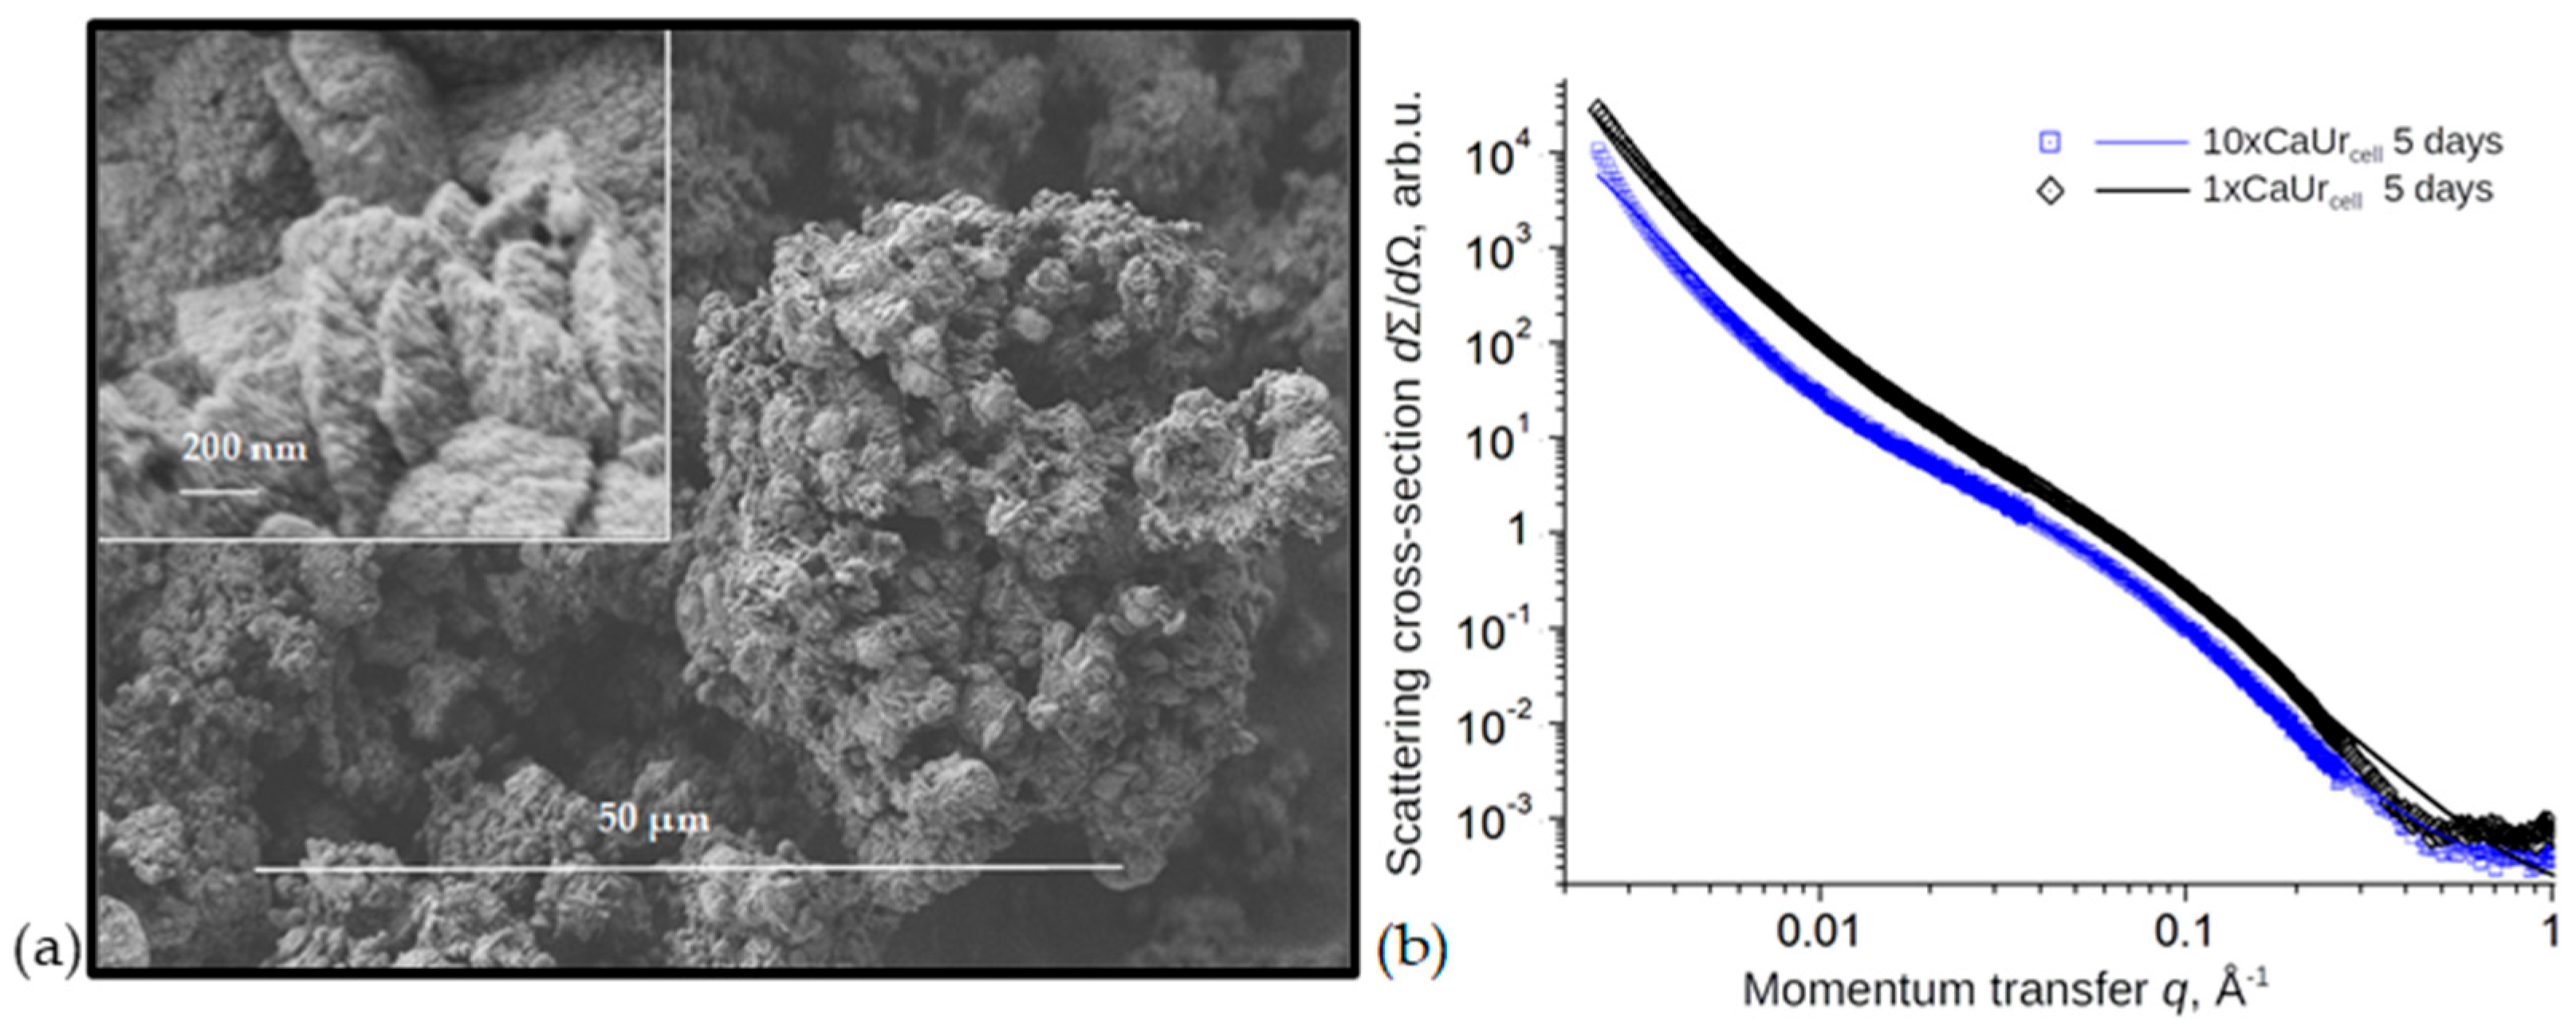
3.3. Evolution of Structure of CaCO3 Precipitates in Cell System

Samples with CaCO3 sediments obtained during the growth of the planktonic bacterium B. cereus in a B4_CaUr (10xCaUrcell) medium for 14 days were analyzed by FTIR, XRD and SEM methods (Figure 6). On the FTIR spectra of all samples (30 h, 72 h, 9 days and 14 days), intense absorption bands of the carbonate ion (CO32−), OH groups and water [45] (Figure 6a) are easily distinguishable. Low-intensity bands with maxima at 1800 and 2500 cm–1 can be attributed to the composite vibration frequencies of the carbonate ion or amine impurities [46] remaining from the urea decomposition products.
In all samples, intense bands CO32− (~710, ~870 and ~1400 cm−1) corresponding to the calcite phase in the obtained samples are also observed. Moreover, the presence of a v1 valence band of CO32− (~1080 cm−1), which is not infrared active in calcite, indicates the presence of small impurities of aragonite (1083 cm−1) [47], vaterite (1089 cm−1) [47] or amorphous calcium carbonate (1075 cm−1) [48,49] in the studied calcite samples. A band with a maximum of ~750 cm–1 was only found in the spectrum of the 30 h sample, which indicates the presence of vaterite [18,49] in its composition. To estimate the ACC content of our calcite samples from FTIR data, we used the technique used in the literature [48,50,51,52,53]. Because ACC does not have a ν4 absorption band around 712 cm−1 and has a broad ν2 absorption pattern around 875 cm−1, the ratios of the maximal intensities of the ν2 and ν4 absorption peaks (Iν2/Iν4) should be higher for ACC-contained calcite than those of pure calcite. For a pure calcite, the Iν2/Iν4 ratio is 3.0 and the value increases with increasing ACC content in calcite. Correspondingly, this ratio increased in a series of samples: 14 days, 9 days, 72 h and 30 h after inoculation, and reached a maximum for the sample at 30 h. According to Beniash et al. [50], it is very difficult to estimate even semi-quantitatively the calcite/ACC ratio, as the ACC absorption coefficient of the ν2 band at 860–870 cm−1 is much less than that of calcite at 875 cm−1, and the ACC band is also much broader than the calcite peak. Alternatively, the observed trends (Figure 6a) could be due to the presence of intermediate transformation phases between the amorphous and crystalline end members. Thus, the data of FTIR spectroscopy are in good agreement with the known model of the transformation of calcium carbonate polymorphs [18], and are also consistent with our previous studies [16] regarding the formation of calcium carbonate polymorphs during biomineralization induced by B. cereus.
X-ray diffraction analysis (Figure 6b) revealed changes in the distribution of CaCO3 polymorphs during the growth of the B. cereus. Thus, in the sediments precipitated from the culture liquid after 30 h, a noticeable amount of vaterite was found, which is about 10% of the total content of calcium carbonate crystals. Subsequently, the vaterite phase gradually transformed into calcite, so that vaterite peaks were no longer detected in the samples taken more than 72 h after inoculation. The accumulation of the calcite phase was accompanied by the disappearance of ACC, which was detected by scanning electron microscopy (Figure 6c). Then, 30 h after inoculation, small spherulites (50–70 µm in size) with traces of bacterial cells on their surface were located among the amorphous phase, as can be seen in the micrographs of the samples (Figure 6c: upper left image). After 72 h of cultivation, the inorganic precipitates increased in size, reaching a structure with an average diameter of 300 to 500 µm (Figure 6c: lower left image). Notably, the finer sediments had a better crystal structure than their 30 h predecessors. During the subsequent period, the precipitates hardly increased in size, their structure looked crystalline and their amorphous medium completely disappeared (Figure 6c: right).
To further analyze the evolution of the structure of precipitates on the mesoscale, we performed a series of SANS measurements of the CaCO3 samples taken between 1 and 14 days from the start of cultivation of bacteria B. cereus. Figure 7 shows the experimental log-log plot of neutron scattering cross sections versus the momentum transfer. Similarly to SAXS data, the SANS spectra exhibited Guinier regime at low momentum transfer magnitudes, transitioning to the fractal regime above 0.02 Å−1. The power exponent for the fractal regime varied between 2.64 for the amorphous CaCO3 samples taken after the first day of bacterial culture, to 2.82 by the end of the mineral formation. SANS data indicated that the CaCO3 precipitate was in the form of mass fractal aggregates, thus showing different structural properties as compared to SAXS, possibly due to the different contrasts of the content and the surface layer of the material.
Figure 8 shows the dependencies of the fractal dimension (Figure 8a) and Rc (Figure 3) on the growth time of crystals within 14 days. The precipitates containing amorphous CaCO3 in the form of fractal aggregates were detected as early as 24 h of bacterial growth. The transformation of CaCO3 polymorphs along the ACC-vaterite-calcite pathway was observed over 14 days and was accompanied by an increase in the characteristic size of the fractal clusters observed from 30 to above 40 nm, and by an increase in the dimension of the mass-fractal from 2.63 to 2.82.

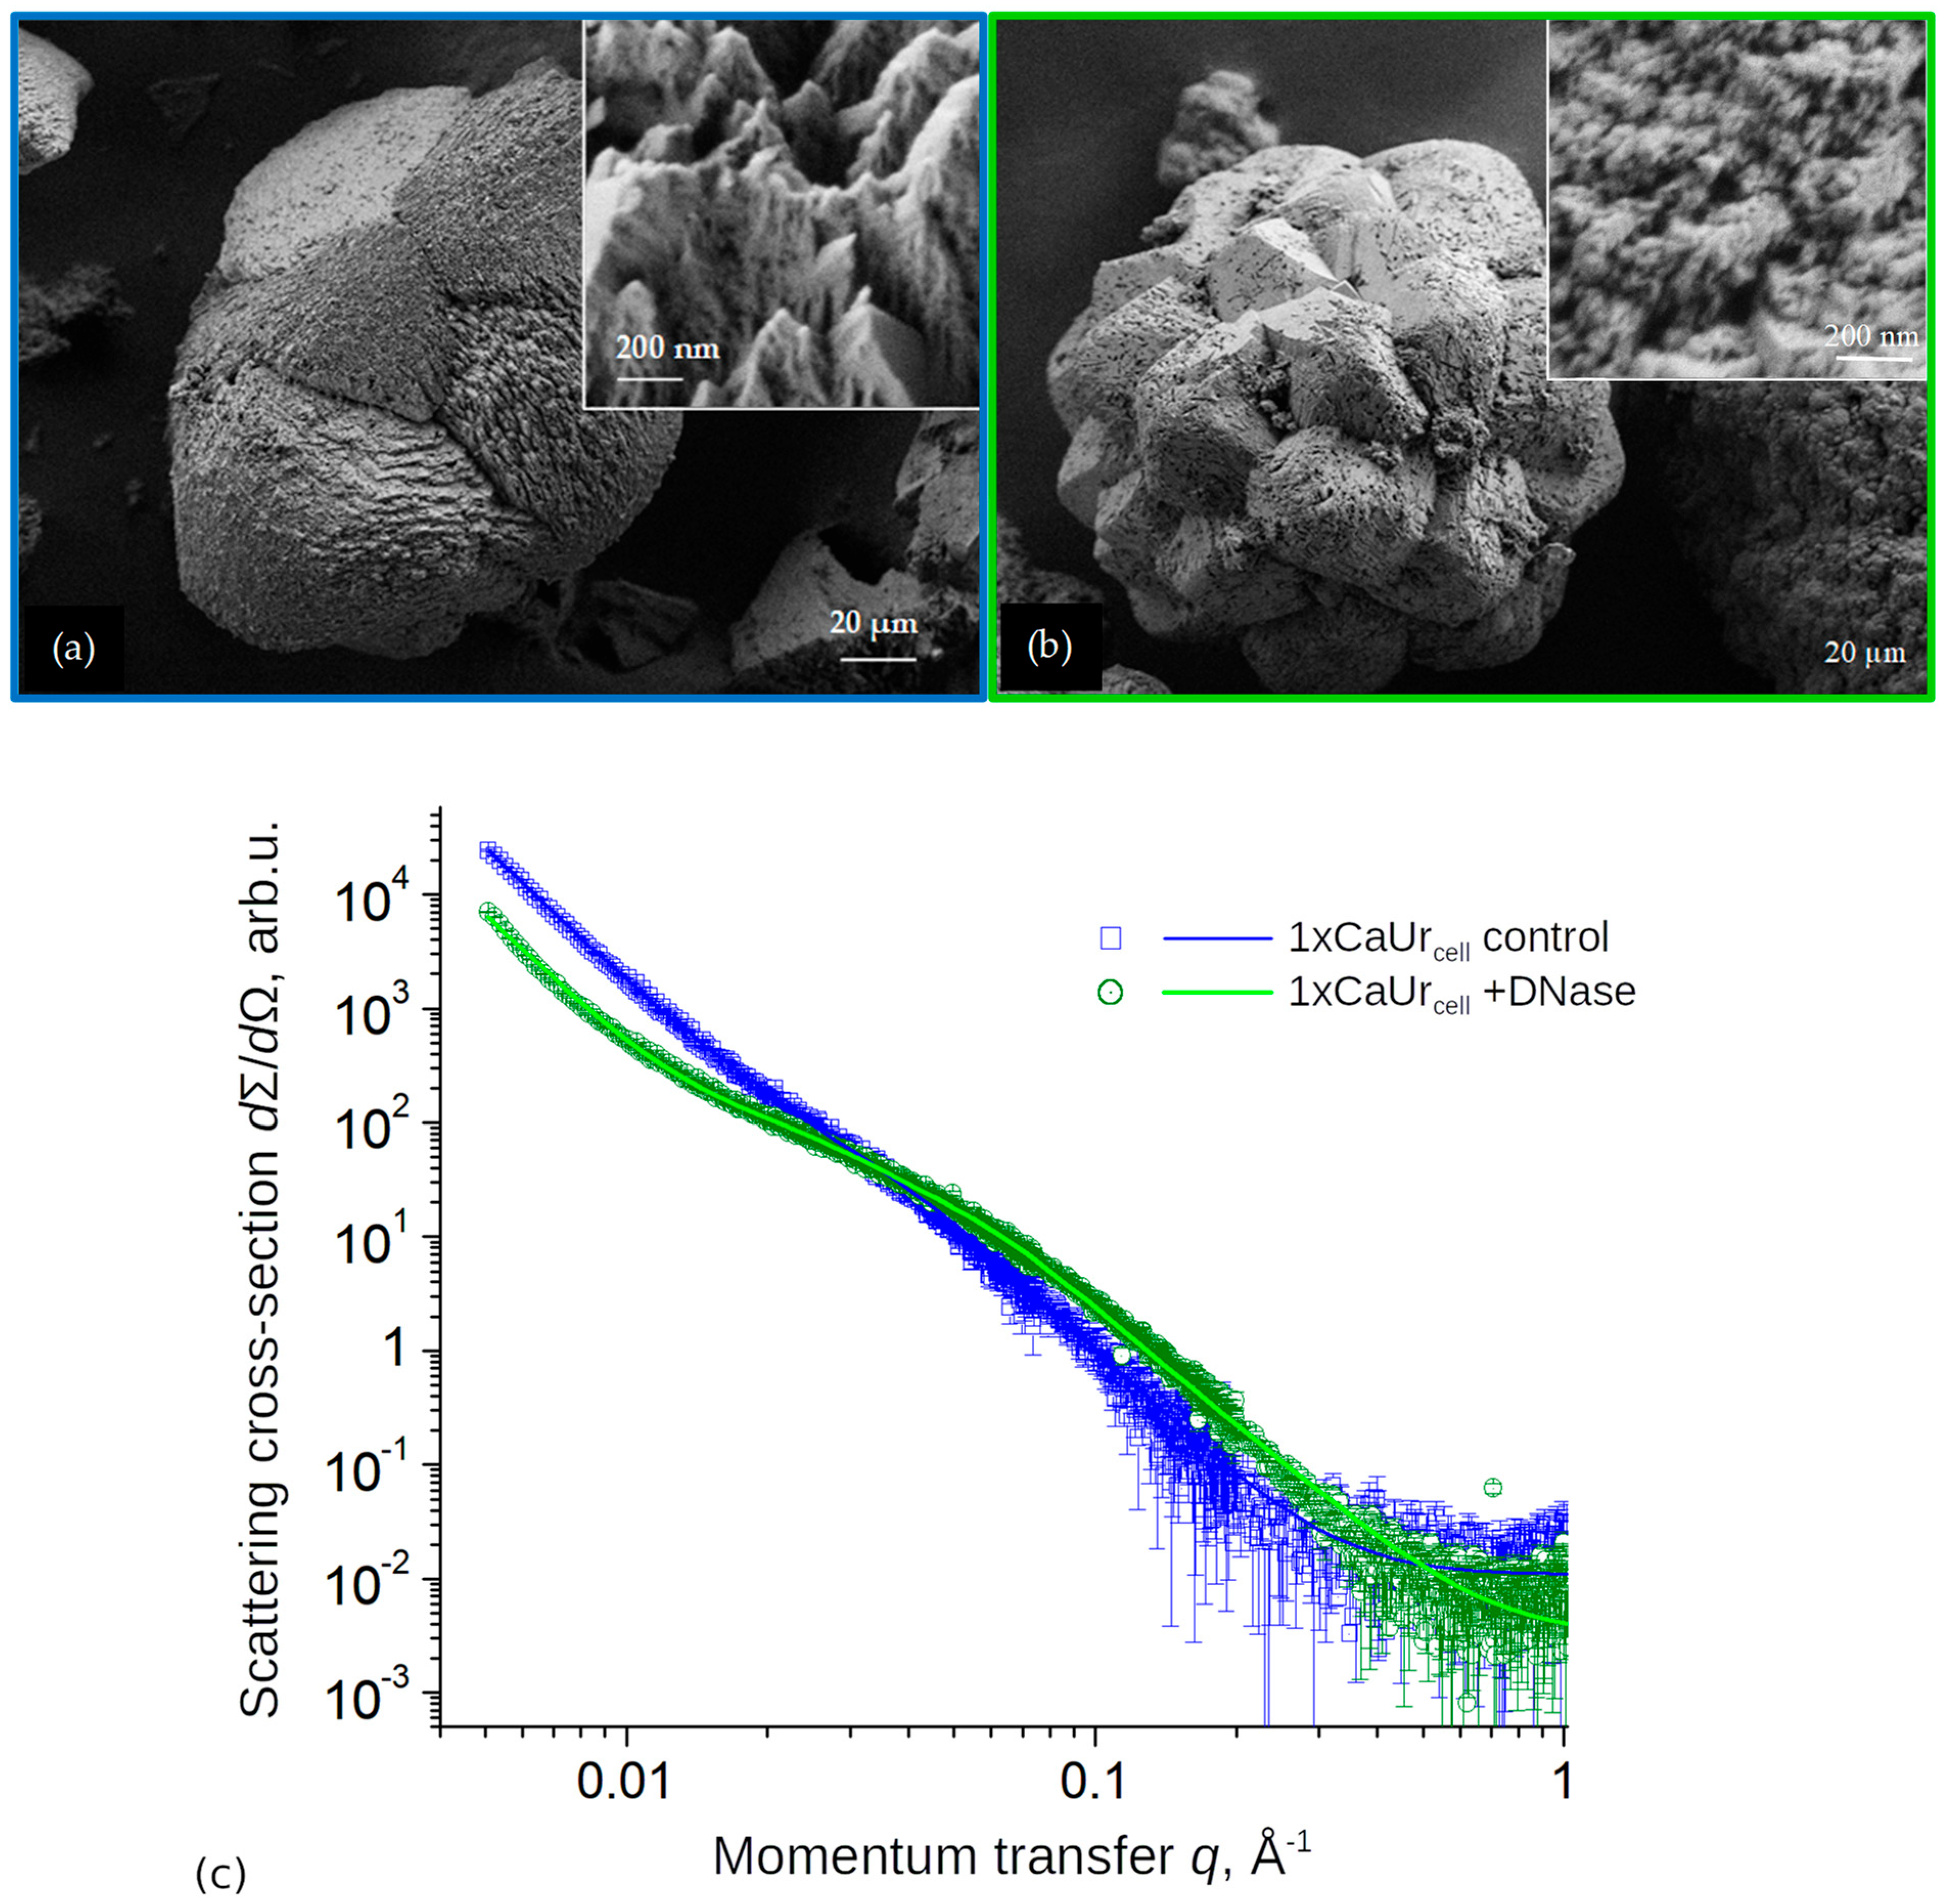
3.4. Effects of DNA Removal during Biomineralization on CaCO3 Structure and Morphology

Earlier reports on the participation of extracellular DNA in the process of biomineralization, as well as the results obtained in cell-free system (Section 3.1), prompted us to check how DNA influences the structure of calcium carbonate during biomineralization in cell culture. To do this, we conducted an experiment with the addition of the DNase enzyme, which excluded the DNA component from the extracellular matrix and reduced the volume of biomineralization sixfold (for details, see [16]). DNase (I), which was used to remove the eDNA component in the extracellular matrix [16], had activity only at a urea concentration of 2.5 g/L. Therefore, all experiments using DNase (I) were carried out at a urea and calcium concentration of 2.5 g/L. We performed SEM and SAXS measurements of the precipitates formed after 5 days of biomineralization at these concentrations of CaCl2 and urea in the culture medium (Figure 9). In contrast to the results obtained in a cell-free system, we observed little effect of ten-fold CaCl2, and the urea concentration decreased on both the structure and morphology of the precipitates. Only a small increase in the surface fractal dimension (2.75 vs. 2.69) was observed. SAXS spectra also showed a pronounced small-scale cut-off of the fractal regime at q ~ 0.3 Å−1, similar to that seen in samples taken after 14 days in 10xCaUrcell medium (Figure 4), suggesting that at the lower CaCl2 and urea concentration both the transformation of CaCO3 along the crystallization pathway and crystal growth may occur faster.
The morphology of crystals formed in a medium with bacterial cells and an excess of calcium and urea at a concentration of 2.5 g/L (1xCaUrcell control) after 44 h of growth of the planktonic culture of B. cereus is shown in the SEM image in Figure 10a. The agglomerates had a similar size to the samples obtained with a calcium and urea content of 25 g/L, as well as a similar crystal surface morphology (Figure A3). These observations were confirmed by FTIR spectroscopy in a previous work [16], where it was shown that in the sample without the addition of DNase, by 44 h a predominant calcite phase was observed with an admixture of amorphous calcium carbonate. On the other hand, SAXS measurements (Figure 10c, blue squares) showed that at this time point of biomineralization the structure of CaCO3 on the scales below 100 nm was different than the mature 5-day sediments formed in either 1xCaUrcell or 10xCaUrcell media, and that precipitates formed in cell-free system, in particular, exhibited much lower surface fractal dimension (ca. 2.3).
When DNase (I) is added to the culture medium, the amount of formed minerals in the mass yield decreases by a factor of 6, but a precipitate still forms. Figure 10b shows a SEM image of the morphology of a precipitate formed in a medium with bacterial cells supplemented with DNase (I) − 1xCaUrcell + DNase. The typical sizes of agglomerates (according to SEM) formed in the medium with DNA and with DNA removal using DNase (I) are similar and are about 100–250 µm by 44 h of cultivation of B. cereus in planktonic culture. However, morphological differences are observed in part of the surface of the agglomerates, which in the case of minerals formed with the addition of DNase is much less ordered and amorphous (Figure 10b, inset) than in the sample where the DNA component was not removed (Figure 10a, inset). The FTIR data indicate [16] that during the formation of precipitates in the absence of DNA, the polymorphic composition of the sediment is very different from that of the control sample and contains many impurities of amorphous calcium carbonate, water and vaterite. The SAXS data (Figure 10c, green circles) also suggests DNA removal had a significant effect on the surface fractal dimension and the upper size limit of the fractal structures in precipitates, 2.58 and 6.3 nm, respectively, which under these cell system conditions became closer to the values observed in the cell-free system.
Thus, unlike the cell-free system, in the cell system the presence of extracellular DNA appears to have a substantial effect on the supramolecular structure of precipitates formed during the first days of biomineralization.

4. Conclusions

The results of this study confirmed that the pathway of polymorphic transformations from amorphous calcium carbonate to vaterite and, further, to calcite, could be universal for both cell-free systems and the system with bacterial cells, and does not depend on the concentration of Ca2+ and urea. At the same time, the morphology and the mesoscale structure of the CaCO3 sediments formed in cell-free and bacterial systems are different, and appear to vary greatly depending on time, medium composition and, in the latter case, on the presence of eDNA in the ECM.
While DNA appear to strongly accelerate the rate of calcium carbonate precipitation in both cell-free and bacterial systems, its effect on the structural properties of the precipitate was only observed in bacterial culture, where it also had an effect on the polymorphic composition of the sediment, underlining the key role of eDNA in the formation of CaCO3 precipitates and their evolution throughout the biomineralization process.

Author Contributions

Conceptualization, D.V.L., A.A.K., G.P.K. and L.A.I.; methodology, D.V.L. and G.P.K.; validation, L.A.I., A.A.K. and D.V.L.; formal analysis, D.A.G., E.V.Z., A.D.Y., N.V.T., Y.E.G., L.A.I. and A.E.B.; investigation, L.A.I., A.E.B. and G.P.K.; data curation, D.V.L., L.A.I., A.D.Y., Y.E.G. and G.P.K.; writing—original draft preparation, L.A.I.; writing—review and editing, D.V.L., A.A.K. and L.A.I.; visualization, L.A.I., D.V.L. and G.P.K.; supervision, D.V.L. and A.A.K. All authors have read and agreed to the published version of the manuscript.

Funding

This work was carried out within the framework of the institutional research project (No. 121060200127-6) of the NRC “Kurchatov Institute”—PNPI.

Data Availability Statement

Data are available upon request from the authors.

Conflicts of Interest

The authors declare no conflict of interest. The funders had no role in the design of the study, in the collection, analyses, or interpretation of data, in the writing of the manuscript, or in the decision to publish the results.

Appendix A

Figure A1. EDX data for calcium carbonate sediments precipitated in a cell-free medium.
Minerals 13 00740 g0a1
Figure A2. SEM images of precipitations CaCO3, bacterial cells and ECM obtained by cultivating B. cereus in 10xCaUr medium (the concentration of urea and calcium reached 25 g/L) for 10 days.
Minerals 13 00740 g0a2
Figure A3. SEM images of precipitations obtained by cultivating B. cereus in 10xCaUr medium (the concentration of urea and calcium reached 25 g/L) for 48 h.
Minerals 13 00740 g0a3

References

  1. Seifan, M.; Berenjian, A. Application of Microbially Induced Calcium Carbonate Precipitation in Designing Bio Self-Healing Concrete. World J. Microbiol. Biotechnol. 2018, 34, 168. [Google Scholar] [CrossRef] [PubMed]
  2. Whiffin, V.S.; van Paassen, L.A.; Harkes, M.P. Microbial Carbonate Precipitation as a Soil Improvement Technique. Geomicrobiol. J. 2007, 24, 417–423. [Google Scholar] [CrossRef]
  3. Dhami, N.K.; Reddy, M.S.; Mukherjee, A. Biomineralization of Calcium Carbonates and Their Engineered Applications: A Review. Front. Microbiol. 2013, 4, 314. [Google Scholar] [CrossRef] [PubMed]
  4. Lee, Y.S.; Park, W. Current Challenges and Future Directions for Bacterial Self-Healing Concrete. Appl. Microbiol. Biotechnol. 2018, 102, 3059–3070. [Google Scholar] [CrossRef] [PubMed]
  5. Joshi, S.; Goyal, S.; Mukherjee, A.; Reddy, M.S. Microbial Healing of Cracks in Concrete: A Review. J. Ind. Microbiol. Biotechnol. 2017, 44, 1511–1525. [Google Scholar] [CrossRef]
  6. Ivanov, V.; Chu, J. Applications of Microorganisms to Geotechnical Engineering for Bioclogging and Biocementation of Soil in Situ. Rev. Environ. Sci. Biotechnol. 2008, 7, 139–153. [Google Scholar] [CrossRef]
  7. Achal, V.; Mukherjee, A.; Kumari, D.; Zhang, Q. Biomineralization for Sustainable Construction—A Review of Processes and Applications. Earth Sci. Rev. 2015, 148, 1–17. [Google Scholar] [CrossRef]
  8. Yuan, F.; Huang, Z.; Yang, T.; Wang, G.; Li, P.; Yang, B.; Li, J. Pathogenesis of Proteus mirabilis in Catheter-Associated Urinary Tract Infections. Urol. Int. 2021, 105, 354–361. [Google Scholar] [CrossRef]
  9. Jones, S.M.; Yerly, J.; Hu, Y.; Ceri, H.; Martinuzzi, R. Structure of Proteus Mirabilis Biofilms Grown in Artificial Urine and Standard Laboratory Media. FEMS Microbiol. Lett. 2007, 268, 16–21. [Google Scholar] [CrossRef]
  10. Tomer, N.; Garden, E.; Small, A.; Palese, M. Ureteral Stent Encrustation: Epidemiology, Pathophysiology, Management and Current Technology. J. Urol. 2021, 205, 68–77. [Google Scholar] [CrossRef]
  11. Akcalı, A.; Lang, N.P. Dental Calculus: The Calcified Biofilm and Its Role in Disease Development. Periodontology 2000 2018, 76, 109–115. [Google Scholar] [CrossRef]
  12. Hoffmann, T.D.; Paine, K.; Gebhard, S. Genetic Optimisation of Bacteria-Induced Calcite Precipitation in Bacillus Subtilis. Microb. Cell Fact. 2021, 20, 214. [Google Scholar] [CrossRef]
  13. Decho, A.W. Overview of Biopolymer-Induced Mineralization: What Goes on in Biofilms? Ecol. Eng. 2010, 36, 137–144. [Google Scholar] [CrossRef]
  14. Li, X.; Chopp, D.L.; Russin, W.A.; Brannon, P.T.; Parsek, M.R.; Packman, A.I. Spatial Patterns of Carbonate Biomineralization in Biofilms. Appl. Environ. Microbiol. 2015, 81, 7403–7410. [Google Scholar] [CrossRef]
  15. Al Disi, Z.A.; Zouari, N.; Dittrich, M.; Jaoua, S.; Al-Kuwari, H.A.S.; Bontognali, T.R.R. Characterization of the Extracellular Polymeric Substances (EPS) of Virgibacillus Strains Capable of Mediating the Formation of High Mg-Calcite and Protodolomite. Mar. Chem. 2019, 216, 103693. [Google Scholar] [CrossRef]
  16. Ivanova, L.A.; Egorov, V.V.; Zabrodskaya, Y.A.; Shaldzhyan, A.A.; Baranchikov, A.Y.; Tsvigun, N.V.; Lykholay, A.N.; Yapryntsev, A.D.; Lebedev, D.V.; Kulminskaya, A.A. Matrix Is Everywhere: Extracellular DNA Is a Link between Biofilm and Mineralization in Bacillus Cereus Planktonic Lifestyle. NPJ Biofilms Microbiomes 2023, 9, 9. [Google Scholar] [CrossRef]
  17. Zehner, J.; Røyne, A.; Sikorski, P. Calcite Seed-Assisted Microbial Induced Carbonate Precipitation (MICP). PLoS ONE 2021, 16, e0240763. [Google Scholar] [CrossRef]
  18. Cheng, M.; Sun, S.; Wu, P. Microdynamic Changes of Moisture-Induced Crystallization of Amorphous Calcium Carbonate Revealed via in Situ FTIR Spectroscopy. Phys. Chem. Chem. Phys. 2019, 21, 21882–21889. [Google Scholar] [CrossRef]
  19. Hammes, F.; Verstraete, W. Key Roles of PH and Calcium Metabolism in Microbial Carbonate Precipitation. Rev. Environ. Sci. Biotechnol. 2002, 1, 3–7. [Google Scholar] [CrossRef]
  20. Anbu, P.; Kang, C.-H.; Shin, Y.-J.; So, J.-S. Formations of Calcium Carbonate Minerals by Bacteria and Its Multiple Applications. Springerplus 2016, 5, 250. [Google Scholar] [CrossRef]
  21. Seifan, M.; Samani, A.K.; Berenjian, A. Induced Calcium Carbonate Precipitation Using Bacillus Species. Appl. Microbiol. Biotechnol. 2016, 100, 9895–9906. [Google Scholar] [CrossRef]
  22. Segovia-Campos, I.; Martignier, A.; Filella, M.; Jaquet, J.; Ariztegui, D. Micropearls and Other Intracellular Inclusions of Amorphous Calcium Carbonate: An Unsuspected Biomineralization Capacity Shared by Diverse Microorganisms. Environ. Microbiol. 2022, 24, 537–550. [Google Scholar] [CrossRef] [PubMed]
  23. Cartwright, J.H.E.; Checa, A.G.; Gale, J.D.; Gebauer, D.; Sainz-Díaz, C.I. Calcium Carbonate Polyamorphism and Its Role in Biomineralization: How Many Amorphous Calcium Carbonates Are There? Angew. Chem. Int. Ed. 2012, 51, 11960–11970. [Google Scholar] [CrossRef] [PubMed]
  24. Cantaert, B.; Kuo, D.; Matsumura, S.; Nishimura, T.; Sakamoto, T.; Kato, T. Use of Amorphous Calcium Carbonate for the Design of New Materials. Chempluschem 2017, 82, 107–120. [Google Scholar] [CrossRef] [PubMed]
  25. Ju, Y.; Zhao, Y.; Guan, Q.; Yang, S.; Wang, W.; Yan, B.; Meng, Y.; Li, S.; Tang, P.; Mao, L.; et al. Amorphous Calcium Carbonate Cluster Nanospheres in Water-Deficient Organic Solvents. Angew. Chem. Int. Ed. 2022, 61, e202211254. [Google Scholar] [CrossRef]
  26. Grünewald, T.A.; Checchia, S.; Dicko, H.; Le Moullac, G.; Sham Koua, M.; Vidal-Dupiol, J.; Duboisset, J.; Nouet, J.; Grauby, O.; Di Michiel, M.; et al. Structure of an Amorphous Calcium Carbonate Phase Involved in the Formation of Pinctada Margaritifera Shells. Proc. Natl. Acad. Sci. USA 2022, 119, e2212616119. [Google Scholar] [CrossRef]
  27. Fernandez-Martinez, A.; Kalkan, B.; Clark, S.M.; Waychunas, G.A. Pressure-Induced Polyamorphism and Formation of ‘Aragonitic’ Amorphous Calcium Carbonate. Angew. Chem. 2013, 125, 8512–8515. [Google Scholar] [CrossRef]
  28. Clark, S.M.; Colas, B.; Jacob, D.E.; Neuefeind, J.C.; Wang, H.-W.; Page, K.L.; Soper, A.K.; Schodder, P.I.; Duchstein, P.; Zubiri, B.A.; et al. The Nano- and Meso-Scale Structure of Amorphous Calcium Carbonate. Sci. Rep. 2022, 12, 6870. [Google Scholar] [CrossRef]
  29. Soper, A.K. Empirical Potential Monte Carlo Simulation of Fluid Structure. Chem. Phys. 1996, 202, 295–306. [Google Scholar] [CrossRef]
  30. Tobler, D.J.; Rodriguez Blanco, J.D.; Sørensen, H.O.; Stipp, S.L.S.; Dideriksen, K. Effect of PH on Amorphous Calcium Carbonate Structure and Transformation. Cryst. Growth Des. 2016, 16, 4500–4508. [Google Scholar] [CrossRef]
  31. Yang, G.; Li, F.; Wang, Y.; Ji, C.; Huang, L.; Su, Z.; Li, X.; Zhang, C. The Effect of Bacillus Cereus LV-1 on the Crystallization and Polymorphs of Calcium Carbonate. RSC Adv. 2022, 12, 26908–26921. [Google Scholar] [CrossRef]
  32. Wang, H.-W.; Daemen, L.L.; Cheshire, M.C.; Kidder, M.K.; Stack, A.G.; Allard, L.F.; Neuefeind, J.; Olds, D.; Liu, J.; Page, K. Synthesis and Structure of Synthetically Pure and Deuterated Amorphous (Basic) Calcium Carbonates. Chem. Commun. 2017, 53, 2942–2945. [Google Scholar] [CrossRef]
  33. Liu, R.; Huang, S.; Zhang, X.; Song, Y.; He, G.; Wang, Z.; Lian, B. Bio-Mineralisation, Characterization, and Stability of Calcium Carbonate Containing Organic Matter. RSC Adv. 2021, 11, 14415–14425. [Google Scholar] [CrossRef]
  34. Steciuk, G.; Palatinus, L.; Rohlíček, J.; Ouhenia, S.; Chateigner, D. Stacking Sequence Variations in Vaterite Resolved by Precession Electron Diffraction Tomography Using a Unified Superspace Model. Sci. Rep. 2019, 9, 9156. [Google Scholar] [CrossRef]
  35. Lyu, J.; Li, F.; Zhang, C.; Gower, L.; Wasman, S.; Sun, J.; Yang, G.; Chen, J.; Gu, L.; Tang, X.; et al. From the inside out: Elemental Compositions and Mineral Phases Provide Insights into Bacterial Calcification. Chem. Geol. 2021, 559, 119974. [Google Scholar] [CrossRef]
  36. Zhao, X.; Wang, M.; Wang, H.; Tang, D.; Huang, J.; Sun, Y. Study on the Remediation of Cd Pollution by the Biomineralization of Urease-Producing Bacteria. Int. J. Environ. Res. Public Health 2019, 16, 268. [Google Scholar] [CrossRef]
  37. Khanjani, M.; Westenberg, D.J.; Kumar, A.; Ma, H. Tuning Polymorphs and Morphology of Microbially Induced Calcium Carbonate: Controlling Factors and Underlying Mechanisms. ACS Omega 2021, 6, 11988–12003. [Google Scholar] [CrossRef]
  38. Wei, S.; Cui, H.; Jiang, Z.; Liu, H.; He, H.; Fang, N. Biomineralization Processes of Calcite Induced by Bacteria Isolated from Marine Sediments. Braz. J. Microbiol. 2015, 46, 455–464. [Google Scholar] [CrossRef]
  39. Golovkina, D.A.; Zhurishkina, E.V.; Ivanova, L.A.; Baranchikov, A.E.; Sokolov, A.Y.; Bobrov, K.S.; Masharsky, A.E.; Tsvigun, N.V.; Kopitsa, G.P.; Kulminskaya, A.A. Calcifying Bacteria Flexibility in Induction of CaCO3 Mineralization. Life 2020, 10, 317. [Google Scholar] [CrossRef]
  40. Marvasi, M.; Gallagher, K.L.; Martinez, L.C.; Molina Pagan, W.C.; Rodríguez Santiago, R.E.; Castilloveitía Vega, G.; Visscher, P.T. Importance of B4 Medium in Determining Organomineralization Potential of Bacterial Environmental Isolates. Geomicrobiol. J. 2012, 29, 916–924. [Google Scholar] [CrossRef]
  41. Klepetsanis, P.G.; Kladi, A.; Ostvold, T.; Kontoyiannis, C.G.; Koutsoukos, P.G.; Amjad, Z.; Reddy, M.M. The Inhibition of Calcium Carbonate Formation in Aqueous Supersaturated Solutions, Spontaneous Precipitation and Seeded Crystal Growth. In Advances in Crystal Growth Inhibition Technologies; Kluwer Academic Publishers: Boston, MA, USA, 2022; pp. 123–137. [Google Scholar]
  42. Krishnapriya, S.; Venkatesh Babu, D.L.; Prince Arulraj, G. Isolation and Identification of Bacteria to Improve the Strength of Concrete. Microbiol. Res. 2015, 174, 48–55. [Google Scholar] [CrossRef] [PubMed]
  43. Beaucage, G. Approximations Leading to a Unified Exponential/Power-Law Approach to Small-Angle Scattering. J. Appl. Crystallogr. 1995, 28, 717–728. [Google Scholar] [CrossRef]
  44. Simon, P.; Pompe, W.; Gruner, D.; Sturm, E.; Ostermann, K.; Matys, S.; Vogel, M.; Rödel, G. Nested Formation of Calcium Carbonate Polymorphs in a Bacterial Surface Membrane with a Graded Nanoconfinement: An Evolutionary Strategy to Ensure Bacterial Survival. ACS Biomater. Sci. Eng. 2022, 8, 526–539. [Google Scholar] [CrossRef] [PubMed]
  45. Nakamoto, K. IK-Spektry i Spektry KR Neorganicheskikh i Koordinatsionnykh Soedinenii [Infrared and Raman Spectra of Inorganic and Coordination Compounds*]; Mir: Moscow, Russia, 1991. [Google Scholar]
  46. Tammer, M.G. Sokrates: Infrared and Raman Characteristic Group Frequencies: Tables and Charts. Colloid Polym. Sci. 2004, 283, 235. [Google Scholar] [CrossRef]
  47. Jones, G.C.; Jackson, B. Infrared Transmission Spectra of Carbonate Minerals; Springer: Dordrecht, The Netherlands, 1993; ISBN 978-94-010-4940-5. [Google Scholar]
  48. Zhong, C.; Chu, C.C. On the Origin of Amorphous Cores in Biomimetic CaCO3 Spherulites: New Insights into Spherulitic Crystallization. Cryst. Growth Des. 2010, 10, 5043–5049. [Google Scholar] [CrossRef]
  49. Rodriguez-Navarro, C.; Jimenez-Lopez, C.; Rodriguez-Navarro, A.; Gonzalez-Muñoz, M.T.; Rodriguez-Gallego, M. Bacterially Mediated Mineralization of Vaterite. Geochim. Cosmochim. Acta 2007, 71, 1197–1213. [Google Scholar] [CrossRef]
  50. Beniash, E.; Aizenberg, J.; Addadi, L.; Weiner, S. Amorphous Calcium Carbonate Transforms into Calcite during Sea Urchin Larval Spicule Growth. Proc. R Soc. Lond. B Biol. Sci. 1997, 264, 461–465. [Google Scholar] [CrossRef]
  51. Jayaraman, A.; Subramanyam, G.; Sindhu, S.; Ajikumar, P.K.; Valiyaveettil, S. Biomimetic Synthesis of Calcium Carbonate Thin Films Using Hydroxylated Poly(Methyl Methacrylate) (PMMA) Template. Cryst. Growth Des. 2007, 7, 142–146. [Google Scholar] [CrossRef]
  52. Yan, G.W.; Huang, J.H.; Zhang, J.F.; Qian, C.J. Aggregation of Hollow CaCO3 Spheres by Calcite Nanoflakes. Mater. Res. Bull. 2008, 43, 2069–2077. [Google Scholar] [CrossRef]
  53. Mantilaka, M.M.M.G.P.G.; Pitawala, H.M.T.G.A.; Rajapakse, R.M.G.; Karunaratne, D.G.G.P.; Upul Wijayantha, K.G. Formation of Hollow Bone-like Morphology of Calcium Carbonate on Surfactant/Polymer Templates. J. Cryst. Growth 2014, 392, 52–59. [Google Scholar] [CrossRef]
Figure 1. Photo of precipitated calcium carbonate in a cell-free system after: (a) the addition of the exogenous DNA; (b) without exogenous DNA.
Minerals 13 00740 g001
Figure 2. SEM images of calcium carbonate obtained in a cell-free system at a CaCl2 concentration of 25 g/L: (a) 10xCaUr with the addition of exDNA (in the green window), (b) 10xCaUrcontr without the addition of exDNA (in the blue window); and at a CaCl2 concentration of 2.5 g/L: (c) 1xCaUr with the addition of exDNA (in the pink window), (d) 1xCaUrcontr without the addition of exDNA (in the yellow window).
Minerals 13 00740 g002
Figure 3. SAXS data for calcium carbonate precipitates obtained in a cell-free system at two different concentrations of CaCl2 and urea: 25 g/L with (green squares, 10xCaUr + DNA) and without (blue circles, 10xCaUr-DNA) DNA induction, and 2.5 g/L with (pink squares, 1xCaUr + DNA) and without (yellow circles, 1xCaUr-DNA) DNA induction. Data fitted to the unified scattering function (Beaucage model) with one and two levels of the hierarchy, respectively (see Methods). The fit parameters: 10xCaUrcontr-DNA − Rg = 41.19 ± 0.01 nm, n = 3.2991 ± 0.0003, χ2 = 122; 10xCaUr + DNA − Rg = 35.0 ± 0.2 nm, n = 3.186 ± 0.003, χ2 = 89; 1xCaUrcontr-DNA – Rg0 = 45.6 ± 0.2 nm, Rg = 3.06 ± 0.04 nm, n = 3.47 ± 0.04, χ2 = 91; 1xCaUr + DNA Rg0 = 68.4 ± 0.1 nm, Rg = 7.2 ± 0.1 nm, n = 3.27 ± 0.01, χ2 = 128.
Minerals 13 00740 g003
Figure 4. SEM data for calcium carbonate precipitates obtained in a cell system within: (a) 5 days of cultivation, (blue window) (b) 14 days of cultivation (black window); and SAXS data (c) for calcium carbonate precipitates obtained in a cell system after 5 days and 14 days from the start of culturing of bacteria. SAXS data were fitted to the unified scattering function (Beaucage model, see Methods): 5 days (blue squares)—Rg = 7.4 ± 0.1 nm, n = 3.31 ± 0.02, χ2 = 5.2; 14 days (black circles)—Rg = 15.8 ± 0.3 nm, n = 3.16 ± 0.01, χ2 = 6.6.
Minerals 13 00740 g004
Figure 5. Time-dependence of: BLUE WITH STRIPES: the bacterial biomass growth: RED WITH CIRCLES: the medium acidity during the incubation of B. cereus 4B in the 10xCaUrcell medium (with an excess of calcium and urea ions).
Minerals 13 00740 g005
Figure 6. Analysis of CaCO3 precipitates formed during B. cereus inoculation in a media 10xCaUrcell medium for 14 days: (a) overall FTIR spectra of precipitates at different growth times; it can be seen in the inset that the region of spectrum shows a decrease in the amorphous phase content in the samples, the loss of the vaterite peak (750 cm−1) after 72 h and an increase in the calcite phase peak (710 cm−1) in the samples over time; (b) X-ray diffraction patterns of the samples show changes in the calcium carbonate polymorphs’ distribution during the growth of B. cereus: after 30 h, a noticeable amount of vaterite was found, around 10% of the total calcium carbonate crystals’ content, and the vaterite phase gradually turned into calcite; after 72 h of incubation no vaterite peaks were detected; (c): The change in the SEM topology shows a near tenfold increase in the spherulites’ size (from 50 to 500 microns) over the period discussed due to the adhesion of several individual particles (blue and violet arrows), with the disappearance of the amorphous phase (green arrow) around the crystalline particles and traces of bacteria (red arrows).
Minerals 13 00740 g006
Figure 7. Small-angle neutron scattering from CaCO3 samples obtained during 14 days of culturing bacteria. Data is offset for clarity and fitted to Beaucage model.
Minerals 13 00740 g007
Figure 8. SANS data of CaCO3 samples obtained during 14 days of culturing bacteria (a) dependence of the fractal dimension on the growth time of crystals within 14 days; (b) dependence of the Rc on the growth time of crystals within 14 days.
Minerals 13 00740 g008
Figure 9. Structure and morphology of CaCO3 samples obtained during 5 days of culturing bacteria: (a) SEM image of the morphology of calcium carbonate precipitates obtained by cultivating B. cereus in 1xCaUrcell medium (the concentration of urea and calcium reached 2.5 g/L) after 5 days; (b) SAXS data of precipitates obtained during biomineralization of B. cereus in 1xCaUrcell medium (the concentration of urea and calcium reached 2.5 g/L) after 5 days (black diamonds). The corresponding data (Figure 4) for 25 g/L (10xCaUrcell concentrations) are shown for comparison (blue squares). Data were fitted to the unified scattering function (Beaucage model, see Methods), Rg = 7.3 ± 0.4 nm, n = 3.25 ± 0.04, χ2 = 343.
Minerals 13 00740 g009
Figure 10. Effect of DNase on CaCO3 precipitates: (a) SEM image of the morphology of calcium carbonate precipitates obtained by cultivating B. cereus in 1xCaUrcell control medium (the concentration of urea and calcium reached 2.5 g/L) 44 h (blue window); (b) SEM image of the morphology of calcium carbonate precipitates obtained by cultivating B. cereus in 1xCaUrcell + DNase medium (the concentration of urea and calcium reached 2.5 g/L) 44 h (green window); (c) SAXS data of precipitates obtained during biomineralization of B. cereus in 1xCaUr medium (the concentration of urea and calcium reached 2.5 g/L) with DNase (I) (green circle) and without DNase (blue square) for 44 h. Data were fitted to the unified scattering function (Beaucage model, see Methods), Rg = 9.4 ± 0.2 nm, n = 3.70 ± 0.02, χ2 = 1.2 (1xCaUrcell control); Rg = 6.3 ± 0.1 nm, n = 3.42 ± 0.02, χ2 = 2.2. (1xCaUrcell + DNase).
Minerals 13 00740 g010
Table 1. Exogenous DNA effect on yields and observed precipitation time in cell-free system.
Sample *ExperimentAdded CaCl2, g/LYield of CaCO3 Precipitates, mg per 100 mLObserved Precipitation Time, min
10xCaUrSupernatant with urea (25 g/L) + exDNA2517.95
10xCaUrcontrSupernatant with urea (25 g/L)2517.630
1xCaUrSupernatant with urea (2.5 g/L) + exDNA2.58.38
1xCaUrcontrSupernatant with urea (2.5 g/L)2.58.240
* The samples were obtained in the manner described in Section 2.2 of Materials and Methods.
Disclaimer/Publisher’s Note: The statements, opinions and data contained in all publications are solely those of the individual author(s) and contributor(s) and not of MDPI and/or the editor(s). MDPI and/or the editor(s) disclaim responsibility for any injury to people or property resulting from any ideas, methods, instructions or products referred to in the content.

