
New Evaluation Method of Exposure to Radon Gas in Mining Environments
by
 , and
, and
Diego Diegues Francisca
,
Wilson Siguemasa Iramina
,
Anna Luiza Marques Ayres da Silva
* and
Giorgio de Tomi
Mining and Petroleum Engineering Department, Polytechnic School, University of São Paulo, São Paulo 05508-030, Brazil
*
Author to whom correspondence should be addressed.
Minerals 2023, 13(7), 897; https://0-doi-org.brum.beds.ac.uk/10.3390/min13070897
Submission received: 8 May 2023
/
Revised: 19 June 2023
/
Accepted: 29 June 2023
/
Published: 30 June 2023
(This article belongs to the Special Issue Radionuclides and Radiation Exposure in Mine Sites)
Abstract
:Physical and chemical agents in workplace environments can be hazardous for employees. Much of the exposure to ionizing radiation can occur due to the presence of radon in the workplace. Mining environments are more susceptible to containing radon gas because it emanates from soil or rocks. Radon is known to be associated with lung cancer as it is a gaseous chemical agent under normal conditions and is also radioactive. Since there is little knowledge about radon in Brazilian mining workplaces, this study aims to measure occupational exposure to radon in mining environments through a proposed methodology and to verify its compliance with international standards to confirm the potential risk of exposure for employees. Radon concentration in open-pit mining work environments was measured and used as a basis for comparison to assess the proposed new evaluation method, which will consist of laboratory evaluations of samples taken from the same workplaces. The radon concentration data in the work environments were compared to laboratory tests for statistical correlation. The results, compared to reference values, tolerance limits, and action levels, showed that radon, in outdoor mining workplaces, can be considered a low risk to employees’ health. The application of the methodology also indicated that the laboratory tests and the field evaluations presented a statistical correlation with each other, being an indication that the laboratory tests can be used to estimate the risks in a preliminary way. Another important point is the fact that it was observed that measurements in the laboratory were more practical and faster to perform when compared to field evaluations. These facts can bring future gains in the number of tests performed and workplace evaluated in mining environments.
1. Introduction
Workers performing their activities in industrial environments may be exposed to hazardous agents.
Radiation, both ionizing and non-ionizing, may be found in workplace environments. If it possesses the energy required to break the bonds between the electrons of a molecule, then we can name it ionizing radiation and it comes from the process of stabilization of very energetic atomic nuclei, the so-called radioactive elements. The radiation statues in any territory in modern circumstances are produced by natural and anthropogenic backgrounds [1].
Radon is a radioactive element with unique characteristics since it is the only one that, under normal conditions of temperature and pressure, is in the form of an inert gas. According to Fianco [2] and Fonseca [3], radon gas is responsible for most people’s exposure to natural ionizing radiation, and this is an important condition when radon is compared to other radioactive elements.
The decay process of radon generates alpha radiation that has low penetration power but a high energetic load when compared to other types of radiation. Alpha radiation, when in direct contact with tissue and mucosal cells, can generate ionization of DNA molecules and, as a consequence, may cause diseases; cancer is the most common one [4,5].
Brazil has individual radon dose limits for both occupational exposure of workers and exposure of the general public. Radon monitoring is, most of the time, a difficult and time-consuming process, and because there is a lack of knowledge concerning the sampling and analysis of its concentration, many of the Brazilian workplace environments ignore this potentially hazardous condition. Mining is a very important Brazilian economy segment, and since the mining process is associated with moving earth on a large scale and sometimes in very deep places, chances are that radon gas may be released from time to time.
Because radon is an inert gas, there are no chemical filters capable of detecting its concentration directly in the air like methane or NOx in mines. Most detection methods are based on radioactive activity [6].
Therefore, this study aims to present and evaluate a proposed laboratory methodology to estimate exposure to radon in mining environments. The measurements can also be used to verify compliance with international standards and as a warning of a potential hazard.
The relevance of the study is due to the fact that, in Brazil, the norms that regulate and present the limits of workers’ exposure to physical agents do not differentiate the methodology for evaluating exposure to radon from other sources of ionizing radiation; however, this radioactive element has its own characteristics and specifics, which makes the assessment of exposure and the application of control measures to reduce it different.
Evaluating and improving the different quantification methodologies can increase the number of environments analyzed and make the results obtained more representative.
This is a way of alerting those responsible for the health of mining workers regarding a potential risk.
2. Materials and Methods
2.1. Ionizing Radiation and Radon Gas
There are three families or series of natural radioactive elements, and they vary according to their decay sequence (stabilization process): uranium series, actinium series, and thorium series. These three families have, in their sequential stabilization process, a stage in which matter is transformed into an element called radon, but for each of these series, an isotope of radon is formed [4,7,8]. The three isotopes of this naturally occurring gas are [9]:
- 222Rn, or radon 222, which has a half-life of 3.8 days and is called radon gas;
- 220Rn, or radon 220, which has a half-life of 54.5 s and is called thoron gas;
- 219Rn, or radon 219, which has a half-life of 3.9 s and is called actinium gas; this exists in negligible quantities in nature.
The physical properties of the 222Rn isotope, which is the most abundant in nature, are shown in Table 1.
The emission generated in the radioactive decay of radon is the alpha type. Because it has low penetration power, it is blocked by the most superficial layers of the skin of living beings. On the other hand, since radon is a gas, its inhalation can represent a danger to health. When inhaled, part of the gas may decay within the lung, exposing the cells of the internal mucous of its membranes to the ionizing radiation. Moreover, a fraction of the short-lived radon decay product aerosols can be deposited within the respiratory tract once inhaled and can reach the lungs, acting directly on pulmonary cells [10]. These cells are much more sensitive to radiation than the cells that form the skin. As alpha radiation has higher energy compared to other emissions, the ionization density is also higher, increasing the probability of cancer development in the exposed individual, especially the lung type, which is the organ directly sensitized [4,9,11].
The concentration of radon in the atmosphere is differently characterized from other chemical agents. The activity of radon matter dispersed in equilibrium in the air is used to determine its concentration by a certain volume, and the usual unit is Bq/m3 [4].
From the average radon concentration in an environment, it is possible to estimate the average annual effective dose for radon and its descendants through the Equation (1) [12]:
where:
E = C × t × F × 9 × 10⁻⁶
- E is the average annual effective dose expressed in mSv/a;
- C is the concentration of radon expressed in Bq/m3 on the air;
- t is the exposure time in hours per year, considered as 2000 h/year;
- F is the equilibrium factor that depends on the rate of ventilation and other factors such as wind speed; the usual is 0.8 for outdoor and 0.4 for indoor [13];
- 9 is the conversion factor of the radon concentration to the effective dose given in (nSv × m3)/(Bq × h) [12].
2.2. Radon Exposure Standards
In Brazil, individual dose limits to both occupational exposure for workers and exposure of the general public cannot exceed the values defined by CNEN (National Nuclear Energy Commission) in its norm CNEN-NN-3.01 from 2011 and revised in 2014, denominated “Basic Guidelines of Radiological Protection” [14].
In the USA, the tolerance limit for exposure to radon gas is 148 Bq/m3; in Germany, the limit drops to 100 Bq/m3. Both limits were set for the general public (non-occupational exposures) [4].
2.3. Radon in Mining Activities and Effects of Exposure
Radon has a natural occurrence in rocks and soils [2], and depending on the characteristics of the mined materials, mining environments may have a higher concentration of this gas when compared to other industry working environments [15].
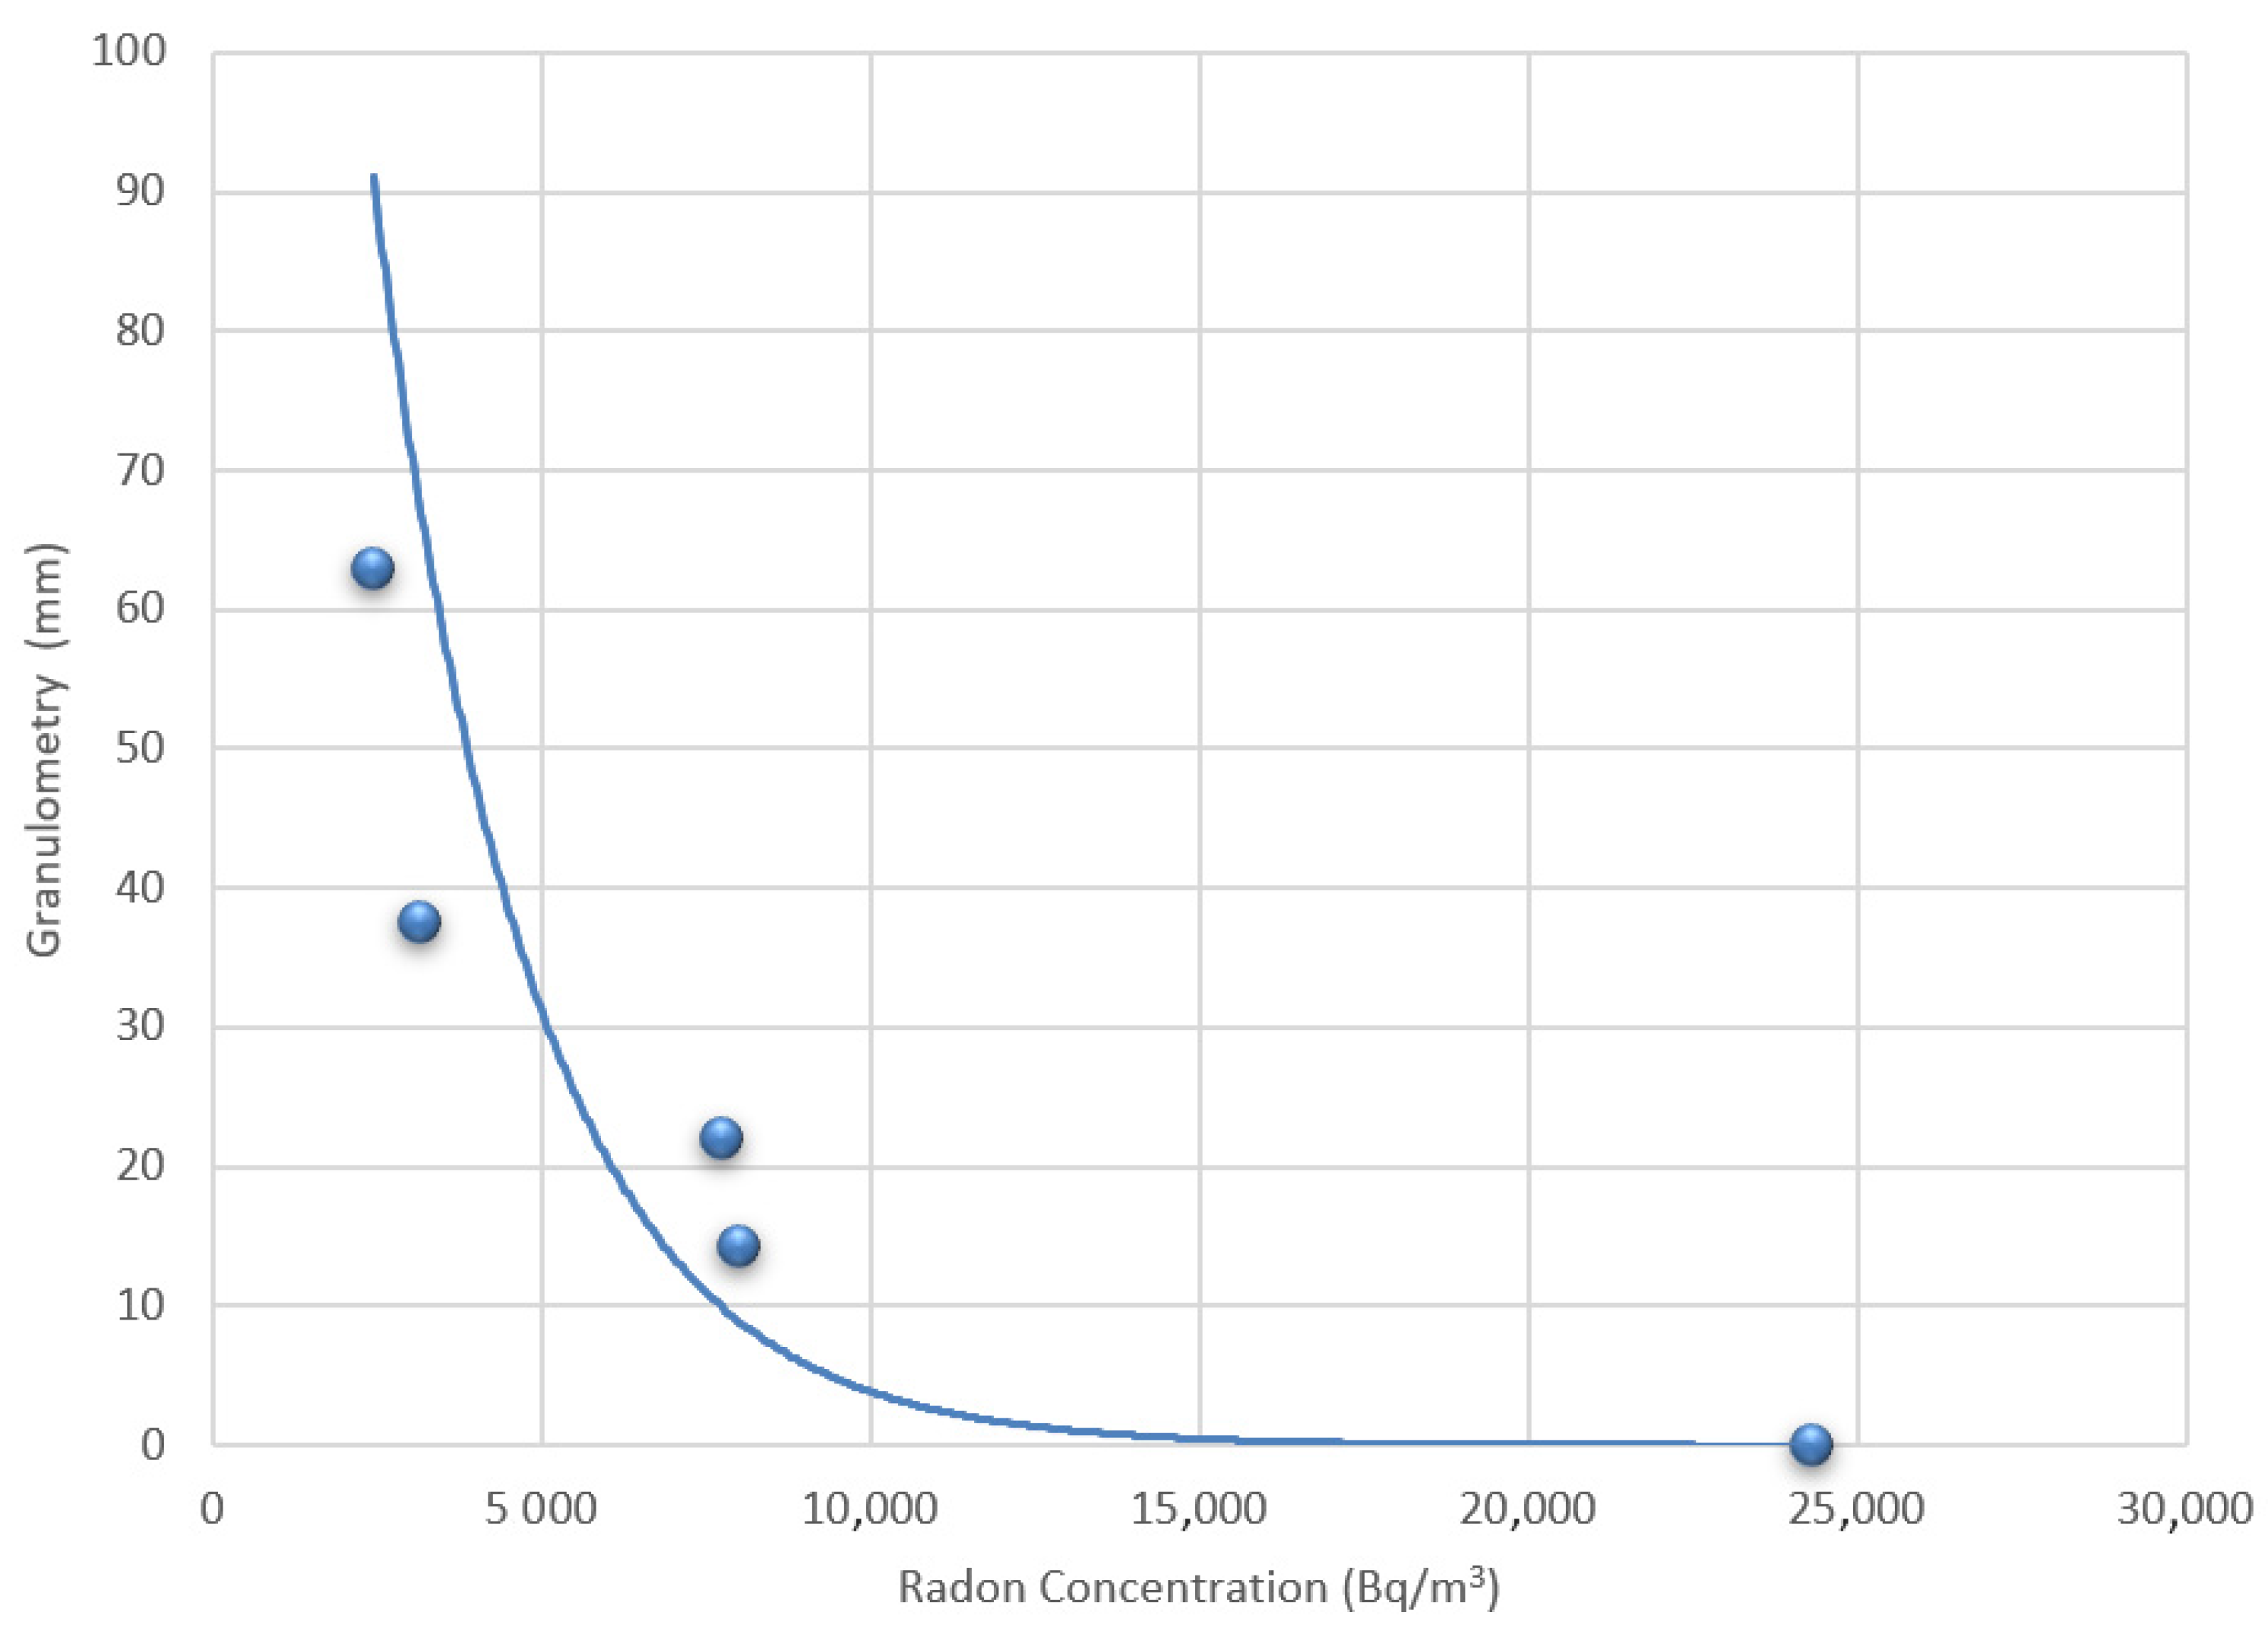
In addition, according to Francisca [16], the concentration of radon in minerals increases exponentially with the reduction in granulometry (Figure 1), which indicates a greater exposure to the element in environments where methods of comminution of mined materials are applied.
Ayres da Silva [17], as shown in Table 2, presents a compilation of data with the average concentration of radon in Brazilian mining and the estimate of the effective dose received by workers due to this exposure.
The annual dose estimates were calculated using Equation (1).
The study presented by Veiga et al. [18] indicates that the concentration of radon gas in underground coal mines assessed in Brazil are above the action levels recommended by the International Commission of Radiological Protection-ICRP 65. In another study carried out by Anjos et al. [19], radon concentration was approximately three times higher than the action level recommended by the ICRP. The measures on this study were conducted at the La Carolina mine, a decommissioned gold mine open to tourist visitation in Argentina.
On the effects of exposure to radon and its subsequent elements, according to the study by Woodward et al. [20], the mortality rate from lung cancer in former workers at the Radium Hill uranium mine is higher when compared to the rate for the general Australian population. It was also observed that the mortality rate for underground workers was higher than for surface workers.
The study conducted by Lubin et al. [21] compiling 11 studies on exposure to radon gas in mining environments, considering 65,000 individuals and more than 2700 deaths from lung cancer, observed that approximately 40% of all lung cancer deaths in miners may have been caused by prolonged exposure to radon gas and its progenitors.
2.4. Radon Detection Issues
As stated, radon is an inert gas, and there are no chemical filters capable of detecting its concentration directly in the air. Most detection methods are based on radioactive activity [6].
Some detector types are sensitive to alpha particle emissions from 222Rn and its decay products. Other methods detect gamma rays from the elements 214Pb or 214Bi [6].
Scintillation cell detectors are semi-integrative devices that operate in passive or active mode (without or with an air pump). They consist of a metal cylinder lined internally with a scintillating material, usually zinc sulfide activated by silver powder. When an alpha emission interacts with the scintillator material, the production of luminous photons occurs; these are detected and amplified by a photomultiplier. This photomultiplier is posterior to a transparent window, where an electronic sensor counts these photons determining the concentration of radon [22]. This method was used in field sampling and laboratory procedures in this study.
2.5. Radon Measurement and Analysis
The procedures consisted of visiting mining companies to measure the radon concentration in the workplace, always in open-pit conditions with high mineral dust accumulation, and in crusher dust stockpiles, also in open pit, (grain size below 4.8 mm), to measure the concentration of this material. These measurements will later be used as a basis for comparison.
In addition to this process, a sample of material was collected at each site visited so that it could be analyzed in the laboratory. These laboratory analyses, which will be proposed and described later, represent the new evaluation method of exposure to radon gas.
The samples were prepared for the analysis of radon concentration in the laboratory, through an elongate pile procedure and screening, to avoid sample bias. Only the material with particle size under 4.8 mm mesh was used in this test, and the sample was dried up in an industrial oven at 100 °C for 12 h.
The radon concentration data in the workplace were compared, two by two, with concentration obtained in the laboratory and with stockpile concentration data, to verify if there was a statistical correlation.
Laboratory work and sample preparation aimed to control two parameters, humidity levels and granulometry. These procedures allow statistical comparison between samples.
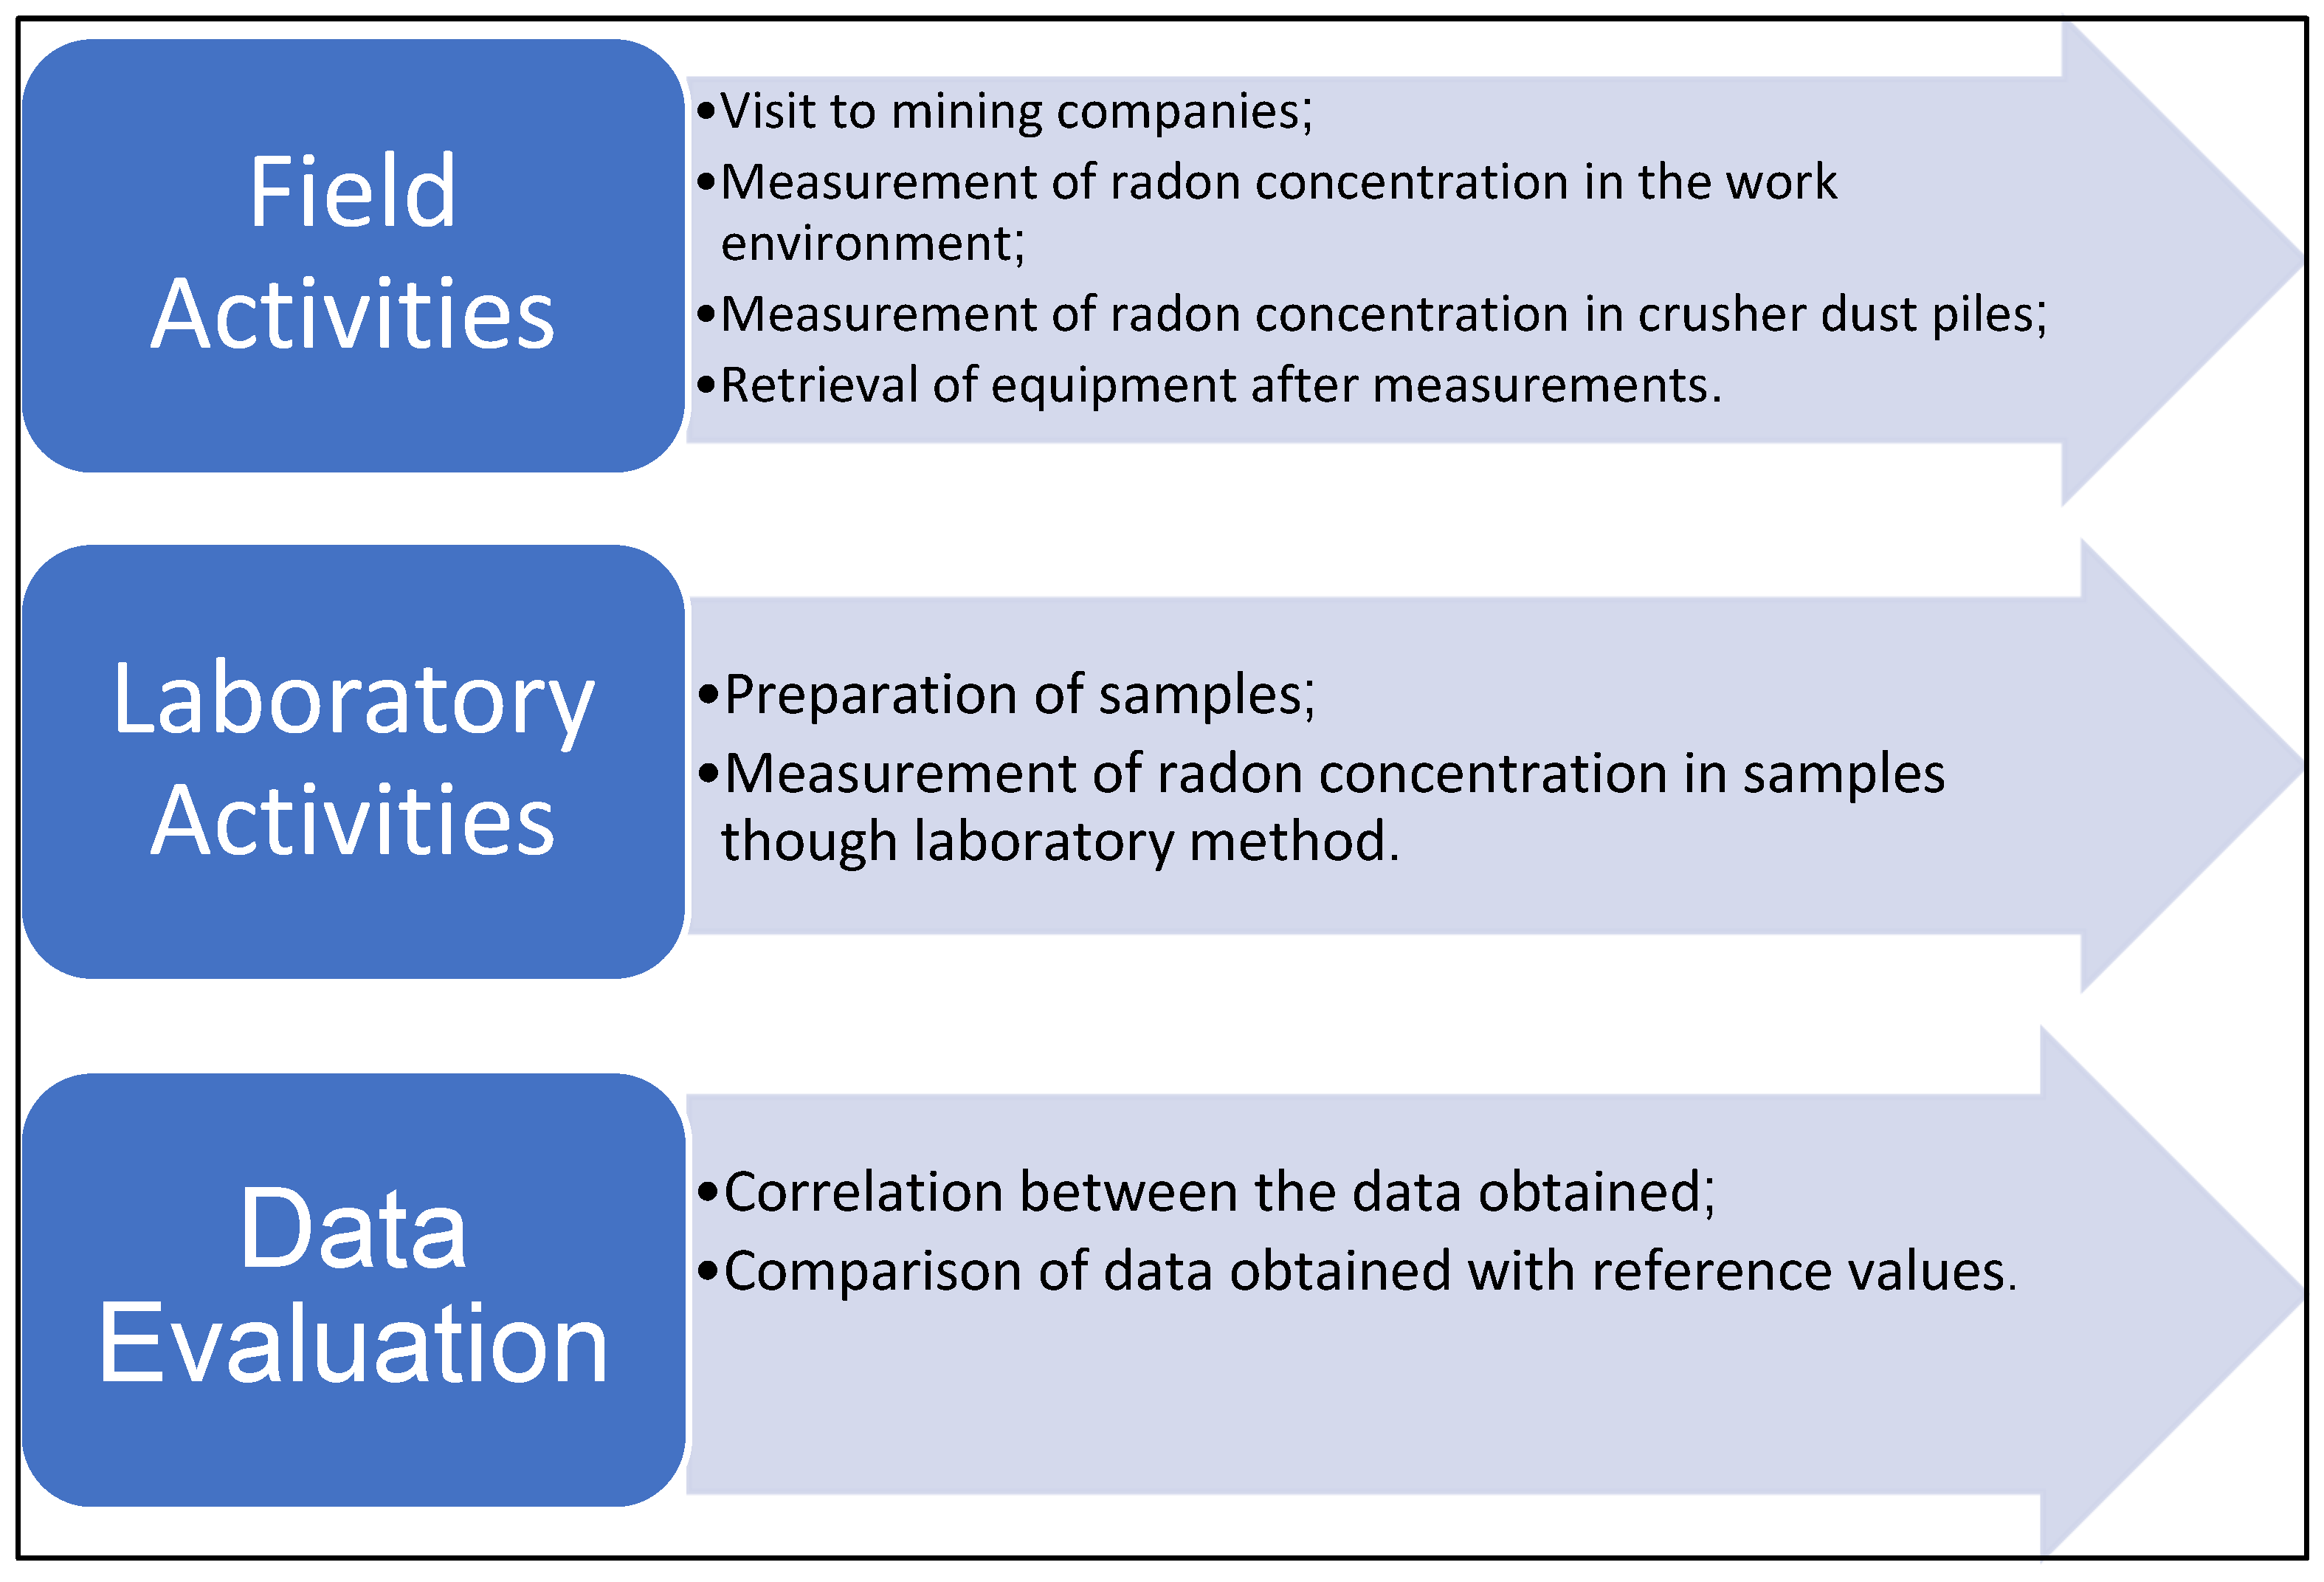
Finally, the values were compared with reference values, tolerance limits, and action levels. Figure 2 presents the methodology in summary form.
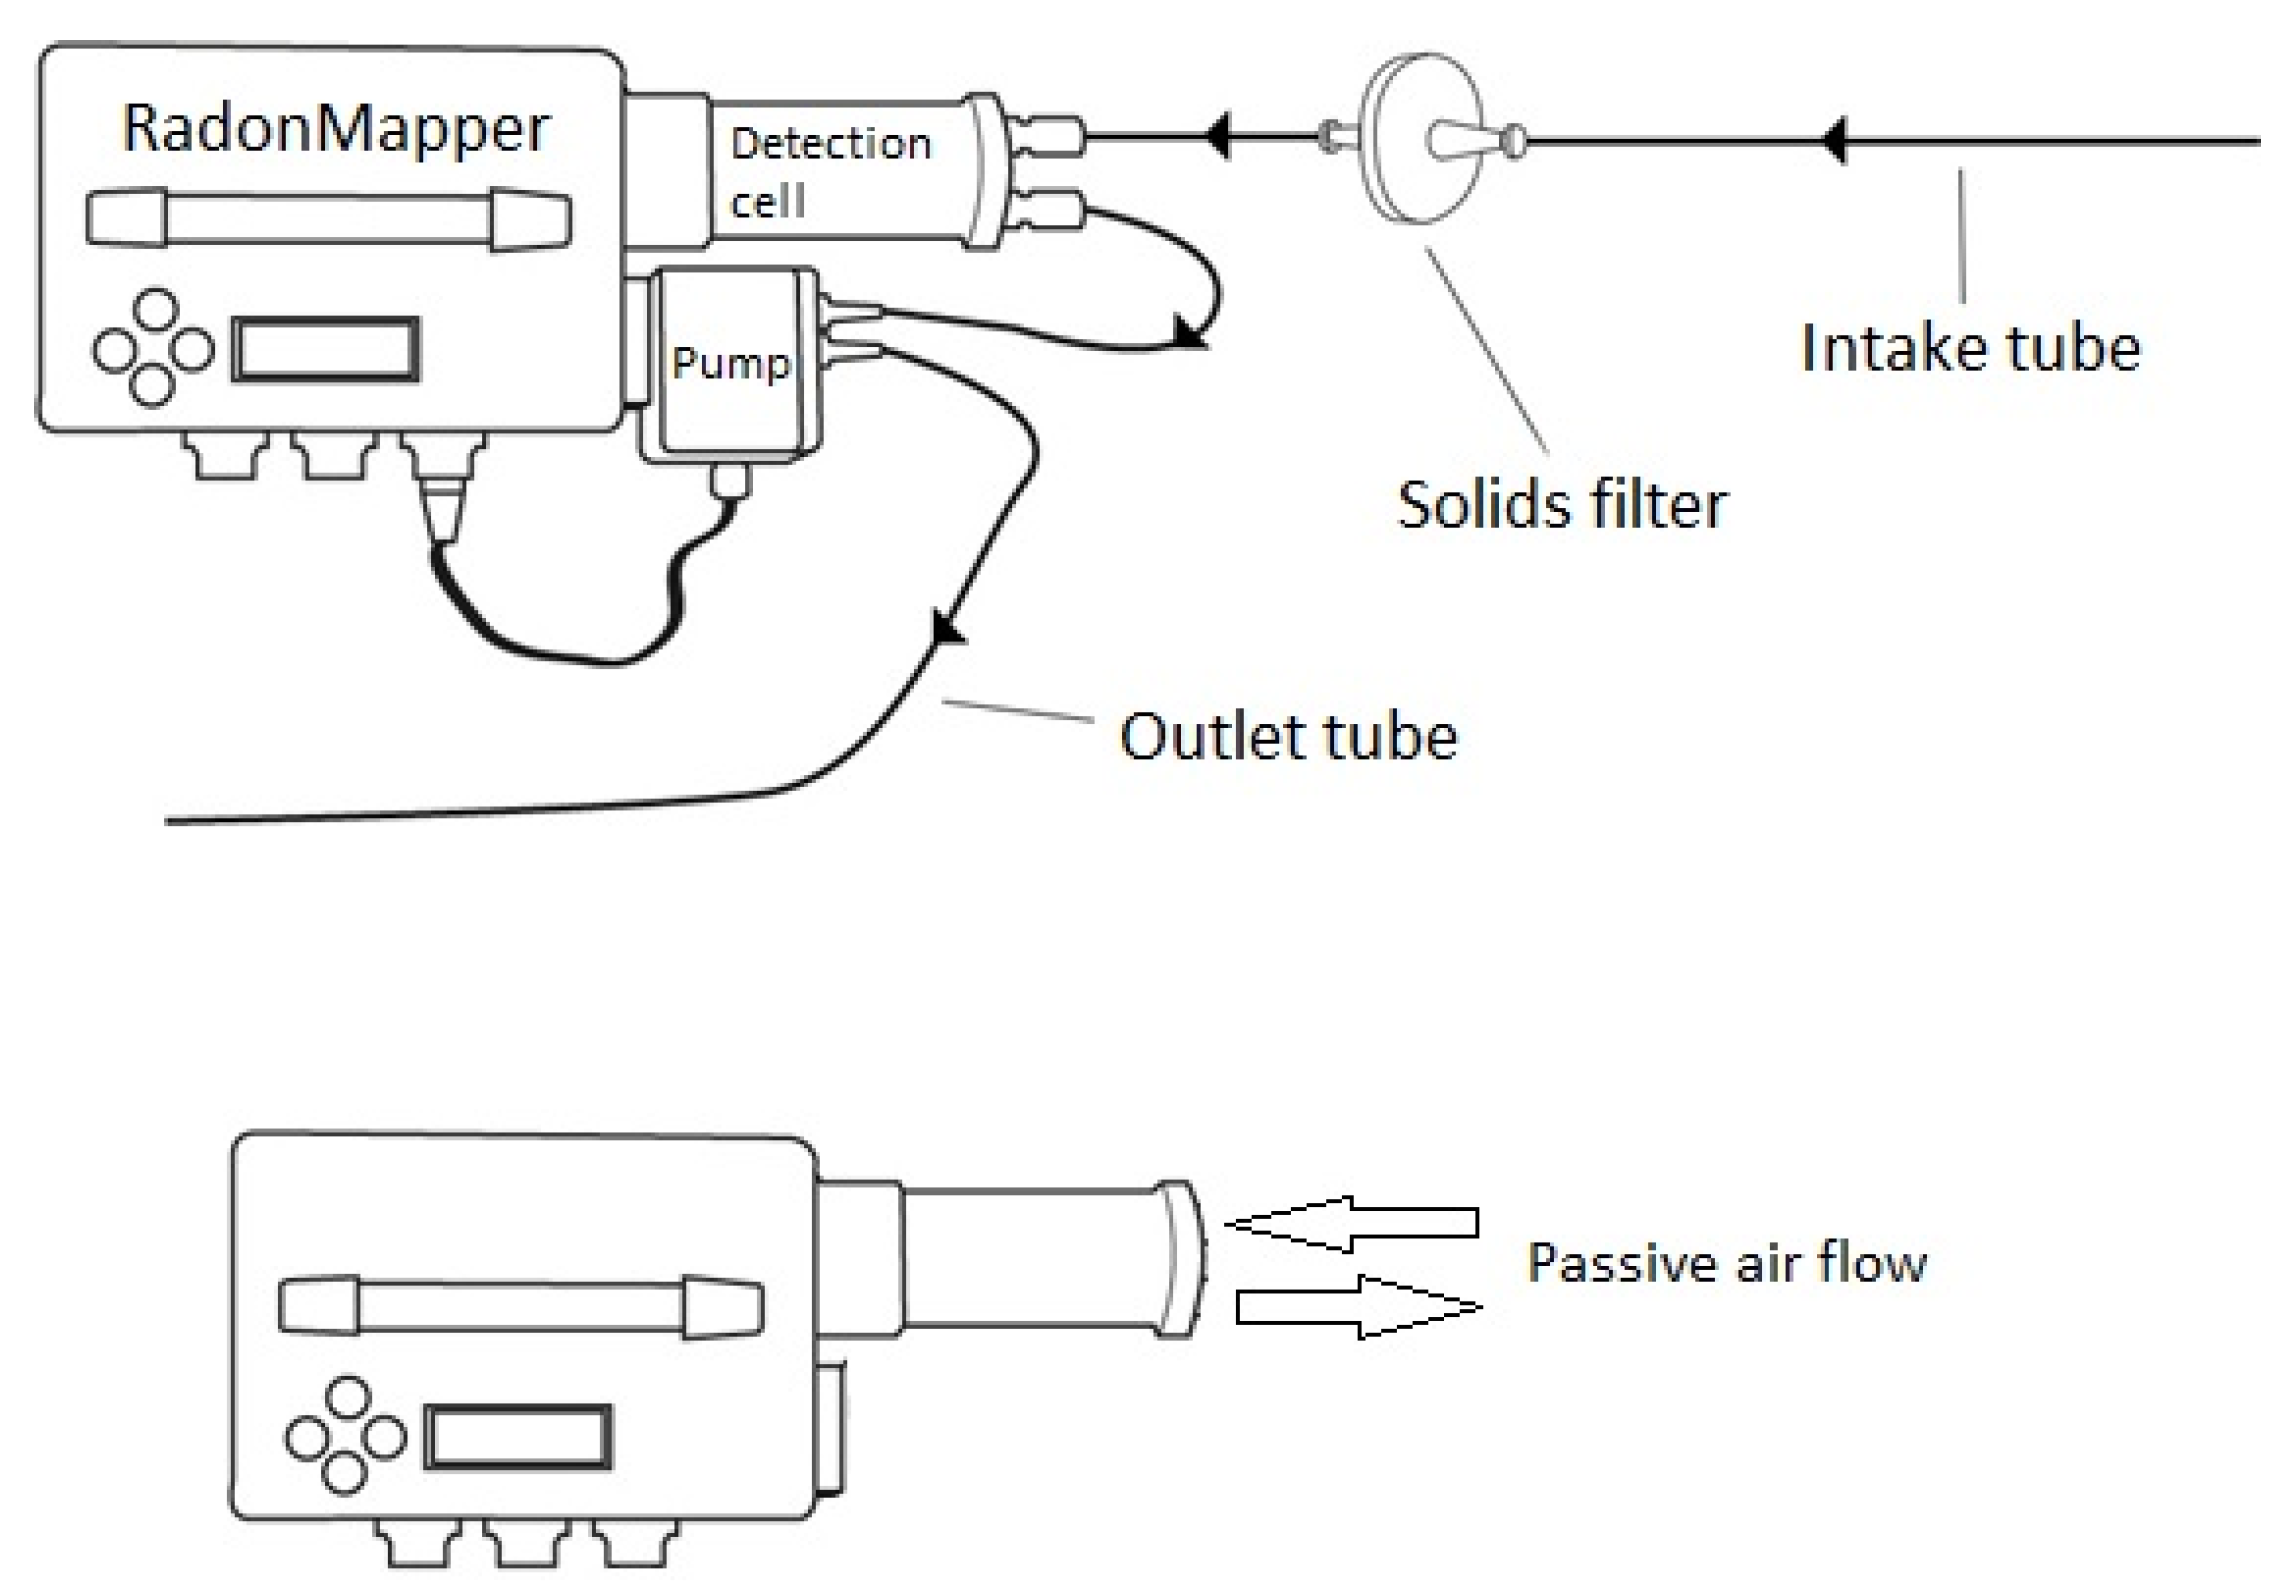
The RadonMapper, manufactured by the company TECNAVIA, Barbengo-Lugano, Switzerland, is an equipment that operates with a scintillation cell and was used to evaluate the radon concentration in the working environment, in crusher dust stockpiles, and in the laboratory tests. The measurements were performed in passive mode, i.e., without pumping air, and in parallel, in active mode, with an air pumper. These measurements were divided into samples of 1 min and was performed for 1 h. Therefore, 60 samples may result in fair, representative value for radon concentration in the mining workplace.
The instrument used in connection with the active measuring circuit was the mass flow meter Red-y Compact, manufactured by the company Vögtlin, Muttenz, Switzerland. In all measurements, it was set to operate at a flowrate of 0.250 L per minute, due to equipment specifications. A comparative scheme between the positioning of the equipment in passive and active mode is shown in Figure 3.
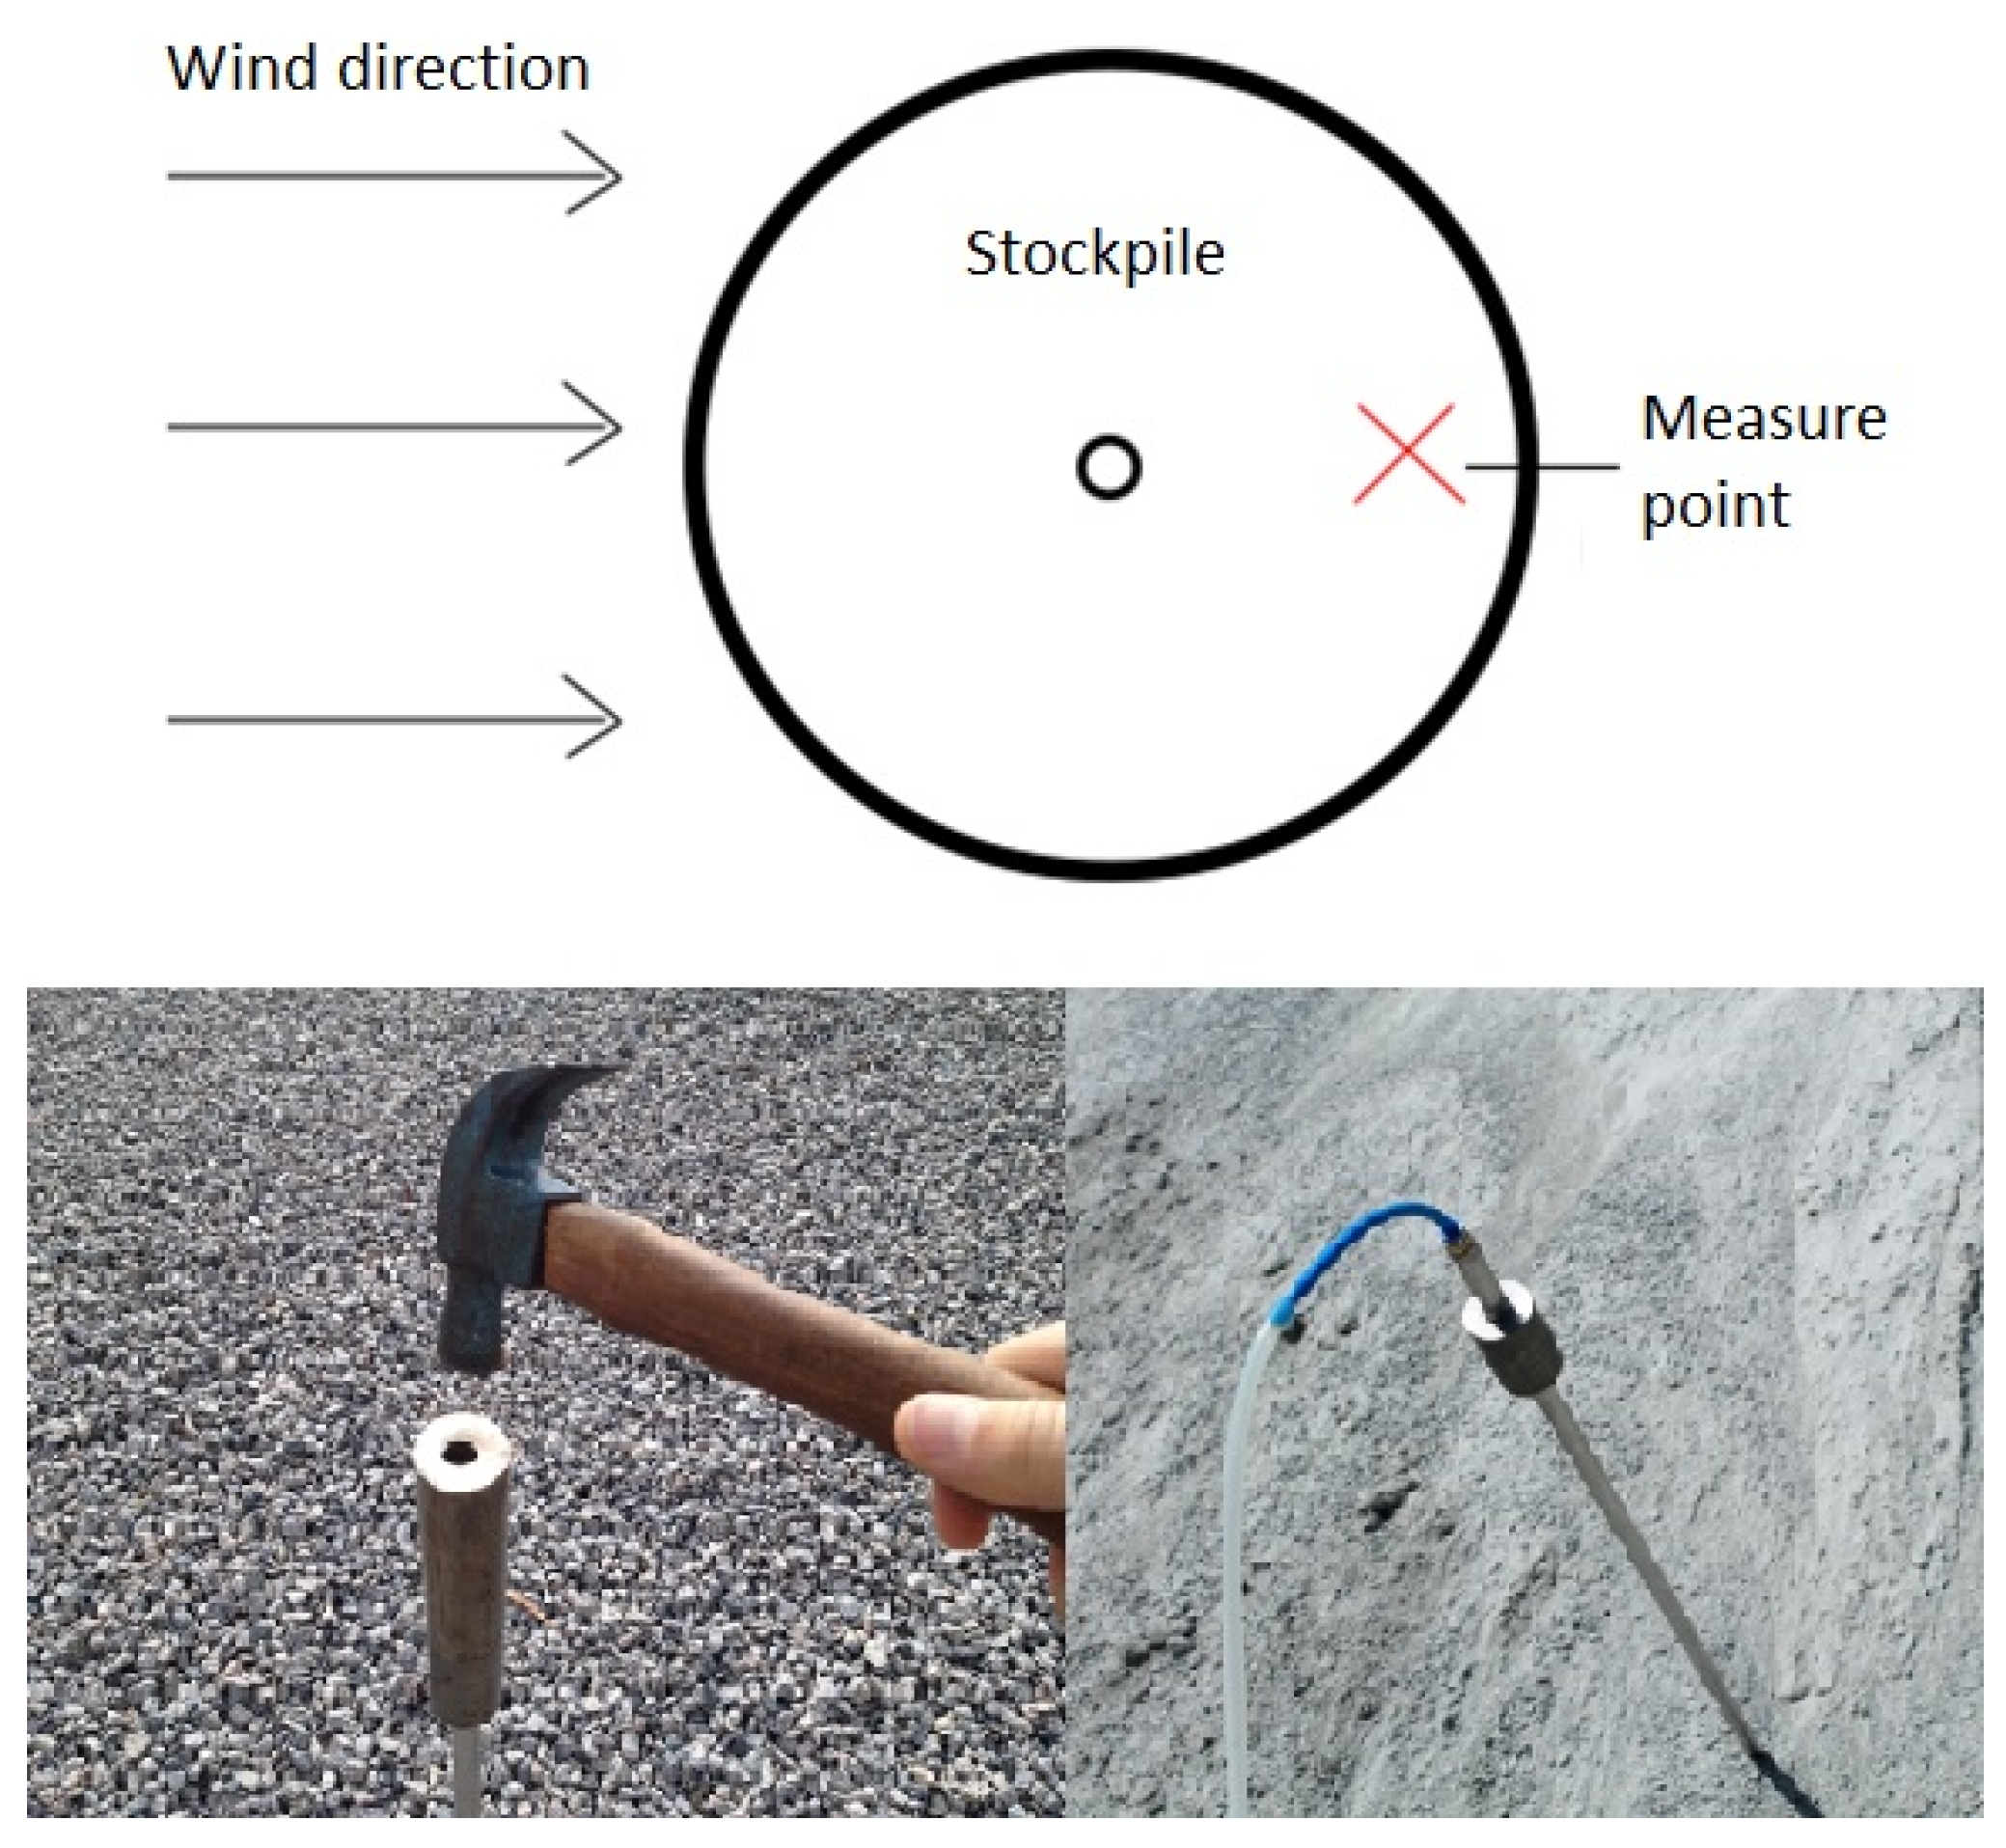
For the evaluation of the radon concentration in stockpiles, a hollow metal rod was used to collect internal air and it was inserted at a depth of 45 cm. The rod was attached to the active circuit at the end of the air inlet tube and was inserted into the stockpile seeking the opposite side to the wind direction for standardization. Figure 4 shows the positioning scheme and example images.
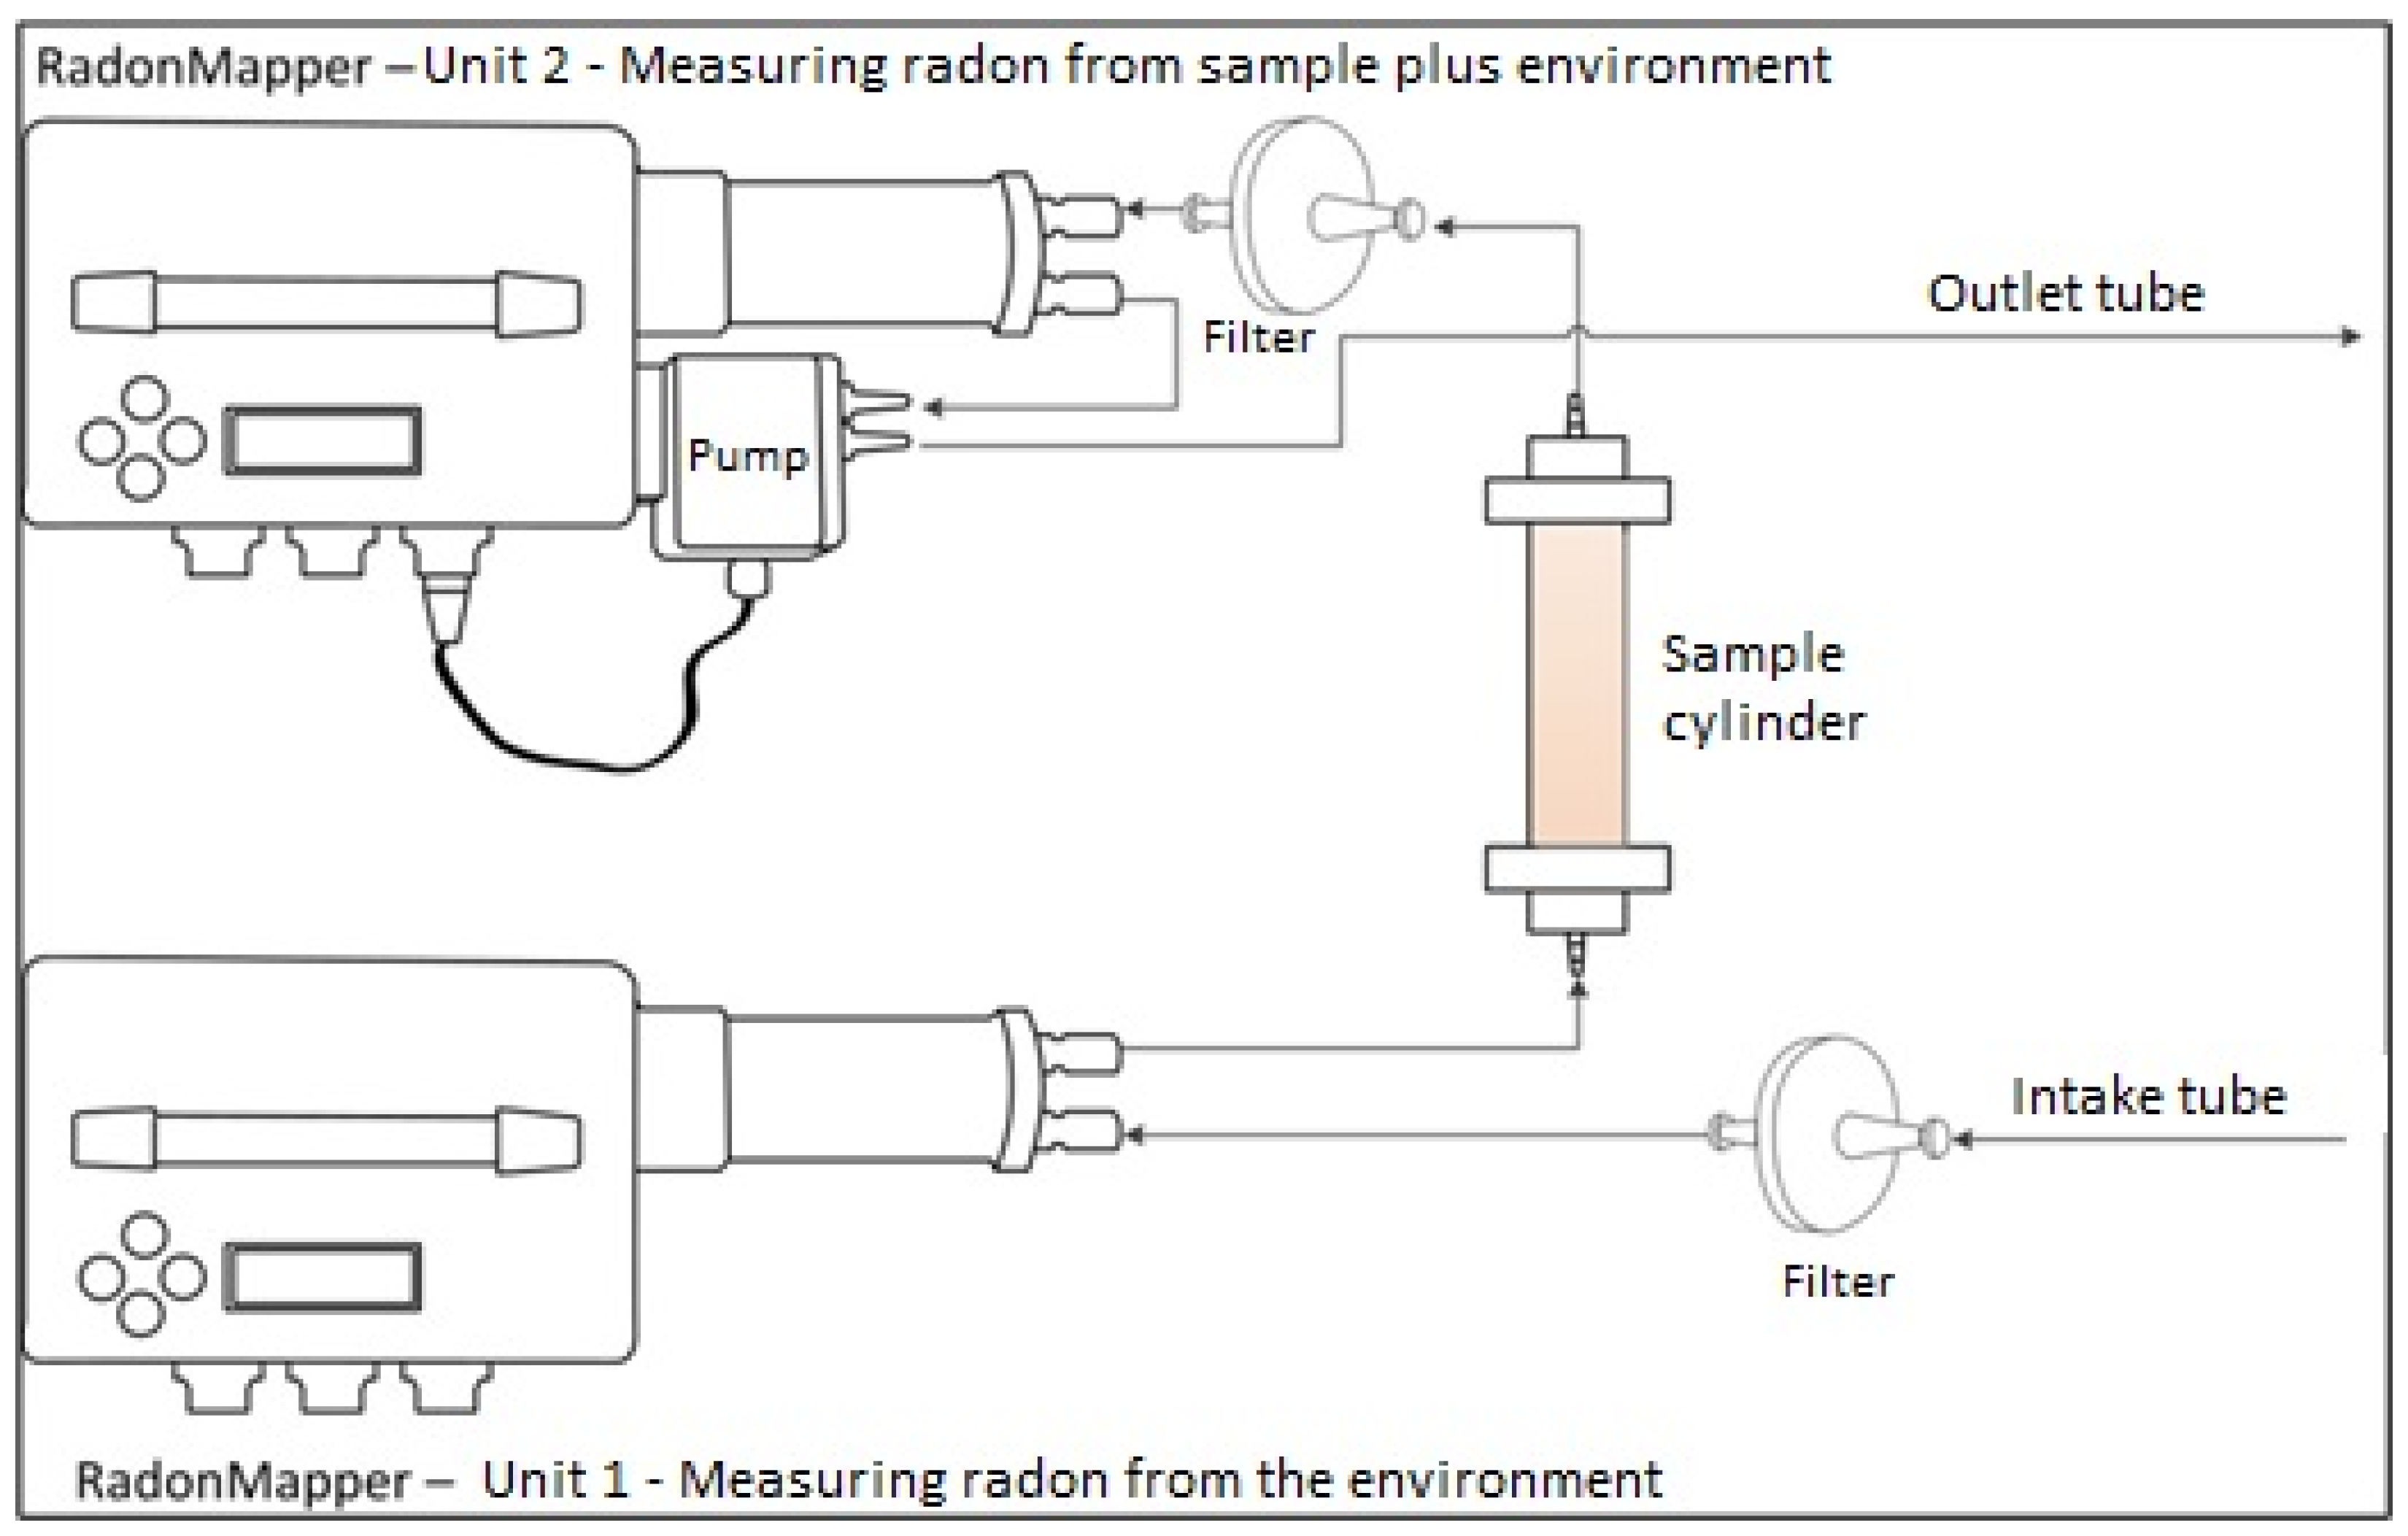
The laboratory measurements were performed in open circuit, using a cylinder to accommodate the samples. Then, the amount of radon in the surrounding air was recorded by other equipment and was subtracted from the results so as not to interfere with the values obtained. The measurement was also performed for 1 h, resulting in 60 samples. Each sample was weighed, and 1 kg of mass was accommodated in a cylinder with a volume of 0.0051 m3. The accumulation time inside the cylinder was 24 h per sample. At each change in material, the cylinder was washed and dried so that there was no interference between samples. Figure 5 presents the scheme of the measurements carried out in the laboratory.
Data collection was carried out in mining companies located in metropolitan areas of the state of São Paulo, as well as the shoreline areas. Five quarries were visited for data collection in this study. In all locations, the extracted material was granite. All measurements were taken in the year 2018, and measured workplaces were below either primary or secondary crusher sets, depending on mineral dust generation.
Although the mining companies were geographically close to each other, differences related to site-specific conditions were not considered, which could lead to sampling deviations in the data collected from environments.
The statistical analysis was performed comparing the descriptive (statistical) parameters. Then, they were grouped by location to verify the possibility of a correlation between data. Subsequently, the Pearson and Spearman coefficients were calculated for group type analysis, to specify the indication of linear (Pearson) or non-linear (Spearman) correlation between the data.
If the results for both field and laboratory measurements are statistically comparable with a certain degree of reliability, then there may be a possibility that in the future, only laboratory measurements will be sufficient to estimate the concentration of radon in the environment, because it is easier to perform these measurements in the laboratory.
3. Results
Table 3 and Table 4 present, by groups, the resulting average for the performed measurements and the confidence interval corresponding to each result, respectively. Radon concentration data were subtracted from the radon present in laboratory air (22 Bq/m3 average). For the workplace measurements in quarries D and E, where only the passive and active equipment were available, respectively, the data were duplicated so that it was possible to perform the correlation analysis.
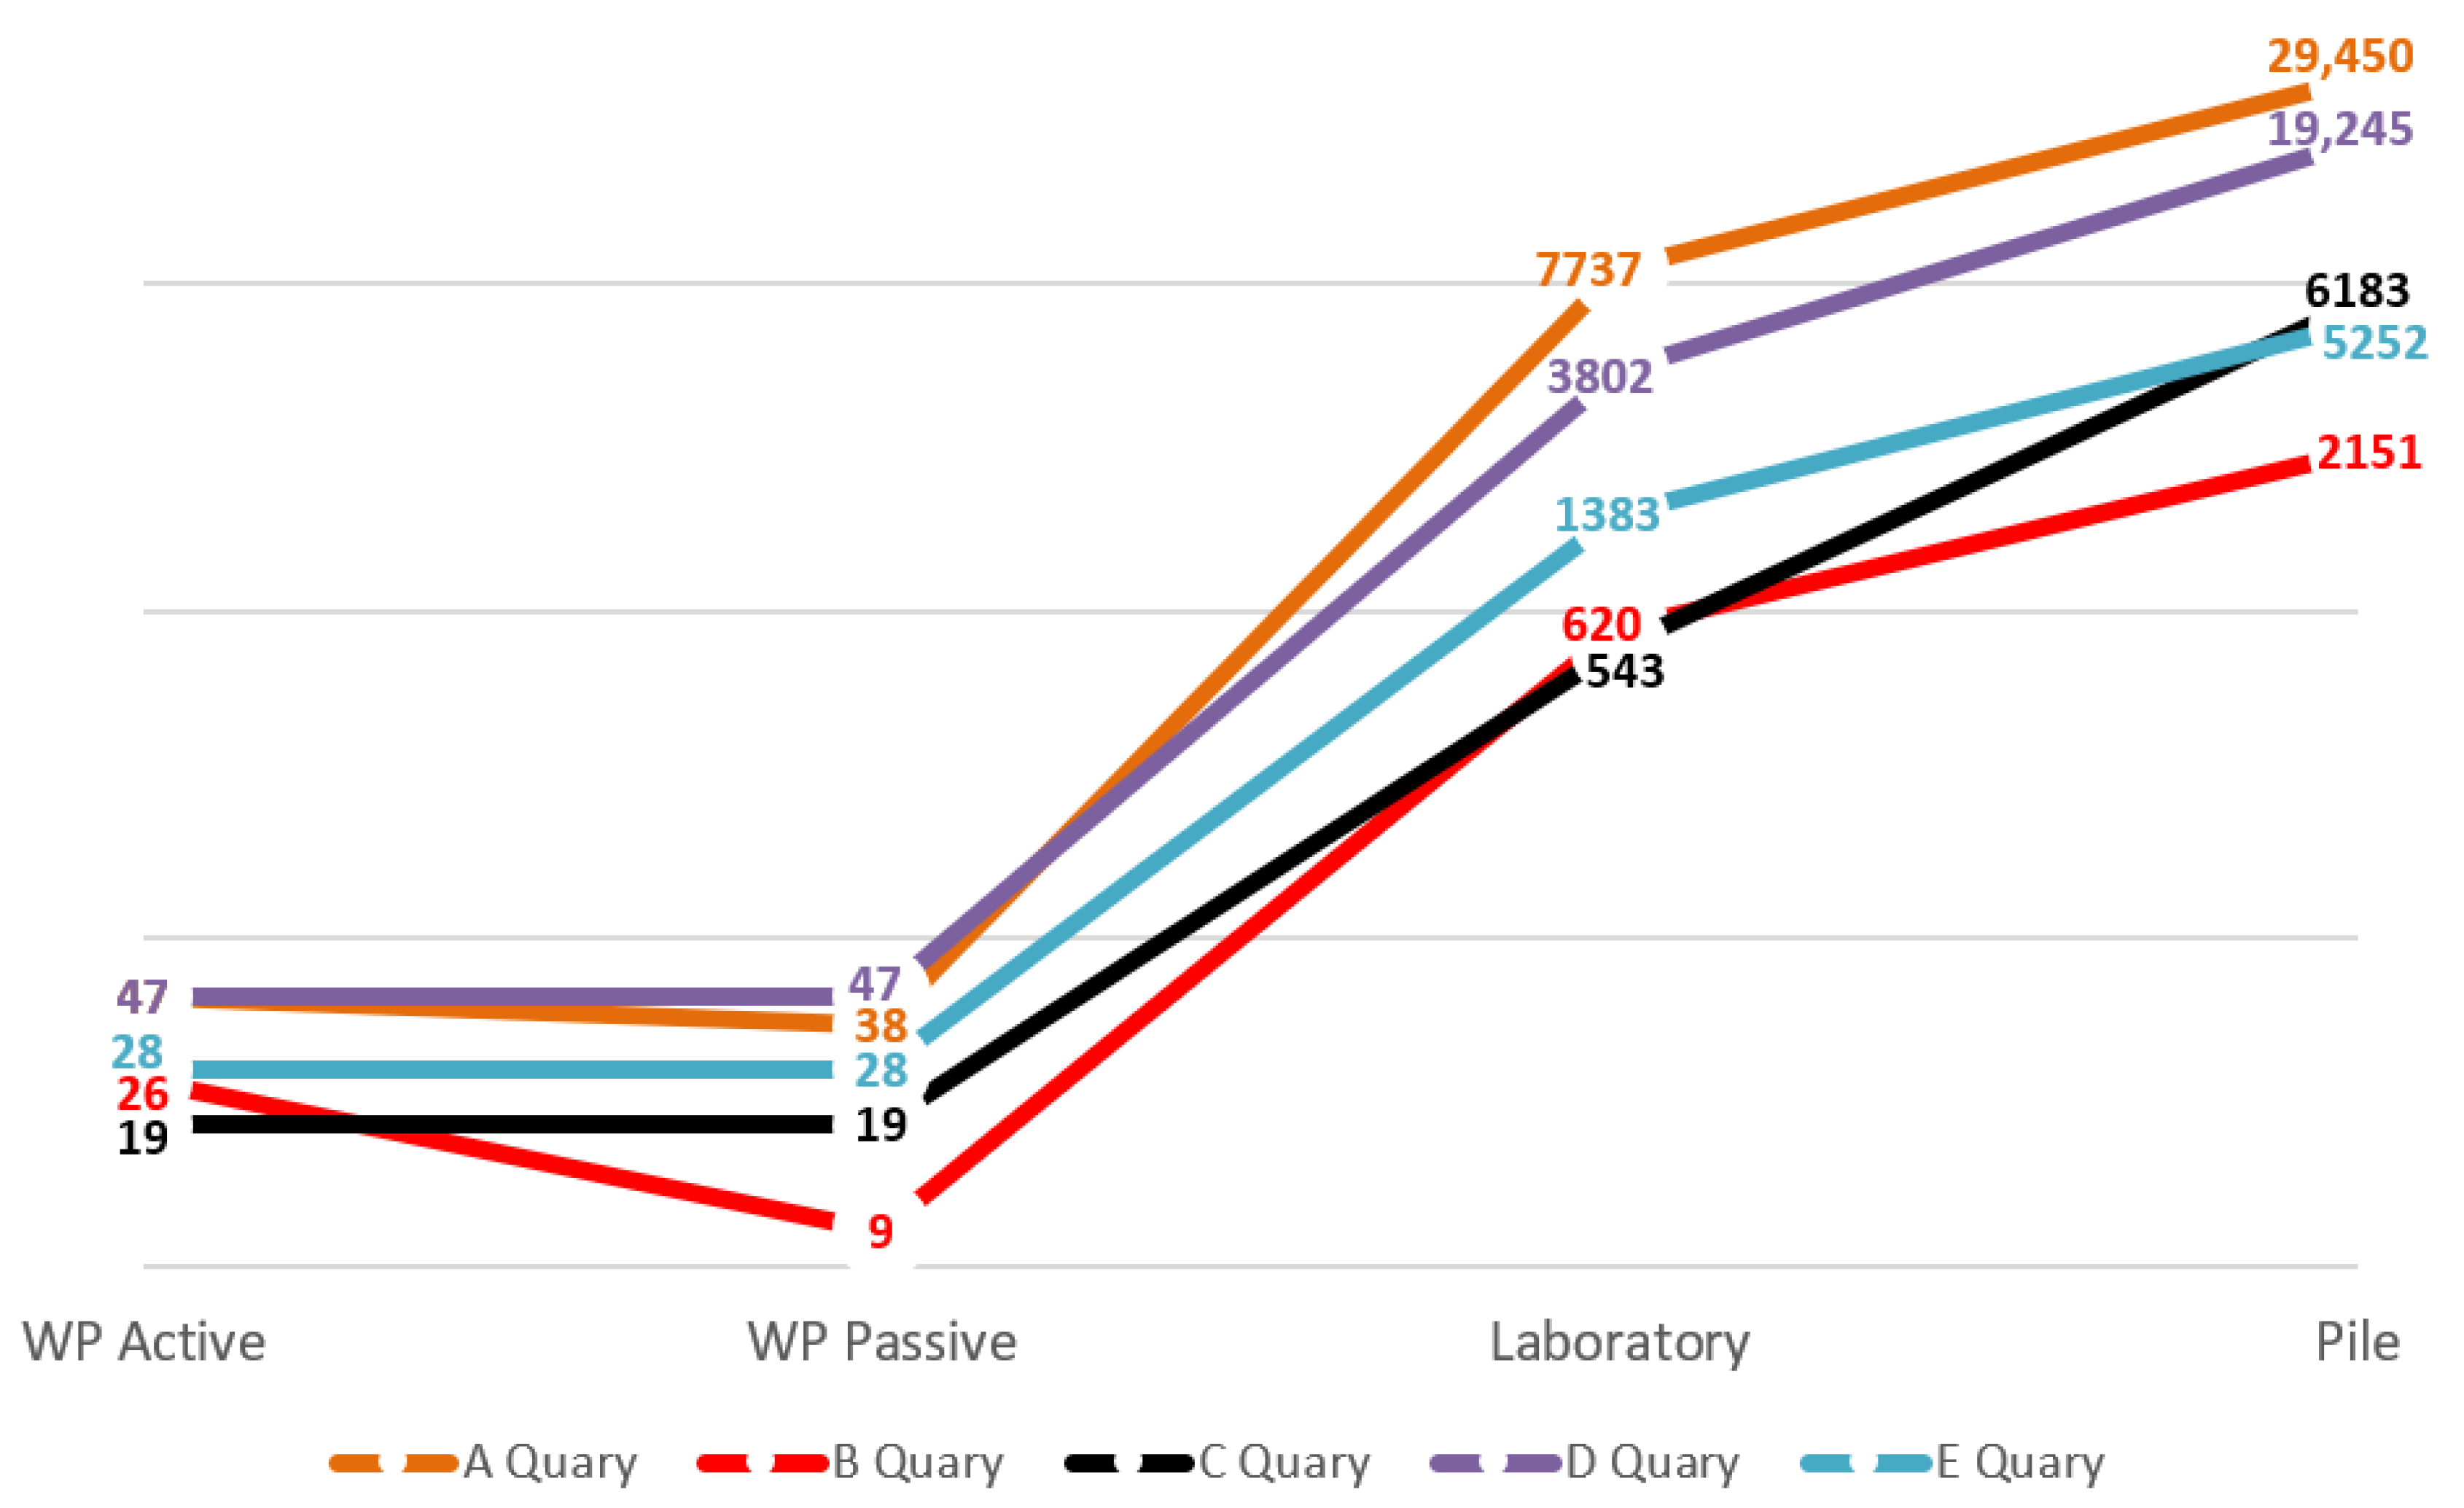
The graphical representation shown in Figure 6 was obtained by taking the log of the data to improve visualization.
Observing the trend lines presented in each quarry, there is an indication that the methodology performed was consistent for each applied location, since the data growth followed the same sequence in all the measurements. While smaller values were found in the workplaces, followed by laboratory test measurement, the larger ones were always in the stockpile concentration data.
To obtain a deeper analysis of the behavior of the data, the values were compared using statistical correlation parameters.
In general, the expected behavior was observed in most of the evaluated data, since the main influencing factor in performing radon concentration measurements is the amount of intrinsic radon gas in each material, represented more directly by the stockpile concentration test.
It can be observed that a higher intrinsic concentration of radon in the evaluated material results in wider distribution of the data. This may contribute to improving the precision of the method, since the statistical differences in the results can be observed more sharply as the gas concentration increases.
Table 5 presents the results of the correlation analysis using the Pearson and Spearman coefficients.
The analysis of the Spearman coefficient, only for the comparison between stockpile and workplace, resulted in moderate correlation (between 0.5 and 0.7). All other results showed a strong correlation (between 0.7 and 0.8) or very strong (between 0.9 and 1).
The linear correlation, represented by the Pearson coefficient, was more evident in the comparisons between the active workplace and the stockpile values, and in the comparison between laboratory and stockpile sampling. Therefore, there is an indication that the correlation between these data is close to a linear correlation.
The correlation between the other data was expressed more clearly by the Spearman coefficient, indicating that the most applicable model presents a non-linear correlation.
As a result of this analysis, it can be observed that the intrinsic amount of radon gas contained in the mined material will directly influence the exposure of the workers in the workplaces. This fact is validated by the correlation results presented.
At first, regarding the questioning about the possibility of exposure to radon gas, all the professionals who followed the measurements answered that they were not aware of it. No previous evaluation had been carried out in any of the quarries visited. Only the total radiation tests intrinsic to the mined material had been performed for quality and acceptability purposes for the final product intended for consumers.
Therefore, in the evaluated environments, there was total ignorance regarding the risk of this agent. This fact may be related to the lack of Brazilian legislation that regulates exposures of workers to radon gas.
Regarding the average values of radon concentration observed in the work environment, considering that there were identified locations where there would be a greater probability of exposure to mineral dust, all values were below the adopted US reference value of 148 Bq/m3. Even considering the German concentration limit, which is more restrictive (100 Bq/m3), the average would not exceed this value.
On average, the results found in this study are close to the values measured by Deiana et al. [23] and by Vimercati et al. [24] in their studies conducted in indoor hospital environments in Italy, for environments that are complying with established international standards. Also, it could be observed that the results obtained here are between 4 and 10 times lower than the values obtained by Vimercati et al. [25] in their study that correlates lung cancer rates by exposure to radon gas in residential environments susceptible to seismic activities, also in Italy.
This is indicative that in outdoor workplaces, radon can be considered a low risk to employees’ health. The average exposure to radon gas, even in cases where exposure to mineral dust is continuous, did not exceed unsafe values considered by international standards during the measurements.
In almost all measurements performed in work environments, there were occasional moments where the reference value was exceeded. Therefore, in enclosed environments, where there is manipulation of mineral material with a high intrinsic concentration of radon gas, as in underground mines, the risk can be considered significant and should not be neglected.
Through the results observed during this study, it was verified that the applied methodology presents a correlation between the data, i.e., either laboratory or stockpile evaluation can be used to estimate the risk of exposure to radon gas in a working environment.
Considering this fact, in a possible assessment of the risk of exposure to radon gas, the measurements with less random variables (laboratory test or stockpile concentration) can be used to define, in preliminary form, the work environment concentration, to guarantee the safety of employees against this agent.
The methodology using the RadonMapper equipment from TECNAVIA, Barbengo-Lugano, Switzerland, proved to be practical and relatively fast and is considerably easier in the laboratory-controlled environment. Furthermore, there is no need for complex analyses carried out by third-party laboratories.
The only costs involved in this method are related to the acquisition of the Radon Mapper equipment and the solid filters used, which can saturate depending on the amount of mineral dust collected during sampling. A single piece of equipment allows the replication of the whole method, although resulting in a longer total time of analysis.
Although an indication of correlation between the laboratory and field data could be identified in the study, the same may not happen in other environments, for example, underground mines, or even in places with significant climatic differences.
4. Conclusions
A scintillation cell detector method was applied to evaluate radon gas exposure in mining activities. Field and laboratory measurements obtained by this study showed an indication of statistical correlation. Thus, there may be a possibility that, in the future, this new evaluation method performed practically only in the laboratory may be widely applied, complementing, or even replacing, field analysis methods. This would be possible if a method of correcting the data could be established, using a rock type coefficient, for example.
Also, the measured exposure concentrations were compared to reference values, and according to the results, there is a low potential risk of exposure to radon gas in these environments.
Since there is a lack of knowledge about this hazard and there may be workers exposed to radon gas without knowledge, these point to the fact that it is urgent to develop specific legislation concerning the evaluation of radon in Brazil. Also, mining environments can vary in material (rock/ore) composition and depth, and as the years go by, radon concentration and exposure may become an issue. Having a reliable, relatively quick, and practical methodology can help avoid this, since in this way it may be possible to considerably increase the number of evaluations carried out.
Moreover, public policies concerning the analysis and control of the risk of exposure to radon gas can be effectively applied, since a valid evaluation methodology might be available.
It is recommended for future studies that the methodology could be replicated in other environments, such as in underground mines. Contributing to the creation of a database and subsequent increase in the sampling may allow the improvement in the correlation indices presented by this method as well as allow the comparison between this methodology with other ones.
Author Contributions
Conceptualization, methodology, investigation, and writing—original draft preparation, D.D.F.; resources, W.S.I.; data curation and writing—review and editing, A.L.M.A.d.S.; supervision, G.d.T. All authors have read and agreed to the published version of the manuscript.
Funding
This research received no external funding.
Data Availability Statement
No new data were created or analyzed in this study. Data sharing is not applicable to this article.
Acknowledgments
All equipment and supplies used in the study were provided by the Laboratory of Environmental Control, Hygiene and Safety in Mining of the Polytechnic School of the University of São Paulo.
Conflicts of Interest
The authors declare no conflict of interest.
References
- Perevoshchikov, R.; Perminova, A.; Menshikova, E. Natural Radionuclides in Soils of Natural-Technogenic Landscapes in the Impact Zone of Potassium Salt Mining. Minerals 2022, 12, 1352. [Google Scholar] [CrossRef]
- Fianco, A.C.B. Concentrações de Radônio Nas Águas Subterrâneas, Rochas e Solos de Porto Alegre, RS, Universidade Federal do Rio Grande do Sul: Porto Alegre. 2011. Available online: https://lume.ufrgs.br/bitstream/handle/10183/32667/000786610.pdf?sequence=1&isAllowed=y (accessed on 21 May 2022).
- Fonseca, L.M. Avaliação da Radioatividade Natural em Tintas de Uso Comercial No Brasil; Comissão Nacional de Energia Nuclear: São Paulo, Brazil, 2016. [Google Scholar]
- Zeeb, H. International Radon Project: Survey on Radon Guidelines. Programs Act. 2007, 1–49. [Google Scholar]
- Emad, B.M.; Sayyed, M.I.; Somaily, H.H.; Hanfi, M.Y. Natural Radioactivity and Radiological Hazard Effects from Granite Rocks in the Gabal Qash Amir Area, South Eastern Desert, Egypt. Minerals 2022, 12, 884. [Google Scholar] [CrossRef]
- L’Annunziata, M.F. Handbook of Radioactivity Analysis, 2nd ed.; Academic Press: Cambridge, MA, USA, 2013; ISBN 978-0-12-436039. [Google Scholar]
- Goronovski, A.; Joyce, P.J.; Björklund, A.; Finnveden, G.; Tkaczyk, A.H. Impact Assessment of Enhanced Exposure from Naturally Occurring Radioactive Materials (NORM) within LCA. J. Clean. Prod. 2018, 172, 2824–2839. [Google Scholar] [CrossRef] [Green Version]
- Cardoso, E.M. A Energia Nuclear, 3rd ed.; CNEN: Rio de Janeiro, Brasil, 2012. [Google Scholar]
- Gavioli, Y.S. Emissão de Radônio Em Rochas Ornamentais. In Proceedings of the XVII Jornada de Iniciação Científica-CETEM 2009, Rio de Janeiro, Brasil, 30–31 July 2009; pp. 95–101. [Google Scholar]
- Ayres da Silva, A.L.M.; de Eston, S.M.; Iramina, W.S.; Diegues Francisca, D. Radon in Brazilian Underground Mines. J. Radiol. Prot. 2018, 38, 607–620. [Google Scholar] [CrossRef] [PubMed]
- Hajj, T.M. El Gás Radônio: O Perigo Invisível. Rev. Assoc. Fish 2016, 1, 27–31. [Google Scholar]
- UNSCEAR. Source and Effects of Lonizing Radiation, Report to the General Assembly, United Nations; United Nations Scientific Committee on the Effects of Atomic Radiation: New York, NY, USA, 2000. [Google Scholar]
- Santos, C.E.L. Determinação Dos Processos de Enriquecimento e Das Concentrações de Radônio Em Minas Subterrâneas de Fluorita e Carvão Do Estado de Santa Catarina: Critérios Para Avaliação Dos Riscos Radiológicos, Universidade Federal do Rio Grande do Sul: Porto Alegre. 2008. Available online: https://lume.ufrgs.br/bitstream/handle/10183/13537/000633905.pdf?sequence=1&isAllowed=y (accessed on 21 May 2022).
- Brasil Comissão Nacional de Energia Nuclear. Diretrizes Básicas de Proteção Radiológica; Norma CNEN-NN-3.01L: Rio de Janeiro, Brazil, 2014; pp. 1–22. [Google Scholar]
- Bekteshi, S.; Kabashi, S.; Ahmetaj, S.; Xhafa, B.; Hodolli, G.; Kadiri, S.; Alijaj, F.; Abdullahu, B. Radon Concentrations and Exposure Levels in the Trepça Underground Mine: A Comparative Study. J. Clean. Prod. 2017, 155, 198–203. [Google Scholar] [CrossRef]
- Francisca, D.D. Utilização Do Radonmapper Na Avaliação de Exposição Ao Gás Radônio Em Ambientes de Mineração. Master’s Thesis, Universidade de São Paulo, São Paulo, Brasil, 2014. [Google Scholar]
- Ayres da Silva, A.L.M. Medidas de Controle de Radônio Em Minas Subterrâneas Brasileiras. Ph.D. Thesis, Universidade de São Paulo, São Paulo, Brasil, 2016. [Google Scholar]
- Veiga, L.H.S.; Melo, V.; Koifman, S.; Amaral, E.C.S. High Radon Exposure in a Brazilian Underground Coal Mine. J. Radiol. Prot. 2004, 24, 295–305. [Google Scholar] [CrossRef] [PubMed]
- Anjos, R.M.; Umisedo, N.; da Silva, A.A.R.; Estellita, L.; Rizzotto, M.; Yoshimura, E.M.; Velasco, H.; Santos, A.M.A. Occupational Exposure to Radon and Natural Gamma Radiation in the La Carolina, a Former Gold Mine in San Luis Province, Argentina. J. Environ. Radioact. 2010, 101, 153–158. [Google Scholar] [CrossRef] [PubMed]
- Woodward, A.; Roder, D.; McMichael, A.J.; Crouch, P.; Mylvaganam, A. Radon Daughter Exposures at the Radium Hill Uranium Mine and Lung Cancer Rates among Former Workers, 1952–1987. Cancer Causes Control 1991, 2, 213–220. [Google Scholar] [CrossRef] [PubMed]
- Lubin, J.H.; Boice, J.D.; Edling, C.; Hornung, R.W.; Howe, G.R.; Kunz, E.; Kusiak, R.A.; Morrison, H.I.; Radford, E.P.; Samet, J.M.; et al. Lung Cancer in Radon-Exposed Miners and Estimation of Risk From Indoor Exposure. J. Natl. Cancer Inst. 1995, 87, 817–827. [Google Scholar] [CrossRef] [PubMed]
- Ishimori, Y.; Lange, K.; Martin, P.; Mayya, Y.S.; Phaneuf, M. Measurements and Calculation of Radon Releases from NORM Residues. Technol. Rep. Ser. 2013, 103, 85. [Google Scholar]
- Deiana, G.; Dettori, M.; Masia, M.D.; Spano, A.L.; Piana, A.; Arghittu, A.; Castiglia, P.; Azara, A. Monitoring Radon Levels in Hospital Environments. Findings of a Preliminary Study in the University Hospital of Sassari, Italy. Environments 2021, 8, 28. [Google Scholar] [CrossRef]
- Vimercati, L.; Fucilli, F.; Cavone, D.; De Maria, L.; Birtolo, F.; Ferri, G.; Soleo, L.; Lovreglio, P. Radon Levels in Indoor Environments of the University Hospital in Bari-Apulia Region Southern Italy. Int. J. Environ. Res. Public Health 2018, 15, 694. [Google Scholar] [CrossRef] [PubMed] [Green Version]
- Vimercati, L.; Cavone, D.; Delfino, M.C.; De Maria, L.; Caputi, A.; Sponselli, S.; Corrado, V.; Bruno, V.; Spalluto, G.; Eranio, G.; et al. Relationships among Indoor Radon, Earthquake Magnitude Data and Lung Cancer Risks in a Residential Building of an Apulian Town (Southern Italy). Atmosphere 2021, 12, 1342. [Google Scholar] [CrossRef]
Figure 1.
Relation between granulometry and radon concentration in a quarry. Source: Adapted from Francisca [16].
Figure 1.
Relation between granulometry and radon concentration in a quarry. Source: Adapted from Francisca [16].

Figure 2.
Summary of the methodology. Source: Personal data.

Figure 3.
Measuring schemes; above: active, below: passive. Source: Personal data.

Figure 4.
Rod position in the stockpile. Source: Personal data.

Figure 5.
Laboratory measurement scheme. Source: Personal data.

Figure 6.
Mean of measurements in Bq/m3, graphical representation. Source: Personal data.


Table 1.
Physical and chemical properties of radon.
| Property | Data |
|---|---|
| State of matter | Gas |
| Fusion point | 202 K |
| Boiling point | 2113.3 K |
| Fusion enthalpy | 3.247 kJ/mol |
| Vaporization enthalpy | 18.10 kJ/mol |
| Vapor pressure | 1 Pa a 110 K |
| Specific heat | 84 J/(kg.K) |
| Thermal conductivity | 0.00364 W/(m.K) |
| First ionization energy | 1037 kJ/mol |
Source: Personal data.
Table 2.
Mean concentration of Rn-222 and estimated annual effective dose.
| Property | Data | Average Concentration (Bq/m3) | Average Annual Effective Dose (mSv/a) |
|---|---|---|---|
| A | Fluorite | 2194.0 | 15.8 |
| B | Fluorite | 3090.0 | 22.25 |
| C | Fluorite | 2047.0 | 14.74 |
| D | Coal | 101.0 | 0.73 |
| E | Coal | 99.0 | 0.71 |
| F | Coal | 21.0 | 0.15 |
| G | Coal | 2800.0 | 10.7 |
| H | Agalmatolite | 679.0 | 21.0 |
| I | Emerald | 122.0 | 1.00 |
| J | Coal | 985.0 | 5.00 |
| L | Scheelite | 779.0 | 4.00 |
| M | Tourmaline | 4153.0 | 21.00 |
| N | Fluorite | 316.0 | 3.00 |
Source: Adapted from Ayres da Silva [17].
Table 3.
Compilation of the means of analysis.
| Quarry | Workplace Active | Workplace Passive | Laboratory Tests | Stockpile Concentration |
|---|---|---|---|---|
| A | 47 Bq/m3 | 38 Bq/m3 | 7737 Bq/m3 | 29,450 Bq/m3 |
| B | 26 Bq/m3 | 9 Bq/m3 | 620 Bq/m3 | 2151 Bq/m3 |
| C | 19 Bq/m3 | 19 Bq/m3 | 543 Bq/m3 | 6183 Bq/m3 |
| D | 47 Bq/m3 | 47 Bq/m3 | 3802 Bq/m3 | 19,245 Bq/m3 |
| E | 28 Bq/m3 | 28 Bq/m3 | 1383 Bq/m3 | 5252 Bq/m3 |
Source: Personal data.
Table 4.
Confidence interval of the means obtained—values presented in Bq/m3.
| Quarry | Workplace Active | Workplace Passive | Laboratory Tests | Stockpile Concentration |
|---|---|---|---|---|
| A | 40.67–53.33 | 32.71–43.29 | 7639.4–7834.6 | 29,273.52–29,626.48 |
| B | 20.58–31.42 | 5.9–12.1 | 600.51–639.49 | 2102.72–2199.28 |
| C | 14.09–23.91 | 11.25–26.75 | 522.34–563.66 | 6096.89–6269.11 |
| D | 40.29–53.71 | 40.29–53.71 | 3744.42–3859.58 | 19,105.83–19,384.17 |
| E | 22.32–33.68 | 22.32–33.68 | 1348.92–1417.08 | 5199.71–5304.29 |
Source: Personal data.
Table 5.
Pearson and Spearman correlation analysis.
| Active Workplace | Passive Workplace | Laboratory Tests | Stockpile Concentration | ||
|---|---|---|---|---|---|
| Pearson | Active Workplace | 1 | 0.860 | 0.874 | 0.892 |
| Spearman | 1 | 0.872 | 0.975 | 0.667 | |
| Pearson | Passive Workplace | 0.860 | 1 | 0.710 | 0.795 |
| Spearman | 0.872 | 1 | 0.800 | 0.800 | |
| Pearson | Laboratory tests | 0.874 | 0.710 | 1 | 0.977 |
| Spearman | 0.975 | 0.800 | 1 | 0.700 | |
| Pearson | Stockpile Concentration | 0.892 | 0.795 | 0.977 | 1 |
| Spearman | 0.667 | 0.800 | 0.700 | 1 |
Source: Personal data.
Disclaimer/Publisher’s Note: The statements, opinions and data contained in all publications are solely those of the individual author(s) and contributor(s) and not of MDPI and/or the editor(s). MDPI and/or the editor(s) disclaim responsibility for any injury to people or property resulting from any ideas, methods, instructions or products referred to in the content. |
© 2023 by the authors. Licensee MDPI, Basel, Switzerland. This article is an open access article distributed under the terms and conditions of the Creative Commons Attribution (CC BY) license (https://creativecommons.org/licenses/by/4.0/).
Share and Cite
MDPI and ACS Style
Francisca, D.D.; Iramina, W.S.; Ayres da Silva, A.L.M.; de Tomi, G. New Evaluation Method of Exposure to Radon Gas in Mining Environments. Minerals 2023, 13, 897. https://0-doi-org.brum.beds.ac.uk/10.3390/min13070897
AMA Style
Francisca DD, Iramina WS, Ayres da Silva ALM, de Tomi G. New Evaluation Method of Exposure to Radon Gas in Mining Environments. Minerals. 2023; 13(7):897. https://0-doi-org.brum.beds.ac.uk/10.3390/min13070897
Chicago/Turabian StyleFrancisca, Diego Diegues, Wilson Siguemasa Iramina, Anna Luiza Marques Ayres da Silva, and Giorgio de Tomi. 2023. "New Evaluation Method of Exposure to Radon Gas in Mining Environments" Minerals 13, no. 7: 897. https://0-doi-org.brum.beds.ac.uk/10.3390/min13070897
Note that from the first issue of 2016, this journal uses article numbers instead of page numbers. See further details here.