Article

Chemical Characteristics and Distribution Prediction of Hydrocarbon Source Rocks in the Continental Lacustrine Basin of the Chang 7 Member in the Heshui Area of the Ordos Basin, China

1
School of Earth Science and Engineering, Xi’an Shiyou University, Xi’an 710065, China
2
Shaanxi Key Laboratory of Petroleum Accumulation Geology, Xi’an Shiyou University, Xi’an 710065, China
3
No. 12 Oil Production Plant, PetroChina Changqing Oilfield Company, Qingyang 745400, China
4
No. 11 Oil Production Plant, PetroChina Changqing Oilfield Company, Qingyang 745002, China
*
Author to whom correspondence should be addressed.
Submission received: 17 January 2024 / Revised: 3 March 2024 / Accepted: 6 March 2024 / Published: 13 March 2024
(This article belongs to the Section Mineral Geochemistry and Geochronology)

Abstract

:
The Heshui area within the Ordos Basin holds significant strategic importance for the extraction and development of tight oil resources in the Changqing Oilfield. This study extensively explored the geochemical features and distribution tendencies of source rocks in the Chang 7 member, utilizing core samples and logging data for a comprehensive analysis. A more advanced model was utilized to predict the dispersion of Total Organic Carbon (TOC) in the Chang 7 member source rock. The properties and hydrocarbon generation potential of source rocks were thoroughly assessed through a comprehensive analysis that involved evaluating their total organic carbon content, pyrolysis parameters, and reflectance (Ro) values. The research concluded that the source rocks boast substantial organic matter, predominantly categorized as type II-I organic material. The thermal maturation levels span from low maturity to maturity, signifying significant potential for oil generation. Generally, the source rock quality falls within the range of good to excellent. Sedimentary patterns notably influence the distribution of hydrocarbon-source rocks. The northeastern sector of the study area is situated in an area characterized by deep to semi-deep lake sedimentation, making it the primary location for the presence of Chang 7 member hydrocarbon source rocks. With a thickness ranging from 40 to 70 m, this zone becomes a pivotal focus for the potential exploration of tight oil resources in the future. The results of this study offer crucial insights for understanding the geochemical characteristics of hydrocarbon source rocks, evaluating their potential for hydrocarbon generation, and forecasting favorable zones for oil and gas exploration in similar regions.

1. Introduction

The Chang 7 member of the Triassic Yanchang Formation in the Ordos Basin represents a pivotal stage in lake basin development, characterized by a sedimentary environment ranging from semi-deep to deep lake facies [1,2]. This geological setting has given rise to a diverse array of high-quality organic source rocks within the mudstone and shale formations of the Chang 7 member, distinguished by significant thickness, a high total organic carbon content, and exceptional potential for hydrocarbon generation [3,4]. Consequently, these rocks serve as the primary source rock series for the Triassic Yanchang Formation within the Mesozoic Basin, sparking considerable interest in recent years for Triassic shale oil exploration in the Ordos Basin [5].
While prior research has yielded valuable insights into the geochemical characteristics, oil-source correlations, and hydrocarbon generation patterns of these source rocks, further studies are imperative to predict their distribution and enrichment behaviors. Traditional geochemical experiments have played a crucial role in assessing critical parameters of hydrocarbon source rocks [6,7,8,9], yet their efficacy can be hindered by the sporadic availability of samples. In contrast, logging data emerges as a highly preferred tool for evaluating source rocks due to its exceptional continuity and vertical resolution [10,11,12]. High-quality hydrocarbon source rocks exhibit distinctive attributes within logging data, including increased neutron counts, pronounced acoustic time differences, elevated resistivity, enhanced natural gamma radiation, and reduced density [13,14,15].
Consequently, this study undertakes a comprehensive investigation of the source rocks within the Chang 7 member in the study area, entailing a detailed analysis of geochemical characteristics. Additionally, an enhanced model for predicting organic carbon content (TOC) is introduced. The primary objective is to anticipate the distribution characteristics of these source rocks and conduct source rock assessments, thereby contributing valuable insights to the broader understanding of oil and gas exploration in the region.
Simultaneously, oil type classification emerges as a crucial method for categorizing oil and gas resources based on the organic matter type and maturity of source rocks, along with the properties of the generated hydrocarbon products. Originating from the pioneering work of French geologists Tissot and Welte in 1978 [16], this classification system divides source rocks into four types (Type I to Type IV) based on the Hydrogen Index (HI) and the Oxygen Index (OI) parameters of the kerogen [16]. Each type reflects distinct characteristics, including the abundance of algae, bacteria, planktonic organisms, and terrestrial plants, influencing the predominant production of oil or natural gas.
While oil type classification offers simplicity and ease of use, providing an intuitive reflection of source rock organic matter type, maturity, as well as the composition and abundance of oil and gas, it has limitations. These include not accounting for processes like oil and gas migration, accumulation, and alteration, as well as the heterogeneity and complexity of source rocks. Therefore, oil type classification serves as a valuable reference in oil and gas exploration, complementing other geological analysis methods to provide a holistic understanding of petroleum systems.

2. Geology Setting

The Ordos Basin, situated on the North China Plate, is a significant cratonic basin in China renowned for its extensive sedimentary history, ranking as the second-largest in the country [1,2]. Significant geological transformations occurred during the Middle and Late Triassic periods, particularly within the Yanchang Formation, and the Ordos Basin evolved into a noteworthy inland cratonic depression lake basin [17,18]. This transformation led to the deposition of a series of sedimentary formations that primarily consist of continental clastic rocks.
The Yanchang Formation is stratigraphically divided into ten units, ranging from Chang 10 at the lowest to Chang 1 at the highest, primarily based on their lithological characteristics and the sequence of sedimentary cycles, as illustrated in Figure 1b [2]. Within this stratigraphic framework, the Chang 7 member sedimentary phase assumes particular significance, representing substantial Mesozoic basin lake sediment deposition primarily concentrated in the vast semi-deep and deep lake region, predominantly situated in the southwestern part of the basin, which was characterized by a flourishing presence of lake algae and planktonic organisms, coinciding with frequent thermal fluid activities [2]. These geological processes significantly contributed to the abundance of source material for forming organic shale. Consequently, within the basin, a substantial series of source rocks, enriched with organic matter and spanning a thickness exceeding 100 m, took shape.
Heshui is positioned in the southwestern part of the Yishan Slope, a geological feature within the Ordos Basin, as illustrated in Figure 1a. This area is an essential component of the Qingcheng Oilfield, which has experienced a large influx of materials from the southwest and developed gravity flow sedimentation. In our designated study region, the Chang 7 member can be delineated into three specific subsections, ordered from the bottom to the summit: namely, Chang 73, Chang 72, and Chang 71, as outlined in Figure 1b [2]. Within these subsections, Chang 73 is identified by shale and dark mudstone, interspersed with sporadic layers of argillaceous siltstone.
Conversely, the Chang 72 and Chang 71 subsections predominantly comprise gravity-flow sand bodies in shades of black and grayish-black, interspersed with thin layers of dark mudstone. These sections vertically coexist with hydrocarbon source rocks, representing the primary focus for shale oil exploration and development. The average thickness of sand bodies within the Chang 7 member is 31.2 m. These reservoirs are located, on average, at a depth of 2050 m, showcasing an oil saturation typically averaging 68.5%.

3. Materials and Methods

The sampling location for the Chang 7 member core sample is indicated by the yellow well symbol in Figure 1a. The study encompasses five comprehensive experimental tests and analyses, including organic carbon, pyrolysis analysis, vitrinite reflectance, mineral composition, and organic matter macerals analysis.
Total Organic Carbon (TOC) measurement is performed using a CS744 carbon and sulfur analyzer in compliance with the specifications detailed in the Chinese standard GB/T19145-2022 [19], titled “Determination of Total Organic Carbon in Sedimentary Rocks.” The prescribed method, executed by the CS744 analyzer, involves essential steps including sample preparation, phosphoric acid treatment, removal of inorganic carbon, and subsequent measurement of TOC concentration. Adherence to these standardized procedures ensures precision within ±0.5% of the specified standards. The Rock Eval 6 method is an analytical technique used to evaluate the organic richness, type, and maturity of source rocks. In this method, a small sample (approximately 100 mg) is placed in a pyrolysis furnace and heated to a pre-set temperature. Through flushing with an inert gas, such as helium, the volatile hydrocarbon gases released from the sample at high temperatures are separated from the sample residue.
Subsequently, the contents of free hydrocarbons (S1), pyrolyzed hydrocarbons (S2), CO2 (S3), and residual organic carbon (S4) in the sample are quantitatively analyzed using a Flame Ionization Detector (FID) and a Thermal Conductivity Detector (TCD).
During the pyrolysis process, the sample boat is placed at the top of a hollow piston. The piston automatically moves between the pyrolysis and oxidation stages to ensure the sample undergoes pyrolysis at atmospheric pressure. The temperature ramp rate for the S2 stage is 25 °C/minute. The amount of CO2 in the S3 stage is measured using the Thermal Conductivity Detector (TCD), which continuously detects the CO2 released during the pyrolysis of kerogen in the temperature range of 300 °C to 390 °C. The content of residual organic carbon in the S4 stage is determined by transferring the pyrolyzed rock sample to an oxidation furnace, introducing air, and maintaining a constant temperature of 600 °C for 5 min. This step combusts the residual carbon in the rock sample into CO2, which is then detected using the TCD.
The reflectance of vitrinite denotes the percentage of incident light reflected off the polished surface of a coal sample when examined under a reflective light microscope. This property is instrumental in assessing both the degree of metamorphism and the chemical composition of coal. Additionally, it aids in distinguishing the microscopic components of vitrinite. The reflectivity of vitrinite varies across different subgroups; generally, structural vitrinite exhibits the lowest reflectivity, followed by clastic vitrinite, with gel vitrinite displaying the highest. Consequently, by measuring the reflectance of coal samples, it becomes possible to differentiate between the various microscopic components of vitrinite. Vitrinite reflectance (Ro) was determined with a CRAIC 508PV microspectrophotometer. The analysis procedure conformed to the Chinese standard SY/T 5124-2012 [20], which provides guidelines for measuring vitrinite reflectance in sedimentary rocks. In general, around 50–70 grains or areas of vitrinite-like macerals in each polished sample disk were measured to obtain a mean value as the reported vitrinite reflectance. The typical relative standard deviation is within ±0.06%.
The mineral composition of hydrocarbon source rocks was analyzed through X-ray diffraction, following the guidelines specified in the Chinese standard SY/T 5163-2018 [21]. This standard explicitly outlines X-ray diffraction methods for mineral identification. Microstructure and composition observations were conducted via thin section identification using a Leica Microsystems DM4500p microscope (Leica Microsystems, Solms, Germany).
Analysis of Organic Matter Macerals: Microcomponent identification was undertaken using a biological microscope DIALUX-22EB (Ernst Leitz GmbH, Wetzlar, Germany) and a UMSP-50 microphotometer (Oberkochen, Baden-Württemberg, Germany).
All five experimental tests and analyses were conducted at the Shaanxi Provincial Key Laboratory of Oil and Gas, affiliated with Xi’an Shiyou University.

4. Results

4.1. Key Characteristics and Corresponding Logging Indicators of Hydrocarbon Source Rocks

Lithological Varieties and Mineralogical Features of Hydrocarbon Source Rocks

Considering the pertinent analyses, the source rocks within the study area can predominantly be divided into oil shale and black mudstone, as illustrated in Figure 2 and Figure 3. The oil shale, often called the “Zhangjiatan Shale,” is predominantly distributed within the Chang 73 Formation. In drilling cores, the oil shale manifests as blocks ranging from black to brownish-black, showcasing either horizontal bedding (Figure 2) or thin layer dispersion.
Conversely, black mudstone is present in various subsections of the Chang 7 member, exhibiting shades of grayish-black or black. In cases of substantial layer thickness, it adopts the appearance of uniform blocks, with specific layers demonstrating horizontal bedding (Figure 3). These black mudstones predominantly form in deep and semi-deep lake environments.
These two categories of hydrocarbon source rocks share common lithological traits, such as darker hues, fine particle dimensions, the absence of sand particles, and relatively homogeneous rock structures. Moreover, they exhibit richness in organic matter, carbon particles, and carbonized fragments of plants and plant stems. These features indicate prevailing humid climatic conditions during sedimentary periods and primarily denote deposition within weakly reducing or reducing lacustrine environments.
Shale and dark mudstone share some similarities in mineral composition, including constituents such as quartz, feldspar, and clay minerals. However, their proportional quantities exhibit slight differences (Figure 4a). Specifically, shale is characterized by an average composition comprising approximately 43.4% quartz and feldspar, with an average clay mineral content of about 34.2%, as illustrated in Figure 4a. The primary components of the clay mineral content are illite, chlorite, and illite/montmorillonite mixed layers, with illite being the most abundant at an average of 20.5%, as shown in Figure 4b. In contrast, dark mudstone features an average quartz and feldspar content of approximately 43.5% (Figure 4a). The average clay mineral content is about 49.1%, primarily consisting of illite, chlorite, and illite/montmorillonite mixed layers (Figure 4b). Compared to shale, the presence of pyrite in dark mudstone is relatively reduced, averaging approximately 6.4%.

4.2. Chemical Properties of Hydrocarbon Source Rocks

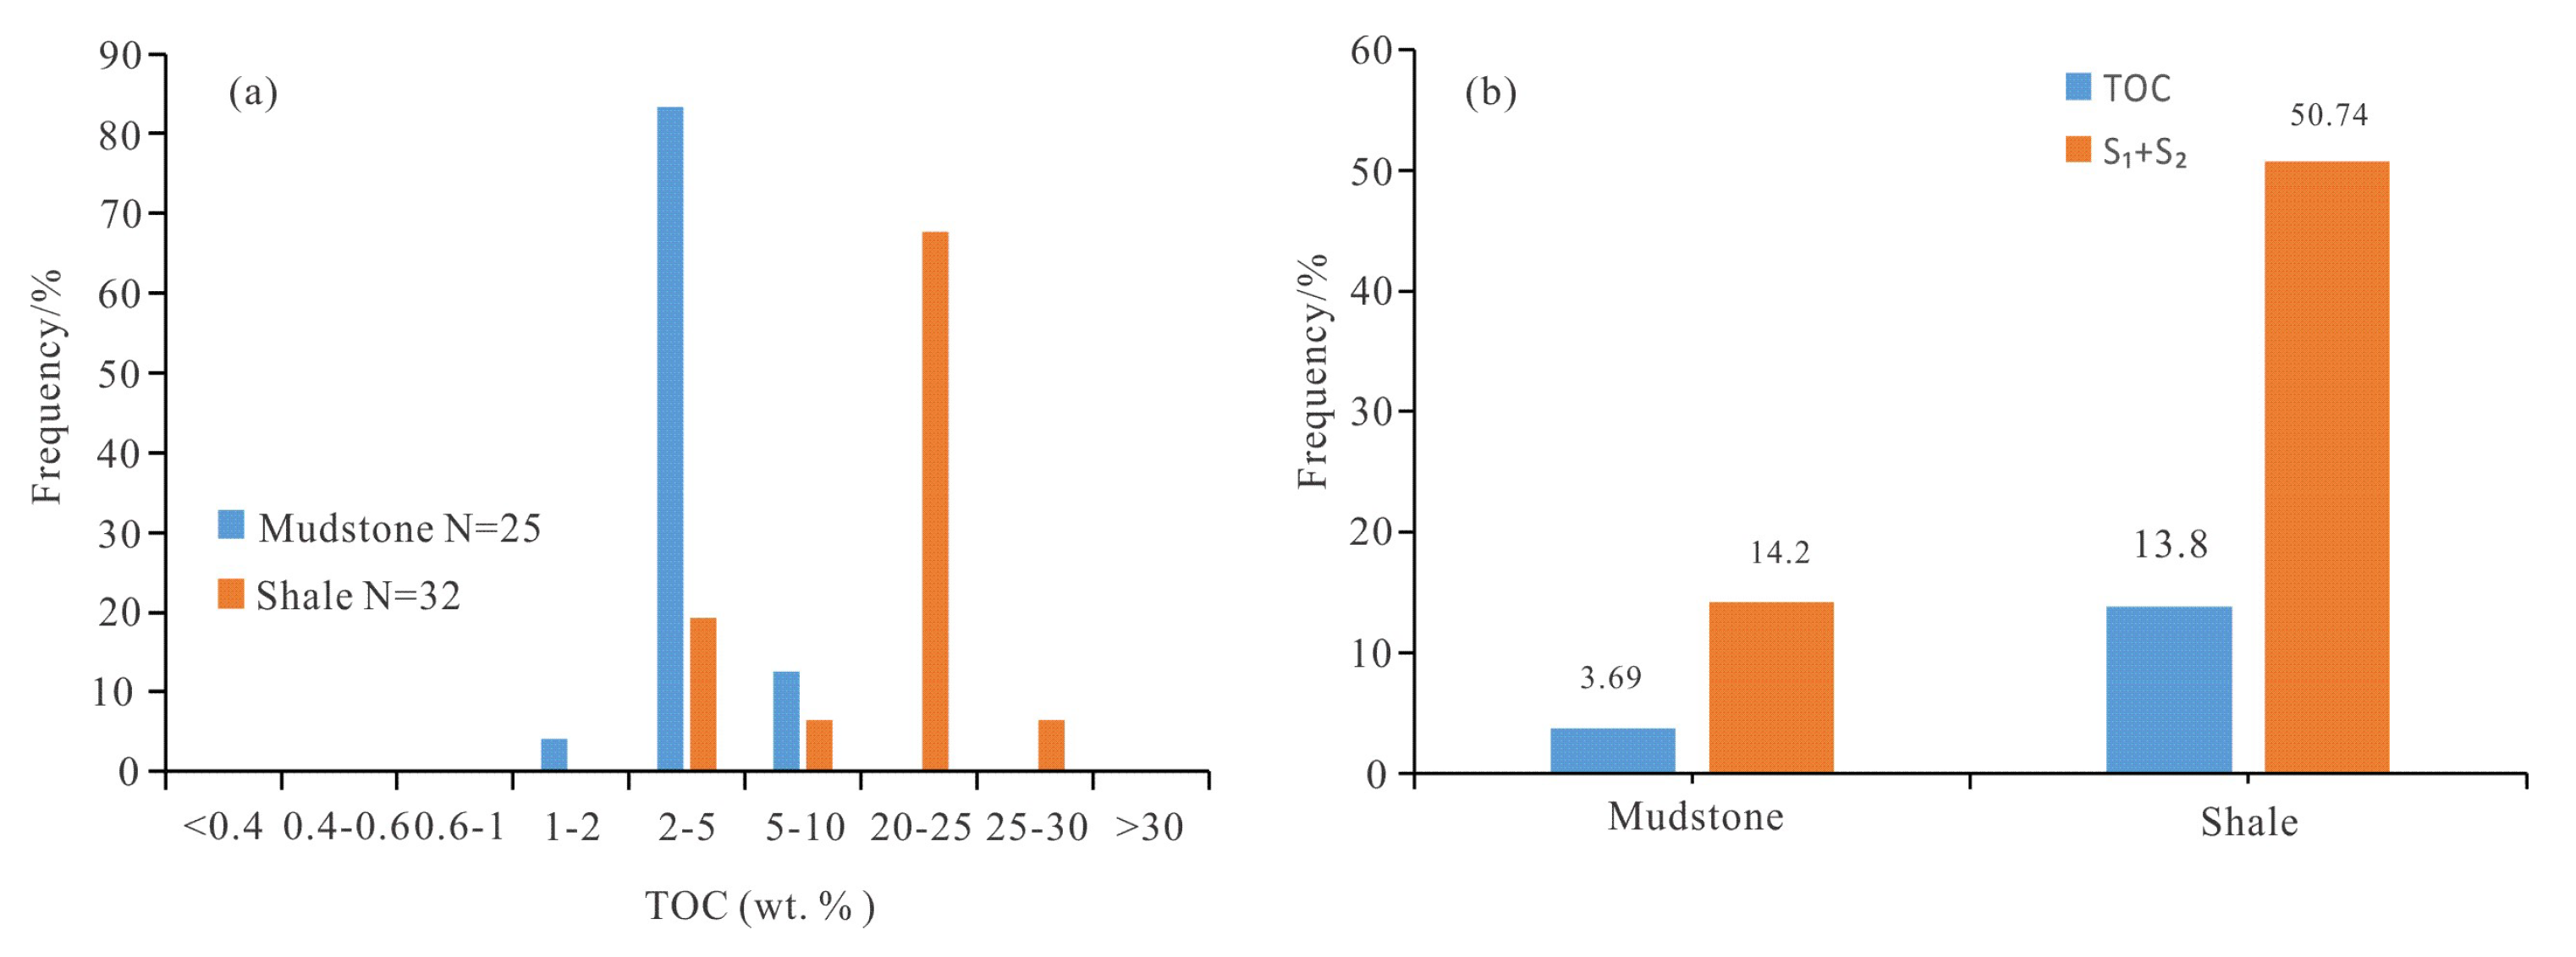
4.2.1. Abundance of Organic Matter in Source Rocks

Evaluating the abundance of organic matter is crucial for quantifying the presence of organic materials and forecasting the potential for hydrocarbon formation within source rocks [22,23]. The parameters employed to assess organic matter abundance encompass TOC, chloroform-extractable asphaltene “A”, Total Hydrocarbons (comprising saturated hydrocarbons and aromatics in chloroform “A”), and the potential for hydrocarbon generation (S1 + S2). In particular, chloroform asphaltene “A” and the total hydrocarbon content reveal the presence of residual hydrocarbons within the source rocks. Elevated values in these indicators can paradoxically suggest a lower capacity for hydrocarbon expulsion. As a result, practical applications often prioritize TOC and S1 + S2 as the primary assessment parameters, with the remaining indicators serving as supplementary reference points (Table 1) [24].
The findings indicate a significant elevation in TOC within the shale of the Chang 7 member in the Heshui area, generally falling between 20 wt.% and 25 wt.%, with an average of 13.8 wt.% (Figure 5a). Furthermore, all analyzed samples exhibit a TOC content exceeding 2 wt.%. The combined hydrocarbon generation potential (S1 + S2) averages 50.74 (mg HC/g rock), suggesting a substantial availability of material for hydrocarbon generation (Figure 5b). In the case of mudstone, the organic carbon content is primarily distributed within the 2 wt.% to 5 wt.% range, with an average of 3.69 wt.% (Figure 5a). The average hydrocarbon generation potential is 14.2 mg HC/g rock (Figure 5b). According to the comprehensive assessment based on Peters’ hydrocarbon source rock criteria [21], the organic matter in shale is classified as “Very good” to “Excellent” source rock, while the organic content in mudstone is categorized as “Good” to “Very good.”

4.2.2. Types of Organic Matter in Source Rocks

The abundance of organic matter reflects the quantity within the source rock and does not inherently establish its capacity for hydrocarbon generation [25]. The hydrocarbon generation potential of source rocks varies significantly among different sources and regions. Therefore, it is equally essential to investigate the types of hydrocarbon source rocks. Various methods are available to determine the type of organic matter. Traditional methods, including kerogen microscopy analysis, determination of H/C-O/C ratio, elemental analysis, and extraction of soluble organic matter, continue to be extensively employed for the examination and evaluation of organic matter properties in source rocks.

Identification of Organic Matter Types through Kerogen Macerals

In this study, the utilization of the International Committee for Coal and Organic Petrology (ICCP) classification system was widely acknowledged for categorizing microscopic components (ICCP, 1969, 1975, 1998, 2001) [26,27,28,29,30,31]. Additionally, Sýkorová et al. (2005) classified the microscopic components of kerogen into three main categories: liptinite, inertinite, and huminite/vitrinite [32,33,34].
The research findings regarding the composition and distribution of microscopic components (Table 2) suggest a relatively high presence of humic and lipid rock components in the microscopic makeup of source rocks. The analysis reveals that a substantial portion of the identified organic matter, up to one-third, is comprised of humic substances, indicating that the lacustrine organic matter in this study originates from a blend of higher plants. Furthermore, Kerogen Type Index (KTI) calculations point to the classification of the organic matter’s kerogen in the study area as Class I–II.

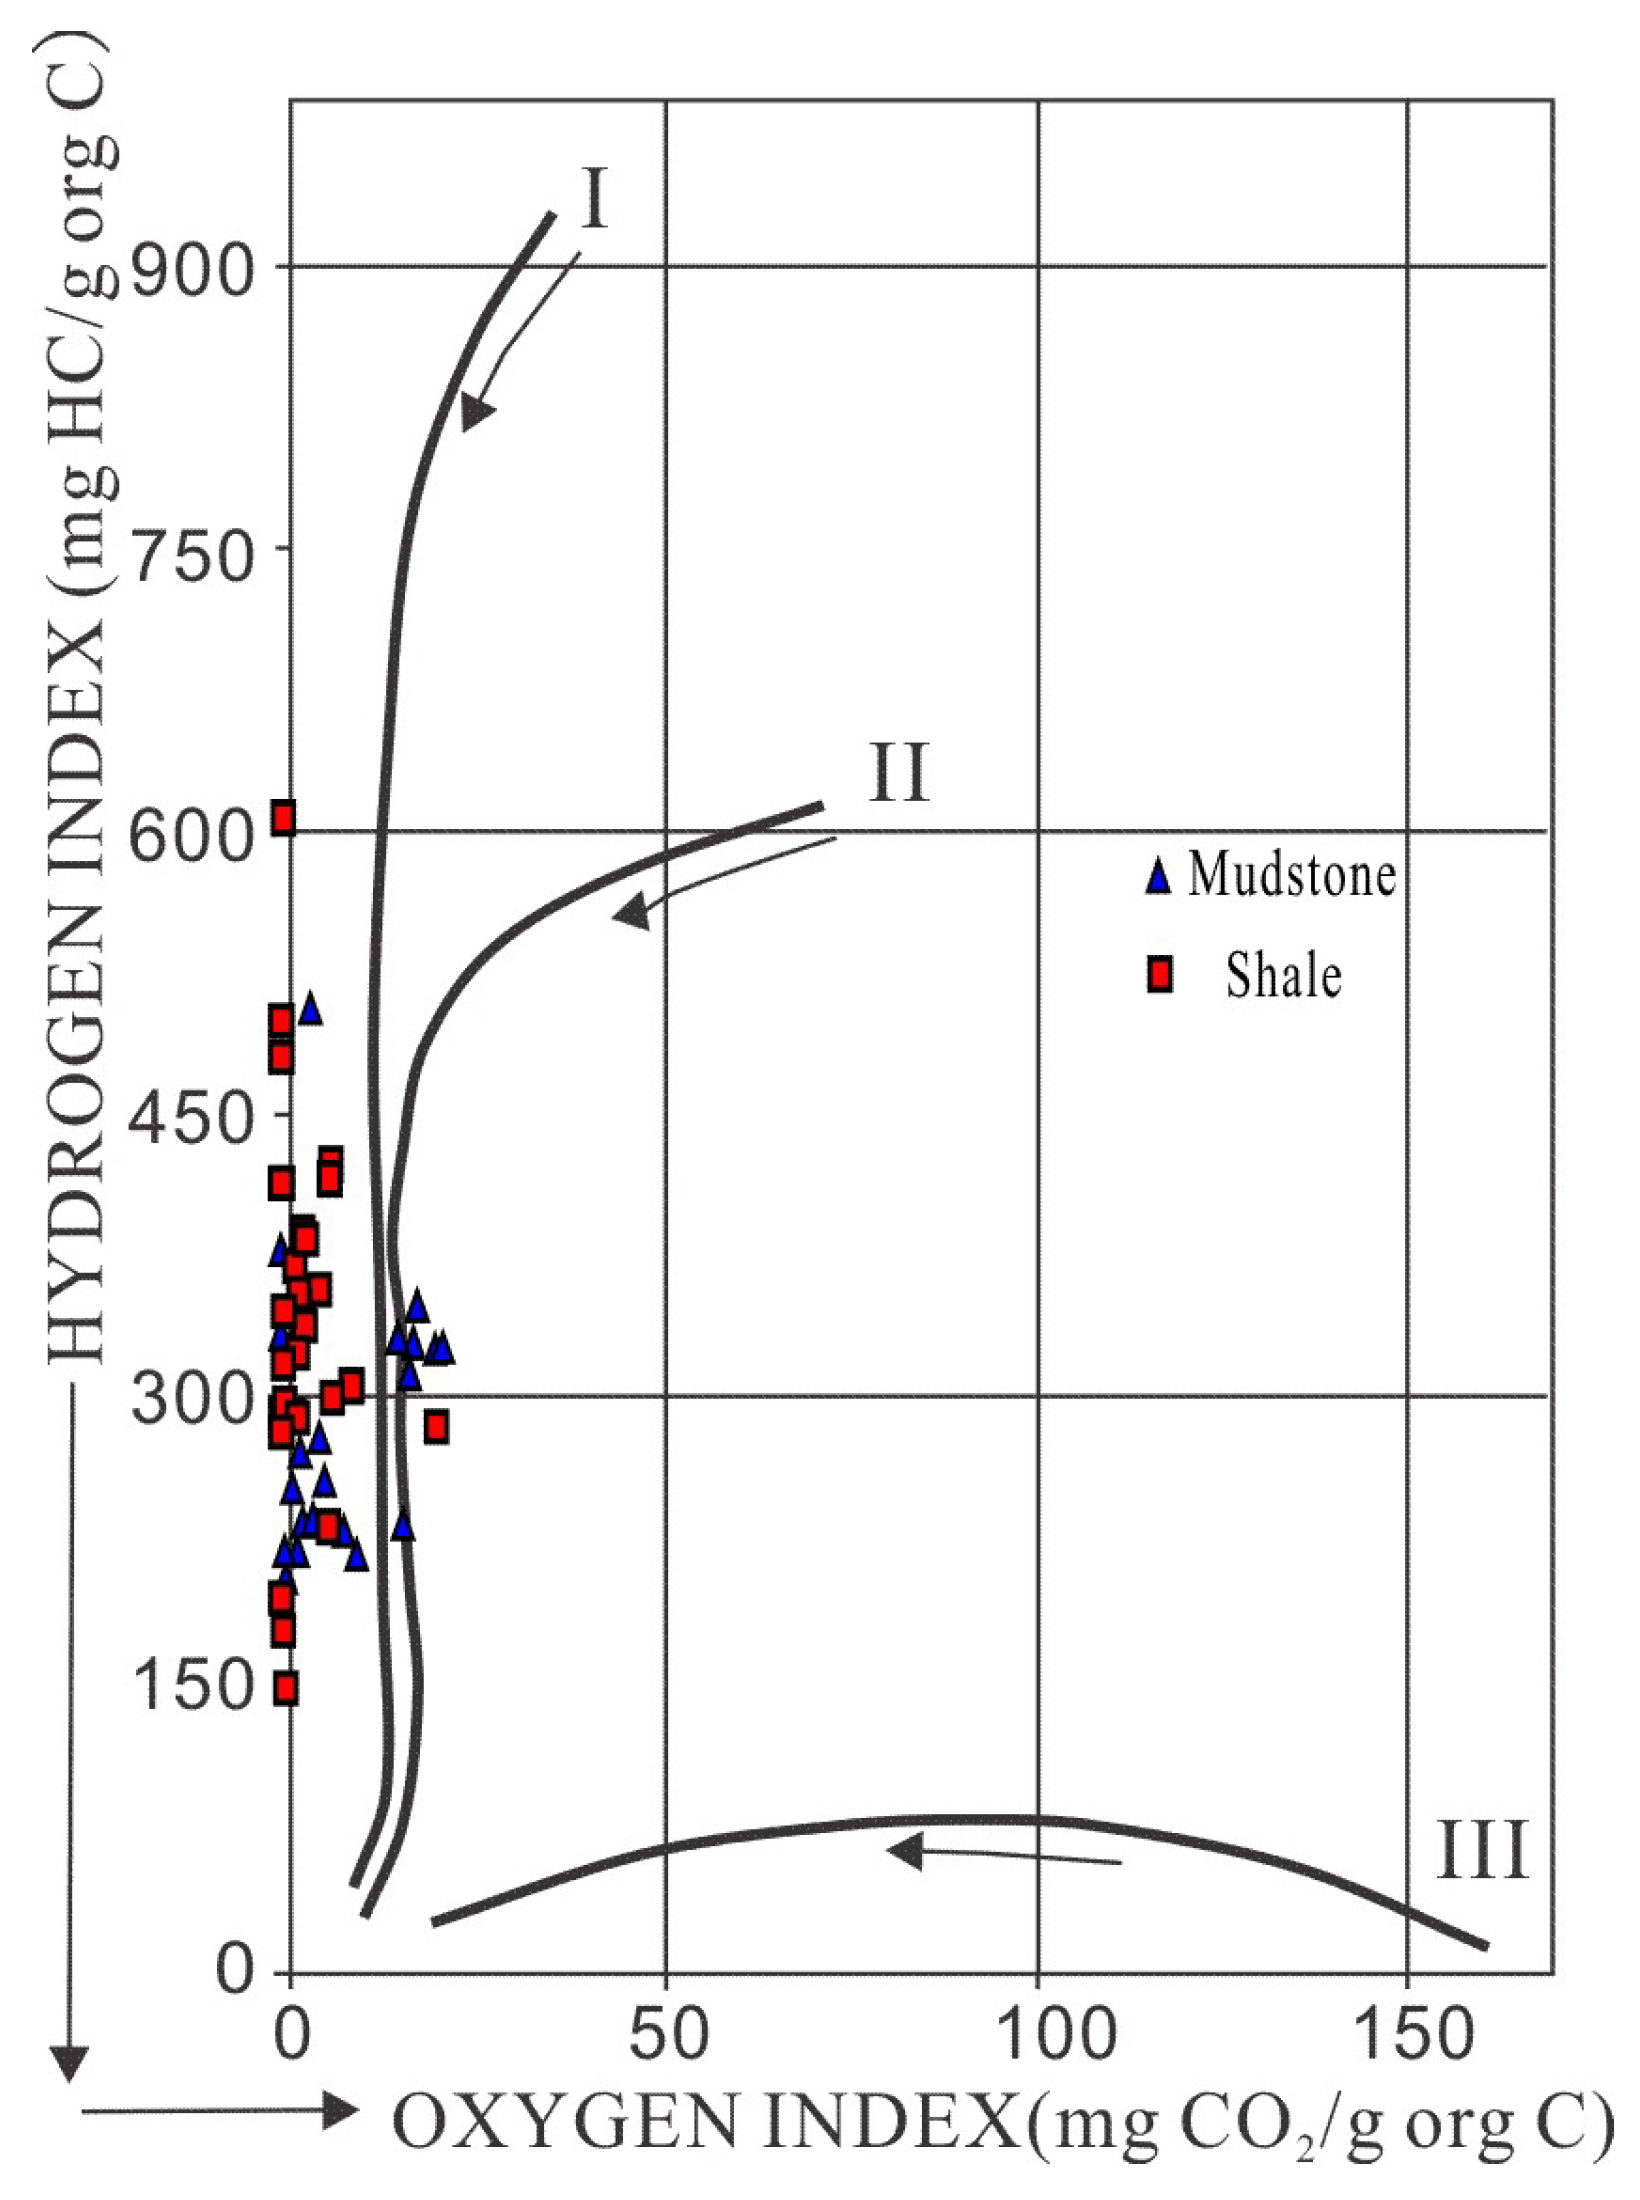
Identification of Organic Matter Types through Rock Pyrolysis Method

Rock pyrolysis analysis is a direct, efficient, and effective geochemical technique. The thermal decomposition parameters of rocks serve a dual purpose, enabling the determination of organic matter abundance and being widely used to differentiate between different types of organic compounds. Commonly used parameters in the thermal analysis of hydrocarbon source rocks include S1, S2, HI, OI, and Tmax. Among these, S1 represents the content of volatile organic compounds, while S2 indicates the quantity of thermally activated organic matter. The Oxygen Index (OI) reflects the oxygen content of organic matter. The Hydrogen Index (HI) is defined as the amount of hydrocarbons generated per unit of organic carbon during pyrolysis, indicating organic matter type and hydrocarbon generation potential. Generally, higher HI values suggest greater hydrogen abundance in organic matter, indicating a more substantial potential for hydrocarbon generation. High HI values are often associated with algal or algal residue organic matter, while low HI values may be related to terrestrial plant organic matter. Therefore, HI helps distinguish different types of organic matter.
In the pyrolysis analysis of source rocks, the term “maximum pyrolysis peak temperature” (Tmax) denotes the temperature at which the maximum reaction rate occurs during the pyrolysis process. This parameter holds significant importance in the investigation of the thermal evolution history and hydrocarbon generation potential of source rocks. Tmax reflects the maturity and hydrocarbon generation potential of source rocks. Higher Tmax values generally indicate higher maturity and lower hydrocarbon generation potential in source rocks. When evaluating organic matter types using pyrolysis parameters, it is crucial to consider the thermal maturity stage of the source rocks. Typically, source rocks exhibit low to moderate maturity levels, making pyrolysis parameters suitable for organic matter classification. However, in cases of high maturity, organic matter may easily convert into soluble hydrocarbons (S1) and pyrolytic hydrocarbons (S2), potentially leading to a decrease in the Hydrogen Index (HI), deviating from the actual conditions.
It is evident that the hydrogen index of the hydrocarbon source rocks is relatively high and the oxygen index is low (Table 3), which may suggest that the source rocks are rich in algal organic matter, with an average Tmax temperature of 443.8 °C. Analysis of the organic matter type chart derived from pyrolysis data (Figure 6) indicates that the primary classification of source rocks in the study area is type II-I.

4.2.3. Thermal Maturation Traits of Hydrocarbon Source Rocks

The presence and makeup of organic matter in sedimentary rocks are the essential building blocks for oil and gas generation. However, only when organic matter reaches a specific level of thermal maturation can a substantial volume of hydrocarbon substances be generated [36]. Empirical exploration practices have shown that areas with a mature distribution of source rocks often have a high success rate in oil and gas exploration. The degree of maturity reflects the extent to which sedimentary organic matter has transformed into oil. It is a vital criterion for evaluating specific source rocks or regions’ hydrocarbon generation potential and resource prospects. To determine whether organic matter has reached a mature stage and initiated significant oil generation, petroleum geologists from various countries have proposed various indicators to assess organic matter maturity. These indicators include Ro, Tmax, the distribution of n-alkanes, the thermal index of organic matter, and biomarker composition characteristics. These metrics aid in assessing the degree of thermal evolution through which organic matter transforms petroleum.
This study aims to elucidate the mature evolution characteristics of source rocks within the Chang 7 member. The current analysis is focused on the target layer and encompasses results derived from experimental analyses of sampled specimens and previous research findings.
Optical indicators play a crucial role in monitoring the evolution of organic matter by discerning microscopic components. These indicators possess optical characteristics that can measure changes in the chemical structure and composition of organic matter. Ro, a parameter indicating the extent of thermal maturation in ancient terrains, is not only associated with the burial depth of the source rock but also influenced by the duration of burial and variations in the geothermal field.
As the burial depth increases, there is a consistent and systematic rise in vitrinite reflectance. Consequently, the stage of organic matter maturity can be classified based on the reflectance (Ro) value of vitrinite and Tmax (Table 4) [24]. It is crucial to note that Tmax is a critical parameter in understanding thermal maturity. The transition to Tmax allows for a more comprehensive evaluation of the organic matter’s evolution, providing additional insights into the thermal history and maturation processes within the Chang 7 member.
In the Heshui region, the vitrinite reflectance (Ro) values for the source rocks primarily fall within the range of 0.7% to 0.9% (Figure 7). This range signifies a continuum of organic matter maturity from peak to mature stages, as illustrated in Figure 7 and detailed in Table 4. In our study area, the oil production threshold is surpassed when the vitrinite reflectance index (Ro) exceeds 0.6% and the associated burial depth reaches 1500 m. The mature stages, including early mature, peak mature, and late mature, occur when Ro ranges between 0.6% and 1.35%. Upon surpassing 1.35%, the corresponding depth exceeds 2800 m, marking the transition into the post-mature stage.

4.3. Logging Appraisal Techniques for Hydrocarbon Source Rocks

4.3.1. Logging Responses of Source Rocks

Due to their low conductivity, organic-rich hydrocarbon source rocks exhibit distinctive logging response characteristics [37]. This unique feature has led to the development of the ΔlogR method, which capitalizes on the conductivity trait of hydrocarbon source rocks [36,37,38,39]. The specific logging response attributes for each lithology are elaborated upon in Table 5.
The formations in the Chang 7 member are predominantly shale, dark mudstone, and sandstone (Figure 1b). On well-logging curves, sandstone typically demonstrates lower values for natural gamma, acoustic transit time, and neutron porosity (Figure 8). Since sandstone often contains oil, it may exhibit a relatively higher electrical resistivity.
Oil shale, renowned for its substantial organic material content or high oil content, exhibits distinctive characteristics on well-logging curves. These attributes include elevated gamma-ray values (around 200 API), extended acoustic transit time (approximately 300 microseconds per meter), increased electrical resistivity (approximately 80 ohms per meter), and heightened neutron porosity values (approximately CNL 45.3%). Additionally, oil shale displays extremely low porosity and permeability.
On the other hand, dark mudstone demonstrates moderate to high gamma-ray values (approximately 115 API) and moderate to high acoustic transit time (around 220 microseconds per meter). Regarding resistivity, it varies between moderate and low values (approximately 40 ohms per meter). Neutron porosity values for dark mudstone cover a spectrum from moderate to high, measuring at approximately 21% CNL (Figure 8).
The low conductivity in organic-rich hydrocarbon source rocks contributes to their distinct logging response characteristics within the hydrocarbon source rock section. This insight led to the formulation of the logR method, and the nuanced logging responses for each lithology are meticulously outlined in Table 5.

Distribution Characteristics of Dark Mudstone

The sedimentary records of the Triassic period in the Ordos Basin reveal a significant influence of sedimentary facies on the deposition of dark mudstone. In deep and semi-deep lake environments, the development of dark mudstone often exhibits a consistently continuous thickness, contrasting with the thickness observed in shallower lake regions and delta fronts. In this study, we integrated logging data with the SH > 70% criterion to calculate the thickness of dark mudstone across various strata, thereby obtaining thickness data for each sub-layer.
Based on a statistical analysis of logging data, thickness distribution maps were created for the sub-layers of Chang 73, Chang 72, and Chang 71 dark mudstones (Figure 9).
The Chang 73 dark mudstone displays a northwest-southeast orientation, stretching over a distance of more than 30 m. It is primarily situated in the northeastern region of the research area, extending from the resettlement farm to Chengguan to Luoshanfu (Figure 9a). The individual layers of Chang 73 dark mudstone are notably thick, mainly owing to the consistent presence of dark mudstone containing tuff at the section’s base, resulting in an average thickness of approximately 20 m.
The dark mudstone in Chang 72 exhibits a northwest-southeast orientation and is mainly located near Wangjia Dazhuang Gucheng. This dark mudstone is characterized by its substantial thickness, although its distribution area is relatively minor (Figure 9b). It is primarily found in the semi-deep lake subfacies, with the cumulative thickness of the dark mudstone in the sedimentary center exceeding 25 m and reaching a maximum of over 30 m, with individual layers exceeding 20 m.
The Chang 71 dark mudstone exhibits a northwest-southeast distribution pattern, with its primary concentration in the Xuanma Gucheng region. During the Chang 71 phase, the cumulative thickness of dark mudstone within the shallow to semi-deep lake subfacies exceeded 20 m, with a maximum thickness reaching 35 m (Figure 9c).
In conclusion, throughout the Chang 73 to Chang 71 periods, the predominant extension of dark mudstone occurred from the northwest to the southeast. The cumulative thickness of dark mudstone exceeded 20 m in each period, resulting in an overall accumulation surpassing 60 m for the source rock. The substantial occurrence of densely distributed dark mudstone is a crucial indicator of the oil reservoir potential during the Mesozoic era.

Distribution Characteristics of the Shale

The shale within the Chang 7 Member displays distinctive characteristics in comprehensive logging. These characteristics include low self-potential (SP), elevated gamma radiation (GR) values, high resistivity (RILD), and a reduced density log (DEN). These features distinguish it from lacustrine silty mudstone and mudstone. A statistical analysis of numerous boreholes indicates a widespread distribution of shale in the study area, albeit with significant variations in thickness. In highly developed regions, the cumulative thickness of the shale can exceed 20 m, while in most areas, it ranges from 5 to 15 m. Among the various segments of the Chang 7 layer, Chang 73 (Figure 10c) exhibits the most significant shale development. In contrast, Chang 72 (Figure 10b) and Chang 71 (Figure 10a) within the Chang 7 Member do not display significant shale development.

4.3.2. Conventional ΔLogR Method Model

This study employed the logging evaluation method known as ΔLogR technology, which was proposed for hydrocarbon source rocks by Passey et al. in 1990 [40,41]. This approach utilizes logging data to identify and quantify organic carbon in source rocks, and it has been extensively applied in regions such as Songliao and North China, yielding favorable results.
The fundamental principle of this method is based on the behavior of rock compaction and sound wave transmission as mudstone and shale undergo increasing burial depth. With greater burial depth, compaction intensifies, reducing pore volume within the rock and enhancing sound wave transmission capacity. Consequently, the acoustic time difference decreases with increasing depth. However, organic matter, oil, or gas within the formation leads to a more significant acoustic time difference than other rock matrices lacking organic content.
Simultaneously, as rock void volume decreases and resistivity increases due to diminishing conductive water volume, both curves show changes in formation porosity with increasing depth. These two curves run parallel and overlap in water-rich rocks without organic content. Conversely, a disparity between the two curves becomes apparent in oil and gas reservoir rocks or non-reservoir rocks rich in organic material. Reservoir intervals can be identified using natural gamma, compensated neutron porosity, or natural potential curves. The observed difference between these two curves is mainly attributed to the porosity curve’s response in rocks abundant in immature organic matter, where oil and gas generation has not yet occurred. In mature hydrocarbon source rocks, in addition to the porosity curve response, hydrocarbons and an increase in resistivity amplify the amplitude difference between these curves [42]. The calculation of ΔLogR is derived from the superposition of sound waves and resistivity, and the equation for ΔLogR is as follows [43]:
ΔLogR = lg (Rt/Rt baseline) + 0.0061 (ΔT − ΔT-Baseline)
where:
ΔLogR represents the measured spacing value of the curve on the logarithmic resistivity scale, with the resistivity (R) expressed in Ω·m in the logging data.
ΔT signifies the acoustic time difference in well logging, measured in μs/m.
Rt baseline indicates the resistivity corresponding to the baseline in Ω·m.
ΔT-Baseline represents the propagation time associated with the baseline, measured in μs/m.
0.0061 is a constant factor dependent on the acoustic time difference corresponding to each resistivity scale (164 μs·m−1).
As ΔLogR demonstrates a linear correlation with Total Organic Carbon (TOC) and is a function of maturity, the relationship between ΔLogR and TOC can be expressed as follows:
TOC = ΔLogR × 10 (2.297 − 0.1688Ro)
To streamline the procedure and circumvent the intricacies associated with analyzing the Ro (maturity) of individual high-quality source rocks, Zhu Guangyou et al. (2003) revised the formula to [44]:
TOC = a × LgR + b × ΔT + c
Because of the distinctive traits of high acoustic time difference, elevated resistivity, and low density in hydrocarbon source rocks, it becomes essential to eliminate the density’s impact on organic carbon content and conduct a density correction. The formula can be further adjusted as follows:
TOC = (a × LgR + b × ΔT + c)/d
In Formula (4), coefficients a, b, and c are determined by analyzing samples within the study area using multiple regression analysis, with d representing density logging values.

4.3.3. Calculation of TOC for Source Rocks of Changyanchang Formation 7

TOC calculation = (27.43 × LgR + 0.15 × ΔT − 27.23)/d
By applying Formula (5) to the data from 57 actual Total Organic Carbon (TOC) measurements in 6 wells and integrating the resistivity and acoustic time logging values separately, corresponding TOC values were obtained. Subsequently, the calculated TOC values were compared to the measured TOC values, showing a good correlation of 0.86 (Figure 11). On the comprehensive single-well column chart, the calculated TOC values closely approximate the measured TOC values (Figure 12).

4.3.4. Spatial Distribution Characteristics of Organic Matter Abundance

Leveraging the previously discussed TOC calculations for the source rock, a planar distribution map has been created to depict the TOC distribution within the Heshui area (Figure 13).
The TOC content within the Chang 73 hydrocarbon source rock exhibits a northwest-southeast distribution pattern, with values exceeding 10 wt.% at its highest. This distribution is primarily observed in the northeastern region of the research area, extending from Wangjia Dazhuang to Luoshan Prefecture in the north and from Xuanma to Chengguan Gucheng Panke in the east. The increased TOC content in the Chang 73 source rock is linked to a robust and expansive layer of shale rich in organic matter at the base of the Chang 73 section (Figure 13a).
The TOC in the hydrocarbon source rocks of the Chang 72 formation exhibits a distribution trend from northwest to southeast. This trend is prominently observed north of Wangjia Dazhuang, extending towards the northern part of Luoshanfu and encompassing the Panke Xiangle area. Notably, the TOC values of the Chang 72 hydrocarbon source rocks exhibit a significant decrease when compared to those of the Chang 73 layer. In the Chang 72 section, black mudstone is substantially developed, with shale being comparatively less well-developed, as illustrated in Figure 13b.
The TOC content in the Chang 71 hydrocarbon source rock follows a northwest-southeast distribution pattern, with a predominant concentration in the Wangjia Courtyard, Luoshanfu, and Chengguan Gucheng areas. This distribution is attributed to the prevalence of well-developed dark mudstone and underdeveloped black oil shale during the Chang 71 period (Figure 13c).
Total Organic Carbon (TOC) distribution in source rocks spanning the Chang 73 to Chang 71 periods predominantly follows a northwest-southeast trend. In the Chang 73 period, the TOC distribution is influenced by shale, whereas in the Chang 72 and Chang 71 periods, it is governed by dark mudstone.

5. Discussion

5.1. Comparative Assessment of Hydrocarbon Generation Potential: Source Rocks in the Chang 7 Member, Heshui Area, vs. Other Terrestrial Lacustrine Source Rocks

The recognition of lacustrine sequences as promising reservoirs for significant petroleum reserves is closely tied to the composition of petroleum source rocks within these sequences. These rocks exhibit a wide range of organic carbon contents, spanning from less than 1% to over 20%, and display various kerogen types, ranging from Type I to Type III. The organic material in these rocks can originate from terrestrial plants, algae, or bacteria [45].
This organic matter within rocks forms the basis for the generation of oil and gas. The rocks become industrially valuable source rocks, termed effective source rocks, only when the organic matter surpasses a certain threshold [46]. Key parameters used to assess organic matter abundance include hydrocarbon generation potential (S1 + S2), chloroform asphalt “A”, and total hydrocarbon content (HC). Total organic carbon content is a commonly employed indicator for evaluating organic matter abundance. While some organic matter may be lost during burial, this loss is relatively minimal compared to the overall organic matter content. As a result, the residual organic carbon content measured in rocks accurately reflects the original organic matter content.
The Ordos Basin, a significant area for oil and gas exploration and development in China, stands out as one of the nation’s largest source rock regions. Within this basin, the Chang 7 source rock holds particular importance. Deposited during a period characterized by a warm and humid climate, the Chang 7 member thrived in a weak oxidation-weak reduction freshwater sedimentary environment [47]. Various geological processes, including volcanic material alteration and deep hydrothermal activity, enriched the area with nutrients, fostering high biological productivity. Subsequent hypoxic conditions post-sedimentation facilitated organic matter preservation, resulting in a high abundance of organic material.
The thick shale found in the Chang 7 member of the Ordos Basin serves as its primary source rock. This shale exhibits robust hydrocarbon generation and expulsion capabilities, especially the black shale within the Chang 73, showcasing a pyrolysis hydrocarbon generation potential (S1 + S2) typically ranging from 30–50 (mg HC/g rock), with peaks exceeding 150 (mg HC/g rock). Such super-strong hydrocarbon generation and expulsion capabilities are notably rare in terrestrial basins. The organic carbon content of Chang 7 in the Heshui area ranges mainly between 1 and 27 wt.%, predominantly of type II-I organic matter (Figure 14). With Ro content between 0.7% and 0.9% and an average pyrolysis temperature of 443.8 degrees Celsius, the thermal evolution of this organic matter indicates a peak mature stage. This shale, rich in organic matter, constitutes a significant contributor to the basin’s oil and natural gas reserves, possessing favorable hydrocarbon source rock characteristics, including high organic matter abundance, moderate maturity, and adequate rock porosity.
Moving to the Songliao Basin, the Qingshankou Formation (K2qn) is a crucial horizon for petroleum exploration in Northeast China [48]. The source rock of the Qingshankou Formation, emerging from the basin’s evolution within a lake environment, consists primarily of organic-rich remnants from algae and plant materials. These organic deposits, predominantly from high-productivity lake environments dominated by algae, boast organic carbon content ranging from 2 wt.% to 10 wt.% (Figure 14). With relatively high maturity, indicated by an average Ro of 1.1% and a maximum pyrolysis temperature of 435 degrees Celsius, this organic matter has evolved to a peak mature or late mature stage, generating substantial hydrocarbon substances. Pyrolysis experiments confirm high hydrocarbon generation potential, suggesting oil and natural gas release potential under appropriate geological conditions. These characteristics hint at the economic promise of the Qingshankou Formation’s lacustrine source rocks in petroleum exploration and their potential as significant contributors to oil and gas reserves.
The Beibu Gulf Port Songhong Basin within the South China Sea has extensive potential for oil and gas resources [49]. The Oligocene strata, composed of 500 m of profound lacustrine mudstone and diverse gravity-induced deposits, represent significant reservoirs for hydrocarbon sources. The mudstone, distinguished by the presence of sapropel type I and a combination of type I and III kerogen, showcases an average Total Organic Carbon (TOC) content of 2.59 wt.% (Figure 14) with an average peak pyrolysis temperature of 429 degrees Celsius. The average Ro is 0.39%, and the thermal evolution of this organic matter suggests an immature stage.
Transitioning to the Northern Switzerland region, specifically the Carboniferous to Permian periods, this area is known as the Northern Switzerland Coal Basin [50]. The lacustrine source rocks from the Carboniferous and Permian eras show promising economic potential. Graben sediments within the North Alpine Foreland Basin (NAFB) include Upper Carboniferous coal measures and Lower Permian lacustrine shale rich in organic matter. While coal may serve as a natural gas source, shale holds potential as a petroleum source rock. The total organic carbon content in coal samples ranges from 51.5 to 77.0 wt.% (Figure 14), with coal shale (12.7–17.1 wt.%) and shale samples (2.0–7.3 wt.%) boasting an average Ro of 0.93% and an average maximum pyrolysis temperature of 453 degrees Celsius. The thermal evolution of organic matter indicates peak maturity, presenting substantial potential for petroleum generation and accumulation in the region.
The lacustrine source shale of the Lower Cretaceous in the Congo Basin, West Africa, is a crucial hydrocarbon source rock. The lithology of this shale is predominantly shale [51]. The average S1 + S2 is 15.5 mg HC/g rock, with an average total organic carbon (TOC) of 3.3%, indicating a rich organic matter content. The Ro values of the shale range from 0.3% to 1.2%, and Tmax values range from 420 °C to 460 °C, classifying it as a low- to medium-maturity hydrocarbon source rock situated in the oil or gas window stage, favorable for oil and natural gas generation. The shale is mainly composed of Type I and III organic matter, exhibiting good hydrocarbon generation potential and efficiency.
The lacustrine source shale in Scotland from the Lower Carboniferous Dinantian Oil Shale Group of Scotland has an average S1 + S2 of 48.2 mg HC/g rock and an average TOC of 11.99%, indicating an extremely high organic content, reaching an excellent hydrocarbon source rock level. Ro ranges from 0.4% to 1.2%, and Tmax ranges from 420 °C to 460 °C. The organic matter is primarily Type III [52].
The lacustrine source rock lithology in the Birkhead and Murta formations of the Eromanga Basin, Australia, comprises siltstone and shale. The Birkhead Formation’s organic matter is predominantly terrestrial, with a focus on lignin and small amounts of humus and algae. Ro ranges from 0.4% to 0.6%, indicating an initial stage within the oil window. The average Tmax is 430 °C [53], consistent with Ro results. The Murta Formation’s organic matter is primarily freshwater lake-based, dominated by algae, with a significant presence of Botryococcus green algae, along with lignin and humus. Ro ranges from 0.5% to 0.7%, indicating an initial stage within the oil window. The average Tmax is 435 °C, consistent with Ro results. The average S1 + S2 is 4.48 mg HC/g rock, with an average TOC of 2.25%, qualifying it as a good hydrocarbon source rock. The average Ro is 0.58%, and Tmax values range from 425 °C to 440 °C.
The lacustrine source rock in the Triassic Newark Basin, USA, has an average S1 + S2 of 0.24 mg HC/g rock and an average TOC of 1.19%, placing it in the category of a typical hydrocarbon source rock. Organic matter is mainly Type III, originating from terrestrial plants and rich in polycyclic aromatic hydrocarbons and oxygen-containing groups. Ro ranges from 1.94% to 2.39%, indicating postmature [54]. The average Tmax is 440 °C. In summary, the hydrocarbon source rock in Triassic, Newark Basin, USA, possesses some gas generation potential, but the potential for liquid petroleum generation is relatively limited.
Through comparative analysis, although the good quality of lacustrine source rocks is widely recognized, there are significant variations in the hydrocarbon generation potential of lacustrine source rocks in different regions (Figure 14). A preliminary assessment of the hydrocarbon generation potential of lacustrine source rocks in eight countries or regions was conducted based on parameters such as TOC, S1 + S2, organic matter type, and Ro.
The Chang 7 member shale of the Ordos Basin ranks first, exhibiting the highest hydrocarbon generation potential with an average oil yield of about 50.74 (mg HC/g·rock). It belongs to the category of excellent to outstanding source rocks, characterized by organic matter of type II-I and reaching the peak maturity stage.
Scotland’s Lower Carboniferous Dinantian Oil Shale Group secures the second position, with an average oil yield of approximately 48.2 (mg HC/g·rock). It falls within the excellent to outstanding source rock category, characterized by organic matter of type III and reaching the peak maturity or late maturity stage.
The hydrocarbon generation potential of Carboniferous-Permian lacustrine source rocks in Switzerland ranks third. Despite high TOC and S1 + S2 values, the average oil generation of shale, after excluding coal samples, is approximately 8.69 (mg HC/g · rock). Maturity is in the peak or late maturity stage, classifying them as good-quality source rocks.
The hydrocarbon generation potential of the Qingshankou Formation in the Songliao Basin holds the fourth position, with an average oil yield of about 8.67 (mg HC/g·rock). These source rocks have reached peak maturity or late maturity, exhibiting high hydrocarbon efficiency and expulsion efficiency.
The Lower Cretaceous alluvial fan facies shale in the West African Congo Basin ranks fifth in hydrocarbon generation potential. With a maximum oil yield of approximately 15.5 (mg HC/g·rock), the maturity level is in the low to medium range, demonstrating good hydrocarbon efficiency but relatively low expulsion efficiency.
The Oligocene mudstones in the Beibu Gulf Port Songhong Basin within the South China Sea rank sixth in hydrocarbon generation potential, with an average oil yield of about 13.95 (mg HC/g·rock). These source rocks are immature, yet they exhibit a certain degree of hydrocarbon generation and expulsion efficiency.
The hydrocarbon generation potential of source rocks in the Eromanga Basin, Australia, is ranked seventh, with an average oil yield of about 4.84 (mg HC/g·rock). The organic matter is in the immature to early mature thermal maturity stage, indicating that these formations are in the early stages of oil and gas generation.
The Triassic shale in the Newark Basin, USA, has the lowest hydrocarbon generation potential, with a maximum oil yield of about 0.24 (mg HC/g·rock). The maturity level is in the over-mature stage, demonstrating some gas generation potential but limited potential for liquid petroleum formation.
The comparative analysis underscores that the Chang 7 source rock in the Ordos Basin, China, holds a unique position with exceptional hydrocarbon source rock characteristics. It surpasses others in terms of hydrocarbon potential, organic content, maturity, and rock porosity. Understanding the variations in lacustrine source rocks globally provides valuable insights for targeted exploration and resource assessment in the Ordos Basin. These insights help evaluate the significance of Chang 7 in the context of its extraordinary attributes, aiding in informed decision-making for oil and gas exploration in the region. Moreover, the comparative results offer lessons and benchmarks for other regions seeking to assess their lacustrine hydrocarbon source rock potential.

5.2. Relationship between Deepwater Fine Grain Lithofacies and Source Rock Development

Shale and mudstone exhibit notable differences in color and characteristics [55]. Shale, generally darker, displays distinctive foliation features and comprises fewer detrital minerals like quartz and feldspar than mudstone, where clay minerals constitute over 50% of its composition (Table 6).
Shale boasts an average pyrite content of approximately 10%, significantly higher than that found in mudstone. Organic carbon content in shale typically ranges from 4 wt.% to 20 wt.%, with instances exceeding 30 wt.%, averaging 10.63 wt.%, five times higher than mudstone, which typically contains 0.5 wt.% to 1.5 wt.% organic carbon, averaging 2.21 wt.% (Table 7). The organic matter in shale often presents a continuous layered distribution, while in mudstone, it takes on a star-shaped dispersed pattern or blends entirely with mineral layers, creating a flocculent distribution.
In addition, shale exhibits an average S1 content three times higher than that of mudstone, indicating a greater production of extractable hydrocarbon substances during pyrolysis. The oil recovery potential index (S1 + S2) of shale is approximately eight times that of mudstone, highlighting shale’s superior capability to provide recoverable materials. While the S3 value of mudstone is about twice that of shale, the S4 value is approximately 1/4 of shale, suggesting the generation of distinct types of hydrocarbon substances during pyrolysis. Moreover, the HI of mudstone is approximately half of that in shale, signaling a relatively lower proportion of organic matter to mature hydrocarbons in mudstone (Table 7).
Notably, the pyrolysis parameter primary gas (PG) in mudstone surpasses that of shale, whereas the pyrolysis parameters pyrolysis carbon (PC) and dehydrogenation (D) in mudstone are both smaller than their shale counterparts (Table 7). These differences likely reflect distinct kinetic characteristics between mudstone and shale in the pyrolysis reaction process.
Overall, these variations in characteristics underscore shale’s heightened hydrocarbon generation potential compared to mudstone, emphasizing its richer content of extractable hydrocarbon substances. Consequently, shale may present a more enticing prospect in the realm of oil and gas exploration and development.
The pyrolysis analysis results reveal that shale exhibits higher total organic carbon (TOC) content and hydrogen index (HI) values compared to mudstone (Table 3). These variations in organic matter composition highlight the distinct sedimentary environments associated with each rock type. Mudstones typically originate in semi-deep to deep lake settings, lake deltas, and shallow lake environments characterized by significant input of terrestrial debris and rapid sedimentation rates. In contrast, shale predominantly forms in relatively enclosed deep-lake environments with limited terrigenous detrital materials and sluggish sedimentation rates. Algae represent the primary source of organic matter in shale, contributing to its elevated organic content.
Consequently, the layered structure of mudstone is generally less conspicuous, creating a notable contrast with shale [56]. It is crucial to note that the organic matter in lake mudstone primarily originates from terrestrial debris, while in shale, it is predominantly derived from algae. Additionally, the sedimentary environment of mudstone influences its microstructure, especially when formed in semi-deep to deep lake gravity flow environments, resulting in mudstones rich in mud components and displaying graded block-like bedding associated with turbidity currents (Table 6). This series of characteristics further emphasizes the microscopic and organic matter distinctions between mudstone and shale in diverse sedimentary environments.
In contrast, shale primarily forms in relatively enclosed deep lake environments with limited terrigenous detrital materials and sluggish sedimentation rates [57]. Shale exhibits a seasonal, layered structure marked by alternating distributions of silicate minerals and organic matter, often influenced by lake or turbidity currents.
Furthermore, shale with a lenticular pattern of pyrite and phosphate rock aggregates, discovered at the base of the Chang 73 member, signifies a sedimentary environment characterized by high productivity and relatively low terrestrial material input. Organic-rich shale stands as a critical fine-grained sedimentary rock abundant in organic matter, playing a pivotal role as a source rock in oil and gas-bearing basins and serving as a primary reservoir rock for shale oil and gas.
Lake intrusion and water stratification define the sedimentary pattern of organic-rich shale within the Chang 7 member (Figure 15). Factors such as “sedimentary facies zone”, “water depth”, “anoxic environment”, and “lake flow” influence shale composition. In tranquil deep lake subfacies, shale tends to possess a higher organic carbon content, influenced by lake currents. In pro-delta settings, semi-deep lacustrine facies shale mainly comprises mudstone and silty mudstone, characterized by lower organic carbon content.
The sedimentary period of the Chang 7 member marks the pinnacle of lake intrusion. During the Chang 73 sedimentation period, the rapid expansion of the deep lake region exceeded 5 × 10⁴ km2, reaching depths of 150 m and creating a freshwater environment with salinity levels below 1‰. The swift pace of lake invasion constrained circulation, fostering a significant hypoxic environment conducive to developing organic-rich shale. Additionally, volcanic activity contributed to increased lake productivity and, to some extent, the formation of a hypoxic environment.

6. Conclusions

(1)
Sedimentary facies, water depth, hypoxic environments, and lake currents are pivotal factors influencing the distribution of hydrocarbon source rocks. Shale predominantly forms in enclosed deep lake environments, while mudstone is prevalent in semi-deep lake, pro-delta, and coastal shallow lake settings. Shale exhibits dark and well-defined foliation structures, featuring lower detrital mineral content such as quartz and feldspar and significantly higher organic carbon content compared to mudstone. The average organic carbon content in shale is 10.63%, five times higher than that observed in mudstone. Efforts have been made to refine the language and minimize repetition. Thin-section observations reveal that organic matter in shale follows a continuous layered pattern, whereas in mudstone, it takes on a star-like dispersion or combines with mineral layers to form a flocculent distribution. Shale primarily possesses kerogen types I-II1, while mudstone is categorized as II.
(2)
The comparative analysis highlights the exceptional lacustrine source rock characteristics of the Chang 7 member in the Heshui area of the Ordos Basin, China, surpassing others in terms of hydrocarbon potential, organic content, and maturity. Insights gained from this comparative study not only provide valuable guidance for targeted exploration and resource assessment in the Ordos Basin but also serve as a valuable reference for regions assessing their lacustrine hydrocarbon source rock potential. In a comprehensive evaluation, the shale in the Heshui area of the Ordos Basin stands out with substantial thickness, extensive spatial distribution, and rich organic matter, indicating favorable hydrocarbon generation potential. Consequently, it is classified as a “very good” and “excellent” source rock, further emphasizing its promising role in the field of hydrocarbon exploration and development.
(3)
Given the substantial distinctions in lithology, organic matter content, and hydrocarbon generation potential between shale and mudstone, shale exhibits dark and well-defined foliation structures, lower detrital mineral content, higher clay mineral content, and significantly elevated organic carbon content. These characteristics suggest a superior potential for hydrocarbon generation. The distribution of organic-rich shale within the Ordos Basin is closely associated with deep lake environments, hypoxic conditions, and lake flow. Shale, enriched in organic matter, is pivotal in oil and gas exploration and development.

Author Contributions

Conceptualization, Q.W. and L.X.; software, W.T.; validation, Q.W. and L.X.; formal analysis, W.T.; investigation, W.T.; resources, L.Y. and M.Z.; writing—original draft preparation, L.X. and Q.W.; writing—review and editing, Q.W. All authors have read and agreed to the published version of the manuscript.

Funding

Quantitative characterization technology for advantageous flow channels in low-permeability reservoirs (2016zx05056).

Data Availability Statement

The data presented in this study are available on request from the corresponding author. The data are not publicly available due to company limitations.

Conflicts of Interest

The authors declare that this study received funding from 2016zx05056. The funder was not involved in the study design, collection, analysis, interpretation of data, the writing of this article or the decision to submit it for publication.

References

  1. Xiao, L.; Bi, L.; Yi, T.; Lei, Y.; Wei, Q. Pore Structure Characteristics and Influencing Factors of Tight Reservoirs Controlled by Different Provenance Systems: A Case Study of the Chang 7 Members in Heshui and Xin’anbian of the Ordos Basin. Energies 2023, 16, 3410. [Google Scholar] [CrossRef]
  2. Wei, Q.; Zhang, H.; Han, Y.; Guo, W.; Xiao, L. Microscopic Pore Structure Characteristics and Fluid Mobility in Tight Reservoirs: A Case Study of the Chang 7 Member in the Western Xin’anbian Area of the Ordos Basin, China. Minerals 2023, 13, 1063. [Google Scholar] [CrossRef]
  3. Liu, B.; Teng, J.; Mastalerz, M. Maceral Control on the Hydrocarbon Generation Potential of Lacustrine Shales: A Case Study of the Chang 7 Member of the Triassic Yanchang Formation, Ordos Basin, North China. Energies 2023, 16, 636. [Google Scholar] [CrossRef]
  4. Zhang, W.; Liang, X.P.; Li, P.; Liu, G.H. The Exquisite Comparison of Shale Mineralogical-Geochemical Characteristics between Chang 7 Member and Chang 9 Member in Yanchang Formation, Ordos Basi. Geofluids 2023, 2023, 5039604. [Google Scholar] [CrossRef]
  5. Li, C.; Chen, S.J.; Liao, J.B.; Hou, Y.T.; Yu, T.; Liu, G.L.; Xu, K.; Wu, X.T. Geochemical characteristics of the Chang 7 Member in the southwestern Ordos Basin, China: The influence of sedimentary environment on the organic matter enrichment. Palaeoworld 2023, 32, 429–441. [Google Scholar] [CrossRef]
  6. Kormos, S.; Sachsenhofer, R.F.; Bechtel, A.; Radovics, B.G.; Katalin Milota, K.; Schubert, F. Source rock potential, crude oil characteristics and oil-to-source rock correlation in a Central Paratethys sub-basin, the Hungarian Palaeogene Basin (Pannonian basin). Mar. Pet. Geol. 2021, 127, 104955. [Google Scholar] [CrossRef]
  7. Barham, A.; Ismail, M.S.; Hermana, M.; Zainal Abidin, N.S. Biomarker characteristics of Montney source rock, British Columbia, Canada. Heliyon 2021, 7, e08395. [Google Scholar] [CrossRef]
  8. Curiale, J.A.; Curtis, J.B. Organic geochemical applications to the exploration for source-rock reservoirs-A review. J. Unconv. Oil Gas. Resour. 2016, 13, 1–31. [Google Scholar] [CrossRef]
  9. Fu, J.H.; Li, S.X.; Xu, L.M.; Niu, X.B. Paleo-sedimentary environmental restoration and its significance of Chang 7 Member of Triassic Yanchang Formation in Ordos Basin, NW China. Petrol. Explor. Develop. 2018, 45, 998–1008. [Google Scholar] [CrossRef]
  10. El-Khadragy, A.A.; Shazly, T.F.; Mousa, D.A.; Ramadan, M.; El-Sawy, M.Z. Integration of well log analysis data with geochemical data to evaluate possible source rock. Case study from GM-ALEF-1 well, Ras Ghara oil Field, Gulf of Suez-Egypt. Egypt. J. Pet. 2018, 27, 911–918. [Google Scholar] [CrossRef]
  11. Rahmani, O.; Khoshnoodkia, M.; Kadkhodaie, A.; Pour, A.B.; Tsegab, H. Geochemical Analysis for Determining Total Organic Carbon Content Based on ∆LogR Technique in the South Pars Field. Minerals 2019, 9, 735. [Google Scholar] [CrossRef]
  12. Fu, J.; Li, X.S.; Sun, Y.H.; Huo, Q.L.; Gao, T.; Fu, L.; Liu, Y.C.; Dong, S.X.; Fan, H.J. A New Evaluation Method of Total Organic Carbon for Shale Source Rock Based on the Effective Medium Conductivity Theory. Geofluids 2021, 9030311. [Google Scholar] [CrossRef]
  13. Zhang, W.Z.; Yang, H.; Li, S.P. Hydrocarbon accumulation significance of Chang 91 high-quality lacustrine source rocks of Yanchang Formation, Ordos Basin. Pet. Explor. Dev. 2008, 35, 557–562. [Google Scholar] [CrossRef]
  14. Hu, S.Q.; Zhang, H.W.; Zhang, R.J.; Jin, L.X.; Liu, Y.M. Quantitative Interpretation of TOC in Complicated Lithology Based on Well Log Data: A Case of Majiagou Formation in the Eastern Ordos Basin, China. Appl. Sci. 2021, 11, 8724. [Google Scholar] [CrossRef]
  15. Zhu, L.Q.; Zhang, C.; Zhang, C.M.; Zhang, Z.S.; Zhou, X.Q.; Liu, W.N.; Zhu, B.Y. A new and reliable dual model- and data-driven TOC prediction concept: A TOC logging evaluation method using multiple overlapping methods integrated with semi-supervised deep learning. J. Pet. Sci. Eng. 2020, 188, 106944. [Google Scholar] [CrossRef]
  16. Tissot, B.P.; Welte, D.H. Petroleum Formation and Occurrence; Springer: Berlin/Heidelberg, Germany, 1978. [Google Scholar] [CrossRef]
  17. Fu, S.Y.; Liao, Z.W.; Chen, A.Q.; Chen, H.D. Reservoir characteristics andmulti-stage hydrocarbonaccumulation of the UpperTriassic Yanchang Formationin the southwestern OrdosBasin, NW China. Nergy Explor. Exploit. 2020, 38, 348–371. [Google Scholar] [CrossRef]
  18. Wang, S.; Li, H.; Lin, L.; Yin, S. Development Characteristics and Finite Element Simulation of Fractures in Tight Oil Sandstone Reservoirs of Yanchang Formation in Western Ordos Basin. Front. Earth 2022, 9, 823855. [Google Scholar] [CrossRef]
  19. Kang, Y.; Ning, Z.F.; Lyu, F.T.; Jia, Z.J. Nanoscale profiling of the relationship between in-situ organic matter roughness, adhesion, and wettability under ScCO2 based on contact mechanics. Fuel 2024, 362, 130833. [Google Scholar] [CrossRef]
  20. Jiang, S.L.; Zhou, Q.H.; Li, Y.J.; Yang, R.L. A Case Study on Preservation Conditions and Influencing Factors of Shale Gas in the Lower Paleozoic Niutitang Formation, Western Hubei and Hunan, Middle Yangtze Region, China. Geofluids 2024, 2024, 6637899. [Google Scholar] [CrossRef]
  21. Shi, X.W.; Wu, W.; Wu, Q.Z.; Zhong, K.S.; Jiang, Z.X.; Miao, H. Controlling Factors and Forming Types of Deep Shale Gas Enrichment in Sichuan Basin, China. Energies 2022, 15, 7023. [Google Scholar] [CrossRef]
  22. Tian, T.; Zhou, S.X.; Fu, D.L.; Yang, F.; Li, J. Calculation of the original abundance of organic matter at high-over maturity: A case study of the Lower Cambrian Niutitang shale in the Micangshan-Hannan Uplift, SW China. J. Pet. Sci. 2019, 179, 645–654. [Google Scholar] [CrossRef]
  23. Astel, A.M.; Bigus, K.; Stec, M. Microbial enzymatic activity and its relation to organic matter abundance on sheltered and exposed beaches on the Polish coast. Oceanologia 2018, 60, 312–330. [Google Scholar] [CrossRef]
  24. Peters, K.E.; Cassa, M.R. Applied source rock geochemistry. AAPG Memoir 1994, 60, 93–102. [Google Scholar]
  25. Nel, H.A.; Dalu, T.; Wasserman, R.J. Sinks and sources: Assessing microplastic abundance in river sediment and deposit feeders in an Austral temperate urban river system. Sci. Total Environ. 2018, 612, 950–956. [Google Scholar] [CrossRef] [PubMed]
  26. International Committee for Coal Petrology (ICCP). International Handbook of Coal Petrography, 2nd ed.; Centre National de la Recherche Scientifique: Paris, France; Academy of Sciences of the USSR: Moscow, Russia, 1963. [Google Scholar]
  27. International Committee for Coal Petrology, (ICCP). International Handbook of Coal Petrography; 1st Supplement to 2nd Edition; CNRS: Paris, France, 1971. [Google Scholar]
  28. International Committee for Coal Petrology, (ICCP). International Handbook of Coal Petrography; 2nd Supplement to 2nd Edition; CNRS: Paris, France, 1975. [Google Scholar]
  29. International Committee for Coal Petrology, (ICCP). International Handbook of Coal Petrography; 3rd Supplement to 2nd Edition; University of Newcastle on Tyne: Newcastle upon Tyne, UK, 1993. [Google Scholar]
  30. International Committee for Coal and Organic Petrology, (ICCP). The new vitrinite classification (ICCP System 1994). Fuel 1998, 77, 349–358. [Google Scholar] [CrossRef]
  31. International Committee for Coal and Organic Petrology (ICCP). The new inertinite classification (ICCP System 1994). Fuel 2001, 80, 459–471. [Google Scholar] [CrossRef]
  32. Sýkorová, I.; Pickel, W.; Christianis, K.; Wolf, M.; Taylor, G.H.; Flores, D. Classification of huminite—ICCP System 1994. Int. J. Coal Geol. 2005, 62, 85–106. [Google Scholar] [CrossRef]
  33. Fathy, D.; Baniasad, A.; Littke, R.; Sami, M. Tracing the geochemical imprints of Maastrichtian black shales in southern Tethys, Egypt: Assessing hydrocarbon source potential and environmental signatures. Int. J. Coal Geol. 2024, 283, 104457. [Google Scholar] [CrossRef]
  34. Labus, M.; Matyasik, I. Application of different thermal analysis techniques for the evaluation of petroleum source rocks. J. Therm. Anal. Calorim. 2019, 136, 1185–1194. [Google Scholar] [CrossRef]
  35. Tissot, B.P.; Welte, D.H. Petroleum Formation and Occurrence, 2nd ed.; Springer: Berlin/Heidelberg, Germany; New York, NY, USA, 1985; Volume 40, pp. 563–579. [Google Scholar]
  36. Hu, D.; Rao, S.; Wang, Z.T.; Hu, S.B. Thermal and maturation history for Carboniferous source rocks in the Junggar Basin, Northwest China: Implications for hydrocarbon exploration. Pet. Sci. 2020, 17, 36–50. [Google Scholar] [CrossRef]
  37. Xiao, Z.L.; Chen, S.J.; Zhao, R.Q.; Han, M.M. Total organic carbon logging evaluation of Fengcheng source rock in the western Mahu Sag, Junggar Basin, China. Energy Sources Part. A Recovery Util. Environ. Eff. 2021. [Google Scholar] [CrossRef]
  38. Bakhtiar, H.A.; Telmadarreie, A.; Shayesteh, M.; Heidari Fard, M.H.; Talebi, H.; Shirband, Z. Estimating Total Organic Carbon Content and Source Rock Evaluation, Applying ΔlogR and Neural Network Methods: Ahwaz and Marun Oilfields, SW of Iran. Pet. Sci. Technol. 2013, 29, 1691–1704. [Google Scholar] [CrossRef]
  39. Tenaglia, M.; Eberli, G.P.; Weger, R.J.; Blanco, L.R.; Rueda Sanchez, L.E.; Swart, P.K. Total organic carbon quantification from wireline logging techniques: A case study in the Vaca Muerta Formation, Argentina. J. Pet. Sci. Eng. 2020, 194, 107489. [Google Scholar] [CrossRef]
  40. Aziz, H.; Ehsan, M.; Ali, A.; Khan, H.K.; Khan, A. Hydrocarbon source rock evaluation and quantification of organic richness from correlation of well logs and geochemical data: A case study from the sembar formation, Southern Indus Basin, Pakistan. J. Nat. Gas. Sci. Eng. 2020, 81, 103433. [Google Scholar] [CrossRef]
  41. Alizadeh, B.; Maroufi, K.; Heidarifard, M.H. Estimating source rock parameters using wireline data: An example from Dezful Embayment, South West of Iran. J. Pet. Sci. Eng. 2018, 167, 857–868. [Google Scholar] [CrossRef]
  42. Wang, J.X.; Sun, P.C.; Liu, Z.J.; Xu, Y.B.; Li, L. Evaluation of oil shale resources based on geochemistry and logging in Tuanyushan, Qaidam Basin, Northwest China. Oil Shale 2020, 37, 188–206. [Google Scholar] [CrossRef]
  43. Kamalia, M.R.; Mirshady, A.A. Total organic carbon content determined from well logs using DLogR and Neuro Fuzzy techniques. J. Pet. Sci. Eng. 2004, 45, 141–148. [Google Scholar] [CrossRef]
  44. Zhu, G.Y.; Jin, Q.; Zhang, L.H. Using Log Information to Analyze the Geochemical Characteristics of Source Rocks in Jiyang Depression. WLT. Logging Technol. 2003, 27, 104–109. [Google Scholar] [CrossRef]
  45. Powell, T.G. Petroleum geochemistry and depositional setting of lacustrine source rocks. Mar. Pet. Geol. 1986, 3, 200–219. [Google Scholar] [CrossRef]
  46. Zhao, Q.Z.; Zhang, B.; Wang, X.M.; Wu, S.T.; Zhang, S.C.; Liu, W.; Wang, K.; Zhao, X. Differences in source kitchens for lacustrine in-source and out-of-source hydrocarbon accumulations. Petrol. Explor. Develop. 2021, 48, 541–554. [Google Scholar] [CrossRef]
  47. Chen, Z.; Li, X.; Chen, H.; Duan, Z.; Qiu, Z.; Zhou, X.; Hou, Y. The Characteristics of Lithofacies and Depositional Model of Fine-Grained Sedimentary Rocks in the Ordos Basin, China. Energies 2023, 16, 2390. [Google Scholar] [CrossRef]
  48. Wu, H.G.; Feng, C.C.; Kang, X.; Fu, D.W.; Feng, J.L.; Zhang, Y.F.; Zhou, J.J.; Hu, T.X. Positive and negative effects of marine transgression on the quality of lacustrine source rocks in the Upper Cretaceous Songliao Basin, China. Mar. Pet. Geol. 2023, 153, 106267. [Google Scholar] [CrossRef]
  49. Nytoft, H.P.; WesselFyhn, M.B.; Hovikoski, J.; Rizzi, M.; Abatzis, I.; Tuan, H.A.; Tung, N.T.; Huyen, N.T.; Cuong, T.X.; Nielsen, L.H. Biomarke-rs of Oligocene lacustrine source rocks, Beibuwan-Song Hong basin junction, offshore northern Vietnam. Mar. Pet. Geol. 2020, 114, 104196. [Google Scholar] [CrossRef]
  50. Ajuaba, S.; Sachsenhofer, R.F.; Meier, V.; Gross, D.; Schnyder, J.; Omodeo-Sal, S.; Moscariello, A.; Misch, D. Coaly and lacustrine hydrocarbon source rocks in Permo-Carboniferous graben deposits (Weiach well, Northern Switzerland). Mar. Pet. Geol. 2023, 150, 106147. [Google Scholar] [CrossRef]
  51. Harris, N.B.; Freeman, K.H.; Pancost, R.D.; White, T.S.; Mitchell, G.D. The character and origin of lacustrine source rocks in the Lower Cretaceous synrift section, Congo Basin, west Africa. AAPG Bull. 2004, 88, 1118–1163. [Google Scholar] [CrossRef]
  52. Parnell, J. Lacustrine petroleum source rocks in the Dinantian Oil Shale Group, Scotland: A review. Geol. Soc. Lond. Spec. Publ. 1988, 40, 235–246. [Google Scholar] [CrossRef]
  53. Röth, J.; Baniasad, A.; Froidl, F.; Ostlender, J.; Boreham, C.; Hall, L.; Littke, R.; Baniasad, A.; Froidl, F.; Ostlender, J.; et al. The Birkhead and Murta formations—Organic geochemistry and organic petrography of Mesozoic fuvio-lacustrine source rocks in the Eromanga Basin, central Australia. Int. J. Earth Sci. 2023, 112, 265–295. [Google Scholar] [CrossRef]
  54. Rddad, L. Hydrocarbon Potential of the Triassic Lacustrine Source Rocks in the Newark Basin, USA. J. Energy Environ. Chem. Eng. 2019, 4, 47–53. [Google Scholar] [CrossRef]
  55. Liu, L.; Pan, H.P.; Lin, Z.Z.; Zhang, S.H.; Qin, Z.; Li, J.W.; Huang, G.S.; Wang, L.; Li, D. Reservoir characteristics and logging evaluation of gas−bearing mudstone in the south of north china plain. Sci. Rep. 2020, 10, 8791. [Google Scholar] [CrossRef]
  56. Hart, B.S.; Acquaker, J.H.S.; Taylor, K.G. Mudstone (“shale”) depositional and diagenetic processes: Implications for seismic analyses of source-rock reservoirs. Interpretation 2013, 1, 7–26. [Google Scholar] [CrossRef]
  57. Zhao, L.; Li, Y.; Zou, C.; Zhao, S.; Wu, C. Paleoenvironmental characteristics and organic matter enrichment mechanisms of the upper Ordovician-lower Silurian organic-rich black shales in the Yangtze foreland basin, South China. Front. Earth 2023, 11, 1237495. [Google Scholar] [CrossRef]
Figure 1. Location of the research area and target horizon. ((a) is the location map of the research area; (b) is the lithological histogram of Chang 7) [2].
Minerals 14 00303 g001
Figure 2. Oil Shale, Li285 Well, 2167.85 m.
Minerals 14 00303 g002
Figure 3. Black mudstone, Li338 well, 2308.88 m.
Minerals 14 00303 g003
Figure 4. X-ray diffraction analysis of mineral composition in Chang 7 shale and black mudstone (Well Cheng 1). (a) Mineral content of shale and mudstone; (b) The clay content of shale and mudstone.
Minerals 14 00303 g004
Figure 5. Comparison of organic matter abundance of source rocks of different lithologies in the Chang 7 member of the Heshui area. (a) Histogram of TOC content distribution in shale and mudstone; (b) Comparison chart of TOC content and hydrocarbon generation potential (S1 + S2) between shale and mudstone.
Minerals 14 00303 g005
Figure 6. Plot of hydrogen index vs. Oxygen index (according to Tissot et al. 1984 [35]) in the Chang 7 source rocks of the Heshui.
Minerals 14 00303 g006
Figure 7. Relationship between vitrinite reflectance and depth of Yanchang Formation source rocks in Heshui region.
Minerals 14 00303 g007
Figure 8. Logging response characteristics of hydrocarbon source rocks in Chang 7 (Well Zhuang 230).
Minerals 14 00303 g008
Figure 9. Thickness distribution map of Chang 7 mudstone in Heshui area (T-Thickness; (a) Thickness distribution of Chang 73 mudstone; (b) Thickness distribution of Chang 72 mudstone; (c) Thickness distribution of Chang 71 mudstone).
Minerals 14 00303 g009
Figure 10. Distribution of thickness of Chang 7 black shale in Heshui area. (T-Thickness; (a) Thickness map of Chang 73 shale; (b) Thickness map of Chang 72 shale; (c) Thickness map of Chang 71 shale).
Minerals 14 00303 g010
Figure 11. Relationship between measured TOC and calculated TOC of Chang 7 source rocks in Heshui area.
Minerals 14 00303 g011
Figure 12. Matching effect of measured TOC and calculated TOC of source rocks in Well Li68.
Minerals 14 00303 g012
Figure 13. Distribution of Chang 7 TOC in Heshui District ((a) Distribution characteristics of TOC in Chang 73; (b) Distribution characteristics of TOC in Chang 72; (c) Distribution characteristics of TOC in Chang 71).
Minerals 14 00303 g013
Figure 14. Comparison of hydrocarbon generation potential between source rocks in the Chang 7 section of the Heshui area and lacustrine source rocks in other regions [48,49,50,51,52,53,54].
Minerals 14 00303 g014
Figure 15. Fine-grained sedimentary system and distribution pattern of rich organic matter in the Chang 7 member of the Triassic in the Ordos Basin.
Minerals 14 00303 g015
Table 1. Evaluation criteria for organic matter abundance of source rocks [21].
IndexSource Rock
PoorFairGoodVery GoodExcellent
TOC (wt.%)<0.50.5–1.01.0–2.02.0–4.0>4.0
Rock-Eval PyrolysisS1 (mg HC/g rock)0–0.50.5–11–22–4>4
S2 (mg HC/g rock)0–2.52.5–55–1010–20>20
Table 2. a (%), b (%), c (%) and d (%) represent the volume percentages of huminite, liptinite, vitrinite and inertinite maceral groups, respectively. Kerogen type index (KTI) = (100 × a + 50 × b − 75 × c − 100 × d)/100. The organic matter is predominantly type III (KTI < 0), the organic matter is predominantly type II2 (0 ≤ KTI < 40), the organic matter is predominantly type II1 (40 ≤ KTI < 80), the organic matter is predominantly type I (KTI ≥ 80).
SampleDepth(m)Lithologya (%)b (%)c (%)d (%)KTIOrganic Matter Type
X36-12175.0Shale90.40.86.62.283.7I
X36-22175.4Shale98.401.6097.2I
Z2331785.9Shale7.068.018.07.021.0II2
Z891956.9Shale7.059.021.013.08.0II2
M342295.0Mudstone87.81.410.00.880.2II1
L338-12269.6Mudstone35.056.04.05.055.0II1
L338-22308.1Mudstone37.052.05.06.053.0II1
L338-32324.1Mudstone15.063.017.05.029.0II2
L3042495.2Mudstone9.052.018.021.01.0II2
N1051527.7Mudstone9.058.023.010.011.0II2
N331655.4Mudstone30.058.09.03.049.0II1
X2882116.3Mudstone57.036.06.01.070.0II1
X2911982.2Mudstone19.065.012.04.039.0II2
X3182026.9Mudstone10.067.018.05.025.0II2
Table 3. Main geochemical characteristics of pyrolysis study on Chang 7 member, as determined by Rock-Eval analysis.
SampleDepth (m)LithologyTmax (°C)S1 (mg
HC/g)
S2 (mg
HC/g)
S3 (mg CO2/g rock)TOC (wt %)HI (mg HC/g
org C)
OI (mg CO2/g org C)
D49-11533.2 Mudstone4481.65 6.67 0.02 3.24205.860.62
D49-21533.6 Mudstone4512.02 10.02 0.06 3.95253.671.52
D49-31534.1 Mudstone4463.91 17.10 0.13 3.37507.423.86
D49-41534.5 Mudstone4411.95 0.07 0.00 3.18220.132.2
D49-51535.1 Mudstone4451.64 7.22 0.09 3.07235.182.93
D49-61535.5 Mudstone4392.16 7.65 0.14 3.23236.844.33
D49-71535.7 Mudstone4461.93 8.75 0.16 3.12280.455.13
D49-81536.8 Mudstone4492.18 9.91 0.09 3.64272.252.47
D49-91537.1 Mudstone4512.76 9.99 0.02 4.54220.040.44
H1582117.4 Mudstone4481.37 9.38 0.21 3.65256.995.75
M14-12120.8 Shale4471.44 12.88 0.00 4.39293.390
M14-22120.8 Shale4481.49 12.71 0.93 4.44286.2620.95
M14-32122.2 Shale4492.27 48.13 0.00 11.61414.560
M14-42122.2 Shale4492.27 48.13 0.00 11.61414.560
M14-52123.3 Shale4462.33 40.43 0.05 10.15298.330.49
M14-62123.3 Shale4473.83 82.31 1.31 19.38424.726.76
M14-72124.4 Shale4472.60 45.80 0.72 10.98417.126.56
M14-82124.4 Shale4472.60 45.80 0.72 10.98417.126.56
X36-12175.0 Shale4543.56 18.67 0.27 5.21358.355.18
X36-22175.4 Shale4524.34 18.86 0.16 5.49343.532.91
L572246.0 Shale4473.60 27.20 0.05 15.3177.780.33
M342295.0 Mudstone4422.15 8.15 0.30 3.54230.238.47
L38-12324.6 Mudstone4470.61 6.73 0.47 2.87234.4916.38
L38-22325.0 Shale4463.24 71.63 0.51 20.5349.412.49
L38-32326.0 Shale4381.52 15.41 0.47 5308.29.4
L38-42326.5 Shale4461.28 13.34 0.41 4.34307.379.45
L38-52327.5 Shale4341.54 13.27 0.30 4.4301.596.82
L38-62328.0 Shale4442.49 45.42 0.42 13.4338.963.13
L38-72328.8 Shale4462.73 70.89 0.34 19.1371.151.78
L38-82329.1 Shale4462.46 62.08 0.41 17.4356.782.36
L38-92329.5 Shale4463.13 86.08 0.65 22.14388.82.94
L38-102330.2 Shale4224.27 8.74 0.24 3.75233.076.4
L38-112331.0 Shale4423.72 60.69 0.47 20.9290.382.25
L38-122331.4 Shale4424.33 80.89 0.55 24.86325.382.21
L38-132332.0 Shale4414.39 93.07 0.80 24.18384.93.31
L57-12348.8 Shale4454.04 39.69 0.00 14.02283.10
L57-22349.1 Shale4455.76 66.97 0.00 13.91481.450
L57-32349.5 Shale4407.56 68.20 0.04 21.37319.140.19
L57-42350.1 Shale4454.36 51.16 0.00 26.18195.420
L57-52351.1 Shale4435.65 93.00 0.03 15.3607.840.2
L57-62353.0 Shale4482.59 39.37 0.15 26.63147.840.56
L57-72353.3 Shale4472.17 38.17 0.04 11.01346.680.36
L57-82353.8 Shale4493.19 53.46 0.00 10.68500.560
M13-12488.7 Mudstone4424.60 16.32 0.00 4.87335.110
M13-22488.7 Mudstone4435.56 17.29 1.10 5.29326.8420.79
M13-32489.7 Mudstone4423.45 9.83 0.54 3.13314.0617.25
M13-42489.7 Mudstone4423.45 9.83 0.54 3.13314.0617.25
M13-52490.7 Mudstone4454.94 17.81 0.00 4.69379.740
M13-62490.7 Mudstone4423.84 10.90 0.59 3.3330.317.88
M13-72491.7 Mudstone4434.11 12.08 0.63 3.45350.1418.26
M13-82491.7 Mudstone4434.11 12.08 0.63 3.45350.1418.26
M13-92492.7 Mudstone4465.59 19.03 0.90 5.72332.6915.73
M13-102492.7 Mudstone4465.59 19.03 0.90 5.72332.6915.73
M13-112493.5 Mudstone4344.87 11.49 0.76 3.5328.2921.71
C962614.9 Mudstone4001.71 2.38 0.11 1.09218.3510.09
Table 4. Evaluation criteria for maturity of organic matter of terrestrial source rocks [21].
Evolution StageRo/%Tmax/°C
Immature0.2–0.6<435
Early mature0.6~0.65435~445
Peak mature0.65~0.9445~450
Late Mature0.9~1.35450~470
Postmature>1.35>470
Table 5. Logging responses and characteristics of source rocks in the Chang 7 member.
LithologyBorehole Diameter (cm)Spontaneous Potential Logginggamma Logging (API)Acoustic Logging
(us/m)
Neutron Logging (%)Density Logging (g/cm2)Resistivity Logging
(Ohm Meter)
ShaleGreater than the drill bit diameterLow spontaneous potential logging>200250–38030–702.0–2.3>80
Black mudstoneGreater than the drill bit diameterBaseline Natural Potential<150>30020–602.2–2.7<40
SandstoneLess than or equal to the drill bit diameterNoticeably abnormal<100200–25020–302.1–2.530–50
Table 6. Differences in sedimentary facies fabrics between mudstone and shale in the Chang 7 member of the Heshui area of the Ordos Basin.
Rock TypeColorBedding StructuresSand ContentPetrographic CompositionClay Mineral ContentQartz and Feldspar Content
MudstoneLight gray, grayBlock bedding and horizontal bedding5%–20%Clay minerals, quartz, feldspar, siderite, etc.Less than 50%Greater than 40%
Shaleark gray, blackPage structureLess than 5%Clay minerals, quartz, feldspar, pyrite, etc.Greater than 50%Less than 40%
Table 7. Differences in geochemical characteristics between mudstones and shales in the Chang 7 member of the Ordos Basin.
Rock TypeAverage TOC (%)Kerogen TypeS1 + S2 (mg HC/g Rock)S3 (mg CO2/g Rock)S4 (mg Inert Carbon/g Rock)PGHI (mg HC/g Toc)PC (%)D
Mudstone2.21II1-II28.290.5530.830.19143.960.6614.47
Shale10.63I-II162.880.26131.930.12296.205.3027.20
Disclaimer/Publisher’s Note: The statements, opinions and data contained in all publications are solely those of the individual author(s) and contributor(s) and not of MDPI and/or the editor(s). MDPI and/or the editor(s) disclaim responsibility for any injury to people or property resulting from any ideas, methods, instructions or products referred to in the content.

