Article

Geological and Crystallochemical Characterization of the Margaritasite–Carnotite Mineral from the Uranium Region of Peña Blanca, Chihuahua, Mexico

by
Fabián G. Faudoa-Gómez
1,
Luis E. Fuentes-Cobas
1,
Hilda E. Esparza-Ponce
1,*,
Jesús G. Canche-Tello
1,*,
Ignacio A. Reyes-Cortés
2,
Maria E. Fuentes-Montero
3,
Diane M. Eichert
4,
Yair Rodríguez-Guerra
1 and
Maria-Elena Montero-Cabrera
1
1
Centro de Investigación en Materiales Avanzados, Miguel de Cervantes 120, Complejo Industrial Chihuahua, Chihuahua 31136, Mexico
2
Facultad de Ingeniería, Universidad Autónoma de Chihuahua, Chihuahua 31125, Mexico
3
Facultad de Ciencias Químicas, Universidad Autónoma de Chihuahua, Chihuahua 31125, Mexico
4
ELETTRA-Sincrotrone Trieste, S.S. 14 Km 163.5 in Area Science Park, Basovizza, 34149 Trieste, Italy
*
Authors to whom correspondence should be addressed.
Submission received: 19 March 2024 / Revised: 13 April 2024 / Accepted: 17 April 2024 / Published: 21 April 2024

Abstract

:
Margaritasite is a mineral compound discovered in the early 1980s in Chihuahua, Mexico. It is a natural cesium uranyl vanadate found only, so far, in the Margaritas mine of the Peña Blanca highlands. In this work, a thorough characterization of the aforementioned mineral is presented. The portfolio of the techniques employed includes high-resolution X-ray diffraction, scanning electron microscopy with energy dispersive X-ray spectroscopy, transmission electron microscopy in selected area electron diffraction (SAED) mode, and X-ray absorption spectroscopy (XAS). After extensive data analysis and modeling, new information on the mineral has been retrieved. Its phase composition is margaritasite–carnotite: a solid solution of cesium and potassium uranyl vanadate [(Cs,K)2(UO2)2(VO4)2·nH2O], and margaritasite, which is practically pure cesium uranyl vanadate [Cs2(UO2)2(VO4)2·nH2O]. The crystal structure of both components presents the space group P 1 21/c 1. Yet, each phase has similar, but appreciably different, lattice parameters. The mineral has a lamellar tabular and prismatic morphology. SAED patterns confirm the crystal structure of margaritasite. XAS spectra of Cs, V, and U confirm the elemental composition, oxidation states, and interatomic distances of this structure. These findings are consistent with the presence of cesium in this unique mineral from the paragenesis point of view.

Graphical Abstract

1. Introduction

The first uranium mineral deposits in the Sierra Peña Blanca range, Chihuahua, were localized and characterized in the 1960s by the National Nuclear Energy Commission (CNEN) of Mexico. Later, sinkholes and mining pits were opened during mining and exploration activities led by URAMEX (“Uranio Mexicano”). Potassium (carnotite), calcium (metatyuyamunite) and cesium (margaritasite) uranyl vanadates were identified in the Margaritas deposit. These activities concerning the mineral deposits were suspended in 1983 [1]. The uranium ore that was extracted and stored outside has been exposed to weathering. Since surface waters in desert floodplains can transport uranium into the environment, the minerals still present in Peña Blanca are of interest for public health reasons.
In a previous work, the synthesis of the uranyl vanadates of potassium and cesium was reported and their crystalline structures were proposed [2]. The synthesis methods were based on the mild hydrothermal reactions of uranyl pyrovanadate with alkali metal hydroxides [3,4,5].
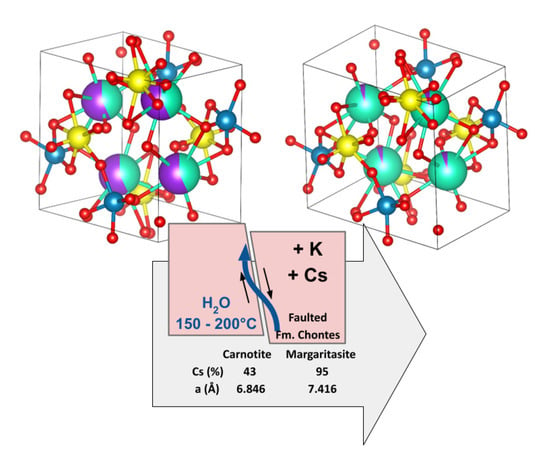
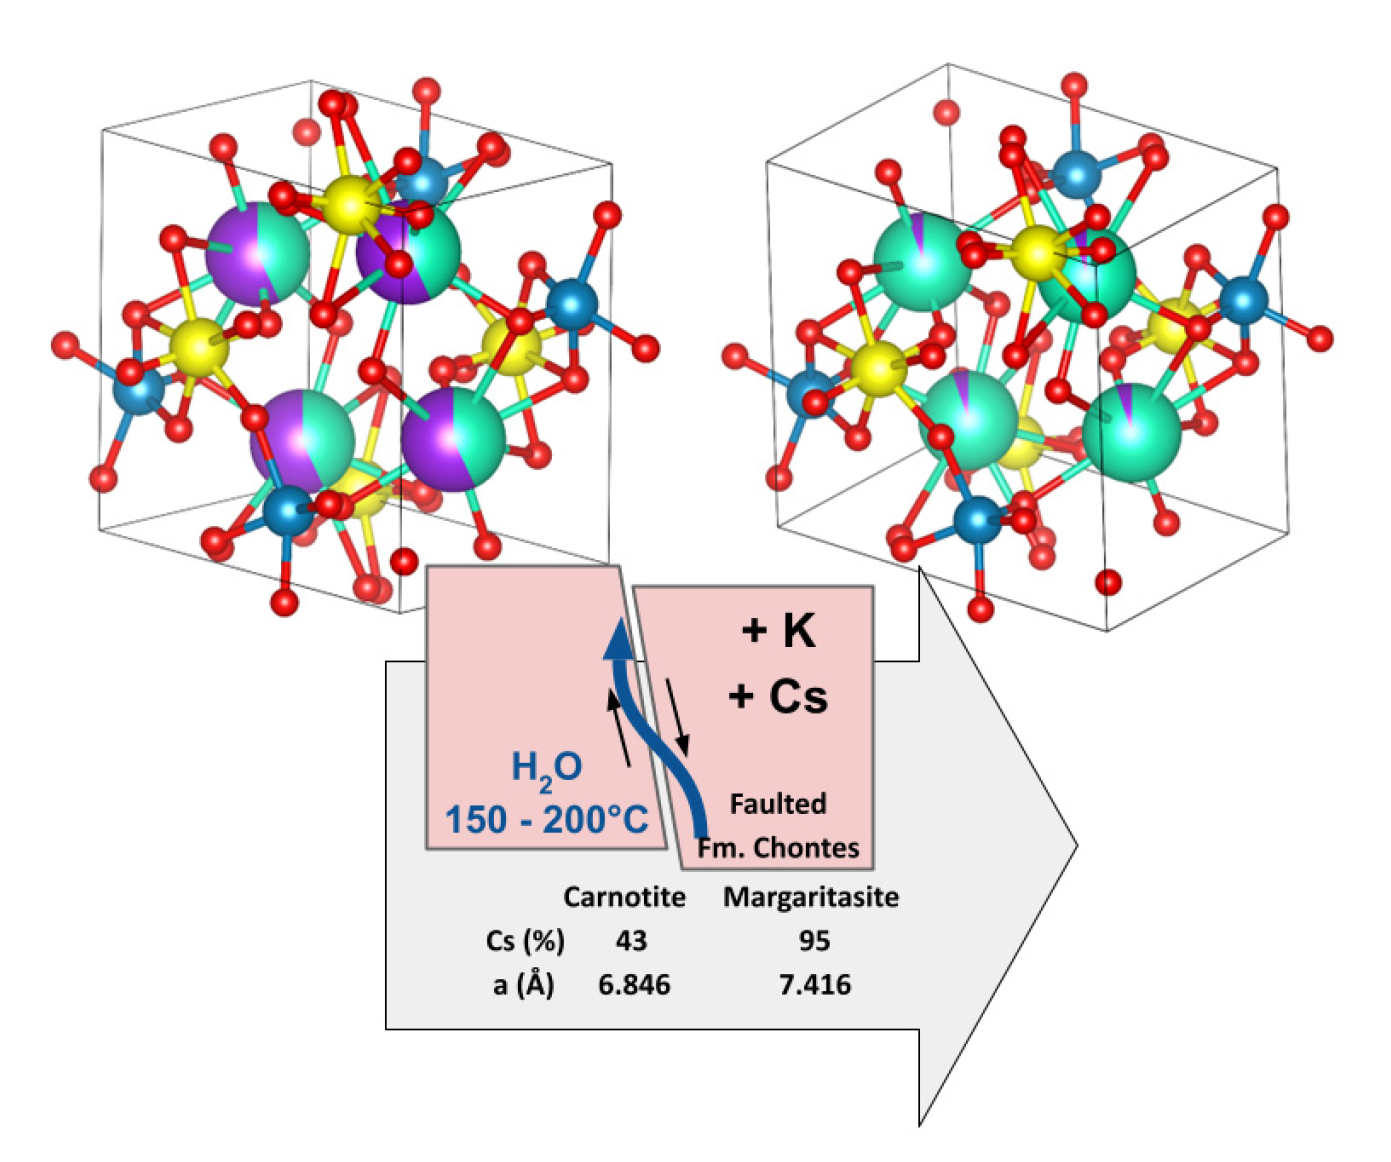
In this context, at the beginning of the 1980s, a mineral compound based on cesium uranyl vanadate was collected from the Margaritas deposit. It was named “margaritasite”. In 1982, Wenrich et al. [6] published a work on this newly discovered mineral. It was singled out and studied for the first time by various characterization methods. An interesting experiment was carried out that led to researchers obtaining margaritasite from carnotite under controlled laboratory conditions. Analytical techniques included X-ray powder diffraction and scanning electron microscopy. Diffraction experiments in [6] demonstrate that, in the samples studied in that research, both margaritasite and carnotite appear quite close to model stoichiometric phases. These authors did not find a disordered solid solution of K and Cs. A question that [6] left open is whether, under field weathering conditions, various margaritasite–carnotite solid solutions occur. To the best of our knowledge, no model has been proposed to justify the presence of cesium in the mine environment.
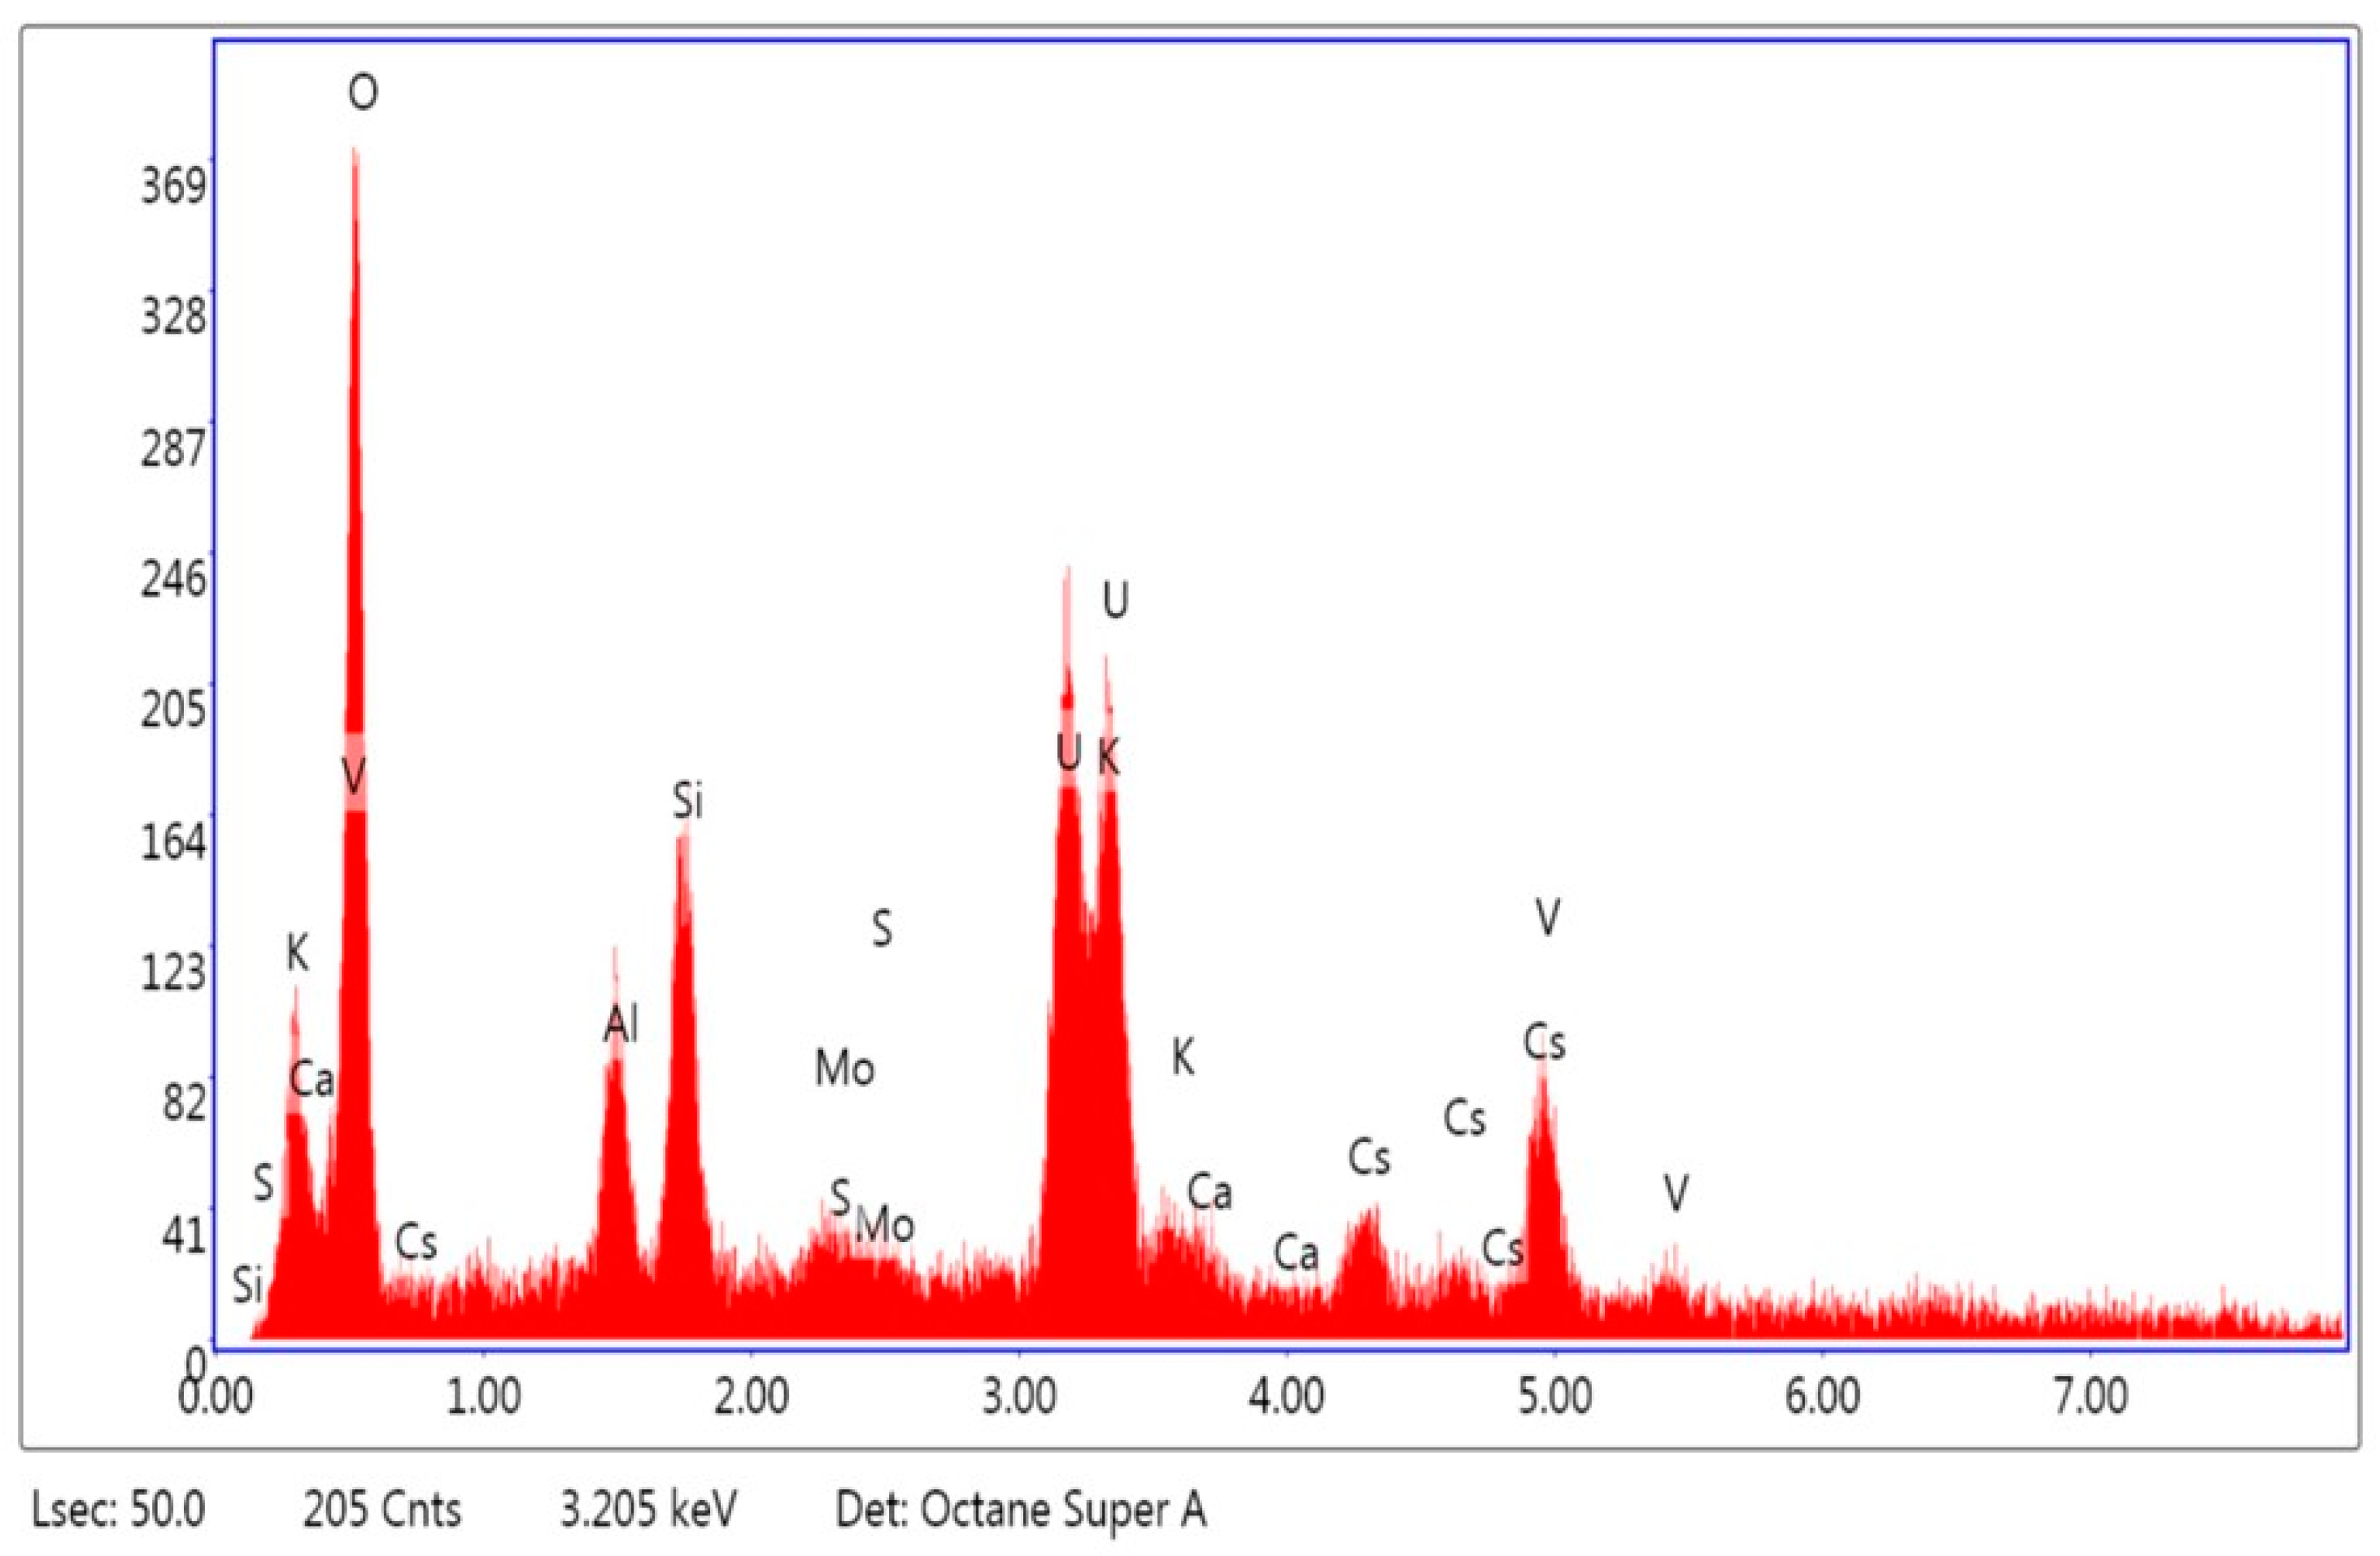
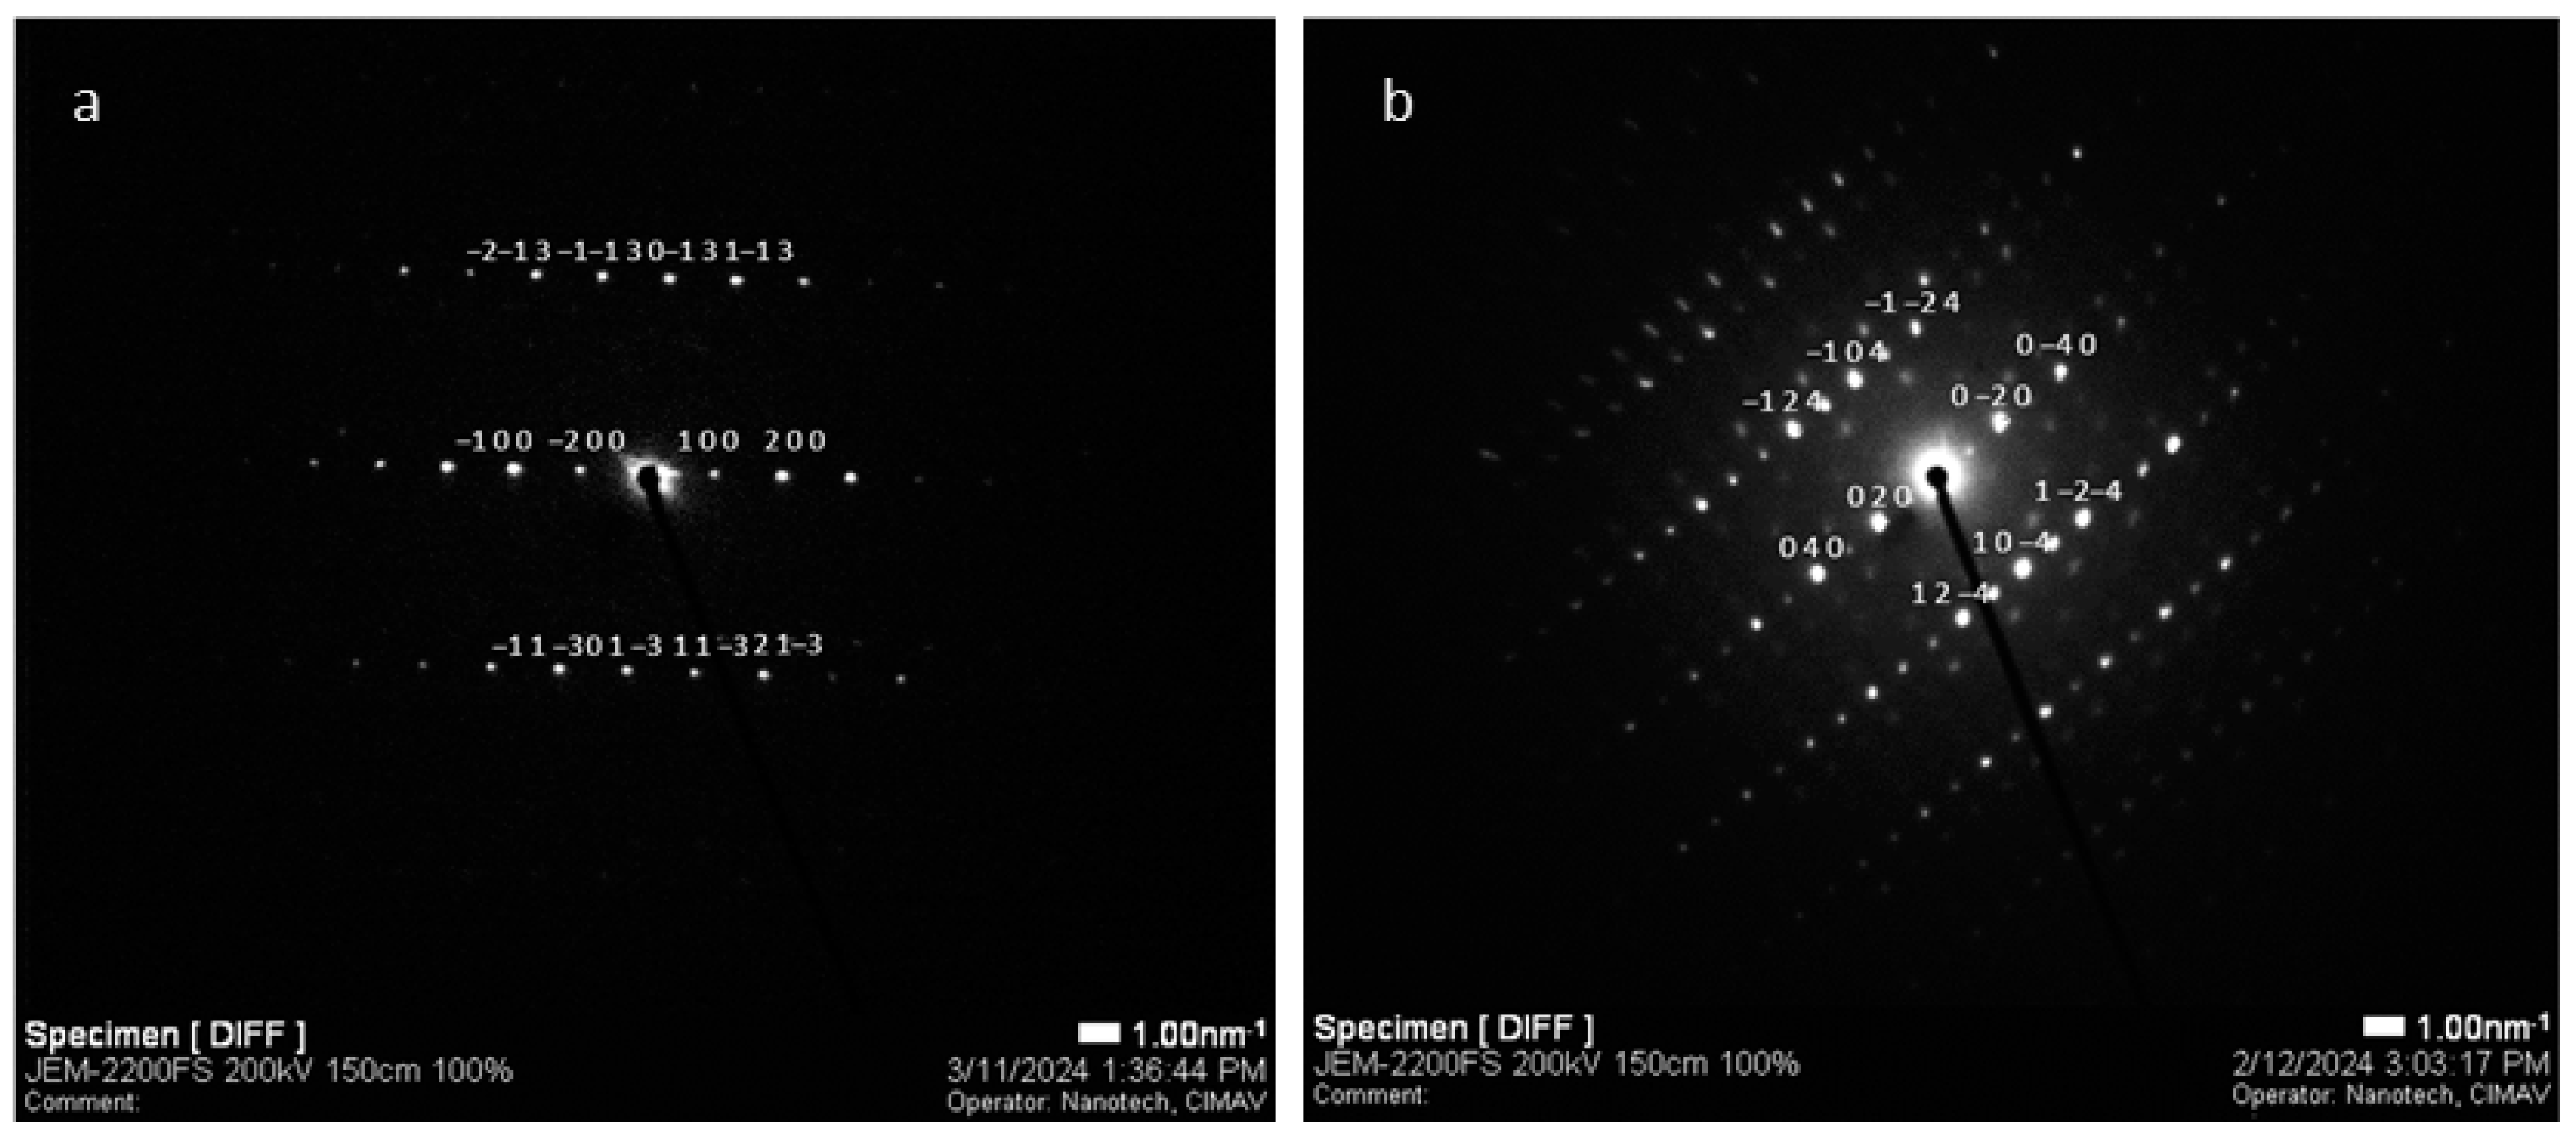
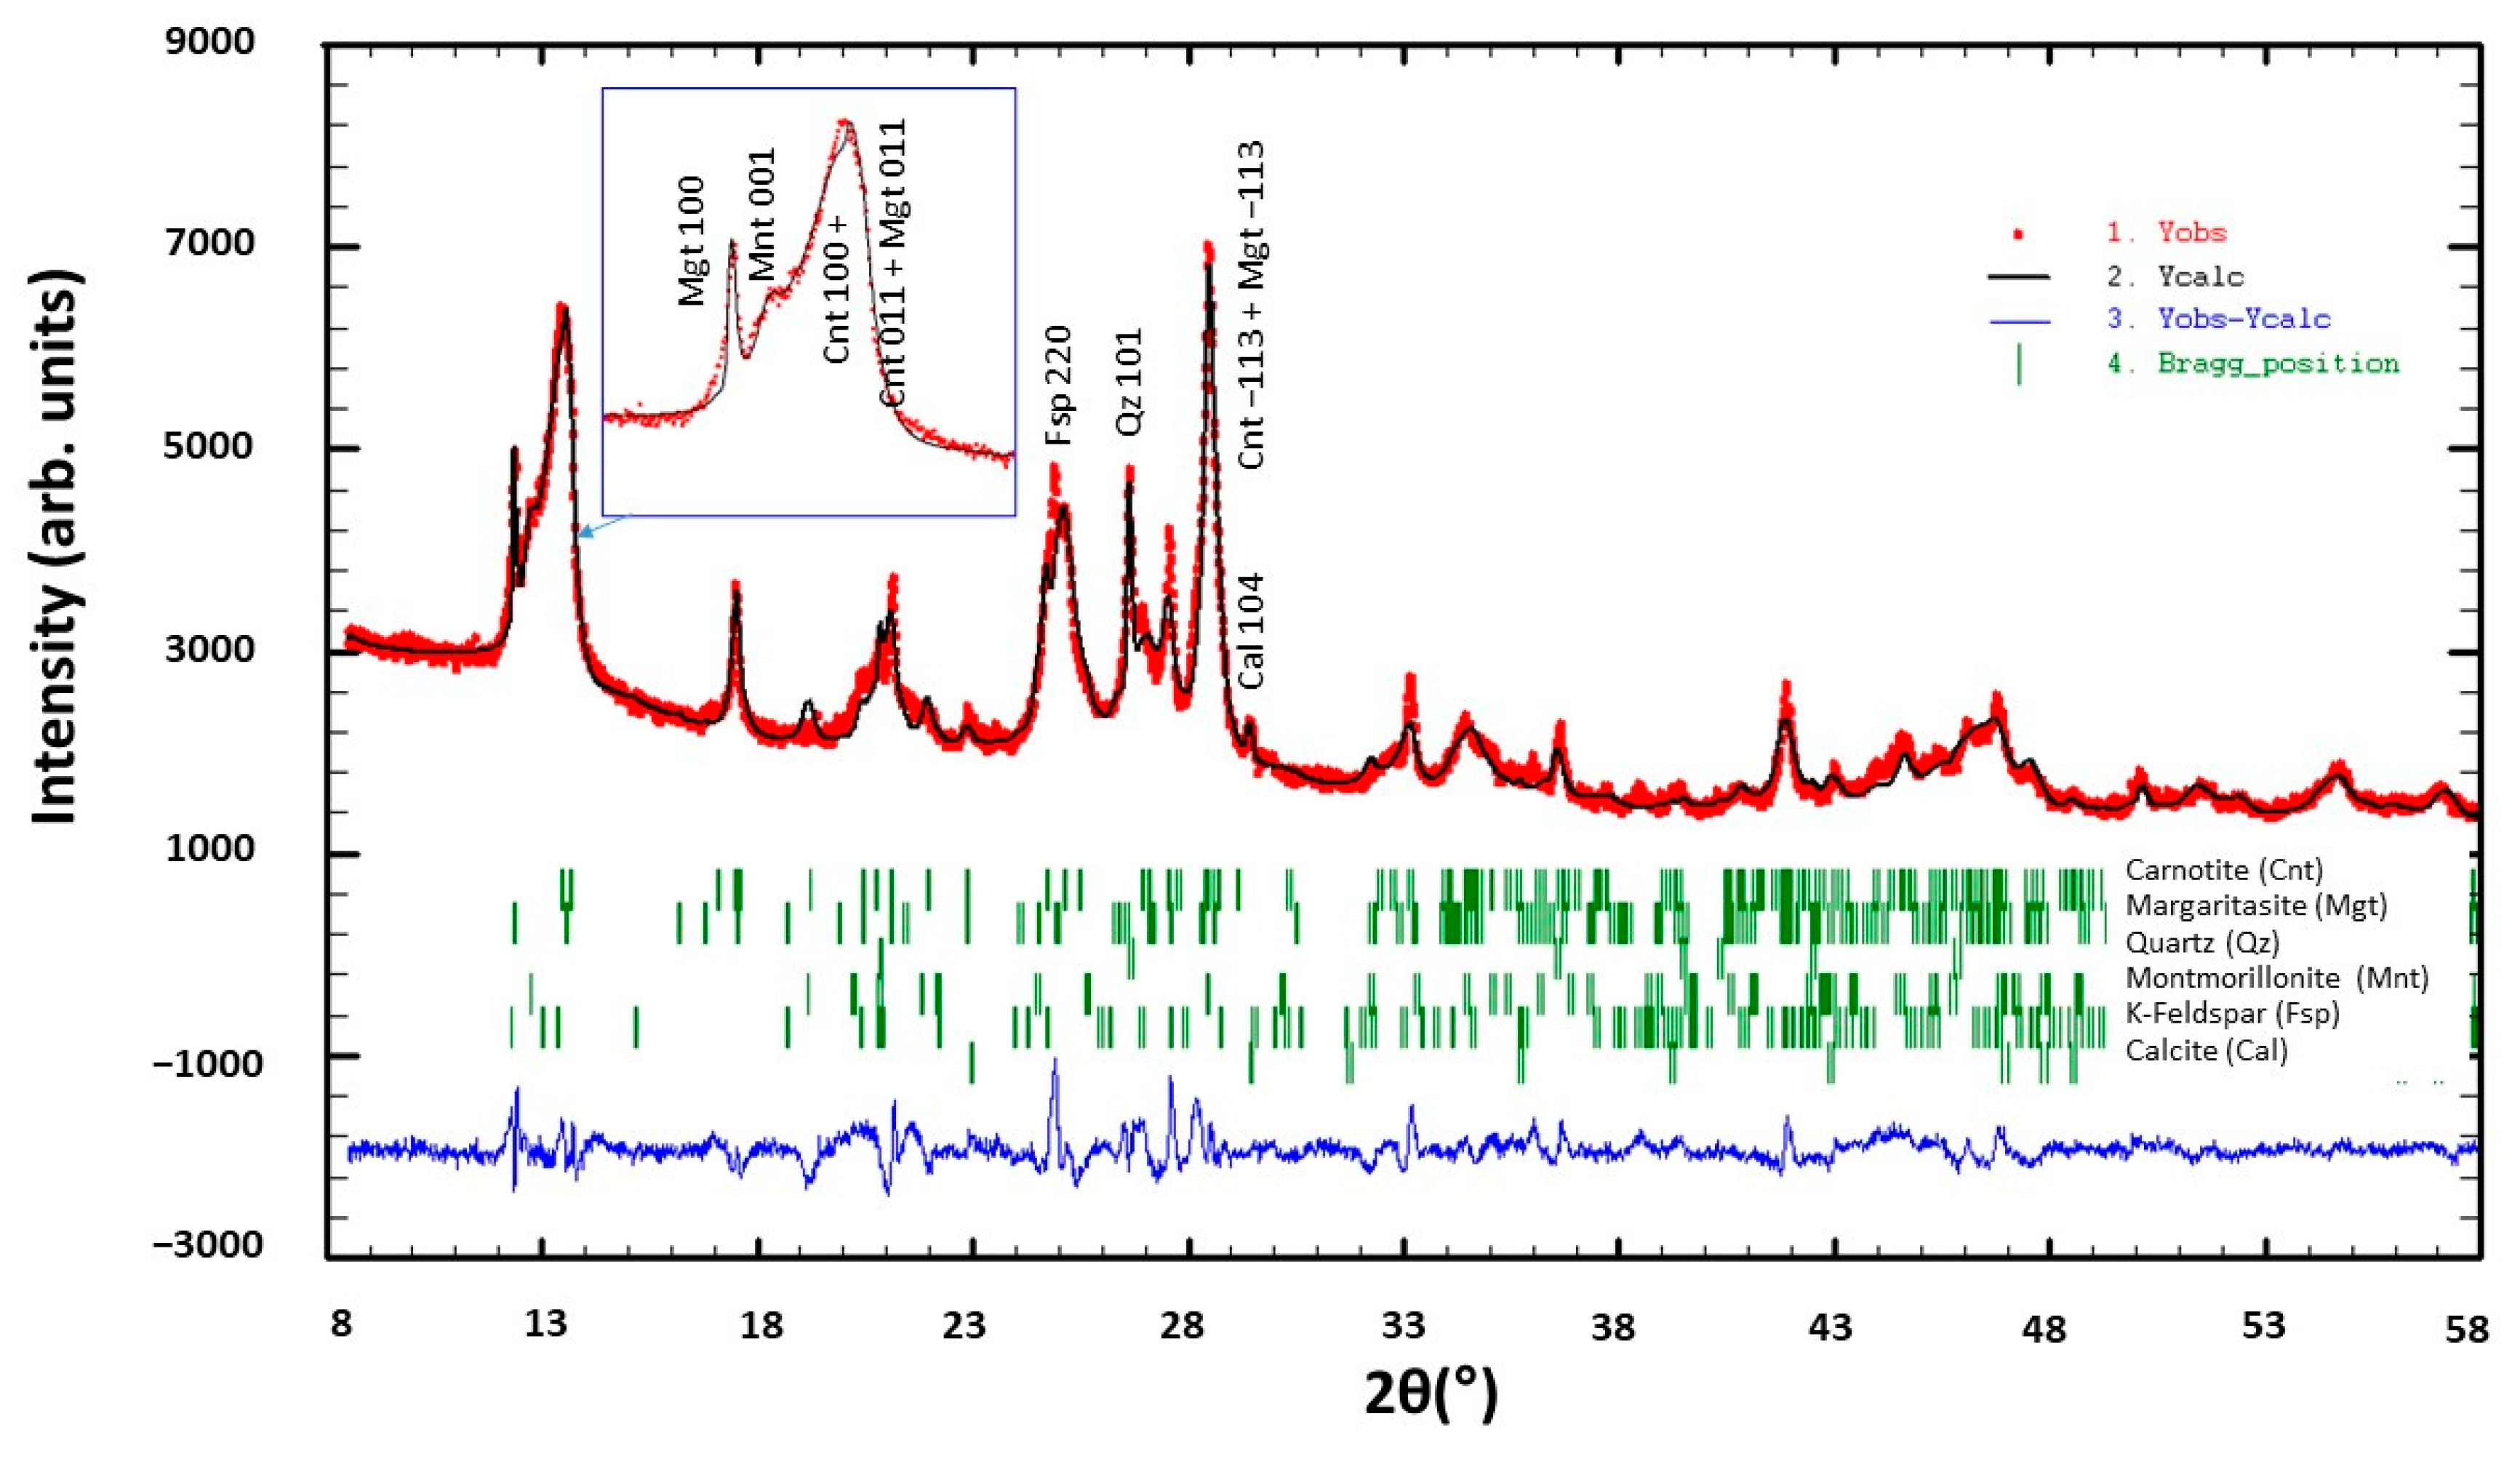
In this study, we conducted a comprehensive geological and crystallographic characterization of the natural margaritasite–carnotite-type mineral. To achieve this, we employed state-of-the-art chemical–structural techniques, including high-resolution X-ray diffraction (XRD), scanning electron microscopy (SEM) with energy dispersive X-ray spectroscopy (EDX), selected area electron diffraction (SAED), and X-ray absorption spectroscopy (XAS). These techniques were correlated to obtain a detailed and comprehensive information level on the minerals studied. Furthermore, we combined the results of the crystallographic analysis with a geological description of the uranium region and the specific Margaritas deposit. This allowed us to propose the origin of cesium and a formation model of this rare mineral, thereby contributing to the understanding of the geological and crystallographic aspects of the Margaritas deposit.

2. Uranyl Vanadates Crystallography

Burns et al. [7,8,9] proposed a structural hierarchy for uranyl compounds, built upon the types of bipyramids that UO2+2 forms with the equatorial oxygens and on the connectivity of U ions with other anionic and cationic environments. The uranyl vanadates carnotite [K2(UO2)2(VO4)2·nH2O] and margaritasite [Cs2(UO2)2(VO4)2·nH2O] are described within the sheet anion topologies containing triangles, squares, and pentagons, and more specifically, within the francevillite-type anion topology [8,
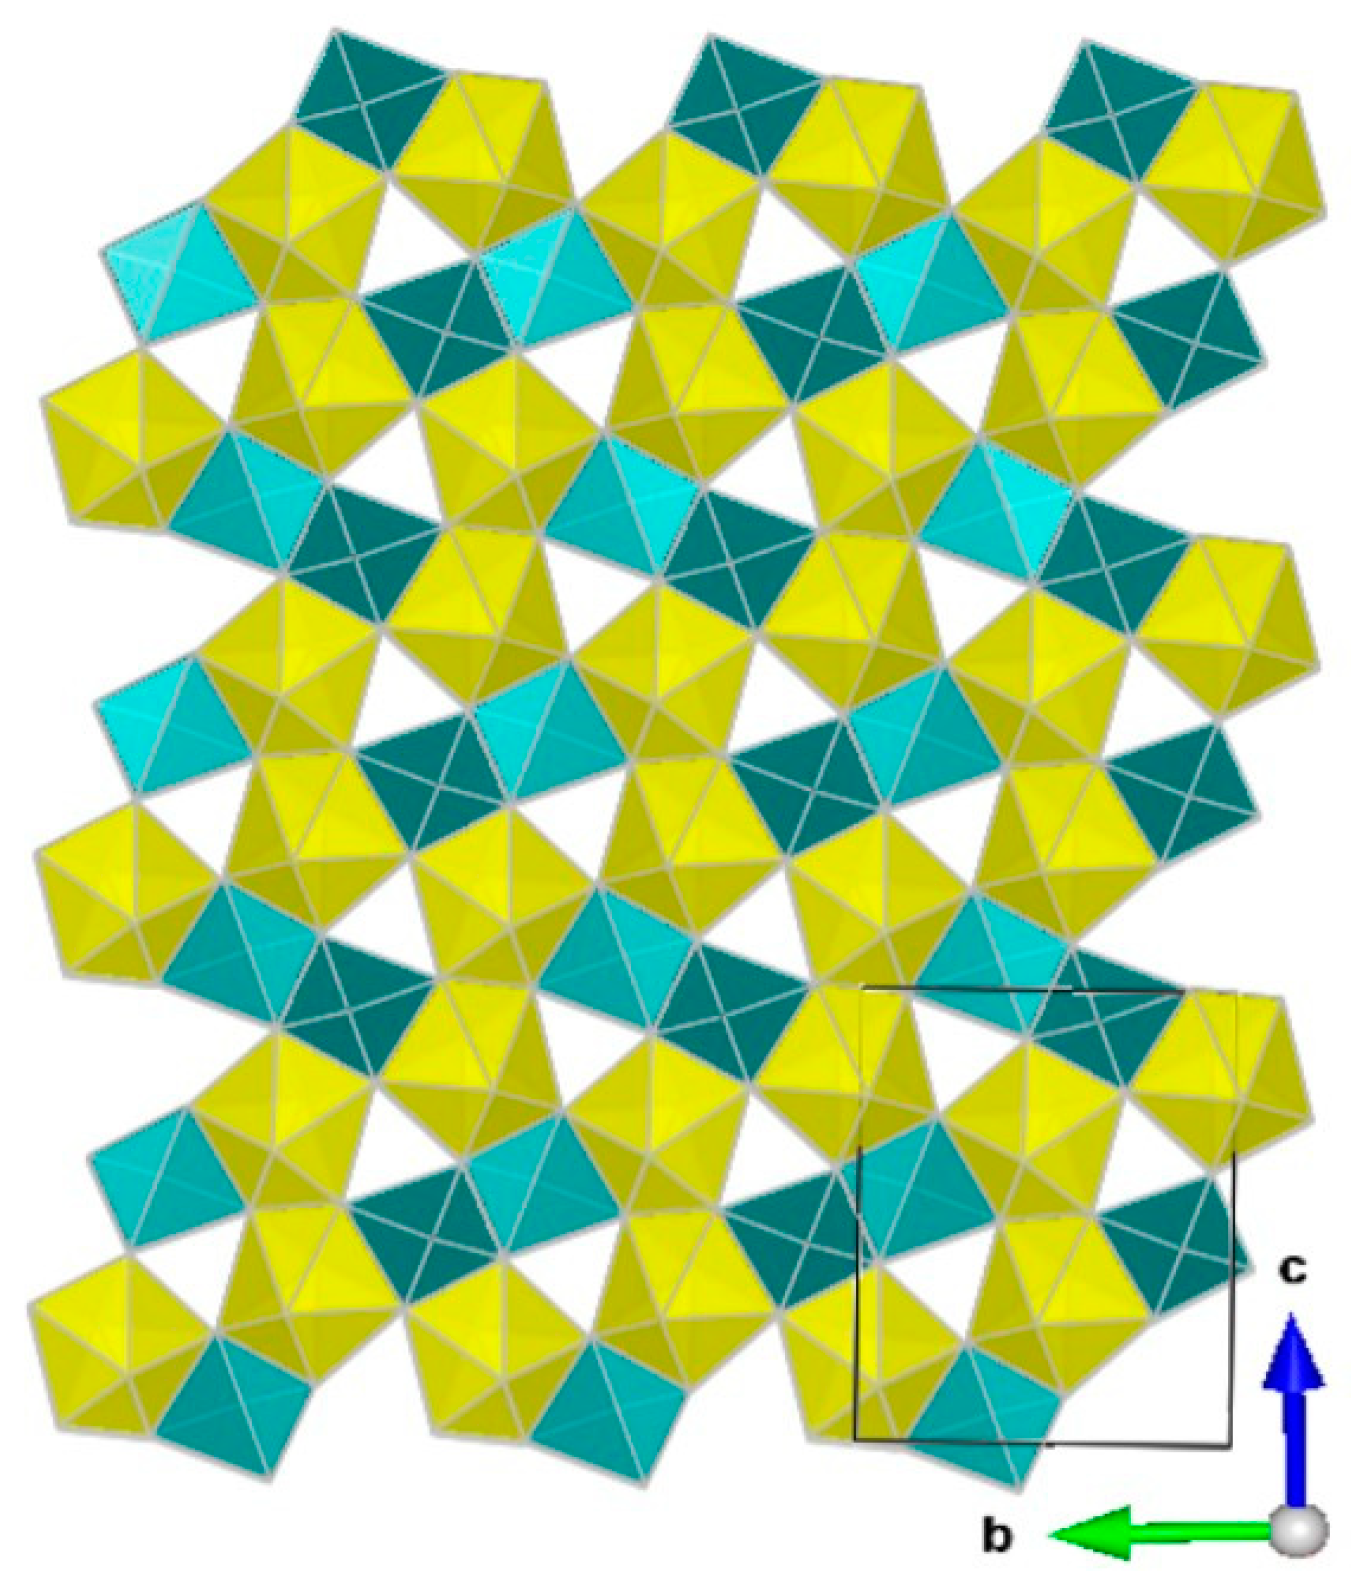
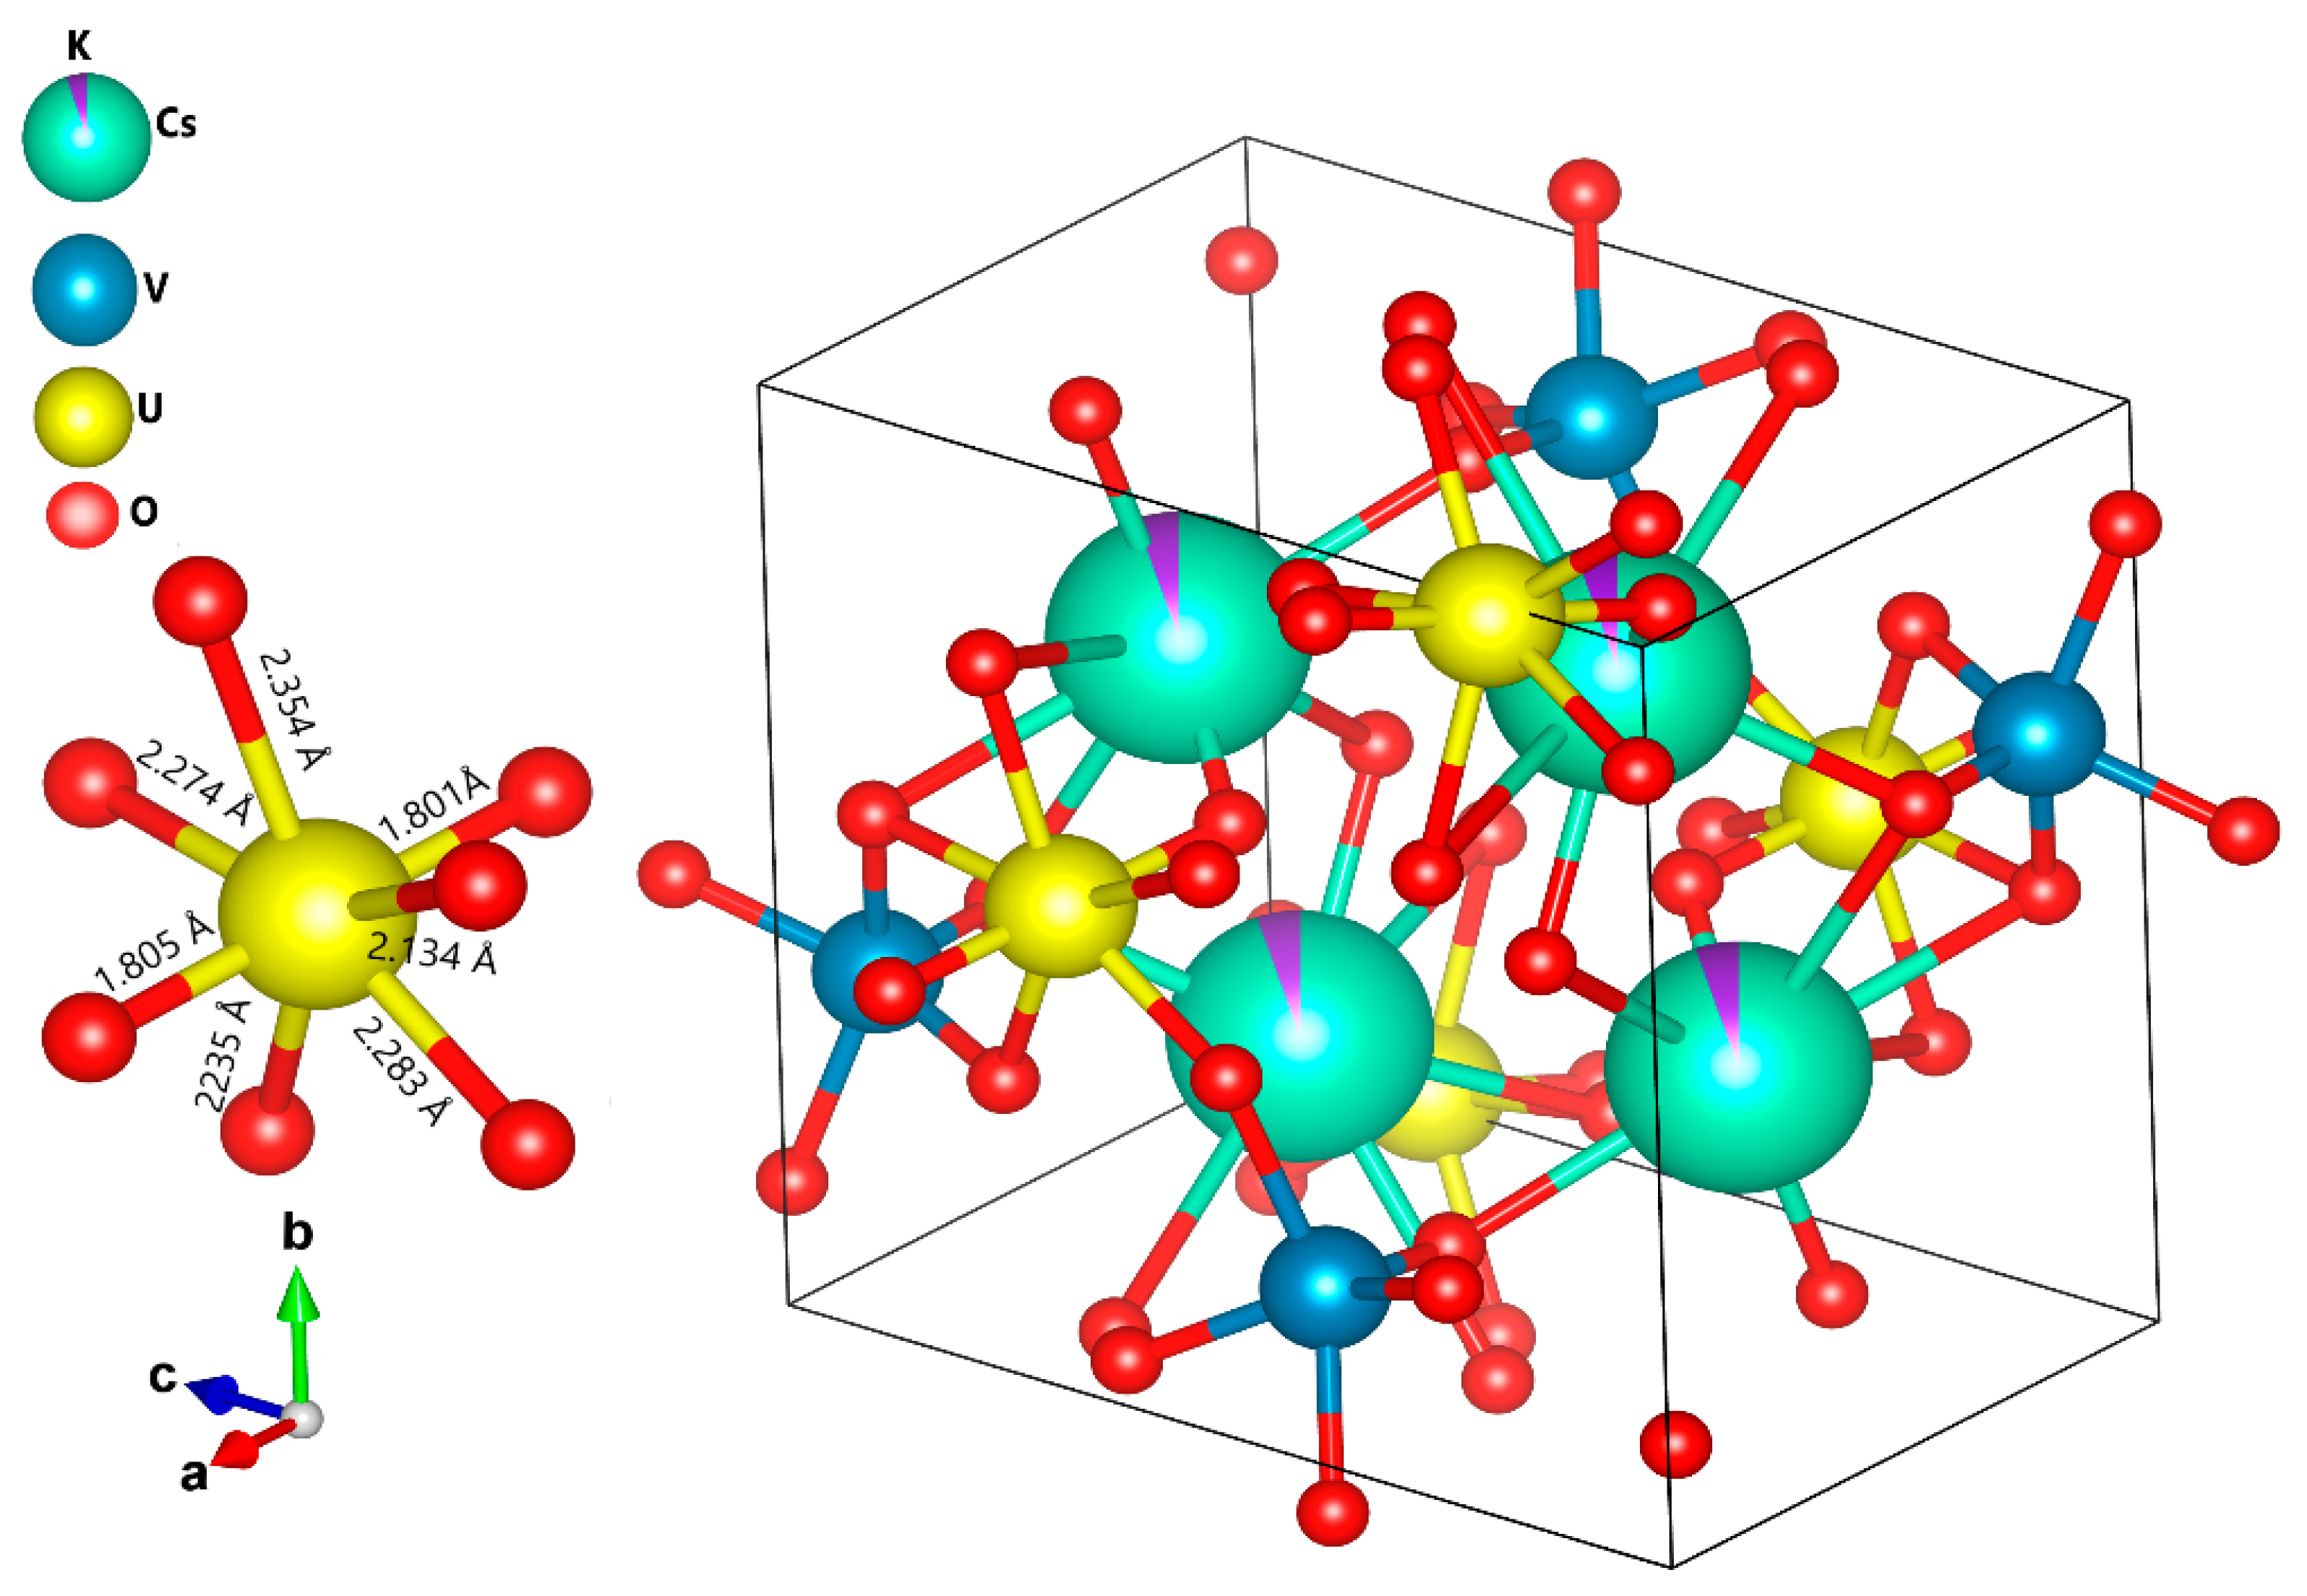
9]. The scheme of the carnotite and margaritasite structure is shown in Figure 1. It consists of two UO7 pentagonal bipyramids, with a uranyl UO2 axis, joined at one edge, which in turn are joined to another pair by a vertex and have contact with vanadium tetrahedra on their respective edges. Since the 1950s, various works dedicated to the synthesis [2,10,11], crystallographic characterization [12,13], and thermodynamics [3,14] of these uranyl vanadates have been published.
The space group of margaritasite/carnotite is number 14, according to the International Union of Crystallography classification. It corresponds to the monoclinic system. Depending on the coordinate system settings, this group may be represented by different notations. Earlier reports on margaritasite/carnotite considered alternative axis settings and applied the P 1 21/a 1 notation for the same space group. In this paper, we follow the convention of the Bilbao Crystallographic Server [15] and thus denote this symmetry group with the symbols P 1 21/c 1.

3. Geology of the Uranium Region Sierra Peña Blanca, Chihuahua

The Sierra de Peña Blanca (SPB) is a fault-block mountain range located 70 km northeast of Chihuahua city, with UTM coordinates of 395,508 east and 3,223,656 north, in zone 13R. The mountain range is about 100 km long in a north–south direction, with a width of up to 15 km, and presents many faults and fractures, resulting in an irregular and abrupt topography. Tectonic activities there have led to the formation of an ignimbrite pile, which was significantly enriched with uranium mineralization. The Peña Blanca uranium district hosts about 40% of the Mexican uranium reserves and consequently has garnered much interest for its geological–mineralogical characteristics. The uranium deposits are stratigraphically controlled in these volcanic rocks, mainly rhyolitic tuffs, and in the underlying Cretaceous rocks, with or without additional mineralization processes. Some of these main ores and their specific mineralizations are known as Nopal I, Puerto III, Domitila, and Margaritas [16].
The Nopal I ore deposit, in particular, has been widely studied, with its genesis, mineralogy and geology described by, to name a few, Goodell et al. [17,18], George-Aniel et al. [19], Angiboust et al. [20], and others [21,22,23,24,25]. Indeed, it has been a natural representative of a uranium ore repository in natural equilibrium with its environment for thousands of years, if not more.
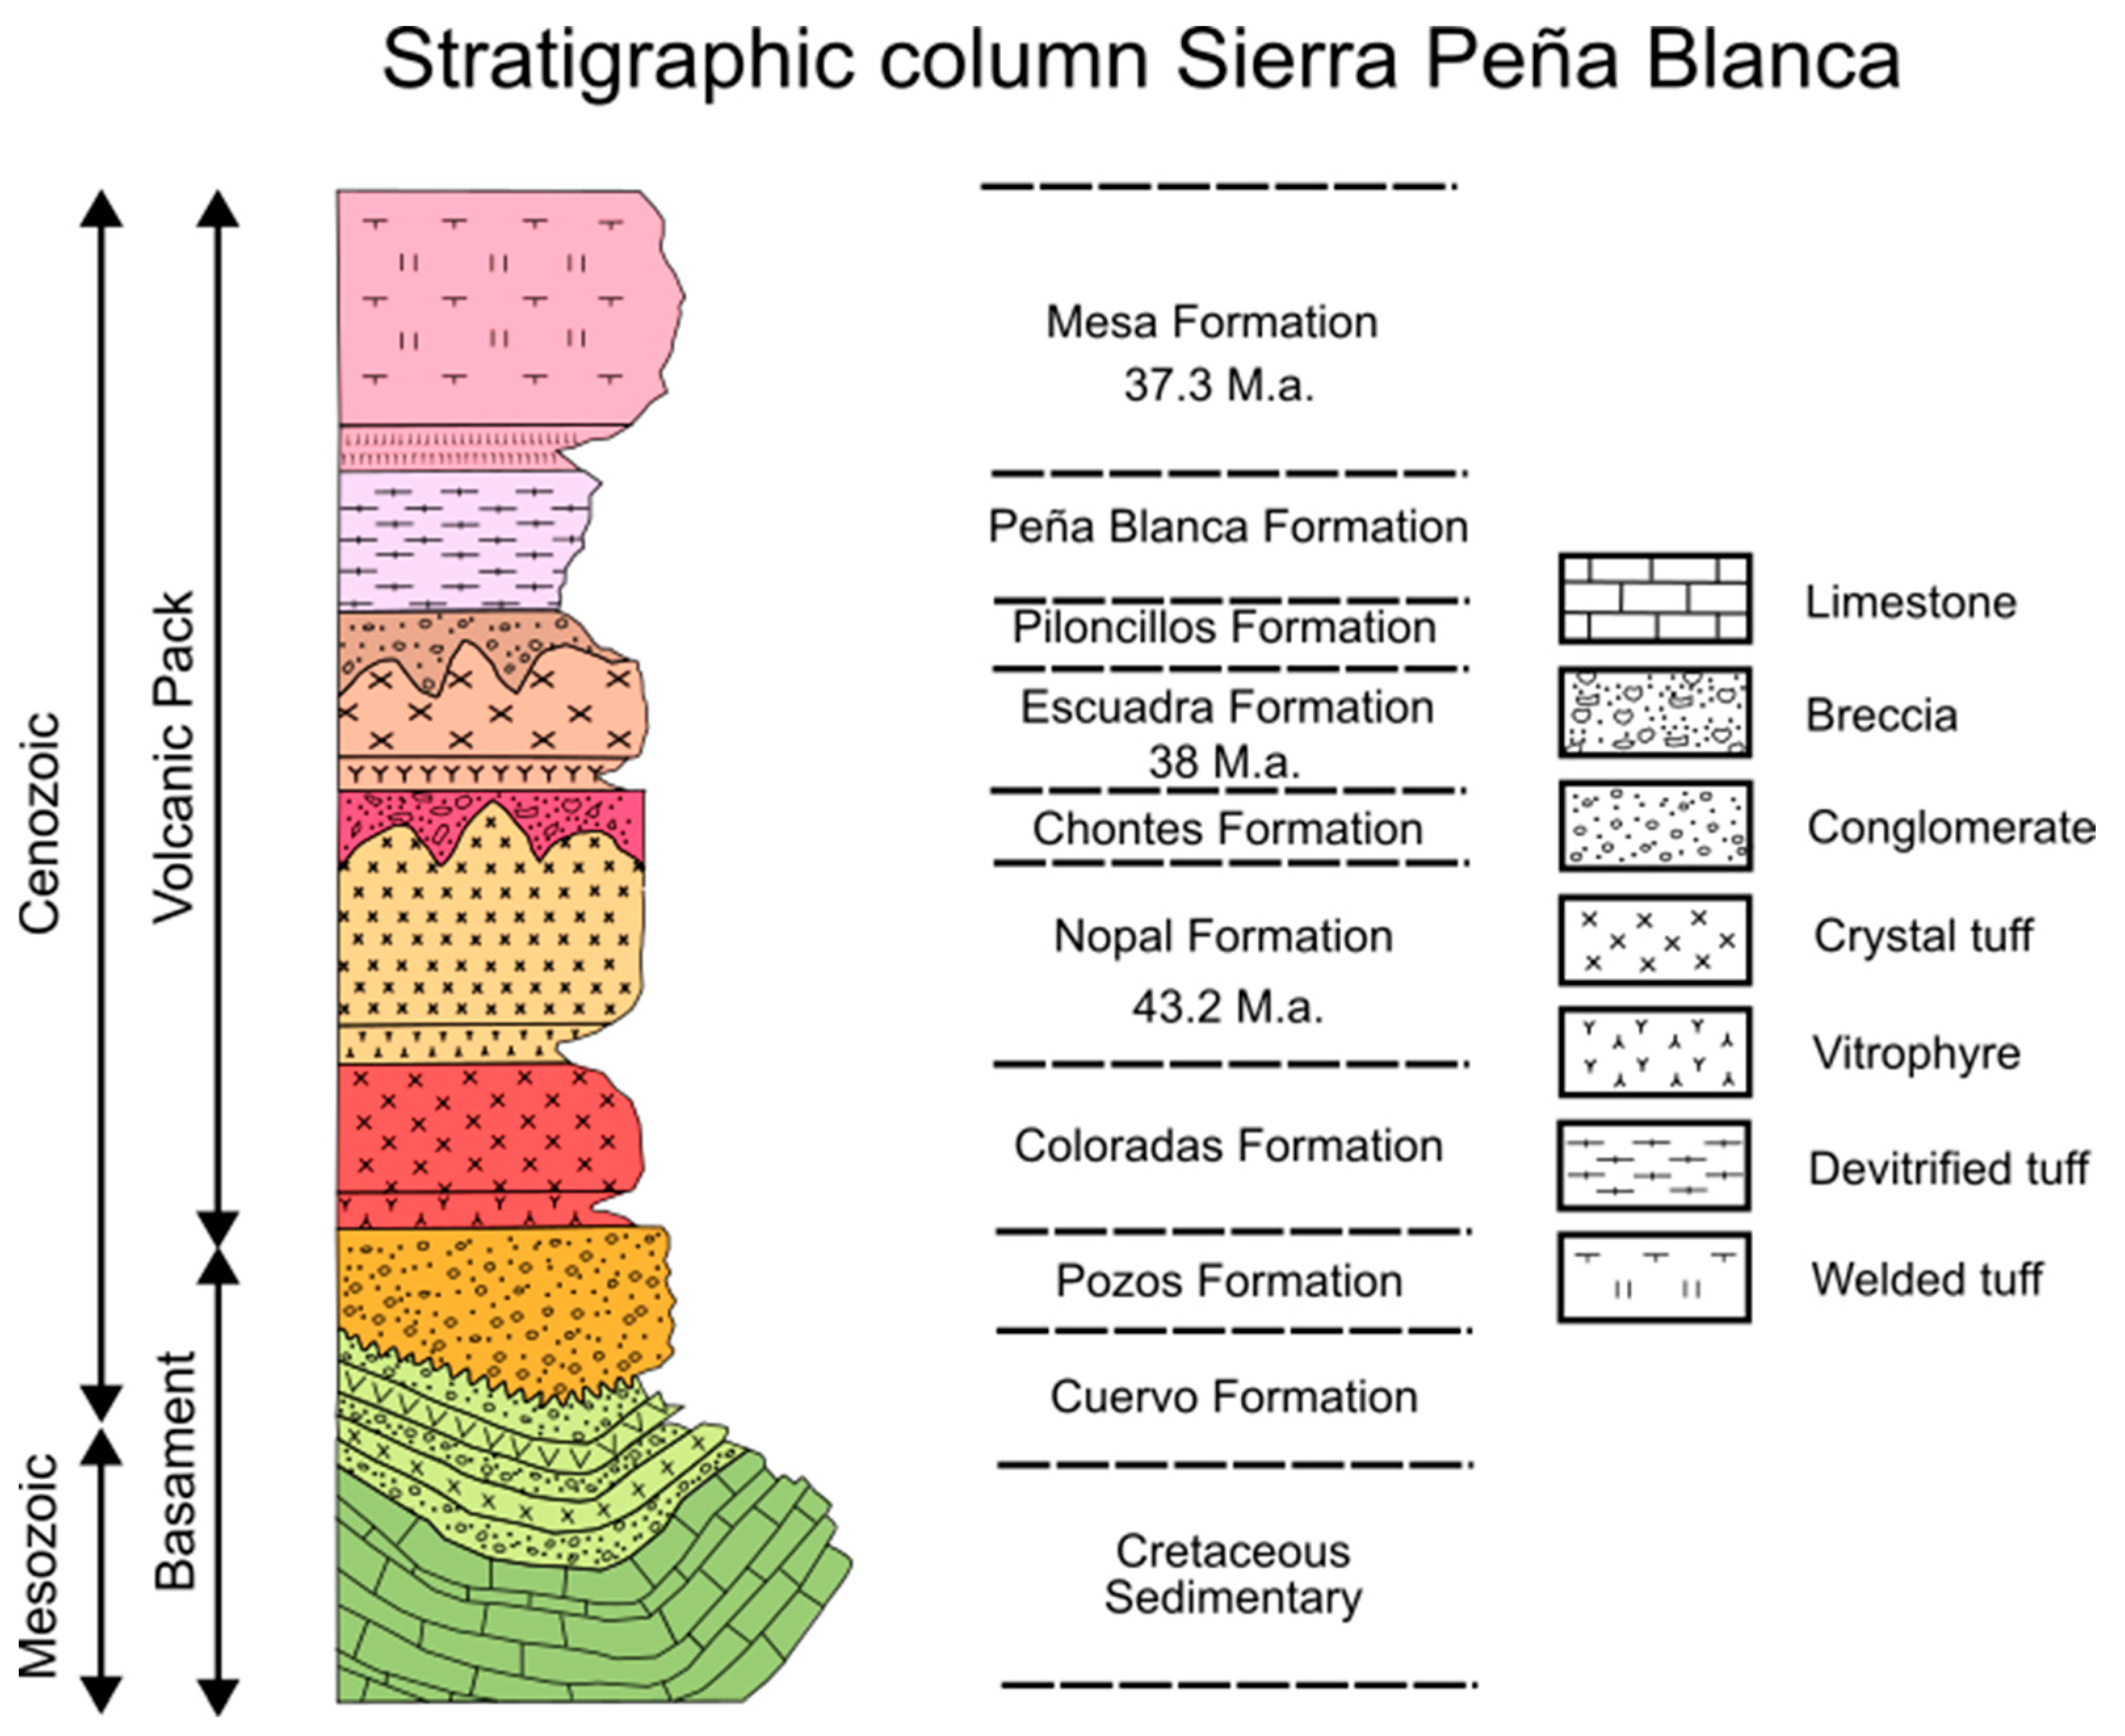
The geological basement of SPB (Figure 2) consists of three lithological units, identified as Cretaceous sedimentary, Cuervo, and Pozos formations, with an irregular and localized presence of tertiary volcanic rocks. Within those rocks are found the formations that contain uranium deposits and, thus, mining possibilities, such as in the Nopal, Escuadra, and Chontes Formations [21].
The Cretaceous sedimentary rocks are formed mainly by sandstones and siltstones, and include conglomerates of calcareous reef formations, with fossil and chert (Buda Formation). It extends out to the south and northeast of the uranium district and dates from the Albian–Cenomanian ages. The Cuervo formation rests unconformably on the Edwards Formation. In the uranium district it consists of two ignimbrites interspersed with volcanoclastic and sedimentary deposits (conglomerates). It is estimated that it belongs to the Upper Cretaceous–Paleogene, because it is folded together with the sedimentary Cretaceous [20,21]. The Pozos Formation is deposited unconformably above the Cuervo Formation. It is composed of polymictic conglomerates of volcanic fragments, limestone, and chert, with intercalations of sandstone lenses, as well as thin layers of tuff (pumice) [25].
The Nopal formation can be described lithologically as a crystal-rich, rhyolitic ash flow tuff with quartz and sanidine phenocrysts, displaying a devitrified matrix in addition to unaltered biotite crystals [21] and presenting highly altered basal vitrophyres [25]. The Nopal Formation has been dated to 43.8 M.a. [16] and is unconformably superimposed onto the Coloradas formation (lithic tuff), which in turn unconformably overlies the Pozos Formation. As for the Chontes Formation, it is a basal red breccio-conglomerate with red sandstone lenses [21] on which the Escuadra formation was deposited in a discordant manner. Some authors consider that it was formed later than the Escuadra Formation due to the abrupt changes in its thickness [21,26]. Finally, the Escuadra Formation is a pinkish crystalline ignimbrite, with altered and leached areas, which contains quartz and sanidine phenocrysts (iridescent). It has been dated to 38 M.a. [21].
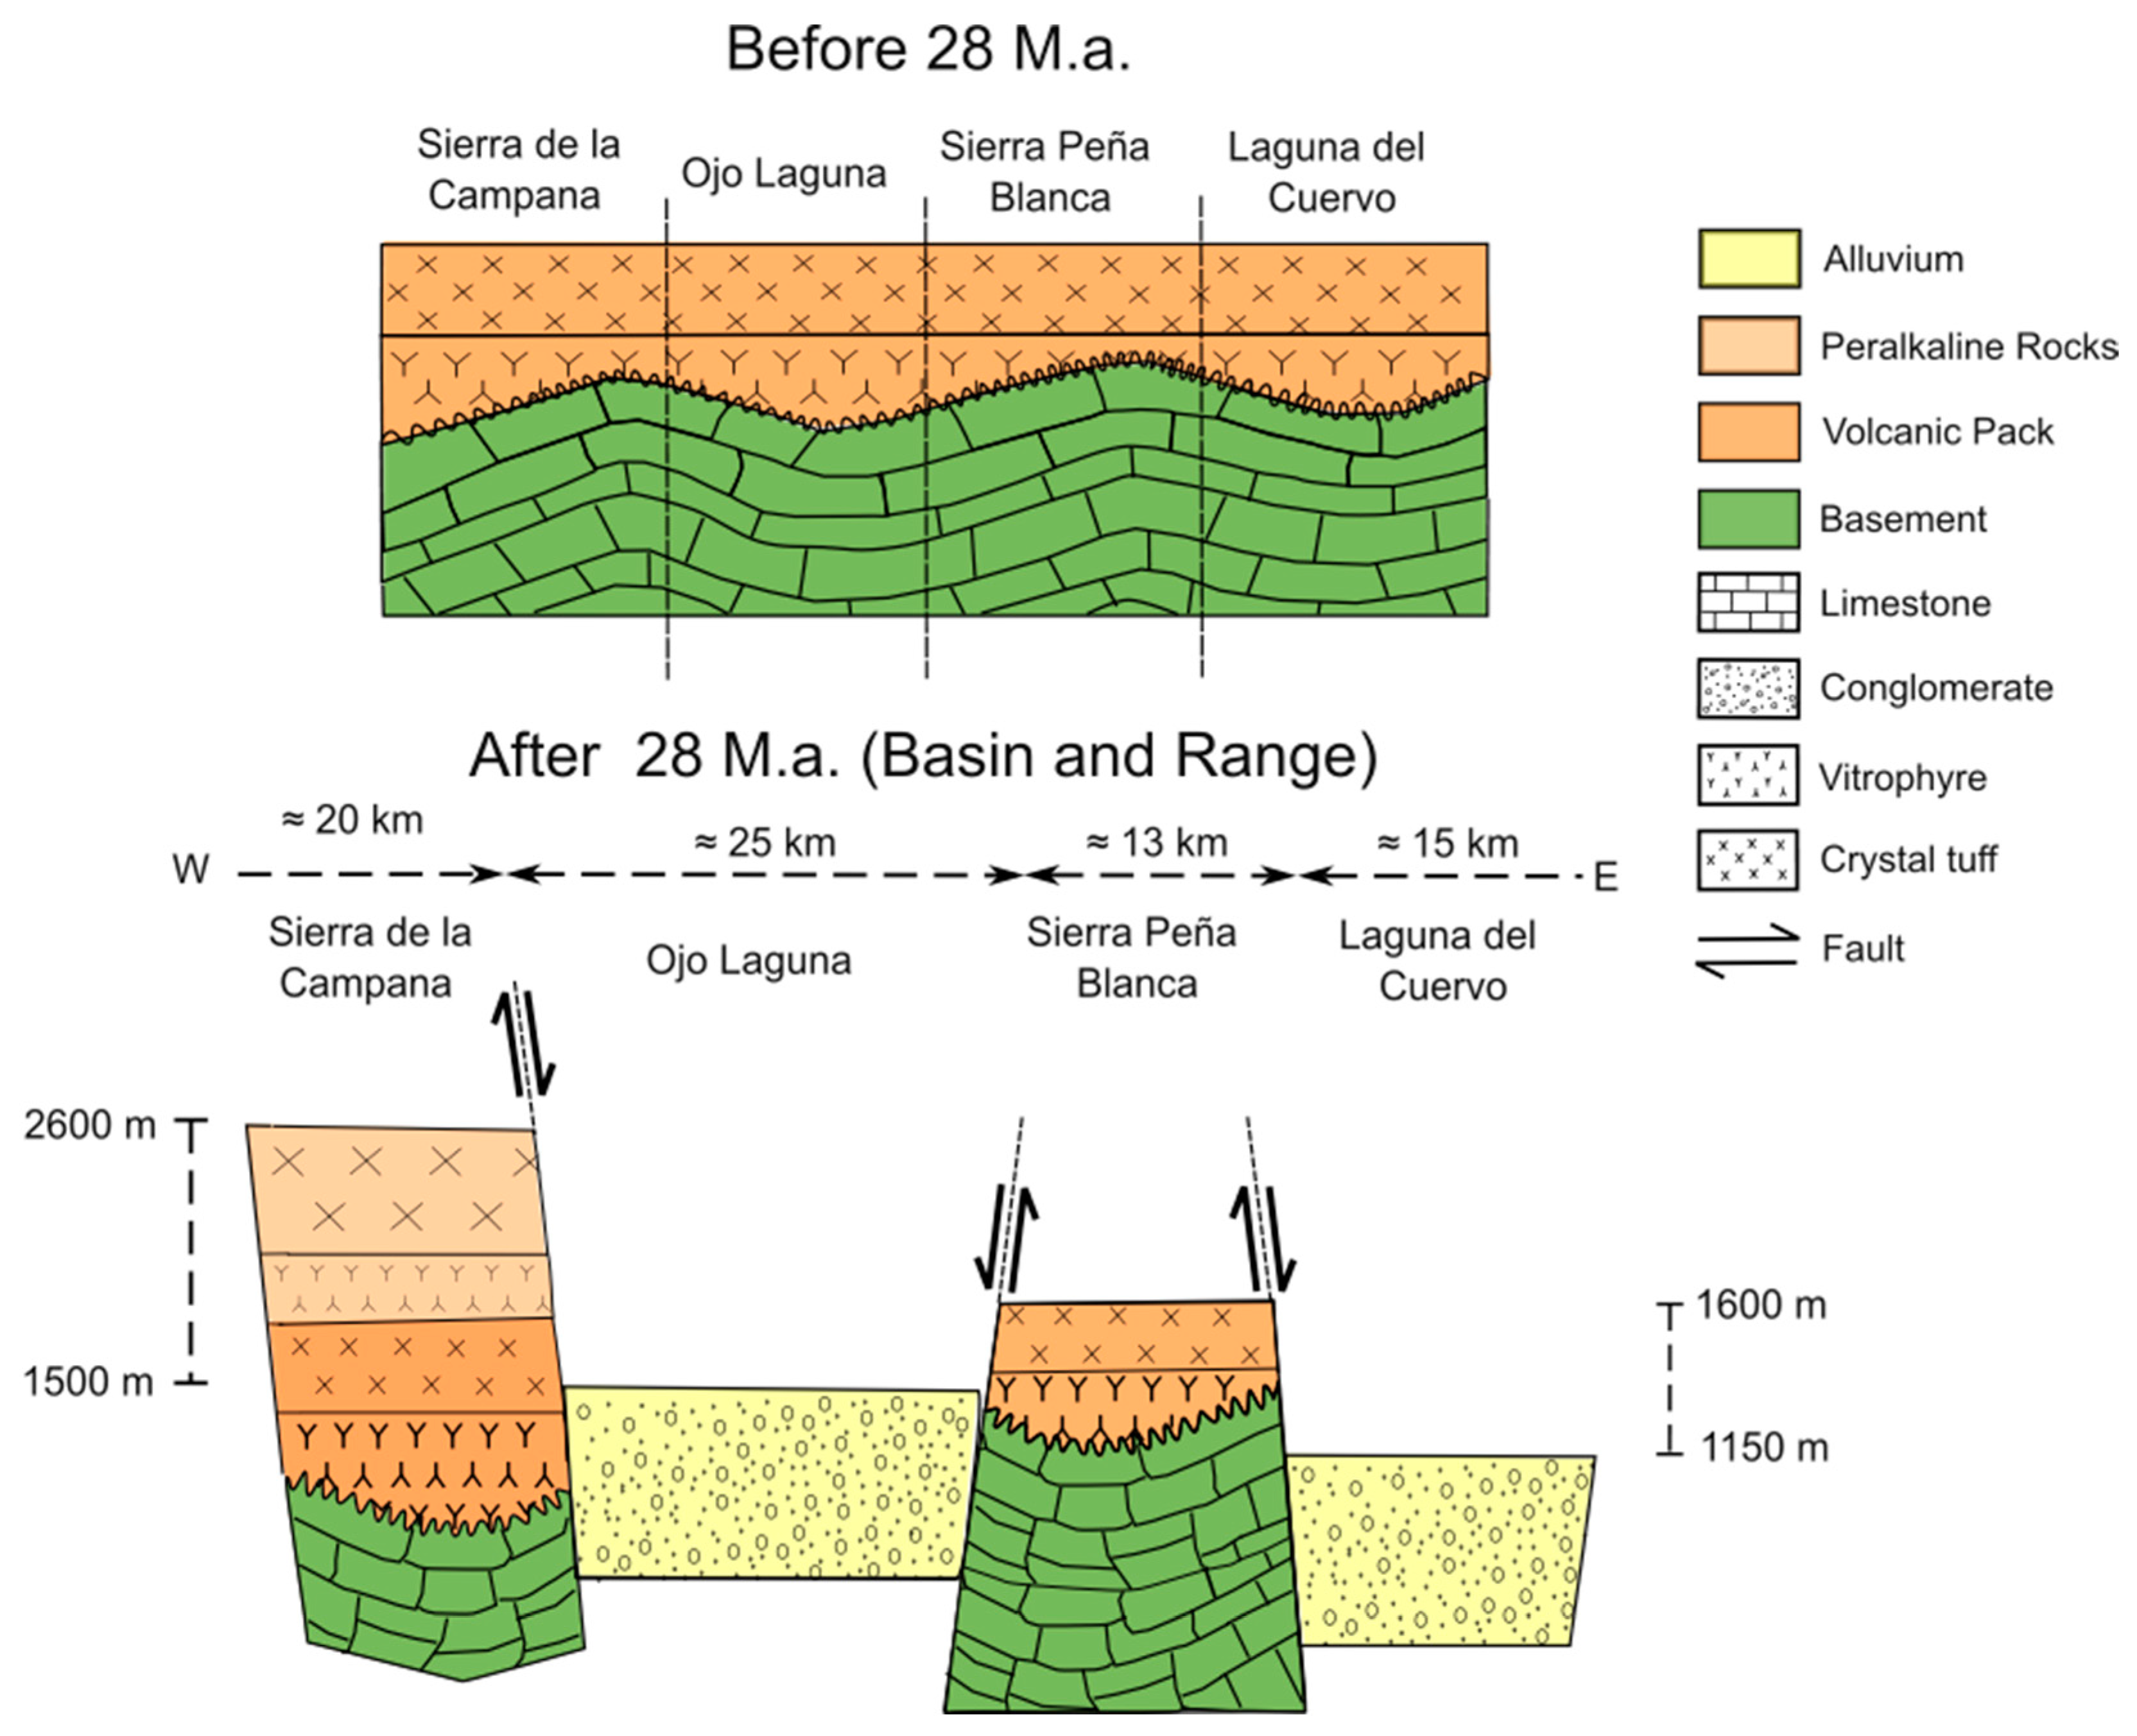
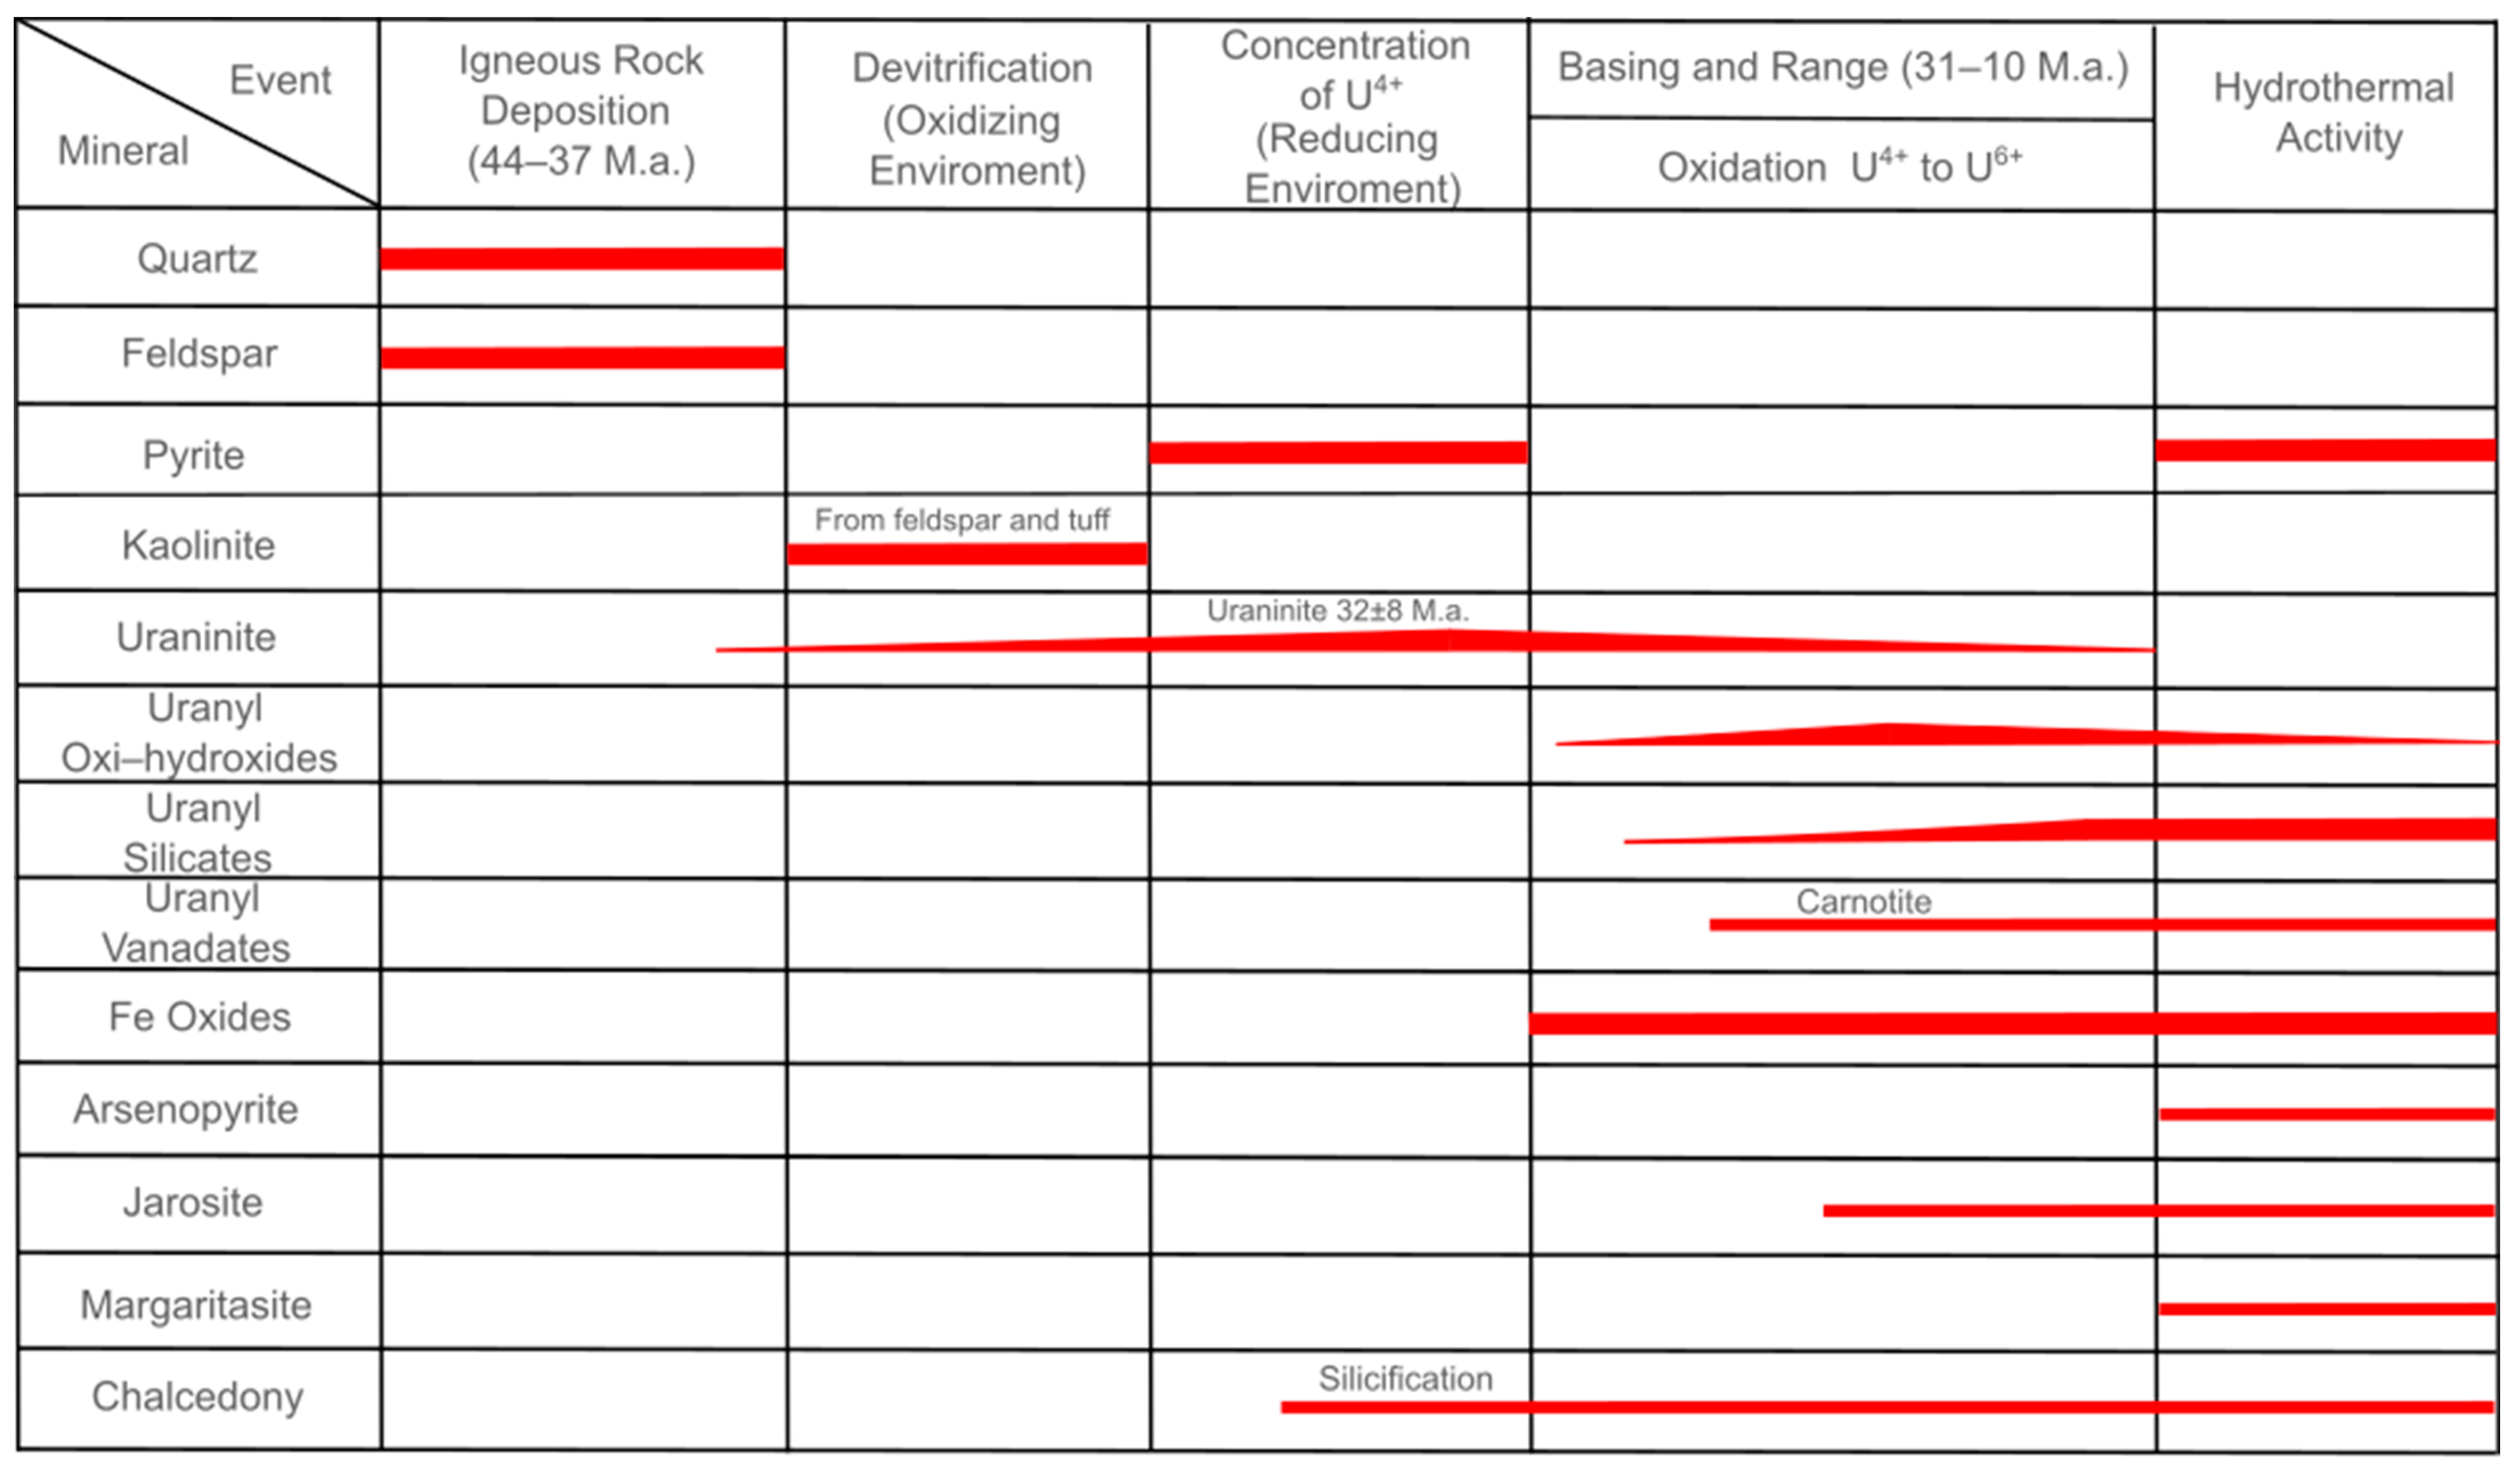
The diagenesis of uranium ores (Figure 3) in the Peña Blanca district has been discussed by various authors, for example [18,19,23]. The uranium primarily originated from peralkaline rocks (with U ≈ 20 ppm) [18] issued from the Nido blocks (Sierra de la Campana), which were found approximately between 30 to 40 km west of the current Peña Blanca uranium district, thus ex situ. Ref. [18] suggested that the migration of uranium (~35 M.a.) from the del Nido Block to Peña Blanca resulted from the processes of devitrification, leaching, weathering, erosion, and interactions with meteoric waters.
The SPB uranium district underwent a series of hydrothermal activities, which altered the rock and the uranium minerals. After the folding of the basal rocks layer, the volcanic pack was discordantly generated in the Peña Blanca uranium district between 44 and 37 M.a. [27]. These volcanic rocks are contemporaneous to the Superior Volcanic Series. Subsequently, a regional extension event induced the formation of the Basin and Range Province (31–28 M.a.). At the same time, peralkaline rocks were emplaced from the Nido Block to Texas. Tectonism engendered a stepped slope from west to east, resulting in a hydraulic gradient that allowed, together with meteoric water, the movement of uranium through the clastic and volcanoclastic sedimentary horizons, from the Nido Block, crossing the Encinillas Basin, to the uranium district of Peña Blanca, where the uranium was reduced thanks to favorable conditions allowing it to precipitate and/or to concentrate.
A hydrothermal origin for the uranium in SPB, from deeper rocks present in situ, via various geological stages and events was also proposed [19]. In the case of the Nopal I deposits, the combination of hydrothermal activity (evidenced by the presence of kaolin), supergene activity (evidenced by the devitrification of the vitrophyres and the presence of montmorillonite), and tectonic activity (evidenced by the filling of carbonates of the faults) may be responsible for the precipitation of uranium minerals.
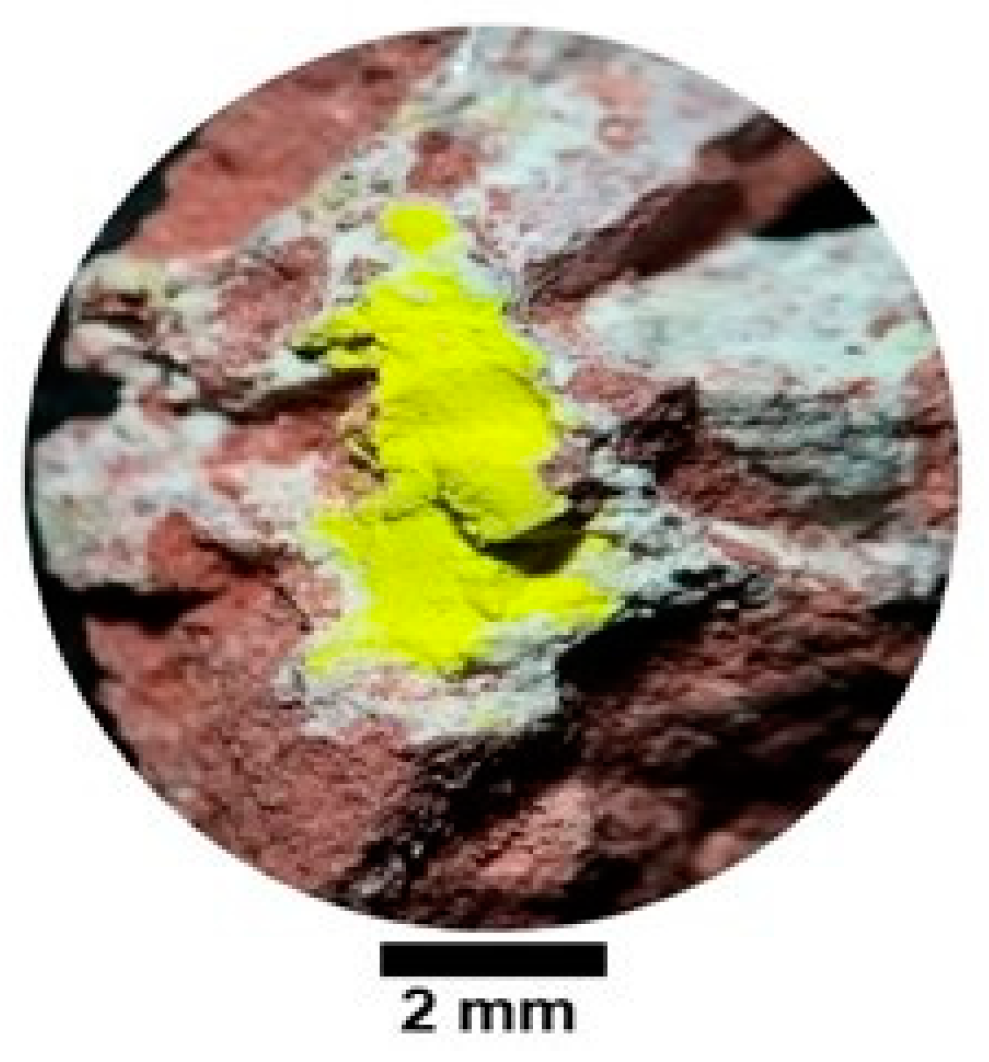
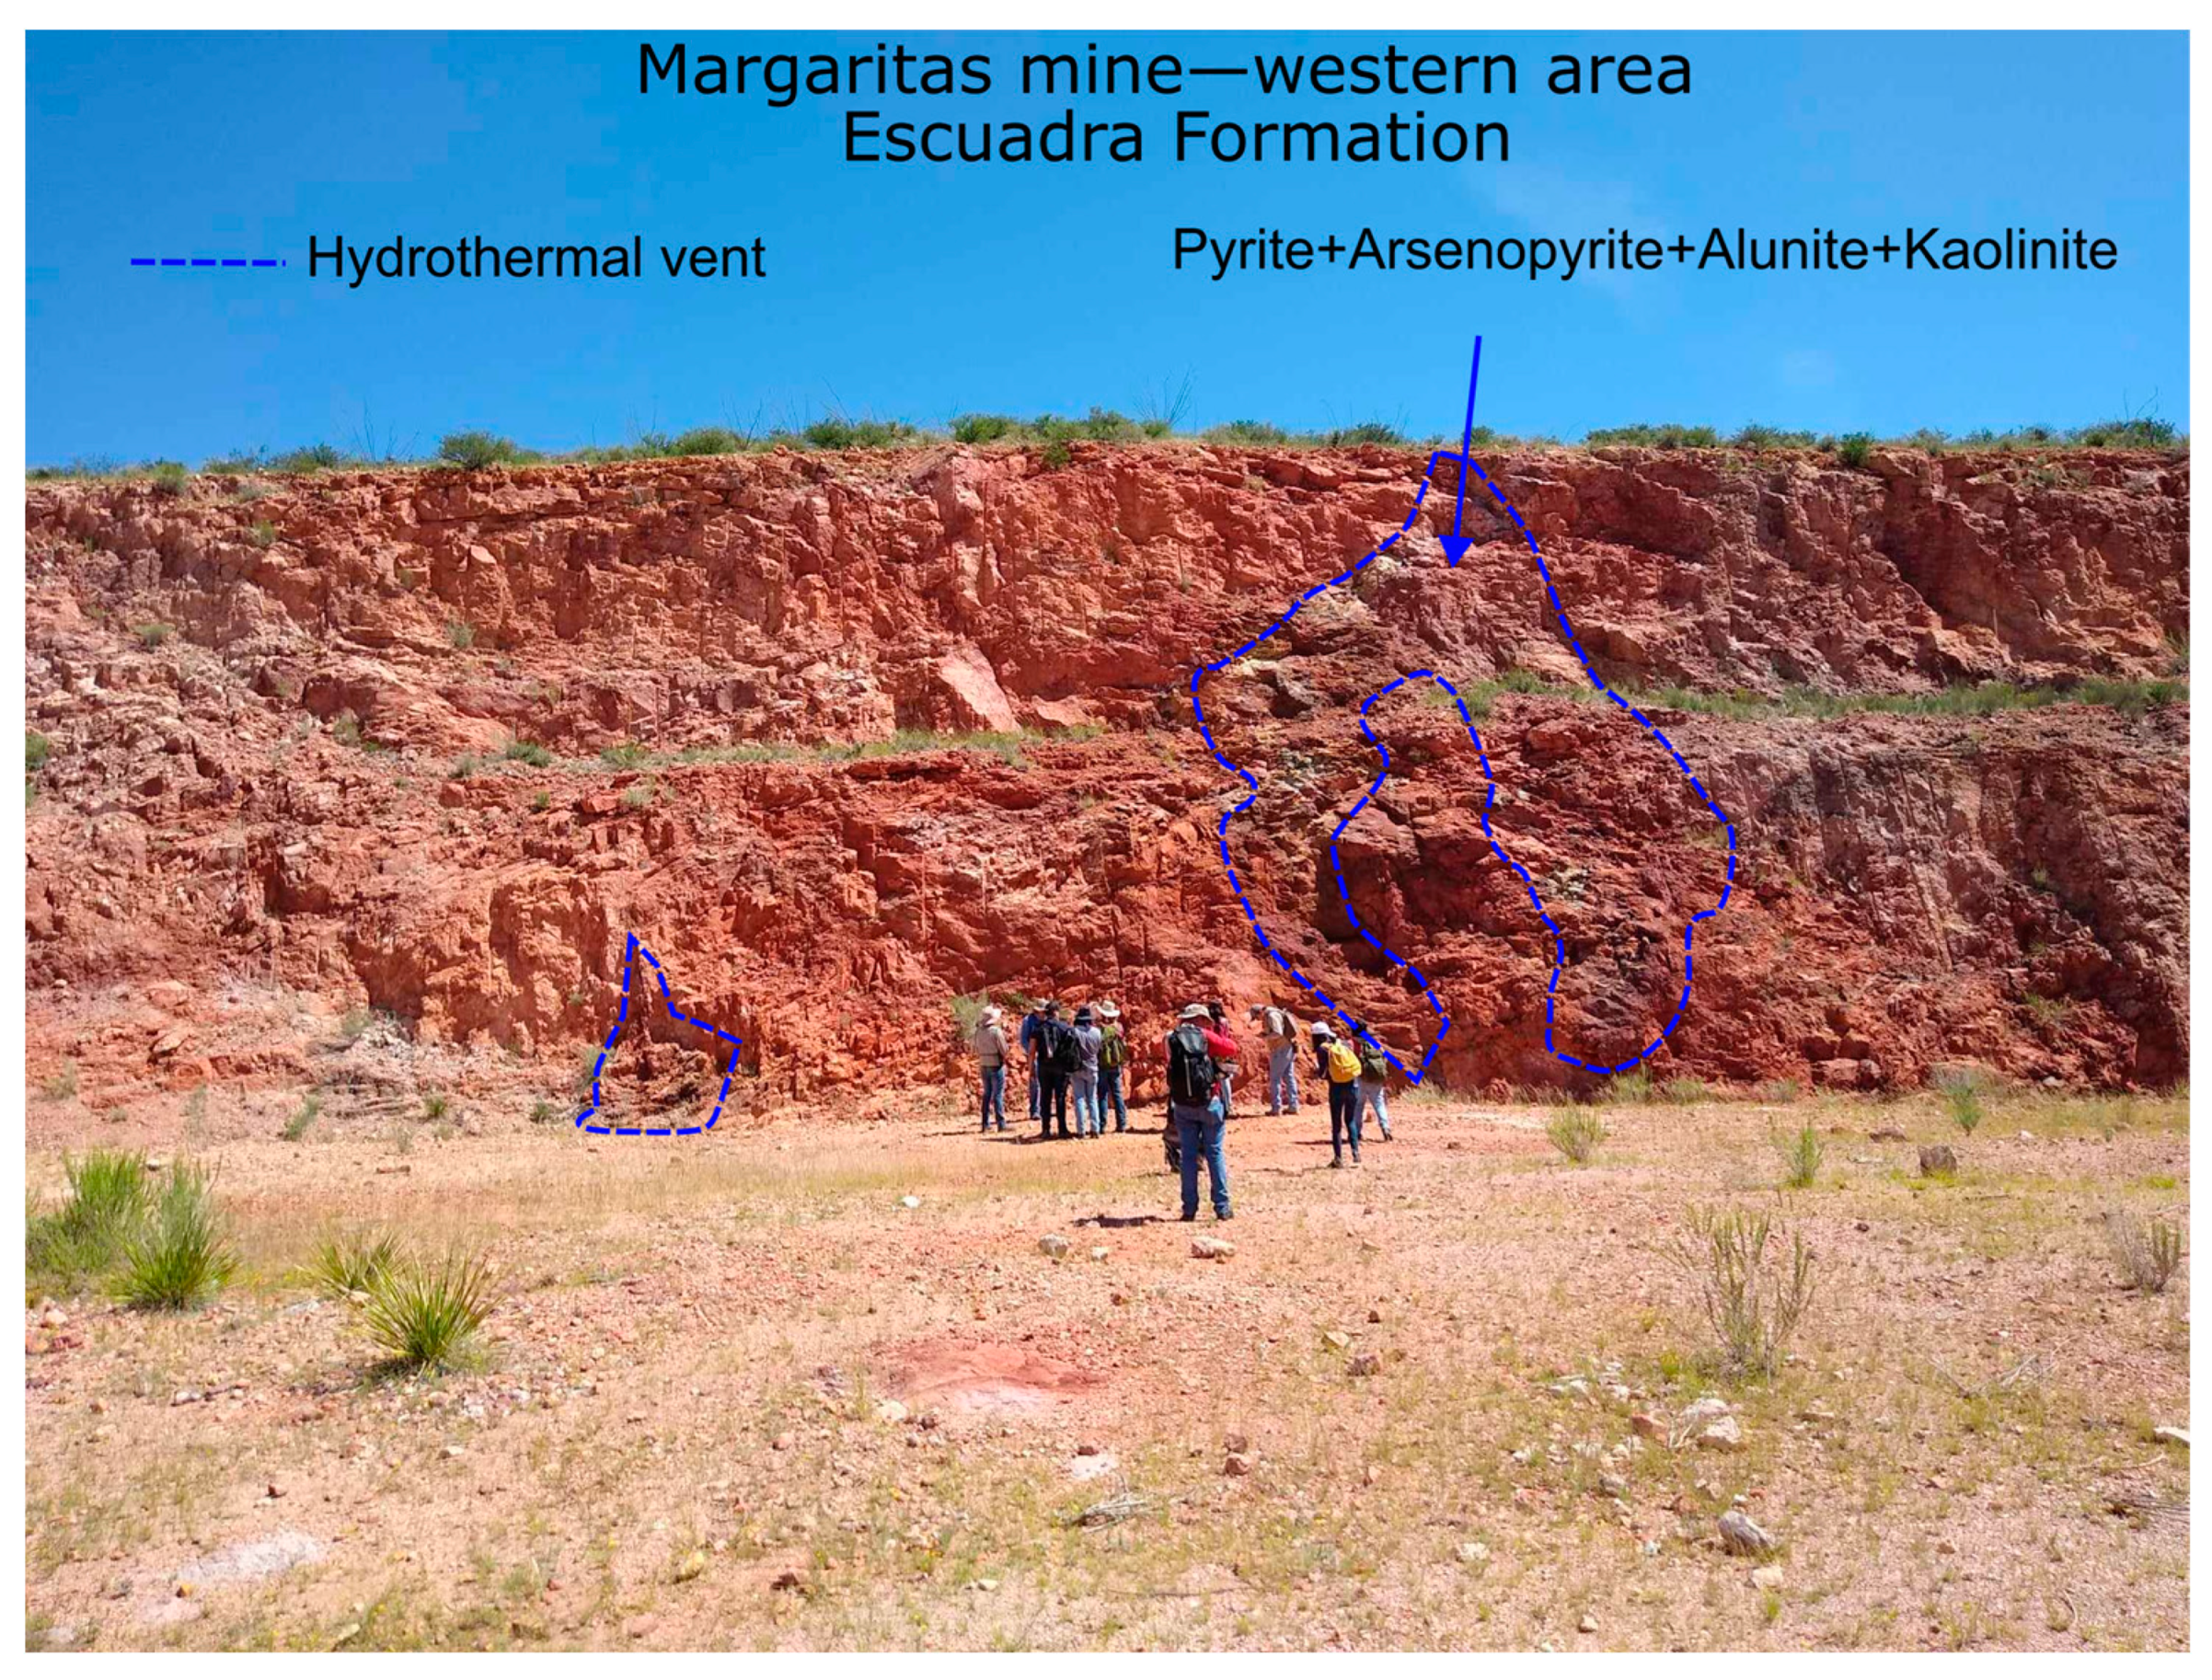
The Margaritas Mine (Figure 4) is located in the central part of the Peña Blanca uranium district at coordinates 396,120 east and 3,222,175 north. According to [17], it covers three mineralized horizons: the lower part of the Escuadra Formation, the Chontes Formation and the top of the Nopal Formation. The Margaritas deposit is housed in gravel limited by tilted horsts dipping towards the east. In the 1980s, 1224 tons of U3O8 were estimated to reside in this deposit [28].

4. Materials and Methods

4.1. Sampling

Rock samples containing margaritasite vesicles were collected from the Chontes Formation on the west side of the Margaritas deposit (Figure 5). Fresh samples were obtained by sampling the deposit with a geologist’s hammer and were placed in high-density bags.
The yellow mineral was precisely extracted from the site’s rocks with a geologist’s scratcher tipped with tungsten carbide (hardness 5.5 on the Mohs scale). It was deposited in a glass vessel until at least 0.05 g of sample was collected, which was then pulverized with an agate mortar and thus homogenized and then placed in a 1.5 mL plastic vial.

4.2. X-ray Diffraction (XRD)

“Laboratory” (conventional) powder XRD patterns were acquired on a Malvern Panalytical X’Pert diffractometer with filtered Cu-Kα radiation, operated using Bragg–Brentano geometry, with measurement intervals of 2θ = [5°, 60°] and steps of Δ(2θ) = 0.013°.
The qualitative analysis of the phases present in the sample was achieved with the Match application [31].
A high-resolution X-ray diffraction experiment was performed on the MCX beamline of Elettra Sincrotrone Trieste (Italy) [32,33]. The sample (m ≈ 1 mg) was encapsulated in a glassy capillary (ϕ = 0.25 mm) (cf. to Figure A1 in Appendix A). The diffractometer was operated under Debye–Scherrer geometry, with measurement intervals of 2θ = [5°, 35°], steps of Δ(2θ) = 0.01°, and photon energy of E = 15 keV (λ = 0.826561 Å). The instrumental resolution was calibrated with a LaB6 reference material.
Data analysis was carried out with the Rietveld method, using the FullProf program, Ref. [34] in order to interpret the results and retrieve quantitative phase models. To begin the procedure, structural models were taken from the Crystallography Open Database [35] and Mindat [36] databases.

4.3. Electron Microscopy

The morphology and elemental analysis of the samples of interest were performed using a scanning electron microscope (7401-F JEOL, Tokyo, Japan), coupled with EDS EDAX at 15 kV, a magnification of 3000× in secondary electron mode, and an 18,000× in backscattering electron mode) [37]. Selected area electron diffraction (SAED) patterns were acquired using the transmission electron microscope (JEM 2200 FS + CS JEOL, Tokyo, Japan), at 200 kV, with a camera length of 150 cm. The interpretation of the obtained electron diffraction patterns was performed following the methodology proposed by Doynikova [38]. The samples were prepared by dispersing the margaritasite–carnotite powder in isopropanol, a drop of which was deposited on a copper grid [39] for investigation.

4.4. X-ray Absorption Spectroscopy (XAS)

X-ray absorption spectroscopy (XAS) is a well-established technique that analyzes the amplitude modulation of the X-ray absorption coefficient of a chemical element in energies near and above its X-ray absorption edge [40]. XAS analysis has already been employed for the analysis of uranium in the environment [41,42,43,44] as it allows the characterization of the local environment of U, for instance its speciation, and the determination of its inter-atomic distances. This information is essential to identify the mineral species of U present in a given sample, as well as to study the character of the adsorption of the uranyl ion in sediments and soils, and in turn unravel its potential mobility in the environment.
Natural margaritasite–carnotite mineral powder (~30 mg), with particle sizes varying from 2 to 3 µm, was placed uniformly on adhesive tape (1 × 8 cm2) and sectioned into smaller parts (1 × 1 cm2). Those were then superimposed appropriately and sealed with the same tape [45] to avoid voids and self-absorption in the sample and to improve the overall interaction of the X-rays with the material (cf. Figure A2 in Appendix A). XAFS experiments were carried out at the Diamond Light Source station B18 [46] (UK), at the U L3-edge (16,966 to 18,437.5 eV), Cs L3-edge (4862 to 5248.66 eV), and V K-edge (5265 to 6314.8 eV). The spectra were measured at room temperature with a beam size of 200 µm × 250 µm, at energy intervals of ΔE = 0.4 eV, in fluorescence mode using a 36-element Ge detector, and in transmission mode using an ionization chamber. The scans were accumulated until a proper signal was obtained (7 scans of 5 min for U; 10 scans of 4 min for V; 5 scans of 4 min for Cs), along with in-line yttrium and vanadium foil reference spectra for the calibration of the energy scale. XAFS data were processed with DEMETER package based on IFEFFIT 7.0, via ATHENA (XAS raw data processing) and ARTEMIS GUI, in order to generate the theoretical EXAFS spectra assuming the crystallographic structure, and via FEFF, to produce the theoretical spectra [47,48].

5. Results and Discussion

5.1. X-ray Diffraction

5.1.1. Laboratory XRD

Conventional XRD provided a first approximation of the phase composition and crystallographic characterization of the investigated mineral samples. The details of this investigation are placed in Appendix A. The diffractogram obtained, as well as the Rietveld modeling, are shown in Figure A1. The phases identified are margaritasite, carnotite, quartz, montmorillonite, potassium feldspar, and calcite. The quantification results are presented in Table A1.

5.1.2. High-Resolution XRD

Figure 6 shows the high-resolution XRD pattern, obtained with a synchrotron X-ray source and with a high-precision diffractometer at Elettra, and its modeling was refined via the Rietveld method. This pattern reveals diffraction details not achievable with a (conventional) laboratory instrument. The quartz phase is not of particular interest in this work, but its maxima have high intensity. In order to simplify data treatment, the contributions of the quartz phase to the spectra were eliminated computationally (through modeling and subtraction).
The results of the Rietveld analysis are presented in the following tables. All the reported numerical values are given at the level of significant figures.
The reported uncertainties are derived from the standard deviation given by the program Fullprof. They are presented between parentheses (), referred to as the last digit in the informed magnitude. The Supplementary Information includes files with the numerical values of the diffraction pattern and text files containing data for the Rietveld refinement and the output of the Fullprof program. Details about the Rietveld methodology employed can be communicated upon request. Table 1 shows the results of the phase analysis (excluding quartz).
Table 2 compares the values obtained in the current study for the lattice parameters of margaritasite and carnotite with those published by [2,6]. The content of Table 2 refers to the notation P 1 21/c 1 for group 14.
In the Rietveld refinement, the fractional coordinates given by Appleman [2] for the atoms in the unit cells of carnotite and margaritasite were preserved. The changes detected in the lattice parameters implied variations in the interatomic distances. Of particular interest are those distances linked to the uranium atom, such as the U-O distances and variations for the uranyl ion. Table 3 shows the results for these distances in carnotite and margaritasite.
The input data for the FullProf program were prepared so that the program numerically optimized a couple of the chemical–structural parameters of interest: first, the partial occupation, in a disordered solid solution, of the sites shared by K and Cs; and second, the anisotropic micro-strain (preferentially in the direction [1,0,0] compared to the direction [0,0,1]). The results of this part of the refinement are presented in Table 4.

5.2. Qualitative (Mineralogical) Interpretation of Diffractometric Results

The margaritasite–carnotite sample is a mixture of six detectable crystalline phases (Table 1, which does not report the quartz phase) and a glassy fraction, causing a wavy background. It consists of a mixture of a majority phase with approximately equal relative concentrations of K and Cs in disordered solid solution, “carnotite”, plus a phase close to stoichiometric “margaritasite”.
The carnotite phase gives rise to broadened XRD peaks due to its lack of chemical-geometric uniformity. The peaks of the margaritasite phase do not show significant broadening, which is interpreted as a greater homogeneity.
In the structural comparison between carnotite and margaritasite, the increases in the “a” dimension of the elemental unit cell and in the O1-U1-O2 distances of the uranyl ion stand out (Table 3). The thickening of the unit cell and the separation of the atoms inside are a consequence of the larger size of the Cs ion with respect to the K ion.
Figure 7 represents the structure of the studied mineral margaritasite.

5.3. Scanning Electron Microscopy

Figure 8 shows a secondary electron micrograph of an agglomerate formed of margaritasite–carnotite particles. The crystals present mostly a lamellar tabular and prismatic form and measure approximately 3 × 3 × 0.5 µm3.
Figure 9 and Table 5 report on the EDX fluorescence spectrometry results linked with the micrograph presented in Figure 8. The elements that were detected are U, O, K, Cs, and V, which is fully consistent with the chemical composition of the margaritasite–carnotite crystals that was revealed by XRD.

5.4. Selected Area Electron Diffraction

Figure 10 shows two representative SAED patterns from margaritasite–carnotite nanoparticles. The indexing of the observed diffraction spots was performed following the methodology proposed by [38]. The reciprocal lattice of the margaritasite–carnotite solid solution was modelled from the structure determined by high resolution XRD. The modeling fits satisfactorily with the observed SAED. Coincidence between high resolution XRD and SAED confirms the monoclinic-disordered solution structure of the mineral investigated.

5.5. X-ray Absorption Spectroscopy

Figure 11a–c show the X-ray absorption near edge spectroscopy (XANES) spectra of the U L3-edge, V K-edge, and Cs L3-edge of margaritasite, respectively. The energy of the absorption edge was chosen by taking the first derivative at the main edge of each spectrum. The presence of Cs and V in the same compound precludes obtaining the extended X-ray absorption fine structure (EXAFS) spectrum for these elements, as their various absorption edges limit the length of the domain in energy, which can be probed. Indeed, an EXAFS spectrum is typically acquired over thousands of eVs after the absorption edge, which is not possible in this case. The V K-edge (5465 eV) prevents the probing of the EXAFS domain of the Cs L3-edge (5012 eV), while the presence of the Cs L2- and L1-edges (5359 and 5714 eV, respectively) overlap with the EXAFS domain of V K-edge. We had therefore to restrict our spectroscopic investigations to the XANES domains for these elements. In the XAS analysis at the U L3-edge, the characteristic features of the U+6 oxidation state were confirmed. Furthermore, the V+5 oxidation state could be readily discriminated in Figure 11b as a large peak at 5468 eV was found in the pre-edge of the V K-edge. In the “pre-edge” of the XAS spectrum of the Cs L3 edge, unexpected features appear. It was concluded that this was the Ti K absorption edge, with energy 4966 eV. The sensitivity of the XAS technique allows the unravelling of this element, Ti, which is present at the impurity level and was not identified by the other methods employed in this study.
Catalano et al. [41] demonstrated that, in practice, multiple atomic shells at similar distances are generated by the EXAFS spectra for the uranyl compounds of different structural families. If experimental spectra are obtained, up to relatively large wavenumber k, the features of the spectra at k allow us to approximately discriminate the uranyl compound of a given family. There are relatively few works dedicated to the characterization of the pure uranyl vanadate family using XAFS, which had traditionally become model compound spectra [49,50]. Nonetheless, studies were published on the possible presence of carnotite in these various environments, as identified by XAS and other complementary techniques [51,52,53,54,55,56]. Those studies usually relied on crystal structures obtained by XRD methods.
The appropriate strategies described in [57] were applied to theoretically model the spectra in terms of wavenumber k and Fourier transform for the uranyl compounds. The simulation of theoretical EXAFS spectra was undertaken using the Artemis module of the Demeter software package and benefits from the knowledge provided by the structural data obtained by XRD on margaritasite and carnotite. One can logically assume that an adequate fit for the experimental EXAFS spectrum enables the elaboration and verification that the model for the crystalline phase under study is correct. In Figure 12, the Fourier transform and k3-weighted spectra retrieved from the margaritasite’s U L3-edge EXAFS spectra are reported. The features of the radial distribution function at ~1.1–1.8 Å were properly fitted by considering two axial oxygen atoms at a bonding distance of 1.79 Å (2U-Oax) and five equatorial oxygen atoms at a bonding distance ~2.17– 2.42 Å (5U-Oeq), respectively. These distances are consistent with those obtained via Rietveld refinement on XRD data (Table 3). The best fit parameters for the simulated EXAFS data are summarized in Table 6.
The same strategy was applied to simulate an EXAFS spectrum, but using the carnotite parameters instead of those of margaritasite. The results are shown in Appendix A, Figure A2, and Table A2. The fit demonstrates that the first atomic shell consists of two axial oxygen atoms (Oax) of the uranyl group, UO2+2, at a distance of 1.806 ± 0.009 Å. This distance is very similar to the one obtained after a fit performed with structural data inputs of the margaritasite mineral (Table 6). As the best fit obtained with the carnotite structural parameters produces a U-Oax distance value, which is typical of the margaritasite structure, and our data suggest that the sample analyzed in the XAFS experiment contains a prevalent amount of margaritasite phase and carnotite solid solution with a large proportion of Cs. In this way, the EXAFS spectrum of margaritasite–carnotite can be considered another model spectrum of uranyl vanadate.

5.6. Paragenesis of Nopal and Margaritas Deposits

5.6.1. Origin of Cs in the Margaritas Uranium Deposit

It has been shown that elements such as U, Th, Mo, and Cs are concentrated in the upper part of the magma chambers [58], silicic magmatic chambers, and tuffs [59]. A study [60] performed on silicic rocks, intrusive rocks, rocks on the margins of calderas, and peralkaline–peraluminous rocks of the northern part of the Basin and Range Province, northwest USA, determined that the Cs content varies between 3 to 6 ppm, and its presence is highly correlated with that of uranium.
The SPB presents similarities with the current state of the Yellowstone system, in terms of rock composition and flow of hot material, so it can be inferred that they are analogous systems [61]. However, the area corresponding to the “Margaritas” deposit is much smaller in extent and depth of alteration. The Yellowstone National Park presents superimposed calderas, with large volume of lava flows and rhyolitic composition similar to SPBs. There, Ref. [62] reported an enrichment of Cs above 3000 ppm, coming from the upper part of the silicic magma chamber underlying the area and from the leaching of rhyolitic rocks underlying the geyser basins, where fresh rocks contain between 2.5 to 7.6 ppm [62]. Cs is believed to have been incorporated into the analcime structure during crystallization [62], rather than by subsequent cationic substitution. This proposed mechanism is in disagreement with other experiments [6] which have revealed that carnotite potassium can be exchanged for Cs under certain conditions, as we report in Section 5.6.2. Hydrothermal fluids can also yield trace amounts of Cs, as demonstrated by the study in Yellowstone [61]. There is evidence that the interactions of fluids with the Yellowstone Lake sediments later led to their enrichment with As, B, Cl, Cs, Cu, Ge, Li, Mo, Sb, and W. These fluids are known to reach temperatures of ~220–360 °C with variable concentrations of Cs (22–660 nM) [61].
Similarly, hot springs reaching ~85 °C are found in Tibet [63]. Those are part of a hydrothermal (low epithermal) system with geothermal waters containing ~5 µg/mL of Cs. The highest ore grade in the area reaches 2.89% Cs by mass in clays [63]. Consequently, the Cs found in the Margaritas uranium deposit most likely originated from the leaching of the rocks of the “Escuadra” Formation and from hot fluids that slowly passed through the porous rock of the Chontes Formation. This process allowed the interaction of hydrothermal fluids with the rock and minerals for long periods.

5.6.2. Paragenesis

Figure 13 presents the proposed paragenesis for the main SPB deposits (Margaritas–Nopal), inspired by [20,24,64].
Igneous rocks, mainly tuffs with vitrophyre at their base, of rhyolitic composition (quartz and feldspar) were deposited along the SPB. A devitrification of the vitrophyres and unstable material allowed the movement of U in the area, which subsequently induced an alteration of minerals (such as kaolinite).
The works of [24] on Nopal I and [20] on “Margaritas” present pathways for the paragenesis of the formation of uranium minerals in SPB. In the present proposal, the sequence of the occurrence of uranyl minerals is similar to that of [24]. Due to a reducing environment, uranium precipitated and was concentrated in its reduced form (U4+) as uraninite (along with pyrite), which gradually increased in proportion. During the formation of the Basin and Range Province, a new oxidation event occurred when those minerals were put in presence and then, interacted with meteoric water. Uranyl oxides and hydroxides were formed, mainly schoepite, which transformed into metaschoepita [20,24]. Subsequently, the oxyhydroxides underwent a replacement by uranyl silicates (alpha uranophane, beta uranophane, weeksite, soddyite, and boltwoodite, in that order of abundance).
For the “Margaritas” deposit, the appearance of uranyl vanadates (metatyuyamunite and carnotite) occurred simultaneously or after the appearance of silicates. The oxidation–reduction cycle took place one or more times, followed by hydrothermalism. Minerals from the Nopal I mine were dated in [64]. The residual uraninite was found to be 1.6 ± 0.5 M.a., the uranophane was 3.6 ± 0.5 M.a., and the weeksite/ boltwoodite was 41 ± 5 k.a. Angiboust et al. [20] classify four stages in the formation of the deposit, in which devitrification (U concentration), reduction process (formation of U4+ uraninite), and oxidation (the formation of U6+ uranyl minerals) stand out in general. Several works [19,20,24] have reported on the mineral alteration and have described the minerals present in both Nopal I (kaolinite, iron oxide and chalcedony–silicification) and “Margaritas” mines (kaolinite, iron oxides, jarosite veins, and chalcedony–silicification). In particular, jarosite formation is accompanied by a marked silicification process [20]. This event occurred twice and is known to have been induced by high fluid temperatures of ~150 °C. This hydrothermal flow circulated along the main fractures and faults, which are concomitant to the development of the Basin and Range, through the Escuadra Formation and probably also, although it is not as clear, the Chontes Formation.
The incorporation of Cs into the structure of carnotite at 200 °C was demonstrated in [6]. At the Margaritas deposit, the movement of Cs has probably occurred since the first devitrification and oxidation events, as Cs is present in the tuffs and vitrophyres of the volcanic pack. The substitution of Cs for K has been made possible thanks to hot fluids, which provided trace amounts of Cs, as described in the previous section. These fluids likely created the conditions necessary to form the margaritasite, since temperatures close to 200 °C were reached. Some alterations were added into the model presented in Figure 13, such as pyrite–arsenopyrite in hydrothermal chimneys (Figure 14), found in the eastern part of the deposit.

6. Summary

Margaritasite is a rare uranyl vanadate, found only in the Margaritas mine, in the Chontes Formation, at Sierra Peña Blanca, Chihuahua, Mexico.
Here, the presence of margaritasite–carnotite, issued from the SPB deposit, has been confirmed through a detailed crystallochemical characterization of representative samples, using updated, independent, and complementary techniques.
A synergetic use of high-resolution XRD, SEM, EDX, SAED, and XAS shows that this natural margaritasite–carnotite consists of a mixture of practically pure margaritasite and a solid solution of margaritasite–carnotite, with variable amounts of cesium. Detailed descriptions of both phases are provided in this work. The paragenesis concept enables a model that justifies the presence of cesium in natural margaritasite.

Supplementary Materials

The following supporting information can be downloaded at: https://0-www-mdpi-com.brum.beds.ac.uk/article/10.3390/min14040431/s1.

Author Contributions

Conceptualization, F.G.F.-G., I.A.R.-C. and M.-E.M.-C.; formal analysis, F.G.F.-G., L.E.F.-C., H.E.E.-P., J.G.C.-T., D.M.E. and Y.R.-G.; funding acquisition, M.-E.M.-C.; investigation, F.G.F.-G., L.E.F.-C., H.E.E.-P., J.G.C.-T., M.E.F.-M., D.M.E., Y.R.-G. and M.-E.M.-C.; methodology, F.G.F.-G. and I.A.R.-C.; project administration, M.-E.M.-C.; supervision, M.-E.M.-C.; validation, M.E.F.-M. and D.M.E.; writing—original draft, L.E.F.-C. and M.-E.M.-C.; writing—review and editing, F.G.F.-G., H.E.E.-P., M.E.F.-M., D.M.E. and M.-E.M.-C. All authors have read and agreed to the published version of the manuscript.

Funding

This research was funded by the CONAHCYT research project CF/2019 10853.

Data Availability Statement

Data are contained within the article and associated Supplementary Materials.

Acknowledgments

XAS measurements were performed as part of the proposal SP31884 at Diamond Light Source (UK). High-resolution XRD measurements were performed as part of the proposal 20215805 at Elettra Sincrotrone Trieste (Italy). The authors acknowledge Jasper Plaisier for his support in collecting high-resolution XRD data. The authors appreciate the support of Jorge I. Carrillo during sample collection; of Andrés I. López during XRD data collection; of Karla Campos and Cesar Leyva in the SEM-EDX data collection; and of Marco Ruiz-Esparza in the SAED data collection.

Conflicts of Interest

The authors declare no conflicts of interest.

Appendix A

Appendix A.1. Sample Preparation

Appendix A.1.1. High-Resolution XRD

Approximately 1 mg of pulverized mineral was deposited in a capillary (amorphous silica) 0.25 mm in diameter and 1 cm in length (Figure A1). The diameter of the capillary to be used was optimized to avoid X-ray self-absorption effects in the specimen.
Figure A1. Picture of the filled capillary with the margaritasite sample submitted to high-resolution XRD analysis.
Minerals 14 00431 g0a1

Appendix A.1.2. XAS

30 mg of mineral powder was placed uniformly on the adhesive part of a tape with dimensions of 1 cm× 8 cm (Figure A2 (left)) and sectioned into similar parts (1 cm × 1 cm) that were superimposed in layers and sealed with the same tape (Figure A2 (right)). The method was reported by [45] to avoid the self-absorption of X-rays into the material and increase the interaction of X-rays with the particles, thus reducing empty spaces. The particle size was 2–3 µm.
Figure A2. (Left) tape covering pulverized material; (right) accumulated and sealed sample.
Minerals 14 00431 g0a2

Appendix A.2. Conventional Diffraction Results and Discussion

Figure A3 shows the XRD pattern obtained with a conventional diffractometer operating with a Cu K-alpha X-ray source. The pattern interpretation was achieved via the Rietveld method.
Figure A3. “Laboratory” XRD pattern, with its interpretation using Rietveld-type modeling. The inset shows a zoom of the cluster (poorly resolved) at 2θ ≈ 13°. Goodness of fit descriptors: Rp = 3.48; Rwp = 4.69; χ2 = 4.82.
Minerals 14 00431 g0a3
The XRD pattern in Figure A3 is produced by the combined patterns of six mineralogical phases, with the proportions given in Table A1.
Table A1. Phase analysis obtained with conventional XRD equipment.
Mineral PhaseFormulaRelative Concentration (%)
CarnotiteK2(UO2)2(VO4)2·nH2O62 (2)
MargaritasiteCs2(UO2)2(VO4)2·nH2O8 (1)
QuartzSiO210 (1)
Montmorillonite(Na,Ca)0.33(Al,Mg)2(Si4O10)(OH)2·nH2O12 (1)
K-FeldsparKAlSi3O85.0 (5)
CalciteCaCO33.0 (5)
The interpretation of the XRD patterns in Figure A1 presents some difficulty as the different phases produced significant peak broadening and peak overlap. The broadening of XRD peaks, in general, is a result of the deviation of the observed structures from the perfect crystal model. The most frequent imperfections are the small size of the crystallites and the non-homogeneity (in dimensions and/or contents) of the unit cells. The structures of the margaritasite–carnotite, the clays (montmorillonite), and the feldspars present in the mineral are such that they generate important clusters of broadened maxima in the environments 2θ ≈ 13°, 20°, and 25°–28° (for Cu-Kα radiation). Particularly interesting is the complex of unresolved signals around 2θ = 13°. This cluster of maxima is produced by the (1,0,0) and (0,1,1) plane families of the margaritasite and carnotite phases (both of the same space group P1 21/c1) and by the (0,0,1) family of montmorillonite. The sharp peak at the lowest angle (2θ = 12°) provides information about the lattice parameter a of margaritasite. The rest of the signals in this package would have to be acquired with a better angular resolution to be interpreted. In fact, the Rietveld refinement that led to the results compiled in Table A1 was performed based on the high-resolution XRD interpretation as described in Section 5.1.2 of the manuscript.

Appendix A.3. XAS

The results from the simulations of the EXAFS spectrum of the mineral under study, using the carnotite parameters as inputs, instead of margaritasite, are shown in Figure A2, namely the radial distribution function and the k3-weighted EXAFS data. The Fourier transform spectra are shown in Figure A2 and summarized in Table A2.
Figure A4. The Fourier transform and k3-weighted spectra of experimental (solid) and fitted with carnotite parameters (dashed line) of U L3 EXAFS.
Minerals 14 00431 g0a4
Table A2. Best fit parameters for the margaritasite U L3 EXAFS spectrum, taking as an input the carnotite structural data. Independent points = 18.76; number of variables = 10; obtained R-factor = 0.0193.
NameNS02σ22)E0ΔR (Å)Reff (Å)Reff + ΔR (Å)Uncertainty (Å)
U_Oax21.05 ± 0.130.004 (1)5.1 ± 1.20.1271.67861.8060.009
U_Oeq111.05 ± 0.130.001 (1)5.1 ± 1.20.0732.13842.2120.011
U_Oeq221.05 ± 0.130.001 (1)5.1 ± 1.20.0732.23322.3060.011
U_Oeq321.05 ± 0.130.001 (1)5.1 ± 1.20.0732.27352.3470.011
U_Oeq411.05 ± 0.130.001 (1)5.1 ± 1.20.0732.35472.4280.011
U_V11.05 ± 0.130.007 (2)5.1 ± 1.20.0593.25743.3160.021
U_V11.05 ± 0.130.007 (2)5.1 ± 1.20.0593.29993.3580.021
U_U11.05 ± 0.130.006 (5)5.1 ± 1.12−0.1643.86363.8590.047
Symbols: N—coordination number; S02—amplitude reduction factor; σ2—mean square displacement in R; E0—energy shift of the photoelectron; ΔR—change in path length of the photoelectron; Reff—effective radius.

References

  1. El Uranio en México. Available online: https://www.sgm.gob.mx/Web/MuseoVirtual/Aplicaciones_geologicas/El-uranio-en-Mexico.html (accessed on 13 March 2024).
  2. Appleman, D.E.; Evans, J.; Howard, T. The crystal structures of synthetic anhydrous carnotite, K2(UO2)2V2O8, and its cesium analogue, Cs2(UO2)2V2O8. Am. Mineral. 1965, 50, 825–843. [Google Scholar]
  3. Karyakin, N.V.; Chernorukov, N.G.; Suleimanov, E.V.; Alimzhanov, M.I. Thermodynamics of Alkali Metal Uranovanadates. Russ. J. Gen. Chem. 2001, 71, 1333–1341. [Google Scholar] [CrossRef]
  4. Requena Yáñez, J.; Reyes Cortés, M.; Torres Moye, E.; Lardizabal, D.; Riveros, H.; Montero Cabrera, M.E. Synthesis of potassium and calcium uranovanadates, analogues of carnotite and metatyuyamunite minerals. Rev. Mex. Física 2012, 58, 253–257. [Google Scholar]
  5. Spano, T.L.; Dzik, E.A.; Sharifironizi, M.; Dustin, M.K.; Turner, M.; Burns, P.C. Thermodynamic investigation of uranyl vanadate minerals: Implications for structural stability. Am. Mineral. 2017, 102, 1149–1153. [Google Scholar] [CrossRef]
  6. Wenrich, K.J.; Modreski, P.J.; Zielinski, R.A.; Seeley, J.L. Margaritasite: A new mineral of hydrothermal origin from the Pena Blanca Uranium District, Mexico. Am. Mineral. 1982, 67, 1273–1289. [Google Scholar]
  7. Lussier, A.J.; Lopez, R.A.K.; Burns, P.C. A Revised and Expanded Structure Hierarchy of Natural and Synthetic Hexavalent Uranium Compounds. Can. Mineral. 2016, 54, 177–283. [Google Scholar] [CrossRef]
  8. Burns, P.C. U6+ Minerals and Inorganic Compounds: Insights into an Expanded Structural Hierarchy of Crystal Structures. Can. Mineral. 2005, 43, 1839–1894. [Google Scholar] [CrossRef]
  9. Burns, P.C.; Miller, M.L.; Ewing, R.C. U6+ minerals and inorganic phases: A comparison and hierarchy of crystal structures. Can. Mineral. 1996, 34, 845–880. [Google Scholar]
  10. Murata, K.J.; Cisney, E.; Stieff, L.; Zworykin, E. Synthesis, Base Exchange, and Photosensitivity of Carnotite, Tyuyamunite, and Related Minerals; US Department of the Interior, Geological Survey: Washington, DC, USA, 1950; Volume 107.
  11. Barton, P.B. Synthesis and Properties of Carnotite and Its Alkali Analogues. Am. Mineral. 1958, 43, 799–817. [Google Scholar]
  12. de Abeledo, M.J.; de Benyacar, M.R.; Poljak, R. Crystallographic Data. 167. Potassium Uranyl Vanadate, KUO2VO4. Anal. Chem. 1958, 30, 452–453. [Google Scholar] [CrossRef]
  13. Dickens, P.G.; Stuttard, G.P.; Ball, R.G.J.; Powell, A.V.; Hull, S.; Patat, S. Powder neutron diffraction study of the mixed uranium–vanadium oxides Cs2(UO2)2(V2O8) and UVO5. J. Mater. Chem. 1992, 2, 161–166. [Google Scholar] [CrossRef]
  14. Karyakin, N.V.; Chernorukov, N.G.; Suleimanov, E.V.; Alimzhanov, M.I. Chemical Thermodynamics of Alkaline-Earth Metal Uranovanadates. Radiochemistry 2003, 45, 457–468. [Google Scholar] [CrossRef]
  15. Aroyo, M.I.; Kirov, A.; Capillas, C.; Perez-Mato, J.; Wondratschek, H. Bilbao Crystallographic Server. II. Representations of crystallographic point groups and space groups. Acta Crystallogr. Sect. A Found. Crystallogr. 2006, 62, 115–128. [Google Scholar] [CrossRef] [PubMed]
  16. Alba, L.A.; Chávez, R. K-Ar ages of volcanics rocks from the central Sierra Peña Blanca, Chihuahua, México. Isochron/West 1974, 10, 21–23. [Google Scholar]
  17. Goodell, P.; Trentham, R.; Carroway, K. Geologic Setting of the Pena Blanca Uranium Deposits. In Formation of Uranium Ores by Diagenesis of Volcanic Sediments: Grand Junction, US Dept. of Energy Report GJBX; Henry, C.D., Walton, A.W., Eds.; US Department of Energy: Austin, TX, USA, 1978; pp. 22–79. [Google Scholar]
  18. Goodell, P.C. Chihuahua City Uranium Province, Chihuahua Mex. In Proceedings of the Technical Committee Meeting on Uranium Deposits in Volcanic Rocks, El Paso, TX, USA, 2–5 April 1984; IAEA: El Paso, TX, USA, 1985; pp. 97–124. [Google Scholar]
  19. George-Aniel, B.; Poty, B.; Leroy, J. Uranium deposits of the Sierra Peña Blanca: Three examples of mechanisms of ore deposit formation in a volcanic environment In Proceedings of the Uranium Deposits in Volcanic Rocks. In Proceedings of the Technical Committee Meeting, El Paso, TX, USA, 2–5 April 1984; IAEA: Vienna, Austria; El Paso, TX, USA, 1985; pp. 175–186. [Google Scholar]
  20. Angiboust, S.; Fayek, M.; Power, I.M.; Camacho, A.; Calas, G.; Southam, G. Structural and biological control of the Cenozoic epithermal uranium concentrations from the Sierra Peña Blanca, Mexico. Miner. Depos. 2012, 47, 859–874. [Google Scholar] [CrossRef]
  21. Cardenas-Flores, D. Volcanic stratigraphy and U-Mo mineralization of the Sierra de Pena Blanca district, Chihuahua, Mexico. In Uranium Deposits in Volcanic Rocks; International Atomic Energy Agency (IAEA): Vienna, Austria, 1985; pp. 125–136. [Google Scholar]
  22. Badilla Cruz, R.; Aponte Barrera, M. Estudio Geológico y de Caracterización de los Yacimientos el Nopal I, Las Margaritas, y Puerto III, del Distrito Uranífero de Peña Blanca, Chihuahua; Mexicano, U.-U., Ed.; Servicio Geológico Mexicano: Pachuca, Mexico, 1980. [Google Scholar]
  23. Calas, G. Les phenomenes d’alteration hydrothermale et leer relation avec les mineralisations uraniferes en milieu volcanique: Le cas des ignimbrites tertiaries de la Sierra de Peña Blanca, Chihuahua (Mexique). Sci. Geol. Bull. Strasbg. 1977, 30, 3–18. [Google Scholar] [CrossRef]
  24. Pearcy, E.C.; Prikryl, J.D.; Murphy, W.M.; Leslie, B.W. Uranium Mineralogy of the Nopal I Natural Analog Site, Chihuahua, Mexico; Center for Nuclear Waste Regulatory Analyses: San Antonio, TX, USA, 1993. [Google Scholar]
  25. Dobson, P.F.; Fayek, M.; Goodell, P.C.; Ghezzehei, T.A.; Melchor, F.; Murrell, M.T.; Oliver, R.; Reyes-Cortés, I.A.; De La Garza, R.; Simmons, A. Stratigraphy of the PB-1 Well, Nopal I Uranium Deposit, Sierra Peña Blanca, Chihuahua, Mexico. Int. Geol. Rev. 2008, 50, 959–974. [Google Scholar] [CrossRef]
  26. Magonthier, M. Caracteristicas petrograficas y geoquimicas de las unidades ignimbriticas portadoras de mineralizacion de uranio de la Sierra de Pena Blanca, Mexico. In Proceedings of the Uranium Deposits in Volcanic Rocks. Technical Committee Meeting, El Paso, TX, USA, 2–5 April 1984; IAEA: Vienna, Austria; El Paso, TX, USA, 1985; pp. 137–150. [Google Scholar]
  27. Clark, K.F. Geologic Section across Sierra Madre Occidental, Chihuahua to Topolobampo, Mexico; New Mexico Geological Society: Socorro, NM, USA, 1979; pp. 26–38. [Google Scholar]
  28. Salas, G.P.; Nieto, F.C. Geology of uranium deposits in Mexico. In Economic Geology, Mexico; Geological Society of America: Boulder, CO, USA, 1991; Volume P-3, pp. 161–166. [Google Scholar]
  29. Goodell, P.C.; Waters, A.C. Uranium in Volcanic and Volcaniclastic Rocks; American Association of Petroleum Geologists: Tulsa, OK, USA, 1981; Volume 13, p. 340. [Google Scholar]
  30. CRM (Consejo de Recursos Minerales). Monografía Geológico-Minera del Estado de Chihuahua; Secretaria de Energía, Minas e Industria Paraestatal, México: Mexico City, Mexico, 1994. [Google Scholar]
  31. Putz, H.; Brandenburg, K. Match! Phase Analysis Using Powder Diffraction. version 3. x, Crystal Impact. 2022. Available online: https://www.crystalimpact.de/match (accessed on 10 March 2024).
  32. Plaisier, J.R.; Nodari, L.; Gigli, L.; San Miguel, E.P.R.; Bertoncello, R.; Lausi, A. The X-ray diffraction beamline MCX at Elettra: A case study of non-destructive analysis on stained glass. Acta Imeko 2017, 6, 71–75. [Google Scholar] [CrossRef]
  33. Rebuffi, L.; Plaisier, J.R.; Abdellatief, M.; Lausi, A.; Scardi, P. MCX: A Synchrotron Radiation Beamline for X-ray Diffraction Line Profile Analysis. Z. Anorg. Allg. Chem. 2014, 640, 3100–3106. [Google Scholar] [CrossRef]
  34. Rodríguez-Carvajal, J. Recent advances in magnetic structure determination by neutron powder diffraction. Phys. B Condens. Matter 1993, 192, 55–69. [Google Scholar] [CrossRef]
  35. Gražulis, S.; Daškevič, A.; Merkys, A.; Chateigner, D.; Lutterotti, L.; Quiros, M.; Serebryanaya, N.R.; Moeck, P.; Downs, R.T.; Le Bail, A. Crystallography Open Database (COD): An open-access collection of crystal structures and platform for world-wide collaboration. Nucleic Acids Res. 2012, 40, D420–D427. [Google Scholar] [CrossRef] [PubMed]
  36. Ma, X.; Ralph, J.; Zhang, J.; Que, X.; Prabhu, A.; Morrison, S.M.; Hazen, R.M.; Wyborn, L.; Lehnert, K. OpenMindat: Open and FAIR mineralogy data from the Mindat database. Geosci. Data J. 2024, 11, 94–104. [Google Scholar] [CrossRef]
  37. Goldstein, J.I.; Newbury, D.E.; Michael, J.R.; Ritchie, N.W.; Scott, J.H.J.; Joy, D.C. Scanning Electron Microscopy and X-ray Microanalysis; Springer: New York, NY, USA, 2017. [Google Scholar]
  38. Doynikova, O.A. Uranous Mineralogy of Hypergene Reduction Region; Springer: New York, NY, USA, 2021. [Google Scholar]
  39. Williams, D.B.; Carter, C.B. The Transmission Electron Microscope. In Transmission Electron Microscopy: A Textbook for Materials Science; Springer: Boston, MA, USA, 1996; pp. 3–17. [Google Scholar]
  40. Koningsberger, D.C.; Prins, R. X-ray Absorption: Principles, Applications, Techniques of EXAFS, SEXAFS, and XANES; John Wiley and Sons: New York, NY, USA, 1988; Volume 92, p. 684. [Google Scholar]
  41. Catalano, J.G.; Brown, G.E., Jr. Analysis of uranyl-bearing phases by EXAFS spectroscopy: Interferences, multiple scattering, accuracy of structural parameters, and spectral differences. Am. Mineral. 2004, 89, 1004–1021. [Google Scholar] [CrossRef]
  42. Hennig, C.; Schmeide, K.; Brendler, V.; Moll, H.; Tsushima, S.; Scheinost, A.C. EXAFS Investigation of U(VI), U(IV), and Th(IV) Sulfato Complexes in Aqueous Solution. Inorg. Chem. 2007, 46, 5882–5892. [Google Scholar] [CrossRef] [PubMed]
  43. Hennig, C.; Reich, T.; Kraus, W.; Reck, G.; Prokert, F.; Schell, N. Combining EXAFS and X-ray powder diffraction to solve structures containing heavy atoms. Phys. Scr. 2005, 2005, T115. [Google Scholar] [CrossRef]
  44. Denecke, M.A.; Janssens, K.; Proost, K.; Rothe, J.; Noseck, U. Confocal micrometer-scale X-ray fluorescence and X-ray absorption fine structure studies of uranium speciation in a tertiary sediment from a waste disposal natural analogue site. Environ. Sci. Technol. 2005, 39, 2049–2058. [Google Scholar] [CrossRef] [PubMed]
  45. Newville, M. Fundamentals of XAFS. In Consortium for Advanced Radiation Sources; University of Chicago: Chicago, IL, USA, 2004. [Google Scholar]
  46. Dent, A.J.; Cibin, G.; Ramos, S.; Smith, A.D.; Scott, S.M.; Varandas, L.; Pearson, M.R.; Krumpa, N.A.; Jones, C.P.; Robbins, P.E. B18: A core XAS spectroscopy beamline for Diamond. J. Phys. Conf. Ser. 2009, 190, 012039. [Google Scholar] [CrossRef]
  47. Ravel, B.; Newville, M. ATHENA, ARTEMIS, HEPHAESTUS: Data analysis for X-ray absorption spectroscopy using IFEFFIT. J. Synchrotron Radiat. 2005, 12, 537–541. [Google Scholar] [CrossRef] [PubMed]
  48. Rehr, J.J.; Albers, R.C. Theoretical approaches to X-ray absorption fine structure. Rev. Mod. Phys. 2000, 72, 621. [Google Scholar] [CrossRef]
  49. Wallwork, K.S.; James, M.; Carter, M.L. The Crystal Chemistry, Structure and Properties of a Synthetic Carnotite-Type Compound, Ba2[(UO2)2Ti2O8]. Can. Mineral. 2006, 44, 433–442. [Google Scholar] [CrossRef]
  50. Burciaga-Valencia, D.C.; Reyes-Cortés, M.; Reyes-Rojas, A.; Rentería-Villalobos, M.; Esparza-Ponce, H.; Fuentes-Cobas, L.; Fuentes-Montero, L.; Silva-Sáenz, M.; Herrera-Peraza, E.; Muñoz, A.; et al. Characterization of Uranium Minerals from Chihuahua using Synchrotron Radiation. Rev. Mex. Fis. 2010, S56, 75–81. [Google Scholar]
  51. Avasarala, S.; Brearley, A.J.; Spilde, M.; Peterson, E.; Jiang, Y.-B.; Benavidez, A.; Cerrato, J.M. Crystal Chemistry of Carnotite in Abandoned Mine Wastes. Minerals 2020, 10, 883. [Google Scholar] [CrossRef] [PubMed]
  52. Blake, J.M.; Avasarala, S.; Artyushkova, K.; Ali, A.-M.S.; Brearley, A.J.; Shuey, C.; Robinson, W.P.; Nez, C.; Bill, S.; Lewis, J.; et al. Elevated Concentrations of U and Co-occurring Metals in Abandoned Mine Wastes in a Northeastern Arizona Native American Community. Environ. Sci. Technol. 2015, 49, 8506–8514. [Google Scholar] [CrossRef] [PubMed]
  53. Gräfe, M.; Klauber, C.; Gan, B.; Tappero, R.V. Synchrotron X-ray microdiffraction (μXRD) in minerals and environmental research. Powder Diffr. 2014, 29, S64–S72. [Google Scholar] [CrossRef]
  54. Wang, L.; Yuan, L.; Chen, K.; Zhang, Y.; Deng, Q.; Du, S.; Huang, Q.; Zheng, L.; Zhang, J.; Chai, Z.; et al. Loading Actinides in Multilayered Structures for Nuclear Waste Treatment: The First Case Study of Uranium Capture with Vanadium Carbide MXene. ACS Appl. Mater. Interfaces 2016, 8, 16396–16403. [Google Scholar] [CrossRef] [PubMed]
  55. Gräfe, M.; Donner, E.; Collins, R.N.; Lombi, E. Speciation of metal(loid)s in environmental samples by X-ray absorption spectroscopy: A critical review. Anal. Chim. Acta 2014, 822, 1–22. [Google Scholar] [CrossRef]
  56. Sumaila, S. Mineralogical and Geochemical Characterisation of Cores from an In Situ Recovery Uranium Mine; University of Saskatchewan: Saskatoon, SK, Canada, 2017. [Google Scholar]
  57. Kelly, S.D. Uranium chemistry in soils and sediments. In Developments in Soil Science; Elsevier: Amsterdam, The Netherlands, 2010; Volume 34, pp. 411–466. [Google Scholar]
  58. Smith, R.L.; Chapin, C.E.; Elston, W.E. Ash-flow magmatism. In Ash-Flow Tuffs; Geological Society of America: Boulder, CO, USA, 1979; Volume 180, p. 5-27. [Google Scholar]
  59. Hildreth, W. The Bishop Tuff: Evidence for the Origin of Compositional Zonation in Silicic Magma Chambers; Geological Society of America: Boulder, CO, USA, 1979. [Google Scholar]
  60. Walker, G.W. Uranium, Thorium, and Other Metal Associations in Silicic Volcanic Complexes of the Northern Basin and Range, a Preliminary Report; 2331-1258; US Geological Survey: Denver, CO, USA, 1981.
  61. Shanks, W.P.; Morgan, L.; Balistrieri, L.S.; Alt, J.C. Hydrothermal vent fluids, siliceous hydrothermal deposits, and hydrothermally altered sediments in Yellowstone Lake. In Proceedings of the Thermal Biology Institute Workshop, Yellowstone National Park, WY, USA, October 2005; pp. 53–72. [Google Scholar]
  62. Keith, T.E.; Thompson, J.; Mays, R.E. Selective concentration of cesium in analcime during hydrothermal alteration, Yellowstone National Park, Wyoming. Geochim. Cosmochim. Acta 1983, 47, 795–804. [Google Scholar] [CrossRef]
  63. Wang, W.; Jiang, S.-Y.; Wei, H.-Z. Geochemical processes and mechanisms for cesium enrichment in a hot-spring system. Am. Mineral. 2023, 108, 1275–1288. [Google Scholar] [CrossRef]
  64. Fayek, M.; Ren, M.; Goodell, P.; Dobson, P.; Saucedo, A.; Kelts, A.; Utsunomiya, S.; Ewing, R.C.; Riciputi, L.R.; Reyes, I. Paragenesis and Geochronology of the Nopal I Uranium Deposit, Mexico; Yucca Mountain Project: Las Vegas, NV, USA, 2007; p. 8. [Google Scholar]
Figure 1. Crystallographic scheme of margaritasite. View in plane c–b. Uranyl pentagonal bipyramids: yellow. Square tetragonal VO5 pyramids: green (dark and light). Unit cell borders in black.
Minerals 14 00431 g001
Figure 2. SPB stratigraphic column. The thickness of the formation layers varies from 900 m to more than 1500 m, from the basement to the Mesa formation, along the mountain range.
Minerals 14 00431 g002
Figure 3. More than 28 M.a., (top) the terrain had similar elevations across the different sections (volcanic rocks resting discontinuously on the basement). After the formation of the Basin and Range Province (bottom), a series of blocks developed along the terrain and the deposition of peralkaline rocks occurred on the volcanic pack in the Sierra de la Campana block. The difference in elevation generated a hydraulic gradient, which induced the erosion of the peralkaline rocks containing U, and consecutively produced a flow of sediments (from west to east) rich in U, which finally concentrated SPB. Modified from Goodell [18].
Minerals 14 00431 g003
Figure 4. Geological profile of the Margaritas mine. The thickness of the Chontes formation is irregular because it was deposited in a pre-existing topography, filling streams. The distance 0 m is equivalent to UTM coordinates 394,841 east 3,222,152 north. The mineralized zone of the Margaritas mine is located in the block delimited by the two faults described. Modified from [29,30].
Minerals 14 00431 g004
Figure 5. Visible light image of a margaritasite–carnotite sample (yellow) obtained with a Zeiss Stemi DV4 stereo microscope.
Minerals 14 00431 g005
Figure 6. High-resolution XRD patterns and their interpretation via the Rietveld method. Goodness of fit descriptors: Rp = 7.35; Rwp = 9.83; χ2 = 12.3.
Minerals 14 00431 g006
Figure 7. Unit cell of the mineral margaritasite (right). The inset (left) shows the interatomic distances in the UO7 pentagonal bipyramid. The O-U-O uranyl groups are oriented approximately parallel to the “a” axis.
Minerals 14 00431 g007
Figure 8. SEM micrographs of the margaritasite–carnotite of studied crystals. Left: Secondary electron image at a magnification of 3000×. Right: Backscattering electron image at a 18,000× magnification.
Minerals 14 00431 g008
Figure 9. EDX fluorescence spectrum corresponding to the right image in Figure 8.
Minerals 14 00431 g009
Figure 10. SAED patterns from nanocrystals of margaritasite–carnotite particles. Representative diffraction spots are indexed according to (a) zone axis 0,3,1 and (b) zone axis 4,0,1.
Minerals 14 00431 g010
Figure 11. Margaritasite XANES spectra obtained at different edges. (a) U L3-edge (obtained in fluorescence mode). (b) V K-edge (obtained in fluorescence mode). (c) Cs L3-edge (acquired in transmission mode). A spectrum was observed in the pre-edge zone, corresponding to the excitation of titanium impurities present in the natural mineral.
Minerals 14 00431 g011
Figure 12. The Fourier transform (radial distribution function) and the k3-weighted spectra of experimental (solid) and fitted (dashed line) U L3 EXAFS.
Minerals 14 00431 g012
Figure 13. Proposed paragenesis for SPB. The width of the red lines indicates a greater presence of the mineral.
Minerals 14 00431 g013
Figure 14. View of the western section of the “Margaritas” deposit in its current state. The presence of the sampling participants demonstrates the scale of the pit. The blue lines indicate the location of the minerals in the hydrothermal chimney.
Minerals 14 00431 g014
Table 1. Phase analysis of the mineral obtained with synchrotron XRD.
Mineral PhaseFormulaRelative Concentration (%)
CarnotiteK2(UO2)2(VO4)2·nH2O71 (2)
MargaritasiteCs2(UO2)2(VO4)2·nH2O7 (1)
Montmorillonite(Na,Ca)0.33(Al,Mg)2(Si4O10)(OH)2·nH2O14 (2)
K-FeldsparKAlSi3O86 (1)
CalciteCaCO32 (5)
Table 2. The various lattice parameters of margaritasite and carnotite, as found in this study and in [2,6].
AuthorsPhasea (Å)b (Å)c (Å)β (°)
Present workCarnotite6.846 (4)8.416 (1)10.480 (1)104.57 (1)
Margaritasite7.418 (1)8.391 (1)10.479 (1)104.89 (1)
Appleman and Evans [2] (*)Carnotite6.598.4110.47103°50′
Margaritasite7.328.4510.51106°05′
Wenrich et al. [6] (*)Carnotite6.638.4110.45104.1
Margaritasite7.258.42510.514106.01
(*) Axis notation adapted to the current setting. No uncertainties were provided in [2,6].
Table 3. U-O bond distances in carnotite and margaritasite.
BondDistance (Å)
CarnotiteMargaritasite
U1-O11.676 (2)1.799 (1)
U1-O21.681 (2)1.803 (1)
U1-O42.138 (1)2.134 (1)
U1-O42.273 (1)2.283 (1)
U1-O52.274 (1)2.274 (1)
U1-O62.233 (1)2.239 (1)
U1-O62.355 (1)2.359 (1)
Table 4. Occupancy factors (felement) and anisotropic micro-strains (εdirection).
PhasefK (%)fCs (%)ε [1,0,0] (%%)ε [0,0,1] (%%)
Carnotite57 (2)43 (2)170 (10)37 (5)
Margaritasite5 (2)95 (2)Not detectedNot detected
Table 5. Margaritasite–carnotite. Results of elemental analysis by EDX.
ElementO KAl KSi KMo LU MK KCa KCs LVK
Weight %32.184.035.961.0932.547.040.217.019.93
Atomic %68.095.057.190.384.636.090.181.796.60
Table 6. Best fit parameters for margaritasite U LIII EXAFS spectrum. Independent points = 24.08; number of variables = 16; obtained R-factor = 0.0128.
NameNS02σ22)E0ΔR (Å)Reff (Å)Reff + ΔR (Å)Uncertainty (Å)
U_Oax21.1 ± 0.20.004 (1)9.9 ± 1.5−0.0041.80281.7990.006
U_Oeq111.1 ± 0.20.002 (4)9.9 ± 1.50.0422.13842.1800.043
U_Oeq211.1 ± 0.20.002 (2)9.9 ± 1.50.0512.23542.2870.016
U_Oeq321.1 ± 0.20.002 (2)9.9 ± 1.50.0732.27852.3520.016
U_Oeq411.1 ± 0.20.002 (2)9.9 ± 1.50.0732.35402.4270.016
U_V11.1 ± 0.20.005 (3)9.9 ± 1.50.0443.27533.3190.025
U_V11.1 ± 0.20.021 (1)9.9 ± 1.50.0713.32163.3920.076
U_U11.1 ± 0.20.015 (1)9.9 ± 1.50.0863.86783.9540.062
U_Cs11.1 ± 0.20.01 1 (5)9.9 ± 1.50.00013.31223.310.05
Symbols: N—coordination number; S02—amplitude reduction factor; σ2—mean square displacement in R; E0—energy shift of the photoelectron; ΔR—change in path length of the photoelectron; Reff—effective radius.
Disclaimer/Publisher’s Note: The statements, opinions and data contained in all publications are solely those of the individual author(s) and contributor(s) and not of MDPI and/or the editor(s). MDPI and/or the editor(s) disclaim responsibility for any injury to people or property resulting from any ideas, methods, instructions or products referred to in the content.

