Figure 1.
(
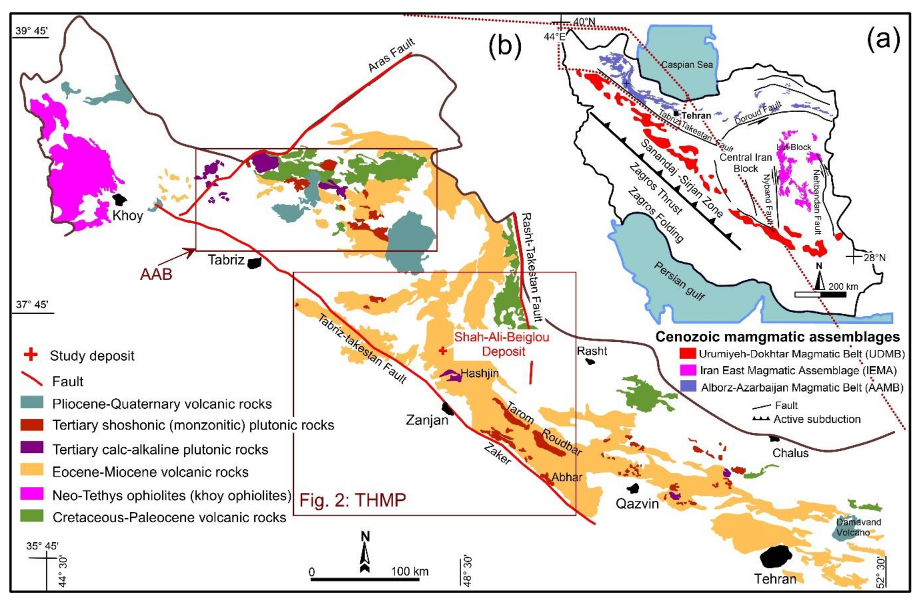
a) Distribution of the Cenozoic magmatic assemblages in Iran [
6]; (
b) Geological schematic map showing the main rock units and structures of the Alborz-Azarbaijan magmatic belt, the location of the Ahar-Arasbaran belt (AAB) and Tarom-Hashjin magmatic province (THMP), and the location of the study area in NW Iran; reproduced with permission from [
21], published by Elsevier B.V., 2013.
Figure 1.
(
a) Distribution of the Cenozoic magmatic assemblages in Iran [
6]; (
b) Geological schematic map showing the main rock units and structures of the Alborz-Azarbaijan magmatic belt, the location of the Ahar-Arasbaran belt (AAB) and Tarom-Hashjin magmatic province (THMP), and the location of the study area in NW Iran; reproduced with permission from [
21], published by Elsevier B.V., 2013.
Figure 2.
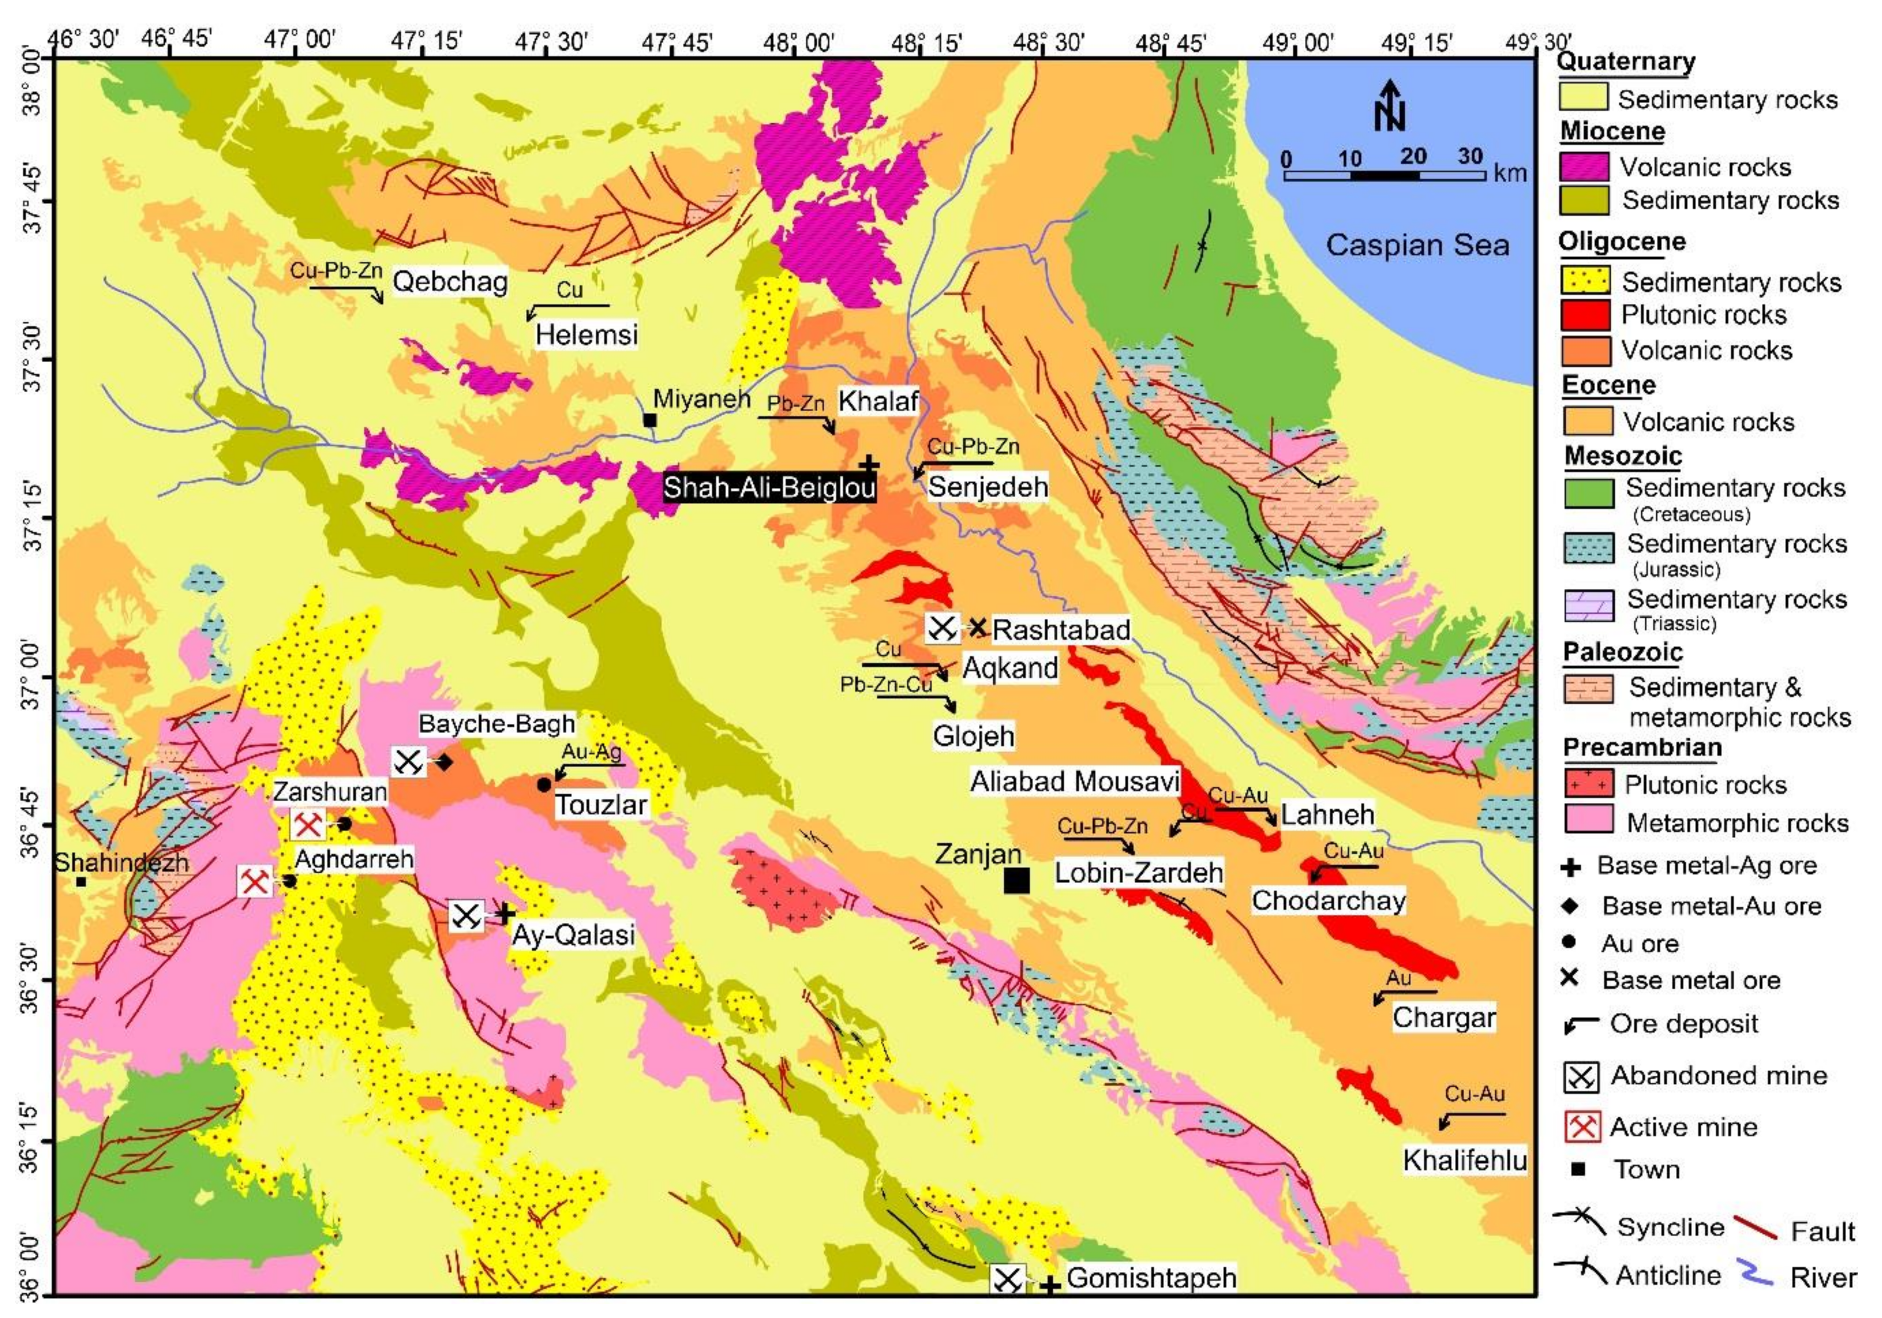
Simplified geological map of the central part of AAMB in NW Iran (based on 1:250,000 geological maps of Bandar-e-Anzali [
43], Takab [
44], Zanjan [
45], and Miyaneh [
46] provided by Geological Survey of Iran), showing the locations of the study area and some of the base metal-Ag, base metal-Au, and Au deposits. Reproduced with permission from Geological Survey of Iran.
Figure 2.
Simplified geological map of the central part of AAMB in NW Iran (based on 1:250,000 geological maps of Bandar-e-Anzali [
43], Takab [
44], Zanjan [
45], and Miyaneh [
46] provided by Geological Survey of Iran), showing the locations of the study area and some of the base metal-Ag, base metal-Au, and Au deposits. Reproduced with permission from Geological Survey of Iran.
Figure 3.
(
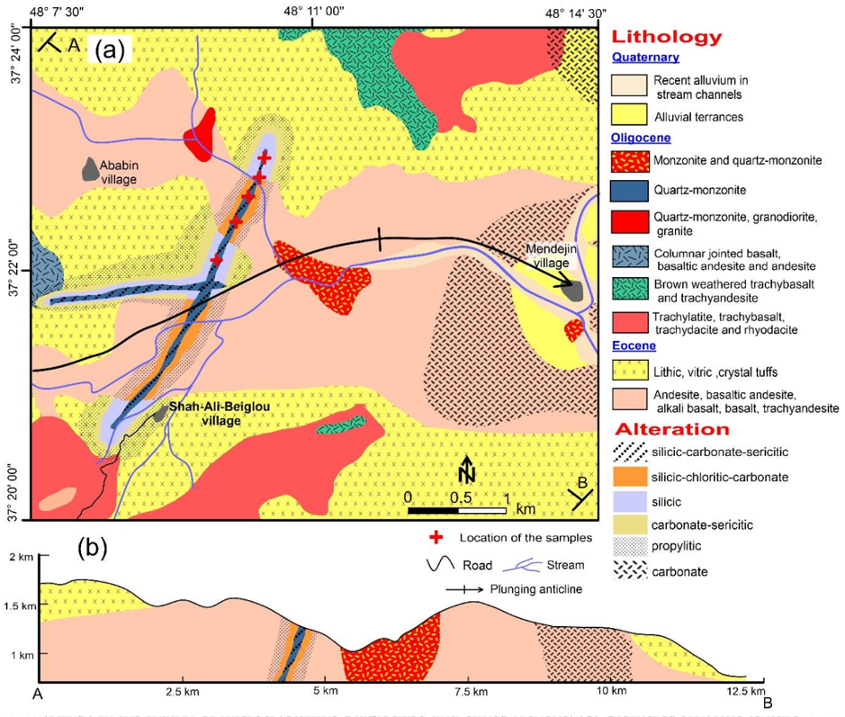
a) Geological map of the Shah-Ali-Beiglou showing the rock units and ore-bearing veins, revised and modified based on the new field data from 1:100,000 geological map of Hashjin provided by Geological Survey of Iran; (
b) Schematic cross-sections showing ore-bearing vein at the contact of andesite-basalt lavas. Reproduced with permission from Faridi and Anvari [
50], published by Geological Survey of Iran, 2000.
Figure 3.
(
a) Geological map of the Shah-Ali-Beiglou showing the rock units and ore-bearing veins, revised and modified based on the new field data from 1:100,000 geological map of Hashjin provided by Geological Survey of Iran; (
b) Schematic cross-sections showing ore-bearing vein at the contact of andesite-basalt lavas. Reproduced with permission from Faridi and Anvari [
50], published by Geological Survey of Iran, 2000.
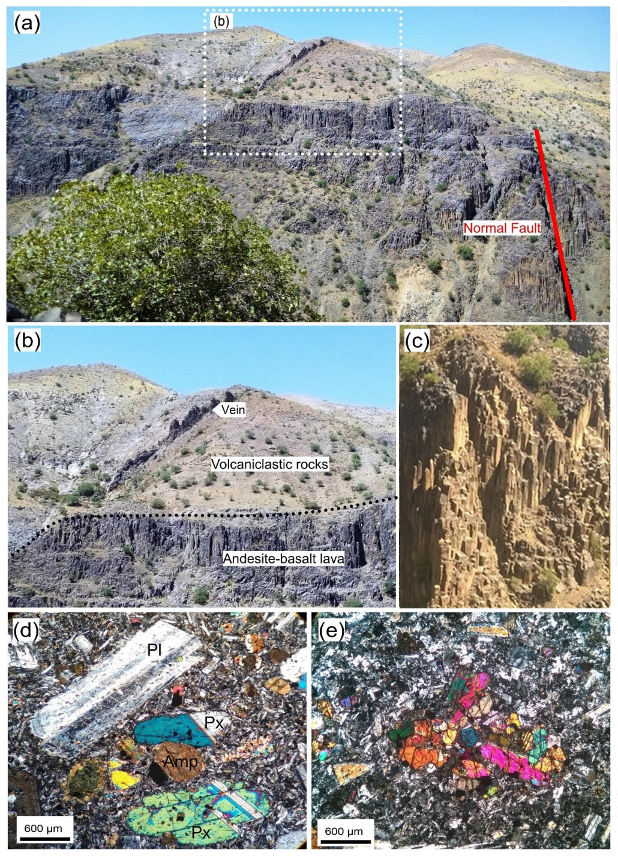
Figure 4.
Field photographs and photomicrographs of Shah-Ali-Beiglou area: (a,b) Outcrop of ore-bearing vein, volcaniclastic rocks, and andesite–basalt lava; (c) Columnar structure in andesite–basalt lava; (d) Porphyric texture consisting of phenocrysts of plagioclase (Pl), pyroxene (Px) and Amp (Amp) in the matrix of microcrystalline plagioclase and clinopyroxene; (e) Glomeroporhyritic texture of pyroxene crystals in a fine grained matrix of plagioclase and pyroxene crystals in andesite-basalt lava.
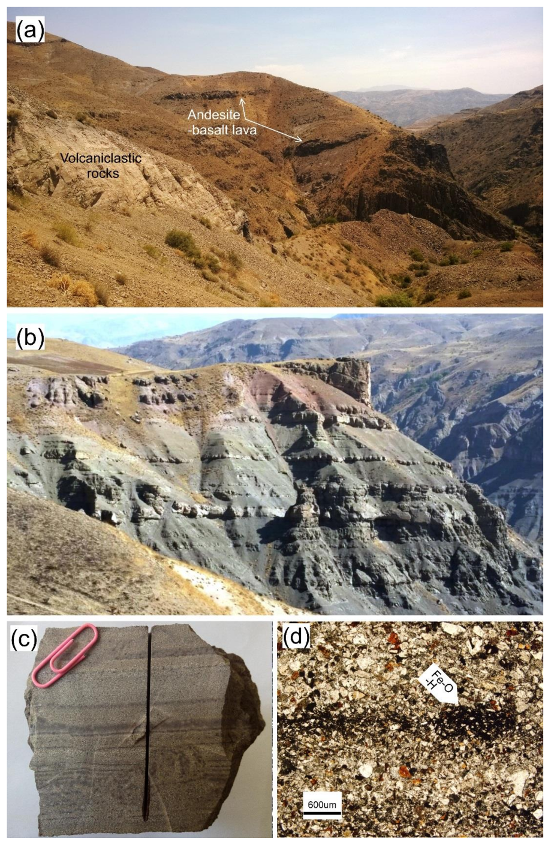
Figure 5.
Field photographs and photomicrographs of Shah-Ali-Beiglou area: (a) Eocene lava flows occurring as interlayers in the volcaniclastic rock unit; (b) Outcrop of volcaniclastic rocks containing thin-bedded texture; (c) Hand sample of crystal tuff with banded texture; (d) Crystal tuffs with banded texture (PPL). Fe-O-H: Fe-Oxide-Hydroxide.
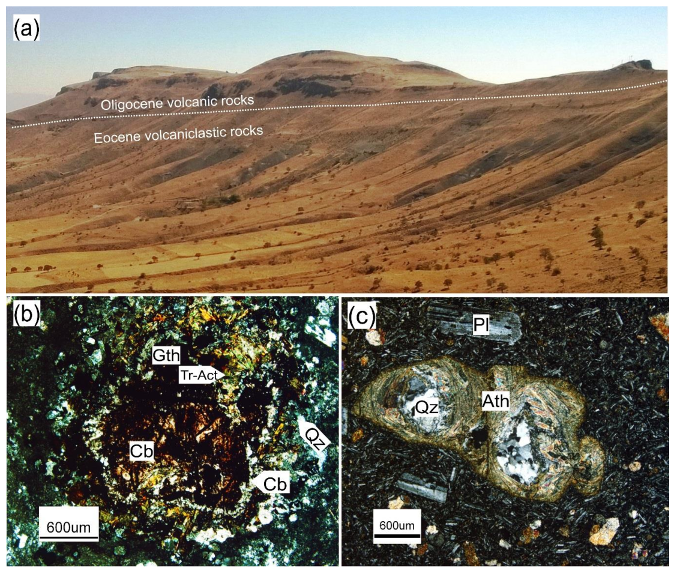
Figure 6.
Field photograph and photomicrographs of Shah-Ali-Beiglou area: (a) The unconformable contact of Eocene volcaniclastic rocks and Oligocene lavas in south of the study area; (b) A xenolith in trachylatite rock that is altered to an assemblage of carbonate, quartz, tremolite-actinolite (Tr-Act), and goethite (Gth) minerals (crossed-polarized light); (c) The second phase of the alteration in a trachy-basalt rock in which the serpentine resulted from the olivine (in the first phase), is altered to anthophyllite (Ath) filled with quartz (Qz) (crossed-polarized light).
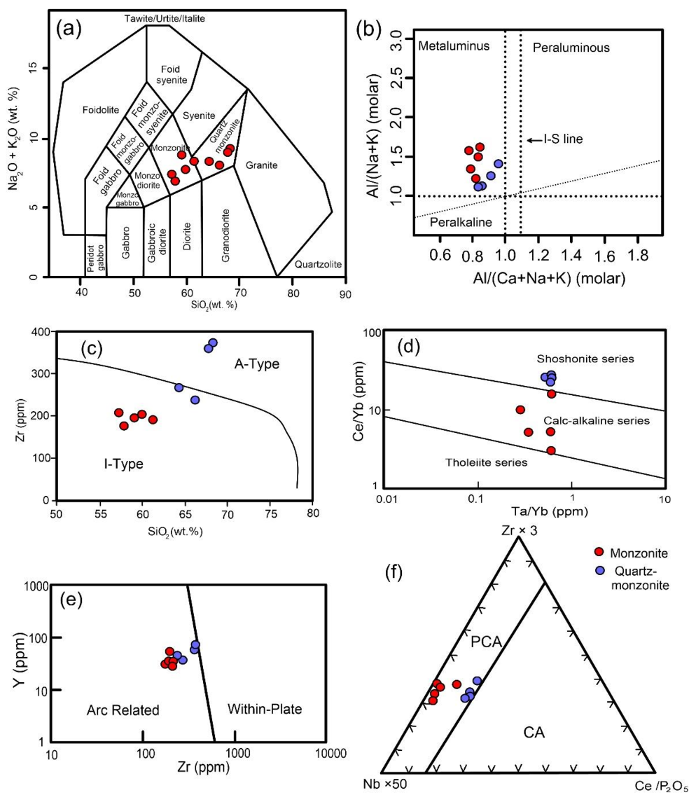
Figure 7.
Geochemical variation diagrams for the Shah-Ali-Beiglou stock. (
a) Rock classification diagram [
57] for the Shah-Ali-Beiglou stock; (
b) Al/Na + K (molar) versus Al/Ca + Na + K that showing all of the samples exhibit metaluminous geochemical characters (after Maniar and Piccoli [
58]) diagram; (
c) Zr versus SiO
2 diagram proposed by Collins et al. [
59] that showing most of the samples have I-type geochemical characters; (
d) Ce/Yb versus Ta/Yb diagram for the samples with lines separating the tholeiitic, calc-alkaline, and shoshonitic series [
60] that showing samples have calc-alkaline to shoshonitic affinity; (
e) Y versus Zr diagram [
51] that showing samples plot within the arc related field; (
f) Zr × 3-Nb × 50-Ce/P
2O
5 tectonic setting discrimination diagram [
51] that showing samples plot within the post-collisional arc field (PCA).
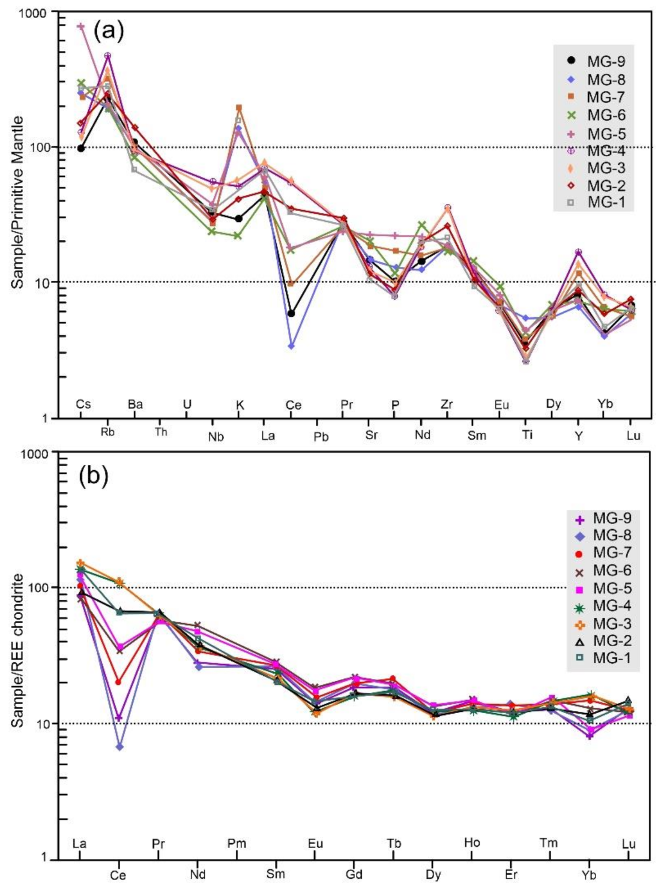
Figure 8.
(
a) Primitive mantle-normalized trace elements [
52]; (
b) chondrite-normalized rare earth elements [
56] diagrams for the Shah-Ali-Beiglou stock.
Figure 8.
(
a) Primitive mantle-normalized trace elements [
52]; (
b) chondrite-normalized rare earth elements [
56] diagrams for the Shah-Ali-Beiglou stock.
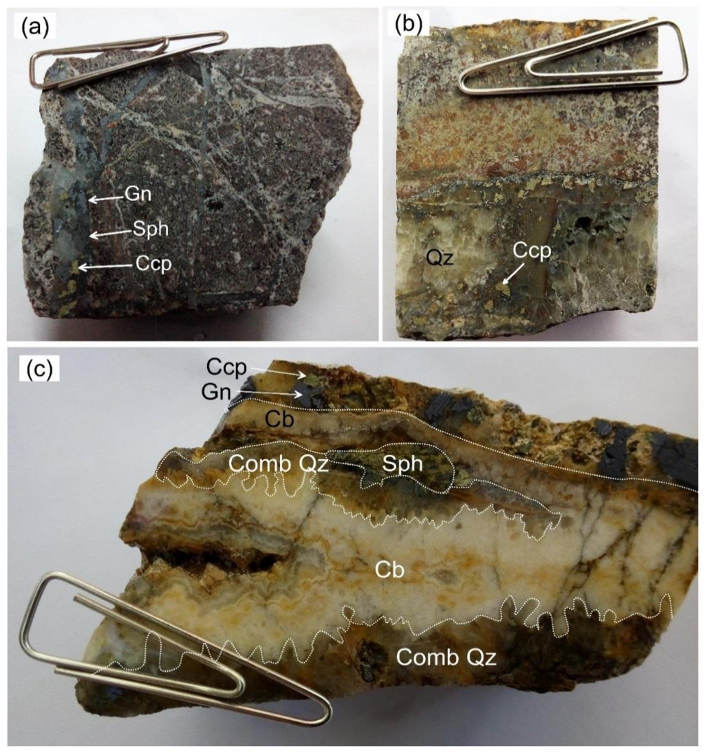
Figure 9.
Photographs of hand samples showing: (a,b) Silica-sulfide vein-veinlets including galena (Gn), sphalerite (Sph), and chalcopyrite (Ccp); (c) Silica-carbonate-sulfide vein containing typical crustiform banding and comb quartz.
Figure 9.
Photographs of hand samples showing: (a,b) Silica-sulfide vein-veinlets including galena (Gn), sphalerite (Sph), and chalcopyrite (Ccp); (c) Silica-carbonate-sulfide vein containing typical crustiform banding and comb quartz.
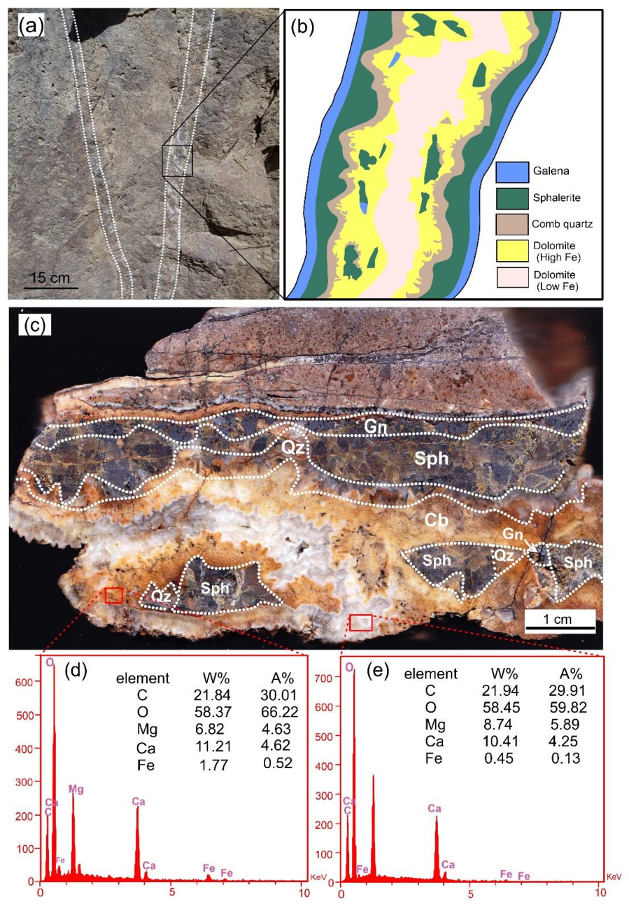
Figure 10.
(a) Close-up view of silica-sulfide-carbonate vein; (b) Schematic representation of silica-sulfide-carbonate vein, illustrating multiple phases of mineral deposition and fracturing events; (c) Photographs of hand sample showing enlarged fractures filled with ore mineral clasts and carbonates; (d) The results of EDX analyses for relatively high Fe dolomite; (e) The results of EDX analyses for relatively low Fe dolomite.
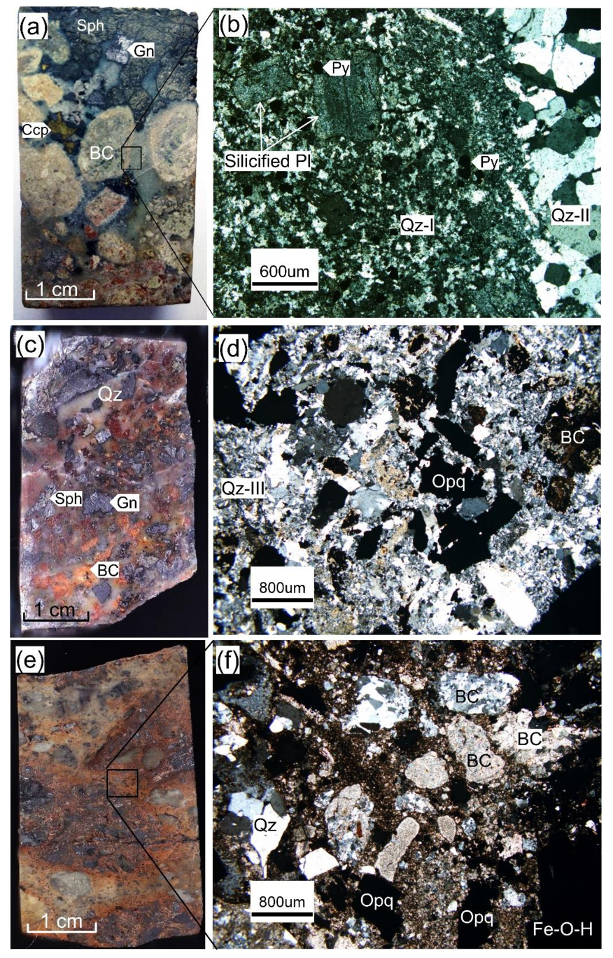
Figure 11.
Representative photographs and photomicrographs of the different breccias in the Shah-Ali-Beiglou deposit (photomicrographs taken under transmitted cross-polarized light images). (a) Breccia-I with rounded clasts in quartz-sulfide cement; (b) Pyrite with dessiminated texture in clasts of Breccia-I; (c) Hand specimens of breccia-II with angular clasts in quartz-sulfide cement; (d) Ore minerals in silica cement occurring as breccia clast; (e) Hand specimens of breccia-III; (f) Breccia-III with rounded to subrounded clasts in carbonate (-Fe-Oxide) cement. (Gn: galena, Sph: sphalerite, Ccp: chalcopyrite, Py: pyrite, Qz: quartz, Cb: carbonate mineral, BC: breccia clast, Pl: plagioclase, Opq: opaque, and Fe-O-H: Fe-oxide-hydroxide).
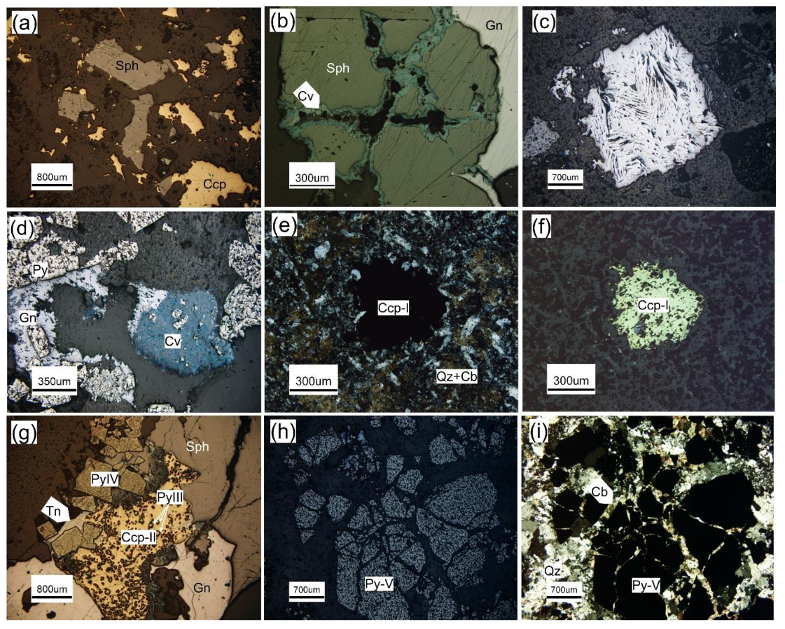
Figure 12.
Photomicrographs of the sulfide minerals from Shah-Ali-Beiglou deposit showing the textural relations among the minerals (images are taken under reflected plane-polarized light, except e and I that are taken under transmitted cross-polarized light). (a) Chalcopyrite (Ccp) crystals are replaced by sphalerite (Sph); (b) Sphalerite is substituted by covellite (Cv) along with borders and fissure planes in the breccia-I; (c) Single grain of galena in silica cement containing undulation and displacement triangular pits in the Breccia-III; (d) Replacement of galena (Gn) by covellite in breccia-I; (e,f) Rounded grain of chalcopyrite in breccia-I; (g) Pyrite-II (Py-II) substituted by chalcopyrite and both of them are substituted by galena and sphalerite; (h,i) Occurrences of coarse-grained pyrite-IV (Py-IV) at contact between quartz and carbonate (Cb).
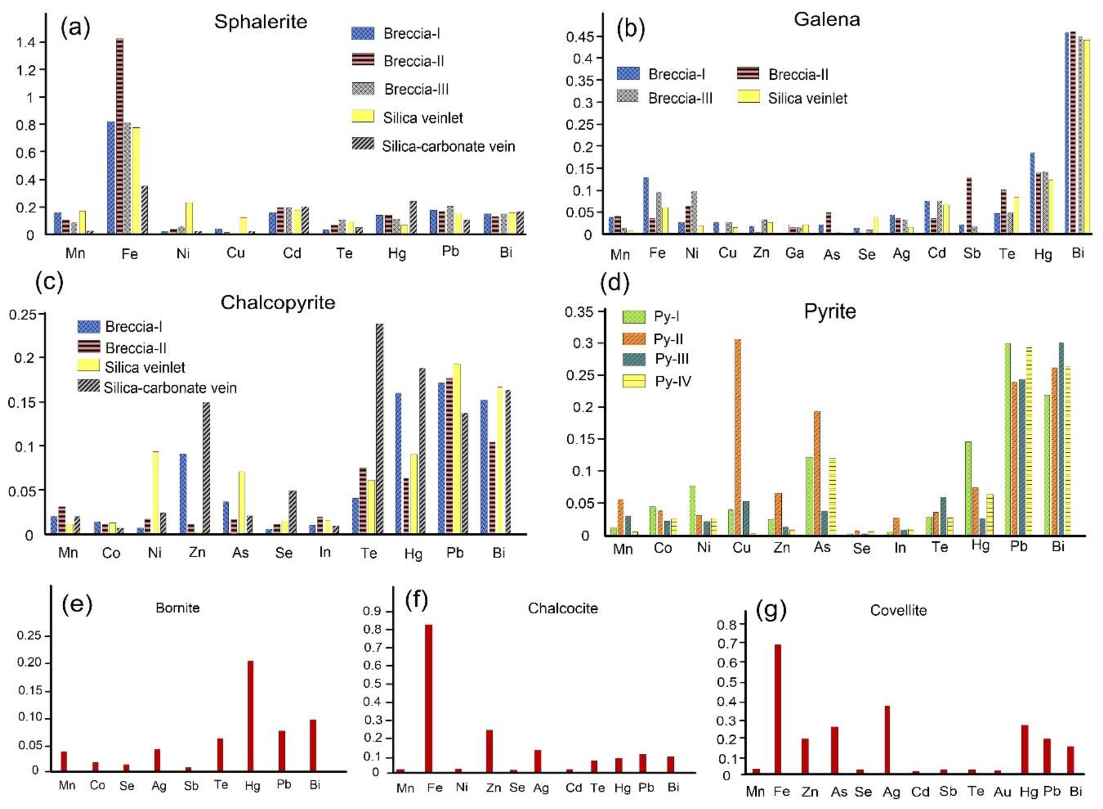
Figure 13.
Histograms showing the average concentrations of the trace elements in different minerals of Shah-Ali-Beiglou deposit: (a) Sphalerite; (b) Galena; (c) Chalcopyrite; (d) Pyrite; (e) Bornite in Breccia-III and silica-sulfide veinlets; (f) Chalcocite in Breccia-III-veinlets; (g) Covellite in Breccia-I and silica-sulfide veinlets (ascribed of ore minerals is based on the texture features; data in wt %).
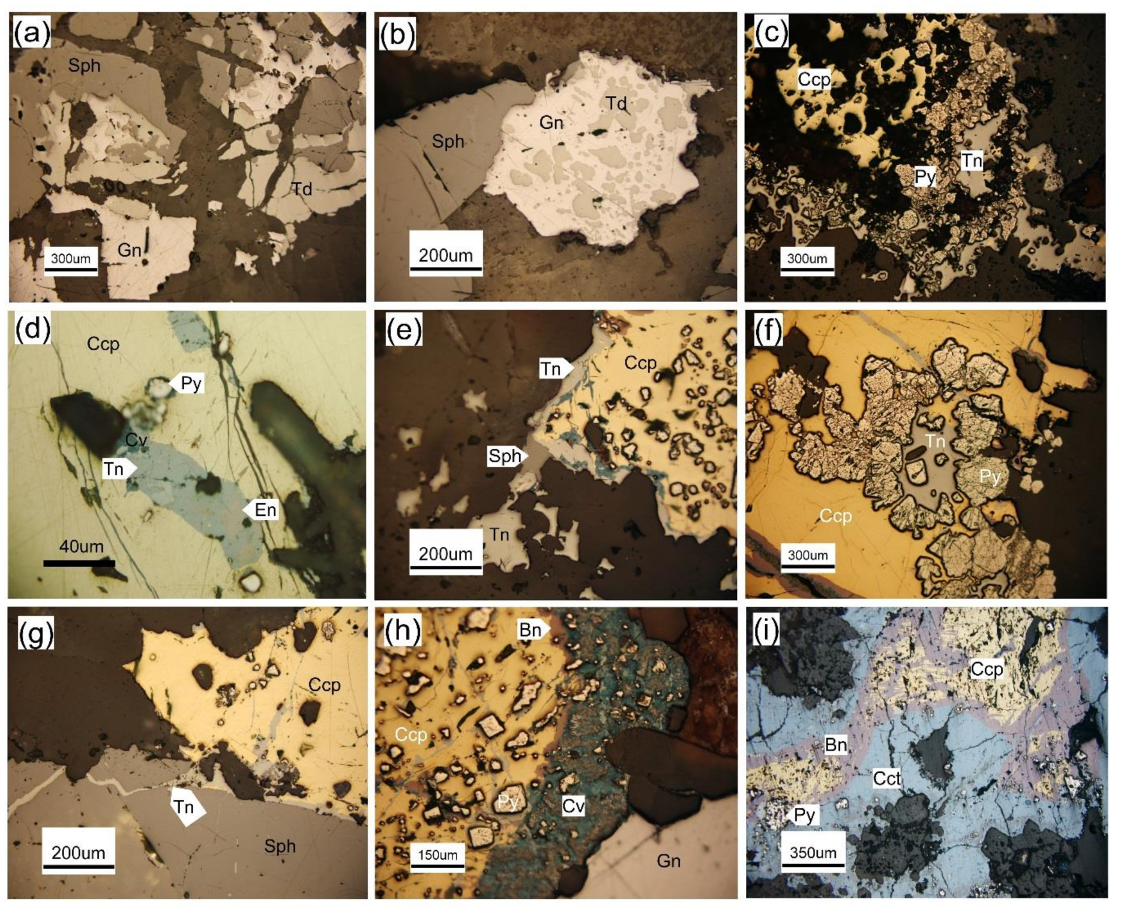
Figure 14.
Photomicrographs of reflected-plain polarized light images of sulfosalt minerals and supergene sulfides from Shah-Ali-Beiglou deposit. (a) Tetrahedrite (Td) accompanied by sphalerite and galena in Breccia-III; (b) Galena is substituted by tetrahedrite in breccia-III; (c) Pyrite is substituted by tennantite (Tn); (d) Occurrence of enargite (En) as a very minor phase associated with tennantite, within chalcopyrite (Ccp); (e) Occurrence of tennantite around chalcopyrite; (f) Tennantite infills cavities of the corroded aggregates of anhedral pyrite (Py) grains within chalcopyrite; (g) Tennantite infills microfractures in sphalerite; (h) Chalcopyrite containing pyrite-II inclusions, is replaced by bornite (Bn) and covellite (Cv) along margins in silica veinlets; (i) Chalcopyrite replaces pyrite and both are replaced by bornite and chalcocite (Cct).
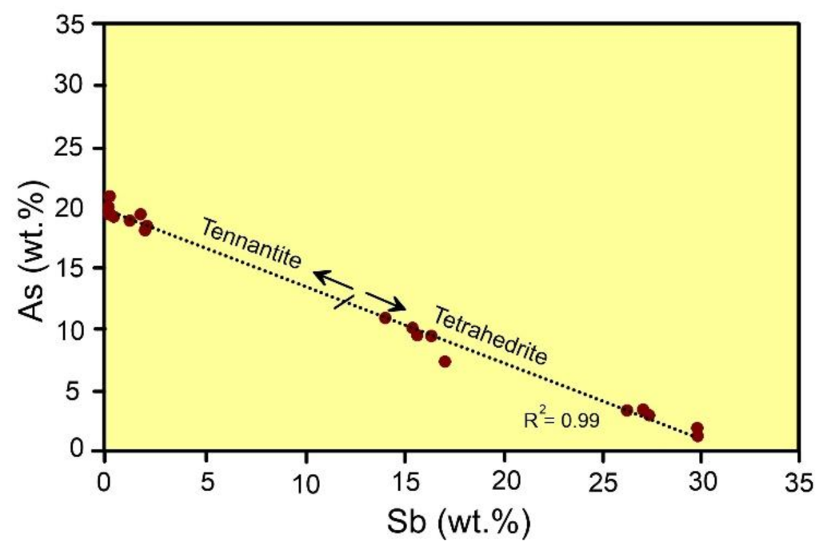
Figure 15.
Chemical variations of As versus Sb in tetrahedrite-tennantite series.
Figure 15.
Chemical variations of As versus Sb in tetrahedrite-tennantite series.
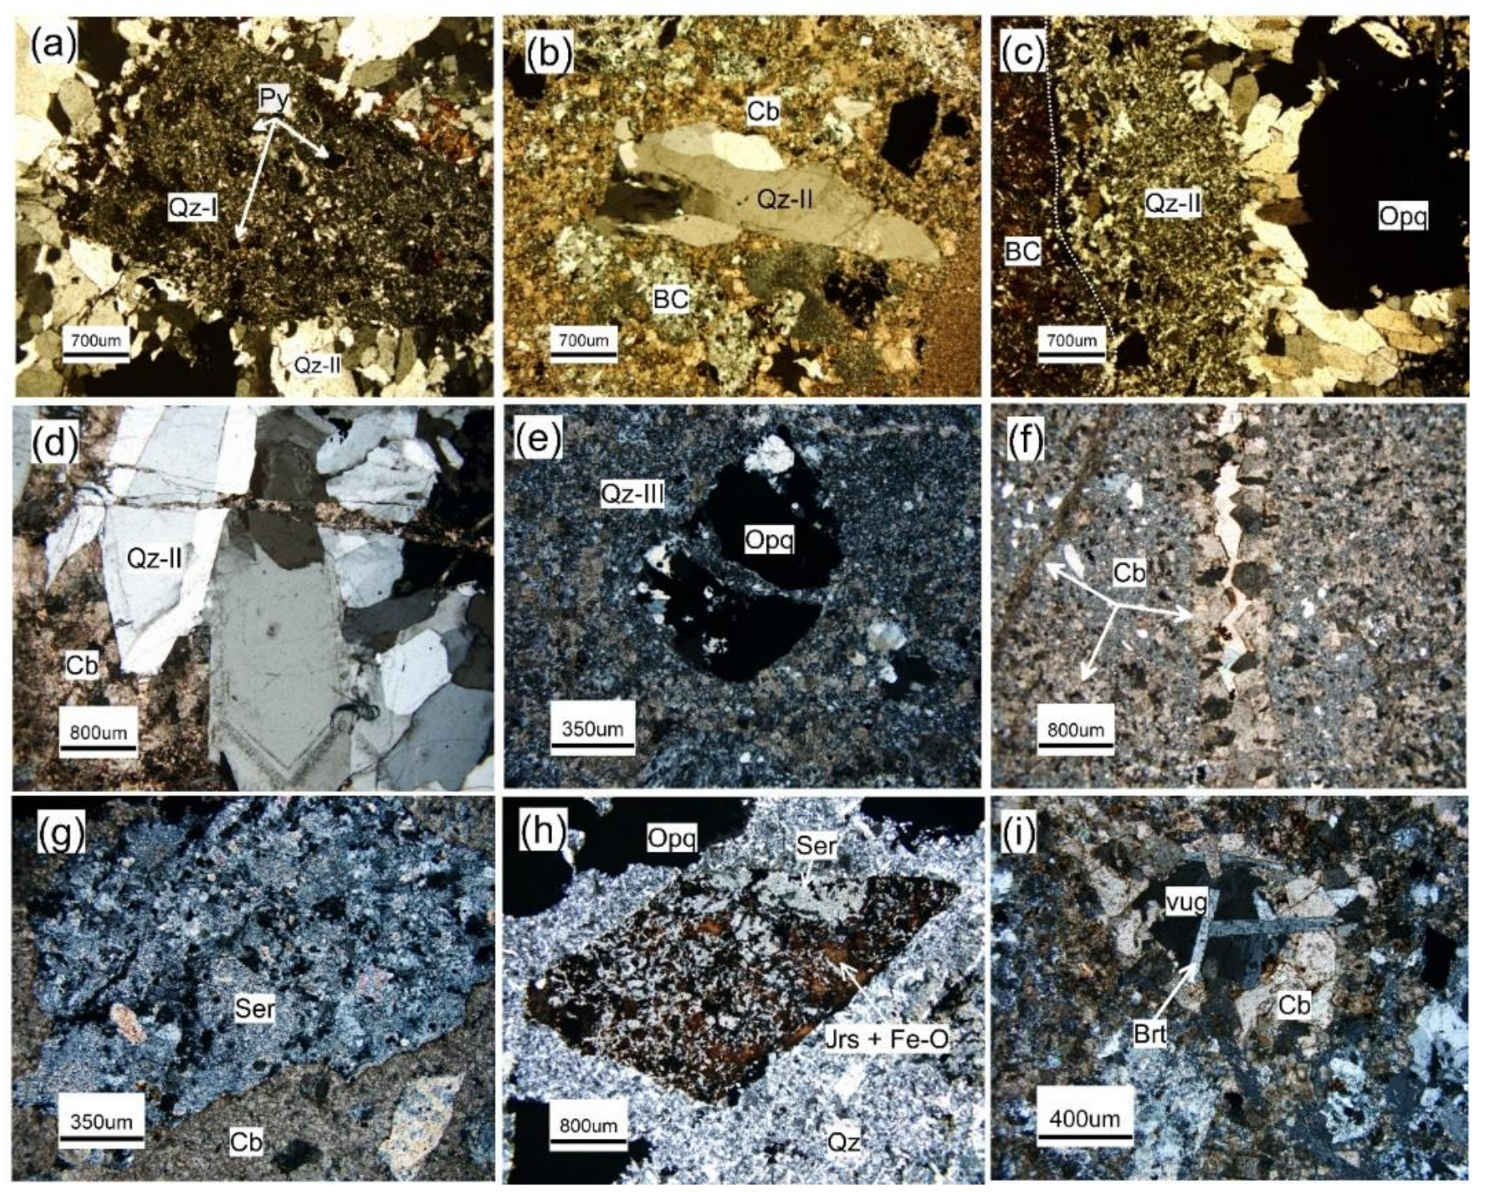
Figure 16.
Photomicrographs of gangue minerals from Shah-Ali-Beiglou deposit showing: (a) Textural relationships between fine-grained quartz crystals (Qz-I) and coarse-grained crystals (Qz-II) which precipitated during pre-ore stage and ore stage mineralization in breccia zones, respectively; (b) Quartz-II in form of breccia clast in breccia-III; (c) Quartz-II in form of breccia cement along with ore in breccia-II; (d) Quartz-II with zonal texture in quartz-carbonate veins; (e) Occurrence of quartz-III within breccia-III; (f) Occurrence of carbonate (Cb) as veinlet without ore; (g) Occurrence of sericite (Ser) as breccia clast; (h) Occurrence of jarosite (Jrs) along with Fe-oxide and sericite within breccia clast; (i) Occurrence of barite (Brt) within a vug.
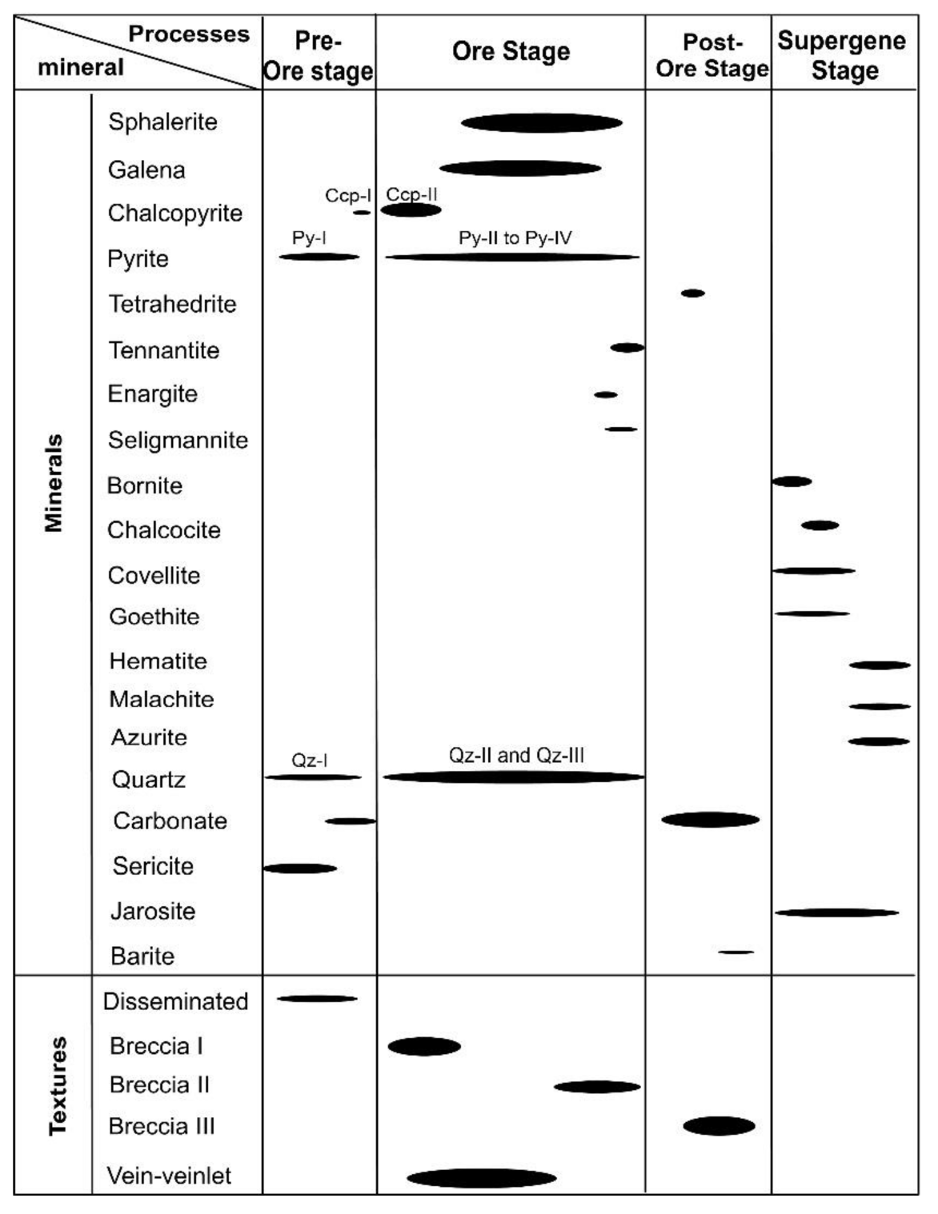
Figure 17.
Paragenetic sequence showing the stages of mineralization in the Shah-Ali-Beiglou deposit. Line width indicates abundance (fine: not abundant, thick: abundant).
Figure 17.
Paragenetic sequence showing the stages of mineralization in the Shah-Ali-Beiglou deposit. Line width indicates abundance (fine: not abundant, thick: abundant).
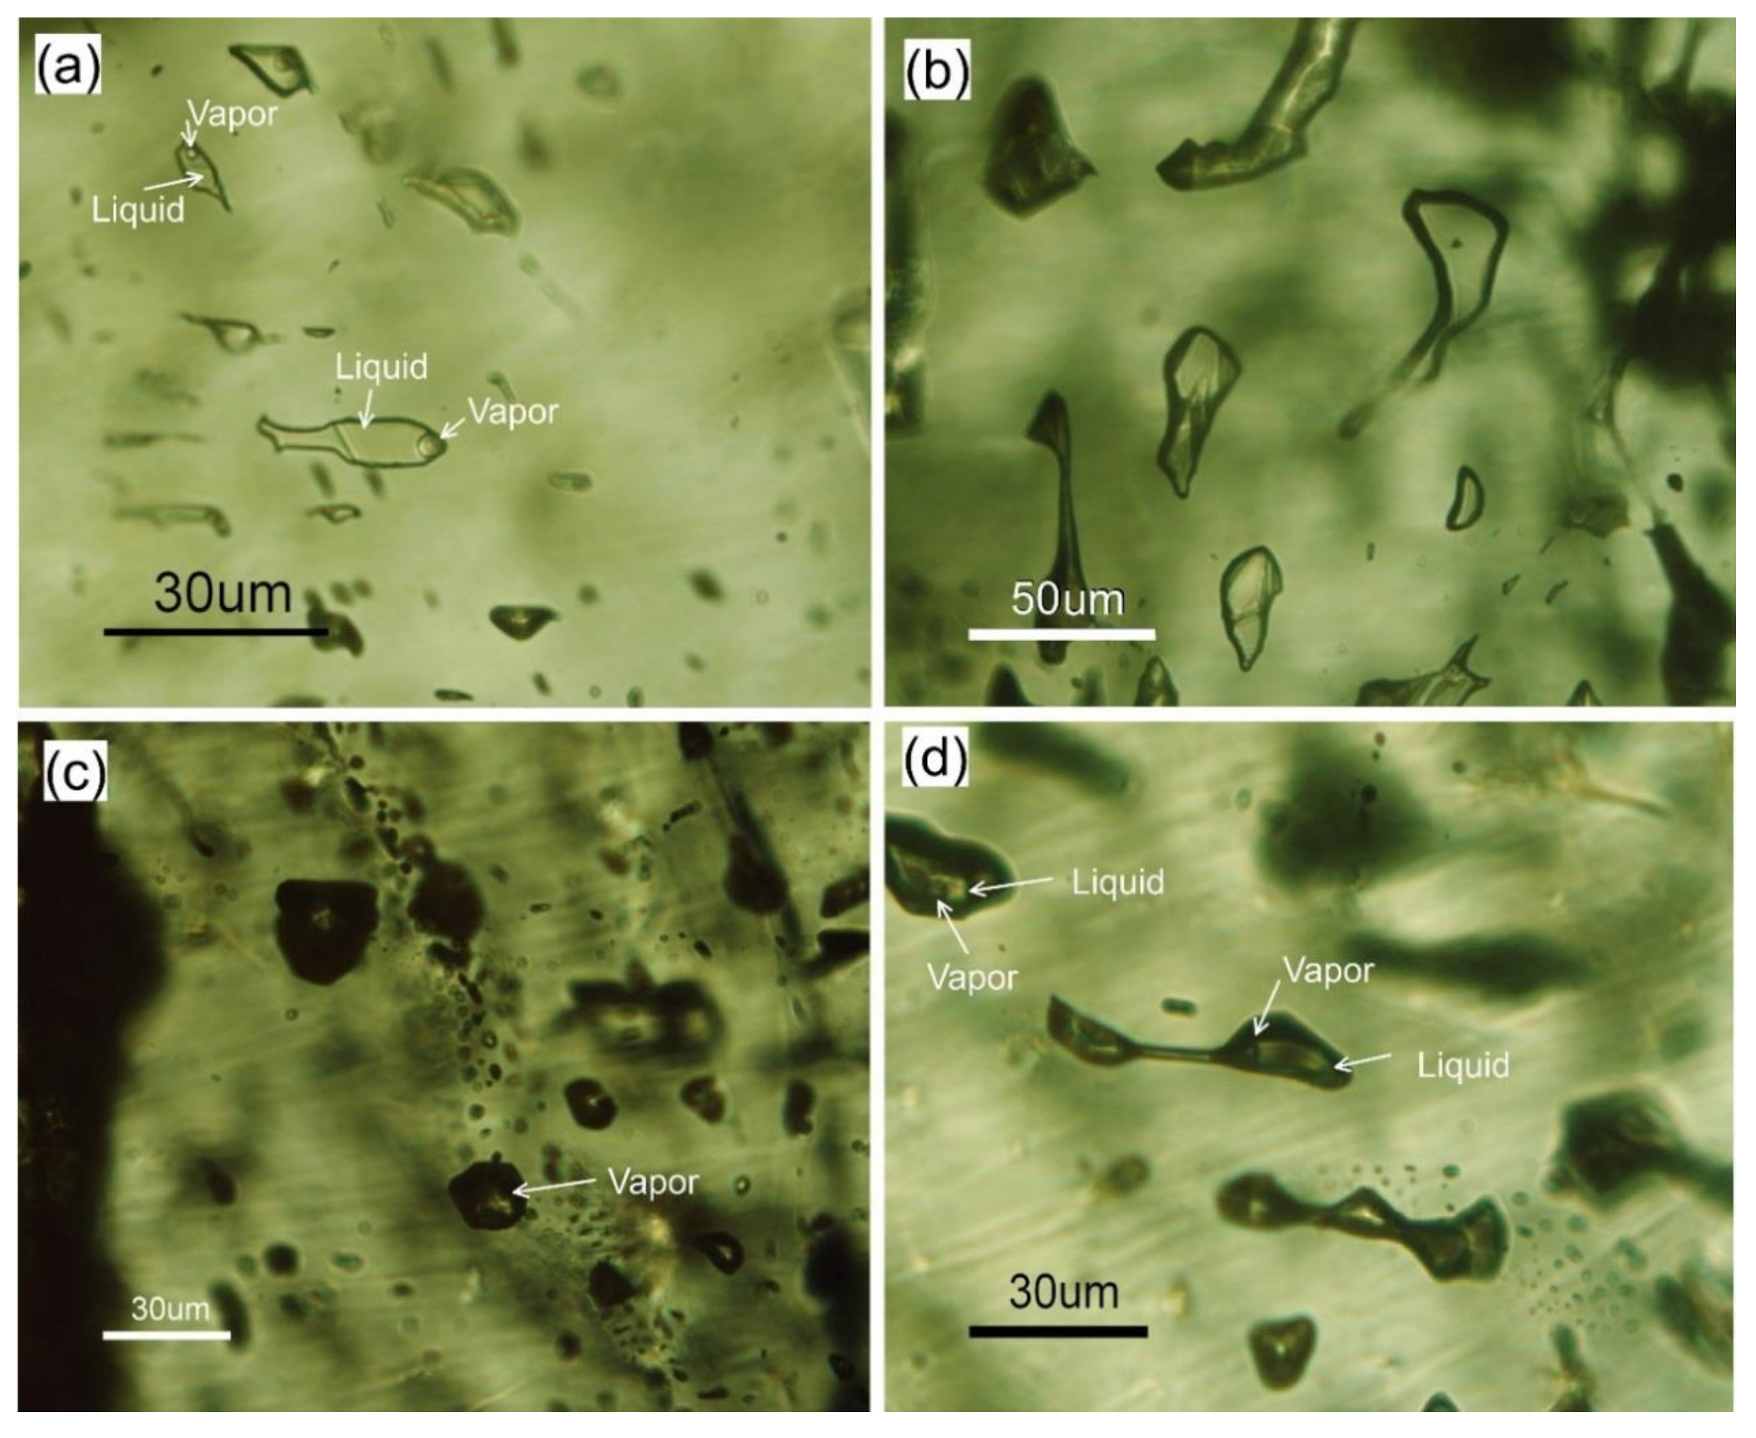
Figure 18.
Microphotographs of the fluid inclusions in sphalerite from the Shah-Ali-Beiglou deposit (at room temperature in plane-polarized light). (a) Primary liquid-rich inclusions; (b) Liquid inclusions; (c) vapor inclusions in sphalerite; (d) Evidence of the necking down in fluid inclusions.
Figure 18.
Microphotographs of the fluid inclusions in sphalerite from the Shah-Ali-Beiglou deposit (at room temperature in plane-polarized light). (a) Primary liquid-rich inclusions; (b) Liquid inclusions; (c) vapor inclusions in sphalerite; (d) Evidence of the necking down in fluid inclusions.
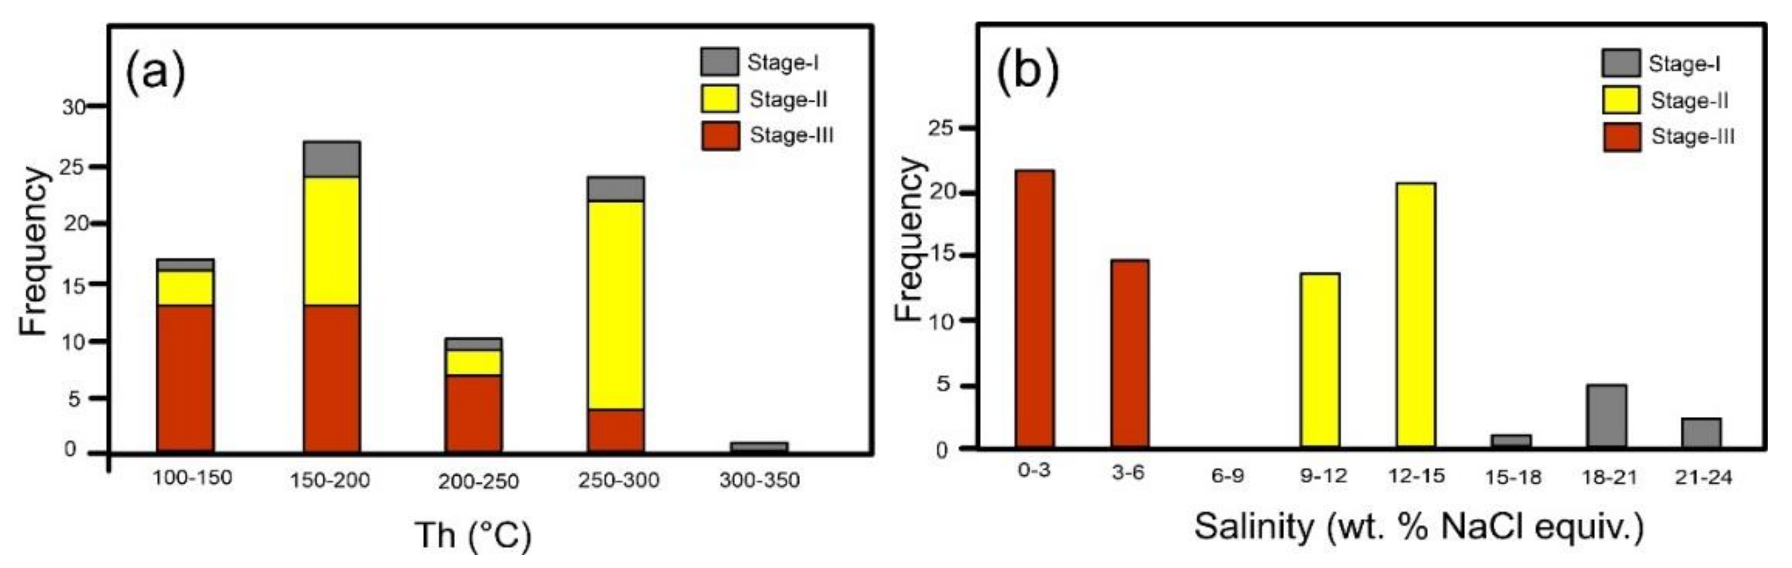
Figure 19.
Histograms of (a) homogenization temperatures (Th) and (b) salinities of primary fluid inclusions in the sphalerite from the Shah-Ali-Beiglou deposit.
Figure 19.
Histograms of (a) homogenization temperatures (Th) and (b) salinities of primary fluid inclusions in the sphalerite from the Shah-Ali-Beiglou deposit.
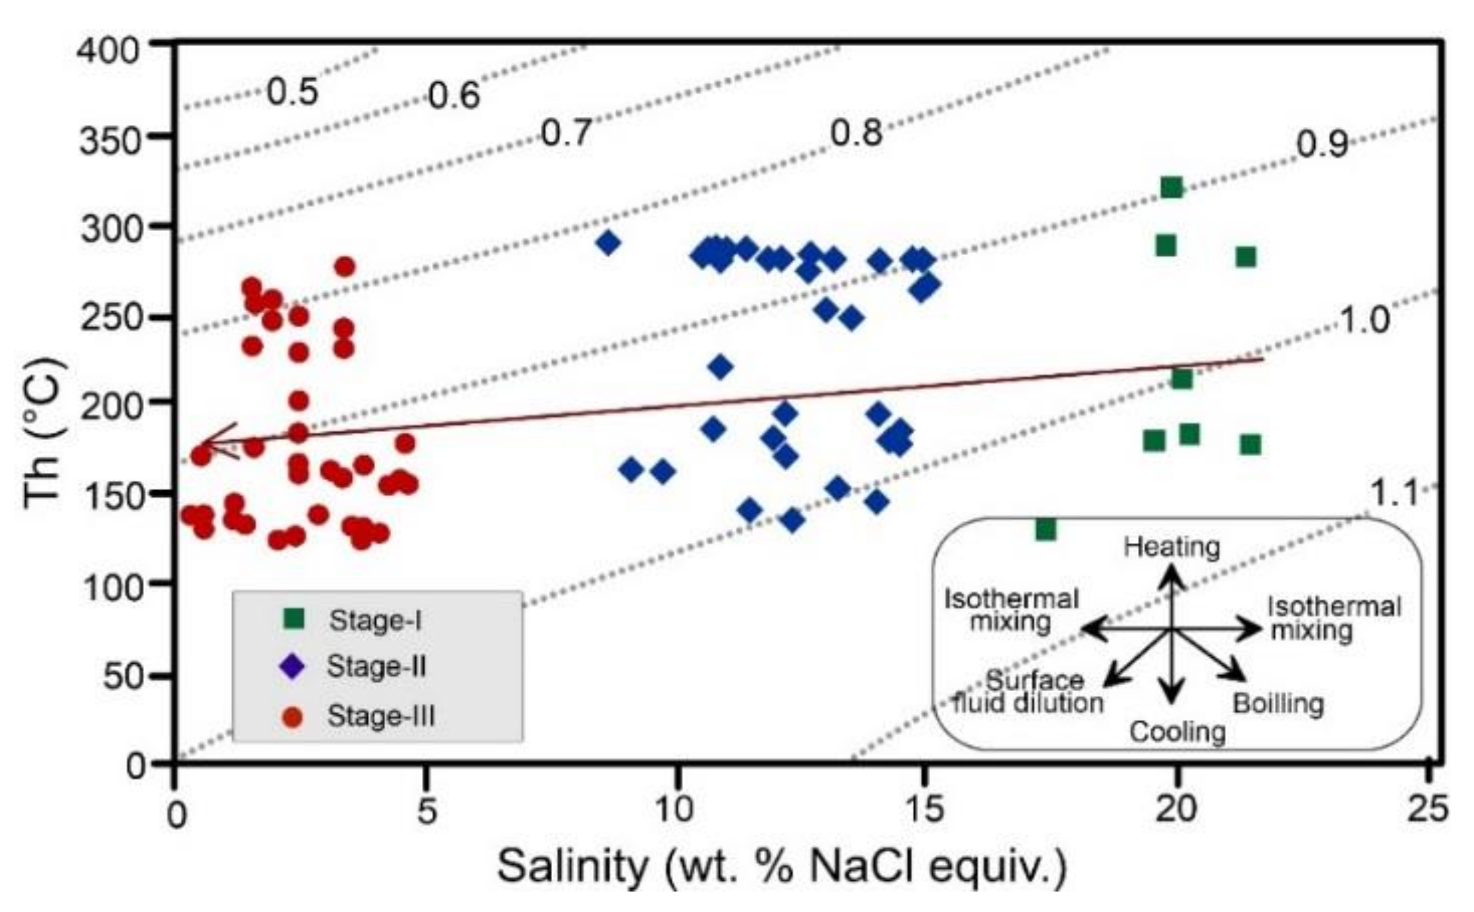
Figure 20.
Homogenization temperature (Th) versus salinity (wt % NaCl eq.) plot of fluid inclusion data in the Shah-Ali-Beiglou deposit showing isothermal mixing trend during mineralization (Doted lines indicate density curves after Wilkinson, [
71]).
Figure 20.
Homogenization temperature (Th) versus salinity (wt % NaCl eq.) plot of fluid inclusion data in the Shah-Ali-Beiglou deposit showing isothermal mixing trend during mineralization (Doted lines indicate density curves after Wilkinson, [
71]).
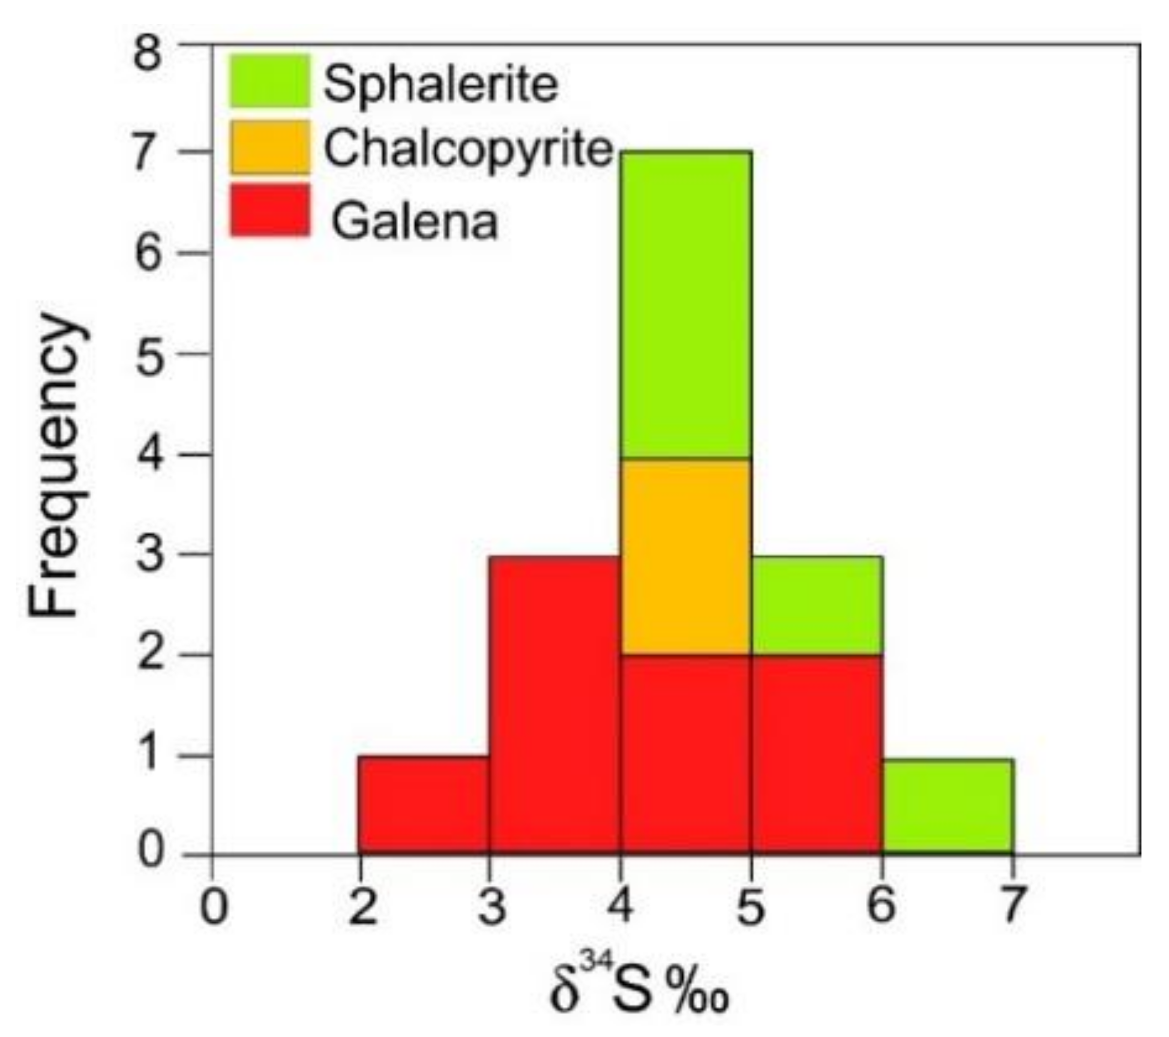
Figure 21.
Histograms illustrating the range of sulfur isotope values for sulfides from the Shah-Ali-Beiglou deposit.
Figure 21.
Histograms illustrating the range of sulfur isotope values for sulfides from the Shah-Ali-Beiglou deposit.
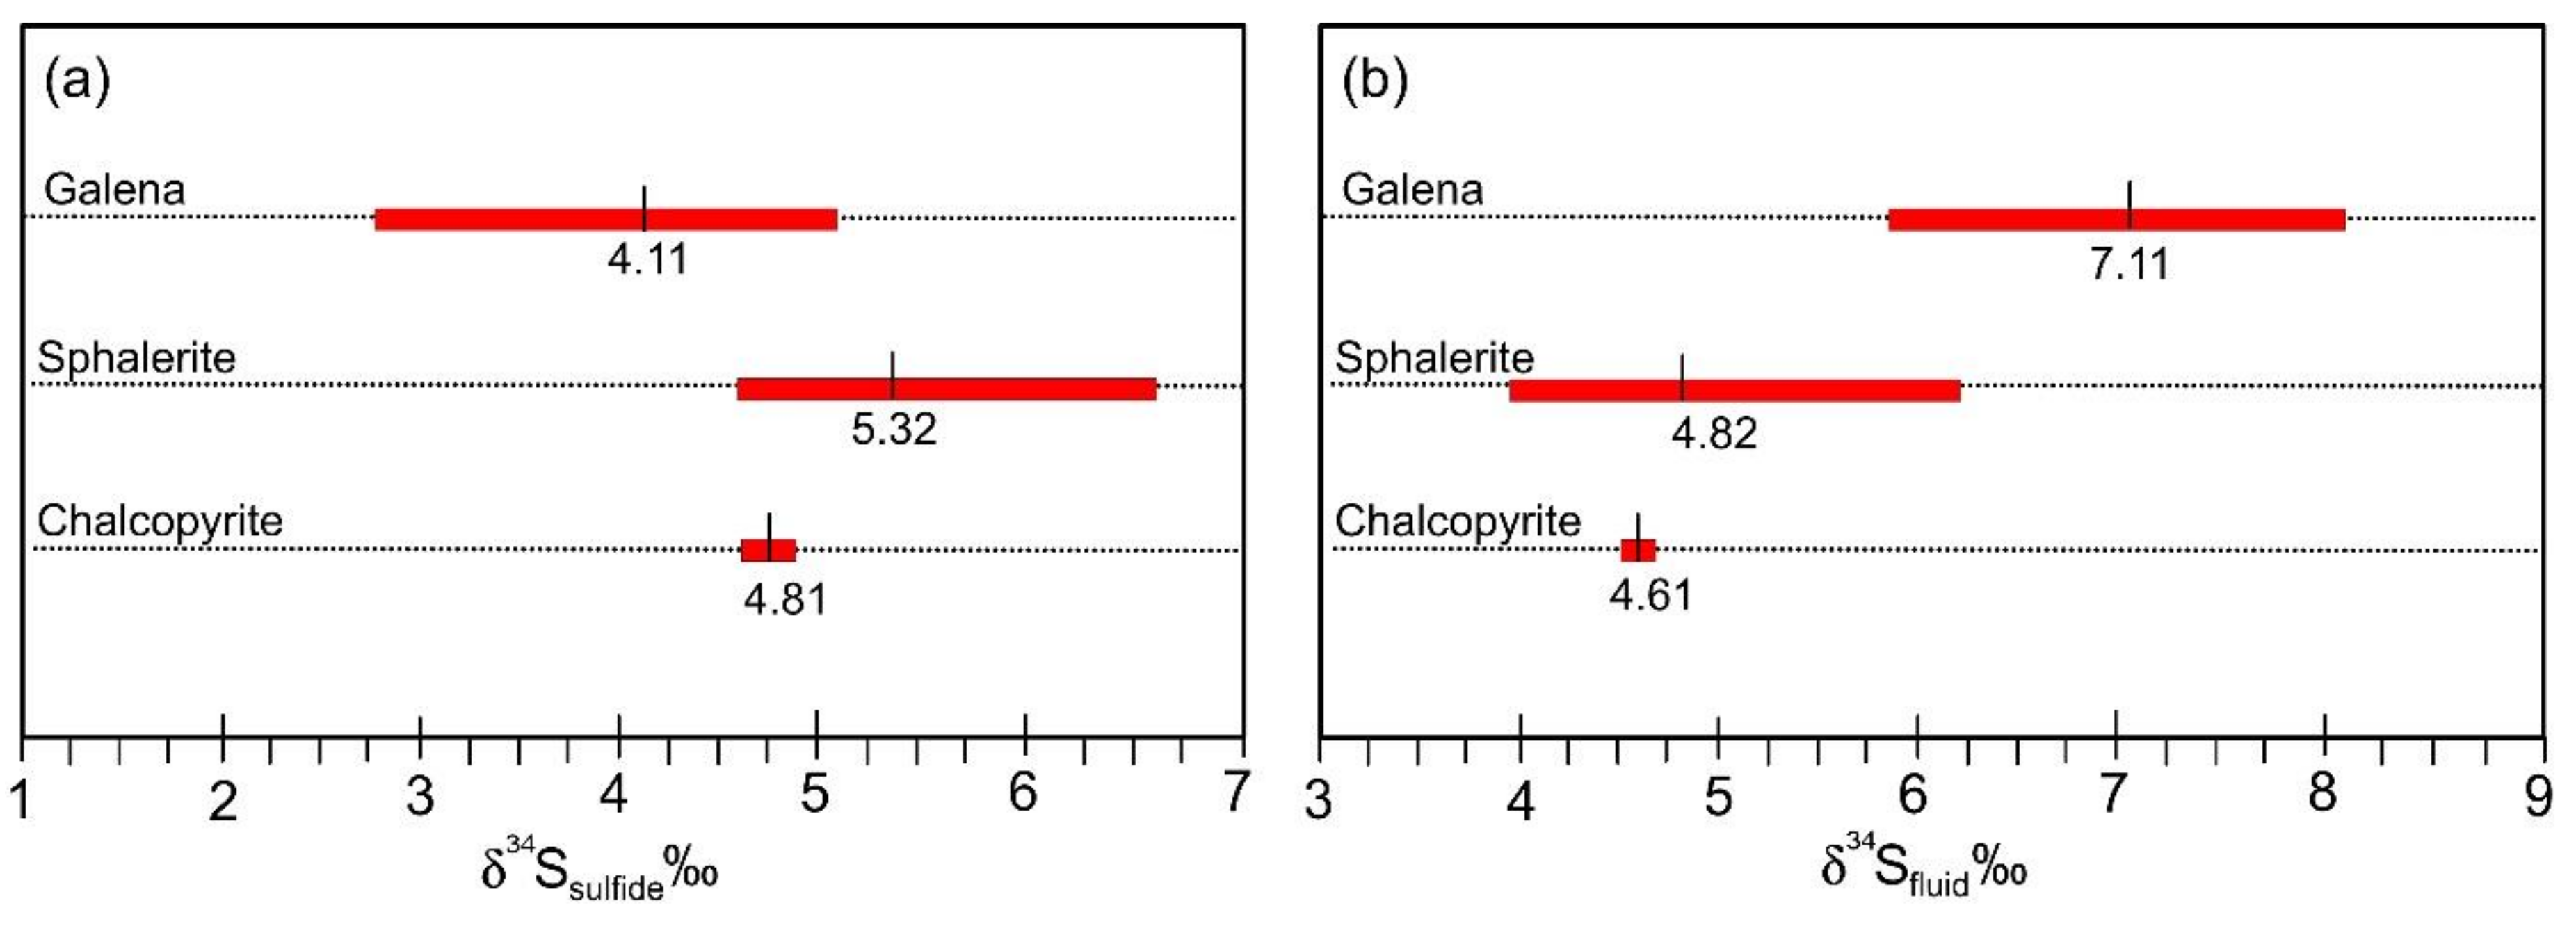
Figure 22.
Range (bars) and average (numbers) of δ34S sulfide (a) and calculated δ34SH2S (b) values in the Shah-Ali-Beiglou deposit.
Figure 22.
Range (bars) and average (numbers) of δ34S sulfide (a) and calculated δ34SH2S (b) values in the Shah-Ali-Beiglou deposit.
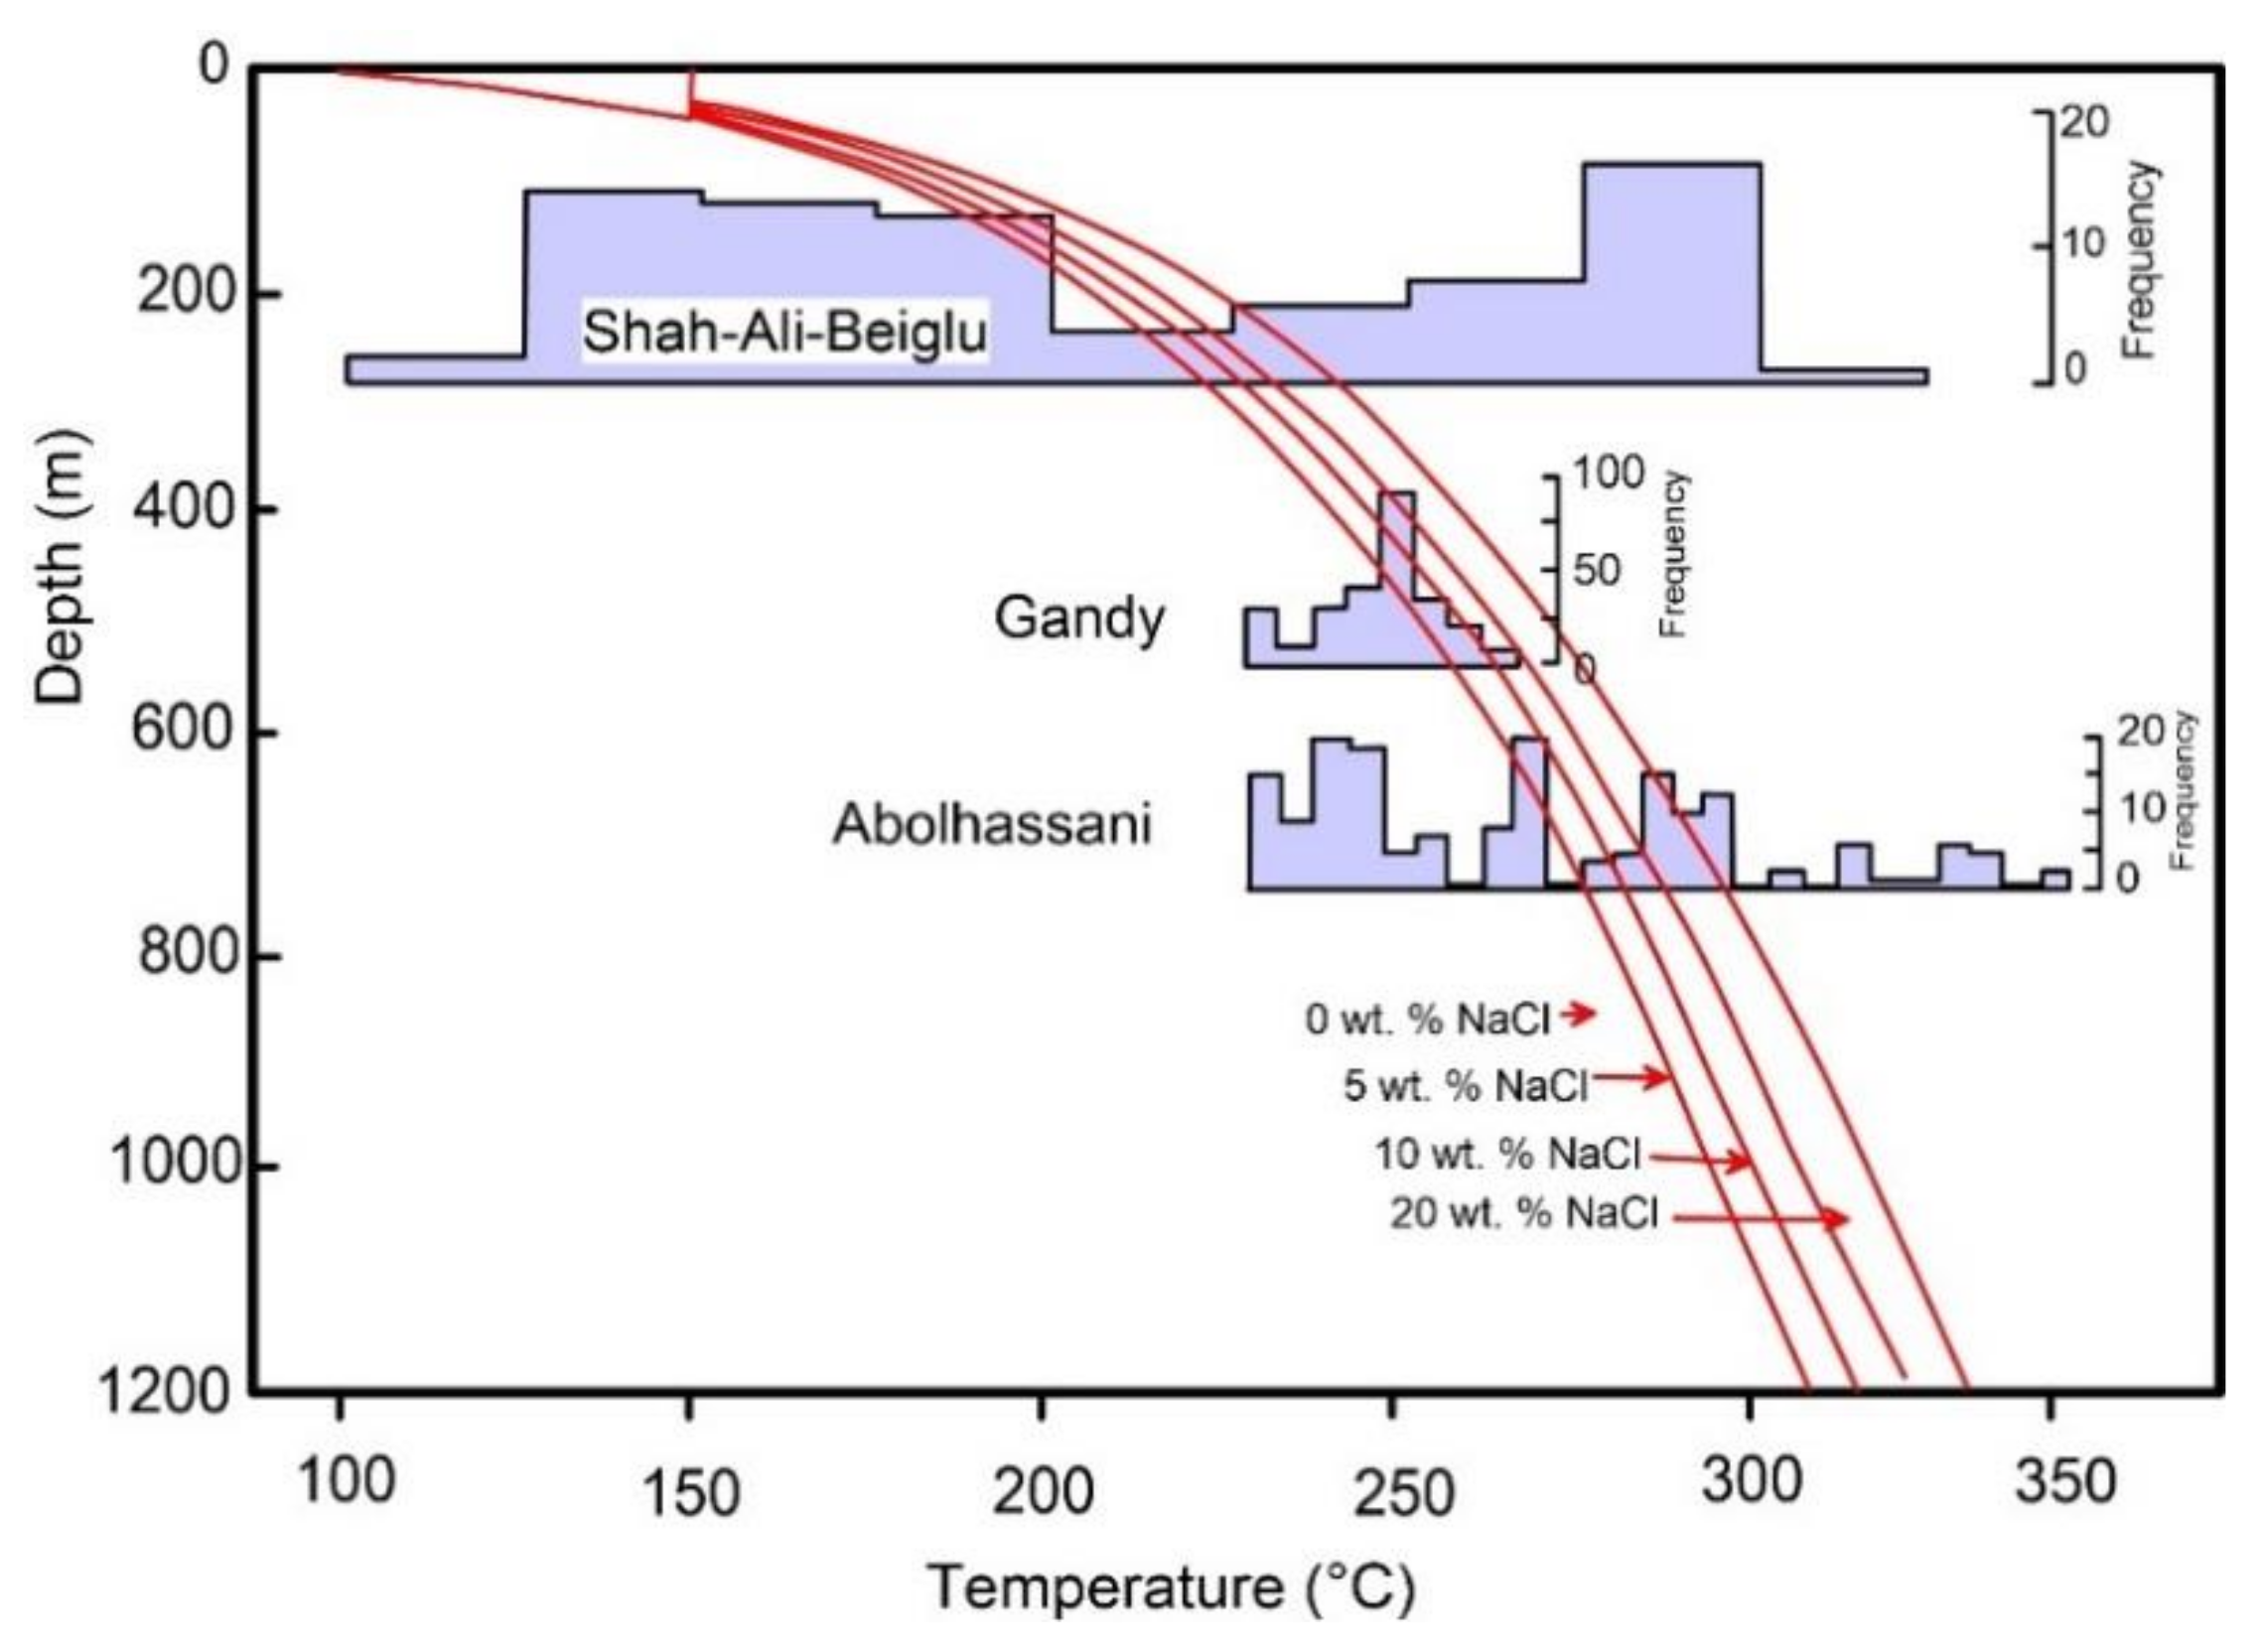
Figure 23.
Temperature-depth diagram with boiling-point curves for pure H
2O (0 wt %) and for brine of different composition given in wt % NaCl (from Haas [
100]). Shah-Ali-Beiglou data were fitted at the mean Th values to the 8.6 wt % NaCl curve. Histograms of Gandy and Abolhassani are based on Shamanian et al. [
82].
Figure 24.
Block diagrams showing structural and mineralization evolution of the Shah-Ali-Beiglou deposit in the study area. (a) Displacement of rock units by sinistral strike-slip fault in a N10°–20° E direction; (b) Rising quartz monzonite magma through the fault and formation of dike along the fault plane; (c) Development of ore mineralization along breccia zone within the quartz-monzonite dike as vein-veinlet, breccia cement and disseminated.
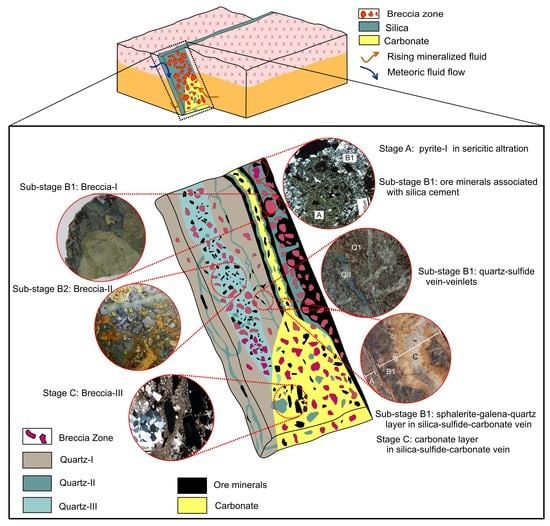
Figure 25.
Schematic presentation of Shah-Ali-Beiglou vein-type deposit, illustrating multiple phases of ore mineral deposition and fracturing events. Stage A: The pre-ore stage in which pyrite-I was deposited as isolated grains. Stage B1: The earliest stage of ore mineralization (ore stage) was developed as hydrothermal breccias and vein-veinlets. Stage B2: The ore mineralization continued as breccia cement associated with pyrite. Stage C: The post-ore stage, which is marked by mostly carbonate as breccia cement and vein-veinlet that are associated with tetrahedrite.
Table 1.
The main features of epithermal deposits in the Tarom-Hashjin Metallogenic Province a.
Table 1.
The main features of epithermal deposits in the Tarom-Hashjin Metallogenic Province a.
| Deposit | Chodarchay | Aqkand | Glojeh | Khalifehlu | Nikuyeh | Lahneh |
|---|
| Host rocks | quartz monzonite to quartz syenite pluton | Eocene andesitic basalt lavas | volcanic and volcaniclastic rocks | Eocene volcanic and volcaniclastic rocks | monzodiorite | Eocene volcanic and volcaniclastic rocks |
| Main minerals | chalcopyrite, pyrite, galena, sphalerite, enargite, tetrahedrite-tennantite | chalcopyrite and hematite | Sphalerite, galena, chalcopyrite, native silver, native gold, bornite, chalcocite | pyrite, chalcopyrite, native gold, bornite, chalcocite, covellite | hematite, chalcopyrite, galena, sphalerite, bornite, pyrite | pyrite, chalcopyrite, bornite, galena, sphalerite, tetrahedrite |
| Style of alteration | propylitic, sericitic, sericitic tourmaline, argillic, and silicic | silicic, propylitic, and chloritic | propylitic, sericitic, and argillic | vuggy quartz, argillic, and propylitic | silicic, sericitic, argillic, carbonate, and propylitic | silicic, sericitic, and argillic |
| Textures | veinlets, open space filling, hydrothermal breccias and disseminated mineralization | breccia veins, open space filling, comb, colloform, cockade, crustiform, and plumose | vein-veinlet, open space filling, replacement, and breccias | vein-veinlet, open space filling, replacement, dessiminated, and breccias | open space filling, vein-veinlet, colloform, and crustiform | vein-veinlet, open space filling, and breccias |
| Main metals | Cu-Au | Base metals | Ag-base metals | Cu-Au | Au- base metals | Base metals-Au |
| Tonnage and grade | 0.5 Mt averaging 0.9% Cu and 2 g/t Au | - | 2.3 Mt averaging 3% Pb, 2.2% Zn, 1.5% Cu, and 350 g/t Ag | 60,000 tonnes averaging 8% Cu, and 6 g/t Au | - | - |
| Type of deposit | HS epithermal | IS epithermal | IS-HS epithermal | HS epithermal | LS epithermal | IS epithermal |
| Reference | Yasami et al. [35] | Kouhestani et al. [18] | Mehrabi et al. [3] | Hosseinzadeh et al. [36] | Aghajani et al. [47] | Zamanian et al. [48] |
Table 2.
Major and trace element contents from the Shah-Ali-Beiglou stock.
Table 2.
Major and trace element contents from the Shah-Ali-Beiglou stock.
| Sample ID | MG-1 | MG-2 | MG-3 | MG-4 | MG-5 | MG-6 | MG-7 | MG-8 | MG-9 |
|---|
| wt % | | | | | | | | | |
| SiO2 | 66.12 | 64.22 | 67.78 | 68.24 | 57.23 | 57.85 | 59.21 | 59.95 | 61.27 |
| TiO2 | 0.56 | 0.64 | 0.56 | 0.51 | 0.94 | 0.84 | 0.82 | 1.17 | 0.73 |
| Al2O3 | 13.38 | 15.22 | 13.71 | 13.64 | 15.71 | 15.14 | 15.32 | 15.58 | 14.21 |
| Fe2O3t | 3.82 | 4.02 | 3.85 | 3.18 | 7.37 | 7.3 | 6.12 | 6.13 | 5.99 |
| MnO | 0.07 | 0.09 | 0.11 | 0.06 | 0.14 | 0.12 | 0.12 | 0.08 | 0.13 |
| MgO | 3.3 | 2.6 | 1.63 | 1.17 | 2.84 | 5.75 | 3.49 | 3.8 | 4.54 |
| K2O | 4.79 | 5.15 | 5.22 | 5.59 | 3.85 | 3.66 | 5.81 | 4.14 | 4 |
| Na2O | 3.28 | 3.25 | 3.87 | 3.71 | 3.56 | 3.31 | 3.1 | 3.62 | 4.41 |
| P2O5 | 0.17 | 0.18 | 0.2 | 0.16 | 0.48 | 0.24 | 0.37 | 0.28 | 0.21 |
| L.O.I | 1.88 | 1.65 | 0.88 | 1.36 | 2.12 | 0.89 | 1.12 | 0.78 | 1.3 |
| Total | 99.59 | 99.75 | 100.01 | 99.81 | 99.85 | 99.77 | 99.9 | 100.03 | 100.03 |
| ppm | | | | | | | | | |
| Ag | 8 | 11 | 14 | 17 | 10 | 21 | 19 | 24 | 13 |
| Ba | 475 | 918 | 648 | 605 | 678 | 551 | 697 | 719 | 716 |
| Ce | 57.12 | 57.62 | 94.12 | 91.08 | 31.64 | 28.69 | 17.36 | 5.94 | 9.81 |
| Co | 10 | 14 | 9 | 4 | 19 | 25 | 15 | 20 | 14 |
| Cr | 153 | 42 | 47 | 83 | 63 | 103 | 136 | 117 | 53 |
| Cs | 2.14 | 3.13 | 2.48 | 2.69 | 6.12 | 6.14 | 1.86 | 1.94 | 2.06 |
| Cu | 4 | 2 | 8 | 7 | 18 | 9 | 29 | 5 | 8 |
| Dy | 4.41 | 4.12 | 3.86 | 4.24 | 4.68 | 4.54 | 4.12 | 4.08 | 4.18 |
| Er | 2.77 | 2.69 | 2.78 | 2.54 | 2.66 | 2.58 | 3.12 | 3.18 | 2.81 |
| Eu | 1.08 | 0.98 | 0.96 | 0.94 | 1.34 | 1.41 | 1.21 | 1.12 | 1.08 |
| Ga | 14.8 | 14.5 | 132.9 | 14.4 | 17.2 | 17.4 | 17.2 | 17.4 | 16.2 |
| Gd | 4.41 | 4.61 | 4.54 | 4.48 | 5.81 | 5.88 | 5.41 | 5.38 | 5.12 |
| Hf | 12 | 9 | 10 | 12 | 10 | 7 | 7 | 10 | 8 |
| Ho | 0.91 | 0.89 | 0.93 | 0.88 | 1.02 | 1.04 | 0.98 | 0.96 | 1.01 |
| La | 45.12 | 30.14 | 49.81 | 44.73 | 41.21 | 27.14 | 34.01 | 38.06 | 28.92 |
| Lu | 0.48 | 0.51 | 0.44 | 0.42 | 0.39 | 0.41 | 0.42 | 0.43 | 0.45 |
| Nb | 24.31 | 18.89 | 32.16 | 35.75 | 26.61 | 15.45 | 19.72 | 20.14 | 22.06 |
| Nd | 26.61 | 24.14 | 22.72 | 22.61 | 29.31 | 33.14 | 21.17 | 16.9 | 17.81 |
| Ni | 25 | 12 | 11 | 14 | 21 | 38 | 20 | 31 | 32 |
| Pb | 17 | 19 | 33 | 17 | 12 | 8 | 9 | 7 | 7 |
| Pr | 7.21 | 7.32 | 7.14 | 6.98 | 6.59 | 6.54 | 7.06 | 7.21 | 6.94 |
| Rb | 177 | 149 | 217 | 284 | 130 | 115 | 204 | 120 | 135 |
| Sc | 3 | 2 | 3 | 4 | 6 | 7 | 4 | 5 | 3 |
| Sm | 4.14 | 4.21 | 4.36 | 4.82 | 5.68 | 5.72 | 5.36 | 5.21 | 5.06 |
| S | 8290 | 433 | 508 | 780 | 7626 | 400 | 126 | 98 | 176 |
| Sr | 220 | 229 | 242 | 259 | 469 | 390 | 385 | 318 | 290 |
| Ta | 1.36 | 1.52 | 2.06 | 1.86 | 1.19 | 0.8 | 1.13 | 1.18 | 1.09 |
| Tb | 0.81 | 0.77 | 0.74 | 0.82 | 0.89 | 0.92 | 1.01 | 0.84 | 0.86 |
| Th | 24 | 12 | 27 | 47 | 6 | 8 | 15 | 10 | 11 |
| Tm | 0.41 | 0.39 | 0.44 | 0.43 | 0.46 | 0.44 | 0.41 | 0.38 | 0.38 |
| U | 5 | 9 | 6 | 13 | 8 | 1 | 1 | 2 | 0 |
| V | 79 | 71 | 67 | 56 | 155 | 157 | 124 | 124 | 128 |
| W | 11 | 0 | 10 | 1 | 0 | 0 | 0 | 0 | 3 |
| Y | 44 | 37 | 59 | 72 | 33 | 31 | 52 | 30 | 34 |
| Yb | 2.28 | 2.56 | 3.47 | 3.51 | 1.99 | 2.81 | 3.26 | 1.98 | 1.83 |
| Zn | 40 | 49 | 157 | 37 | 93 | 72 | 54 | 68 | 68 |
| Zr | 239 | 268 | 363 | 375 | 209 | 178 | 199 | 207 | 192 |
| F | 279 | 433 | 1220 | 1155 | 564 | 0 | 848 | 60 | 0 |
| Cl | 81 | 79 | 157 | 427 | 292 | 161 | 461 | 66 | 113 |
| Ce/Ce* | 0.68 | 0.88 | 1.04 | 1.10 | 0.41 | 0.49 | 0.25 | 0.08 | 0.15 |
| Eu/Eu* | 0.799 | 0.699 | 0.679 | 0.639 | 0.729 | 0.76 | 0.70 | 0.66 | 0.66 |
Table 3.
Summary of average EPMA data for primary minerals from the Shah-Ali-Beiglou deposit (concentrations in wt %). B.I: Breccia I, V.I: sulfide-silica veinlets, and V.II: silica-sulfide-carbonate vein.
Table 3.
Summary of average EPMA data for primary minerals from the Shah-Ali-Beiglou deposit (concentrations in wt %). B.I: Breccia I, V.I: sulfide-silica veinlets, and V.II: silica-sulfide-carbonate vein.
| | Sphalerite (n = 42) | Galena (n = 29) | Chalcopyrite (n = 35) | Pyrite (n = 52) |
| Data on the Basis of wt % |
| | B. I | B. II | B. III | veinlet | vein | B. I | B. II | B. III | veinlet | B. I | B. II | veinlet | vein | Py-I | Py-II | Py-III | Py-IV |
| S | 34.25 | 33.67 | 33.61 | 33.97 | 34.52 | 13.21 | 13.13 | 12.8 | 13.37 | 34.41 | 34.51 | 34.73 | 34.55 | 53.39 | 53.06 | 53.52 | 53.65 |
| Mn | 0.15 | 0.1 | 0.08 | 0.16 | 0.02 | 0.03 | 0.04 | 0.01 | 0.01 | 0.02 | 0.03 | 0.01 | 0.02 | 0.01 | 0.05 | 0.03 | <mdl |
| Fe | 0.82 | 1.43 | 0.81 | 0.78 | 0.36 | 0.13 | 0.03 | 0.09 | 0.06 | 29.94 | 30.68 | 30.66 | 30.82 | 45.68 | 45.86 | 46.37 | 46.06 |
| Co | 0.01 | <mdl | 0.01 | 0.02 | <mdl | <mdl | <mdl | 0.01 | 0.01 | 0.01 | 0.01 | 0.01 | 0.01 | 0.04 | 0.04 | 0.02 | 0.02 |
| Ni | 0.02 | 0.03 | 0.05 | 0.23 | 0.02 | 0.02 | 0.06 | 0.09 | 0.02 | 0.01 | 0.02 | 0.09 | 0.02 | 0.07 | 0.03 | 0.02 | 0.02 |
| Cu | 0.03 | 0.01 | <mdl | 0.12 | 0.02 | 0.02 | <mdl | 0.03 | 0.01 | 33.99 | 33.59 | 33.79 | 33.57 | 0.04 | 0.3 | 0.05 | <mdl |
| Zn | 64.42 | 64.27 | 64.16 | 64.31 | 64.15 | 0.01 | <mdl | 0.03 | 0.03 | 0.09 | 0.01 | <mdl | 0.15 | 0.02 | 0.06 | 0.01 | 0.01 |
| As | <mdl | 0.01 | 0.02 | <mdl | <mdl | 0.02 | 0.05 | <mdl | <mdl | 0.04 | 0.02 | 0.07 | 0.02 | 0.12 | 0.19 | 0.04 | 0.12 |
| Se | 0.01 | <mdl | 0.02 | <mdl | <mdl | 0.01 | <mdl | 0.01 | 0.04 | <mdl | 0.01 | 0.01 | 0.05 | <mdl | 0.01 | <mdl | <mdl |
| Ag | 0.01 | <mdl | <mdl | 0.04 | <mdl | 0.04 | 0.03 | 0.03 | 0.01 | <mdl | <mdl | <mdl | <mdl | <mdl | 0.01 | <mdl | <mdl |
| Cd | 0.15 | 0.19 | 0.19 | 0.17 | 0.19 | 0.07 | 0.03 | 0.07 | 0.06 | <mdl | <mdl | <mdl | <mdl | <mdl | <mdl | <mdl | <mdl |
| Te | 0.03 | 0.06 | 0.1 | 0.09 | 0.05 | 0.04 | 0.1 | 0.05 | 0.08 | 0.04 | 0.07 | 0.06 | 0.23 | 0.03 | 0.03 | 0.06 | 0.03 |
| Hg | 0.14 | 0.13 | 0.11 | 0.06 | 0.23 | 0.18 | 0.14 | 0.14 | 0.12 | 0.22 | 0.06 | 0.09 | 0.18 | 0.14 | 0.07 | 0.02 | 0.06 |
| pb | 0.17 | 0.16 | 0.2 | 0.14 | 0.1 | 86.41 | 86.31 | 86.59 | 86.3 | 0.18 | 0.17 | 0.19 | 0.13 | 0.3 | 0.24 | 0.24 | 0.29 |
| Bi | 0.15 | 0.13 | 0.15 | 0.16 | 0.16 | 0.45 | 0.46 | 0.44 | 0.43 | 0.15 | 0.1 | 0.16 | 0.16 | 0.22 | 0.26 | 0.3 | 0.26 |
| Tot. | 100.43 | 100.51 | 99.6 | 100.33 | 99.94 | 100.81 | 100.63 | 100.53 | 100.66 | 99.25 | 99.37 | 99.97 | 100.02 | 100.11 | 100.28 | 100.72 | 100.71 |
| Data on the Basis of Apfu |
| S | 0.99218 | 0.97538 | 0.97364 | 0.98407 | 1 | 0.99969 | 1 | 0.99968 | 0.99879 | 2 | 1.99976 | 1.99977 | 1.99883 | 1.66506 | 1.65476 | 1.66911 | 1.67316 |
| Mn | 0.00271 | 0.00179 | 0.00145 | 0.00288 | 0.00037 | 0.00128 | 0.00172 | 0.00043 | 0.00043 | 0.00034 | 0.0005 | 0.00017 | 0.00033 | 0.00022 | 0.00109 | 0.00065 | 0 |
| Fe | 0.01458 | 0.02522 | 0.01446 | 0.01382 | 0.00649 | 0.00547 | 0.00127 | 0.00378 | 0.00254 | 0.49798 | 0.50795 | 0.50547 | 0.50741 | 0.99023 | 0.98403 | 0.99297 | 0.99319 |
| Co | 0.00017 | 0 | 0.00017 | 0.00034 | 0 | 0 | 0 | 0.0004 | 0.0004 | 0.00016 | 0.00016 | 0.00016 | 0.00016 | 0.00082 | 0.00081 | 0.00041 | 0.00041 |
| Ni | 0.00034 | 0.0005 | 0.00085 | 0.00388 | 0.00034 | 0.0008 | 0.00241 | 0.0036 | 0.00081 | 0.00016 | 0.00032 | 0.00141 | 0.00031 | 0.00144 | 0.00061 | 0.00041 | 0.00041 |
| Cu | 0.00047 | 0.00015 | 0 | 0.00187 | 0.00032 | 0.00074 | 0 | 0.00111 | 0.00037 | 0.49679 | 0.48869 | 0.48952 | 0.48566 | 0.00076 | 0.00566 | 0.00094 | 0 |
| Zn | 0.97796 | 0.96806 | 0.97811 | 0.9733 | 0.98797 | 0.00036 | 0 | 0.00108 | 0.00109 | 0.00128 | 0.00014 | 0 | 0.00211 | 0.00037 | 0.0011 | 0.00018 | 0.00018 |
| As | 0 | 0.00014 | 0.00027 | 0 | 0 | 0.00064 | 0.00162 | 0 | 0 | 0.00051 | 0.00025 | 0.00088 | 0.00025 | 0.00199 | 0.00312 | 0.00066 | 0.00198 |
| Se | 0.00012 | 0 | 0.00024 | 0 | 0 | 0.00031 | 0 | 0.00032 | 0.00121 | 0 | 0.00024 | 0.00023 | 0.00117 | 0 | 0 | 0 | 0 |
| Ag | 0 | 0 | 0 | 0 | 0 | 0.00087 | 0.00066 | 0.00065 | 0 | 0 | 0 | 0 | 0 | 0 | 0 | 0 | 0 |
| Cd | 0.00132 | 0.00166 | 0.00168 | 0.0015 | 0.0017 | 0.00146 | 0.00063 | 0.00146 | 0.00126 | 0 | 0 | 0 | 0 | 0 | 0 | 0 | 0 |
| Te | 0.00023 | 0.00046 | 0.00078 | 0.0007 | 0.00039 | 0.00074 | 0.00185 | 0.00092 | 0.00148 | 0.00029 | 0.00051 | 0.00043 | 0.00166 | 0.00028 | 0.00028 | 0.00056 | 0.00028 |
| Hg | 0.00069 | 0.00064 | 0.00055 | 0.0003 | 0.00115 | 0.00211 | 0.00165 | 0.00164 | 0.00142 | 0.00102 | 0.00028 | 0.00041 | 0.00082 | 0.00084 | 0.00042 | 0.00012 | 0.00036 |
| Pb | 0.00081 | 0.00076 | 0.00096 | 0.00067 | 0.00049 | 0.98045 | 0.98301 | 0.98001 | 0.98533 | 0.00081 | 0.00076 | 0.00084 | 0.00058 | 0.00175 | 0.00139 | 0.00139 | 0.00169 |
| Bi | 0.00071 | 0.00061 | 0.00072 | 0.00076 | 0.00077 | 0.00506 | 0.00519 | 0.00494 | 0.00487 | 0.00067 | 0.00044 | 0.0007 | 0.0007 | 0.00127 | 0.00149 | 0.00172 | 0.0015 |
Table 4.
Summary of electron microprobe results for tetrahedrite-tennantite series from the Shah-Ali-Beiglou deposit.
Table 4.
Summary of electron microprobe results for tetrahedrite-tennantite series from the Shah-Ali-Beiglou deposit.
| Data on the Basis of wt % | |
| | S | Cu | As | Sb | Fe | Zn | Ag | Te | Bi | Pb | Hg | Se | Tot. |
| M19 | 30.14 | 40.92 | 19.8 | 0.07 | 3.14 | 5.33 | <mdl | 0.02 | <mdl | 0.21 | 0.41 | 0.07 | 100.11 |
| 30.05 | 43.32 | 19.38 | 0.15 | 5.26 | 0.48 | 0.11 | 0.06 | 0.05 | 1.28 | 0.13 | 0.04 | 100.31 |
| 30.02 | 41.19 | 19.87 | <mdl | 1.46 | 7.55 | <mdl | 0.12 | 0.22 | 0.25 | <mdl | 0.11 | 100.79 |
| 29.80 | 41.58 | 19.25 | 0.33 | 1.39 | 7.2 | 0.04 | 0.1 | 0.15 | 0.48 | 0.02 | 0.03 | 100.37 |
| 26.54 | 39.81 | 10.79 | 14.09 | 1.23 | 7.3 | 0.15 | 0.07 | 0.15 | 0.22 | 0.39 | 0.07 | 100.81 |
| 26.21 | 40.45 | 10.94 | 14.05 | 1.19 | 7.24 | 0.05 | 0.01 | 0.13 | 0.11 | 0.25 | 0.05 | 100.68 |
| 25.90 | 34.26 | 9.57 | 15.57 | 9.93 | 4.26 | 0.2 | 0.04 | 0.21 | 0.04 | 0.32 | <mdl | 100.30 |
| 27.06 | 40.81 | 9.42 | 16.36 | 1.33 | 3.72 | 0.23 | 0.08 | 0.07 | 0.15 | 0.01 | 0.06 | 99.30 |
| 26.44 | 39.32 | 10.11 | 15.43 | 1.62 | 5.37 | 0.3 | 0.02 | 0.02 | 0.08 | <mdl | 0.06 | 98.77 |
| 28.74 | 44.39 | 20.04 | 0.05 | 2.69 | 2.93 | 0.39 | 0.01 | 0.03 | 0.94 | 0.19 | 0.11 | 100.51 |
| 28.08 | 39.49 | 20.97 | 0.19 | 0.93 | 2.15 | 0.24 | 0.07 | 0.04 | 0.15 | 0.38 | 0.12 | 92.81 |
| M9 | 25.22 | 37.92 | 3.38 | 26.29 | 0.33 | 5.54 | 0.33 | <mdl | 0.02 | 0.25 | 0.65 | 0.05 | 99.98 |
| 25.26 | 35.78 | 1.43 | 29.78 | 0.82 | 5.58 | 0.43 | 0.03 | 0.13 | <mdl | <mdl | 0.07 | 99.31 |
| 24.42 | 38.13 | 3.17 | 27.34 | 0.7 | 5.95 | 0.34 | <mdl | 0.16 | 0.16 | <mdl | 0.02 | 100.39 |
| 25.28 | 37.09 | 1.86 | 29.72 | 0.63 | 5.19 | 0.33 | 0.11 | 0.02 | 0.25 | <mdl | <mdl | 100.48 |
| 25.13 | 37.94 | 3.45 | 26.97 | 1.03 | 4.41 | 0.46 | 0.04 | 0.01 | 0.29 | 0.42 | 0.02 | 100.17 |
| 30.57 | 42.21 | 18.44 | 2.12 | 5.97 | 1.18 | <mdl | <mdl | 0.07 | 0.09 | <mdl | 0.1 | 100.75 |
| M24 | 30.35 | 42.86 | 18.23 | 2.01 | 6.5 | 0.24 | 0.04 | 0.04 | 0.21 | 0.01 | <mdl | 0.15 | 100.64 |
| 30.58 | 42.48 | 18.95 | 1.21 | 5.59 | 1.56 | <mdl | 0.01 | 0.07 | 0.09 | 0.14 | 0.08 | 100.76 |
| 30.02 | 42.39 | 19.41 | 1.63 | 5.23 | 1.87 | <mdl | 0.01 | 0.18 | 0.2 | 0.19 | 0.01 | 101.14 |
| 27.63 | 37.16 | 7.45 | 17.06 | 0.52 | 8.05 | 0.14 | <mdl | 0.04 | 0.23 | <mdl | 0.03 | 98.31 |
| Data on the basis of apfu: 29 atoms | |
| | S | Cu | As | Sb | Fe | Zn | Ag | Te | Bi | Pb | Hg | Se | |
| M19 | 13.68 | 9.37 | 3.84 | 0.01 | 0.81 | 1.18 | 0 | 0 | 0 | 0.01 | 0.03 | 0.01 | |
| 13.64 | 9.92 | 3.76 | 0.02 | 1.37 | 0.10 | 0.01 | 0 | 0 | 0.09 | 0.01 | 0 | |
| 13.60 | 9.41 | 3.85 | 0 | 0.37 | 1.67 | 0 | 0.01 | 0.01 | 0.01 | 0 | 0.02 | |
| 13.59 | 9.56 | 3.75 | 0.04 | 0.36 | 1.61 | 0 | 0.01 | 0.01 | 0.03 | 0 | 0 | |
| 12.93 | 9.79 | 2.25 | 1.80 | 0.34 | 1.74 | 0.02 | 0.01 | 0.01 | 0.01 | 0.03 | 0.01 | |
| 12.79 | 9.96 | 2.28 | 1.80 | 0.33 | 1.73 | 0.01 | 0 | 0.01 | 0 | 0.02 | 0.01 | |
| 12.64 | 8.43 | 1.99 | 2.00 | 2.78 | 1.02 | 0.03 | 0 | 0.01 | 0 | 0.02 | 0 | |
| 13.28 | 10.10 | 1.97 | 2.11 | 0.37 | 0.89 | 0.03 | 0.01 | 0 | 0 | 0 | 0.01 | |
| 12.91 | 9.68 | 2.11 | 1.98 | 0.45 | 1.28 | 0.04 | 0 | 0 | 0 | 0 | 0.01 | |
| 13.22 | 10.30 | 3.94 | 0 | 0.71 | 0.66 | 0.05 | 0 | 0 | 0.06 | 0.01 | 0.02 | |
| 12.92 | 9.17 | 4.13 | 0.02 | 0.24 | 0.48 | 0.03 | 0 | 0 | 0.01 | 0.02 | 0.02 | |
| M9 | 13.08 | 9.92 | 0.75 | 3.58 | 0.09 | 1.40 | 0.05 | 0 | 0 | 0.02 | 0.05 | 0.01 | |
| 13.27 | 9.48 | 0.32 | 4.11 | 0.24 | 1.43 | 0.06 | 0 | 0.01 | 0 | 0 | 0.01 | |
| 12.70 | 10.00 | 0.70 | 3.74 | 0.20 | 1.51 | 0.05 | 0 | 0.01 | 0.01 | 0 | 0 | |
| 13.15 | 9.73 | 0.41 | 4.07 | 0.18 | 1.32 | 0.05 | 0.01 | 0 | 0.02 | 0 | 0 | |
| 13.03 | 9.92 | 0.76 | 3.68 | 0.30 | 1.12 | 0.07 | 0 | 0 | 0 | 0.03 | 0 | |
| 13.76 | 9.59 | 3.55 | 0.25 | 1.54 | 0.26 | 0 | 0 | 0 | 0 | 0 | 0.02 | |
| M24 | 13.69 | 9.75 | 3.52 | 0.23 | 1.68 | 0.05 | 0 | 0 | 0.01 | 0 | <mdl | 0.02 | |
| 13.74 | 9.63 | 3.64 | 0.14 | 1.44 | 0.34 | 0 | 0 | 0 | 0 | 0.01 | 0.01 | |
| 13.56 | 9.66 | 3.75 | 0.19 | 1.35 | 0.41 | 0 | 0 | 0.01 | 0.01 | 0.01 | 0 | |
| 13.71 | 9.30 | 1.58 | 2.22 | 0.14 | 1.95 | 0.02 | 0 | 0 | 0.01 | 0 | 0 | |
Table 5.
Summary of average EPMA data for supergene sulfides and seligmannite from the Shah-Ali-Beiglou epithermal deposit (concentrations in wt %).
Table 5.
Summary of average EPMA data for supergene sulfides and seligmannite from the Shah-Ali-Beiglou epithermal deposit (concentrations in wt %).
| | Bornite (Breccia-III-Veinlet) | Chalcocite (Breccia-III-Veinlet) | Covellite (Breccia-I and Breccia-III-Veinlet) | Seligmannite |
|---|
| Avg. (n = 5) | Min. | Max. | Avg. (n = 13) | Min. | Max. | Avg. (n = 4) | Min. | Max. | Avg. (n = 4) | Min. | Max. |
|---|
| S | 26.272 | 24.98 | 27.01 | 23.51 | 21.98 | 25.98 | 32.92 | 31.53 | 33.76 | 28.74 | 27.51 | 29.98 |
| Mn | 0.04 | <mdl | 0.12 | 0.02 | <mdl | 0.07 | 0.03 | 0.02 | 0.04 | <mdl | <mdl | <mdl |
| Fe | 11.14 | 8.24 | 13.13 | 0.81 | 0.07 | 1.93 | 0.68 | 0.21 | 1.22 | 4.97 | 3.52 | 6.42 |
| Co | 0.02 | <mdl | 0.05 | <mdl | <mdl | <mdl | 0.01 | <mdl | 0.03 | <mdl | <mdl | <mdl |
| Ni | <mdl | <mdl | 0.01 | 0.02 | <mdl | 0.12 | <mdl | <mdl | <mdl | <mdl | <mdl | <mdl |
| Cu | 62.53 | 61.07 | 65.16 | 75.18 | 71.54 | 76.65 | 64.61 | 63.72 | 65.59 | 41.13 | 40.28 | 41.99 |
| Zn | <mdl | <mdl | <mdl | 0.23 | <mdl | 1.62 | 0.18 | <mdl | 0.47 | 0.23 | 0.11 | 0.35 |
| As | <mdl | <mdl | <mdl | <mdl | <mdl | <mdl | 0.25 | <mdl | 0.53 | 16.55 | 15.93 | 17.18 |
| Se | 0.01 | <mdl | 0.05 | 0.01 | <mdl | 0.07 | 0.03 | <mdl | 0.04 | 0.11 | 0.10 | 0.13 |
| Ag | 0.04 | <mdl | 0.10 | 0.12 | <mdl | 0.25 | 0.36 | <mdl | 1.02 | 0.83 | 0.73 | 0.93 |
| Cd | <mdl | <mdl | <mdl | 0.02 | <mdl | 0.07 | 0.02 | <mdl | 0.07 | <mdl | <mdl | <mdl |
| In | <mdl | <mdl | 0.02 | <mdl | <mdl | 0.05 | 0.01 | <mdl | 0.03 | <mdl | <mdl | <mdl |
| Sb | 0.01 | <mdl | 0.05 | 0.01 | <mdl | 0.04 | 0.03 | <mdl | 0.05 | 0.03 | <mdl | 0.07 |
| Te | 0.06 | <mdl | 0.13 | 0.06 | <mdl | 0.16 | 0.03 | <mdl | 0.09 | 0.08 | 0.02 | 0.15 |
| Au | <mdl | <mdl | <mdl | <mdl | <mdl | 0.03 | 0.023 | <mdl | 0.09 | 0.02 | <mdl | 0.04 |
| Hg | 0.21 | 0.07 | 0.46 | 0.08 | <mdl | 0.31 | 0.26 | 0.10 | 0.48 | 0.32 | 0.25 | 0.39 |
| Pb | 0.07 | <mdl | 0.17 | 0.1 | <mdl | 0.22 | 0.19 | 0.06 | 0.32 | 6.83 | 4.03 | 9.64 |
| Bi | 0.09 | <mdl | 0.21 | 0.09 | <mdl | 0.21 | 0.15 | 0.13 | 0.17 | 0.17 | 0.16 | 0.18 |
| Tot. | 100.63 | 100.23 | 100.88 | 100.35 | 98.47 | 100.91 | 100.15 | 98.71 | 100.85 | 100.13 | 99.99 | 100.28 |
Table 6.
Microthermometric data summary for LV fluid inclusions (n = 80) from sphalerite of the Shah-Ali-Beiglou deposit.
Table 6.
Microthermometric data summary for LV fluid inclusions (n = 80) from sphalerite of the Shah-Ali-Beiglou deposit.
| Mineral | Incl. Type | Th (°C) | Th (Mean) | Th (Mode) | Te (°C) | Tm-Ice (°C) | Wt % NaCl Equiv. | ρ (g/cm3) |
|---|
| Stage-I | L-V | 130–320 | 221 | 178 | −52 | −13.5–−18.6 | 17.34–21.4 | 0.9–1.05 |
| Stage-II | L-V | 135–288 | 231 | 280 | −52–37 | −5.6–−11 | 8.68–14.97 | 0.9–1.02 |
| Stage-III | L-V | 123–274 | 177 | 130 | −21 | −0.2–−2.8 | 0.35–4.65 | 0.88–0.95 |
Table 7.
Sulfur isotope data for galena, chalcopyrite, sphalerite and H
2S of the Shah-Ali-Beiglou deposit. The isotopic compositions were calculated using the mean value of the Th of L-V inclusion data obtained from
Table 6.
Table 7.
Sulfur isotope data for galena, chalcopyrite, sphalerite and H
2S of the Shah-Ali-Beiglou deposit. The isotopic compositions were calculated using the mean value of the Th of L-V inclusion data obtained from
Table 6.
| Mineral | Sample | δ34S (‰) Mineral | δ34S (‰) H2S a |
|---|
| Galena | MKH-2A | 3.19 | 6.19 |
| MKH-5gA | 4.47 | 7.47 |
| MKH-14B | 5.1 | 8.1 |
| MKH-17 | 3.48 | 6.48 |
| MKH-26 | 3.81 | 6.81 |
| MKH-01 | 4.3 | 7.3 |
| MKH-03 | 2.8 | 5.8 |
| MKH-12 | 4.8 | 7.8 |
| MKH-30 | 5.1 | 8.1 |
| Chalcopyrite | MKH-22 | 4.9 | 4.7 |
| MKH-22 | 4.72 | 4.52 |
| Sphalerite | MKH-1A | 5.31 | 4.81 |
| MKH-5gB | 4.46 | 3.96 |
| MKH-14A | 4.84 | 4.34 |
| MKH-02 | 6.7 | 6.2 |
Table 8.
Comparative characteristics of the main features of the Shah-Ali-Beiglou deposit and intermediate sulfidation type deposits (after Sillitoe and Hedenquist, [
102]) and Shah-Ali-Beiglou deposit.
Table 8.
Comparative characteristics of the main features of the Shah-Ali-Beiglou deposit and intermediate sulfidation type deposits (after Sillitoe and Hedenquist, [
102]) and Shah-Ali-Beiglou deposit.
| Tectonic Settings | Intermediate Sulfidation | Shah-Ali-Beiglou Deposit |
|---|
| Extensional Continental | Compressional Continental |
|---|
| Genetically related igneous rocks | Calc-alkaline to shoshonitic andesitic-dacitic arc | Calc-alkaline to shoshonitic magmatism, post-collisional arc setting |
| Host rocks | Andesite to rhyodacite, locally rhyolite | Andesite, basaltic andesite, alkali basalt and tuff unit |
| Ore textures | Open-space veins with variety of textures: crustiform, banded, comb, breccia | Vein-veinlet, breccia, dessimineted, crustiform, replacement, comb |
| Key alteration minerals | Sericite, without adularia | Sericite without adularia |
| Key sulfide species | Sphalerite (low Fe), galena, tetrahedrite-tennantite, chalcopyrite | Sphalerite (low Fe), galena, chalcopyrite, tetrahedrite-tennantite |
| Au and Ag | Native gold, electrum, native silver | Absent |
| Gangue minerals Silica | Vein-filling crustiform and comb quartz | Crustiform and comb quartz |
| Carbonate | Common, typically including manganiferous varieties | Calcite and dolomite |
| Other gangue | Barite ± manganiferious silicates | Barite, Sericite |
| Main metals | Ag-Au, Zn, Pb, Cu | Zn-Pb-Cu-(Ag) |
| Minor metals | As, Sb, Mo | As, Sb |


