Effect of Sodium Sulfite on Floatability of Chalcopyrite and Molybdenite


Department of Earth Resources Engineering, Faculty of Engineering, Kyushu University, 744 Motooka, Nishi-ku, Fukuoka 819-0395, Japan
*
Author to whom correspondence should be addressed.
Minerals 2018, 8(4), 172; https://0-doi-org.brum.beds.ac.uk/10.3390/min8040172
Submission received: 14 March 2018
/
Revised: 15 April 2018
/
Accepted: 16 April 2018
/
Published: 22 April 2018
(This article belongs to the Special Issue Flotation Chemistry)
Abstract
:Sodium hydrogen sulfide (NaHS) is commonly used as a copper depressant in the selective flotation of copper and molybdenum ores. However, the process is facing health and safety issues because NaHS readily yields toxic hydrogen sulfide gas (H2S) under acidic conditions. In this study, Na2SO3 was proposed as an alternative copper depressant. The effect of Na2SO3 on the surface wettability and floatability of chalcopyrite and molybdenite—typical copper and molybdenum minerals, respectively—was intensively studied using contact angle measurements and flotation tests. Contact angle readings show that the chalcopyrite surface became hydrophilic after the Na2SO3 treatment. Meanwhile, the molybdenite surface was relatively more hydrophobic compared with that of chalcopyrite after the treatment. Flotation tests using pure minerals of chalcopyrite and molybdenite demonstrate that the floatability of chalcopyrite decreased with increasing concentration of Na2SO3. On the other hand, the floatability of molybdenite gradually increased under similar conditions, suggesting that Na2SO3 might have the potential to be used for selective flotation of chalcopyrite and molybdenite. A possible mechanism is proposed in this study to explain the phenomenon using X-ray photoelectron spectroscopy analysis.
1. Introduction
Many copper mines often produce associated molybdenum minerals as trace minerals. It is important to separate molybdenum and copper minerals efficiently because molybdenum minerals are valuable minerals. Moreover, contamination of molybdenum minerals in the copper concentrate reduces the concentrate value. The conventional separation of copper and molybdenum (Cu–Mo) ores has been achieved with sulfide ore bulk flotation followed by selective molybdenum flotation with the addition of a copper sulfide depressant (i.e., sodium hydrogen sulfide (NaHS), sodium thioglycollate (HSCH2COONa), sodium sulfide (Na2S), Nokes reagent (P2S5 + NaOH), and sodium thiopropionate (HSCH2CH2COONa)) [1,2,3,4,5,6,7]. NaHS is used most extensively in the conventional Cu–Mo flotation process, where chalcopyrite and molybdenite are the main copper and molybdenum minerals, respectively [3,8].
However, the existing Cu–Mo flotation process shows imperfect molybdenite recovery [9,10]. Moreover, NaHS is a dangerous, corrosive, and toxic reagent. It needs to be used under specific conditions (i.e., alkaline conditions) to prevent the formation of toxic hydrogen sulfide gas (H2S), which is usually formed under acidic conditions. Needless to say, there are environmental and safety needs to replace this highly toxic reagent with more environmentally friendly chemicals [11]. Therefore, better and safer methods are needed to separate copper and molybdenum minerals.
The true role of NaHS as a depressant is not well understood; however, it might act as a reductant [2,8]. Therefore, it might be hypothesized that other reductants might give a similar effect. Sulfite and thiosulfates are known as strong reductants. Sodium sulfite (Na2SO3) was used as a pyrite depressant in separation of sphalerite and pyrite using flotation [12] and in a complex ore containing enargite and chalcopyrite [13]. Houot and Duhamet [14] reported that sodium sulfide (Na2S) depressed the floatability of chalcopyrite in the presence of dialkyl-thionocarbamate as a collector. However, the effect of sodium sulfite on the floatability of chalcopyrite and molybdenite has not yet been investigated. Therefore, this study focused on the effect of sodium sulfite on surface wettability and floatability of chalcopyrite and molybdenite.
2. Materials and Methods
2.1. Materials
Pure crystals of chalcopyrite (Miyatamata mine, Akita, Japan) and molybdenite (Hirase mine, Gifu, Japan) were used as experimental samples in this study. For contact angle measurements, the mineral crystal was cut as a flat surface and then was cast in an epoxy resin. The surface was polished and cleaned following the procedure described by Suyantara et al. [15,16]. For flotation experiment and X-ray photoelectron spectroscopy (XPS) analysis, the chalcopyrite was ground by agate mortar and pestle and was dry screened (<38 μm). Fine powder molybdenite (<30 μm) was supplied by Sumitomo Metal Mining Co., Ltd (Tokyo, Japan). The mineral powders were cleaned using 1 M HNO3 aqueous solution following the procedures described by Suyantara et al. [15]. Millipore® (Direct-Q, Merck, Japan) ultra-pure water with resistivity of 18.2 MΩ∙cm was used in all experiments. KOH and HCl were used as pH modifiers. Na2SO3 was used for mineral treatment and methyl isobutyl carbinol (MIBC) was used as a frother in the flotation tests. Industrial grade diesel oil, TX15216 (alkyl mercaptan) from Nalco (Naperville, IL, USA) and AERO® MX-7017 (modified thionocarbamate) from Cytec (Woodland Park, NJ, USA) were used as flotation collectors.
2.2. Contact Angle Measurements
For contact angle measurements, the polished mineral surfaces were pretreated with various collectors. The surface pretreatment was conducted by mixing the collectors (i.e., TX15216 (6.0 mg/L), AERO® MX-7017 (5.5 mg/L), and diesel oil (5.4 mg/L)) using a food blender TM900 (Tescom, Tokyo, Japan) at 12,000 rpm for 1 min. The mixture is referred to as TMD (TX15216, MX-7017, and diesel oil) solution in this work. The polished mineral surfaces were added into the TMD solution and the pH was controlled at a desired value (8, 9, 10.8, or 11.5) for 10 min. Following the sample pretreatment, the mineral was treated in various concentrations of Na2SO3 for various treatment times (10, 30, and 60 min). Afterwards, contact angle measurements were carried out using a goniometer (Dropmaster 300, Kyowa Interface Science Co., Ltd., Saitama, Japan). The contact angle was measured using the bubble captive method following the procedures described in previous work [17,18].
2.3. X-ray Photoelectron Spectroscopy (XPS)
XPS analysis was performed to analyze the chemical composition of the surface before and after the Na2SO3 treatment. The mineral powders (ca. 1 g) were treated in 0.1 M Na2SO3 and the mixture pH was controlled at various values (8, 10, and 11.5) for 60 min. The sample was then filtered and freeze-dried for 1 day. Afterwards, XPS analysis was conducted for untreated and treated minerals by following the procedure applied in Hirajima et al. [19]. The X-ray photoelectron spectra of the mineral were collected using AXIS 165 (Shimadzu-Kratos Co., Ltd., Manchester, UK) with an Al Kα X-ray source (1486.6 eV) operated at 105 W and a charge neutralizer. The analysis area was 1 mm × 1 mm and the pressure in the analyzer chamber was 10−8 Pa. The collected spectra were analyzed with Casa XPS (Ver. 2.3.16). Background corrections were made using the Shirley method [20] for the C1s, O1s, Fe2p, Cu2p, S2p, and Mo3d spectra. The peak shapes were defined using a Gaussian–Lorentzian function. The binding energy (EB) calibration was based on C1s at EB[C1s] = 284.6 eV.
2.4. Flotation Study
To examine the effect of Na2SO3 on the floatability of both minerals, flotation tests were conducted in the absence of collectors. The floatation tests on each mineral were carried out using a column-type microflotation [16]. A certain amount of mineral powder (ca. 0.6 g) was suspended in 180 mL treatment solution. The mixture was then treated in various concentrations of Na2SO3 for 60 min at the natural pH of the solution (pH 10.8). Following the mineral treatment, MIBC (22 ppm) was added as a frother. The conditioning time for the frother was 2 min. Afterwards, the flotation test was started by injecting the nitrogen gas into the glass column at a flow rate of 20 mL/min for 1 min. The float and sink fractions were collected separately, filtered, dried in an oven at 105 °C for 12 h, and weighed. The mineral recovery reported in this work was calculated based on the mass percentage of the float fraction.
3. Results and Discussion
3.1. Contact Angle
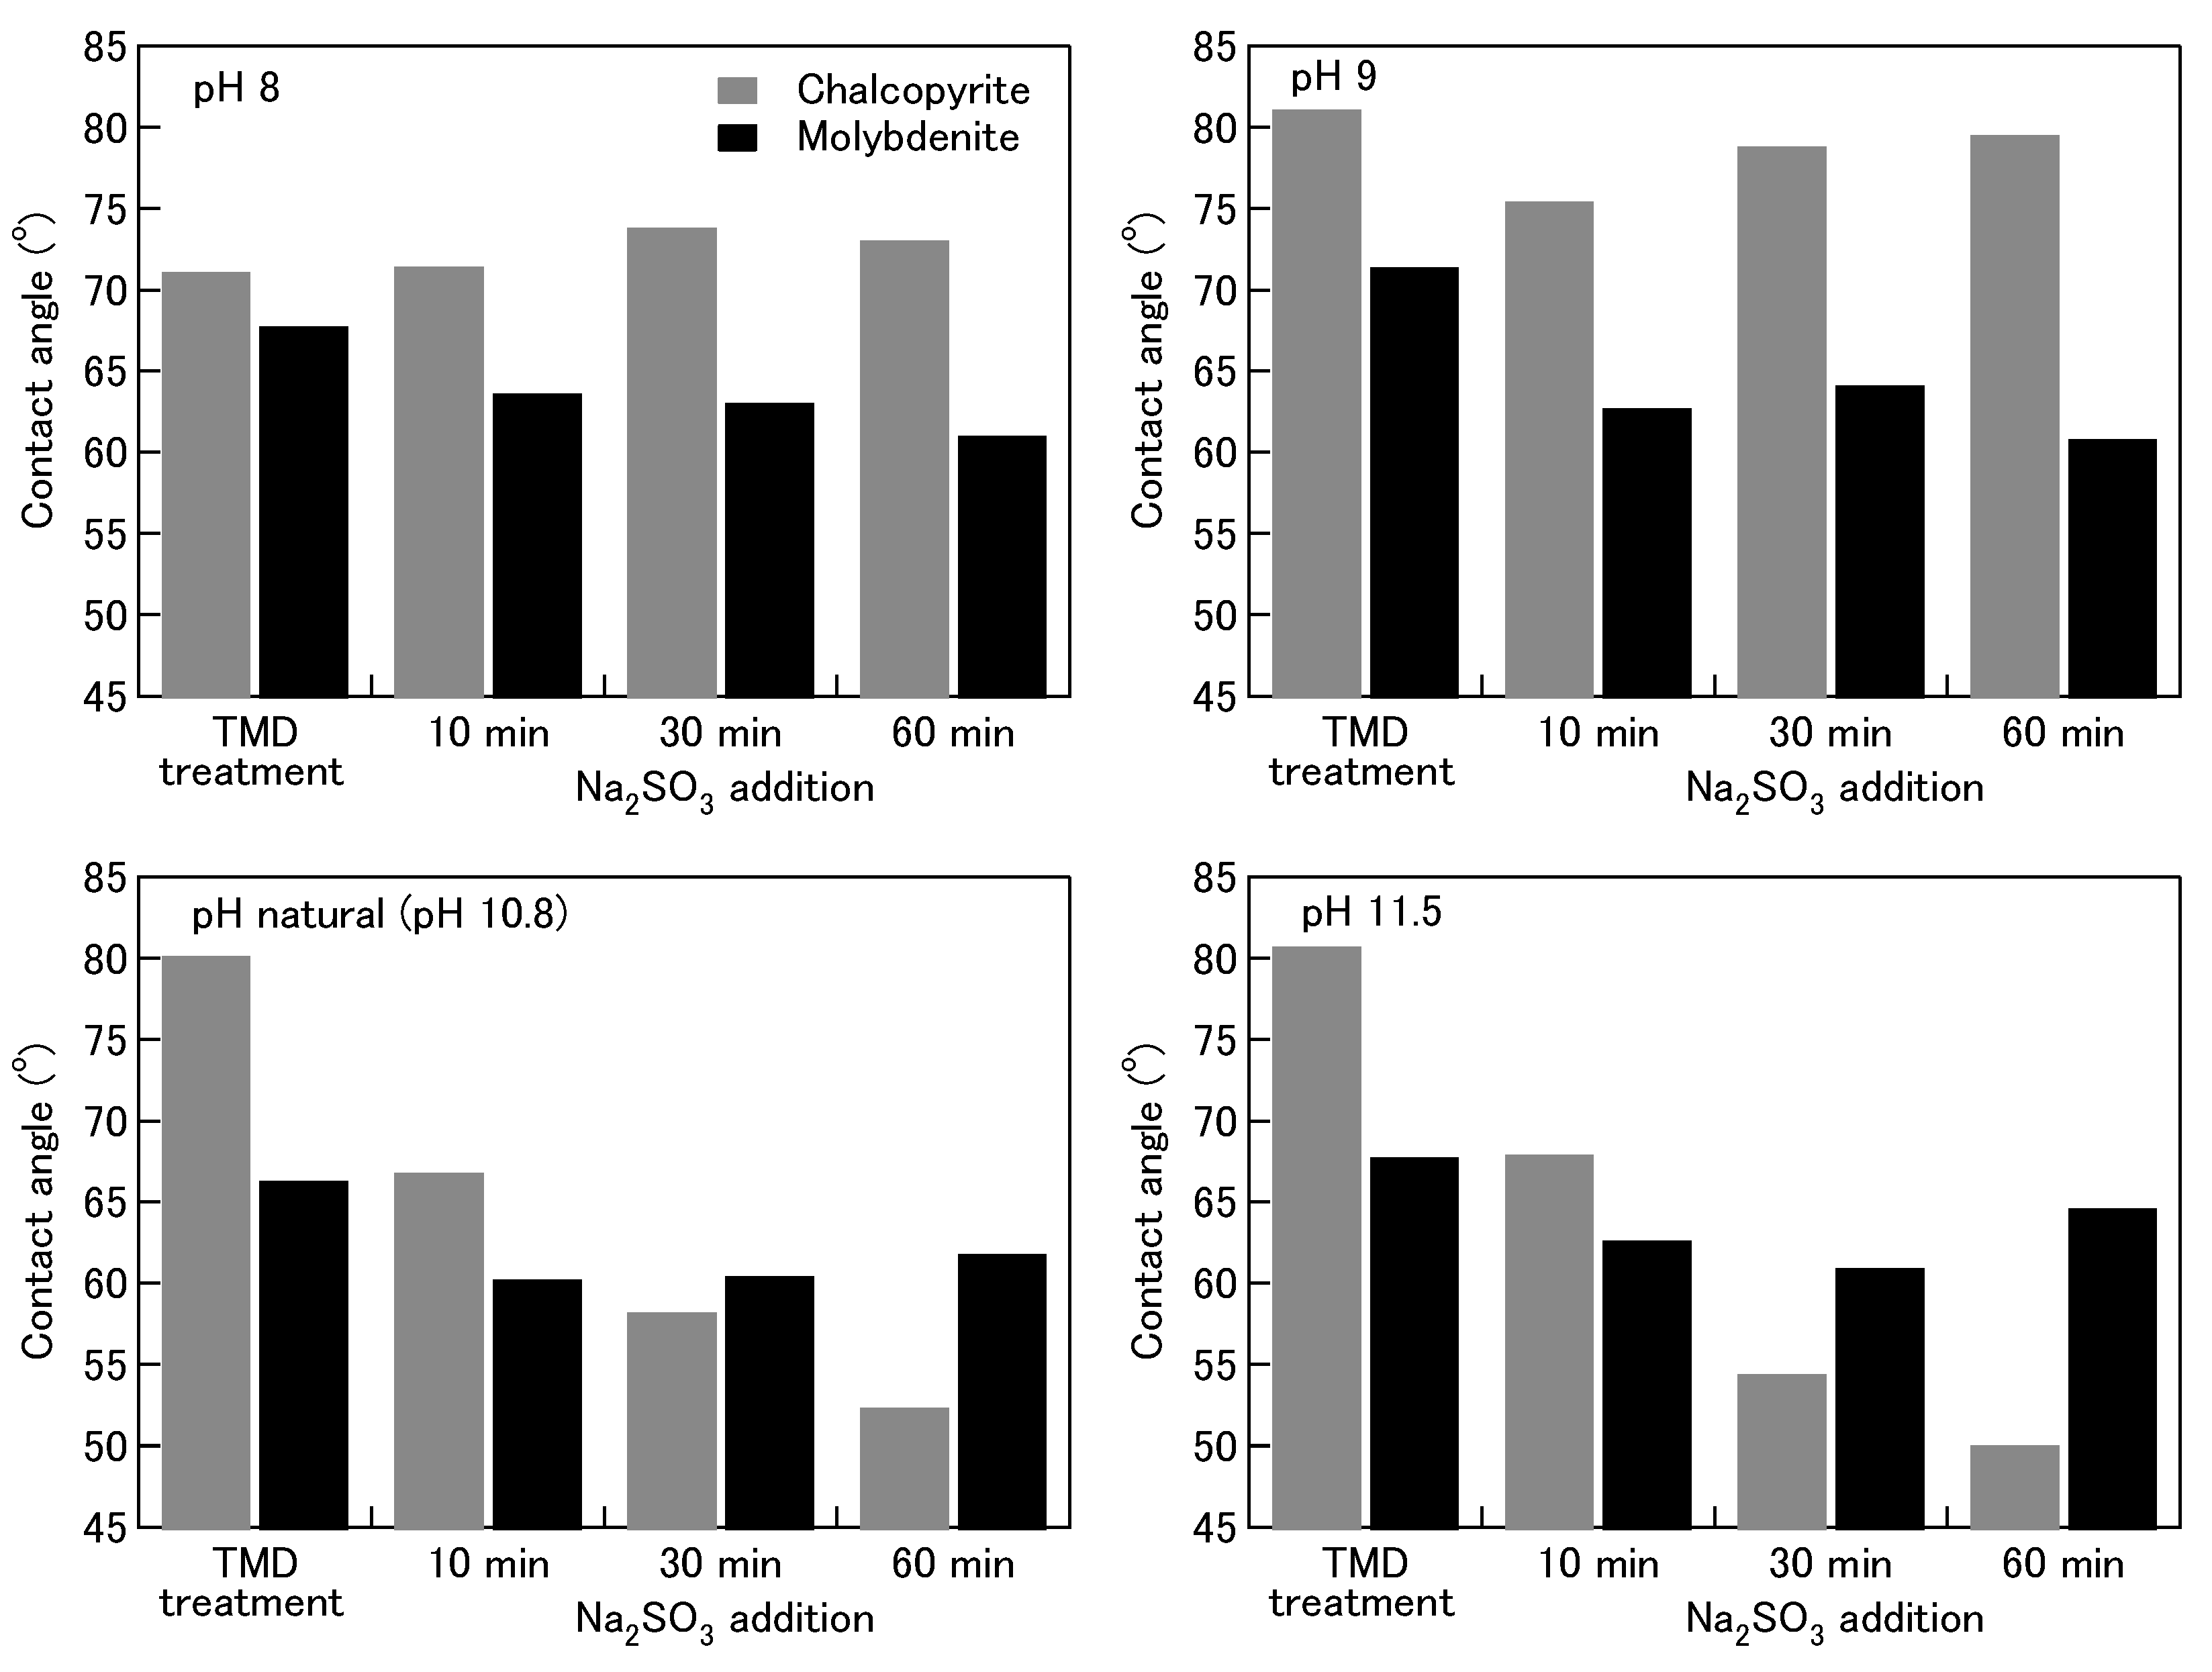
The effect of Na2SO3 on surface wettability of chalcopyrite and molybdenite is presented in Figure 1. Contact angle values of chalcopyrite and molybdenite were ca. 71° and 67°, respectively, after the pretreatment using TMD solution at pH 8. At higher pH values, the contact angle of chalcopyrite significantly increased to ca. 81°. Meanwhile, the contact angle of molybdenite was slightly affected by increasing pH value, with the exception at pH 9, where the contact angle of molybdenite slightly increased to ca. 71°.
In the presence of 0.1 M Na2SO3 at pH 8, the contact angle of chalcopyrite slightly increased with increasing treatment time. On the other hand, the contact angle of molybdenite slightly decreased with increasing treatment time. A similar phenomenon can be observed at pH 9 (Figure 1). However, the contact angle of chalcopyrite significantly decreased with increasing treatment time at the natural pH of Na2SO3 aqueous solution (pH 10.8). A similar phenomenon happened at pH 11.5, indicating that the chalcopyrite surface became more hydrophilic after the Na2SO3 treatment. Under similar pH conditions, the contact angle of molybdenite was slightly decreased after the treatment. The contact angle results at pH higher than 9 indicate that Na2SO3 could selectively alter the surface wettability of chalcopyrite after the pretreatment with TMD solution. In addition, these results demonstrate that the Na2SO3 treatment might be applied for selective flotation of chalcopyrite and molybdenite.
The phenomena observed in Figure 1 can be explained by the following assumptions. The flotation collectors—TX15216 (alkyl mercaptan) and AERO® MX-7017 (modified thionocarbamate)—are mainly used for selective flotation of copper minerals. Meanwhile, diesel oil is usually used to improve the floatability of molybdenite. TX15216 and AERO® MX-7017 can be adsorbed on the mineral surface through physical and chemical adsorption. At higher pH, these collectors can be more ionized, thus increasing the chemical adsorption compared with the physical adsorption. Therefore, a higher contact angle value of chalcopyrite could be obtained with increasing pH. Unlike the alkyl mercaptan and modified thionocarbamate used in this study, diesel oil is a nonpolar collector and, thus, cannot be ionized in the aqueous solution. In addition, diesel oil is physically adsorbed on the molybdenite surface. Therefore, the pH has a little effect on the adsorption of diesel oil on the molybdenite surface.
The selective conversion of surface wettability of chalcopyrite at high pH values in 0.1 M Na2SO3 might be caused by the effect of Na2SO3 on reducing the ionization of collectors, thus reducing the adsorbed collector on the chalcopyrite surface. On the other hand, as diesel oil is a nonpolar collector, the presence of Na2SO3 had a slight effect on the adsorption of this collector on the molybdenite surface; this resulted in the relatively higher contact angle value of molybdenite than that of chalcopyrite.
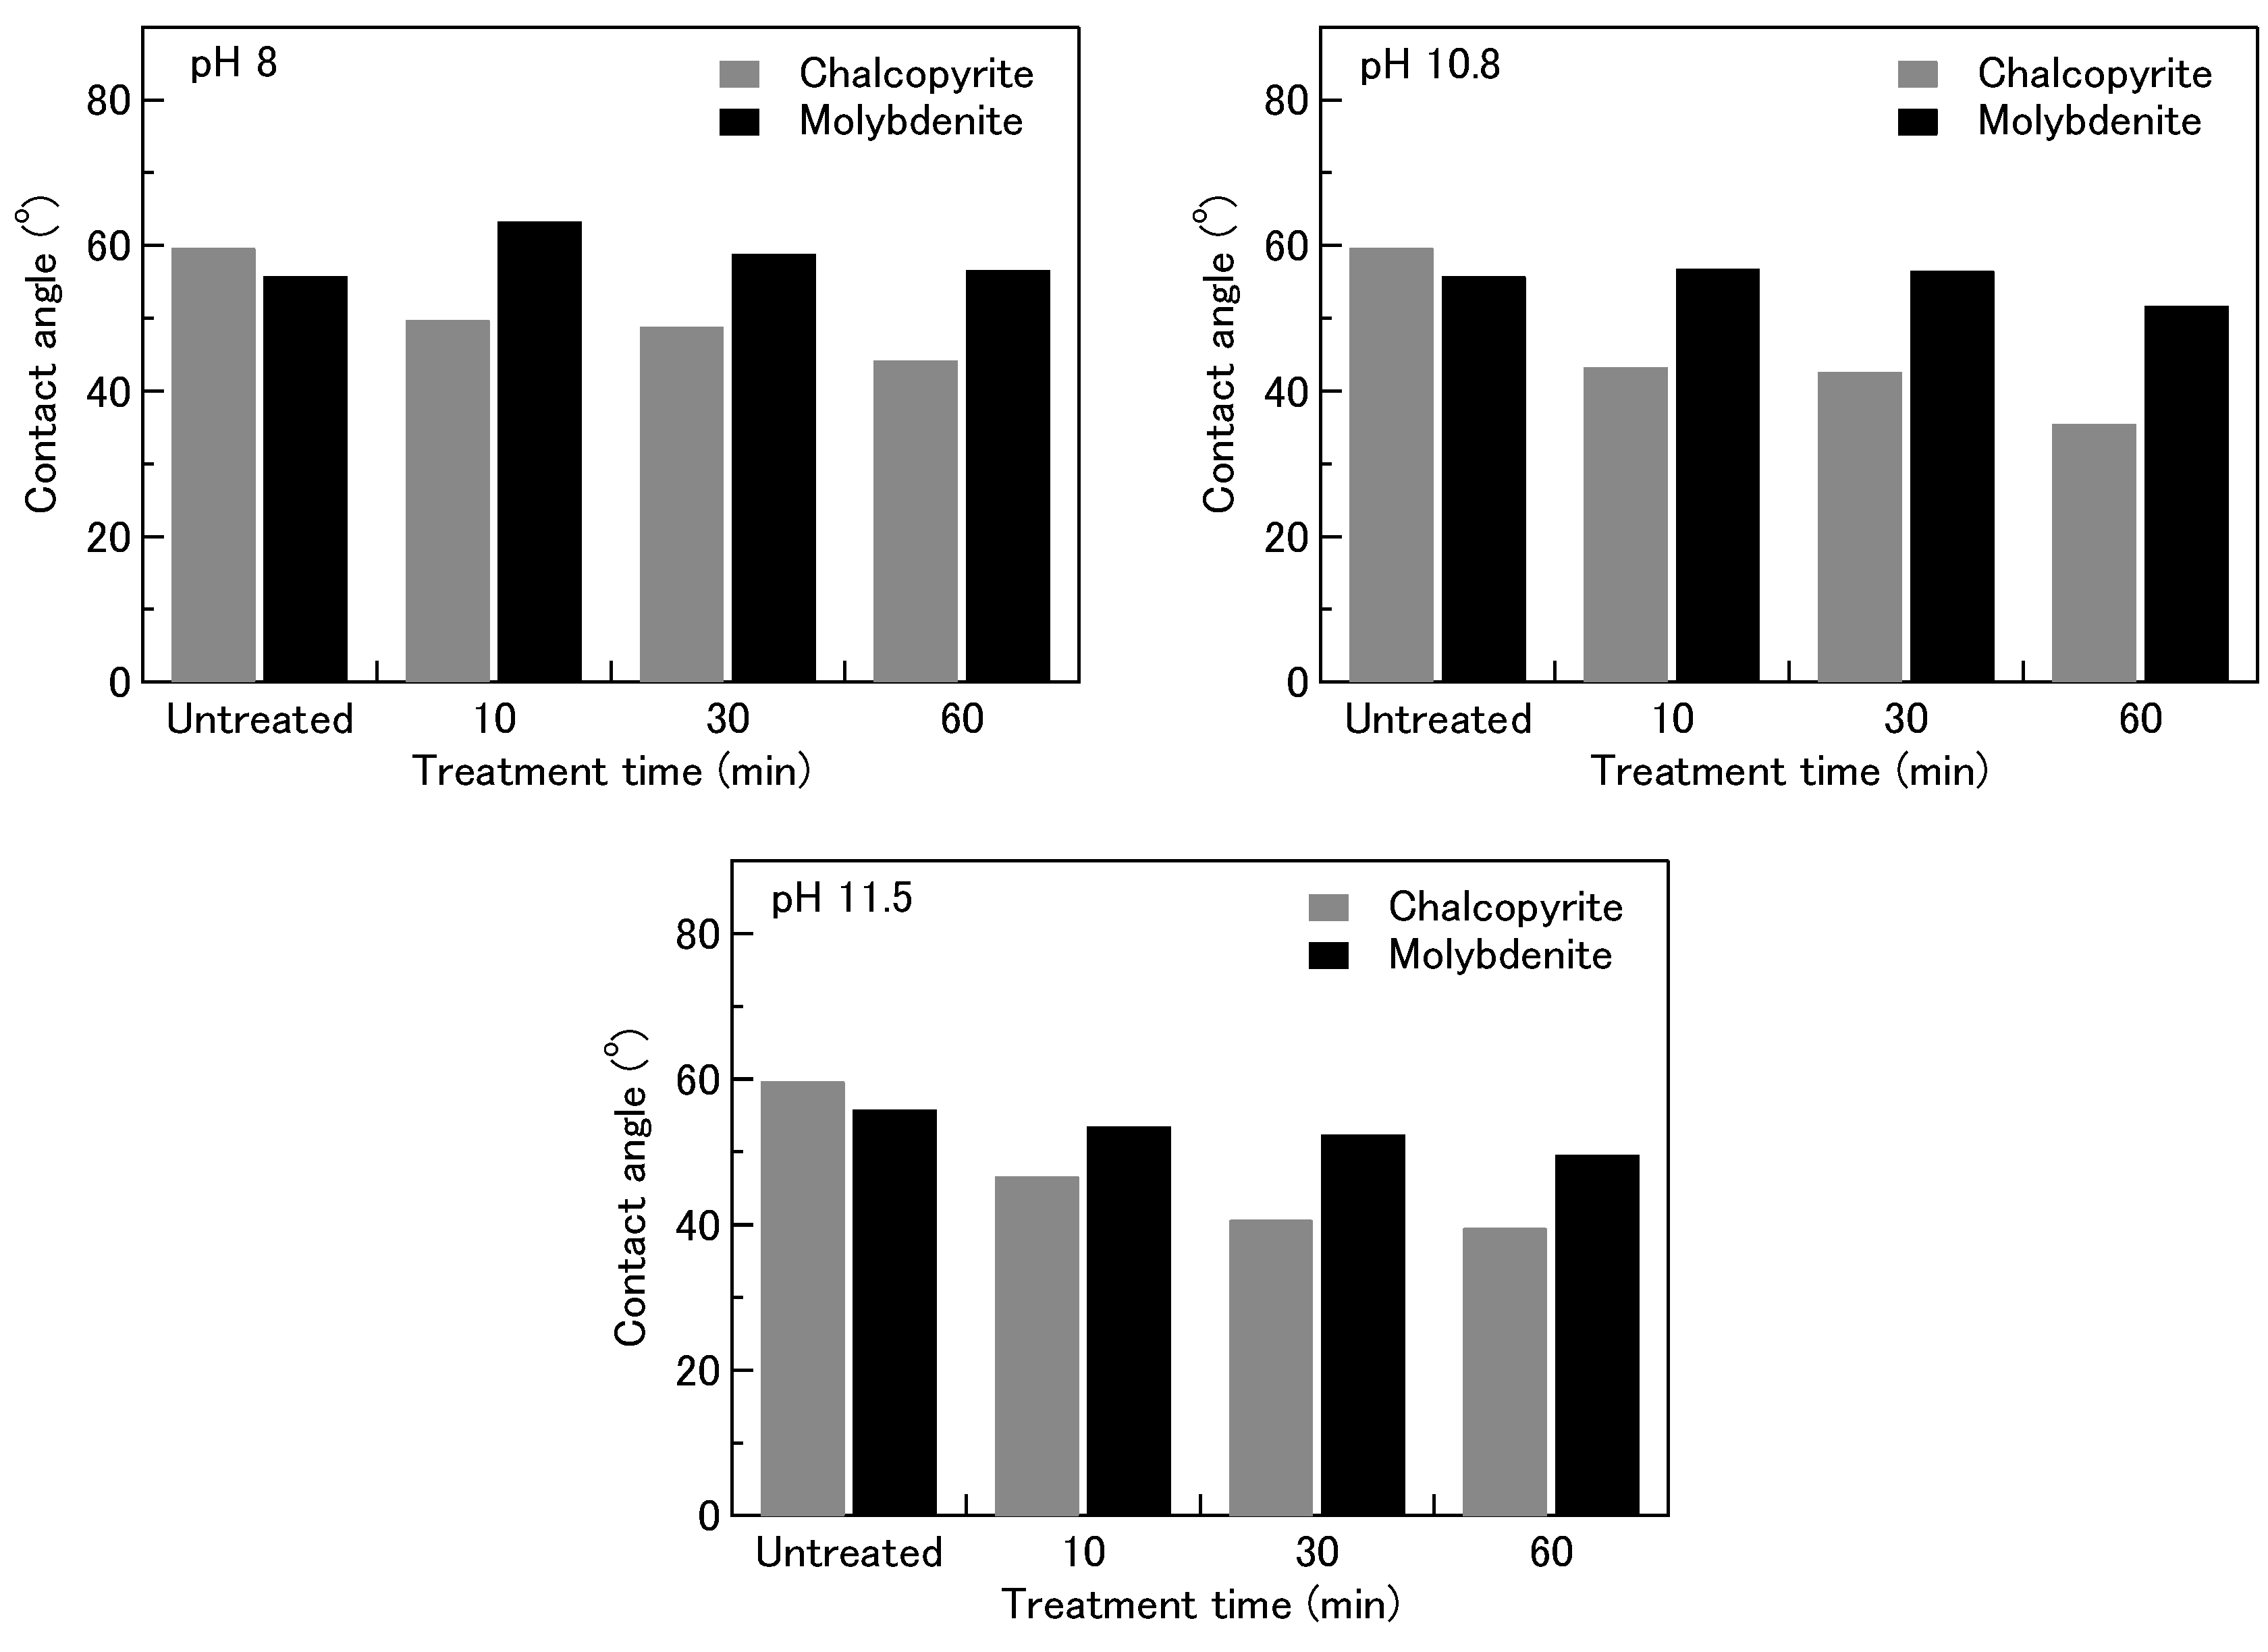
It is difficult to understand the role of Na2SO3 in affecting the surface hydrophobicity of chalcopyrite and molybdenite in the presence of the TMD solution. Therefore, to simplify the process, contact angle measurements were then conducted without pretreatment using TMD solution; the results are presented in Figure 2. It can be seen that the contact angle values of untreated chalcopyrite and molybdenite were lower in the absence of TMD solution compared with those of the pretreatment using TMD solution (Figure 1), demonstrating the effect of TMD collectors on improving the hydrophobicity of both minerals.
Figure 2 shows that the contact angle of chalcopyrite decreased after treated in 0.1 M Na2SO3. Moreover, the contact angle values of chalcopyrite decreased with increasing treatment time and pH, especially at pH 10.8 and 11.5, suggesting that Na2SO3 reduces the natural hydrophobicity of the chalcopyrite surface in the absence of TMD solution. On the other hand, the contact angle values of molybdenite slightly decreased with increasing treatment time and pH of 0.1 M Na2SO3 without the pretreatment (Figure 2). These results indicate that the surface of the molybdenite was slightly affected by the Na2SO3 treatment in the absence of the TMD solution.
The contact angle results presented in Figure 1 and Figure 2 may suggest the role of Na2SO3 treatment. The Na2SO3 treatment might reduce the adsorbed TMD on the chalcopyrite and molybdenite surface, exposing a kind of “fresh” surface of both minerals. On this “fresh” surface of chalcopyrite, the Na2SO3 treatment might further reduce the surface hydrophobicity. On the other hand, the “fresh” molybdenite surface is only slightly affected by the Na2SO3 treatment, therefore resulting in a more hydrophobic surface compared to that of the chalcopyrite. However, the proposed mechanism needs further investigation and will be addressed in future work.
3.2. XPS Analysis
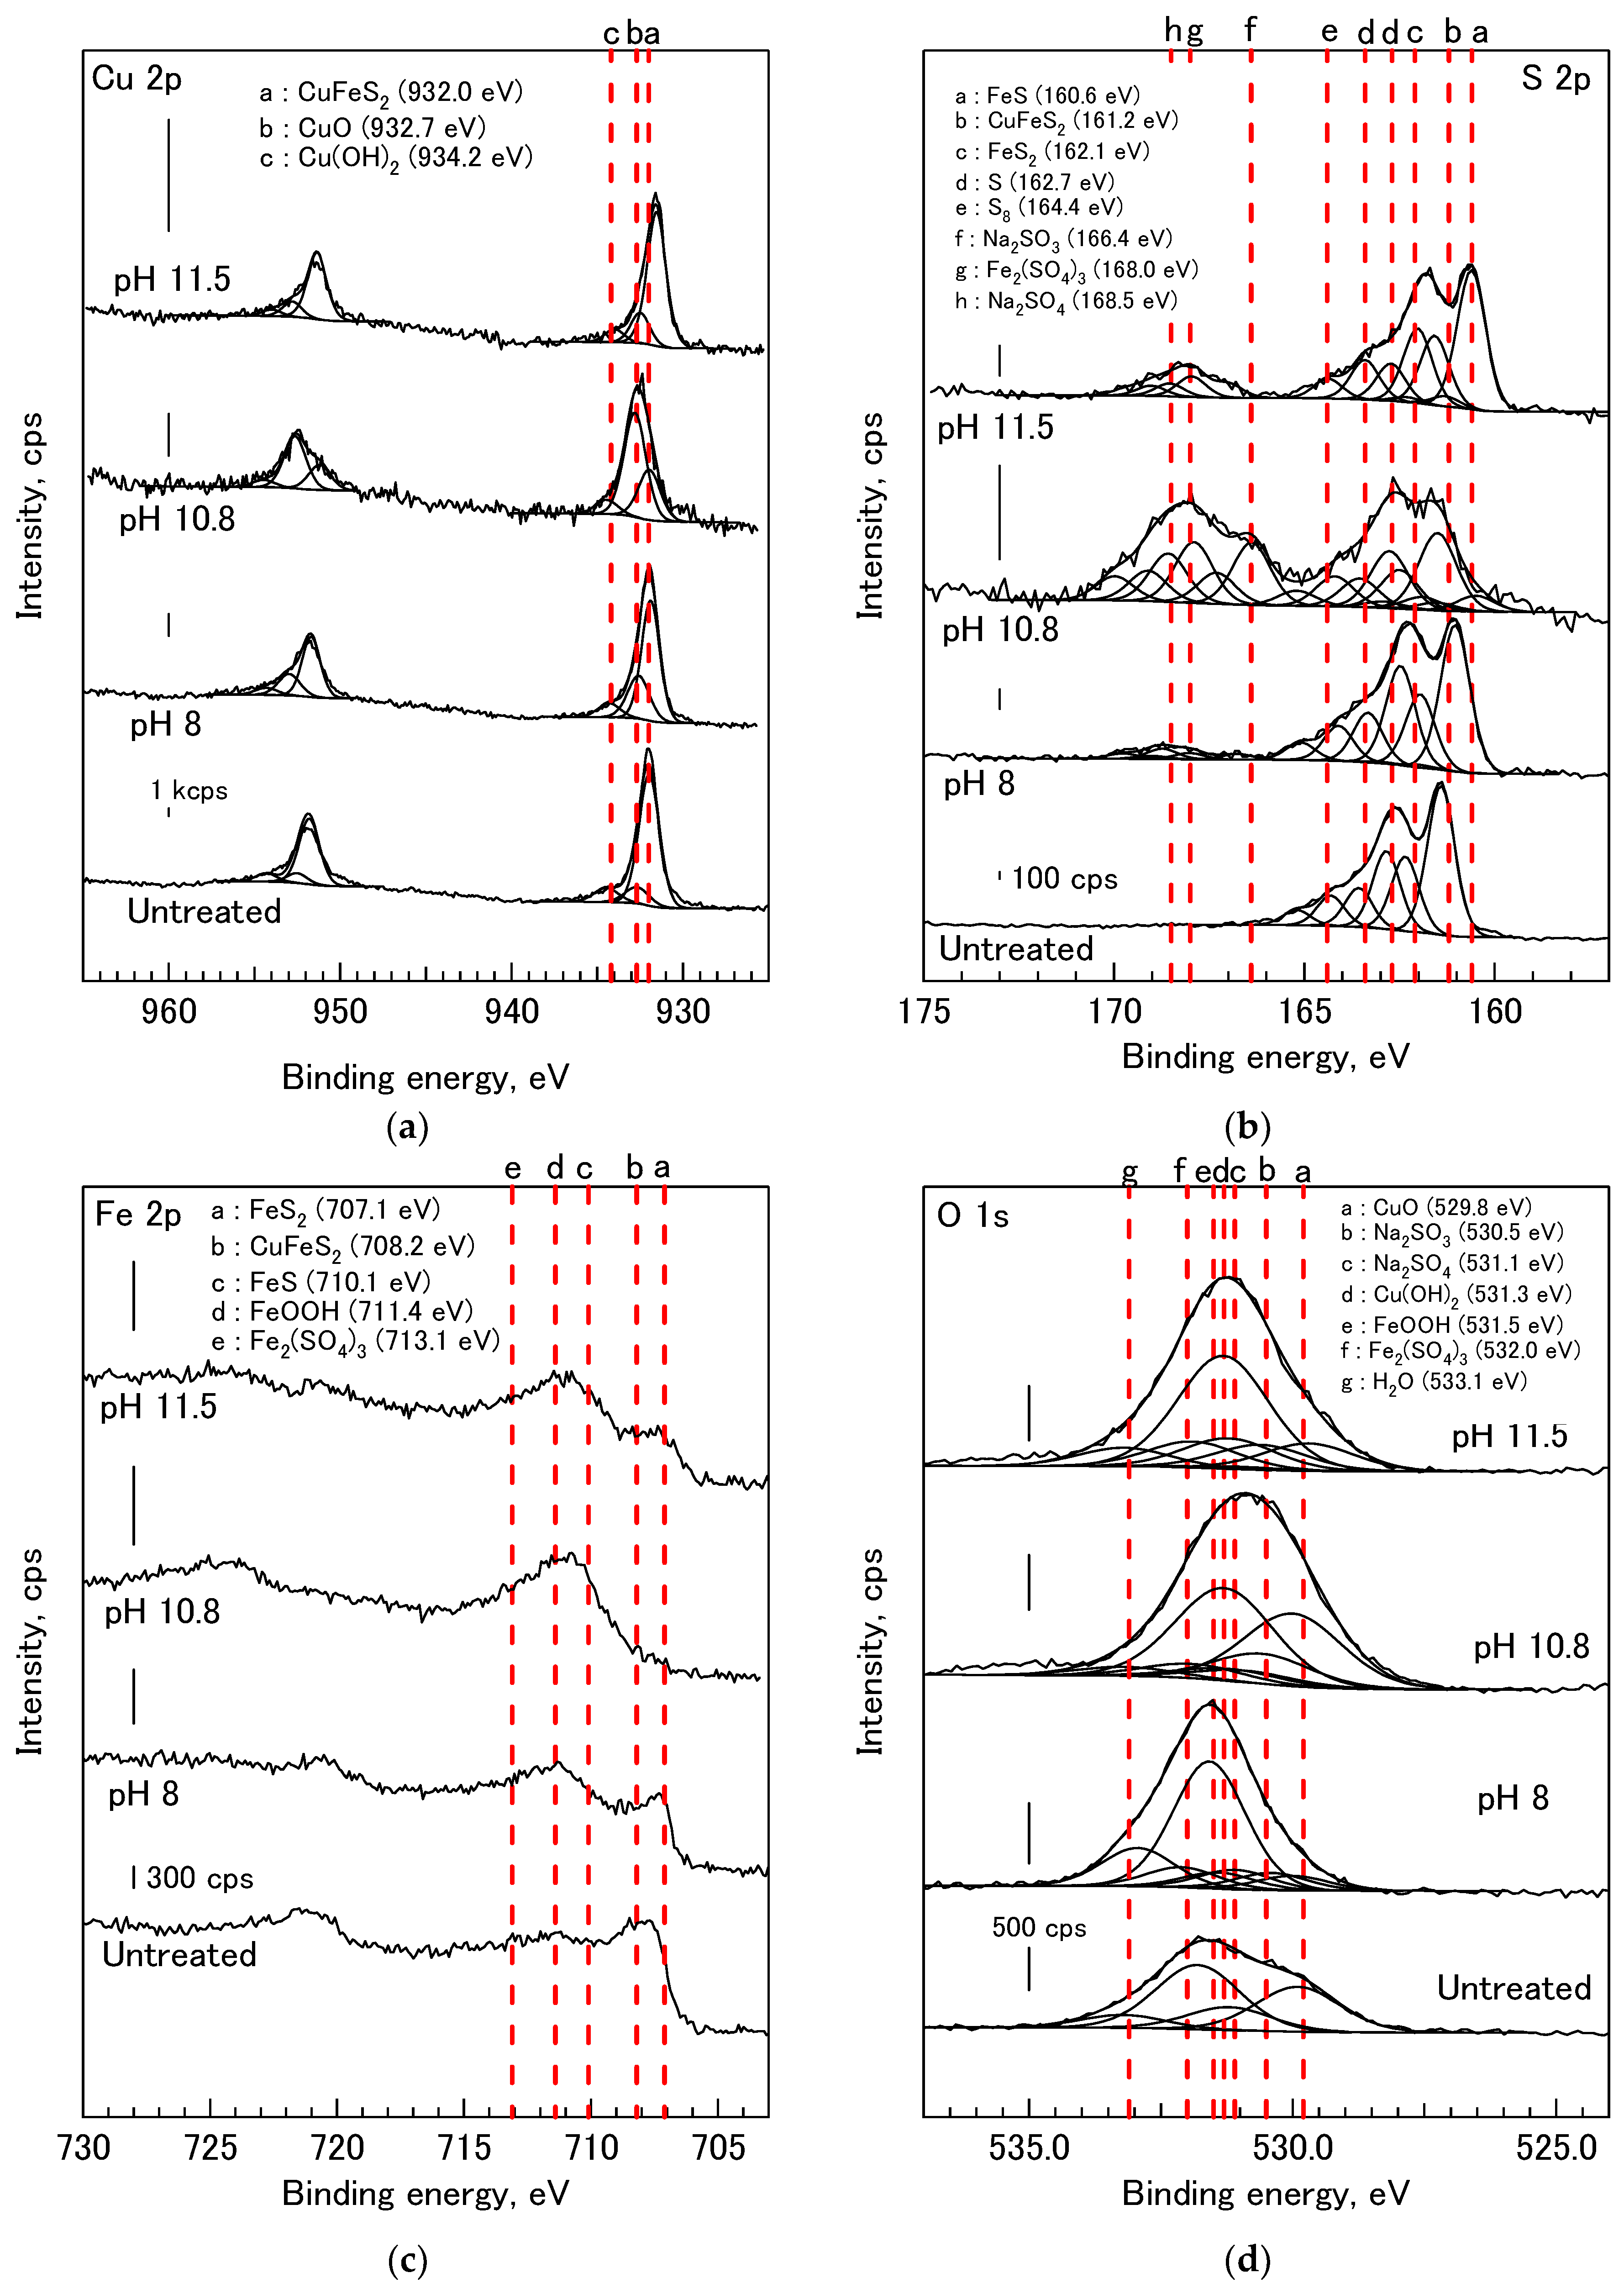
XPS analysis results of chalcopyrite and molybdenite are presented in Figure 3 and Figure 4, respectively. It should be noted that the XPS analysis was conducted in the absence of collector in order to simplify the surface analysis and to examine the effect of Na2SO3 on the chemical composition of the chalcopyrite and molybdenite surfaces. Figure 3 shows the copper (Cu) 2p, iron (Fe) 2p, sulfur (S) 2p, and oxygen (O) 1s spectra of chalcopyrite. The Cu2p of the untreated chalcopyrite spectra (Figure 3) can be best fitted with three Gaussian–Lorentzian functions located at ca. 932.0, 932.7, and 934.2 eV. The binding energy located at ca. 932.0 eV corresponds to chalcopyrite according to Nakai et al. [21]. Meanwhile, the higher binding energies correspond to CuO (ca. 932.7 eV) and Cu(OH)2 (ca. 934.2 eV), as reported by Hussain et al. [22] and McIntyre and Cook [23], respectively. This result indicates that the untreated chalcopyrite surface was slightly oxidized, forming CuO and Cu(OH)2 species, likely due to surface oxidation by cleaning treatment using HNO3 aqueous solution. Indeed, the oxidation of the untreated surface is confirmed from the presence of monosulfide (S) and octasulfur (S8) on the chalcopyrite surface as indicated from the S2p peaks located at ca. 162.7 eV [24] and ca. 164.6 eV [25], respectively. The Cu2p spectrum of the treated chalcopyrite surface using 0.1 M Na2SO3 at pH 8 shows the presence of similar Cu species as the untreated surface. However, the chalcopyrite surface was dominated by CuO species at pH 10.8, indicating the transformation of a metastable copper hydroxide to a more stable copper oxide [26].
Unlike the untreated surface, the S2p spectrum in Figure 3 suggests that the surface was more oxidized after the Na2SO3 treatment for all pH values, as indicated from the appearance of a new peak located at higher binding energy (ca. 168.0 eV), which corresponds to ferric sulfate (Fe2(SO4)3) [27]. Moreover, the deconvolution results of the new peak suggest the presence of Na2SO3 and its oxidation product, sodium sulfate (Na2SO4), on the chalcopyrite surface as indicated from the peaks located at ca. 166.4 eV and 168.5 eV, respectively [28].
The Fe2p spectrum in Figure 3 indicates that the chalcopyrite peak located at ca. 708.2 eV [29] on the untreated surface shifted to a lower binding energy located at ca. 707.1 eV after treated in 0.1 M Na2SO3 at pH 10.8. This binding energy corresponds to iron disulfide (FeS2) as reported by Laajalehto et al. [30]. A similar phenomenon can be observed from the Fe2p spectrum of treated chalcopyrite at pH 11.5. The presence of FeS2 is confirmed from the S2p spectrum as shown by the peak located at ca. 162.1 eV [31]. Moreover, the S2p spectrum suggests the presence of iron sulfide (FeS) on the chalcopyrite surface after the treatment at pH 10.8 and 11.5, as indicated from the peak located at lower binding energy, ca. 160.6 eV [28]. Iron sulfide has binding energy at ca. 710.1 eV [32] in the Fe2p spectrum (Figure 3). However, at pH 10.8, the peak of Fe2p located at ca. 711.2 eV, which is attributed to FeOOH [33], became more apparent, indicating an increased concentration of FeOOH on the surface.
The O1s spectrum presented in Figure 3 confirms the formation of various oxides, sulfite, and sulfate on the chalcopyrite surface. The oxygen from CuO, Cu(OH)2, and FeOOH are located at ca. 529.8 eV [34], 531.3 eV [35], and 531.5 eV [36], respectively. Meanwhile, the oxygen from Na2SO3, Na2SO4, and Fe2(SO4)3 are located at ca. 530.5 eV [37], 531.1 eV [38], and 532.0 eV [29]. In addition, the deconvolution peak of O1s located at ca. 533.1 eV corresponds to H2O [39].
The XPS results presented in Figure 3 show that the Na2SO3 treatment produced various hydrophilic species (i.e., CuO, Cu(OH)2, FeOOH, and Fe2(SO4)3) which covered the chalcopyrite surface. The presence of these hydrophilic species could alter its surface hydrophobicity as shown in Figure 1 and Figure 2. Moreover, the decrease in Cu2p peak intensity of chalcopyrite with increasing pH indicates that the coverage of hydrophilic species on the chalcopyrite surface increased, thus reducing the hydrophobicity. Based on the XPS results, the following possible mechanism is proposed to understand the effect of Na2SO3 treatment on chalcopyrite surface. If SO32− ions from Na2SO3 can act as a reducing agent, chalcopyrite can react with SO32− following Equation (1).
It is known that the produced Cu2S is easily oxidized following Equation (2).
The ferric ion forms precipitates at alkaline conditions. The following reactions are proposed for the precipitations.
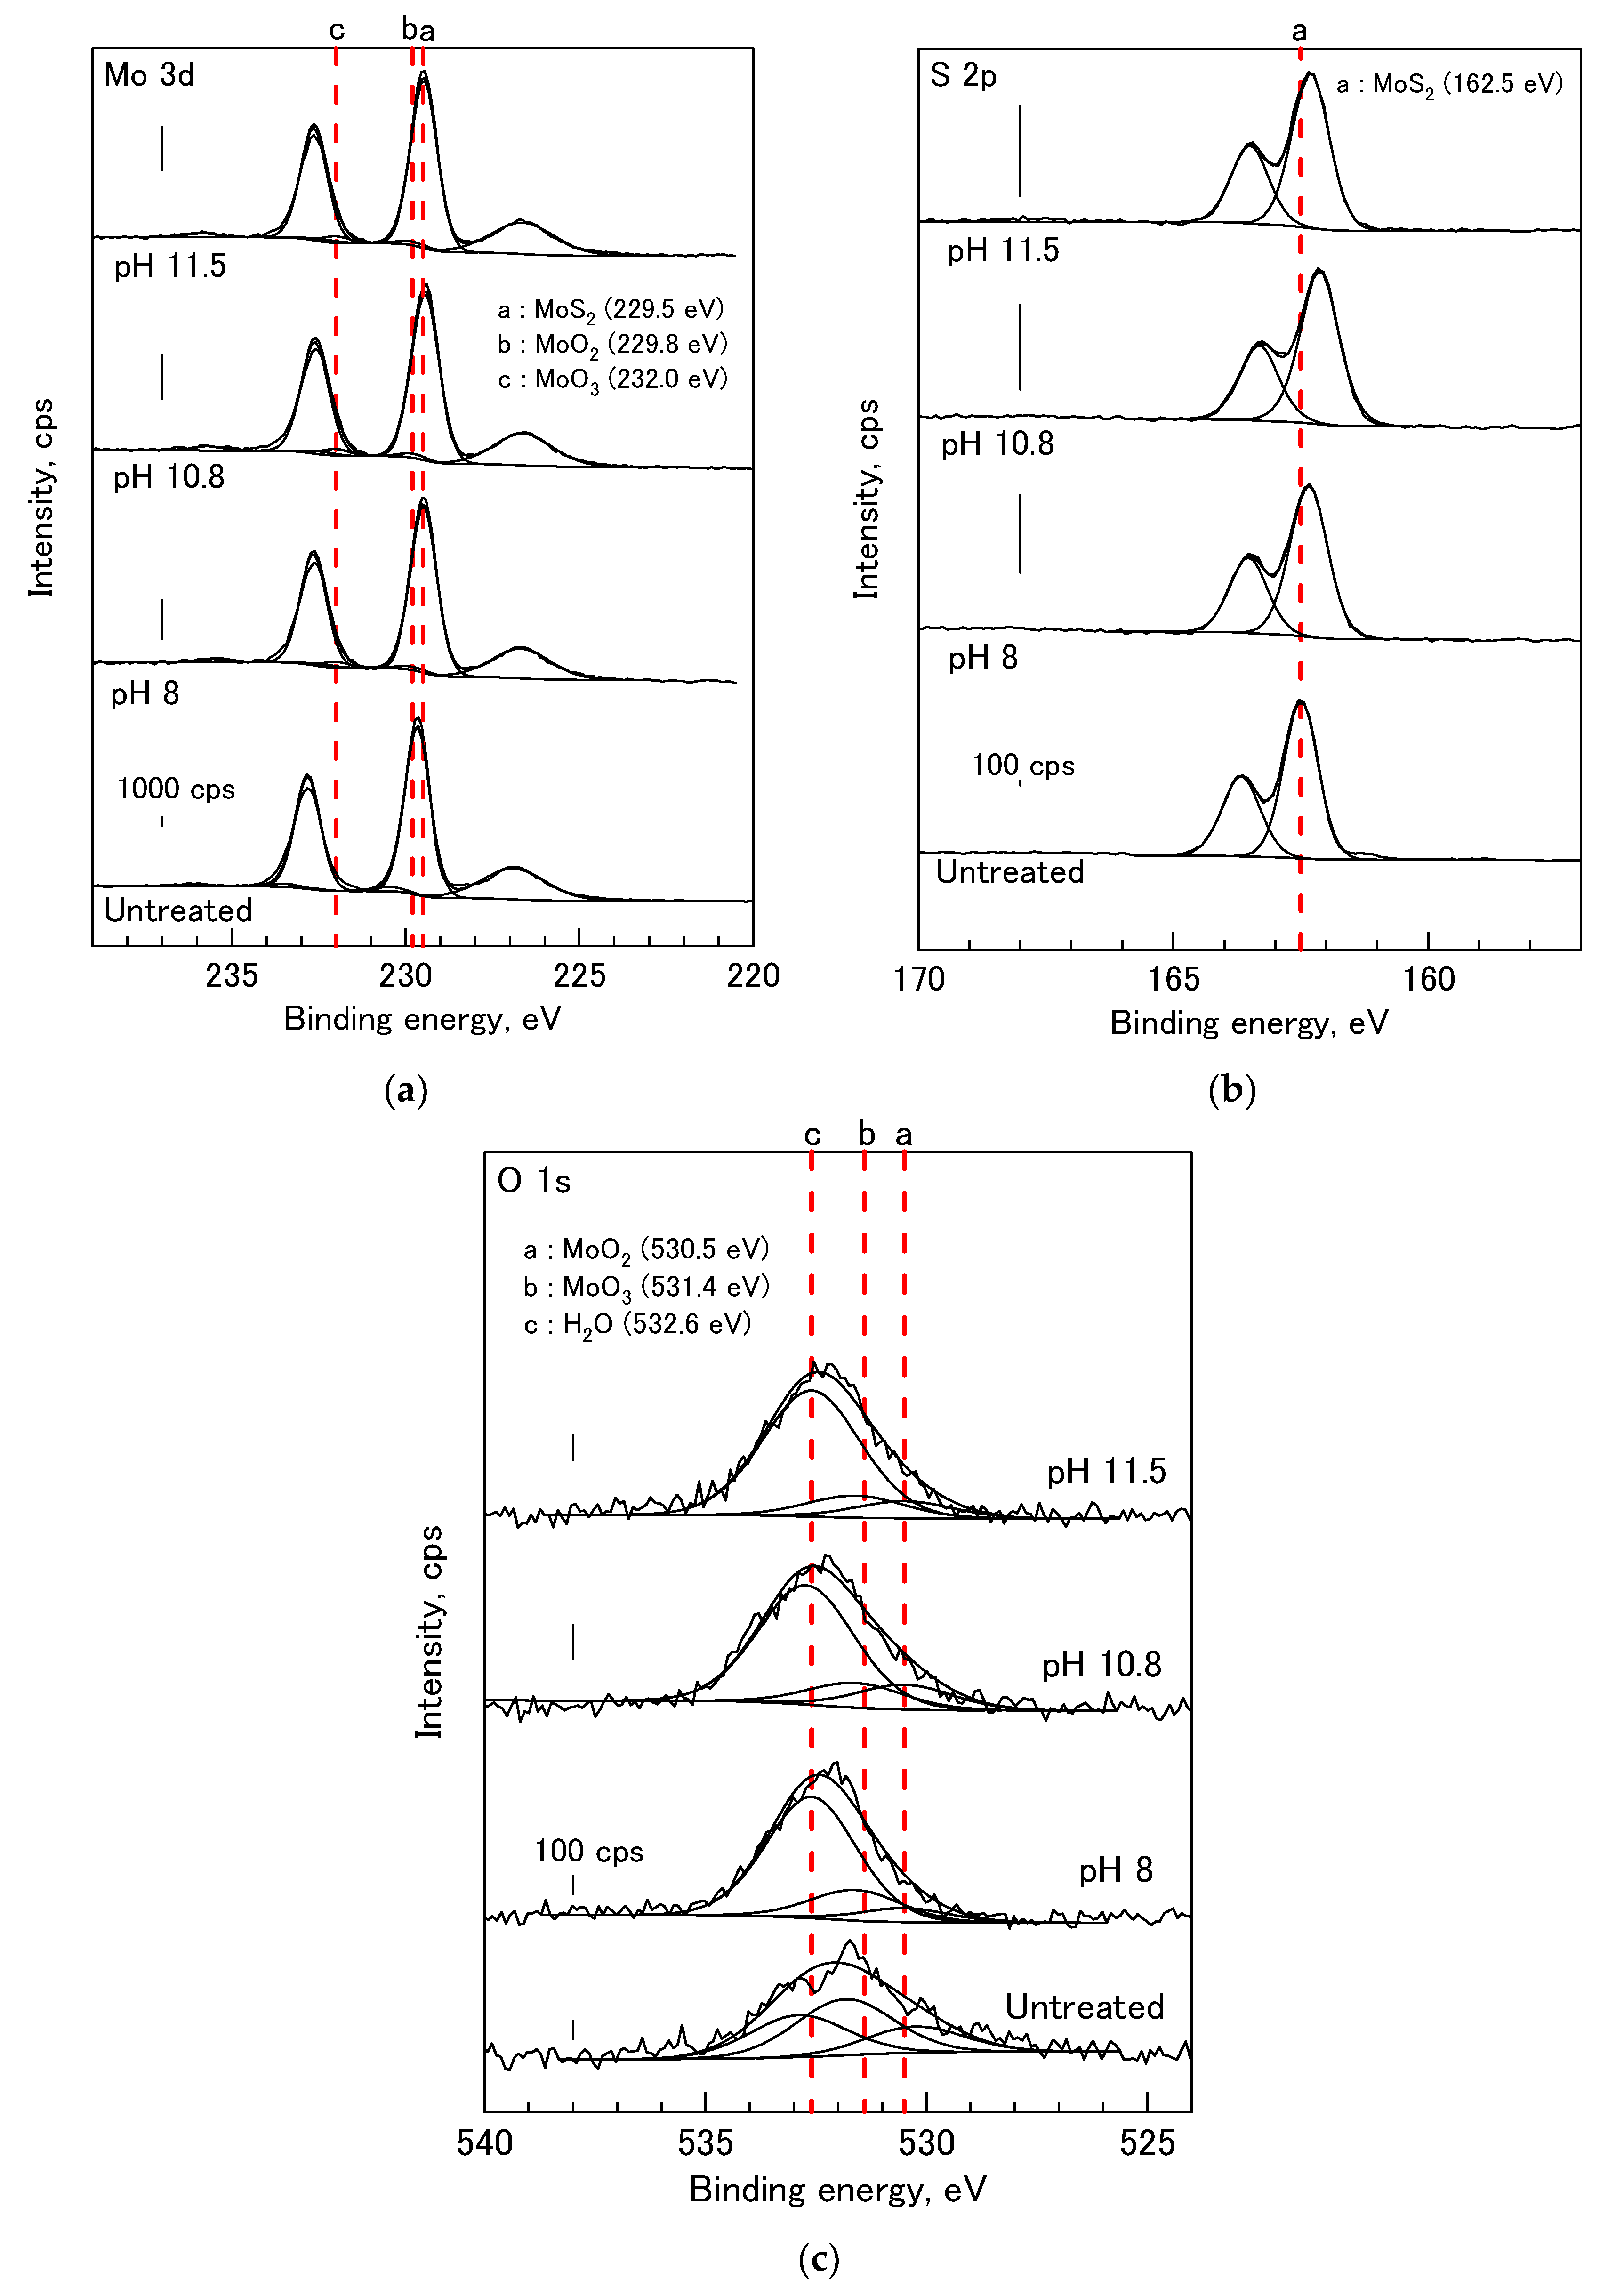
The XPS spectra of untreated and treated molybdenite presented in Figure 4 show that the molybdenite surface was slightly affected by the Na2SO3 treatment, in agreement with the contact angle results presented in Figure 2. The molybdenite (MoS2) species can be seen from the peak located at ca. 229.5 eV in the Mo3d spectrum [40]. Moreover, the S2p spectrum shows a peak located at ca. 162.5 eV which corresponds to the MoS2 species [41]. The Mo3d spectrum of untreated molybdenite suggests that the surface was slightly oxidized as indicated from the peaks located at ca. 229.8 and 232.0 eV. These peaks are attributed to MoO2 [42] and MoO3 [43], respectively. The O1s spectrum confirms the presence of MoO2 and MoO3, as indicated by the peaks located at ca. 530.5 eV [43] and ca. 531.4 eV [44]. The treated molybdenite spectra show similar species present as observed on untreated surface, indicating that the surface was slightly affected by the Na2SO3 treatment; thus, the surface remained hydrophobic.
3.3. Flotation Tests
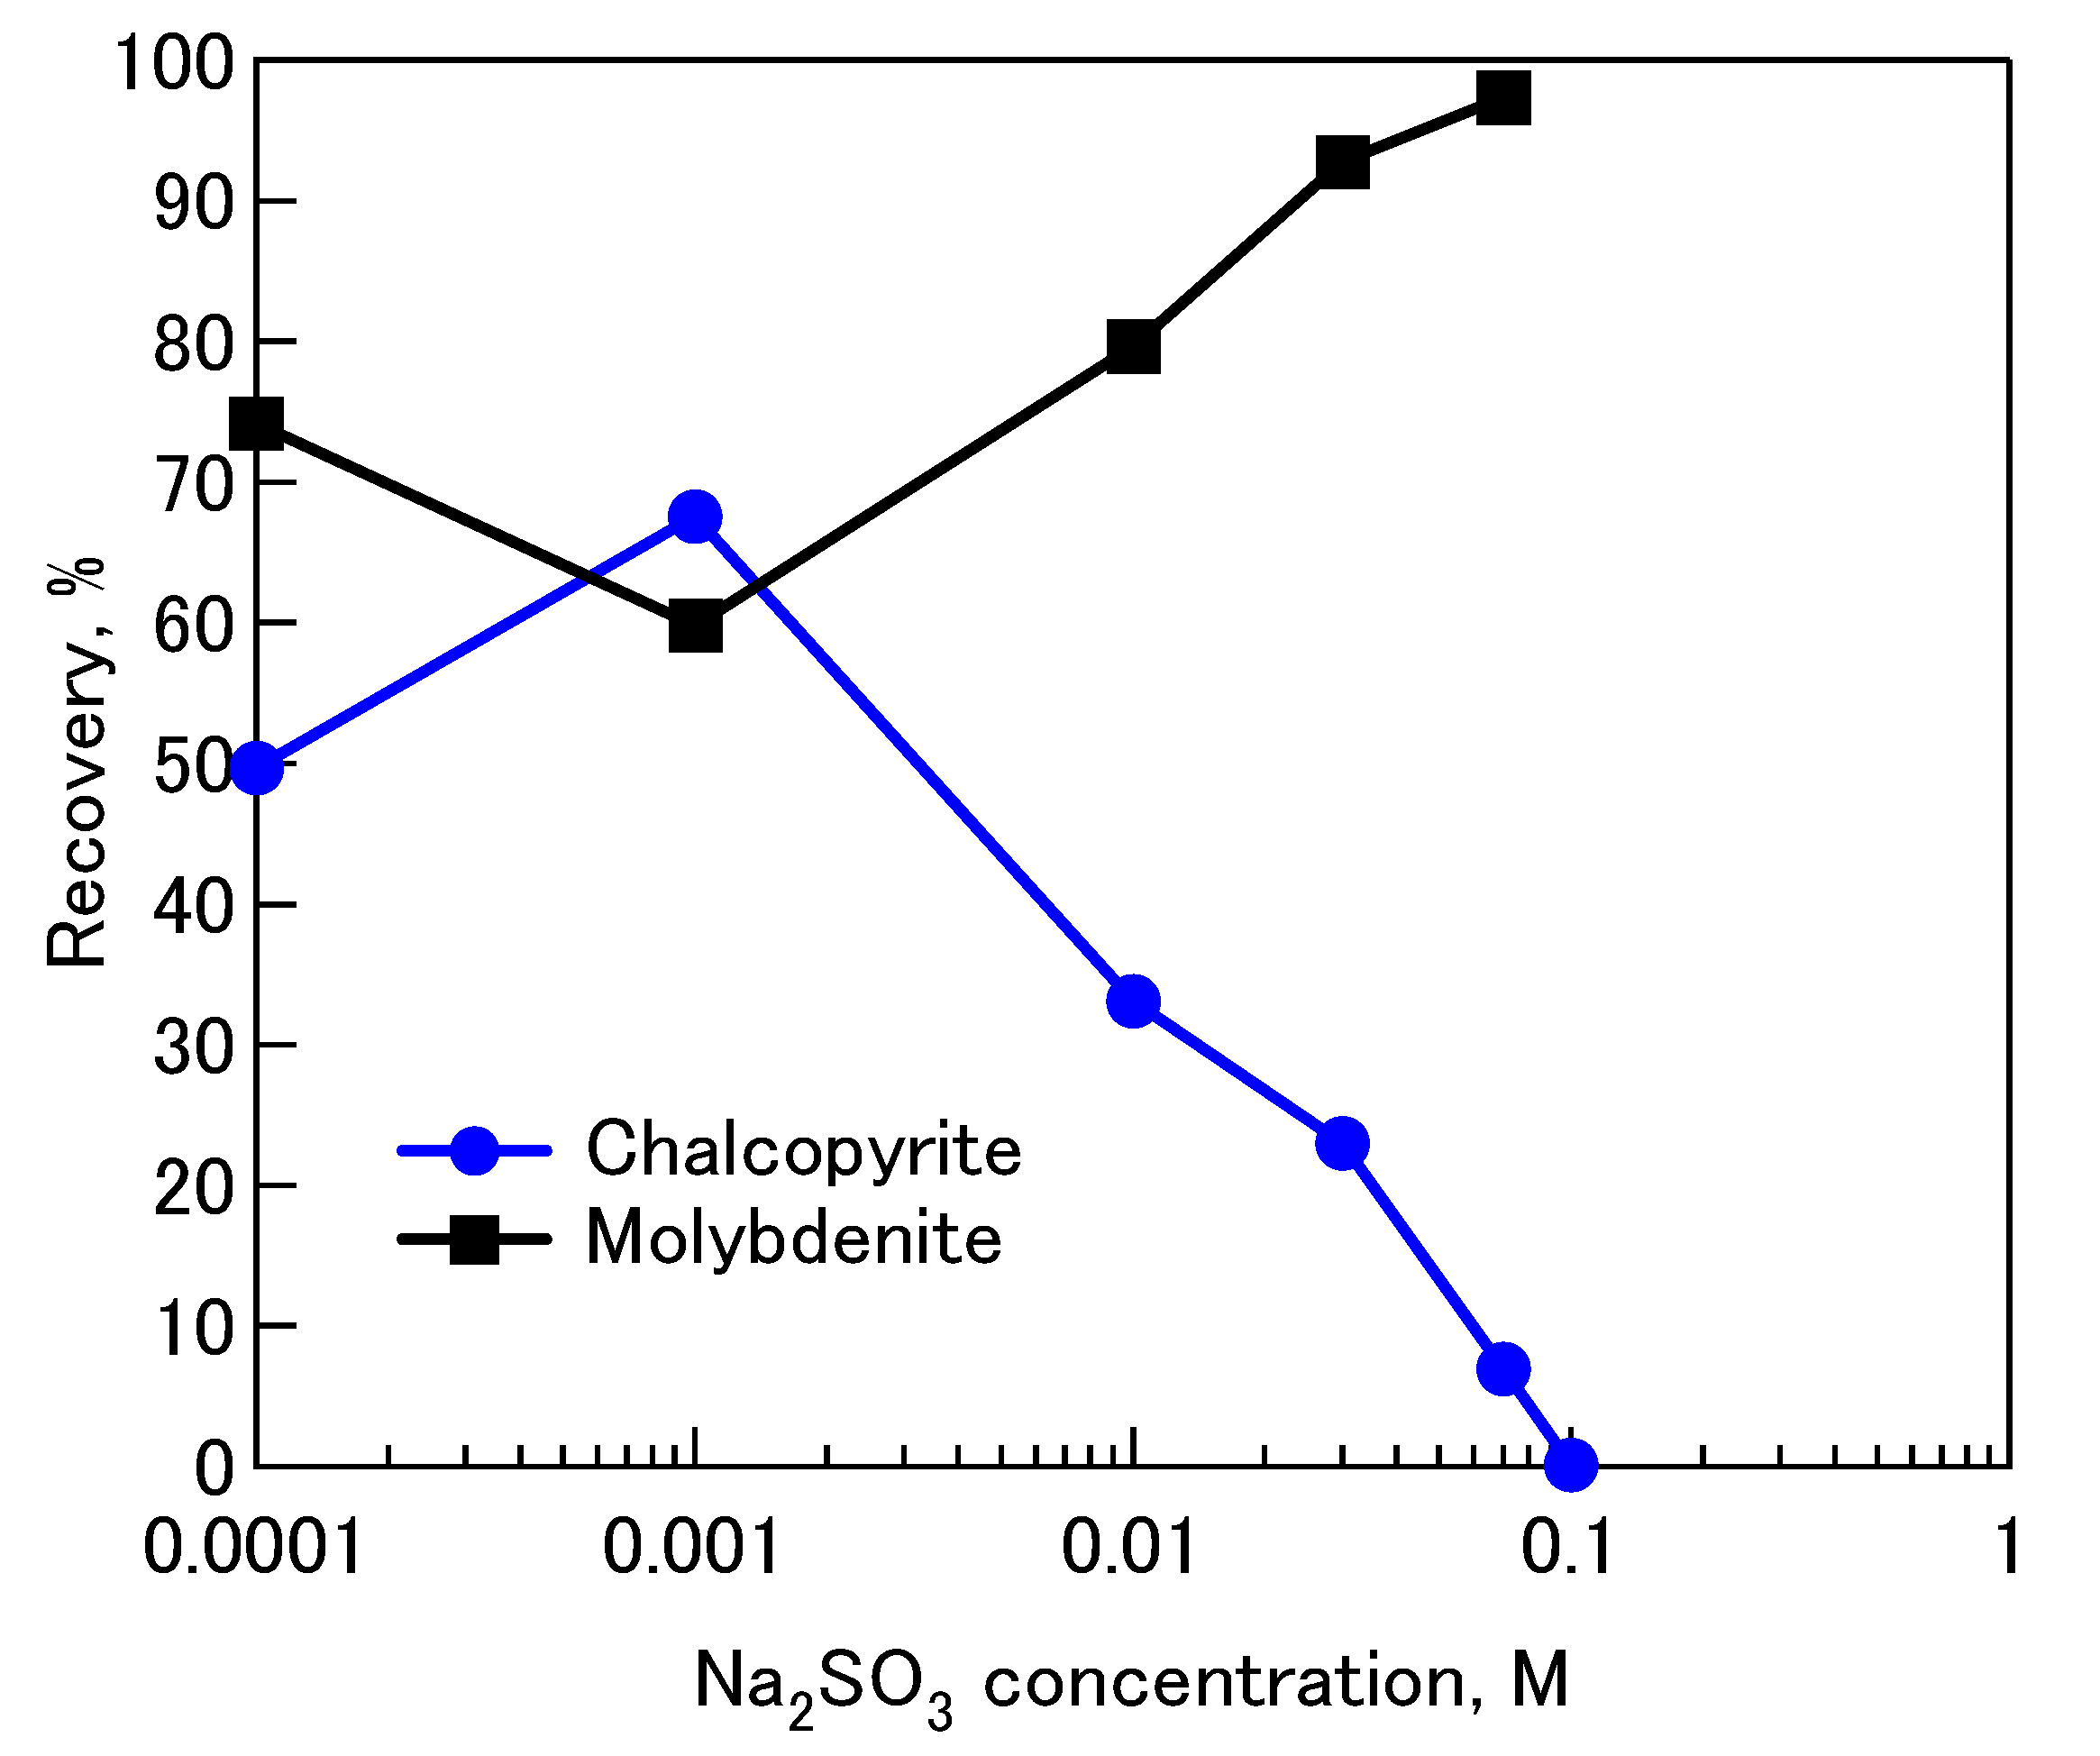
The effect of Na2SO3 on the floatability of single minerals of chalcopyrite and molybdenite without pretreatment using the TMD solution is presented in Figure 5. As shown in this figure, chalcopyrite recovery decreased gradually with increasing concentration of Na2SO3. Indeed, chalcopyrite recovery was almost zero after treatment with 0.1 M Na2SO3 for 60 min. The reason for this phenomenon might be the formation of hydrophilic precipitates on the chalcopyrite surface as shown from XPS and contact angle results. On the other hand, molybdenite recovery gradually increased with increasing concentration of Na2SO3 and reached ca. 95% after treatment with 0.07 M Na2SO3. These results support the contact angle and XPS results, showing that the surface of molybdenite remained hydrophobic after the treatment. It should be noted that the use of MIBC as a frother in the flotation tests might affect the floatability of molybdenite. However, the effect of this straight alcohol frother on molybdenite recovery is lower than those of the aromatic alcohols (i.e., pine oil) and alkoxy paraffin [2]. The flotation results of pure mineral suggest that Na2SO3 might be effective for selective separation of chalcopyrite and molybdenite, which will be addressed in future work.
4. Conclusions
The effect of Na2SO3 on surface wettability and floatability of chalcopyrite and molybdenite was investigated in this study. Contact angle measurements showed that contact angle of chalcopyrite gradually decreased with increasing concentration of Na2SO3. XPS results of chalcopyrite showed that various hydrophilic species (i.e., CuO, Cu(OH)2, FeOOH, Fe2(SO4)3) formed on the surface after the Na2SO3 treatment. These hydrophilic species might be the reason for the decreasing contact angle of the chalcopyrite. A mechanism was proposed to explain the formation of these hydrophilic species via a reduction of chalcopyrite to Cu2S followed by the oxidation of Cu2S. On the other hand, contact angle readings show that the molybdenite had a more hydrophobic surface compared with that of chalcopyrite after the treatment. The XPS results of molybdenite confirm the contact angle results, indicating that the surface was slightly affected by the Na2SO3 treatment.
Flotation of single mineral demonstrated that Na2SO3 depressed chalcopyrite floatability at a higher concentration, likely due to the decrease in the surface hydrophobicity of chalcopyrite. Meanwhile, the floatability of molybdenite gradually increased with increasing concentration of Na2SO3. The flotation results suggest that Na2SO3 might be effective for separation of these two minerals. However, further investigation is needed in the future to assess the effect of Na2SO3 on mixed minerals of chalcopyrite and molybdenite.
Acknowledgments
This work was supported by a Grant-in-Aid for Science Research (JSPS KAKENHI Grant No. JP15H02333 and No. JP16K06929) from the Japan Society for the Promotion of Science (JSPS)—Japan, the Sumitomo Metal Mining Co., Ltd., Japan, and the Ministry of Education, Culture, Sports, Science and Technology of Japan (MEXT).
Author Contributions
H.M. wrote the paper under the supervision of T.H. and K.S. who were also heavily involved in all stages of preparing this paper. Y.M. collected the experimental data with help from G.P.W.S., who also analyzed the XPS data and helped in writing the manuscript.
Conflicts of Interest
The authors declare no conflict of interest.
References
- Ansari, A.; Pawlik, M. Floatability of chalcopyrite and molybdenite in the presence of lignosulfonates. Part II. Hallimond tube flotation. Miner. Eng. 2007, 20, 609–616. [Google Scholar] [CrossRef]
- Bulatovic, S.M. Handbook of Flotation Reagents; Elsevier Science & Technology Books: Amsterdam, The Netherlands, 2007. [Google Scholar]
- Moreno, P.A.; Aral, H.; Cuevas, J.; Monardes, A.; Adaro, M.; Norgate, T.; Bruckard, W. The use of seawater as process water at Las Luces copper–molybdenum beneficiation plant in Taltal (Chile). Miner. Eng. 2011, 24, 852–858. [Google Scholar] [CrossRef]
- Pearse, M.J. An overview of the use of chemical reagents in mineral processing. Miner. Eng. 2005, 18, 139–149. [Google Scholar] [CrossRef]
- Prasad, M.S. Reagents in the mineral industry—Recent trends and applications. Miner. Eng. Spec. Issue Reag. Miner. Eng. 1992, 5, 279–294. [Google Scholar] [CrossRef]
- Somasundaran, P. Reagents in Mineral Technology; CRC Press: Boca Raton, FL, USA, 1987. [Google Scholar]
- Yin, W.; Zhang, L.; Xie, F. Flotation of Xinhua molybdenite using sodium sulfide as modifier. Trans. Nonferrous Met. Soc. China 2010, 20, 702–706. [Google Scholar] [CrossRef]
- Wills, B.A.; Napier-Munn, T.J. Mineral Processing Technology; Elsevier Science & Technology Books: Amsterdam, The Netherlands, 2006. [Google Scholar]
- Liu, G.; Lu, Y.; Zhong, H.; Cao, Z.; Xu, Z. A novel approach for preferential flotation recovery of molybdenite from a porphyry copper-molybdenum ore. Miner. Eng. 2012, 36, 37–44. [Google Scholar] [CrossRef]
- Zanin, M.; Ametov, I.; Grano, S.; Zhou, L.; Skinner, W. A study of mechanisms affecting molybdenite recovery in a bulk copper/molybdenum flotation circuit. Int. J. Miner. Process. 2009, 93, 256–266. [Google Scholar] [CrossRef]
- Ansari, A.; Pawlik, M. Floatability of chalcopyrite and molybdenite in the presence of lignosulfonates. Part I. Adsorption studies. Miner. Eng. 2007, 20, 600–608. [Google Scholar] [CrossRef]
- Shen, W.Z.; Fornasiero, D.; Ralston, J. Flotation of sphalerite and pyrite in the presence of sodium sulfite. Int. J. Miner. Process. 2001, 63, 17–28. [Google Scholar] [CrossRef]
- Haga, K.; Tongamp, W.; Shibayama, A. Investigation of flotation parameters for copper recovery from enargite and chalcopyrite mixed ore. Mater. Trans. 2012, 53, 707–715. [Google Scholar] [CrossRef]
- Houot, R.; Duhamet, D. Floatability of chalcopyrite in the presence of dialkyl-thionocarbamate and sodium sulfite. Int. J. Miner. Process. 1993, 37, 273–282. [Google Scholar] [CrossRef]
- Suyantara, G.P.W.; Hirajima, T.; Elmahdy, A.M.; Miki, H.; Sasaki, K. Effect of kerosene emulsion in MgCl2 solution on the kinetics of bubble interactions with molybdenite and chalcopyrite. Colloids Surf. A Physicochem. Eng. Asp. 2016, 501, 98–113. [Google Scholar] [CrossRef]
- Suyantara, G.P.W.; Hirajima, T.; Miki, H.; Sasaki, K. Floatability of molybdenite and chalcopyrite in artificial seawater. Miner. Eng. 2018, 115, 117–130. [Google Scholar] [CrossRef]
- Hirajima, T.; Miki, H.; Suyantara, G.P.W.; Matsuoka, H.; Elmahdy, A.M.; Sasaki, K.; Imaizumi, Y.; Kuroiwa, S. Selective flotation of chalcopyrite and molybdenite with H2O2 oxidation. Miner. Eng. 2017, 100, 83–92. [Google Scholar] [CrossRef]
- Miki, H.; Matsuoka, H.; Hirajima, T.; Suyantara, G.P.W.; Sasaki, K. Electrolysis Oxidation of Chalcopyrite and Molybdenite for Selective Flotation. Mater. Trans. 2017, 58, 761–767. [Google Scholar]
- Hirajima, T.; Mori, M.; Ichikawa, O.; Sasaki, K.; Miki, H.; Farahat, M.; Sawada, M. Selective flotation of chalcopyrite and molybdenite with plasma pre-treatment. Miner. Eng. Froth Flotat. 2014, 66, 102–111. [Google Scholar] [CrossRef]
- Shirley, D.A. High-Resolution X-ray Photoemission Spectrum of the Valence Bands of Gold. Phys. Rev. B 1972, 5, 4709–4714. [Google Scholar] [CrossRef]
- Nakai, I.; Sugitani, Y.; Nagashima, K.; Niwa, Y. X-ray photoelectron spectroscopic study of copper minerals. J. Inorg. Nucl. Chem. 1978, 40, 789–791. [Google Scholar] [CrossRef]
- Hussain, Z.; Salim, M.A.; Khan, M.A.; Khawaja, E.E. X-ray photoelectron and auger spectroscopy study of copper-sodium-germanate glasses. J. Non-Cryst. Solids 1989, 110, 44–52. [Google Scholar] [CrossRef]
- McIntyre, N.S.; Cook, M.G. X-ray photoelectron studies on some oxides and hydroxides of cobalt, nickel, and copper. Anal. Chem. 1975, 47, 2208–2213. [Google Scholar] [CrossRef]
- Hollinger, G.; Kumurdjian, P.; Mackowski, J.M.; Pertosa, P.; Porte, L.; Duc, T.M. ESCA study of molecular GeS3-x Tex As2 glasses. J. Electron Spectrosc. Relat. Phenom. 1974, 5, 237–245. [Google Scholar] [CrossRef]
- Thomas, J.M.; Adams, I.; Williams, R.H.; Barber, M. Valence band structures and core-electron energy levels in the monochalcogenides of gallium. Photoelectron spectroscopic study. J. Chem. Soc. Faraday Trans. 2 1972, 68, 755–764. [Google Scholar] [CrossRef]
- Cudennec, Y.; Lecerf, A. The transformation of Cu(OH)2 into CuO, revisited. Solid State Sci. 2003, 5, 1471–1474. [Google Scholar] [CrossRef]
- Siriwardane, R.V.; Cook, J.M. Interactions of NO and SO2 with iron deposited on silica. J. Colloid Interface Sci. 1985, 104, 250–257. [Google Scholar] [CrossRef]
- Yu, X.R.; Liu, F.; Wang, Z.Y.; Chen, Y. Auger parameters for sulfur-containing compounds using a mixed aluminum-silver excitation source. J. Electron Spectrosc. Relat. Phenom. 1990, 50, 159–166. [Google Scholar] [CrossRef]
- Brion, D. Etude par spectroscopie de photoelectrons de la degradation superficielle de FeS2, CuFeS2, ZnS et PbS a l’air et dans l’eau. Appl. Surf. Sci. 1980, 5, 133–152. [Google Scholar] [CrossRef]
- Laajalehto, K.; Kartio, I.; Nowak, P. XPS study of clean metal sulfide surfaces. Appl. Surf. Sci. 1994, 81, 11–15. [Google Scholar] [CrossRef]
- Karthe, S.; Szargan, R.; Suoninen, E. Oxidation of pyrite surfaces: A photoelectron spectroscopic study. Appl. Surf. Sci. 1993, 72, 157–170. [Google Scholar] [CrossRef]
- Carver, J.C.; Schweitzer, G.K.; Carlson, T.A. Use of X-Ray Photoelectron Spectroscopy to Study Bonding in Cr, Mn, Fe, and Co Compounds. J. Chem. Phys. 1972, 57, 973–982. [Google Scholar] [CrossRef]
- Buckley, A.N.; Woods, R. An X-ray photoelectron spectroscopic study of the oxidation of chalcopyrite. Aust. J. Chem. 1984, 37, 2403–2413. [Google Scholar] [CrossRef]
- Strohmeier, B.R.; Leyden, D.E.; Field, R.S.; Hercules, D.M. Surface spectroscopic characterization of CuAl2O3 catalysts. J. Catal. 1985, 94, 514–530. [Google Scholar] [CrossRef]
- Deroubaix, G.; Marcus, P. X-ray photoelectron spectroscopy analysis of copper and zinc oxides and sulphides. Surf. Interface Anal. 1992, 18, 39–46. [Google Scholar] [CrossRef]
- Tan, B.J.; Klabunde, K.J.; Sherwood, P.M.A. X-ray photoelectron spectroscopy studies of solvated metal atom dispersed catalysts. Monometallic iron and bimetallic iron-cobalt particles on alumina. Chem. Mater. 1990, 2, 186–191. [Google Scholar] [CrossRef]
- Siriwardane, R.V.; Cook, J.M. Interactions of SO2 with sodium deposited on CaO. J. Colloid Interface Sci. 1986, 114, 525–535. [Google Scholar] [CrossRef]
- Terlingen, J.G.A.; Feijen, J.; Hoffman, A.S. Immobilization of surface active compounds on polymer supports using glow discharge processes: 1. Sodium dodecyl sulfate on poly(propylene). J. Colloid Interface Sci. 1993, 155, 55–65. [Google Scholar] [CrossRef]
- Sasaki, K.; Takatsugi, K.; Ishikura, K.; Hirajima, T. Spectroscopic study on oxidative dissolution of chalcopyrite, enargite and tennantite at different pH values. Hydrometallurgy 2010, 100, 144–151. [Google Scholar] [CrossRef]
- Benoist, L.; Gonbeau, D.; Pfister-Guillouzo, G.; Schmidt, E.; Meunier, G.; Levasseur, A. XPS analysis of lithium intercalation in thin films of molybdenum oxysulphides. Surf. Interface Anal. 1994, 22, 206–210. [Google Scholar] [CrossRef]
- Stevens, G.C.; Edmonds, T. Electron spectroscopy for chemical analysis spectra of molybdenum sulfides. J. Catal. 1975, 37, 544–547. [Google Scholar] [CrossRef]
- Seifert, G.; Finster, J.; Müller, H. SW Xα calculations and x-ray photoelectron spectra of molybdenum(II) chloride cluster compounds. Chem. Phys. Lett. 1980, 75, 373–377. [Google Scholar] [CrossRef]
- Kim, K.S.; Baitinger, W.E.; Amy, J.W.; Winograd, N. ESCA studies of metal-oxygen surfaces using argon and oxygen ion-bombardment. J. Electron Spectrosc. Relat. Phenom. 1974, 5, 351–367. [Google Scholar] [CrossRef]
- Patterson, T.A.; Carver, J.C.; Leyden, D.E.; Hercules, D.M. A surface study of cobalt-molybdena-alumina catalysts using X-ray photoelectron spectroscopy. J. Phys. Chem. 1976, 80, 1700–1708. [Google Scholar] [CrossRef]
Figure 1.
Contact angle of chalcopyrite and molybdenite at various pH values after the pretreatment using TMD solution followed by treatment using 0.1 M Na2SO3 for 10–60 min.
Figure 1.
Contact angle of chalcopyrite and molybdenite at various pH values after the pretreatment using TMD solution followed by treatment using 0.1 M Na2SO3 for 10–60 min.

Figure 2.
Effect of 0.1 M Na2SO3 on contact angle of chalcopyrite and molybdenite at various pH values and treatment times without pretreatment using TMD solution.
Figure 2.
Effect of 0.1 M Na2SO3 on contact angle of chalcopyrite and molybdenite at various pH values and treatment times without pretreatment using TMD solution.

Figure 3.
The Cu2p (a); S2p (b); Fe2p (c); and O1s (d) spectra of untreated and treated chalcopyrite with 0.1 M Na2SO3 treatment for 60 min at various pH conditions.
Figure 3.
The Cu2p (a); S2p (b); Fe2p (c); and O1s (d) spectra of untreated and treated chalcopyrite with 0.1 M Na2SO3 treatment for 60 min at various pH conditions.

Figure 4.
The Mo3d (a); S2p (b); and O1s (c) spectra of untreated and treated molybdenite with 0.1 M Na2SO3 treatment at various pH conditions.
Figure 4.
The Mo3d (a); S2p (b); and O1s (c) spectra of untreated and treated molybdenite with 0.1 M Na2SO3 treatment at various pH conditions.

Figure 5.
Effect of various concentrations of Na2SO3 on floatability of single minerals of chalcopyrite and molybdenite at pH 10.8.
Figure 5.
Effect of various concentrations of Na2SO3 on floatability of single minerals of chalcopyrite and molybdenite at pH 10.8.

© 2018 by the authors. Licensee MDPI, Basel, Switzerland. This article is an open access article distributed under the terms and conditions of the Creative Commons Attribution (CC BY) license (http://creativecommons.org/licenses/by/4.0/).
Share and Cite
MDPI and ACS Style
Miki, H.; Hirajima, T.; Muta, Y.; Suyantara, G.P.W.; Sasaki, K. Effect of Sodium Sulfite on Floatability of Chalcopyrite and Molybdenite. Minerals 2018, 8, 172. https://0-doi-org.brum.beds.ac.uk/10.3390/min8040172
AMA Style
Miki H, Hirajima T, Muta Y, Suyantara GPW, Sasaki K. Effect of Sodium Sulfite on Floatability of Chalcopyrite and Molybdenite. Minerals. 2018; 8(4):172. https://0-doi-org.brum.beds.ac.uk/10.3390/min8040172
Chicago/Turabian StyleMiki, Hajime, Tsuyoshi Hirajima, Yukihiro Muta, Gde Pandhe Wisnu Suyantara, and Keiko Sasaki. 2018. "Effect of Sodium Sulfite on Floatability of Chalcopyrite and Molybdenite" Minerals 8, no. 4: 172. https://0-doi-org.brum.beds.ac.uk/10.3390/min8040172
Note that from the first issue of 2016, this journal uses article numbers instead of page numbers. See further details here.