Article

Comparative Analysis of Attachment to Chalcopyrite of Three Mesophilic Iron and/or Sulfur-Oxidizing Acidophiles

1
Key Laboratory for Water Quality and Conservation of the Pearl River Delta, Ministry of Education, School of Environmental Science and Engineering, Guangzhou University, Guangzhou 510006, China
2
School of Minerals Processing and Bioengineering, Key Laboratory of Biometallurgy of Ministry of Education, Central South University, Changsha 410083, China
3
Biofilm Centre, Aquatische Biotechnologie, Universität Duisburg-Essen, 45141 Essen, Germany
4
Hunan Provincial Key Laboratory of Complex Copper Lead Zinc Associated Metal Resources Comprehensive Utilization, Hunan Research Institute of Nonferrous Metals, Changsha 410100, China
5
Federal Institute for Geosciences and Natural Resources (BGR), Stilleweg 2, 30655 Hannover, Germany
*
Author to whom correspondence should be addressed.
Submission received: 24 July 2018 / Revised: 3 September 2018 / Accepted: 12 September 2018 / Published: 14 September 2018

Abstract

:
Adhesion plays an important role in bacterial dissolution of metal sulfides, since the attached cells initiate the dissolution. In addition, biofilms, forming after bacterial attachment, enhance the dissolution. In this study, interactions between initial adhesion force, attachment behavior and copper recovery were comparatively analyzed for Acidithiobacillus ferrooxidans, Acidithiobacillus thiooxidans, and Leptospirillum ferrooxidans during bioleaching of chalcopyrite. The adhesion forces between bacteria and minerals were measured by atomic force microscopy (AFM). L. ferrooxidans had the largest adhesion force and attached best to chalcopyrite, while A. ferrooxidans exhibited the highest bioleaching of chalcopyrite. The results suggest that the biofilm formation, rather than the initial adhesion, is positively correlated with bioleaching efficiency.

1. Introduction

Chalcopyrite is the primary and most abundant copper sulfide mineral. However, because of various requirements (high temperature, complicated pretreatment) and formation of passivating layers (elemental sulfur, copper-rich polysulfide, or iron sulfate-type precipitates), it is recalcitrant to be leached via hydrometallurgical processing [1,2,3,4,5]. Among hydrometallurgical methods, bioleaching turned out to be the best alternative [6,7,8]. The dissolution of metal ions from insoluble metal sulfides by microorganisms is known as bioleaching [9]. It can be achieved through two modes: contact and non-contact leaching. In both modes, bacteria oxidize ferrous ion to ferric ion, then ferric ion attack minerals. As a consequence, ferrous ion and reduced inorganic sulfur compounds (RISCs) are produced as intermediates. Ferrous ion is re-oxidized by iron oxidizing bacteria. RISCs are oxidized to sulfates by sulfur-oxidizing bacteria, which causes the environment acidify. As a result, minerals get dissolved. The contact leaching mode is accepted to be more effective because the micro space, filled with extracellular polymeric substances (EPS) between mineral surface and biofilm cells, accumulates ferric ion and shortens the reaction time [10,11,12]. In order to win copper in a large industrial scale, a lot of research has been done, including optimization of leaching conditions and of bacterial communities [1,13,14,15]. These strategies made some progress, but the main hindrance for industrial application is still the low rate of chalcopyrite dissolution. Thus, a detailed understanding of adhesion and biofilm formation is needed for further improvement.
Adhesion of bacteria to surfaces is the primary step for biofilm formation [16]. It is mediated by specific (stereochemical forces, such as molecular recognition between ligand and receptor molecules) and/or non-specific (physicochemical forces, such as Lifshitz–Van der Waals, hydrogen bonding, hydrophobic, electrostatic, and acid–base interactions) molecular interactions [17]. By using either thermodynamics or the DLVO theory, the initial bacterial attachment to substrates can be characterized by calculating adhesion force based on experimental data, including zeta potential, contact angle, and surface free energy of the bacteria and of the substrate [18,19,20]. However, this can provide only indirect values for the adhesion force. Atomic force microscopy (AFM) equipped with a cell probe can directly measure the initial adhesion force between cells and surfaces [21,22,23,24]. The term, “cell probe”, means that cells are immobilized on tip of an AFM cantilever. In recent years, this technology of cell probe has already been applied to the field of bioleaching. Diao et al. quantified interactions between different leaching bacteria and pyrite [25,26]. Zhu et al. measured adhesion force between various acidophilic cells and chalcopyrite [27]. They elucidated the effects of energy source, ionic strength, or EPS on the adhesion force, but there was no connection of adhesion force with metal recovery.
Producing EPS and developing early biofilm architecture are the next steps for microorganisms to establish a biofilm after initial adhesion. Since development of a biofilm is pivotal for improving leaching efficiency, emphasis was also placed on the bacterial colonization of mineral surfaces [28,29]. Up to now, there is no correlation between adhesion force and colonization.
Thus, we investigated the relationship between adhesion force, bacterial attachment, and leaching efficiency. Firstly, the initial adhesion force of cells of Acidithiobacillus ferrooxidans, Acidithiobacillus thiooxidans, or Leptospirillum ferrooxidans to chalcopyrite were measured directly by force–distance curves with an AFM. Secondly, the numbers of cells attached to chalcopyrite surfaces were determined within 2 h. Thirdly, copper recovery was measured for all assays for 21 days. Besides, an AFM combined with an epifluorescence microscopy (EFM) was used to visualize biofilm development of the three strains on chalcopyrite coupons.

2. Materials and Methods

2.1. Strains and Growth Conditions

A. ferrooxidans strain ATCC23270, A. thiooxidans strain DSM622, and L. ferrooxidans strain DSM2391 were used in this study. A. ferrooxidans ATCC23270 and L. ferrooxidans DSM2391 were cultivated in 9 K medium [30]: (NH4)2SO4 3 g/L, KCl 0.1 g/L, K2HPO4·3H2O 0.5 g/L, MgSO4·7H2O 0.5 g/L, Ca(NO3)2 0.01 g/L, with 4.47% FeSO4 as energy source. A. thiooxidans DSM622 was cultivated in Starkey medium [31]: (NH4)2SO4 3 g/L, KH2PO4 3 g/L, MgSO4·7H2O 0.5 g/L, CaCl2 ·2H2O 0.25 g/L with 1% S0. All bacteria were incubated at 30 °C on a rotary shaker at 170 rpm.

2.2. Immobilization of Cells on AFM Cantilevers

Cells for immobilization were harvested during the mid-exponential phase. To remove precipitates, the culture was at first filtered using Whatman 42 filter paper. The filtrate was then centrifuged at 11,270× g for 20 min at 4 °C. The pellet was washed in 0.005 mol/L H2SO4 solution (pH = 2) to obtain metabolite-free cells. Cells were further washed in a phosphate buffer solution (PBS, pH = 7.2) and resuspended in 3% (v/v) glutaraldehyde solution for 2 h at 4 °C. After glutaraldehyde treatment, the cells were rinsed and resuspended in PBS and incubated at 4 °C overnight.
The silicon nitride tip was immersed in 1% polyethyleneimine (PEI) for 2.5 h. Afterwards, the tip was rinsed in double-distilled water and stored at 4 °C [32]. A droplet of cells was transferred onto PEI-coated tips for immobilization. Then, a drop of 3% glutaraldehyde was added, followed by incubation at 4 °C for 2 h. The modified cantilevers were rinsed with double-distilled water and dried in air [24]. All tips coated with bacteria were checked by scanning electron microscopy (SEM) after the AFM measurement (Figure 1).

2.3. Preparation of Chalcopyrite Coupons and Powder

Museum grade chalcopyrite was purchased from The Geological Museum of Hunan, Changsha, China. Cu and Fe account for 36.5% and 33% of total weight of the mineral, respectively. The mineral was cut into coupons with 10 mm in diameter and 2 mm in height. The remaining chalcopyrite was ground into particles with a diameter of less than 75 μm and stored under nitrogen atmosphere. The chalcopyrite coupons were further polished using liquid diamond paste of 6, 3, and 0.5 μm grain size, successively, on a polishing cloth. The polished coupons were subsequently cleaned with a 70% ethanol solution and stored under nitrogen atmosphere.

2.4. Force Measurement and Bacterial Topography Analysis by AFM

A Digital Instruments Nanoscope V Multimode AFM (Dimension 5000, Bruker, Santa Barbara, CA, USA) in contact mode was used to measure the adhesion forces. Experiments were conducted in a fluid cell filled with iron-free 9 K medium at pH 2. Only the force corresponding to the vertical displacement was measured. The applied force was 800 pN, and the scan rate ranged between 0.5 and 1 Hz. The applied ramp size was 800 nm, and the loading force was applied by setting the trigger mode to be relative.
Regarding the force measurements, before measurements two parallel cell probes were approached to contact with a chalcopyrite surface and then retracted to keep a constant distance in iron-free 9K medium at pH 2 for at least 30 min [33]. Force measurements were performed for 30 times at three different locations. Data were recorded during both the “approach” to and the “retraction” from the chalcopyrite by the cell-coated tip. The force curve data were an average of sixty force measurements. Force curves (tip deflection in nm versus piezo position in nm) were obtained after the force measurement. The adhesion forces were analyzed with the one-way ANOVA test and its post hoc Bonferroni test by SPSS software. Tip deflection data were translated into force (in nano-Newtons) by the AFM software automatically. The spring constant of the cantilever was 0.57 ± 0.02 nN/nm. The representative force curves were plotted together by aligning the zero deflection and constant compliance portions of the curves like in previous literature [22]. The AFM imaging of bacterial topography was performed as previously described [34].

2.5. Attachment of Planktonic Cells to Chalcopyrite Powder

Harvested cells were suspended in 100 mL iron-free 9K medium with a cell density of 1 × 10⁸ cells/mL. Chalcopyrite powder (1 g) was added to the medium to investigate the initial bacterial adhesion. Each experiment was carried out in 250 mL Erlenmeyer flasks, which were agitated 2 h at 170 rpm, 30 °C. During the experiment, the number of planktonic cells was monitored by direct count using a Petroff Hausser counting chamber (Hausser Scientific, Horsham, PA, UK) with an optical microscope. All experiments were repeated three times. The number of attached cells was calculated by subtracting the planktonic from the initial cell number [35].

2.6. Bioleaching of Chalcopyrite Powder

Leaching experiments were conducted in 250 mL flasks with 100 mL iron-free 9 K medium and 2 g chalcopyrite powder in an air-conditioned shaker at 30 °C and 170 rpm. The pH was adjusted to 2 by 10 M H2SO4 at the beginning of bioleaching. The inoculating cell density was 3 × 10⁶ cells/mL. The concentration of copper was measured after 3, 7, 11, 15, 19, and 21 days leaching by inductively coupled plasma-atomic emission spectroscopy (ICP-AES) (Perkin Elmer Optima 3300RL, Perkin Elmer, Waltham, MA, USA).
At day 21, one part of the residues of the leached sample was filtered and dried in air, while the remains were treated by sonication to remove the attached bacteria. Afterwards, they were visualized by SEM to follow the growth of the bacteria by the corrosion traces on the chalcopyrite.

2.7. Visualization of Attachment to Chalcopyrite Coupons by Combined AFM and EFM

For monitoring the bacterial attachment during bioleaching, chalcopyrite coupons were put into 100 mL iron-free 9K medium with a cell density of 1 × 10⁸ cells/mL. Then they were incubated at 30 °C, 130 rpm.
At day 1, day 3, and day 7, chalcopyrite coupons were taken out. For staining the coupons were first rinsed with sterile pH 2 H2SO4 three times, and then rinsed with sterile still water three times. Afterwards, one drop of SYTO 9 was first placed on the surface of chalcopyrite coupons for 10 min. After rinsing with sterile water, one drop of ConA-TRITC was then placed on the surfaces for 30 min. The coupons were then observed under combined AFM and EFM after rinsing with sterile water. For visualization, two coupons of replicate incubations were used and at least three positions were checked on each coupon.
Regarding the instrumentation of combined AFM and EFM, a NanoWizard II atomic force microscope (JPK Instruments, Berlin, Germany) and an upright epifluorescence microscope (Axio Imager A1m; Zeiss, Jena, Germany) were combined for the Biomaterials Workstation (JPK Instruments). By using this shuttle stage, the same location on a sample can be visualized by two different microscopic techniques.
For EFM imaging, a 50× objective was used. The AFM imaging was performed by contact mode in air with a scan rate of 0.7 Hz and setpoint of 1 V using a CSC38 cantilever (Mikromasch, Estonia).

3. Results and Discussion

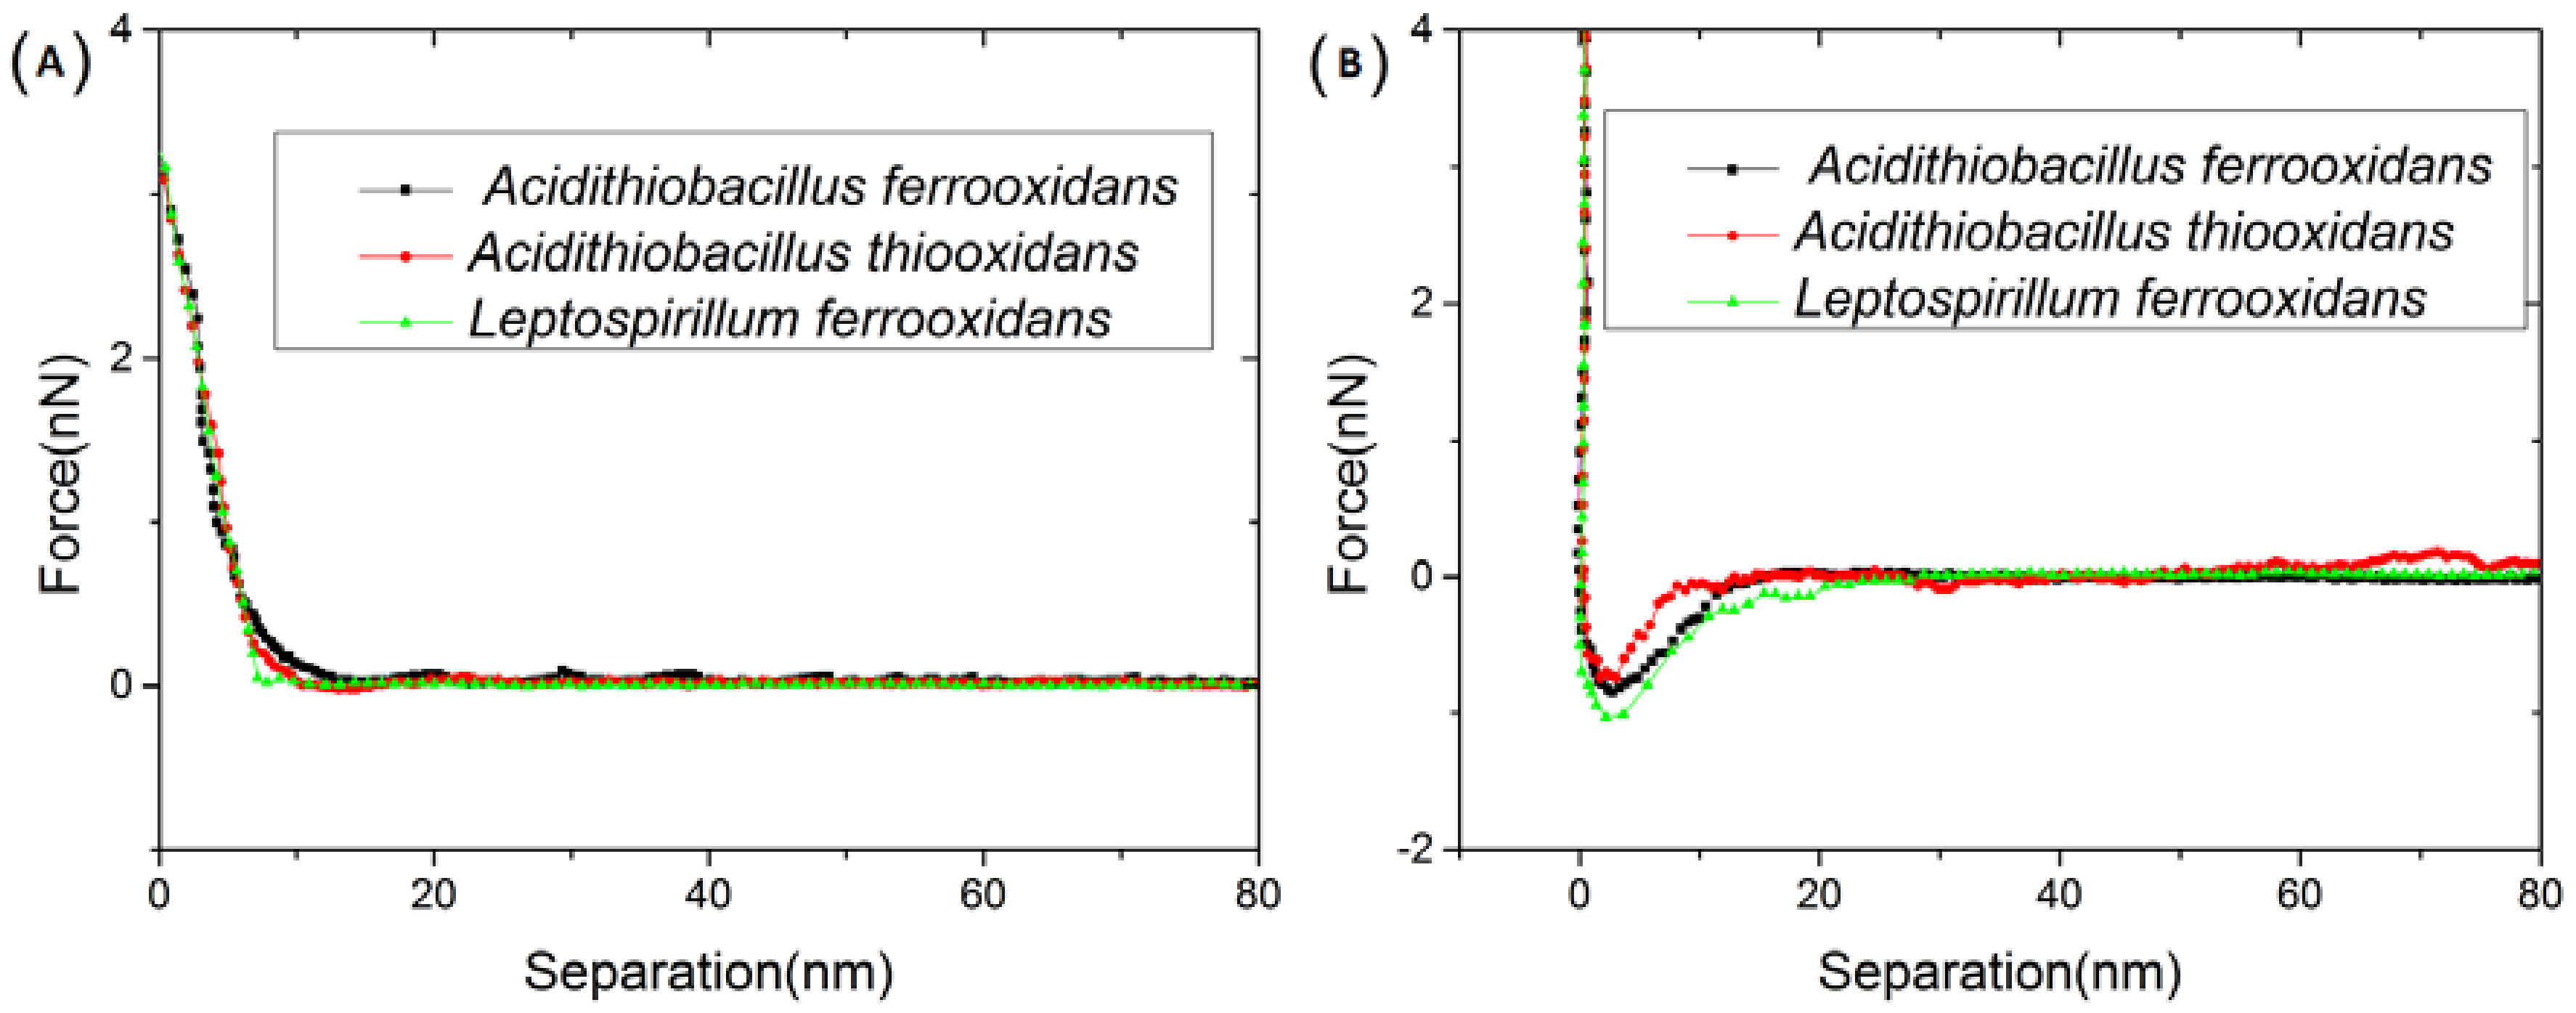
3.1. Interactions between Immobilized Cells and Surface of a Chalcopyrite Coupon

Figure 2 presents the force–distance curves for interactions between cells of A. ferrooxidans, A. thiooxidans, or L. ferrooxidans and surface of chalcopyrite. Each curve is composed of two parts: the approach curve (the part indicates the movement of the cell probe towards the chalcopyrite, Figure 2A) and the retraction curve (the part indicates the movement of the cell probe away from the chalcopyrite, Figure 2B). As demonstrated in Figure 2A, the force between the bacterial cells and chalcopyrite started to increase gradually, when the distance decreased to below 15 nm, regardless of the type of cells. The interactions during this stage were repulsive because of the existence of long-range Van der Waals forces. Since the cells on the cantilever tips were soft and compressible, no sharp single point represented the “jump to contact” event on the approach curve. This repulsive force kept increasing until the cell probe contacted with the chalcopyrite surface. This observation is in agreement with other research, where the authors investigated the interactions between an AFM silicon nitride tip and cells of A. ferrooxidans immobilized on a coated glass slide [36].
After contact, the reverse process was started: the cell probe was retracted from the surface of chalcopyrite. In this process, clear evidence for cell adhesion was detected: when the cell probe “jumped off” from the surface at one point where the deflection force of the cantilever overcame the adhesion force. This was shown as adhesion peaks on the retraction curves (Figure 2B). Comparing the values of these force peaks, one can conclude that L. ferrooxidans had the best adhesion ability because of the largest adhesion force value (1.03 ± 0.11 nN). Next came A. ferrooxidans (0.85 ± 0.27 nN), followed by A. thiooxidans (0.74 ± 0.04 nN). Results from the one-way ANOVA test and its post hoc Bonferroni test showed that there was significant differences among/between these three adhesion force groups. From the retraction curves, all the peaks are shown at the distance around 3 nm. Meyer et al. [37] pointed out that an attraction at separations less than 20 nm is thought to contain more information about hydrophobic interactions. Hammer et al. [38] specified that a “pure” but still not well-understood “long-range hydrophobic force” dominates the regime from 1.5 nm to 15 nm. In our previous study, we have already shown that the chalcopyrite surface had an extremely strong hydrophobicity [27]. Most likely, the force peaks in this study are partly caused by hydrophobic interactions between the cells and the chalcopyrite. In addition, we also found that chalcopyrite carried a negative charge in 9K medium at pH 2, and the surface of the cells was positively charged in the medium [27]. Thus, electrostatic forces could also contribute to the adhesion. Subsequently, when the cell probe had been retracted away from the surface, the forces became zero again.

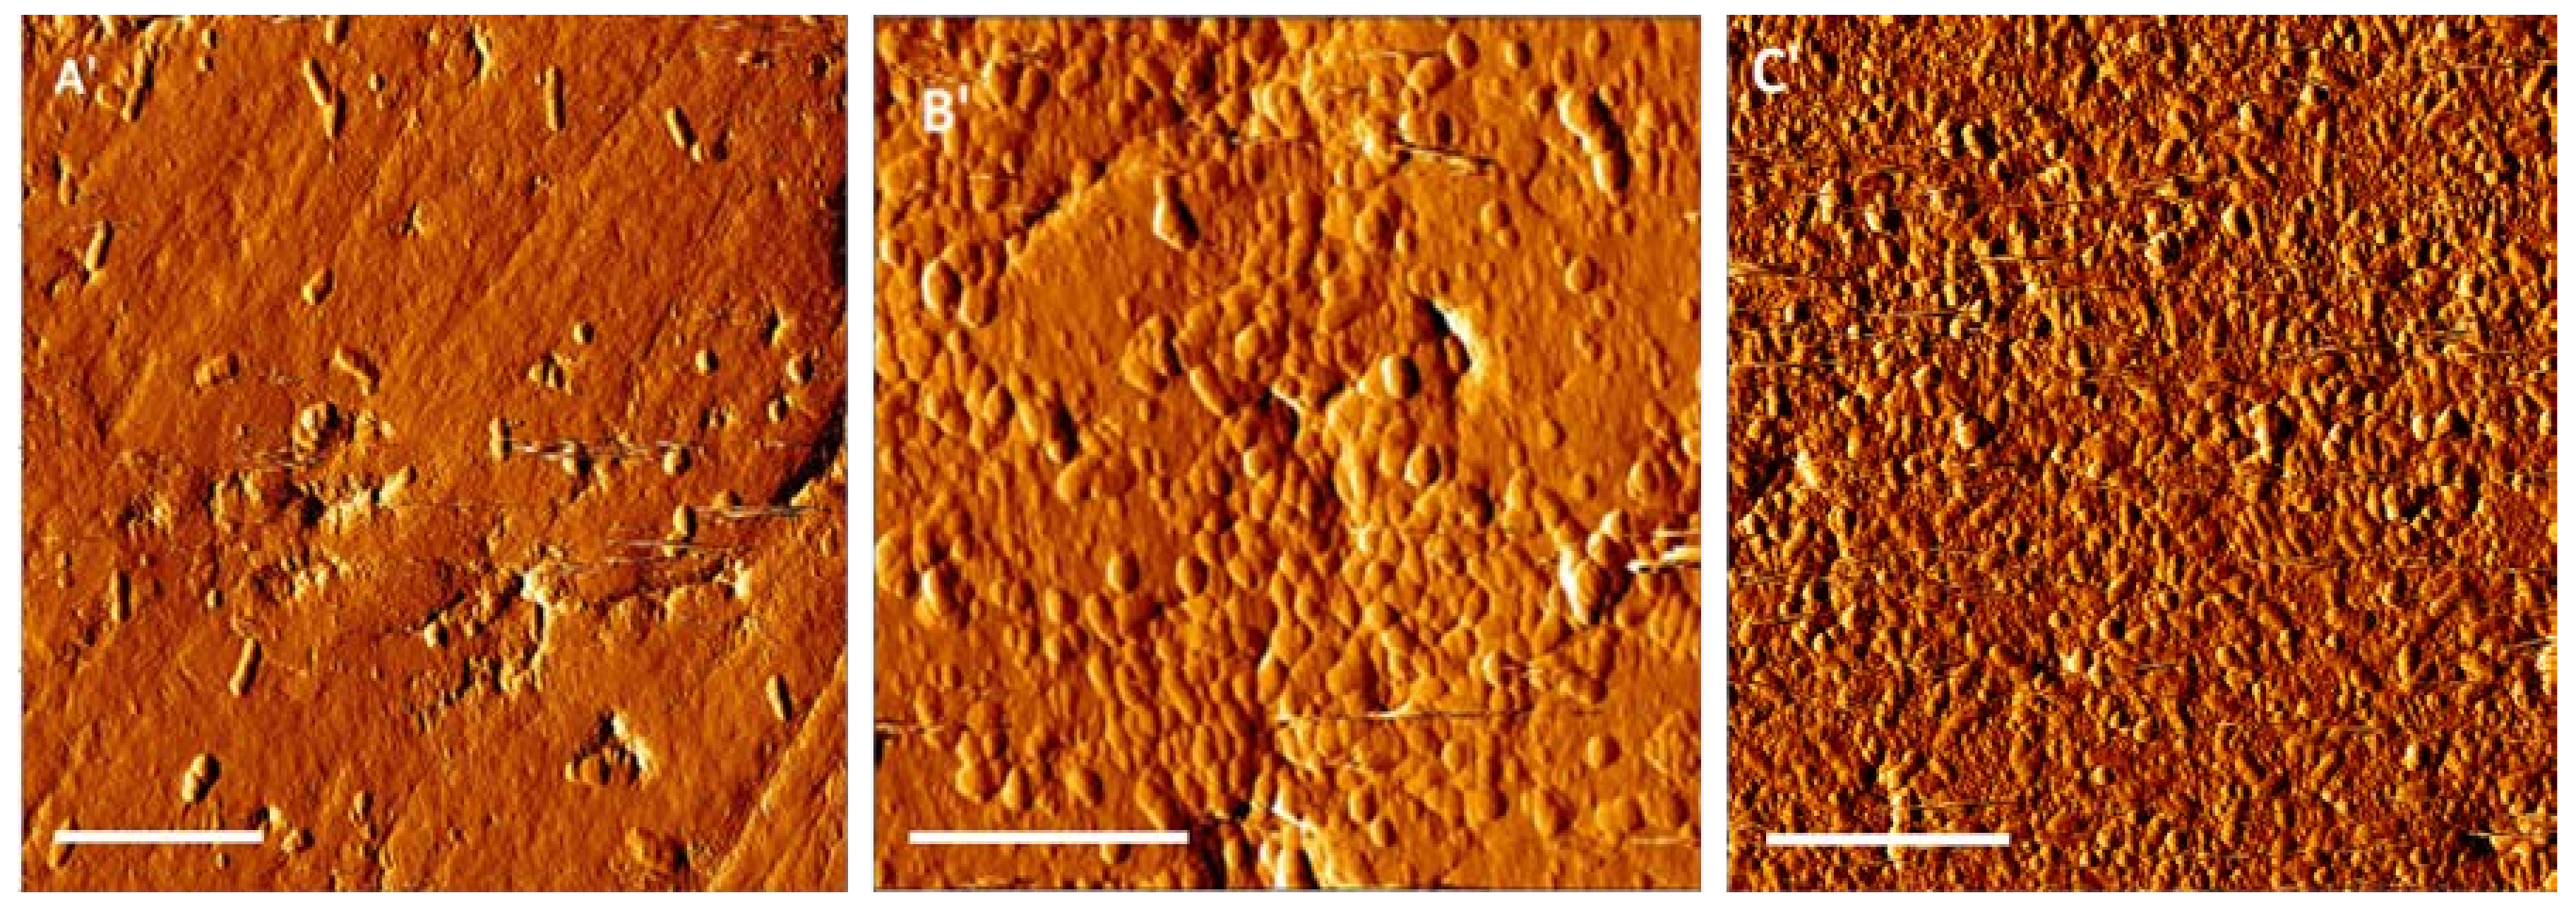
3.2. Attachment of Planktonic Cells to Chalcopyrite Powder

In order to evaluate initial bacterial adhesion to chalcopyrite, assay times of 120 min were chosen. During this time, only negligible growth could occur. From 80 min onwards, adhesion of the cells reached equilibrium with values of ~65%, ~60%, and ~50% for L. ferrooxidans, A. ferrooxidans, and A. thiooxidans, respectively (Figure 3). The results indicate that there is a positive relation between adhesion force and initial adhesion. At this stage, adhesion is reversible and it can be affected by two factors. Motility is one pivotal factor. Number of attached cells is low and no biofilms form on mineral surfaces if microorganisms are immotile [39]. Microorganisms prefer to attach to imperfections such as dislocations and cracks [11,12,40]. In this study, all three tested species possess motility, but the way to the attaching sites is important. There are two possible ways: swim to the mineral surfaces and then slide or twitch on the surfaces to the sites; attach to the mineral surfaces, and detach for the next attachment if the attaching site is not suitable. How to enhance the adhesion is the next question for the attached cells. Thus, the surface property of microorganisms and minerals is another factor. Electrostatic interactions and hydrophobic forces should be mainly responsible for enhancing the attachment during this stage [41]. Since electrostatic interactions and hydrophobic forces govern adhesion force, it can be concluded here that adhesion force enhances the bacterial reversible adhesion.

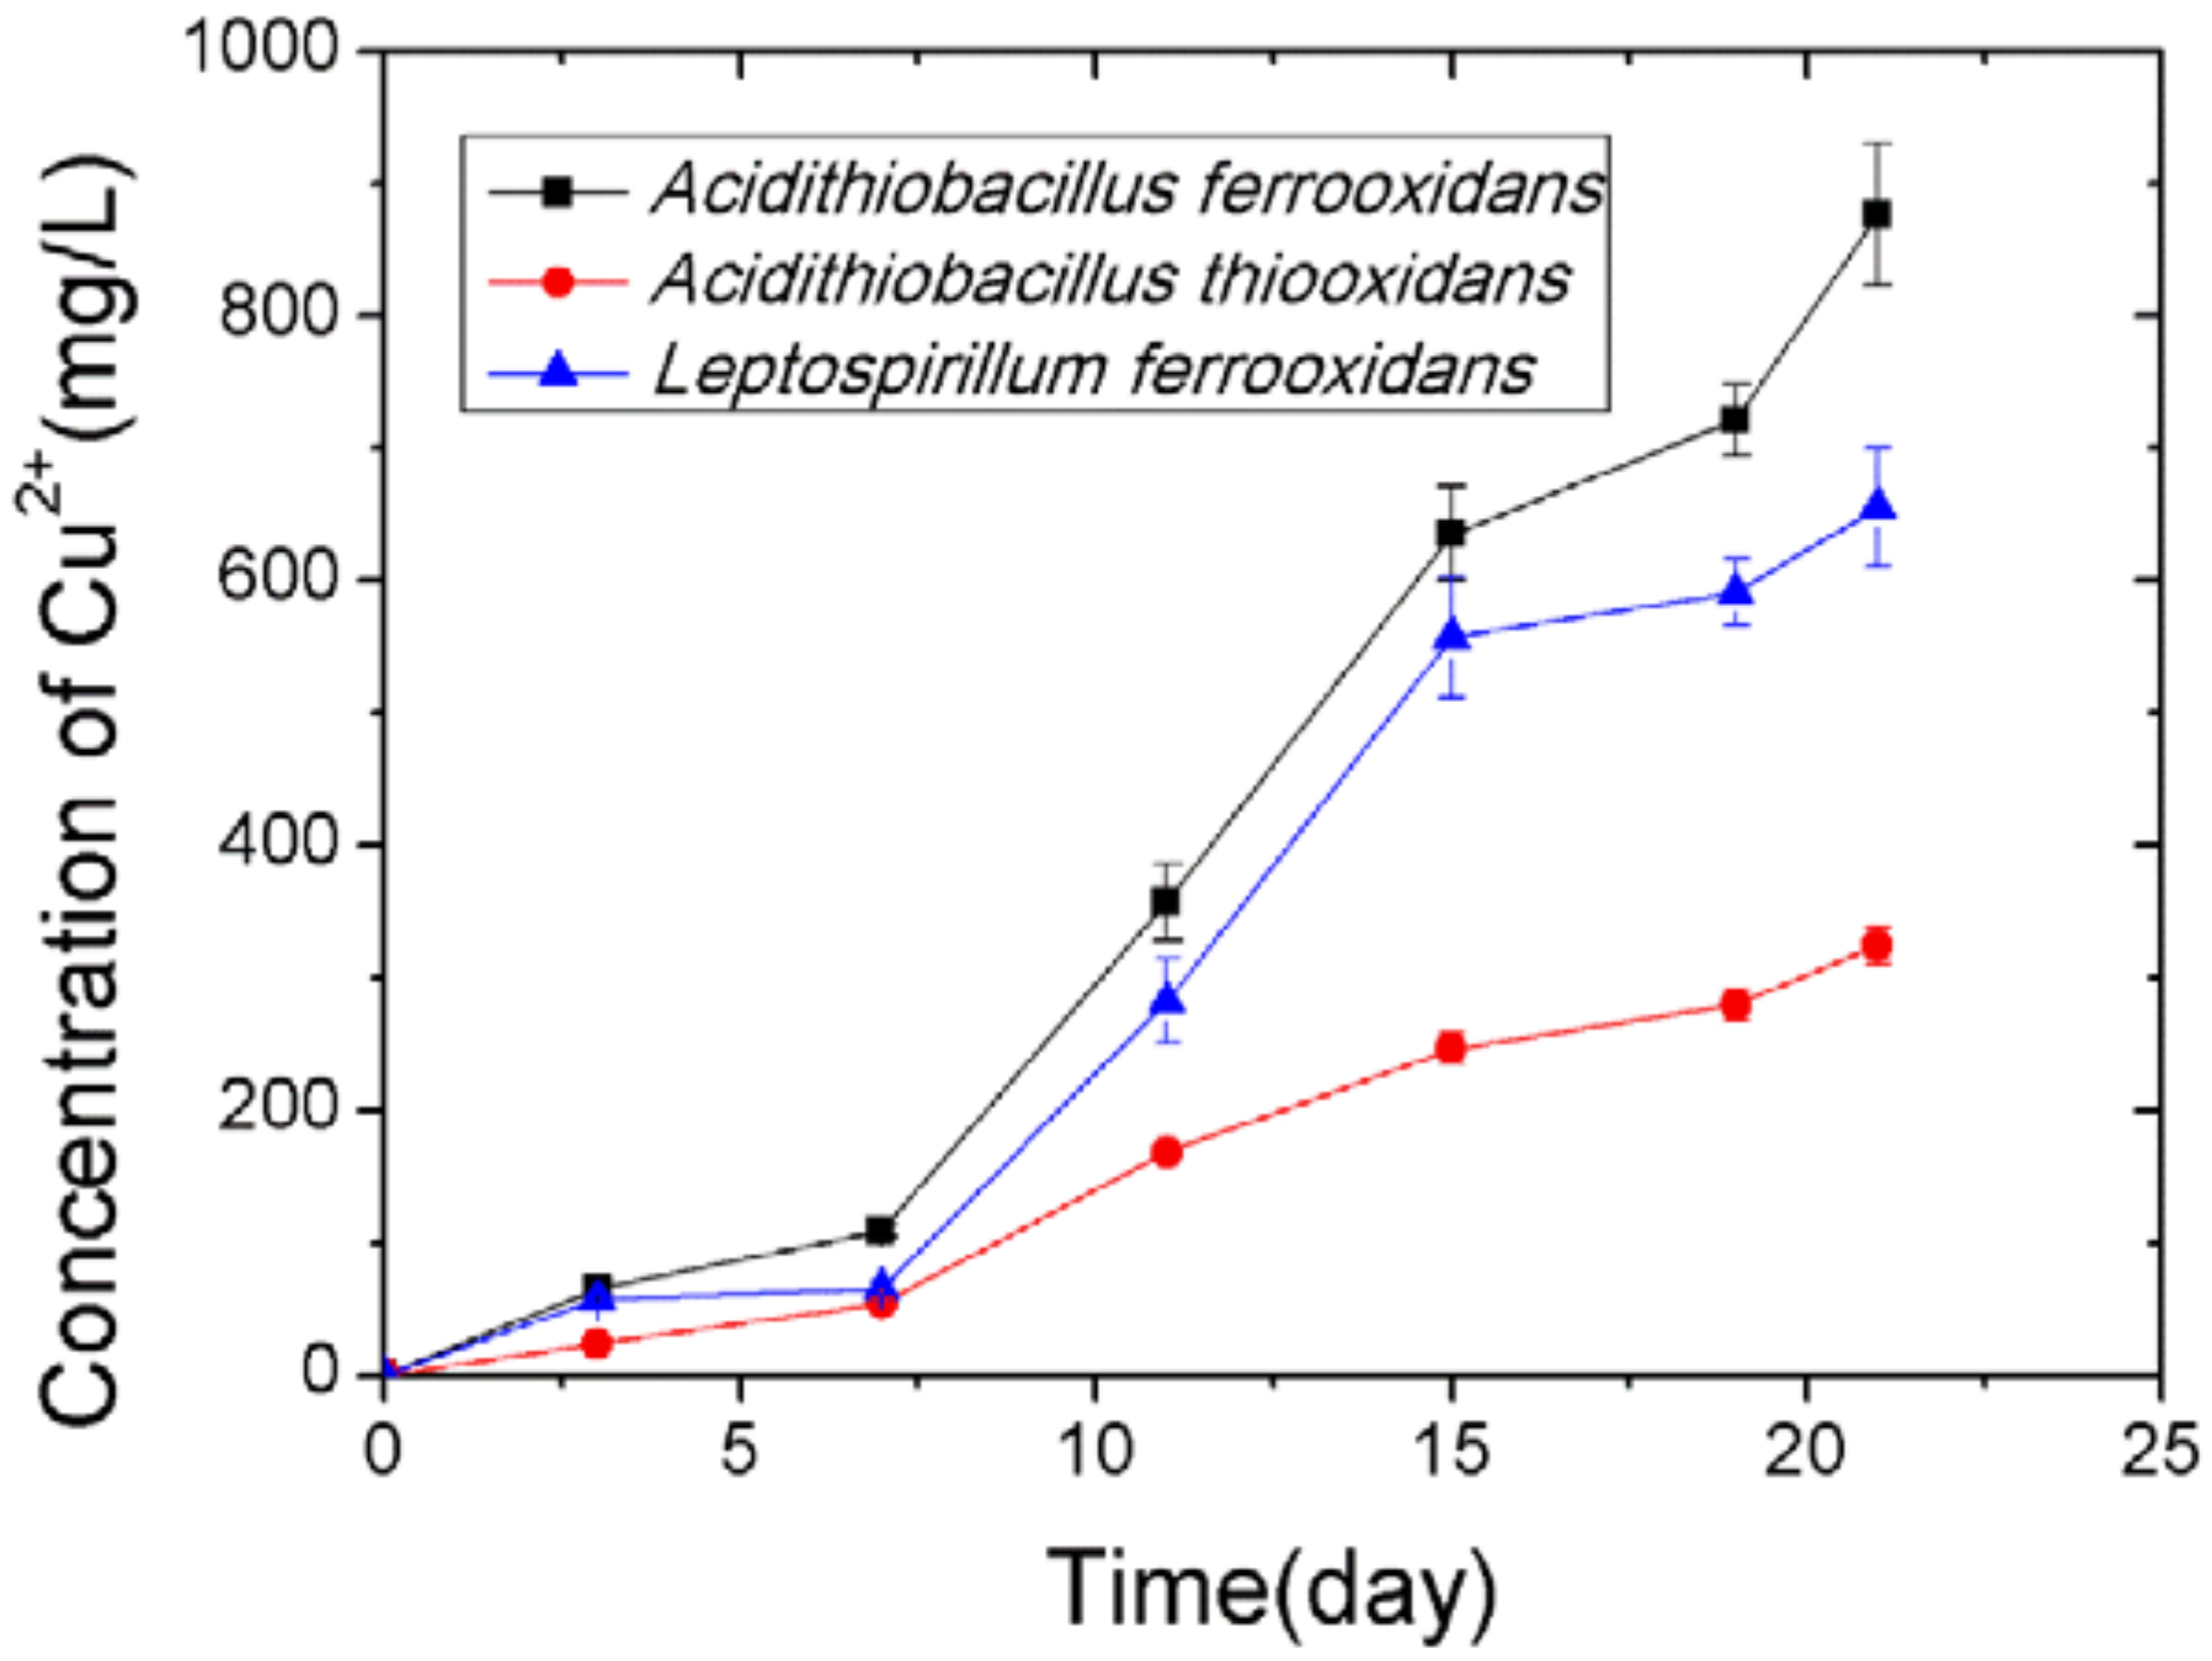
3.3. Bioleaching of Chalcopyrite Powder

Bioleaching of chalcopyrite powder by cells of A. ferrooxidans, A. thiooxidans, or L. ferrooxidans was followed. The changes in copper concentration are plotted in Figure 4. In the first 7 days, there were not so high concentration of copper ion detectable. Afterwards, the concentration of copper ion in all the assays increased. At day 21, in the assays with cells of A. ferrooxidans, 876 mg/L copper ion had been released, 655 mg/L in the assays with cells of L. ferrooxidans and 324 mg/L in the assays with cells of A. thiooxidans. In the sterile control assays, only 86 mg/L copper ion were measurable (data not shown).
After 21 days, based on the SEM images, the surface of the chalcopyrite was massively covered by cells of A. ferrooxidans (Figure 5A). In contrast, cells of A. thiooxidans were detected only in small numbers on the mineral surface (Figure 5B). Cells of L. ferrooxidans exhibited a medium colonization (Figure 5C). For evaluation of the corrosion intensity of the chalcopyrite surface, the attached cells were removed by sonication. The most serious corrosion was visible on the mineral grains, which had been incubated with A. ferrooxidans (Figure 5A’). Only a few corrosion pits were detectable for the chalcopyrite where cells of A. thiooxidans had grown (Figure 5B’). Cells of L. ferrooxidans caused larger and more corrosion pits than cells of A. thiooxidans, but less than cells of A. ferrooxidans (Figure 5C’). The control was free of corrosion traces (Figure 5D’).
Sand et al. [12] proposed that chalcopyrite would be dissolved at low pH due to proton attack via the polysulfide mechanism. After proton attack, iron (II) ions were produced (chemical reaction, Equation (1)). Iron (II) ions would be bio-oxidized to iron (III) ions if iron oxidizing bacteria were present (biological reaction, Equation (2)). Sulfur oxidizing bacteria were responsible for oxidizing sulfur to sulfate (biological reaction, Equation (3)). The final biological product, ferric sulfate, was an oxidizing agent, and contributed to the dissolution of chalcopyrite (chemical reaction, Equation (4)).
CuFeS2 + 4H+ + O2 → Cu2+ + 2S0 + Fe2+ + 2H2O
4Fe2+ + O2 + 4H+ → 4Fe3+ + 2H2O
2S0 +3O2 +2H2O → 2SO42− + 4H+
CuFeS2 + 4Fe3+ → Cu2+ + 5Fe2+ +2S0
During this process, the production of elemental sulfur is a critical step, since it will form passive layers to hinder the bioleaching by the attached bacteria, if the bacteria cannot oxidize sulfur. However, when the bacteria can oxidize the sulfur or there are sulfur oxidizers, the sulfur can be used as an energy source, and protons are produced. These protons will attack chalcopyrite, thereby enhancing leaching. Furthermore, the protons will maintain the pH of the leaching system, ensuring the performance of leaching. Based on the metabolic capabilities of the three species, it can be rationalized that L. ferrooxidans or A. thiooxidans exhibited a lower average oxidation rate of chalcopyrite compared with the versatile A. ferrooxidans (Figure 4).

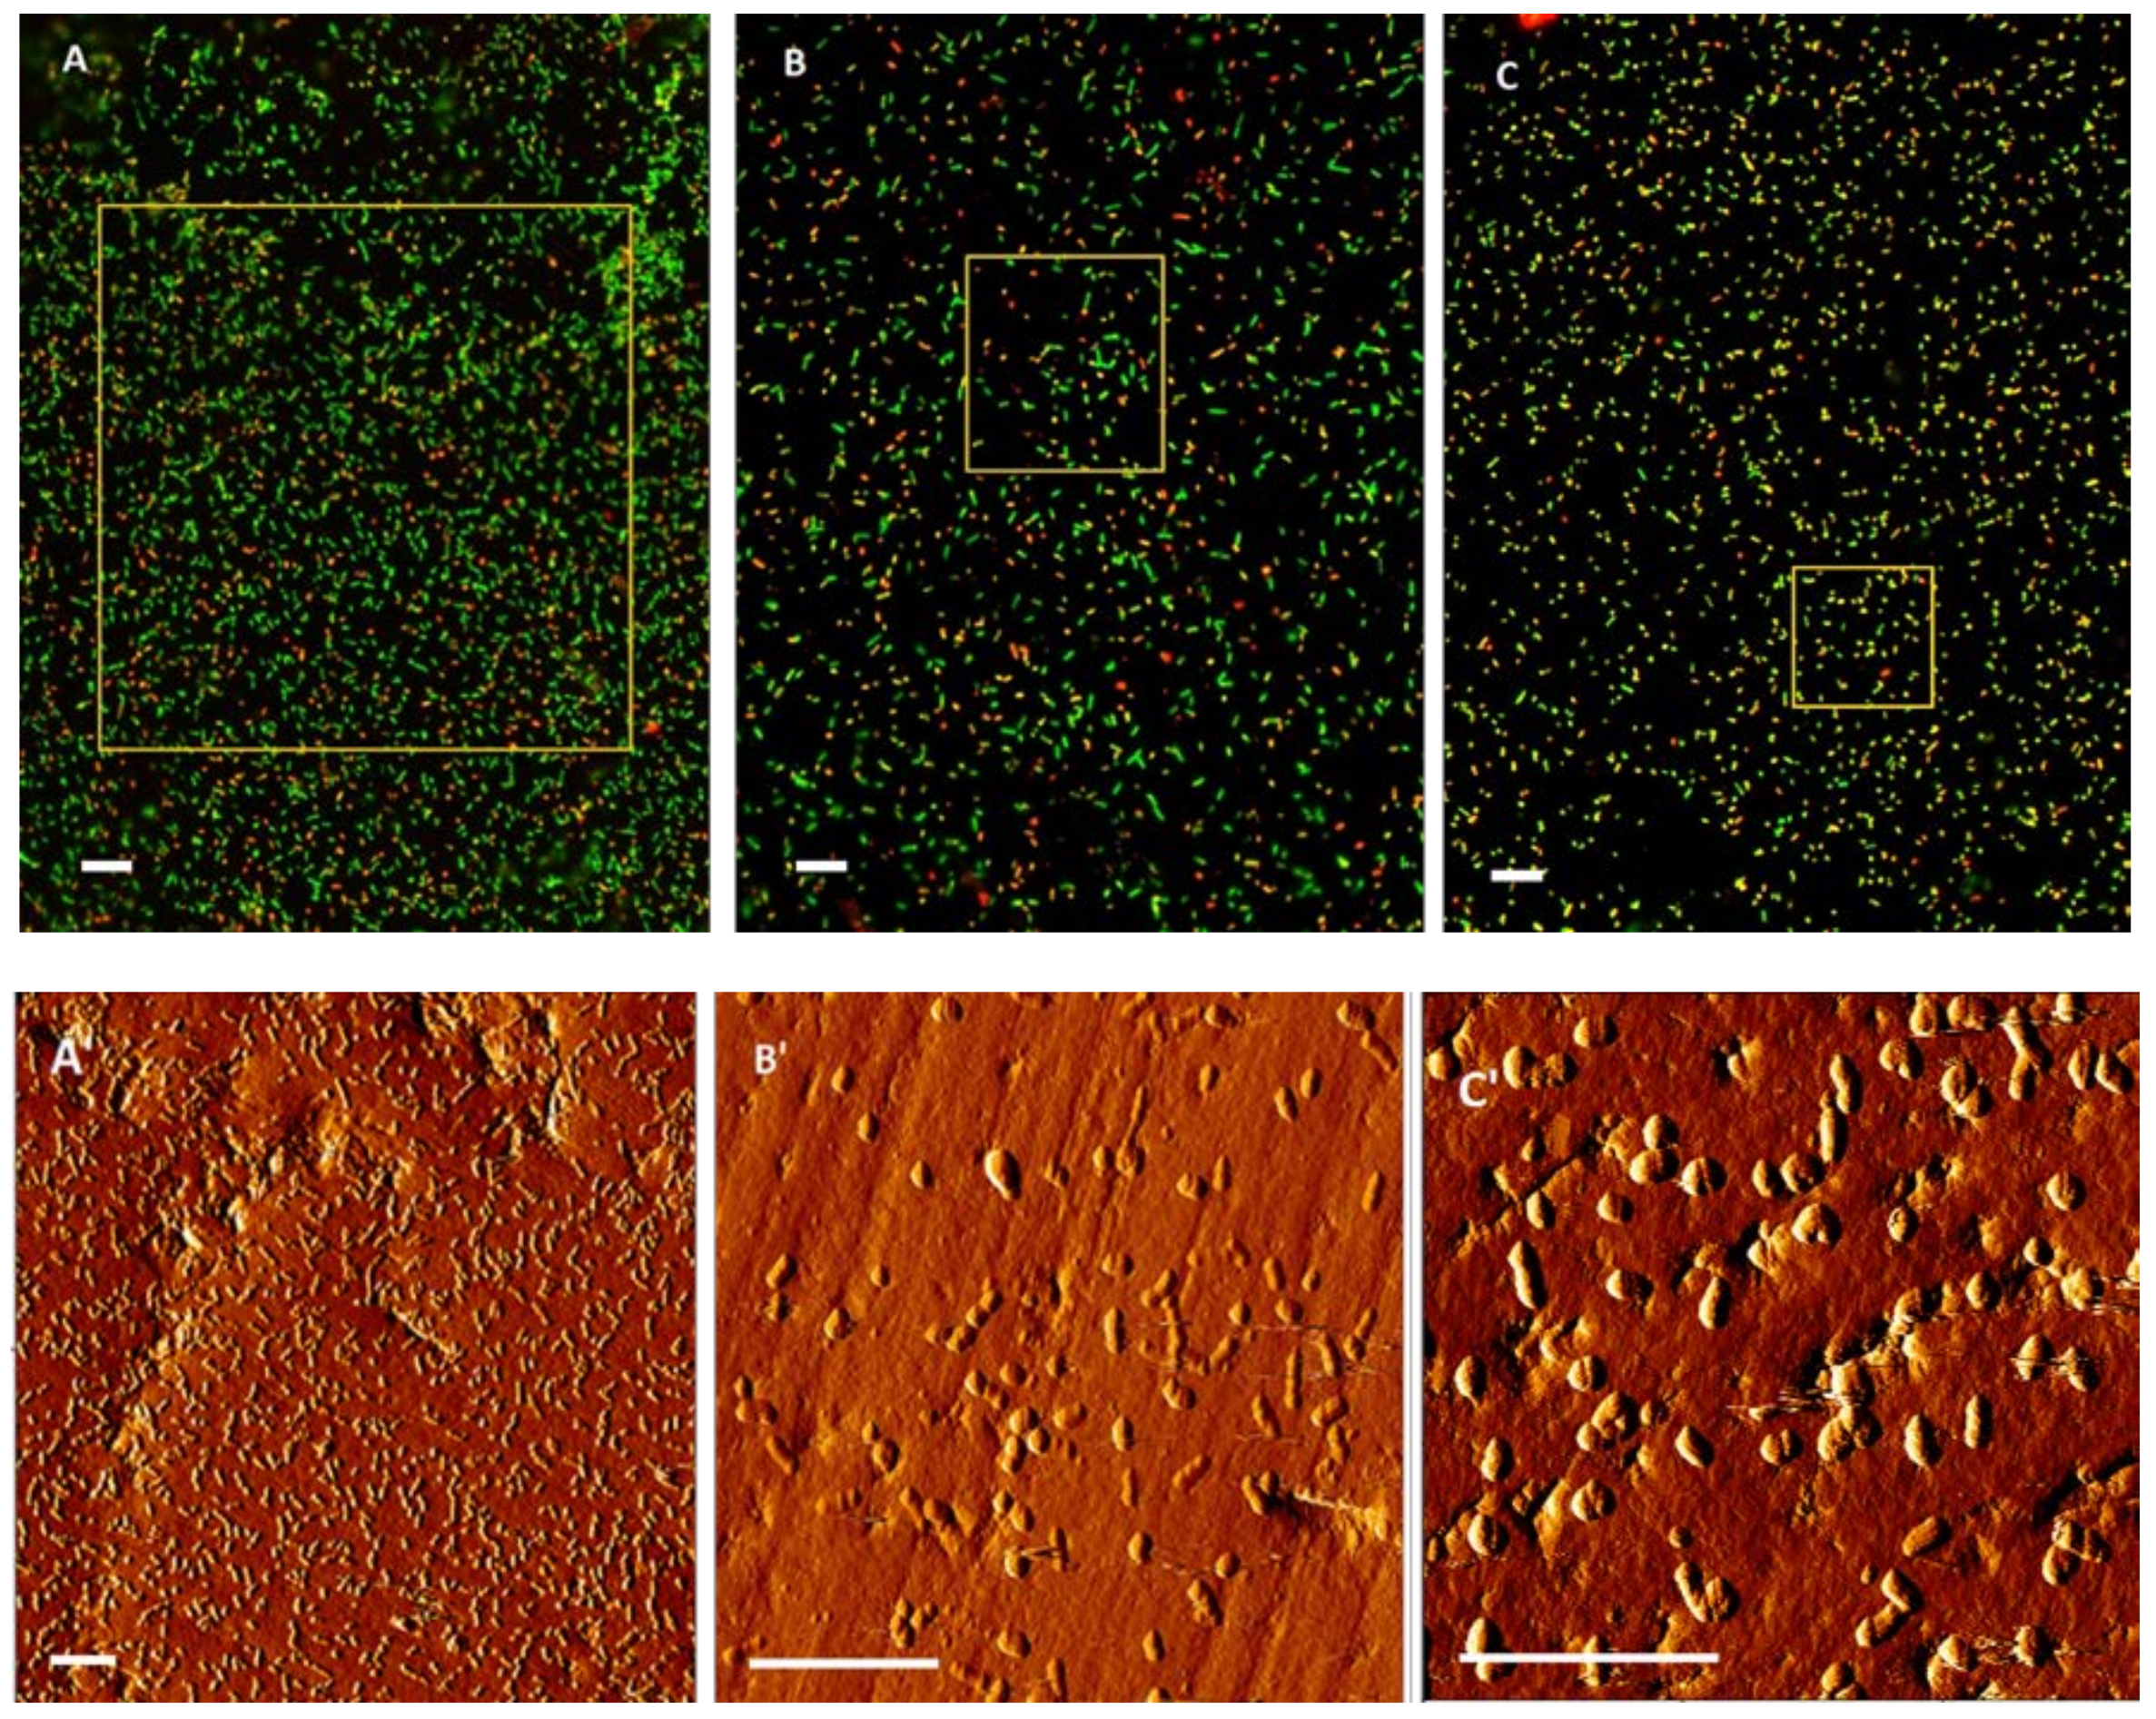
3.4. Visualization of Bacterial Biofilm Development on Chalcopyrite Coupons

Lectins can bind specifically to polysaccharides, which are one of the major components of EPS [42]. They are, therefore, usable as an in situ indicator for EPS [43,44]. In our study, a fluorescently labelled lectin concanavalin A (Con A), showing as a red signal, was used to visualize the distribution of EPS on the chalcopyrite surface. Besides, SYTO 9, showing as a green signal, was used to stain the cells for their location within the biofilms. In this study, all the EFM images show the combination signals of Con A and SYTO 9 (indicated as light yellow, i.e., the combination of red and green). Figure 6, Figure 7 and Figure 8 show the biofilm development on chalcopyrite by A. ferrooxidans, A. thiooxidans, and L. ferrooxidans, respectively. After 1 day incubation, all three bacteria attached to the chalcopyrite as the yellow colored cells can be observed in Figure 6A, Figure 7A, and Figure 8A. Among the three bacteria, A. thiooxidans attached most. This result does not coordinate with the data from the experiments of adhesion force measurement and of attachment. Thus, the planktonic cells of the three species were checked by AFM. The images of the planktonic cells show that A. thiooxidans was surrounded by a larger amount of EPS, compared to the other two bacteria (Figure 9). It is reported that leaching bacteria can produce 5–10 times more EPS when they are grown on solid substrate than on soluble substrate [41]. In this study, A. ferrooxidans and L. ferrooxidans were pre-grown on ferrous ion, but A. thiooxidans was pre-grown on elemental sulfur. Cells of A. thiooxidans owned more EPS at the beginning comparing with the other two species. EPS play an important role in bacterial attachment. Number of attached cells of A. ferrooxidans or A. thiooxidans on pyrite or sulfur is reduced by a factor of 3 if their EPS are depleted [10]. Components of EPS endow the cell surface with certain physicochemical properties, which help the cells to adhere. For example, glucuronic acids in EPS can complex ferric ion and influence surface charge of cells, thereby enabling cell adhesion by electrostatic interactions [41]. After initial adhesion on mineral surfaces, phosphodiester groups of nucleic acids in EPS form monodentate complexes with Fe centers, which provides an energetically stable bond for further EPS or cell adhesion [45]. Thus, our results indicate that after reversible adhesion amounts of EPS positively relate with the number of attached cells.
At day 3, biofilms could be visualized on the chalcopyrite surface for the assays with A. ferrooxidans and L. ferrooxidans, whereas in case of the assays with A. thiooxidans, single cells were still visible (Figure 6B, Figure 7B and Figure 8B). Note the bulges surrounded by the cells shown in the assays with L. ferrooxidans (Figure 8B). According to the reaction equations mentioned before, the bulges were most likely elemental sulfur aggregates as unoxidized products from chalcopyrite dissolution, since they were not found in case of sulfur oxidizers (A. ferrooxidans and A. thiooxidans). After 7 days of incubation, biofilms of A. ferrooxidans and L. ferrooxidans developed, and A. ferrooxidans almost fully covered the chalcopyrite surface. A. thiooxidans still grew as single cells (Figure 6C, Figure 7C and Figure 8C). The results here are in accordance with the observations from SEM. As a matter of fact, after transformation from planktonic state to biofilm state, the cell surfaces experience chemical and mechanical changes [46]. The chemical changes mean that the composition of EPS changes. The mechanical changes include changes of elasticity and adhesiveness. Data show that adhesion force between leaching bacteria and metal sulfides decreased from nN to pN if the bacteria transformed from planktonic state to biofilm state [47]. Clearly, the interactions between biofilms and minerals are different from that between planktonic cells and minerals. They are not only the summation of electrostatic interactions and hydrophobic forces, but more energetically stable bonds enhance the attachment. Consequently, adhesion force does not show effects on biofilm formation.

4. Conclusions

In this study, we compared the attachment behavior of three typical species of acidophiles during bioleaching of chalcopyrite. The results indicate that adhesion force influences the bacterial initial reversible adhesion by enhancing their physical contacts. The EPS intermediate irreversible bacterial attachment. EPS composition of the cells changes after attachment, because the interactions between the attached cells and minerals need to change from physical interactions to chemical bonds to make the attachment robust. Bioleaching efficiency can be indicated by formation of biofilms, since the biofilm formation accompanies EPS secretion and dispersion of single cells from the biofilms, which enhances and accelerates bioleaching. Biofilm formation dependents on metabolic characteristic of the microorganism. Microorganisms possessing versatile metabolisms can develop robust biofilms quickly.

Author Contributions

J.Z. and W.S. conceived and designed the experiments; Q.L., B.Y., H.J. and R.Z. performed the experiments; Q.L. and J.L. analysed the data; J.Z. and W.S. contributed reagents/materials/analysis tools; Q.L. wrote the paper.

Funding

This research was funded by the National Natural Science Foundation of China (No. 51174239), China Postdoctoral Science Foundation funded project (2016M600631), Hunan Provincial Co-Innovation Center for Clean and Efficient Utilization of Strategic Metal Mineral Resources and the National Natural Science Foundation of China (No. 41773089).

Conflicts of Interest

The authors declare no conflict of interest. The funders had no role in the design of the study; in the collection, analyses, or interpretation of data; in the writing of the manuscript, and in the decision to publish the results.

References

  1. Dreisinger, D. Copper leaching from primary sulfides: Options for biological and chemical extraction of copper. Hydrometallurgy 2006, 83, 10–20. [Google Scholar] [CrossRef]
  2. Hackl, R.; Dreisinger, D.; Peters, E.; King, J. Passivation of chalcopyrite during oxidative leaching in sulfate media. Hydrometallurgy 1995, 39, 25–48. [Google Scholar] [CrossRef]
  3. Pradhan, N.; Nathsarma, K.C.; Rao, K.S.; Sukla, L.B.; Mishra, B.K. Heap bioleaching of chalcopyrite: A review. Miner. Eng. 2008, 21, 355–365. [Google Scholar] [CrossRef]
  4. Ding, J.N.; Gao, J.; Wu, X.L.; Zhang, C.G.; Wang, D.Z.; Qiu, G.Z. Jarosite-type precipitates mediated by YN22, Sulfobacillus thermosulfidooxidans, and their influences on strain. Trans. Nonferrous Met. Soc. China 2007, 17, 1038–1044. [Google Scholar] [CrossRef]
  5. Li, H.J.; Yang, H.Y.; Chen, G.B. Catalytic performance of biological method seeds on jarosite process. Trans. Nonferrous Met. Soc. China 2016, 26, 557–564. [Google Scholar] [CrossRef]
  6. Vera, M.; Schippers, A.; Sand, W. Progress in bioleaching: fundamentals and mechanisms of bacterial metal sulfide oxidation-part A. Appl. Microbiol. Biotechnol. 2013, 97, 7529–7541. [Google Scholar] [CrossRef] [PubMed]
  7. Gan, M.; Jie, S.; Li, M.; Zhu, J.; Liu, X. Bioleaching of multiple metals from contaminated sediment by moderate thermophiles. Mar. Pollut. Bull. 2015, 97, 47–55. [Google Scholar] [CrossRef] [PubMed]
  8. Gan, M.; Zhou, S.; Li, M.; Zhu, J.; Liu, X.; Chai, L. Bioleaching of multiple heavy metals from contaminated sediment by mesophile consortium. Environ. Sci. Pollut. Res. 2015, 22, 5807–5816. [Google Scholar] [CrossRef] [PubMed]
  9. Rohwerder, T.; Gehrke, T.; Kinzler, K.; Sand, W. Bioleaching review part a. Appl. Microbiol. Biotechnol. 2003, 63, 239–248. [Google Scholar] [CrossRef] [PubMed]
  10. Harneit, K.; Göksel, A.; Kock, D.; Klock, J.H.; Gehrke, T.; Sand, W. Adhesion to metal sulfide surfaces by cells of Acidithiobacillus ferrooxidans, Acidithiobacillus thiooxidans and Leptospirillum ferrooxidans. Hydrometallurgy 2006, 83, 245–254. [Google Scholar] [CrossRef]
  11. Zhang, R.; Bellenberg, S.; Neu, T.R.; Sand, W.; Vera, M. The biofilm lifestyle of acidophilic metal/sulfur-oxidizing microorganisms. In Biotechnology of Extremophiles: Advances and Challenges; Rampelotto, H.P., Ed.; Springer International Publishing: Cham, Switzerland, 2016; pp. 177–213. [Google Scholar]
  12. Sand, W.; Gehrke, T.; Jozsa, P.G.; Schippers, A. (bio) chemistry of bacterial leaching—Direct vs. Indirect bioleaching. Hydrometallurgy 2001, 59, 159–175. [Google Scholar] [CrossRef]
  13. Wang, Y.; Zeng, W.; Qiu, G.; Chen, X.; Zhou, H. A moderately thermophilic mixed microbial culture for bioleaching of chalcopyrite concentrate at high pulp density. Appl. Environ. Microbiol. 2014, 80, 741–750. [Google Scholar] [CrossRef] [PubMed]
  14. Qin, W.; Yang, C.; Lai, S.; Wang, J.; Liu, K.; Zhang, B. Bioleaching of chalcopyrite by moderately thermophilic microorganisms. Bioresour. Technol. 2013, 129, 200–208. [Google Scholar] [CrossRef] [PubMed]
  15. Xia, L.; Liu, X.; Zeng, J.; Yin, C.; Gao, J.; Liu, J.; Qiu, G. Mechanism of enhanced bioleaching efficiency of Acidithiobacillus ferrooxidans after adaptation with chalcopyrite. Hydrometallurgy 2008, 92, 95–101. [Google Scholar]
  16. Stoodley, P.; Sauer, K.; Davies, D.; Costerton, J.W. Biofilms as complex differentiated communities. Annu. Rev. Microbiol. 2002, 56, 187–209. [Google Scholar] [CrossRef] [PubMed]
  17. Busscher, H.J.; Norde, W.; van der Mei, H.C. Specific molecular recognition and nonspecific contributions to bacterial interaction forces. Appl. Environ. Microbiol. 2008, 74, 2559–2564. [Google Scholar] [CrossRef] [PubMed]
  18. Farahat, M.; Hirajima, T.; Sasaki, K. Adhesion of Ferroplasma acidiphilum onto pyrite calculated from the extended DLVO theory using the van Oss–Good–Chaudhury approach. J. Colloid Interface Sci. 2010, 349, 594–601. [Google Scholar] [CrossRef] [PubMed]
  19. Sharma, P.; Hanumantha Rao, K. Adhesion of Paenibacillus polymyxa on chalcopyrite and pyrite: Surface thermodynamics and extended DLVO theory. Colloids Surf. B Biointerfaces 2003, 29, 21–38. [Google Scholar] [CrossRef]
  20. Farahat, M.; Hirajima, T.; Sasaki, K.; Doi, K. Adhesion of Escherichia coli onto quartz, hematite and corundum: Extended DLVO theory and flotation behavior. Colloids Surf. B Biointerfaces 2009, 74, 140–149. [Google Scholar] [CrossRef] [PubMed]
  21. Dufrêne, Y.F. Understanding forces in biofilms. Nanomedicine 2015, 10, 1219–1221. [Google Scholar] [CrossRef] [PubMed]
  22. Sheng, X.; Ting, Y.P.; Pehkonen, S.O. Force measurements of bacterial adhesion on metals using a cell probe atomic force microscope. J. Colloid Interface Sci. 2007, 310, 661–669. [Google Scholar] [CrossRef] [PubMed]
  23. Boonaert, C.J.; Dufrêne, Y.F.; Derclaye, S.R.; Rouxhet, P.G. Adhesion of Lactococcus lactis to model substrata: Direct study of the interface. Colloids Surf. B Biointerfaces 2001, 22, 171–182. [Google Scholar] [CrossRef]
  24. Ong, Y.L.; Razatos, A.; Georgiou, G.; Sharma, M.M. Adhesion forces between E. coli bacteria and biomaterial surfaces. Langmuir 1999, 15, 2719–2725. [Google Scholar] [CrossRef]
  25. Diao, M.; Nguyen, T.A.; Taran, E.; Mahler, S.; Nguyen, A.V. Effect of energy source, salt concentration and loading force on colloidal interactions between Acidithiobacillus ferrooxidans cells and mineral surfaces. Colloids Surf. B Biointerfaces 2015, 132, 271–280. [Google Scholar] [CrossRef] [PubMed]
  26. Diao, M.; Taran, E.; Mahler, S.; Nguyen, T.A.; Nguyen, A.V. Quantifying adhesion of acidophilic bioleaching bacteria to silica and pyrite by atomic force microscopy with a bacterial probe. Colloids Surf. B Biointerfaces 2014, 115, 229–236. [Google Scholar] [CrossRef] [PubMed]
  27. Zhu, J.; Li, Q.; Jiao, W.; Jiang, H.; Sand, W.; Xia, J.; Liu, X.; Qin, W.; Qiu, G.; Hu, Y. Adhesion forces between cells of Acidithiobacillus ferrooxidans, Acidithiobacillus thiooxidans or Leptospirillum ferrooxidans and chalcopyrite. Colloids Surf. B Biointerfaces 2012, 94, 95–100. [Google Scholar] [CrossRef] [PubMed]
  28. Noël, N.; Florian, B.; Sand, W. AFM & EFM study on attachment of acidophilic leaching organisms. Hydrometallurgy 2010, 104, 370–375. [Google Scholar]
  29. Lara, R.; Valdez-Pérez, D.; Rodríguez, A.; Navarro-Contreras, H.; Cruz, R.; García-Meza, J. Interfacial insights of pyrite colonized by Acidithiobacillus thiooxidans cells under acidic conditions. Hydrometallurgy 2010, 103, 35–44. [Google Scholar] [CrossRef]
  30. Silverman, M.P.; Lundgren, D.G. Studies on the chemoautotrophic iron bacterium Ferrobacillus Ferrooxidans: I. An improved medium and a harvesting procedure for securing high cell yields. J. Bacteriol. 1959, 77, 642–647. [Google Scholar] [PubMed]
  31. Postgate, J. Media for sulphur bacteria. Lab. Pract. 1966, 15, 1239–1244. [Google Scholar] [PubMed]
  32. Razatos, A.; Ong, Y.L.; Sharma, M.M.; Georgiou, G. Molecular determinants of bacterial adhesion monitored by atomic force microscopy. Proc. Natl Acad. Sci. USA 1998, 95, 11059–11064. [Google Scholar] [CrossRef] [PubMed] [Green Version]
  33. Weder, G.; Blondiaux, N.; Giazzon, M.; Matthey, N.; Klein, M.; Pugin, R.; Heinzelmann, H.; Liley, M. Use of force spectroscopy to investigate the adhesion of living adherent cells. Langmuir 2010, 26, 8180–8186. [Google Scholar] [CrossRef] [PubMed]
  34. Zhu, J.; Wang, Q.; Zhou, S.; Li, Q.; Gan, M.; Jiang, H.; Qin, W.; Liu, X.; Hu, Y.; Qiu, G. Insights into the relation between adhesion force and chalcopyrite-bioleaching by Acidithiobacillus ferrooxidans. Colloids Surf. B: Biointerfaces 2015, 126, 351–357. [Google Scholar] [CrossRef] [PubMed]
  35. Yu, R.L.; Ou, Y.; Tan, J.X.; Wu, F.D.; Sun, J.; Miao, L.; Zhong, D.L. Effect of EPS on adhesion of Acidithiobacillus ferrooxidans on chalcopyrite and pyrite mineral surfaces. Trans. Nonferrous Met. Soc. China 2011, 21, 407–412. [Google Scholar] [CrossRef]
  36. Chandraprabha, M.N.; Somasundaran, P.; Natarajan, K.A. Modeling and analysis of nanoscale interaction forces between Acidithiobacillus ferrooxidans and AFM tip. Colloids Surf. B: Biointerfaces 2010, 75, 310–318. [Google Scholar] [CrossRef] [PubMed]
  37. Meyer, E.E.; Rosenberg, K.J.; Israelachvili, J. Recent progress in understanding hydrophobic interactions. Proc. Natl Acad. Sci. 2006, 103, 15739–15746. [Google Scholar] [CrossRef] [PubMed] [Green Version]
  38. Hammer, M.U.; Anderson, T.H.; Chaimovich, A.; Shell, M.S.; Israelachvili, J. The search for the hydrophobic force law. Faraday Discuss. 2010, 146, 299–308. [Google Scholar] [CrossRef] [PubMed] [Green Version]
  39. Li, Q.; Sand, W.; Zhang, R. Enhancement of biofilm formation on pyrite by Sulfobacillus thermosulfidooxidans. Minerals 2016, 6, 71. [Google Scholar] [CrossRef]
  40. Zhang, R.; Bellenberg, S.; Castro, L.; Neu, T.R.; Sand, W.; Vera, M. Colonization and biofilm formation of the extremely acidophilic archaeon Ferroplasma acidiphilum. Hydrometallurgy 2014, 150, 245–252. [Google Scholar] [CrossRef]
  41. Gehrke, T.; Telegdi, J.; Thierry, D.; Sand, W. Importance of extracellular polymeric substances from Thiobacillus ferrooxidans for bioleaching. Appl. Environ. Microbiol. 1998, 64, 2743–2747. [Google Scholar] [PubMed]
  42. Flemming, H.C.; Wingender, J. The biofilm matrix. Nat. Rev. Microbiol. 2010, 8, 623–633. [Google Scholar] [CrossRef] [PubMed]
  43. Strathmann, M.; Wingender, J.; Flemming, H.C. Application of fluorescently labelled lectins for the visualization and biochemical characterization of polysaccharides in biofilms of Pseudomonas aeruginosa. J. Microbiol. Methods 2002, 50, 237–248. [Google Scholar] [CrossRef]
  44. Zhang, R.; Neu, T.; Bellenberg, S.; Kuhlicke, U.; Sand, W.; Vera, M. Use of lectins to in situ visualize glycoconjugates of extracellular polymeric substances in acidophilic archaeal biofilms. Microb. Biotechnol. 2015, 8, 448–461. [Google Scholar] [CrossRef] [PubMed]
  45. Omoike, A.; Chorover, J.; Kwon, K.D.; Kubicki, J.D. Adhesion of bacterial exopolymers to α-feooh: Inner-sphere complexation of phosphodiester groups. Langmuir 2004, 20, 11108–11114. [Google Scholar] [CrossRef] [PubMed]
  46. Li, Q.; Sand, W. Mechanical and chemical studies on eps from Sulfobacillus thermosulfidooxidans: From planktonic to biofilm cells. Colloids Surf. B: Biointerfaces 2017, 153, 34–40. [Google Scholar] [CrossRef] [PubMed]
  47. Li, Q.; Becker, T.; Sand, W. Quantification of cell-substratum interactions by atomic force microscopy. Colloids Surf. B Biointerfaces 2017, 159, 639–643. [Google Scholar] [CrossRef] [PubMed]
Figure 1. Scanning electron microscope image of a silicon nitride tip coated with cells of A. ferrooxidans ATCC23270.
Minerals 08 00406 g001
Figure 2. AFM force–separation curves for cell-coated tips with different bacteria when (A) approaching to and (B) retracting from chalcopyrite in iron-free 9K medium, pH = 2.
Minerals 08 00406 g002
Figure 3. Attachment of cells of A. ferrooxidans (■), A. thiooxidans (●), L. ferrooxidans (▲) to chalcopyrite. Experiments were carried out in 250 mL Erlenmeyer flasks with agitation at 170 rpm for 2 h, 30 °C. Error bars representing standard deviation of three parallel assays are given.
Minerals 08 00406 g003
Figure 4. Dissolved Cu2+ during bioleaching of chalcopyrite by cells of A. ferrooxidans, A. thiooxidans, and L. ferrooxidans. Experiments were done in 250 mL Erlenmeyer flasks with agitation at 170 rpm, 30 °C for 21 days. Error bars representing standard deviation of three parallel assays are given.
Minerals 08 00406 g004
Figure 5. SEM images of chalcopyrite after bioleaching of 21 days. Images A, B, and C show the chalcopyrite grains with biofilms of A. ferrooxidans, A. thiooxidans, and L. ferrooxidans, respectively. Images A’, B’, and C’ show the chalcopyrite grains after removal of biofilms of A. ferrooxidans, A. thiooxidans, and L. ferrooxidans, respectively. Images D and D’ show the chalcopyrite grains before and after leaching without inoculation of bacteria, respectively.
Minerals 08 00406 g005
Figure 6. The combination of EFM and AFM images of chalcopyrite surface colonized by A. ferrooxidans at different bioleaching times: 1 d (A and A’), 3 d (B and B’), and 7 d (C and C’). A’, B’, and C’ are the AFM images of the areas framed in A, B, and C, respectively. Scale bar is 10 μm.
Minerals 08 00406 g006aMinerals 08 00406 g006b
Figure 7. The combination of EFM and AFM images of chalcopyrite surface colonized by A. thiooxidans at different bioleaching times: 1 d (A and A’), 3 d (B and B’), and 7 d (C and C’). A’, B’, and C’ are the AFM images of the areas framed in A, B, and C, respectively. Scale bar is 10 μm.
Minerals 08 00406 g007
Figure 8. The combination of EFM and AFM images of chalcopyrite surface colonized by L. ferrooxidans at different bioleaching times: 1 d (A and A’), 3 d (B and B’), and 7 d (C and C’). A’, B’ and C’ are the AFM images of the areas framed in A, B, and C, respectively. An arrow in image B’ indicates bulges. Scale bar is 10 μm.
Minerals 08 00406 g008
Figure 9. AFM images of planktonic cells of A. ferrooxidans (A), A. thiooxidans (B), and L. ferrooxidans (C). The arrows in B indicate EPS.
Minerals 08 00406 g009

