Article

Using Reservoir Geology and Petrographic Observations to Improve CO2 Mineralization Estimates: Examples from the Johansen Formation, North Sea, Norway

Department of Geosciences, University of Oslo, 0371 Oslo, Norway
*
Author to whom correspondence should be addressed.
Submission received: 9 September 2019 / Revised: 22 October 2019 / Accepted: 24 October 2019 / Published: 31 October 2019
(This article belongs to the Special Issue Geological and Mineralogical Sequestration of CO2)

Abstract

:
Reservoir characterization specific to CO2 storage is challenging due to the dynamic interplay of physical and chemical trapping mechanisms. The mineralization potential for CO2 in a given siliciclastic sandstone aquifer is controlled by the mineralogy, the total reactive surface areas, and the prevailing reservoir conditions. Grain size, morphologies and mineral assemblages vary according to sedimentary facies and diagenetic imprint. The proposed workflow highlights how the input values for reactive mineral surface areas used in geochemical modelling may be parameterized as part of geological reservoir characterization. The key issue is to separate minerals both with respect to phase chemistry and morphology (i.e., grain size, shape, and occurrence), and focus on main reactants for sensitivity studies and total storage potentials. The Johansen Formation is the main reservoir unit in the new full-value chain CO2 capture and storage (CCS) prospect in Norway, which was licenced for the storage of CO2 as of 2019. The simulations show how reaction potentials vary in different sedimentary facies and for different mineral occurrences. Mineralization potentials are higher in fine-grained facies, where plagioclase and chlorite are the main cation donors for carbonatization. Reactivity decreases with higher relative fractions of ooidal clay and lithic fragments.

1. Introduction

Saline aquifers hold the largest potential for geological CO2 storage considering total volume, economic and environmental factors [1]. CO2 storage is considered one important measure for the imminent reduction of greenhouse gas emissions and climate change mitigation [2]. Most suitable reservoir candidates, pilot projects, and commercial operations utilize siliciclastic deeply buried sandstones [3,4]. In evaluating the suitability of saline aquifers for CO2 storage, geological characterization is of crucial importance in estimating the reservoir property distribution and reactivity under prevailing reservoir conditions. Sedimentary facies and burial diagenesis control the petrophysical properties and mineralogical composition of the reservoir host rock, and to some extent the chemistry of pore water. These factors must be specified when evaluating the relative effect of various trapping mechanisms for CO2 (i.e., structural, residual, solubility, ionic, and mineral trapping [5]). The physical and chemical immobilization of CO2 are important controls in risk assessments.
Predictions of the CO2 trapping potential of a storage reservoir over hundreds to thousands of years requires a sound understanding of the geochemical reactions that will come about when CO2 is injected and the thermodynamic system is perturbed [6]. Such predictions ideally require detailed knowledge about the mineralogy, formation water chemistry, mineral surface reactivities, and reaction rates. These data are then used as input in the geochemical batch or reactive transport numerical simulations (e.g., [7,8,9,10,11,12]). This is, however, not trivial for several reasons. First, there is no simple way to accurately estimate reactive surface areas of the various reactive mineral phases without careful sediment analyses and theoretical models to relate reactive and total surface areas [13,14,15,16]. This may lead to corresponding orders-of-magnitude uncertainties in the rates of CO2 mineral trapping [17]. Second, the most commonly used rate models, i.e., based on transition state theory (TST), have been suggested to largely overestimate the growth rates of secondary carbonates at low temperatures and in the shorter time scales (<100–1000 years) [10,17,18]. Third, data on the mineralogy may in many cases be available only as crude XRD data, without details on the individual mineral morphologies, grain size, sediment maturity, etc.
The relative importance of the various trapping mechanisms for injected CO2 in aquifers has been discussed ever since Gunther and co-workers published their geochemical simulations on solubility, ionic, and mineral trapping in the early nineties [19,20]. This relates especially to how fast these reactions are, and if they will impose porosity/permeability changes. This has implications if true complex multiphase reactive flow simulations are needed, or if flow and reactions can be partly separated. Most commonly, reservoir simulations of CO2 storage only include the dissolved CO2 in contact with separate phase CO2, and disregard the mineral-formation water reactions due to slow reaction rates. Furthermore, the heterogeneity of reservoirs with respect to mineralogy and grain size has seldom been taken into account (e.g., [7,16,21,22,23]). However, some mineral phases and occurrences do seem to react and contribute to mineralization in shorter time scales (100’s of years) (e.g., [10,24]) and are thus valid for consideration in sensitivity studies of storage reservoir performance.
We show how to more accurately estimate input parameter values for reactive mineral surface areas, as used in the geochemical modelling of long-term mineralization potential for CO2. Reservoir models can be improved by upscaling from pore- and grain-scale to sedimentary facies distributions with the associated reactive mineral characteristics [25]. A general workflow is outlined, which can be applied to improve facies and mineral specific estimates of reactive surface areas and mineralization potential for CO2 in sandstone aquifers.

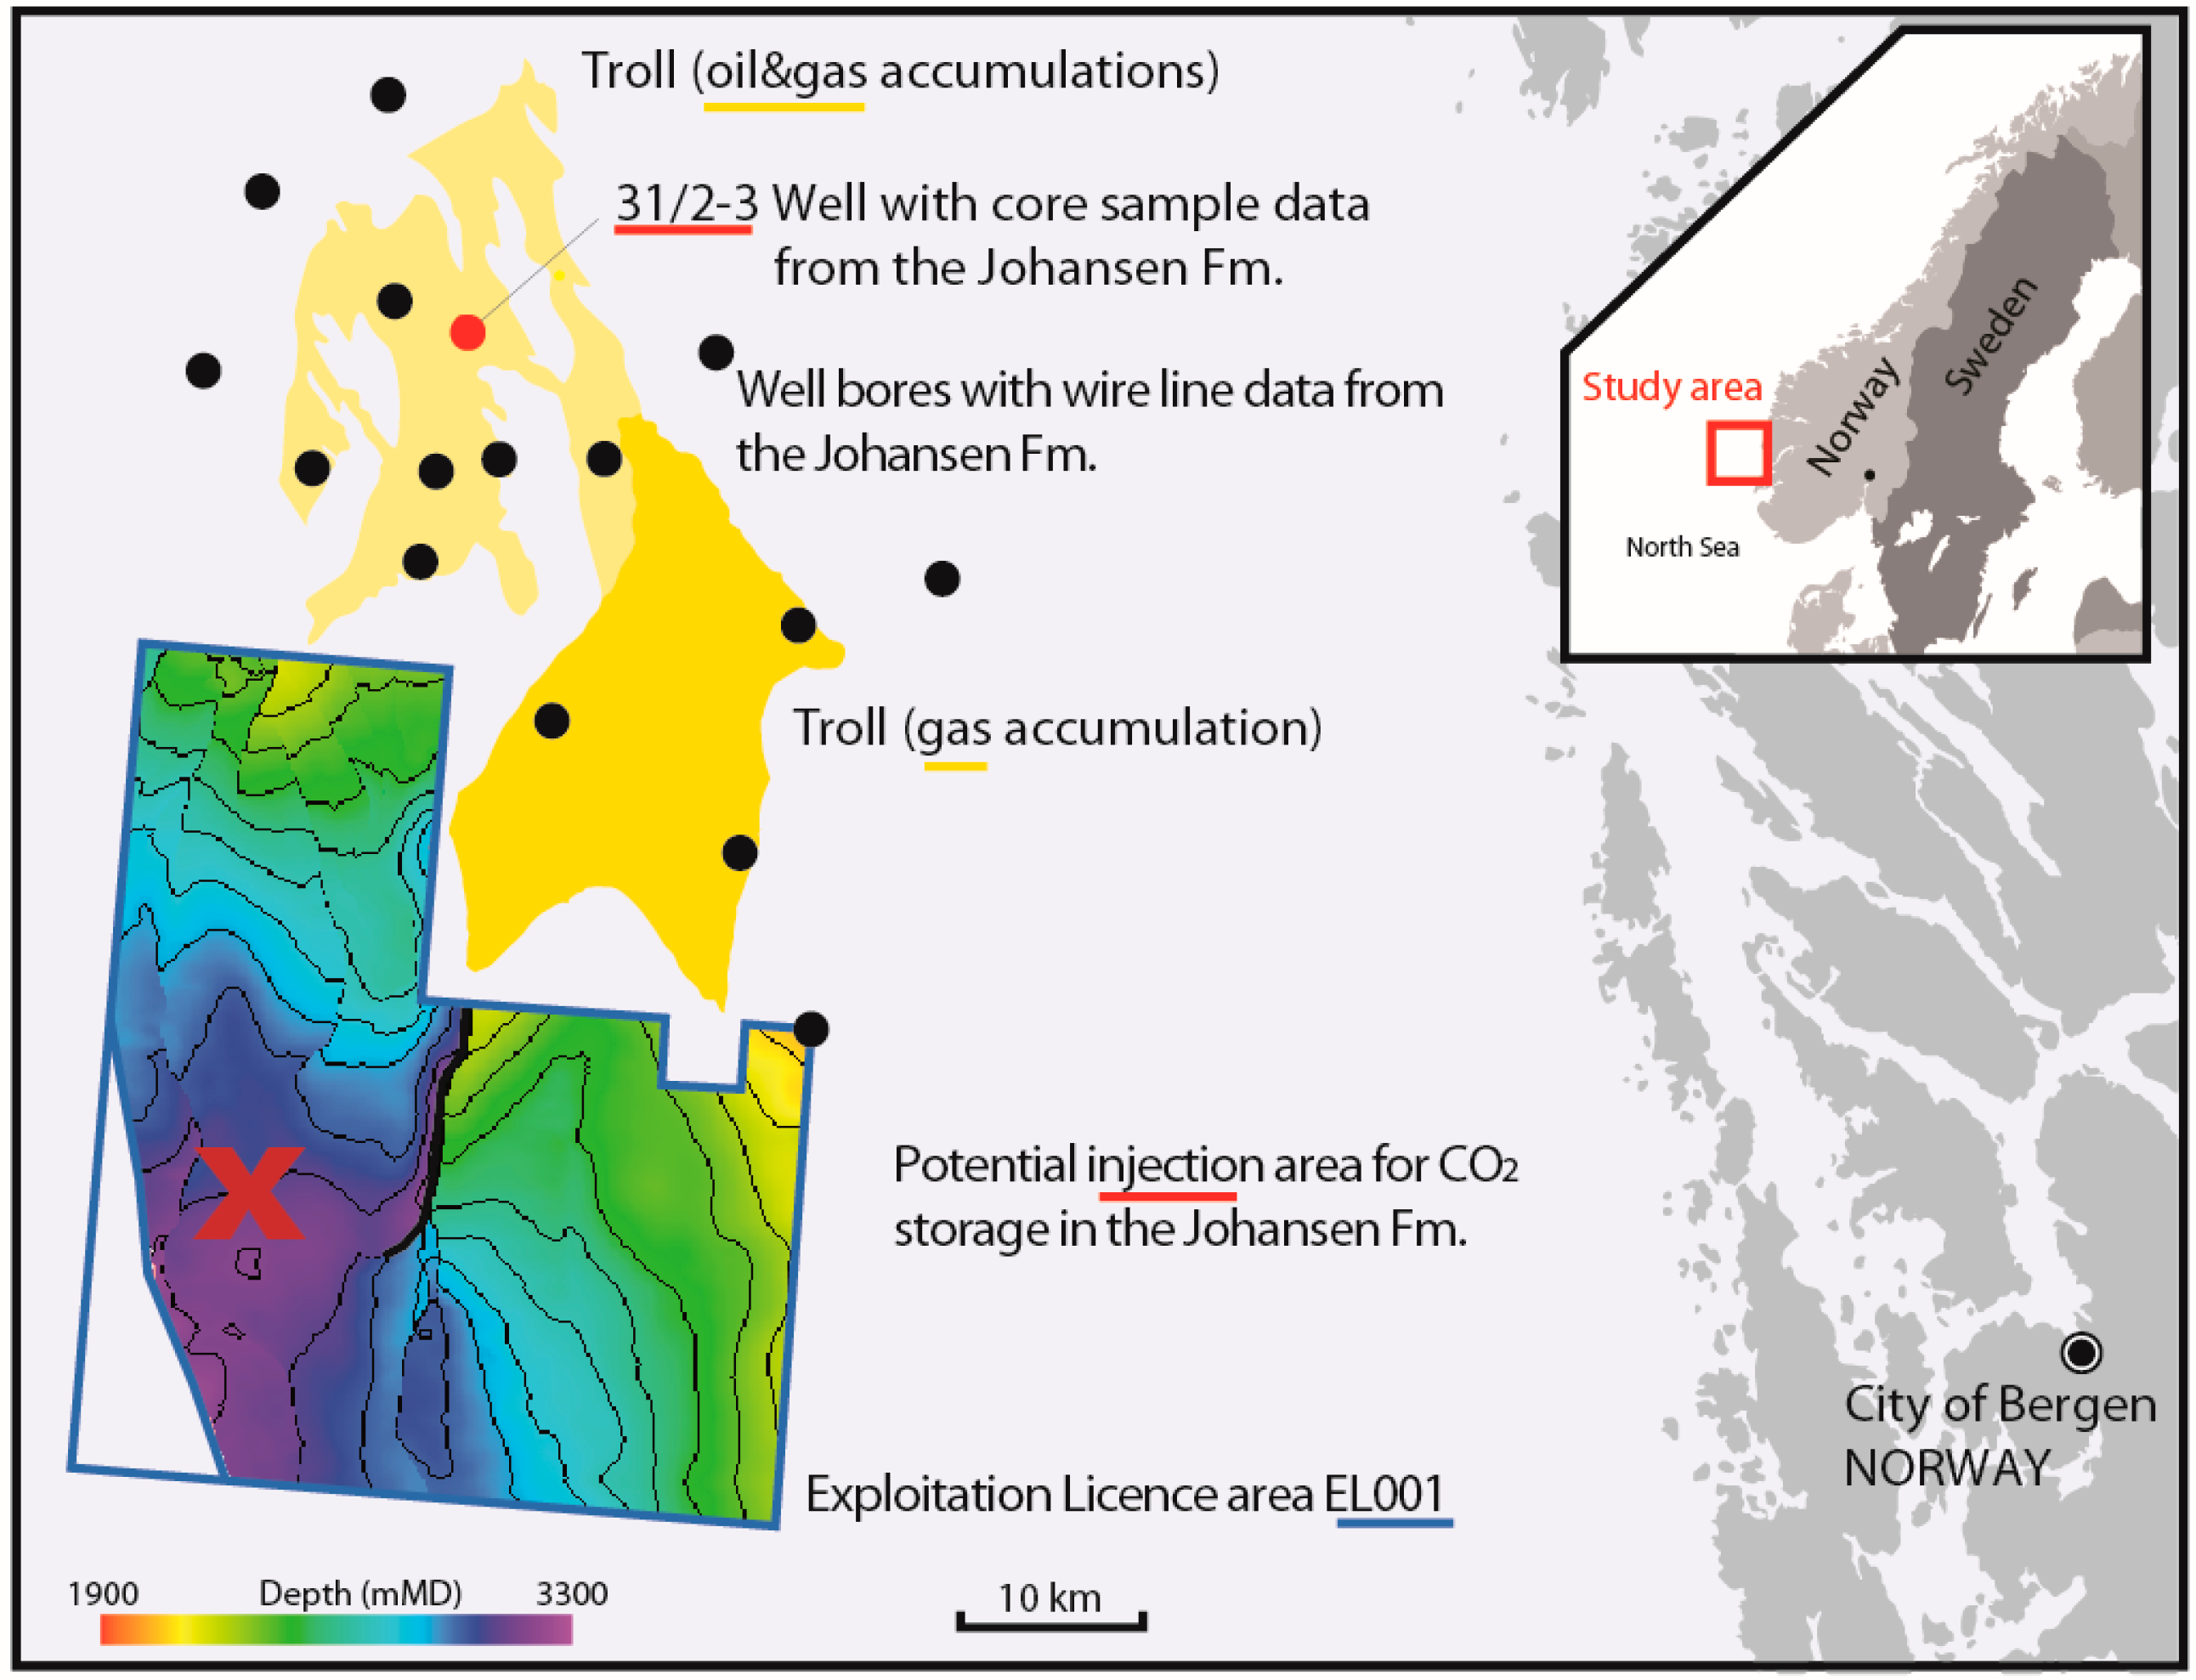
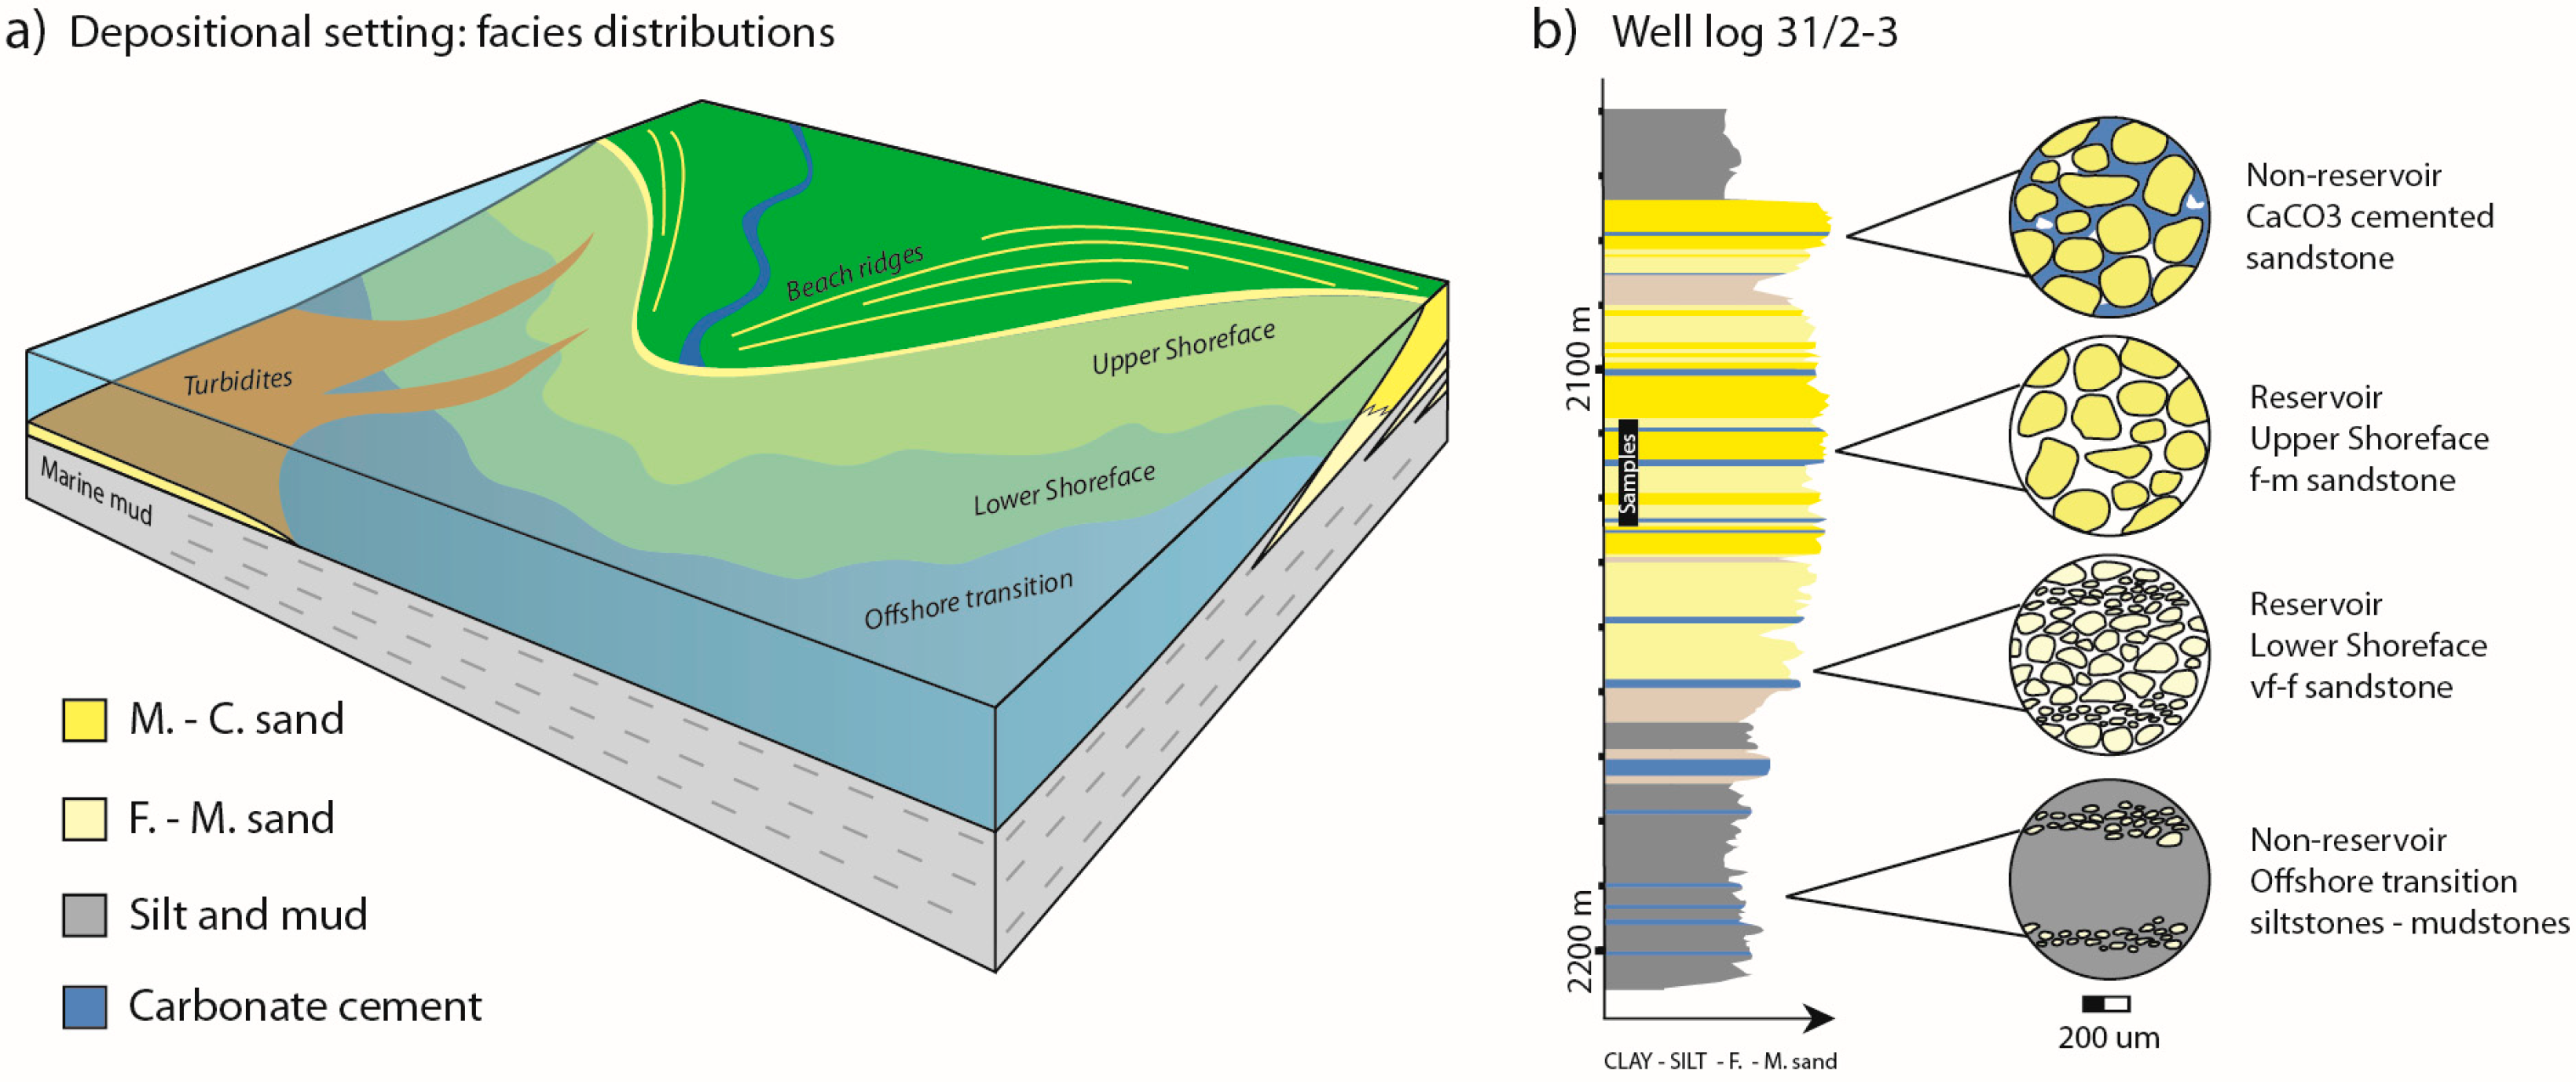
Case Study: The Johansen Formation, North Sea (NORWAY)

Simulation examples with input from the Johansen Formation are provided. The Johansen Formation is part of the Northern Lights full scale storage prospect offshore Norway (Figure 1), which is highly relevant at this time due to imminent drilling and plans for CO2 injection [26]. The first formal license for injecting and storing CO2 as part of full-value chain carbon capture and storage (CCS) was approved by Norwegian authorities as of 2019 (Exploitation Licence EL001, by the Norwegian Petroleum Directorate) [26].
The Johansen Formation (Dunlin Group) is a sandstone of early Jurassic age [27]. This prospective reservoir is located offshore of the city of Bergen on the western Norwegian coast (Figure 1). It displays thicknesses in the order of 100–180 m and is located at burial depths of 2–3 km. The saline aquifer is in parts underlying the operating Troll Gas Field in the North, and as a premise for storing CO2, there is to be no risk of interference with on-going production [4]. Thus, the potential injection area considered in evaluations of storage potential for CO2 is located approximately 20 km south of Troll, at top formation depths in the order of 3 km. The Cook Formation is likely to be in contact with the Johansen Formation and provide as a secondary reservoir unit. The main sealing unit is the Drake Formation mudstone [4,28,29].
The Johansen Formation is interpreted as a progradational to retrogradational sequence of shallow marine sandy deposits sourced from the east [28,29]. The depositional environment in the licenced injection area (Figure 1) has been interpreted to comprise lower to upper shoreface deposits based on seismic data and extrapolation (across distance and depth) of well data from the Troll area [28]. However, an accurate facies description of sandstone in the injection area is not feasible until an appraisal and/or injection well is drilled and sample material becomes available. The shallow marine facies and mineral assemblages of the Johansen Formation appear analogous to several other CO2 reservoir candidates on the Norwegian Shelf, e.g., the Sognefjord, Fensfjord, Krossfjord, Cook, and Gassum formations [29,30,31,32,33,34,35].

2. Estimating CO2 Mineralization Potential (I): Model Parameterization

In CO2 storage, the chemical characteristics of the sediment are of particular importance with respect to estimating mineralization potential. Thorough, descriptive petrographic studies using optical- and scanning electron-microscopy (SEM) methods in addition to quantitative bulk mineralogy analysis such as X-ray diffraction data (XRD) are necessary to characterize the reservoir rock with respect to reactivity.

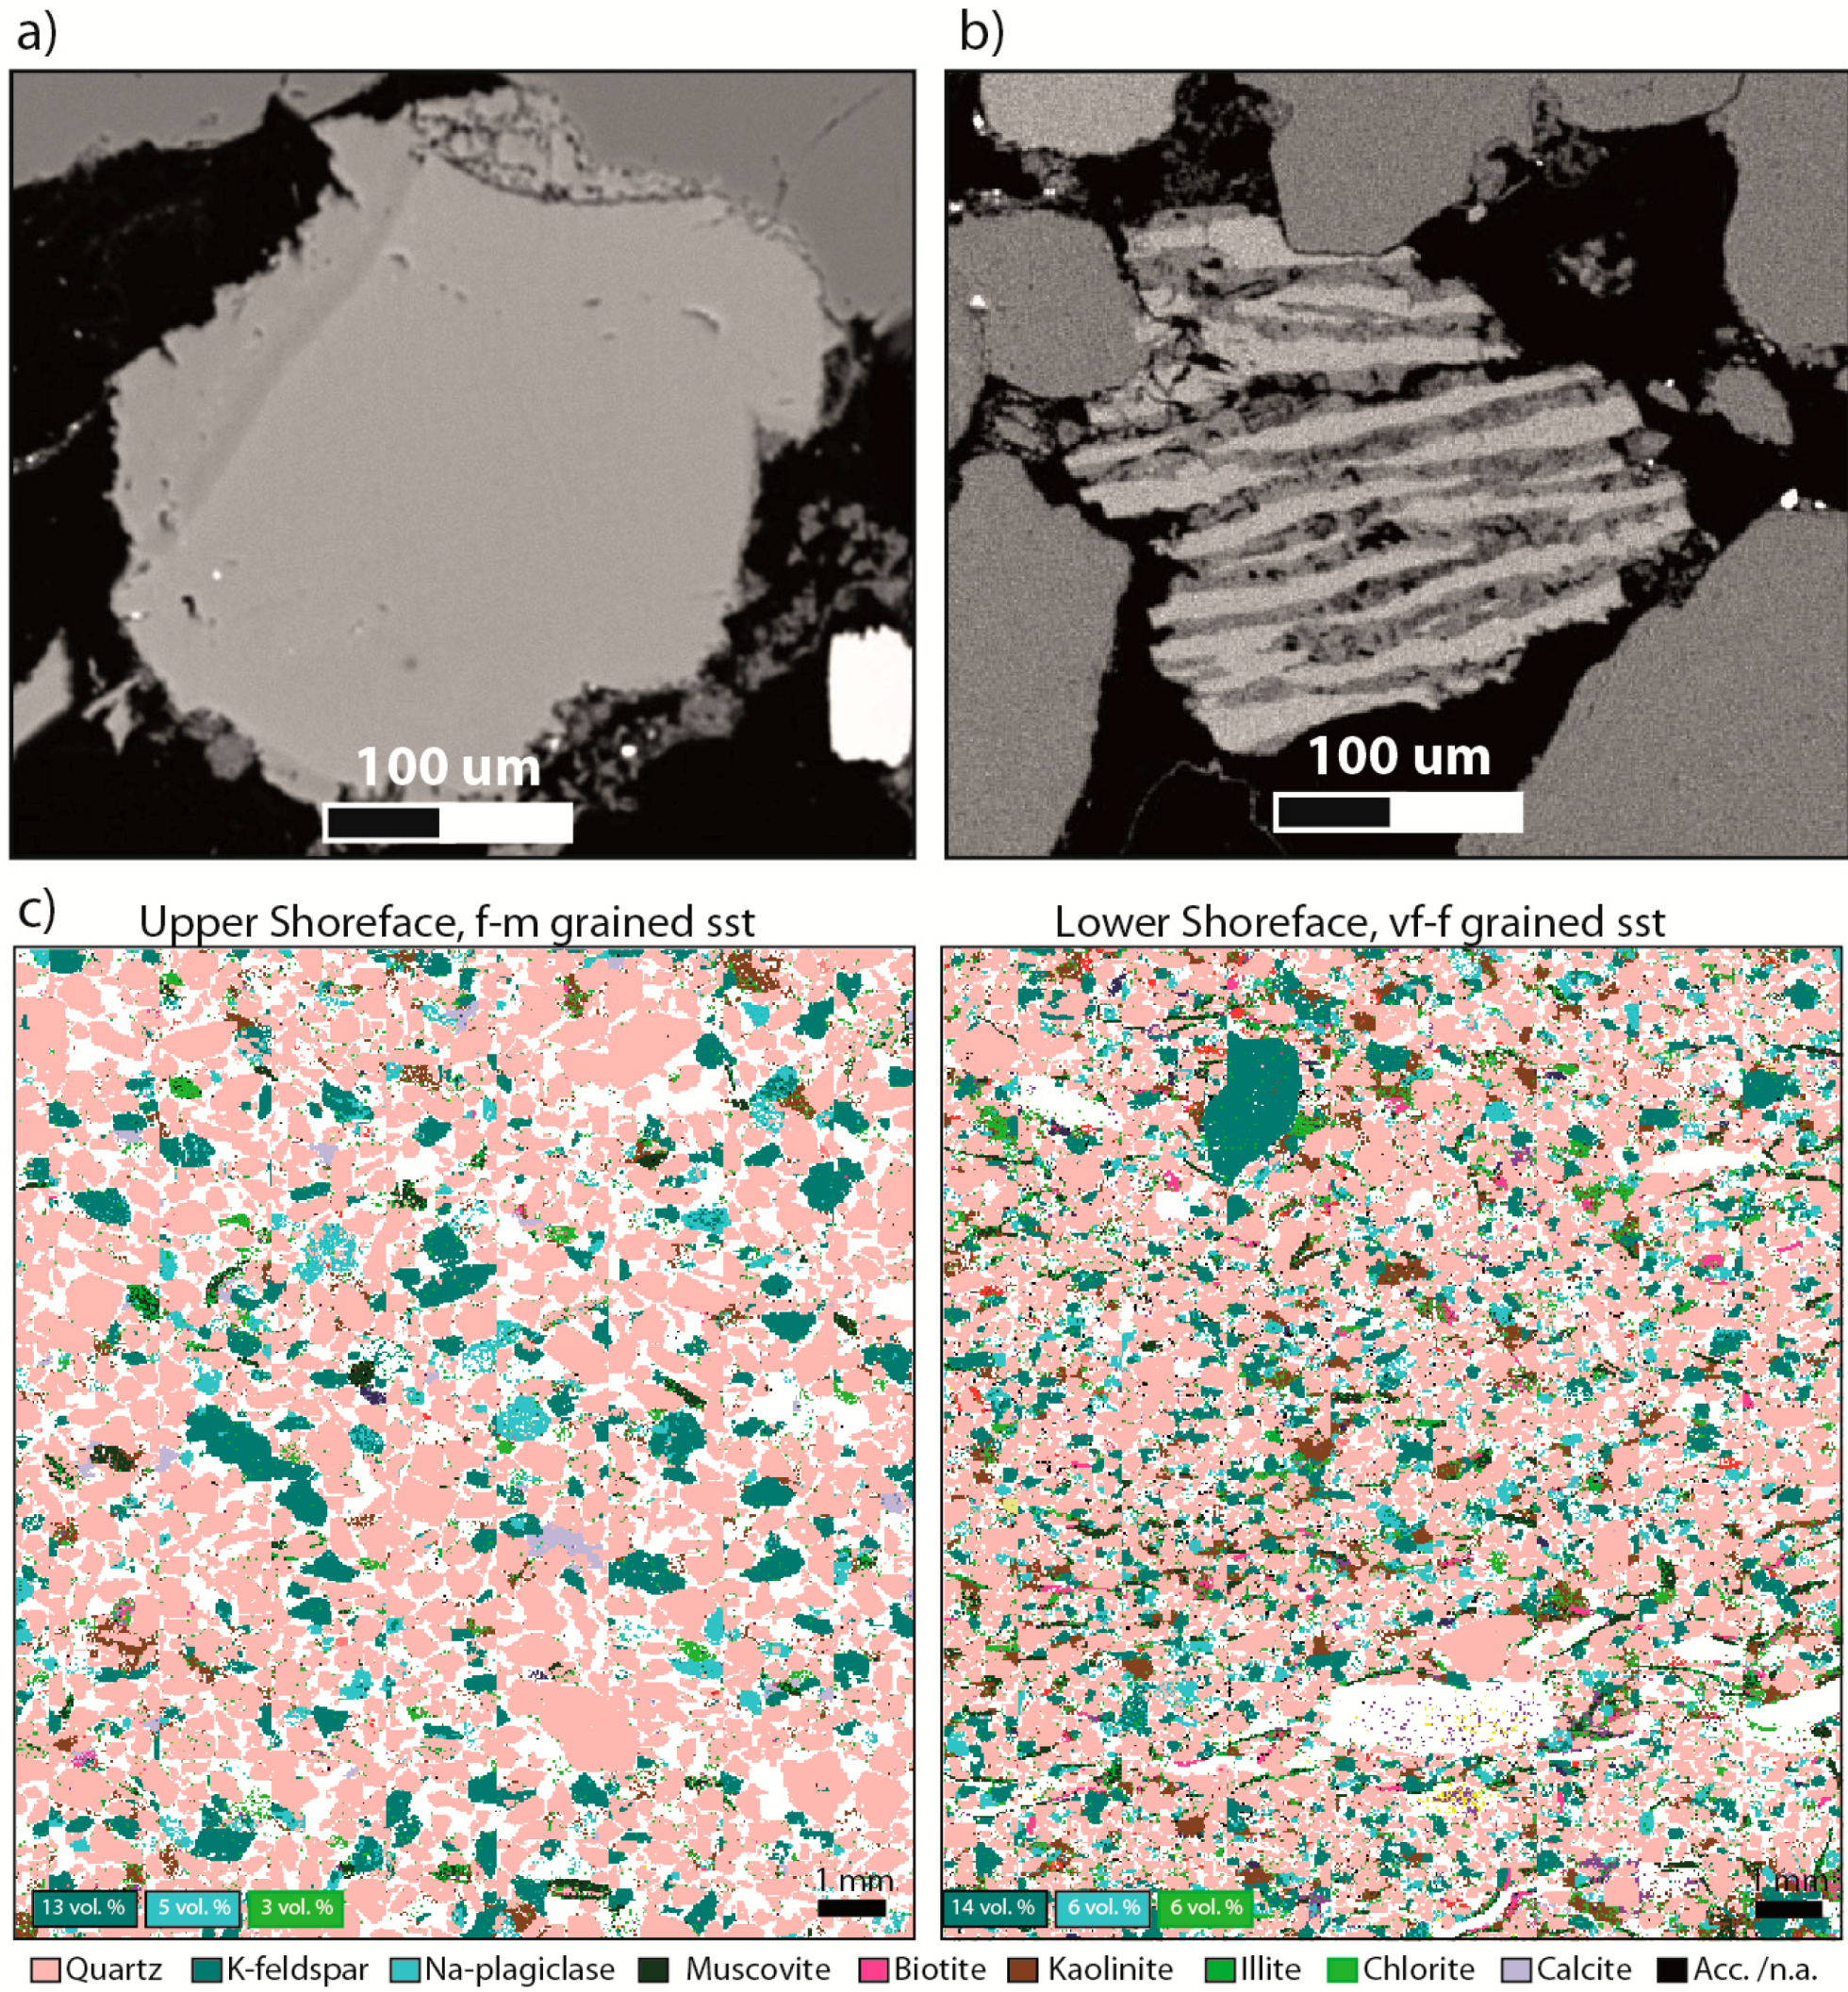
2.1. Qualitative and Quantitative Reservoir Mineralogy

It is useful to define reactivity and make separate geochemical categories within the sedimentological framework. Changes in grain size and mineralogy (phase and occurrence) are particularly important. Bed stacks, or para-sequences (sensu Van Wagoner et al. [36,37]), may serve as a scale of reservoir subdivision, depicting depositional trends; e.g., upwards coarsening or fining trends in grain sizes, indicating changes in depositional regime with time. In the case of the Johansen Formation, reservoir grade sandstones recognised in wells are subdivided in lower shoreface (very fine-grained) and upper shoreface (medium-grained) deposits, interbedded with mudstones and/or carbonate cemented layers [28,29] (Figure 2).
Though desirable, geological cores through the entire reservoir zone from saline aquifers are rarely available. Usually data from shorter core sections or sidewall cores must be interpolated with respect to vertical and lateral facies changes. In the case of the Johansen Formation, available core data are collected from a well tens of kilometres away from potential injection areas, and at shallower burial depths (Figure 1). Thin sections provide means for 2D porosity estimations, grain size, and mineral content (vol. %). Porosity and permeability plug test data are available from side wall cores [28].
One of the most common means for mineralogical quantification is X-ray diffraction (XRD) (e.g., the Rietveld method), as it is inexpensive, fast, and requires little sample material. The method may be crude or specific with respect to mineral phases, depending on the effort and knowledge put into interpretation of the results and treatment of sample material [38]. Analyses of grain size specific fractions are more suited for reactivity estimates—e.g., clay separation in fluid suspension.
Identification of main cation donors for mineralization in a given reservoir can be performed using the bulk mineralogy. Chlorite is a major constituent in the clay fraction of the Johansen Formation [29], and geochemical studies find chlorite to be a significant cation donor (i.e., Fe2+ and Mg2+ supply through rapid dissolution) in CO2 carbonatization [9,10,18,39]. Feldspars also provide a significant reactant, as plagioclase (albite and oligoclase) dissolve within relatively short time-scales (100 s of years), contributing Na+ and Ca2+ to solution [10,18,19]. This study will focus on the characterization of chlorites and feldspars, while the same kind of analyses should be undertaken in case of other or more reactive constituents (e.g., mafic minerals).

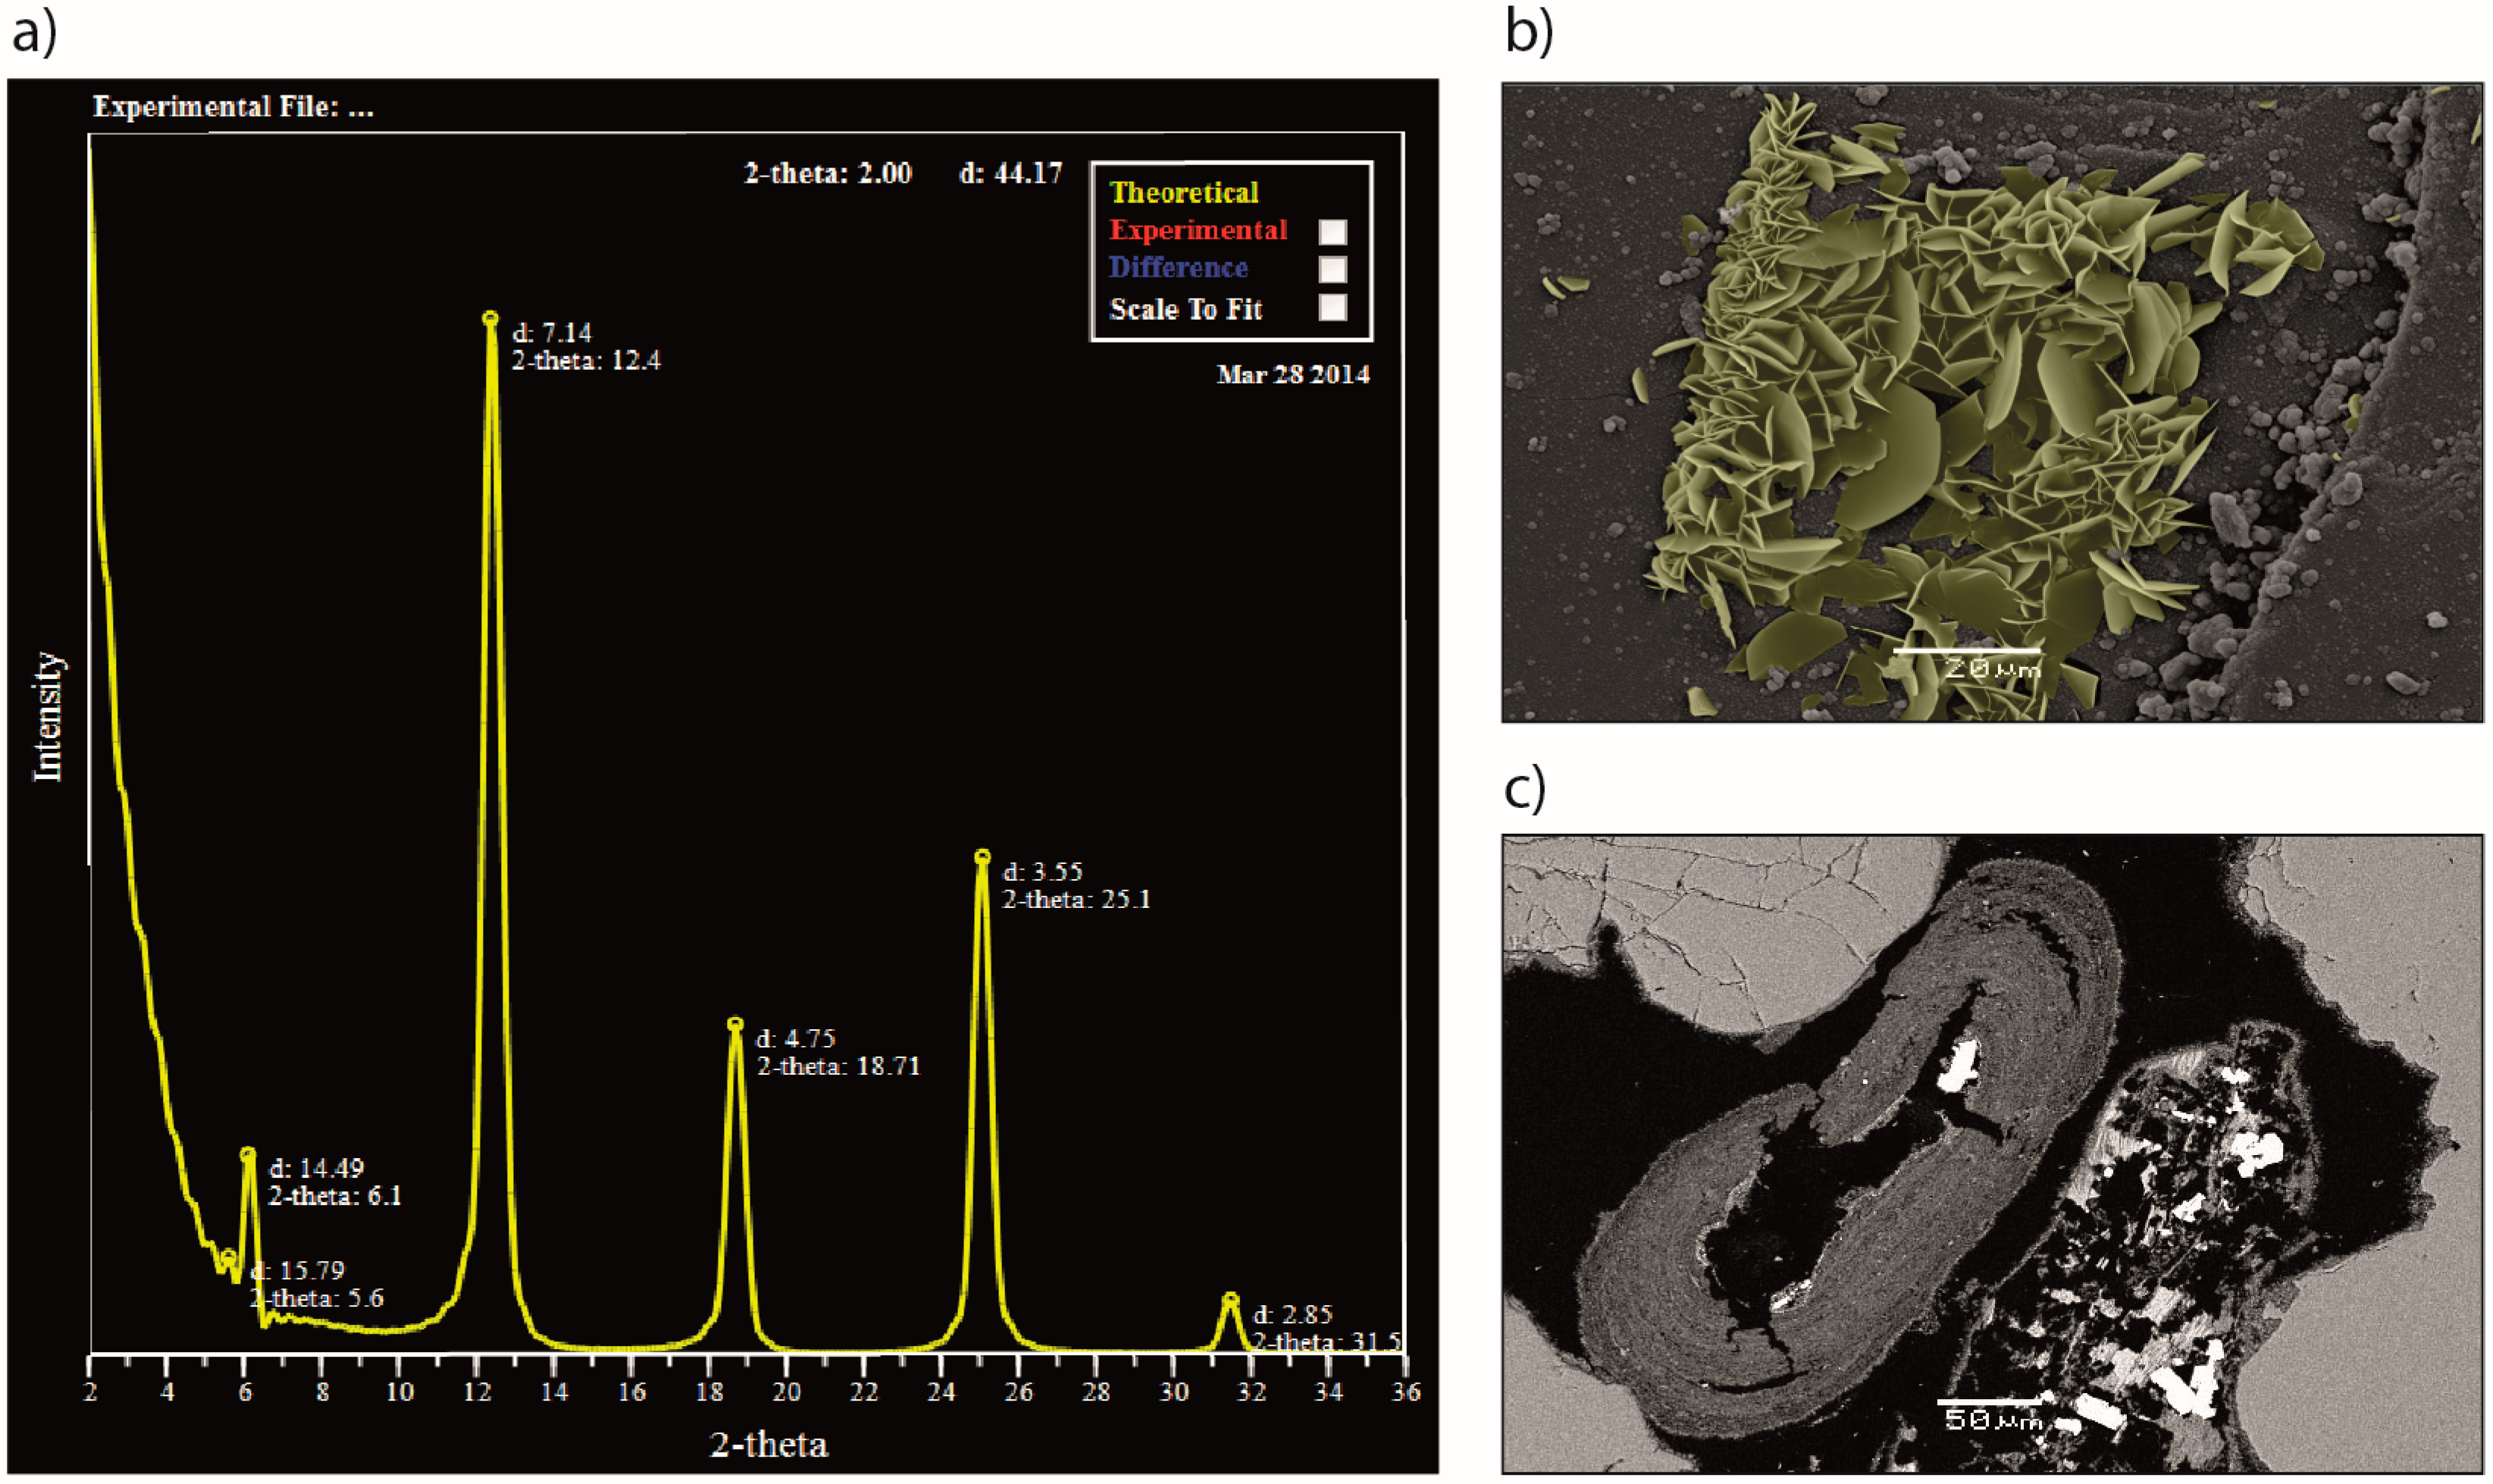
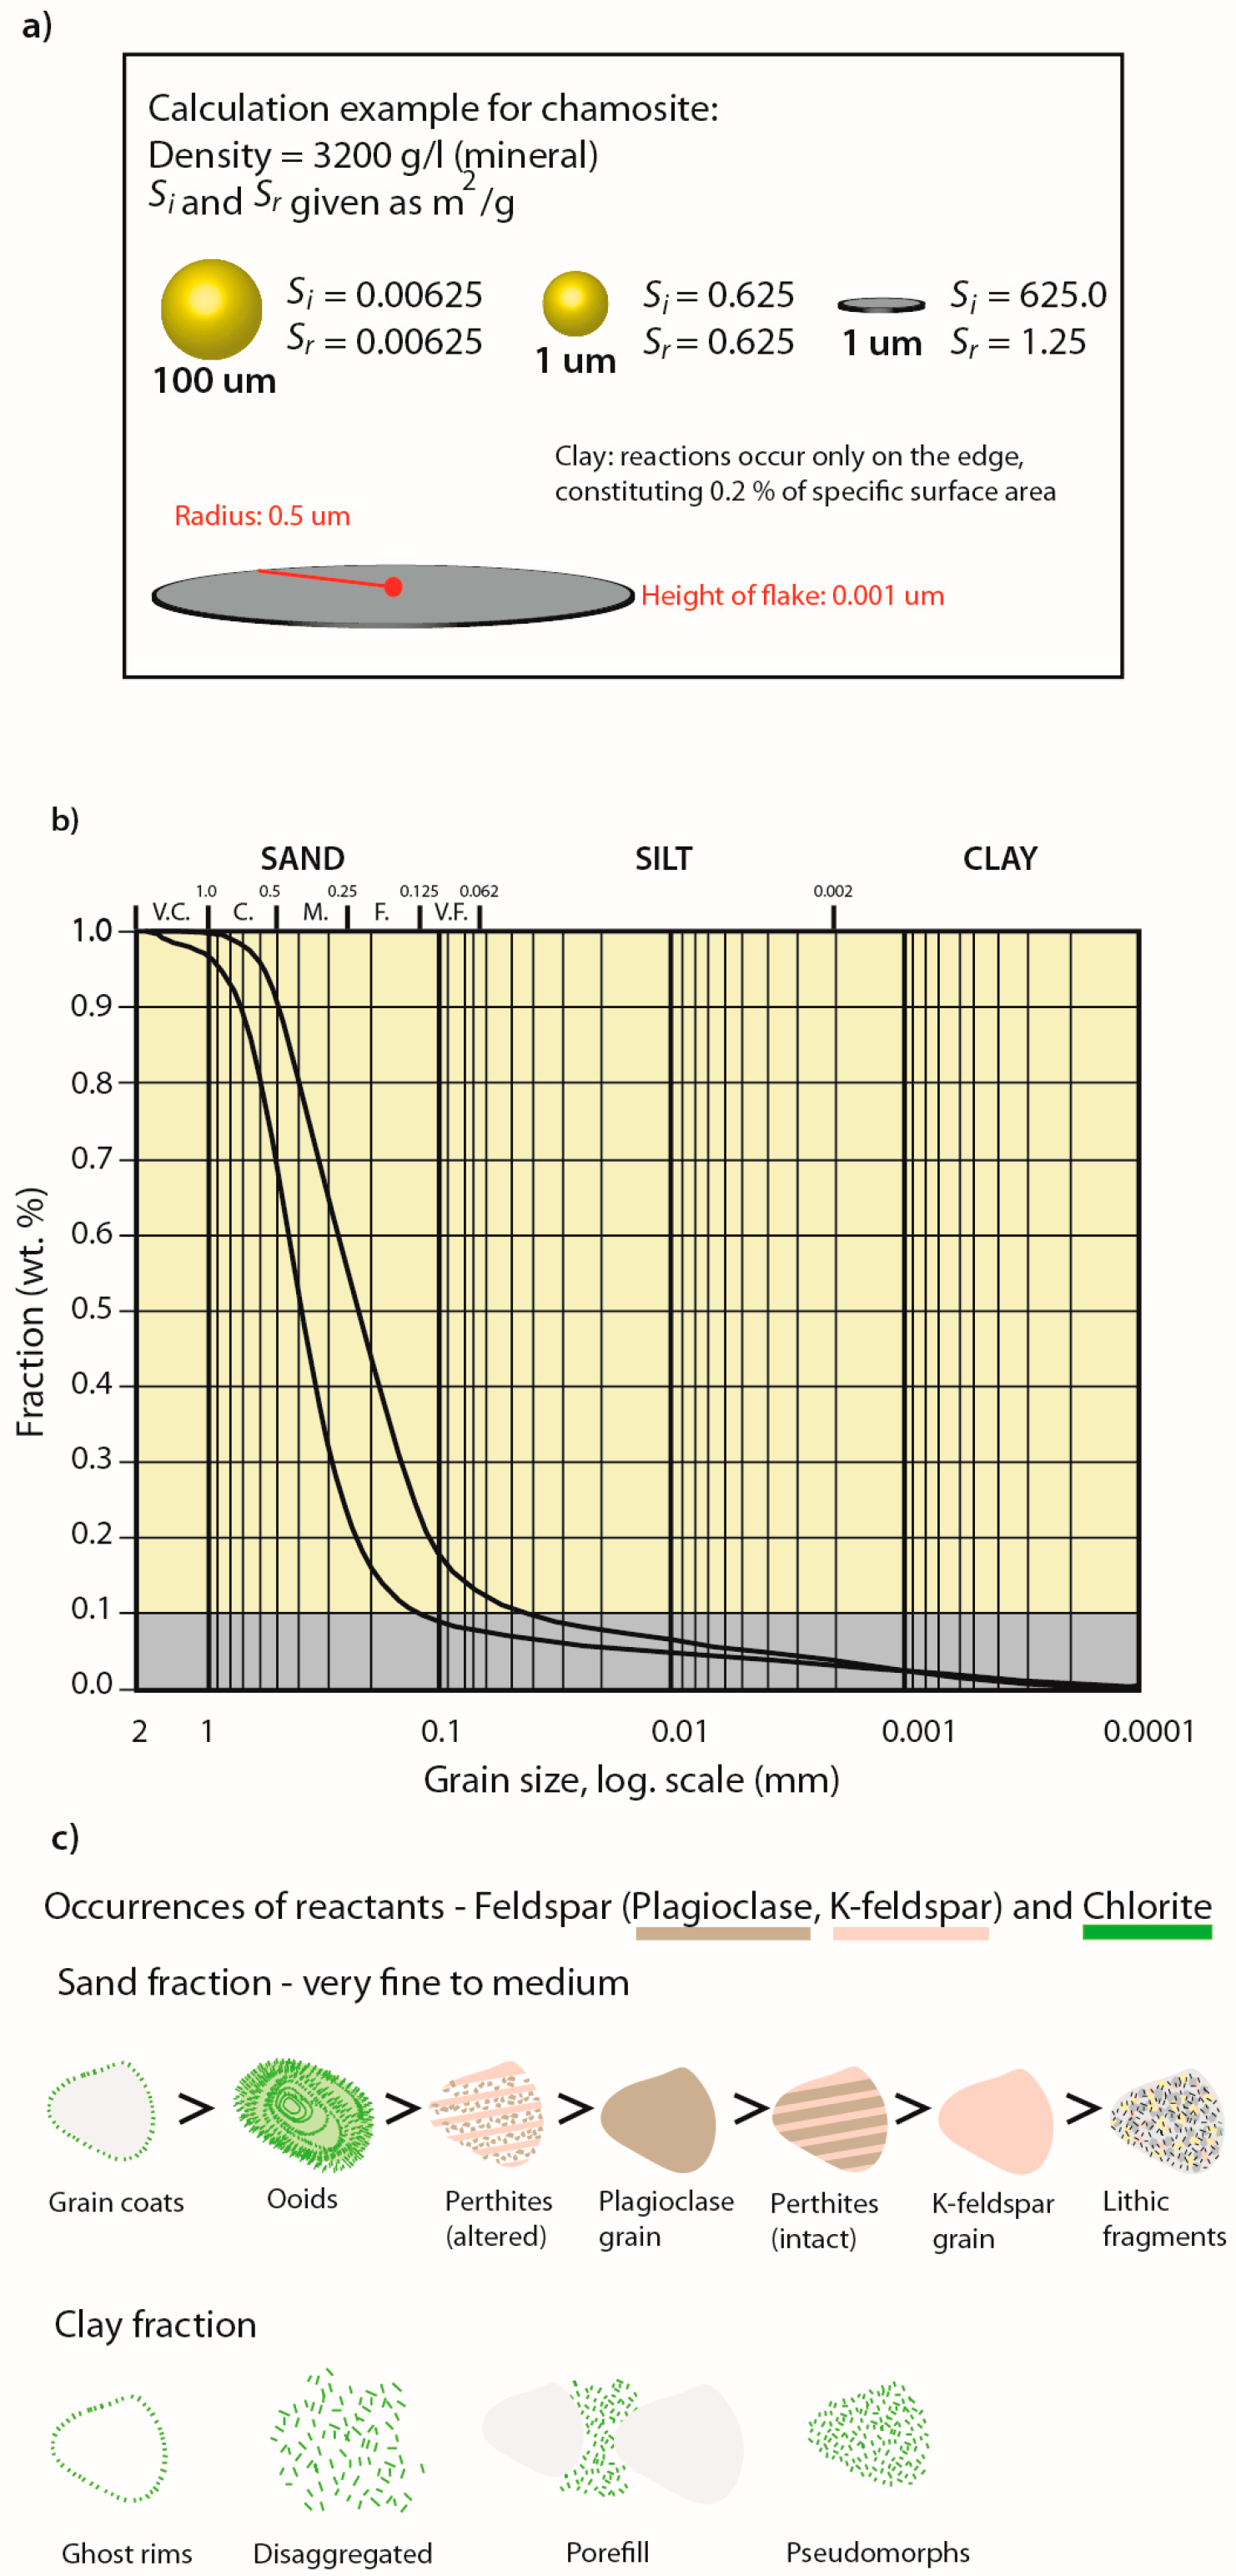
2.1.1. Characterization of Chlorites

Chlorite is a phyllosilicate mineral, with Fe-rich chamosite (Fe,Mg)5Al(Si3Al)O10(OH)8 and Mg-rich clinochlore (Mg,Fe)5Al(Si3Al)10(OH)8 as common varieties. Detrital chlorites derived from mafic volcanic or metamorphic terrains are commonly Mg-rich clinochlores, whereas chlorites sourced from peralkaline granites tend to generate Fe-rich chamosites [40]. Diagenetic chlorite is a significant constituent in many siliciclastic reservoirs in the Norwegian North Sea [33]. Autigenic chlorite may form by recrystallization of precursor clay minerals during early burial; e.g., from smectite (<70 °C) [41,42] or from berthierine (90 °C) [33,34,43]. Chlorite may also form as an alteration product from degradation of mafic minerals (e.g., biotite, pyroxene, amphibole). In addition to provenance and detrital mineralogy, depositional environment also exerts a control on chlorite occurrence. As summarized in a literature review by Maast [44] (and references therein), Fe-rich chlorite coating is associated with sediments deposited in marine environments, near river mouths and under tropical conditions, whereas Mg-rich chlorite coating is commonly found in continental sediments, deposited under arid- to semi-arid conditions. Chemical speciation with respect to Fe/Mg ratios is important in the selection of suitable kinetic parameters for geochemical simulations, as chamosite and clinochlore display different reaction potentials. Chamosites with Fe/(Fe+Mg) values between 0.57 and 0.91 are the most common in studied North Sea reservoirs [45]. Most geochemical studies implement kinetic data from [46], which only provide kinetic constants for Mg-rich clinochlore. It seems that also recent investigations into chlorite kinetics focus mainly on clinochlore (e.g., [47,48,49]). The effect of varying chemical composition of chlorite on dissolution rates is uncertain, as no thorough studies have been performed in this realm. It has been claimed to have little effect [50]. However, some experimental studies indicate significantly higher rate constants for Fe-chlorite [33]. However, the precipitation rates for siderite (FeCO3), magnesite (MgCO3), and Fe-Mg-Ca solid solutions are not the same, which provides another argument for differentiation. It is likely that more kinetic data will become available and include more detailed solid solution speciation in the future. As part of the geological characterization, XRD-spectra may be modelled for estimation of element ratios, as shown for a typical Fe-rich chlorite (chamosite) from the Johansen Formation (Figure 3a).
In a disaggregated sample, e.g., separated in clay (<2 µm), fine (2–250 µm), and medium (>250 µm) grain size classes, chlorite may be present in all fractions as quantified by XRD. The clay fraction would comprise pore-filling chlorites from diagenetic degradation of detrital, percolated clay and/or diagenetic chlorite from disassembled pseudomorphs of altered grains (e.g., degraded biotite) or mud-clasts. The sand fraction classes could comprise grain coating chlorite, from precursor clay coats. These appear as platy clay-fraction crystals growing tangential or perpendicular on the host grain surface (Figure 3b), and may be more or less resistant to mechanical sample treatment. Another common chlorite occurrence, ooidal, may also be included in the sand fraction. Ooids are spherical grains, with concentric layers of a coating mineral (e.g., clays, carbonates, phosphates) adsorbing on and accumulating around a nucleus-grain. Ooidal chlorite (Figure 3c) forms by recrystallization of precursor clay. These grains have a dense structure with low permeability. Other examples are chloritic pellets and dense diagenetically altered pseudomorphs. Thus, reaction potentials calculated as surface area per wt% mineral from XRD analysis, assuming a uniform clay fraction, would be overestimated in ooid-rich sediments. Additionally, pore-filling clays may not be accessible for intruding reactive fluid [22,23,51], which may cause overestimation of the clay fraction reactivity.
Petrographic studies (e.g., modal mineralogy or point counting) of thin sections in optical microscopes provide a volumetric estimate (vol %) of the mineral assemblage and porosity, which in combination with a description of grain shapes, sizes, micro-porosity from SEM, pore connectivity, and extent of coating translates directly to 2D specific surface areas. As with sieving before XRD analysis, point-counting methods may be used to separate mineral occurrences in grain size classes, in combination with descriptions of grain shape. In addition to chlorite, several reactants may appear in different grain size classes, representative of different reaction potentials.

2.1.2. Characterization of Feldspars

It is relevant to quantify the relative contributions and occurrences of feldspars (i.e., microcline/orthoclase/sanidine, albite, anorthite, and their solid solutions), as kinetics and dissolution potentials in the presence of CO2 vary significantly [46]. Anorthite is rarely preserved in clastic rocks, as it is chemically unstable and weathers easily [52]. Generally the feldspar assembly varies according to provenance and hinterland geology (i.e., felsic or mafic, igneous or methamorpic rock), and relative feldspar/quartz contents are higher in finer grained facies.
In the Johansen Formation (and aforementioned siliciclastic reservoirs of the North Sea) K-feldspar and Na-plagioclase are abundant (Figure 4). Plagioclase occurs as monocrystalline, diagenetically etched grains, partly dissolved and/or severely altered to sericite. The plagioclase fraction is less than the original detrital composition, but the overall reactive surface area is probably higher than the direct relation to average grain size, due to the diagenetic, secondary porosity within individual grains. The chemical composition in single grains is closer to the albite endmember, with Na >> Ca (determined with electron microprobe). Albitization of K-feldspar grains is common in siliciclastic reservoirs at temperatures >65 °C [53], which would add to the more reactive fraction of feldspars compared to assemblages at shallower depths. If the reservoir conditions in the injection area differ from the sample site it is necessary to extrapolate such diagenetic alterations, or perform sensitivity studies. In the available data set from the Johansen Formation microcline is the most abundant phase, and occurs as monocrystalline grains, some with authigenic overgrowths. K-feldspar is less corroded than plagioclase, and the reactivity is thus likely more directly proportional to average grain size. In perthitic grains, one constituent may be more corroded than the other (Figure 4b), increasing the proportion of reactive surface areas. The feldspar component in lithic fragments (e.g., gneiss and granite) is less corroded and exposes smaller mineral surface areas relative to the absolute volume fraction.

2.2. Reaction Potential

The mineralization potential is given by the amount of available cations per given rock volume, but the term reaction potential is more useful for summarizing the geochemical processes. In the case of the Johansen Formation, plagioclase (5–8 wt% in samples [29]) is the most reactive phase in fine- and medium-grained sand fractions, while K-feldspar (9–12 wt% in samples [29]) is more abundant. Fe-rich chlorite (1–9 wt% in samples [29]) is the most reactive clay phase. There is generally more clay in the finer grained, lower shoreface facies (e.g., Figure 4).
The potential for CO2 to be mineralized, i.e., trapped in solid state, depends firstly on the amount of CO2 added to the system and less on the solubility in formation water, considering salinity, pressure, temperature, and thermodynamic constraints. CO2 is transported through the aqueous phase during mineralization [18]. The solution composition applied in simulations (Table 1) was selected based on analogous reservoirs in the North Sea [54]. There is currently no data available on detailed water composition from the Johansen Formation.
Aqueous trapping capacity; CO2 + HCO3 + CO32−, is relatively small and in the order of a few percent [55]. Further dissolution of residual CO2 adds to the dissolution potential [56]. Carbonate precipitation reactions consume bicarbonate and cations from solution, lowering the pH as H+ is produced. Dissolution of silicate minerals consumes protons, and release cations, HCO3, aqueous silica and/or secondary clay minerals to solution (e.g., [19]). Carbonate stability is enhanced by increased pH, and the cation supply drives further carbonate precipitation. Dissolution and precipitation are interconnected through these feedback mechanisms [56], and the rate of either will be controlled by the slowest reaction [18]. Carbonate precipitation, most often considered a more rapid reaction compared to silicate dissolution (e.g., [54]), may in some settings provide the rate limiting reaction, such as for low temperature settings [18].
As a first approximation of reactivity and identification of primary reactants, initial geochemical batch simulations including the full mineral assemblage are adequate. For example PHREEQC, TOUGHREACT, and other numerical tools may be applied for batch geochemical modelling in combination with thermodynamic databases such as llnl.dat, phreeqc.dat, or equivalents, including kinetic expressions with nucleation growth rate equations (e.g., [10]).
Based on previous geochemical studies of siliciclastic reservoirs from the North Sea and elsewhere, it may be concluded that a few percent of scattered carbonate equilibrates instantly, that quartz is close to chemically inert, and that reactive accessory minerals present in small amounts (<<1 wt%) are insignificant on reservoir scale. One sedimentary facies may be represented by several samples, which in turn should be averaged with respect to grain size distributions, porosity and mineral content. Subsequently, cases for geochemical simulations, may be defined. If the sediment sorting is poor, it may be relevant to divide the sand fraction in two or more classes. Each mineral is assigned a representative wt% within each class according to petrographic studies of occurrence.

2.3. Reactive Surface Areas

Estimation of reactive surface area (m2/liter pore water) must relate weight or volume percent of mineral to grain size, shape, porosity, and mineral density. Aged, coated, diagenetically altered and/or weathered grain surfaces are expected to display lower reactivity compared to crushed sample material commonly used in laboratory studies of kinetics.
The mineral content given as wt% from XRD must be translated to the specific surface area by relating mineral density and grain shape (e.g., spheres or circular disks) in geometric formulas. Spherical grains are an appropriate assumption if grain sizes are adjusted according to appearance, e.g., 0.1 µm diameter for the clay fraction if assuming spherical grains, rather than 2 µm diameter if measuring more realistic clay appearances such as flakes (Figure 3b). Porosity is a characteristic of the sedimentary facies and diagenetic imprint, which must be estimated for the associated sample and/or interpolated to the study area. The geometric surface area may be described as:
S ¯ i = 3 x i ρ s o l i d ρ i [ 1 φ 1 ] j x j r j
where Si is the average specific surface area of mineral i for the appropriate facies (m2/L pore water). x is the mass fraction of mineral i, and ρsolid (g/L) and ρi (g/m3) are the average density of the total solid and density of mineral i respectively, φi is porosity, r is the mean radius of grains belonging to the discrete size group j, and x is the fraction of grains belonging to the same discrete grain size group. As a next step in detailed studies of separate mineral phases, the reactive surface area may be further adjusted according to petrographic observations. The true reactive surface area St, differs from Si, as only some parts of the surface is reacting at any given time (e.g., [10,17]). Grain roughness may increase St by up to several orders of magnitude compared to Si, while grain coats and “aged” surfaces have the opposite effect. Diagenetic processes may provide inaccessible (−) or accessible (+) micro-porosity within grains or mud aggregates. Appropriate fractions may be estimated qualitatively and/or quantitatively by elemental analysis and microscopy.
For example, the reactive surface area of plagioclase in lithic fragments may be assigned a lower reactive surface area, Sr < Si, compared to plagioclase as monocrystalline grains, where Sr = Si. In the case of etched plagioclase grains with additional internal porosity, Sr > Si. Using spheres as proxy for geometric grain shapes is sufficient in most cases, as long as the true morphology is considered. Needle-like crystals (e.g., illite) may for example be represented as a series of small spheres, and must be accounted for by reducing grain size. Clay minerals with flaky occurrence (e.g., chlorite in Figure 3b) are most reactive at the edges, and thus, Sr << Si, as shown in Figure 5a. Assuming spherical grain shapes is therefore not necessarily a drastic simplification. For shales, where the connected porosity is low, reactive surface areas have to be estimated from a geometric model of the pore space rather than the solid phase [17].
3D imagery of crystal habits in SEM is useful in quantification of reactive surfaces (Figure 3b). By use of 2D element-mapping of thin sections, mineral distributions may be efficiently estimated. These methods are of particular importance when variations in solid-solution chemistries relate to different reaction potentials; e.g., for feldspars, chlorites, smectites, carbonates, sometimes by orders of magnitude (e.g., [46]). Micro-porosity and fluid access is challenging to quantify, and total porosity is likely to be underestimated by microscopy methods. The total surface within connected pores may be measured in 3D by use of micro-tomography or Hg intrusion. In combination, these methods may be applied to estimate reactive surface areas, as described in [23]. However, available sample material or budget is often limiting 3D characterization.

3. Estimating CO2 Mineralization Potential (II): Example Modelling

Batch reaction models were performed with the geochemical software PHREEQC v3 using the built-in phreeqc.dat thermodynamic database, allowing robust estimates of the CO2 fugacity coefficient using the Peng–Robinson EOS model [57]. CO2 solubilities are however slightly high because a Poynting (pressure) correction for the gas solubilities is not included in PHREEQC. For the Johansen Formation (e.g., 96 °C, 300 bar, 0.5M NaCl, from [28]) the true solubility is 1.29 mol/Kgw (using the SAFT v1 method as described in [56]), whereas the PHREEQC solubility is 1.52 mol/Kgw. Nevertheless, the high solubility does not alter the prediction of carbonatization potential as simulations were run at a constant CO2 pressure and pH rapidly approaches a value close to 5 (4.9–5.4) at calcite saturation and over a large range of CO2 pressures (100–300 bar) [10,17].
To model the kinetics of mineral reactions the rate equations presented in [10] were used, with a transition state theory (TST) based rate law for dissolution and a nucleation-growth equation for growing mineral phases. The exception was growth of dawsonite, which had to be estimated using a local-equilibrium assumption (forming at equilibrium) because of convergence problems when it was included in the kinetic assemblage. This has been demonstrated to cause an overestimate of the amount of dawsonite that forms at short time-scales, whereas the models are less sensitive at the longer time-scales [17]. Kinetic data (rate constants for dissolution, nucleation and growth, and apparent activation energies), were taken from [17] (Table 2).
The true reactive surface area (St) differs from the geometric values (Si) because of grain shape, surface roughness, and because only parts of the surface are taking part in the reaction at a given time. Roughness may increase the surface area by 1–2 orders of magnitude, whereas the fraction of the total surface that is reactive may be 1% or less. These two effects therefore partly cancel each other, but the extent of this is difficult to assess and depends on several factors. Generally, aged sediments may have orders of magnitude lower reactive surface area than activated crushed materials. The sensitivity of mineral carbonatization on the reactive surface area has earlier been demonstrated in [10,17], and we will here simply use the geometric model (Equation (2)) and focus the sensitivity study on sedimentological features (e.g., chlorite and feldspar morphologies and mean sediment grain sizes).
S ¯ i = 3 x i ρ s o l i d r ¯ ρ i [ 1 φ 1 ]
For the case studies, we divided simulations into very fine sand (r = 0.05 mm) and medium sand (r = 0.2 mm), representing typical lower and upper shoreface facies of the Johansen Formation (Figure 2) [28,29]. In these simulations quartz (nucleation surface), feldspar, Fe-chlorite ooids, and rock fragments were considered to be of the same size, whereas clay particles (kaolinite, chlorite, smectite) were considered to have a mean radius of 1 µm. Sensitivity of feldspar occurrences were simulated for 4.8 wt% perthitic K-feldspar, 1 wt% lithic K-feldspar, 2 wt% perthitic Na-feldspar, and 3 wt% plagioclase. Chamosite input was 4 wt% porefill and 1 wt% ooid. The porosity was set at 25% and reservoir conditions (300 bar, 96 °C) were not varied between scenarios. Model sensitivity studies for temperature and nucleation growth are on-going.

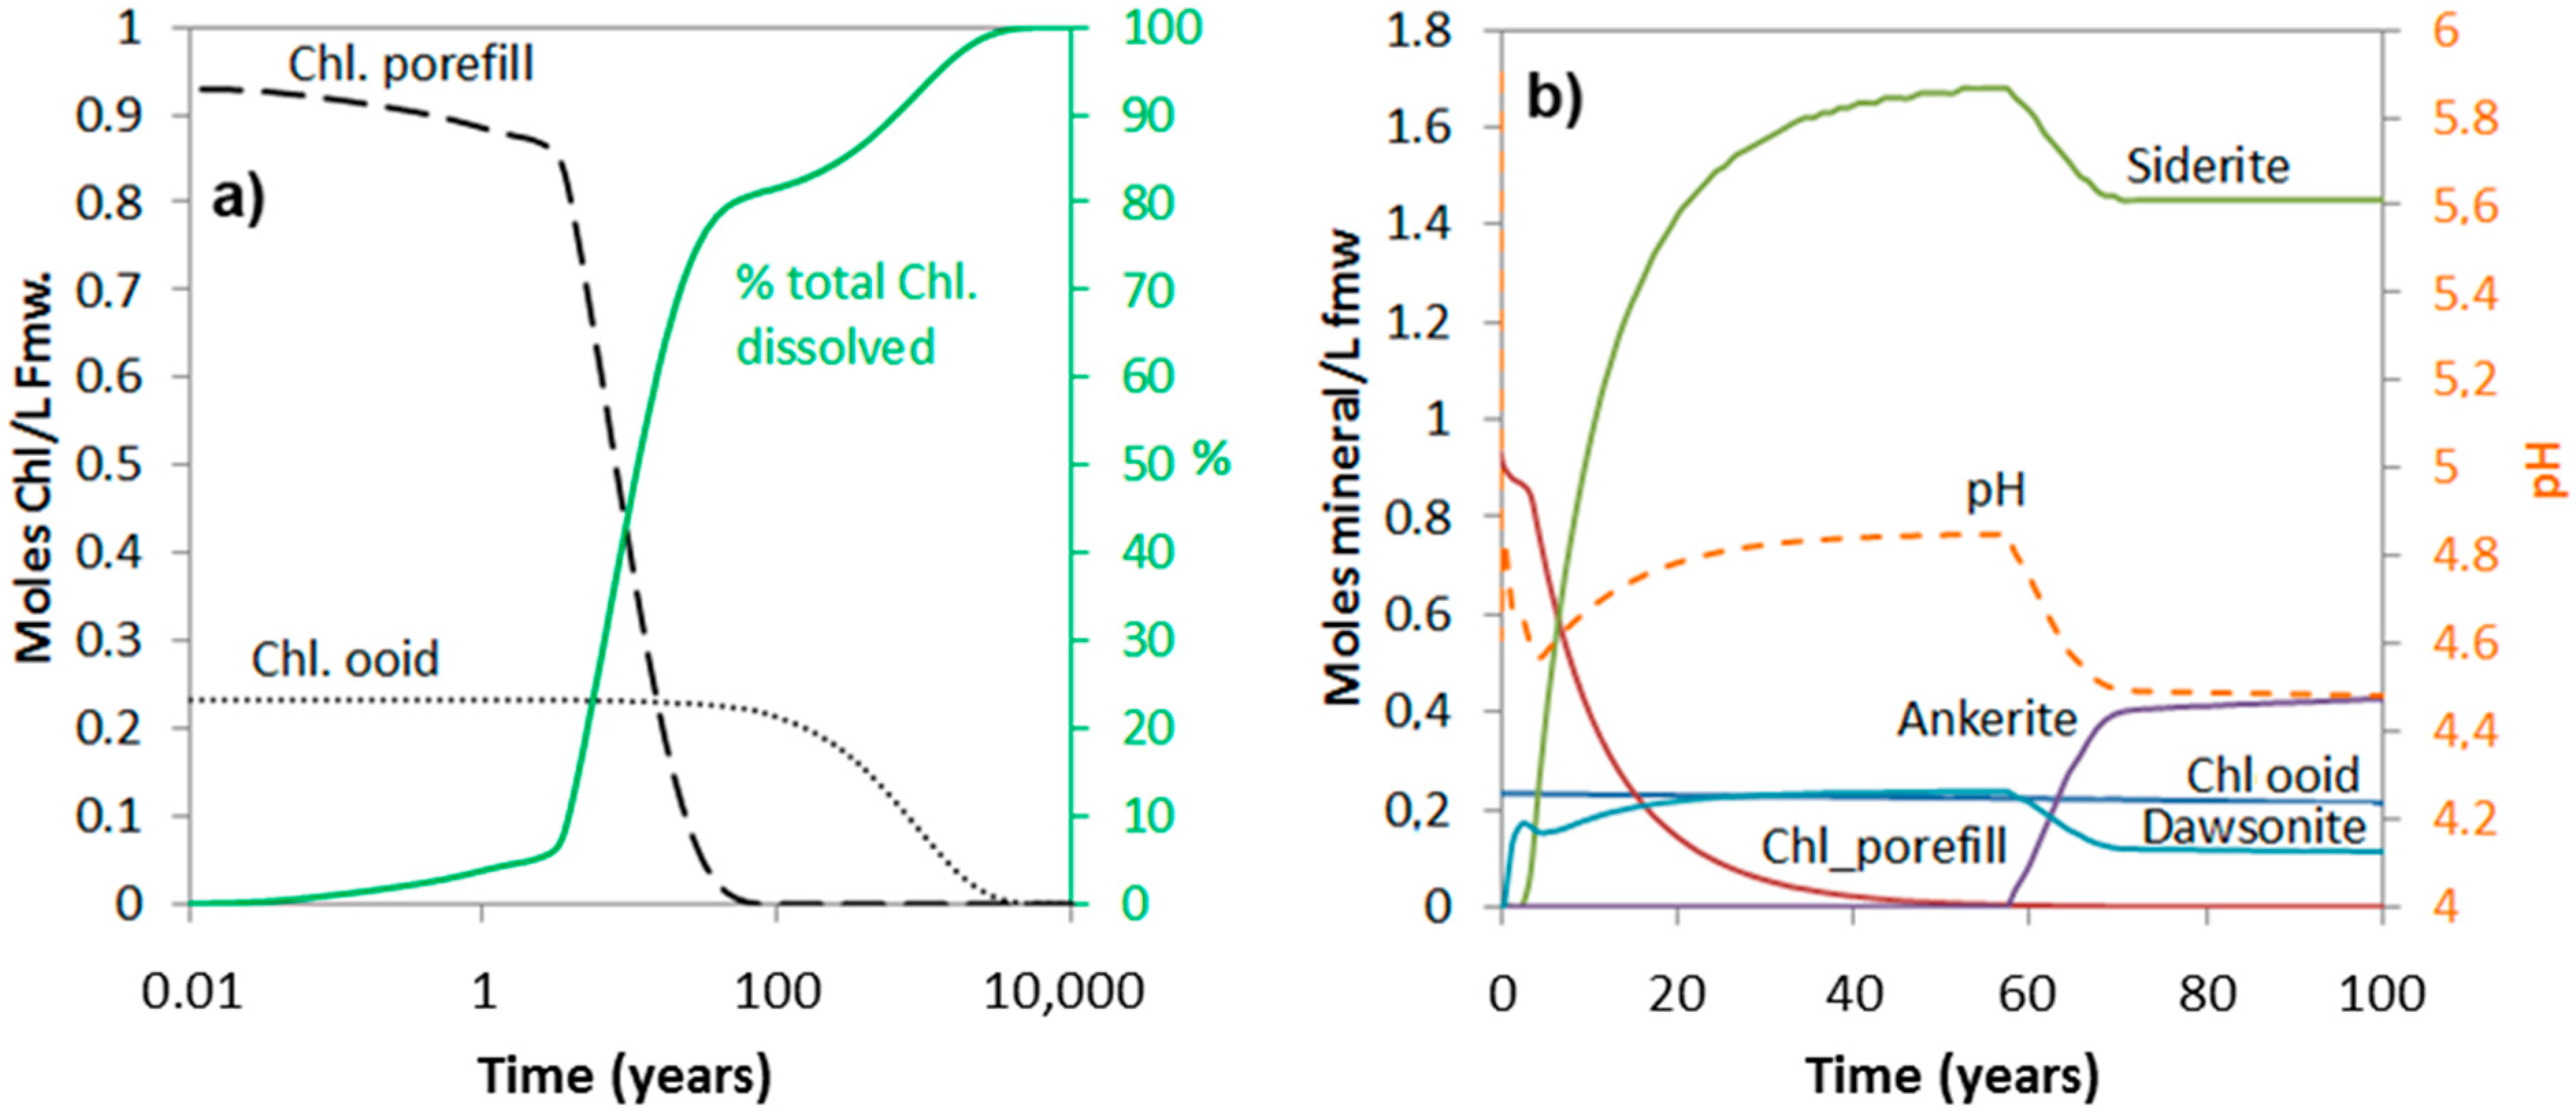
3.1. Carbonatization of Chlorite

Two of the chlorite occurrences observed in the Johansen Formation, i.e., in ooids and as pore filling and grain coating cements, display very different reactivity. Because large parts of the chlorite in ooids are inside the grain and prevented from being in contact with the reactive solutions, ooid-chlorite is assumed to have about two orders of magnitude lower specific reactive surface area than the pore-filling and grain-coating chlorites. The abundance of ooids varies in the cored interval of well 31/2-3 in the Johansen Formation, but is generally not dominant relative to more accessible pore-filling, pseudomorph alterations, and grain coats. We therefore varied the fraction of ooid-chlorite from 0 to 20 vol %. Chlorite morphology is also expected to show significant lateral and stratigraphic variations. Chloritic ooids are recognised also in other potential storage formations such as the overlying Cook Formation [34] and in the Gassum Formation [35].
The simulations show that the amount of chlorite dissolved over short to medium time spans (<1000 years) very much depends on the amount that is high-reactive, i.e., the pore-filling and grain-coating chlorite (Figure 6 and Figure 7). The time it takes to completely dissolve the ooidal chlorite is approximately 10,000 years, also in the 20% ooid-chlorite case, and it is therefore no difference in the dissolved amount at this time scale (Figure 7a). Figure 7b shows pH changes and the amount of secondary carbonates (siderite, ankerite, and dawsonite) that form in the 20% chlorite-ooid case over 100 years. Siderite is the only Fe-carbonate to form, and the amount is proportional to the amount of chlorite that dissolved (1.8 moles of siderite formed for each mole of chlorite dissolved). The short delay of four years before onset of growth (Figure 7b) was due to the nucleation induction time. As kaolinite was defined to be at equilibrium with the formation water and dawsonite formed according to the local-equilibrium assumption, dawsonite formed immediately from the dissolved CO2 and the formation water Na+ and Al3+, but the growth rapidly stopped as no further Na+ was supplied (Figure 7b).

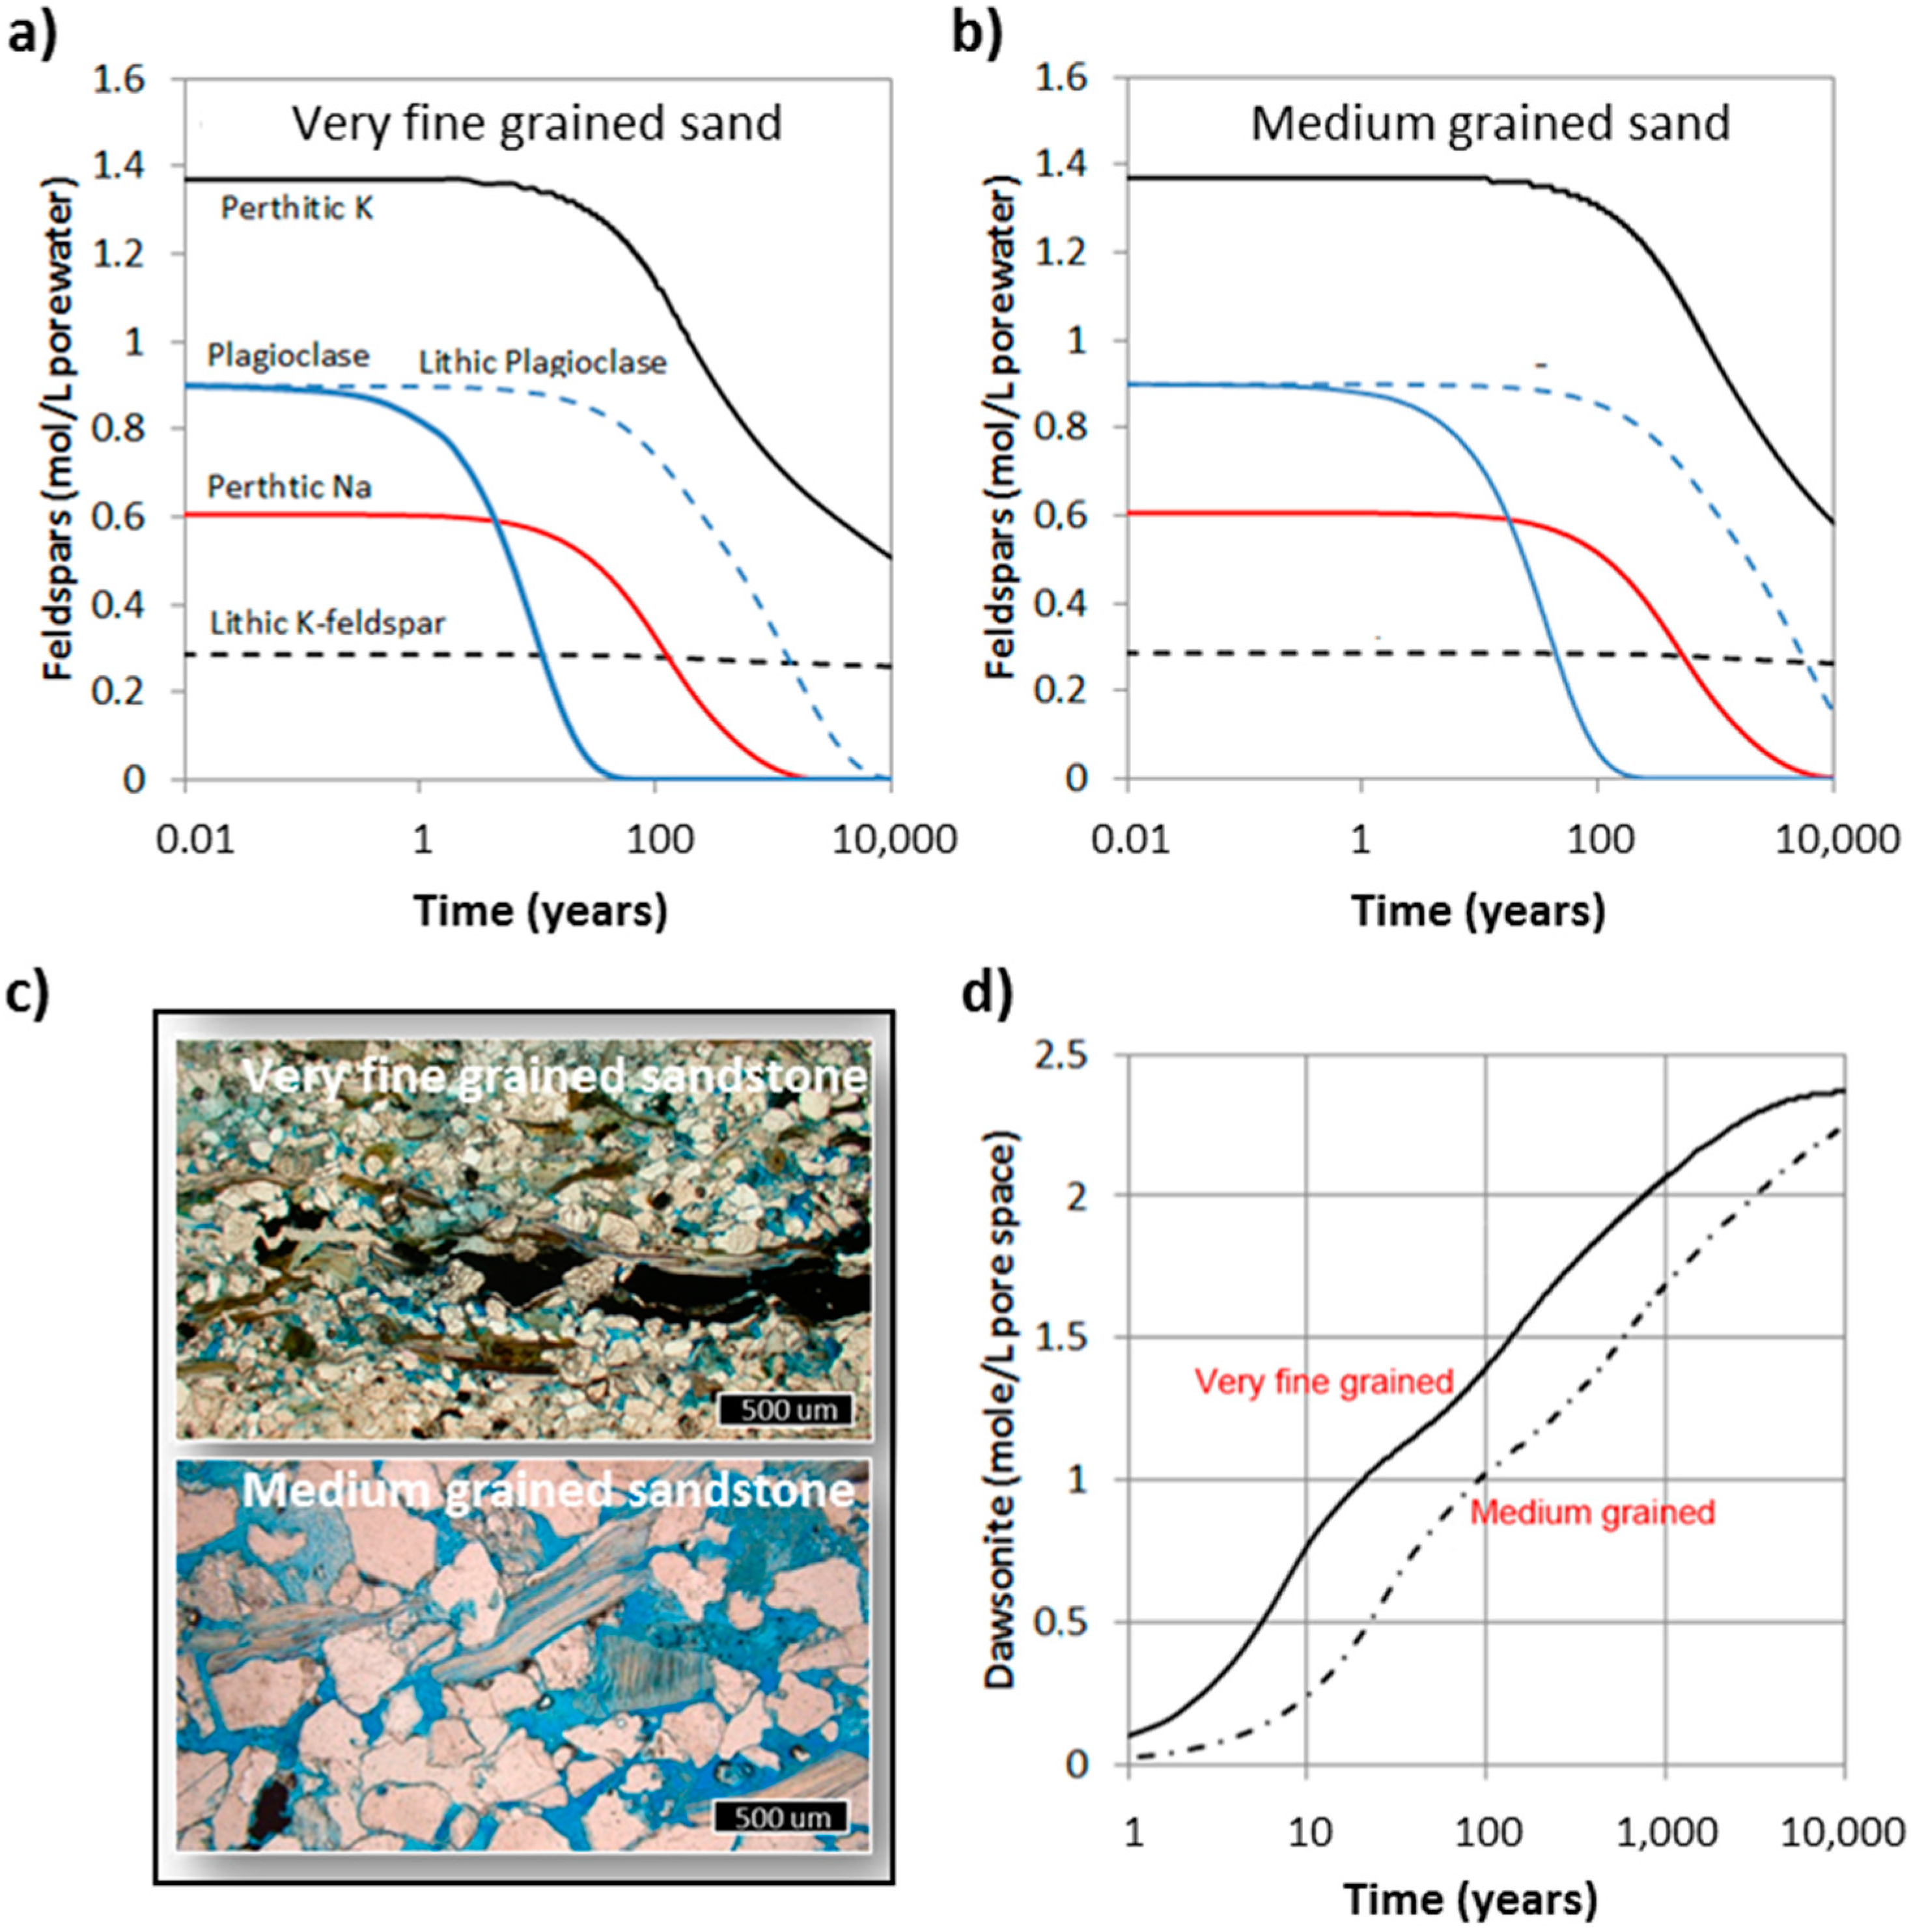
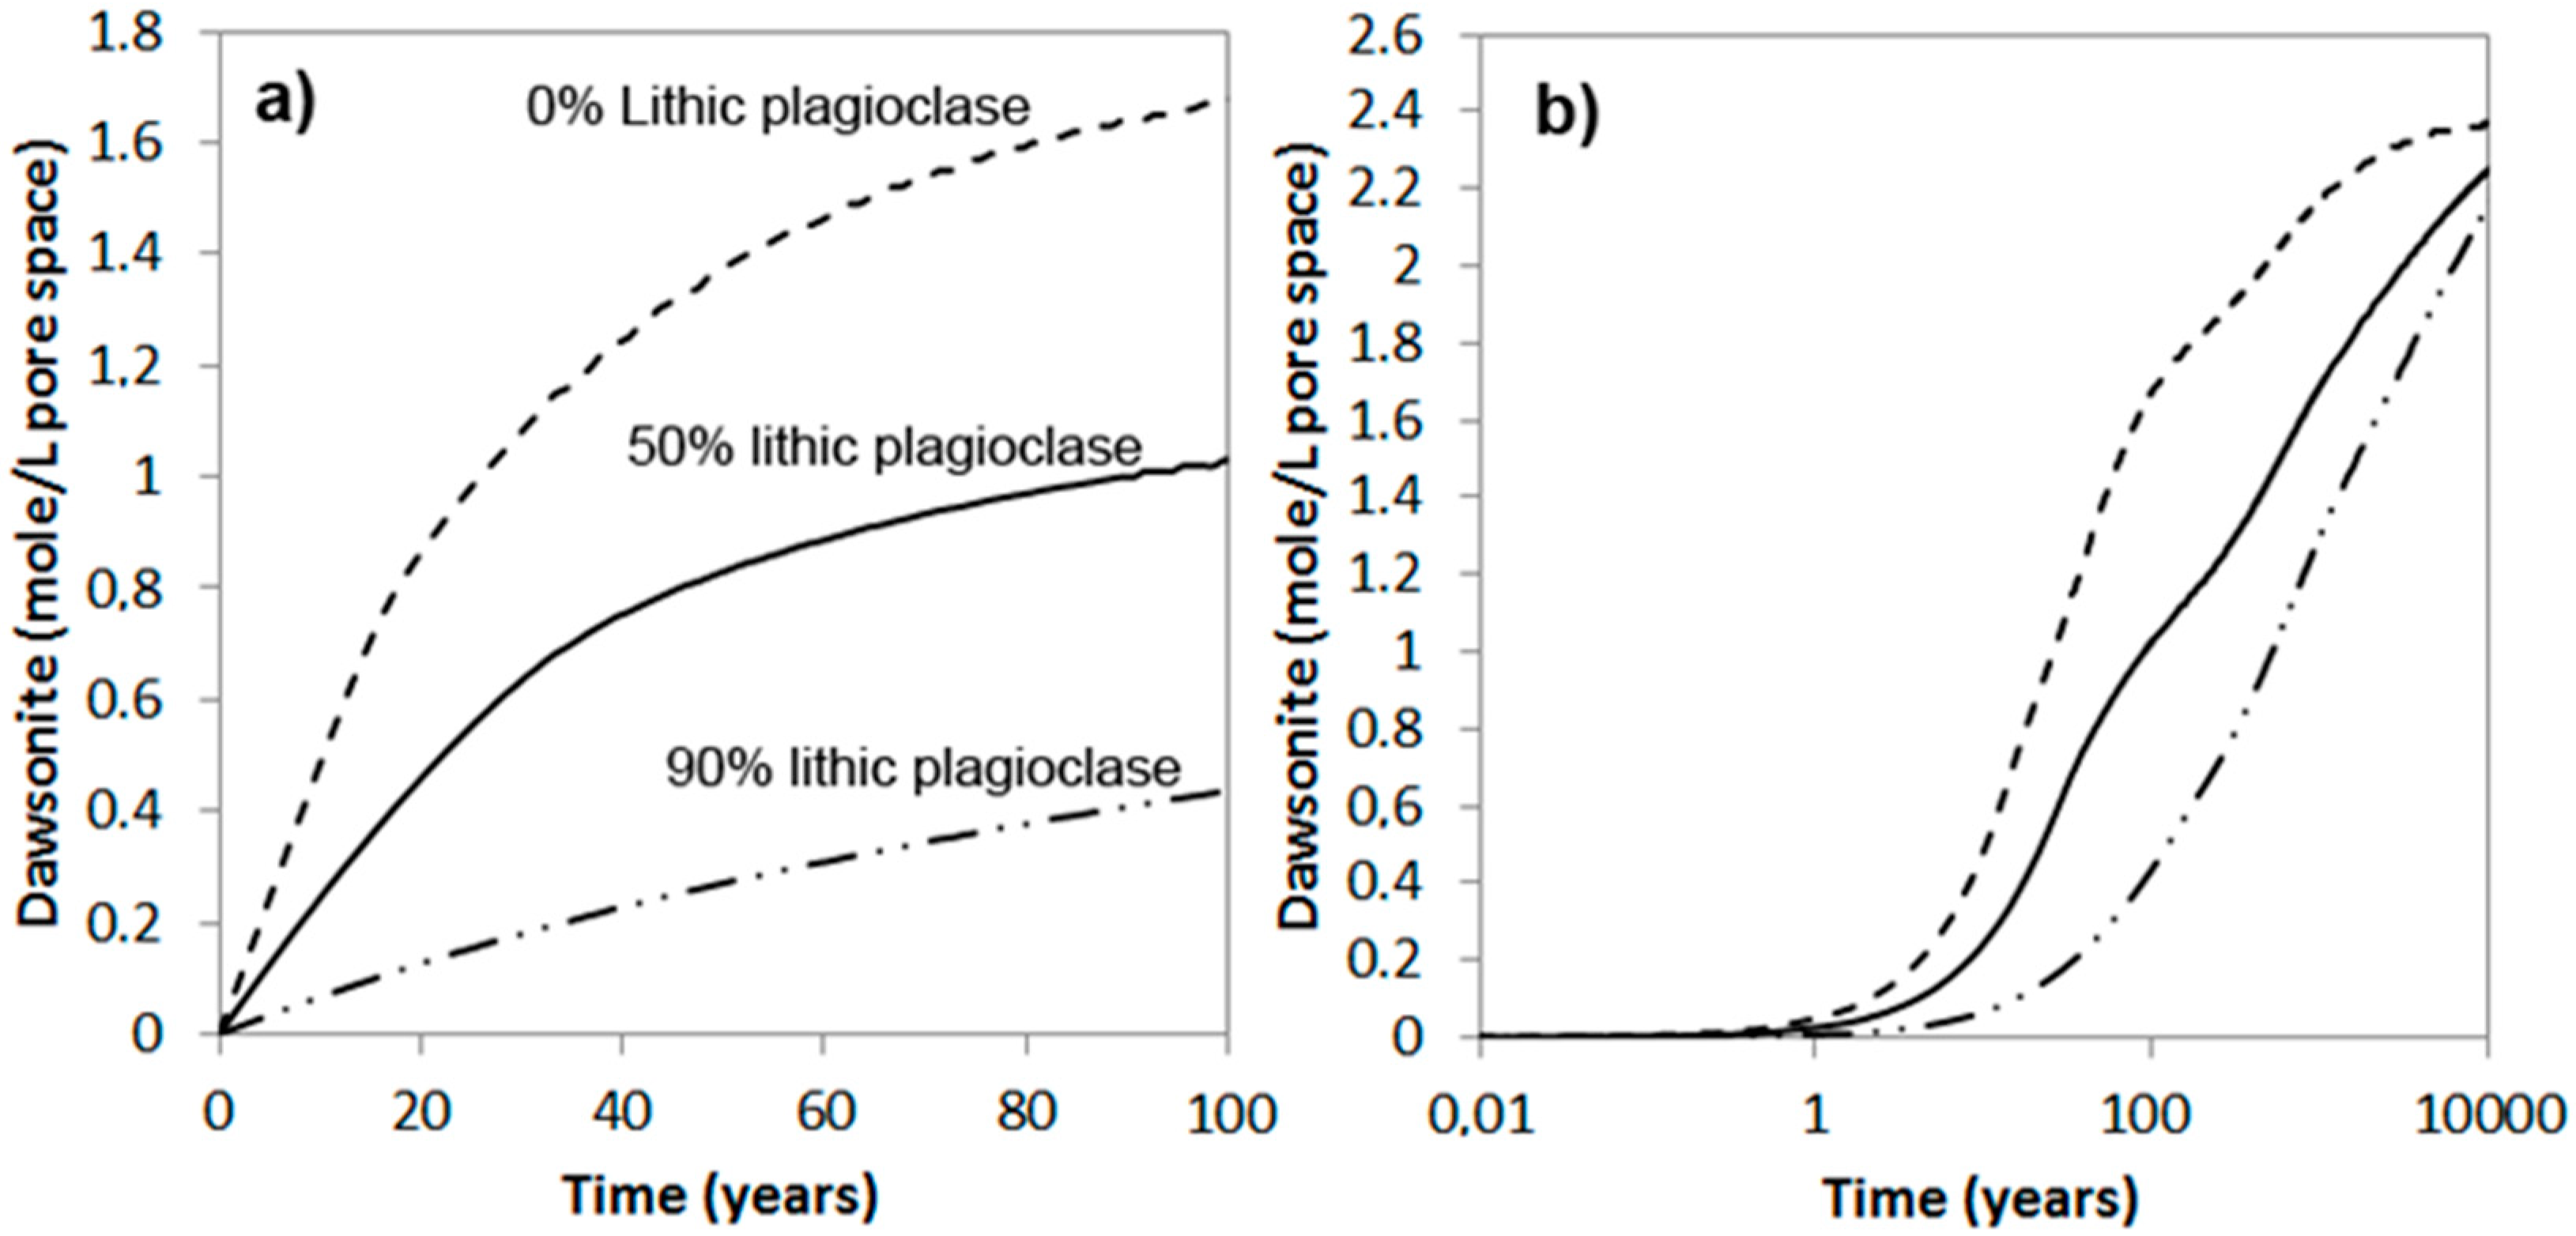
3.2. Carbonatization of Feldspars

The feldspars in the Johansen Formation have been divided into five different types based on their chemistry and morphology. The lithic feldspars (plagioclase and K-feldspar) were assumed to be in a mineral mixture inside spherical fragments, and have reactive surface areas corresponding to the mineral fraction in the fragment. K-feldspar was also found along albite in perthitic fragments, and some plagioclase occurred as larger, preserved detrital grains. In these simulations we assumed that all grains (minerals and lithic) where in the same size, and we simulated two different settings: very fine grained sand (0.1 mm) corresponding to lower shoreface deposits, and medium grained sand (0.4 mm) being representative for upper shoreface deposits [29]. The difference in grain size leads to a four times larger reactive surface area for the very fine sandstone, and correspondingly faster dissolution of the feldspar grains and faster formation of the secondary dawsonite (Figure 8). In the very fine sand, detrital plagioclase dissolved completely within 50 years, leading to a corresponding dawsonite growth. In the medium-grained sandstone the same reaction takes four times longer, indicating that the dissolution occurs at far-from-equilibrium under-saturation and that the rate therefore is proportional to the reactive surface area. The difference in carbonatization potential is mainly seen on the short term, with the very fine sandstone having a potential of about 50% more CO2 bound and immobilized in dawsonite after 100 years (Figure 8). The difference is smaller in the long term (1000–10,000 years) as all Na-feldspars are eventually replaced by dawsonite. Including minor calcite contents (e.g., 1 wt%) causes some minor recrystallization of calcite to ankerite, but the overall storage potential does not change much. The K-feldspars were not completely dissolved after 10,000 years, but K-feldspars have earlier not been regarded as a source for dawsonite ([59] and references therein). Some recent data may, however, indicate that K-dawsonite may also form, but this is still highly uncertain [60]. The feldspars in intact lithic fragments are much less reactive compared to individual plagioclase grains, and it takes thousands of years to dissolve the lithic plagioclase even in the very fine sandstone.
If available mineral data are XRD analyses only and no petrographic information is available, we cannot distinguish the lithic plagioclase component (as long as the chemical compositions of the two are similar). The rates of plagioclase dissolution and dawsonite formation may in such cases be highly uncertain. Although we know quite well the local composition (well 31/2-3) of the Johansen Formation rocks, there may be spatial variations and we illustrated this by simulating three cases with different fractions of plagioclase bound in lithic fragments (Figure 9). If all plagioclase is monocrystalline and detrital (0% in lithic fragments), nearly 70% of the plagioclase has dissolved after only 100 years and some significant amounts of dawsonite forms (Figure 9b). On the other hand, if most (90%) of plagioclase is within lithic fragments, less than 20% has dissolved after 100 years and much less dawsonite forms. The difference is, however, smaller at longer time scales and quite small when approaching 10,000 years (Figure 9). We have so far simulated chlorites and feldspars and their carbonatization potentials separately. Because these mineral groups share elements such as Al and Si, dissolution of one may affect the other. We therefore simulated the combined chlorite-feldspar assemblage and compared the carbonatization potential with the individual mineral-group simulations (Figure 10).

4. Discussion

The reactivity depends on the mineral assemblage, grain size and morphology, which all vary according to sedimentary facies within one sandstone reservoir unit, as well as on the diagenetic imprint and in-situ reservoir conditions. Characterizing and describing a potential storage candidate with respect to the spatial distribution of sedimentary facies is an efficient means for separating zones with different mineralization potentials for CO2 in siliciclastic reservoirs.

4.1. Workflow

The workflow for parameterizing input for geochemical models described above is summarized in Figure 11. The main challenge with respect to geological characterization of saline aquifers is that hard data are often scarce. Thus, interpolation across large distances and/or burial depths from areas where data are available, to a less mapped, potential injection site are carried out. Absolute reactivity may often not be estimated, but taking into account facies changes (e.g., more clay and feldspar in finer grained facies) and diagenetic imprint (such as albitization with increasing temperature), some scenarios may be defined for initial geochemical bulk modelling including all phases and identification of main reactants. For the Johansen Formation the main cation donors were identified in bulk simulations as albite and Fe-chlorite [61]. Subsequently, estimating the facies-specific reaction potential through geochemical simulations takes a detailed description of the reactants into account. Solid-solutions must be specified and parameterized with suitable kinetic parameters [10,46] and assigned to one or more grain size/shape class occurrences (Figure 5).
The total input reactive surface area (St) may be defined through petrographic studies and quantification of mineral assemblage as described here and/or according to other methodologies (e.g., [22,23,62]). Depending on the magnitude and kinetics of pH-changes during simulations (i.e., not too large fluctuations), simulations for each reactant (dissolving phase) may be run separately.

4.2. Input Data

XRD quantification procedures provide cheap and frequently available data. Direct use of bulk rock XRD data (sometimes lacking specification of sample type and treatment) as input for geochemical modelling of mineral trapping, with uniform grain sizes and associated reactive surface areas, is common procedure. Evaluating the effect of phase occurrence and grain shape/size may change the time scale and magnitude of mineralization potential significantly, as shown here. Without complementary geological knowledge about the depositional environment and burial history of siliciclastic rocks, reservoir scale estimations of reaction potentials may be grossly wrong. Appreciating the large uncertainty due to natural heterogeneity and lack of data, a range of geochemical models can be constructed to illustrate effects of alternative interpretations and data interpolation. Effects of system variability may also be explored by means of stochastic analysis: for example by Monte Carlo sampling from experimental surface area measurements [16].
In the Johansen Formation the content of reactive minerals varies in well 31/2-3, and until the assembly is confirmed in the actual injection area, facies related scenarios may be defined for sensitivity studies of trapping potential.

4.3. Upscaling

Having defined reactive surface areas and mineral assemblages specific to each facies represented in the reservoir, bulk reservoir reaction potentials (dissolution + mineralization) may be estimated. By fluid flow simulations of CO2 injection and migration (e.g., Eclipse, TOUGH, and similar numerical tools), total dissolved volumes of CO2 within specific layers or in each defined facies setting may be quantified. The current facies model for the Johansen Formation (Figure 12) is based on acoustic impedance data, and must be verified and calibrated with well data before reactivity distributions can be predicted. Scenario based modelling of fluid distributions and dissolution potentials, however, indicate that the dissolution potential (e.g., 29% of 160 Mt injected CO2 after 1000 y) could be less than the mineralization potential (Figure 10) on the same time scales (100’s of years), which would cause a catalytic effect of mineralization on further dissolution of the residual phase, where supply of CO2 would be the rate limiting factor. This is highly dependent also on reservoir pressure and temperature conditions, which still are to be measured in the proposed injection area.
Decoupling of models is an advantage in that fluid simulations may include realistic topography, fine grid sizes, proper equations of state (EoS) [63] and relative permeability curves (e.g., [51]) assigned to facies [28], all within the limits of computing capacity (CPU). Considering the residence time of CO2 at the dispersive plume front, as well as the dissolution of residually trapped CO2 left behind a migrating plume, the reaction potential in the injection area and along the predicted migration path may be evaluated. The formation water salinity has negligible effect on the mineralization potential, as the moles of cations in the solid phases are several orders of magnitude larger than in the water at any time, and the aqueous phase can be regarded as merely a transporter of CO2 during the mineralization [18]. Significant mineral precipitation may retard plume migration, increase the dissolution potential, immobilize CO2 and is considered the safest trapping mechanism [2,55,56]. The reaction potential is higher in fine grained facies (because of larger reactive surface areas and higher relative fractions of cation donor minerals), which in combination with higher fractions of residual CO2 would support more efficient immobilization. With a porosity of 25%, the estimated volumetric long term trapping potential would be 55 kg CO2 per m3 reservoir.

4.4. Hydrogeochemical Trapping

Mineral and ionic trapping reactions for CO2 are often disregarded in reservoir characterization and modelling schemes, due to slow kinetics. Geochemical studies indicate, however, that the dissolution of clay and silicate minerals and the subsequent precipitation of carbonates may be significant also on time scales less than 100 years (e.g., [10,24]), and approach immobilization potentials in the same size order as dissolution in pore waters [7]. Thus, it may be argued that mineralization potential and the associated increase in dissolution potential should be taken into account in general reservoir characterization schemes.
Immobilization of CO2 enhances storage security [2]. Between two otherwise suitable reservoir candidates (e.g., high injectivity, safe cap-rock, appropriate temperature and pressure conditions), the safer option would be the more reactive reservoir setting (e.g., mineralogy, salinity, pH, temperature) providing permanent storage of CO2 through dissolution-, ionic- and mineral- trapping, disregarding near-well pore-clogging by rapid salt precipitation in this context. Geological heterogeneity may cause plume spreading, increase dissolution and immobilization potential [28,64].
De-coupling of models for transport and reactions, as proposed here, introduce challenges with regards to timing and linked processes such as aqueous speciation of CO2 and pH-changes during silicate dissolution and carbonate precipitation [56]. Furthermore, the dynamics of porosity changes due to mineral precipitation may not be incorporated [65]. However, in coupled geochemical and transport models, reservoir geometries and geological heterogeneities are not accounted for, e.g., [7], which impose the most important control factors with respect to fluid distributions (Figure 12). Fluid flow models may highlight preferential flow paths within distinct facies, bypass zones, and plume separations due to layered heterogeneities. The reactive surface area is expected to be highest in rocks of sedimentary facies with smaller average grain size and higher clay content, as well as increasing with associated lower porosities and smaller pore throats. This relation is valid only down to effective porosities <6% and associated permeabilities <100 mD [66], at which point it is no longer realistic that all pores are swept with CO2. Absolute estimations of mineralization potential by decoupled methods are not possible due to constrains of present day CPU capacity, but reservoir scale relative evaluations may be made by bulk volume calculations of residual and dissolved CO2 present in a given sedimentological facies setting at different time steps during fluid migration (Figure 12). The implementation of geological models in sensitivity studies may provide insight towards long-term reservoir behaviour.
The result shows that there is no significant difference between batch simulations using the complete reactive mineral assemblage, and the results of running separate simulations for the feldspars and chlorite and summing up the carbonatization potential (Figure 10). This indicates that pH of the simulations are also very similar, as pH strongly affects reaction rates. Such simplifications may be beneficial for running reactive-transport simulations of larger and more complex CO2 storage systems as the addition of kinetic reactions to flow simulations adds a substantial CPU load. All simulations were run at constant CO2 pressure, implying that the batch system is in communication with a CO2 source with sufficient CO2 to feed the necessary five moles required for a complete carbonatization of the feldspar-chlorite assemblage. The amount of CO2 required for a complete carbonatization at time scales when CO2 is still dominantly mobile (<100–1000 years) is about 2.5 to 3.8 moles/L Fmw (Figure 10). With a solubility of 1.28 moles/Kg Fmw in the Johansen Formation (SAFT v1 calculations: [59]), we need about 1.2 to 2.5 additional moles of CO2 per liter formation water for a complete carbonatization. This can be fed from CO2 trapped residually. The minimum volume of residual CO2 and percent residual required per liter pore water was estimated using a CO2 density of 680.13 kg/m3 [63]. The estimated amounts of residually trapped CO2 for 1.2 and 2.5 moles are then 7.2% and 13.9% respectively.

4.5. Kinetic Rate Uncertainties for Chlorite

Kinetic data used for most CO2 storage simulations are taken from Palandri and Kharaka [46]. There has, however, been generated more recent data and some experiments have also been performed at conditions more relevant to CO2 storage (i.e., relevant CO2 pressures). Because the Palandri and Kharaka [46] review has incorporated data for all feldspars of interest to CO2 storage in sedimentary basins (anorthite, Na-rich plagioclases, albite, K-feldspar), and there are no more recent studies that change the rate constants or temperature dependencies, we have here focused on the variation in data for chlorites, and the few data of Fe-rich chlorites and the total lack of data for the Fe-endmember chlorite. Only rate data from experiments at acidic conditions will be compared here as they are most relevant for CO2 storage. A summary of the compiled chlorite data is given in Table 3.
Average values from Palandri and Kharaka [46] have been estimated from the published data prior to 2004. This compilation suggests a dissolution rate constant of the Mg-endmember chlorite (clinochlore-14A) of 7.76 × 10⁻¹² mol/m2 s at pH = 0 and 25 °C (all rate constants will from here be discussed at this reference point), and with an apparent activation energy of 88.0 kJ/mol. Lowson et al. [50,67] examined the dissolution rates of an Fe-rich chlorite (molar Mg/Fe = 1.4) and found a rate constant of 1.62 × 10⁻¹⁰ mol/m2s, significantly larger than the average value listed by Palandri and Kharaka [46] for the Mg-endmember, but with a similar and even larger apparent activation energy (94.3 kJ/mol). Smith et al. [48] examined the clinochlore-14A end-member and found a rate constant comparable with [50] (1.23 × 10⁻¹⁰ mol/m2·s), but with a much smaller apparent activation energy (25.1 kJ/mol). Finally, Black and Haese [68] recently found a clinochlore-14A rate constant of 9.55 × 10⁻¹³ mol/m2·s, and with an even smaller apparent activation energy than in Smith et al. [48] (16.0 kJ/mol). In all studies, except for Black and Haese [68], a reaction order with respect to protons of about 0.5 has been found. However, the low value of 0.076 found by Black and Haese [68] was attributed to the inhibiting effect of bicarbonate on the dissolution rate, largely cancelling out the catalyzing effect of protons. It is clear that it is a large range in listed rate constants and apparent activation energies, and the work by Black and Haese [68] also suggest that CO2 and bicarbonate will significantly affect the pH dependency of the rates. It is therefore of interest to compare chlorite dissolution rates at conditions relevant for CO2 storage. The pH of a CO2 storage repository buffered by calcite dissolution is around 5 and quite independent of CO2 pressure and temperature [10,17].
The temperature varies from reservoir to reservoir. At 37 °C (e.g., the Utsira CO2 storage site), differences are only modest for the Mg-endmember, with the largest rate constants from Smith et al. [48] being approximately seven times larger than the lowest from Palandri and Kharaka [46]. The Fe-rich chlorite is at these conditions suggested to react approximately six times faster than the average found for the Mg-end-member (Table 3). At 75 °C the rate constant from Palandri and Kharaka [46], having much higher apparent activation energy, passes the value for two other studies on the Mg-chlorite. At this condition, the Palandri and Kharaka [46] rate constant is approximately 16 times that of the Black and Haese [68]. The rate constant for the Fe-chlorite, having even larger activation energy, is at 75 °C almost 100 times larger than for the average of the Mg-chlorites. This fast reactivity of the Fe-end-member fits well with studies of other Fe-rich clay minerals, such as glauconite [69], and poses a challenge in predicting the short term (<100 years) reactivity and mineral trapping potential of the Fe-chlorites, being very common in North Sea reservoirs [34,35,44,61]. The large variations in data for Mg-chlorite and the lack of data for the Fe-endmember result in a significant uncertainty in estimated dissolution rates, on top of the large uncertainties in reactive surface areas. This calls for more rate studies on chlorite dissolution, preferentially done at CO2 storage conditions (including realistic CO2 pressures).

5. Conclusions

The reactive surface area depends on grain size and shape, porosity and permeability, and varies according to sedimentary facies and diagenetic imprint. More accurate, or relevant ranges, of input values for reactive specific mineral surface areas as used in geochemical modelling of long term mineralization potential for CO2 may be estimated by combining optical, physical and chemical quantification methods, and relate mineral morphology to grain size in estimations from weight %. Implementing sedimentary facies variations in reservoir models provides for volume estimations of fluid distributions in various parts of the reservoir, which may be applied for evaluating spatial variability of mineralization potentials in CO2 storage reservoirs.
Na-plagioclase and Fe-chlorite are the main cation donors for mineral trapping of CO2 in the Johansen Formation. Reaction rates of chamosite in reservoirs ~100 °C are likely significant on shorter time scales (100’s of years), and relevant for estimation of immobilization potential and increased dissolution. The bulk reactive mineral content (feldspar and chlorite) as well as reactive surface area per weight fraction is higher in fine-grained facies. Simulations suggest that chlorites in ooids or dense aggregates may reduce the short term (<100 years) mineral trapping potential by up to 20%, compared to more reactive occurrences like grain coats. Feldspars are suggested to have the largest impact on long-term (1000–10,000 years) mineral trapping. Intact lithic fragments are less reactive, while diagenetically altered grains may be more reactive. In our geometric model, fine-grained facies have four times larger specific reactive surface areas compared to medium-grained sand, and the mineral trapping rates are correspondingly faster.

Author Contributions

A.S. and H.H. wrote, edited and reviewed the manuscript, and developed the concept, idea and methodology; H.H. performed the numerical simulations; A.S. made input for the models; A.S. handled project administration and secured funding.

Funding

This work has been partly funded by the Research Council of Norway in projects CO2 Upslope under grant # 268512 and SUCCESS under grant # 193825/S60. SUCCESS (SUbsurface CO2 storage—Critical Elements and Superior Strategy) is a consortium with partners from industry and science, hosted by Christian Michelsen Research, and is an Environment-friendly Energy Research (FME)-center assigned by the Research Council of Norway. The CO2-Upslope project: Optimized CO2 storage in sloping aquifers, is funded by the CLIMIT-programme. Gassnova SF and the Research Council of Norway collaborate on the CLIMIT-programme which finances projects within Carbon Capture and Storage (CCS).

Acknowledgments

The authors would like to thank CLIMIT and the Norwegian Research Council for funding. We acknowledge Equinor and the Norwegian Petroleum Directorate for access to sample the Johansen core, with the mineralogy presented in previously published works forming the basis for these simulations. The authors thank Equinor for sharing QemScan data from thin sections, and we appreciate discussions with C. Kruber and R. Meneguolo. We are also grateful to R. Miri, H. Dypvik, and P. Aagaard at UiO for fruitful discussions. Finally, the authors thank the two anonymous reviewers for their insightful comments.

Conflicts of Interest

The authors declare no conflict of interest. The funders had no role in the design of the study; in the collection, analyses, or interpretation of data; in the writing of the manuscript, or in the decision to publish the results.

References

  1. Bachu, S. Sequestration of CO2 in geological media: Criteria and approach for site selection in response to climate change. Energy Convers. Manag. 2000, 41, 953–970. [Google Scholar] [CrossRef]
  2. Metz, B.; Davidson, O.; De Coninck, H.; Loos, M.; Meyer, L. IPCC Special Report on Carbon Dioxide Capture and Storage; Cambridge University Press: Cambridge, UK, 2005. [Google Scholar]
  3. Michael, K.; Golab, A.; Shulakova, V.; Ennis-King, J.; Allinson, G.; Sharma, S.; Aiken, T. Geological storage of CO2 in saline aquifers—A review of the experience from existing storage operations. Int. J. Greenh. Gas Control 2010, 4, 659–667. [Google Scholar] [CrossRef]
  4. Halland, E.K.; Johansen, W.T.; Riis, F. CO2 Storage Atlas—Norwegian North Sea; Norwegian Petroleum Directorate: Stavanger, Norway, 2011. [Google Scholar]
  5. Bachu, S. Screening and ranking of sedimentary basins for sequestration of CO2 in geological media in response to climate change. Environ. Geol. 2003, 44, 277–289. [Google Scholar] [CrossRef]
  6. Benson, S.M.; Cole, D.R. CO2 sequestration in deep sedimentary formations. Elements 2008, 4, 325–331. [Google Scholar] [CrossRef]
  7. Xu, T.; Apps, J.A.; Pruess, K. Mineral sequestration of carbon dioxide in a sandstone–shale system. Chem. Geol. 2005, 217, 295–318. [Google Scholar] [CrossRef]
  8. André, L.; Audigane, P.; Azaroual, M.; Menjoz, A. Numerical modeling of fluid-rock chemical interactions at the supercritical CO2-liquid interface during CO2 injection into a carbonate reservoir, the Dogger aquifer (Paris Basin, France). Energy Convers. Manag. 2007, 48, 1782–1797. [Google Scholar] [CrossRef]
  9. Audigane, P.; Gaus, I.; Czernichowski-Lauriol, I.; Pruess, K.; Xu, T. Two-dimensional reactive transport modeling of CO2 injection in a saline aquifer at the Sleipner site, North Sea. Am. J. Sci. 2007, 307, 974–1008. [Google Scholar] [CrossRef]
  10. Pham, V.T.H.; Lu, P.; Aagaard, P.; Zhu, C.; Hellevang, H. On the potential of CO2–water–rock interactions for CO2 storage using a modified kinetic model. Int. J. Greenh. Gas Control 2011, 5, 1002–1015. [Google Scholar] [CrossRef]
  11. Balashov, V.N.; Guthrie, G.D.; Hakala, J.A.; Lopano, C.L.; Rimstidt, J.D.; Brantley, S.L. Predictive modeling of CO2 sequestration in deep saline sandstone reservoirs: Impacts of geochemical kinetics. Appl. Geochem. 2013, 30, 41–56. [Google Scholar] [CrossRef]
  12. Kampman, N.; Bickle, M.; Wigley, M.; Dubacq, B. Fluid flow and CO2-fluid-mineral interactions during CO2-storage in sedimentary basins. Chem. Geol. 2014, 369, 22–50. [Google Scholar] [CrossRef]
  13. White, A.F.; Brantley, S.L. The effect of time on the weathering of silicate minerals: Why do weathering rates differ in the laboratory and field? Chem. Geol. 2003, 202, 479–506. [Google Scholar] [CrossRef]
  14. White, A.F.; Peterson, M.L. Role of reactive-surface-area characterization in geochemical kinetic models. In Chemical modeling of aqueous systems II. ACS Symp. Ser. 1999, 416, 461–475. [Google Scholar]
  15. Lüttge, A. Etch pit coalescence, surface area, and overall mineral dissolution rates. Am. Miner. 2005, 90, 1776–1783. [Google Scholar] [CrossRef]
  16. Bolourinejad, P.; Omrani, P.S.; Herber, R. Effect of reactive surface area of minerals on mineralization and carbon dioxide trapping in a depleted gas reservoir. Int. J. Greenh. Gas Control 2014, 21, 11–22. [Google Scholar] [CrossRef]
  17. Hellevang, H.; Aagaard, P. Can the long-term potential for carbonatization and safe long-term CO2 storage in sedimentary formations be predicted? Appl. Geochem. 2013, 39, 108–118. [Google Scholar] [CrossRef]
  18. Hellevang, H.; Pham, V.T.H.; Aagaard, P. Kinetic modelling of CO2-water-rock interactions. Int. J. Greenh. Gas Control 2013, 15, 3–15. [Google Scholar] [CrossRef]
  19. Gunter, W.D.; Perkins, E.H.; McCann, T.J. Aquifer disposal of CO2-rich gases: Reaction design for added capacity. Energy Convers. Manag. 1993, 34, 941–948. [Google Scholar] [CrossRef]
  20. Perkins, E.H.; Gunter, W.D. Mineral traps for carbon dioxide. In Aquifer Disposal of Carbon Dioxide, B.; Hitchon, Geoscience Publishing: Alberta, Canada, 1996; pp. 93–113. [Google Scholar]
  21. Knauss, K.G.; Johnson, J.W.; Steefel, C.I. Evaluation of the impact of CO2, co-contaminant gas, aqueous fluid and reservoir rock interactions on the geologic sequestration of CO2. Chem. Geol. 2005, 217, 339–350. [Google Scholar] [CrossRef]
  22. Peters, C.A. Accessibilities of reactive minerals in consolidated sedimentary rock: An imaging study of three sandstones. Chem. Geol. 2009, 265, 198–208. [Google Scholar] [CrossRef]
  23. Landrot, G.; Ajo-Franklin, J.B.; Yang, L.; Cabrini, S.; Steefel, C.I. Measurement of accessible reactive surface area in a sandstone, with application to CO2 mineralization. Chem. Geol. 2018, 318, 113–125. [Google Scholar] [CrossRef]
  24. Park, J.; Baek, K.; Lee, M.; Chung, C.W.; Wang, S. The use of the surface roughness value to quantify the extent of supercritical CO2 involved geochemical reaction at a CO2 sequestration site. Appl. Sci. 2017, 7, 572. [Google Scholar] [CrossRef]
  25. Ringrose, P.; Bentley, M. Reservoir Model Design: A Practitioner’s Guide; Springer: Berlin/Heidelberg, Germany, 2014. [Google Scholar]
  26. Northern Lights: A European CO2 Transport and Storage Project. Available online: https://www.slideshare.net/globalccs/northern-lights-a-european-CO2-transport-and-storage-project (accessed on 28 October 2019).
  27. Vollset, J.; Doré, A.G. A Revised Triassic and Jurassic lithostratigraphic nomenclature for the Norwegian North Sea. Nor. Pet. Dir. Bull. 1984, 3, 1–33. [Google Scholar]
  28. Sundal, A.; Miri, R.; Ravn, T.; Aagaard, P. Modelling CO2 migration in aquifers; considering 3D seismic property data and the effect of site-typical depositional heterogeneities. Int. J. Greenh. Gas Control 2015, 39, 349–365. [Google Scholar] [CrossRef]
  29. Sundal, A.; Nystuen, J.P.; Rørvik, K.L.; Dypvik, H.; Aagaard, P. The Lower Jurassic Johansen Formation, northern North Sea–Depositional model and reservoir characterization for CO2 storage. Mar. Pet. Geol. 2016, 77, 1376–1401. [Google Scholar] [CrossRef]
  30. Marjanac, T.; Steel, R.J. Dunlin Group sequence stratigraphy in the northern North sea: A model for Cook Sandstone deposition. AAPG bulletin 1997, 81, 276–292. [Google Scholar]
  31. Dreyer, T.; Whitaker, M.; Dexter, J.; Flesche, H.; Larsen, E. From spit system to tide-dominated delta: Integrated reservoir model of the Upper Jurassic Sognefjord Formation on the Troll West Field. In Proceeding of the Petroleum Geology Conference series, London, UK, 1 January 2005; pp. 423–448. [Google Scholar]
  32. Holgate, N.E.; Jackson, C.A.L.; Hampson, G.J.; Dreyer, T. Sedimentology and sequence stratigraphy of the middle–upper Jurassic Krossfjord and Fensfjord formations, Troll Field, northern North Sea. Pet. Geosci. 2013, 19, 237–258. [Google Scholar] [CrossRef]
  33. Aagaard, P.; Jahren, J.S.; Harstad, A.O.; Nilsen, O.; Ramm, M. Formation of grain-coating chlorite in sandstones. Laboratory synthesized vs. natural occurrences. Clay Miner. 2000, 35, 261–269. [Google Scholar] [CrossRef]
  34. Ehrenberg, S.N. Preservation of anomalously high porosity in deeply buried sandstones by grain-coating chlorite: Examples from the Norwegian continental shelf. AAPG Bulletin 1993, 77, 1260–1286. [Google Scholar]
  35. Olivarius, M.; Sundal, A.; Weibel, R.; Gregersen, U.; Baig, I.; Thomsen, T.B.; Kristensen, L.; Hellevang, H.; Nielsen, L.H. Provenance and sediment maturity as controls on CO2 mineral sequestration potential of the Gassum Formation in Skagerrak. Front. Sediment. Res. 2019. in review. [Google Scholar]
  36. Van Wagoner, J.; Posamentier, H.; Mitchum, R.; Vail, P.; Sarg, J.; Loutit, T.; Hardenbol, J. An overview of sequence stratigraphy and key definitions. In Sea Level Changes—An Integrated Approach; Wilgus, C., Hastings, B., Kendall, C.G.S.C., Posamentier, H., Ross, C., Van Wagoner, J., Eds.; SEPM Special Publication: Tulsa, OK, USA, 1988; pp. 39–45. [Google Scholar]
  37. Van Wagoner, J.C.; Mitchum, R.; Campion, K.; Rahmanian, V. Siliciclastic sequence stratigraphy in well logs, cores, and outcrops: Concepts for high-resolution correlation of time and facies. In Siliciclastic Sequence Stratigraphy in Well Logs, Cores, and Outcrops: Concepts for High-Resolution Correlation of Time and Facies; American Association of Petroleum Geologists: Tulsa, OK, USA, 1990; pp. 3–55. [Google Scholar]
  38. Hillier, S. Accurate quantitative analysis of clay and other minerals in sandstones by XRD: Comparison of a Rietveld and a reference intensity ratio (RIR) method and the importance of sample preparation. Clay Miner. 2000, 35, 291–302. [Google Scholar] [CrossRef]
  39. Johnson, J.W.; Nitao, J.J.; Knauss, K.G. Reactive transport modeling of CO2 storage in saline aquifers to elucidate fundamental processes, trapping mechanisms and sequestration partitioning. In Geological Storage of Carbon Dioxide; Bains, S.J., Worden, R.H., Eds.; Geological Society Special Publications: London, UK, 2004; pp. 107–128. [Google Scholar]
  40. Deer, W.A.; Howie, R.A.; Zussman, J. Rock Forming Minerals: Layered Silicates Excluding Micas and Clay Minerals; Geological Society: London, UK, 2009. [Google Scholar]
  41. Hillier, S. Pore-lining chlorites in siliciclastic reservoir sandstones: Electron microprobe, SEM and XRD data, and implications for their origin. Clay Miner. 1994, 29, 665–680. [Google Scholar] [CrossRef]
  42. Hillier, S.; Fallick, A.; Matter, A. Origin of pore-lining chlorite in the aeolian Rotliegend of northern Germany. Clay Miner. 1996, 31, 153–171. [Google Scholar] [CrossRef]
  43. Jahren, J.; Aagaard, P. Compositional variations in diagenetic chlorites and illites, and relationships with formation-water chemistry. Clay Miner. 1989, 24, 157–170. [Google Scholar] [CrossRef]
  44. Maast, T.E. Reservoir Quality of Deeply Buried Sandstones—A Study of Burial Diagenesis from the North Sea. Ph.D. Thesis, University of Oslo, Oslo, Norway, 2013. [Google Scholar]
  45. Jahren, J.; Aagaard, P. Diagenetic illite-chlorite assemblages in arenites. I. Chemical evolution. Clays Clay Miner. 1992, 40, 540. [Google Scholar] [CrossRef]
  46. Palandri, J.L.; Kharaka, Y.K. A Compilation of Rate Parameters of Water-Mineral Interaction Kinetics for Application to Geochemical Modeling; OPEN-FILE-2004-1068; US Geological Survey: Menlo Park, CA, USA, 2004.
  47. Critelli, T.; Marini, L.; Schott, J.; Mavromatis, V.; Apollaro, C.; Rinder, T.; De Rosa, R.; Oelkers, E.H. Dissolution rates of actinolite and chlorite from a whole-rock experimental study of metabasalt dissolution from 2 ≤ pH ≤ 12 at 25 °C. Chem. Geol. 2014, 390, 100–108. [Google Scholar] [CrossRef]
  48. Smith, M.M.; Wolery, T.J.; Carroll, S.A. Kinetics of chlorite dissolution at elevated temperatures and CO2 conditions. Chem. Geol. 2013, 347, 1–8. [Google Scholar] [CrossRef]
  49. Smith, M.M.; Carroll, S.A. Chlorite dissolution kinetics at pH 3–10 and temperature to 275 °C. Chem. Geol. 2016, 421, 55–64. [Google Scholar] [CrossRef]
  50. Lowson, R.T.; Comarmond, M.-C.J.; Rajaratnam, G.; Brown, P.L. The kinetics of the dissolution of chlorite as a function of pH and at 25 °C. Geochim. Cosmochim. Acta 2005, 69, 1687–1699. [Google Scholar] [CrossRef]
  51. Bachu, S.; Bennion, B. Effects of in-situ conditions on relative permeability characteristics of CO2-brine systems. Environ. Geol. 2008, 54, 1707–1722. [Google Scholar] [CrossRef]
  52. Morad, S. Feldspars in sedimentary rocks. In Encyclopedia of Sediments and Sedimentary Rocks; Middleton, G.V., Church, M.J., Coniglio, M., Hardie, L.A., Longstaffe, F.J., Eds.; Springer: Berlin/Heidelberg, Germany, 2003. [Google Scholar]
  53. Aagaard, P.; Egeberg, P.K.; Saigal, G.C.; Morad, S.; Bjørlykke, K. Diagenetic albitization of detrital K-feldspars in Jurassic, Lower Cretaceous and Tertiary clastic reservoir rocks from offshore Norway; II, Formation water chemistry and kinetic considerations. J. Sediment. Res. 1990, 60, 575–581. [Google Scholar] [CrossRef]
  54. Warren, E.A.; Smalley, P.C. North Sea formation waters atlas. Oceanogr. Lit. Rev. 1995, 6, 471. [Google Scholar]
  55. Bachu, S.; Gunter, W.D.; Perkins, E.H. Aquifer disposal of CO2: Hydrodynamic and mineral trapping. Energy Convers. Manag. 1994, 35, 269–279. [Google Scholar] [CrossRef]
  56. Wawersik, W.R.; Rudnicki, J.W.; Dove, P.; Harris, J.; Logan, J.M.; Pyrak-Nolte, L.; Orr, F.M.; Ortoleva, P.J.; Richter, F.; Warpinski, N.R.; et al. Terrestrial sequestration of CO2: An assessment of research needs. Adv. Geophys. 2001, 43, 97–177. [Google Scholar]
  57. Parkhurst, D.L.; Appelo, C.A.J. Description of Input and Examples for PHREEQC Version 3: A Computer Program for Speciation, Batch-Reaction, One-Dimensional Transport, and Inverse Geochemical Calculations; U.S. Geological Survey: Reston, VA, USA, 2013; pp. 1–497.
  58. Hellevang, H.; Declercq, J.; Kvamme, B.; Aagaard, P. The dissolution rates of dawsonite at pH 0.9 to 5 and temperatures of 22, 60 and 77 °C. Appl. Geochem. 2010, 25, 1575–1586. [Google Scholar] [CrossRef]
  59. Hellevang, H.; Aagaard, P.; Jahren, J. Will dawsonite form during CO2 storage? Greenh. Gases: Sci. Technol. 2014, 4, 191–199. [Google Scholar] [CrossRef]
  60. Tambach, T.J.; Hellevang, H. Discussion on the paper titled “Effect of reactive surface area of minerals on mineralization and carbon dioxide trapping in a depleted gas reservoir” by Bolourinejad et al. (2014). Int. J. Greenh. Gas Control 2015, 100, 141–143. [Google Scholar] [CrossRef]
  61. Sundal, A.; Hellevang, H.; Miri, R.; Dypvik, H.; Nystuen, J.P.; Aagaard, P. Variations in mineralization potential for CO2 related to sedimentary facies and burial depth–a comparative study from the North Sea. Energy Procedia 2014, 63, 5063–5070. [Google Scholar] [CrossRef]
  62. Förster, A.; Schöner, R.; Förster, H.J.; Norden, B.; Blaschke, A.W.; Luckert, J.; Beutler, G.; Gaupp, R.; Rhede, D. Reservoir characterization of a CO2 storage aquifer: The Upper Triassic Stuttgart Formation in the Northeast German Basin. Mar. Pet. Geol. 2010, 27, 2156–2172. [Google Scholar] [CrossRef]
  63. Miri, R.; Aagaard, P.; Hellevang, H. Examination of CO2-SO2 solubility in water by SAFT1. Implications for CO2 transport and storage. J. Phys. Chem. 2014, 118, 10214–10223. [Google Scholar] [CrossRef]
  64. Hovorka, S.D.; Doughty, C.; Benson, S.M.; Pruess, K.; Knox, P.R. The impact of geological heterogeneity on CO2 storage in brine formations: A case study from the Texas Gulf Coast. Geol. Soc. 2004, 233, 147–163. [Google Scholar] [CrossRef]
  65. Gaus, I. Role and impact of CO2-rock interactions during CO2 storage in sedimentary rocks. Int. J. Greenh. Gas Control 2010, 4, 73–89. [Google Scholar] [CrossRef]
  66. Bachu, S. Drainage and Imbibition CO2/Brine Relative Permeability Curves at in Situ Conditions for Sandstone Formations in Western Canada. Energy Procedia 2013, 37, 4428–4436. [Google Scholar] [CrossRef]
  67. Lowson, R.T.; Brown, P.L.; Comarmond, M.C.J.; Rajaratnam, G. 2007. The kinetics of chlorite dissolution. Geochim. Cosmochim. Acta 2007, 71, 1431–1447. [Google Scholar] [CrossRef]
  68. Black, J.R.; Haese, R.R. Chlorite dissolution rates under CO2 saturated conditions from 50 to 120 °C and 120 to 200 bar CO2. Geochim. Cosmochim. Acta 2014, 125, 225–240. [Google Scholar] [CrossRef]
  69. Aagaard, P.; Oelkers, E.H.; Schott, J. Glauconite dissolution kinetics and application to CO2 storage in the subsurface. Geochim. Cosmochim. Acta 2004, 68, A143. [Google Scholar]
Figure 1. The Johansen Formation is a prospective CO2 storage reservoir offshore of Norway, located at burial depths of ca. 2100–3200 m. The operating hydrocarbon field “Troll” (yellow) is located north of the licensed CO2 injection area “EL001”. The cored well 31/2-3 is marked in red, and additional wells with wire line data from the Johansen Formation are marked as black dots. There are no well data available from EL001 as of yet, while an appraisal well is planned [26]. Source data are available at factmaps.npd.no, with suggested injection area and depth maps as shown in [29].
Minerals 09 00671 g001
Figure 2. (a) Simplified sedimentary facies distributions for the Johansen Formation. Mineralization potential for the reservoir intervals are given for upper and lower shoreface sandstones; (b) an interpreted lithological log (vertical section through the sandy Johansen Formation with the muddy over- and underlying Amundsen Formation) from well 31/2-3: based on wire line log data (available at npd.factpages.no), cuttings, and a short cored section (2116–2134 m) from which rock samples were collected. The succession consists of prograding and aggrading parasequences of upper and lower shoreface deposits, with mudstones representing flooding events. Carbonate cemented sandstone layers may form within or on the top of beds due to dissolution and re-precipitation of calcareous material (e.g., shells). These layers are close to impermeable, and provide barriers to fluid flow in otherwise permeable reservoir sandstone. Generally, micro-scale observations from the different facies settings show that total grain surface area in contact with pore water (white void) increases with decreasing grain size.
Minerals 09 00671 g002
Figure 3. Chlorite solid solutions and occurrence: (a) Modelled X-ray diffraction pattern by use of Newmod II, showing a fit with typical chlorites found in a potential CO2 reservoir in the North Sea; the Johansen Formation. The best fit was found for a Fe2.34 chamosite, with a Fe/(Fe+Mg) ratio of 0.93; (b) Scanning electron microscope image of grain coating chlorite from laboratory experiments of daphnite growth (yellow colour applied for reference). Individual crystals are half disk-shaped, growing perpendicular to the host grain surface, ranging in size from 2–15 µm; (c) Scanning electron microscope image of ooidal chlorite. Crystal growth occurs in dense, concentric layers around a nucleus grain, which has been dissolved in this case. Grain coating chlorite covers the surface of framework quartz grains. Ghost rims of chlorite coats remain where the framework grain has been dissolved.
Minerals 09 00671 g003
Figure 4. Feldspar occurrences and elemental mapping: (a) Scanning electron micrograph of K-feldspar grain with spiky, euhedral overgrowths. Note the compositional change across the outline of the original, detrital grain. The autigenic component is pure microcline, compared to the detrital K-feldspar grain with more heavy elements; (b) feldspar perthite grain (scanning electron micrograph). The albite component (dark colour) is partly dissolved, while microcline (light colour) is preserved. This grain is likely to display large mineral surface area compared with average grain sizes; (c) mineral maps from Scanning Electron Microscopy (QemScan analysis, Equinor—by C. Kruber), showing the relative volume fractions of the main mineral constituents. Corresponding wt% from XRD (Rietveld) are: 10 wt% K-felspar, 6 wt% Albite, and 2 wt% chlorite in this f-m grained sandstone (2125.4 m), and 12 wt% K-felspar, 5 wt% Albite and 9 wt% chlorite in this very fine grained sandstone (2129.3 m).
Minerals 09 00671 g004
Figure 5. Parameterization of reactive surface areas: (a) Examples of grain geometries in relation to specific and reactive surface areas. For platy clay minerals Sr << Si, as reactions only occur along the edges; (b) Grain size distribution curves for typical lower (finer) and upper (coarser) shoreface facies. The small amounts of clay in reservoir sandstone and small amounts of available sample material makes separate clay analysis for detailed speciation difficult. Note that if disaggregating samples to analyse the clay fraction separately in XRD, a large part of the reactive phase may sort as sand (e.g., chamosite grain coats and ooids). Bulk XRD for the same samples show 6–9 wt% chlorite; (c) Reactivity quantification may be performed on bulk XRD data if typical mineral occurrences are described (vol %), and reactive surface area assigned. Example from the Johansen Formation: plagioclase, K-feldspar, chamosite, sorted from right to left according to reactivity in sand and clay fractions, respectively. Occurrence affecting reactive surface area is related both to sedimentary facies and diagenetic alterations (e.g., altered perthites).
Minerals 09 00671 g005
Figure 6. Simulated dissolution of chlorite (chamosite) (e.g., Johansen Formation, 96 °C, 300 bar CO2); where chlorite was separated into two parts: (1) highly reactive pore filling/grain coating chlorite with large reactive surface area (1 μm grains); and (2) low-reactive ooids (125 μm aggregates where reactions are only assumed on the aggregate surface). Up to 20% chlorite in ooids was simulated.
Minerals 09 00671 g006
Figure 7. Simulated chlorite dissolution (a), and corresponding secondary carbonate formation and pH (dotted curve) evolution (b), for 100 years of CO2-chlorite interactions with initial materials consisting of 20% chlorite as ooids, and the remaining fraction as high-reactive pore-filling or grain-coating materials.
Minerals 09 00671 g007
Figure 8. Simulated feldspar dissolution of equal wt% feldspars for (a) very fine grained sand, and (b) medium-grained sand. Feldspars were divided into perthitic K- and Na-feldspars, K-feldspar and plagioclase in lithic fragments, and detrital plagioclase grains; (c) micrographs from corresponding facies in the Johansen Formation: very fine grained and medium grained sandstones. Pore space is filled with blue epoxy; (d) amount of dawsonite that forms from feldspar dissolution for very fine grained and medium grained sand lithologies. The two cases correspond to (a) and (b) (this figure).
Minerals 09 00671 g008
Figure 9. The amount of dawsonite formed with varying amount of plagioclases lithic rock fragments (low-reactive) or as separate detrital crystals (high-reactive) over (a) 100 years, and (b) 10,000 years.
Minerals 09 00671 g009
Figure 10. Amount of CO2 stored in secondary carbonates (mol/L fmw) in simulations only taking into account either feldspars or chlorites, and compared to the results in coupled simulations taking into account both feldspars and chlorites. No/little difference suggests that pH is the same in both cases. The motivation to run separate simulations is to save time in more complex large-scale reactive transport simulations.
Minerals 09 00671 g010
Figure 11. Workflow for estimating mineralization potentials specific to sedimentary facies and mineral occurrence in reservoir characterization.
Minerals 09 00671 g011
Figure 12. Fluid distribution relative to sedimentary facies with different mineralization potentials: (A) Interpreted facies distribution related to porosity class and interpreted from seismic attribute analysis (acoustic impedance). Upper shoreface (high porosity and permeability) in dark yellow, lower shoreface (intermediate porosity and permeability) in light yellow. Non-reservoir siltstones and mudstones in green and grey. Model described in [28]; (B) fluid distribution at 100 years, after 50 years of injection 3 Mt/y CO2 through a well perforated in the lower half of the reservoir. In this case 16% of CO2 was dissolved, 38% residually trapped [28].
Minerals 09 00671 g012
Table 1. Aqueous solution input for kinetic simulation.
TpHNaKCaMgFeAlClAlkSiOO2
°C ppmppmppmppmppmppmppmmeqppmppmLog P
965.975441138905301 × 10−813,1872931 × 10−41 × 10−3−50
Table 2. Kinetic data.
Minerallog k+ T = 25 pH = 0Ea+ (1)N (2)log k- (3)Ea-
Albite −10.265.00.46log k+ −2Ea+
Oligoclase−9.765.00.46log k+ −2Ea+
K-feldspar−10.152.00.5log k+ −2Ea+
Chamosite 7A−9.822.00.53log k+ −2Ea+
Quartz/ChalcedonyEQUIL Ea+
CalciteEQUIL Ea+
KaoliniteEQUIL Ea+
Dawsonite(4)−4.563.80.98log k+ −2Ea+
Siderite−7.548.00.94log k+ −2Ea+
Ankerite (5)−3.256.70.5log k+ −2Ea+
(1) Apparent activation energy (kJ/mol) for dissolution, listed in [46]; (2) Reaction order with respect to protons [46]; (3) Growth rate constants at 25 °C (mol/m2 s). pH dependencies are unknown and neglected for growth; (4) Rate coefficient at 25 °C and pH = 0 (mol/m2 s), apparent activation energy and reaction order with respect to protons from [58]; (5) Lacks data and set to the same as dolomite [46].
Table 3. Kinetic data for chlorites.
StudyCO2 (1)pHTlog k (2)Ea N (3)log k log k
range°C (kJ/mol) at 37 °C, pH 5at 75 °C, pH 5
Clinochlore-14A0Acidic–11.188.00.5–13.0–10.6
Fe-rich (Mg/Fe = 1.4)0Acidic25–95–9.894.30.49–11.6–9.1
Clinochlore-14A0.1–0.5 M3.0–5.7100–275–9.925.10.49–12.2–11.5
Clinochlore-14A120–200 M 3.5–5.450–120–12.016.00.076–12.3–11.9
(1) Experimental CO2 molar concentration (denoted with an ‘M’ after the value) or CO2 pressure. (2) Rate constant k (mol/m2s) at pH = 0 and 25 °C, assuming a rate equation of the form R = kSaH+n(1 − Ω) (see Palandri and Kharaka, 2004 [46]). (3) Rate order with respect to the proton activity.

