1. Introduction
With global demand for raw materials steadily increasing, large exploration investments are required to discover the ore deposits needed to satisfy the demand. Exploration includes thousands of kilometres of diamond drill-cores that are obtained to test subsurface regions with high mineral resource potential. The drilling consists of the extraction of cylindrical core samples, which are traditionally analysed visually by on-site geologists and subjected to geochemical analyses [
1,
2]. These methods are slow, and the mineralogical information extracted from the cores is limited and usually influenced by the subjectivity of the observer. During the last decade, hyperspectral imaging techniques have been increasingly used to complement traditional logging methods and provide fast, efficient, and unbiased means of extracting valuable compositional information [
3,
4,
5,
6]. However, most existing hyperspectral data processing tools only target the compositional mineralogical information and not the spatial distribution and geometry of minerals comprising the ore. For this purpose, a workflow integrating the analysis of mineral abundance with mineral spatial distribution is proposed in this paper.
Common hyperspectral sensors cover the visible to near-infrared (VNIR) and short-wave infrared (SWIR) regions of the electromagnetic spectrum. In these ranges, specific absorption features allow the identification of common mineral groups such as phyllosilicates, amphiboles, iron oxides and hydroxides, carbonates and hydrated sulphates, phosphates and arsenates [
7]. Several of these mineral groups are associated with hydrothermal alteration and are known to occur in different mineral systems [
8]. They are commonly used as proxies for mineralization vectoring [
9,
10,
11] making their identification key to the discovery and mapping of mineral exploration targets.
Several techniques have been proposed in the literature for the analysis of hyperspectral drill-core data and mineral mapping [
1,
5,
6,
12,
13,
14,
15,
16]. Among these, band ratios and minimum wavelength maps are useful tools for the evaluation and visualisation of the relative abundance of chemical groups characteristic for specific minerals [
17,
18,
19,
20,
21]. Another approach for mineral mapping consists of the use of the spectral angle mapper (SAM), a classifier which works based on the similarity measure between an unknown spectrum and reference spectra. The reference spectra are acquired from either spectral libraries or from endmembers, for instance, obtained by the pixel purity index method followed by the n-Dimensional visualiser [
22]. This approach is widely used due to the availability of the algorithms in common software such as ENVI (Exelis Visual Information Solutions, Boulder, CO, USA). Although the aforementioned mineral mapping tools can provide good results, batch implementation is difficult, as it requires extensive human interaction.
While progress has been made on (semi-)automated mineral mapping, few studies have addressed the identification and extraction of structural features. Yet, this kind of analysis is particularly relevant for vein-type mineralization such as encountered in porphyry style deposits [
23,
24]. The characterization of alteration halos, both in terms of width and composition, is critical for assessing the mineralization/alteration stage. The composition of the pervasive alteration and the vein halos also represents an indicator on the location of the sample within the mineralized system as well as on the expected vein composition in terms of ore mineralogy. Wang et al. [
2] used a seeded region growing method combining a similarity and homogeneity analysis of optical data (unmixing of short-wave infrared spectra and RGB 3-band natural-colour imagery) with an edge map to extract quartz and carbonate veins. The results cover the extraction of predefined vein types and do not include their orientation, which for the mapping and modelling of a porphyry-style mineral system would be a key attribute.
In the last two decades, a broad variety of methods has been proposed to extract linear features from images. The most commonly used approaches are based on edge detection algorithms, which identify discontinuities in greyscale images (e.g., [
25], and references therein). These methods have been widely used in Earth sciences to extract structural features such as faults scarps and lineaments, but are often difficult to apply to the extraction of structural entities such as veins. Edge detection methods perform poorly when the edges of the object are smooth (i.e., gradual transitions from vein alteration halo to matrix) and are very susceptible to noise. An alternative approach relies on ridge detection algorithms (e.g., [
26], and references therein). While the purpose of edge detectors is to extract the boundary of an object, ridge detection makes it possible to identify the major axis of symmetry of an elongated object using the curvature associated with the brighter or darker components in a greyscale image. These algorithms make it possible to specifically target the linear components of an image and have been broadly used in various fields such as medical sciences and geographic information sciences to extract curvilinear features such as blood vessels [
27,
28] and road or drainage networks [
29].
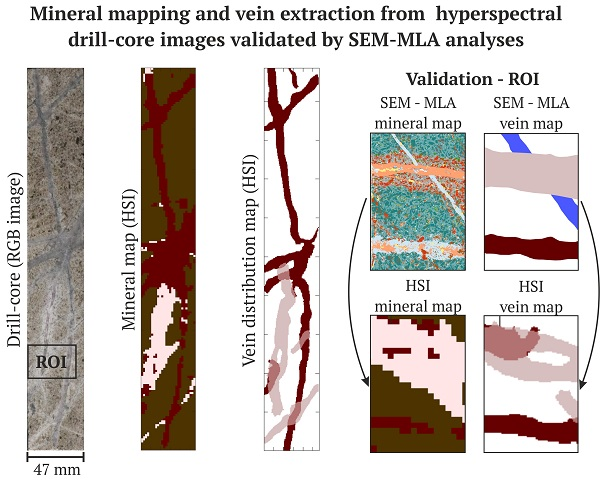
In this paper, a workflow that enables extraction of both the mineralogical and structural information from drill-core samples is developed and tested. The approach combines hyperspectral data analysis and image processing techniques. The workflow consists of three main steps: (1) endmember extraction and spectral unmixing, followed by (2) mineral mapping, and (3) vein extraction. The results provide mineral maps illustrating the distribution of the main mineral assemblages and vein distribution maps including the composition, calculated abundance and azimuth of different vein-types. This type of information can become a valuable tool for exploration. For vein-hosted mineralization, the identification of the vein composition and density and the assessment of the abundance of different vein types can represent key parameters to be used in ore body modelling and evaluation.
The workflow performance is assessed based on three selected samples from the Bolcana porphyry-copper gold project in Romania. The samples were collected from typical alteration zones at different depths in order to showcase different vein compositions and structures. The validation is achieved based on high resolution mineralogical analyses of thin sections using a Scanning Electron Microscopy (SEM) equipped with the Mineral Liberation Analyzer (MLA) software [
30].
2. Test Site
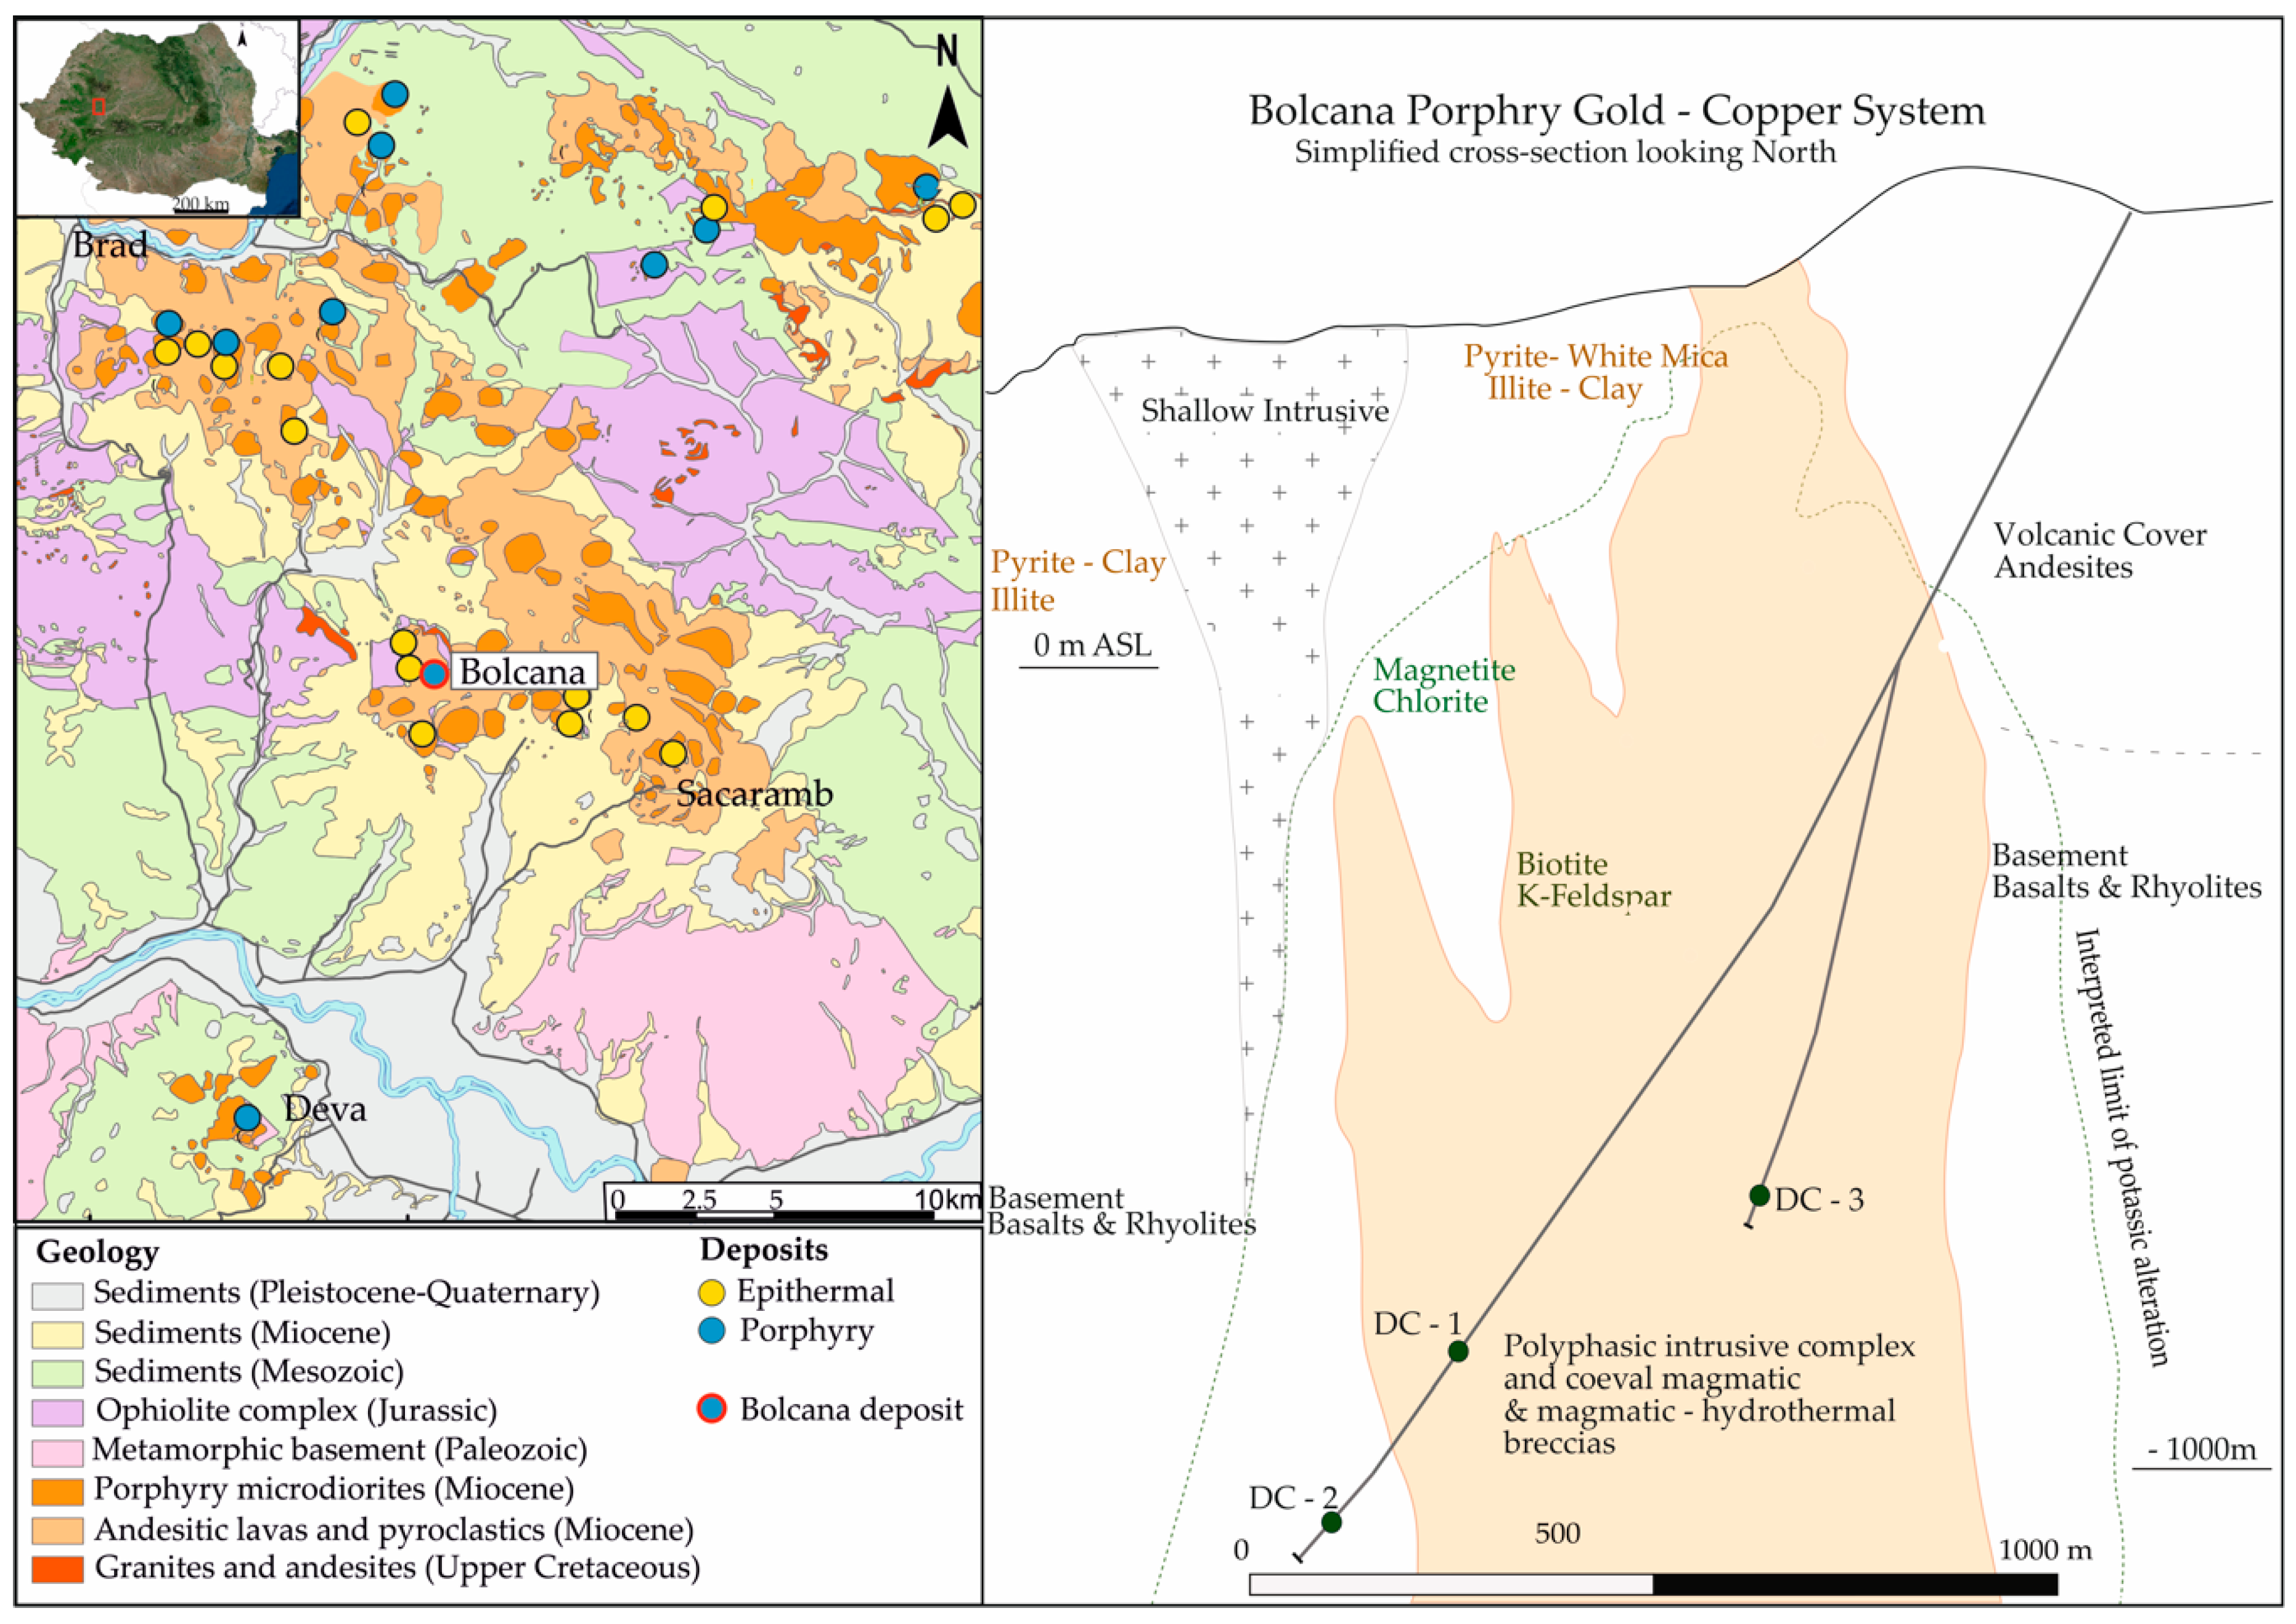
The Bolcana copper-gold mineralized system is located in the Brad-Sacaramb metallogenic district within the Golden Quadrilateral in South Apuseni Mountains, Romania (
Figure 1). The Golden Quadrilateral hosts around 20 porphyry-type deposits and represents Europe’s largest epithermal Au-Ag-Te province. The region is also one of Europe’s most important porphyry Cu–Au provinces [
31,
32,
33]. The mineralization in the Golden Quadrilateral is conditioned by the emplacement of Neogene volcanic rocks, mainly between 14.9 and 9 Ma [
34,
35,
36,
37]. The main direction of the distribution of the ore deposits follows an ESE-trending, dextral, strike-slip fault system [
36]. Here, the basement consists of Middle Jurassic–Lower Cretaceous basaltic andesites, basaltic lava flows and pyroclastics, and Lower Cretaceous rhyolite overlain by Paleocene and Miocene sedimentary series. Neogene volcanic and subvolcanic bodies are intruding the basement and Paleocene sedimentary units.
Bolcana is a porphyry-type Cu–Au ore deposit with associated epithermal veins hosted by the Bolcana microdioritic subvolcanic body. The mineralization is represented by chalcopyrite, bornite, chalcocite, covellite, pyrite, magnetite, hematite, molybdenite. The gold is predominantly present as fine inclusions in the copper sulphides. The mineralized body shows a large extension at depth being characterized by a large potassic core with a wide transition to sodic-calcic alteration. The transition is characterized by the presence of chlorite as the main pervasive alteration phase [
38].
3. Data Acquisition
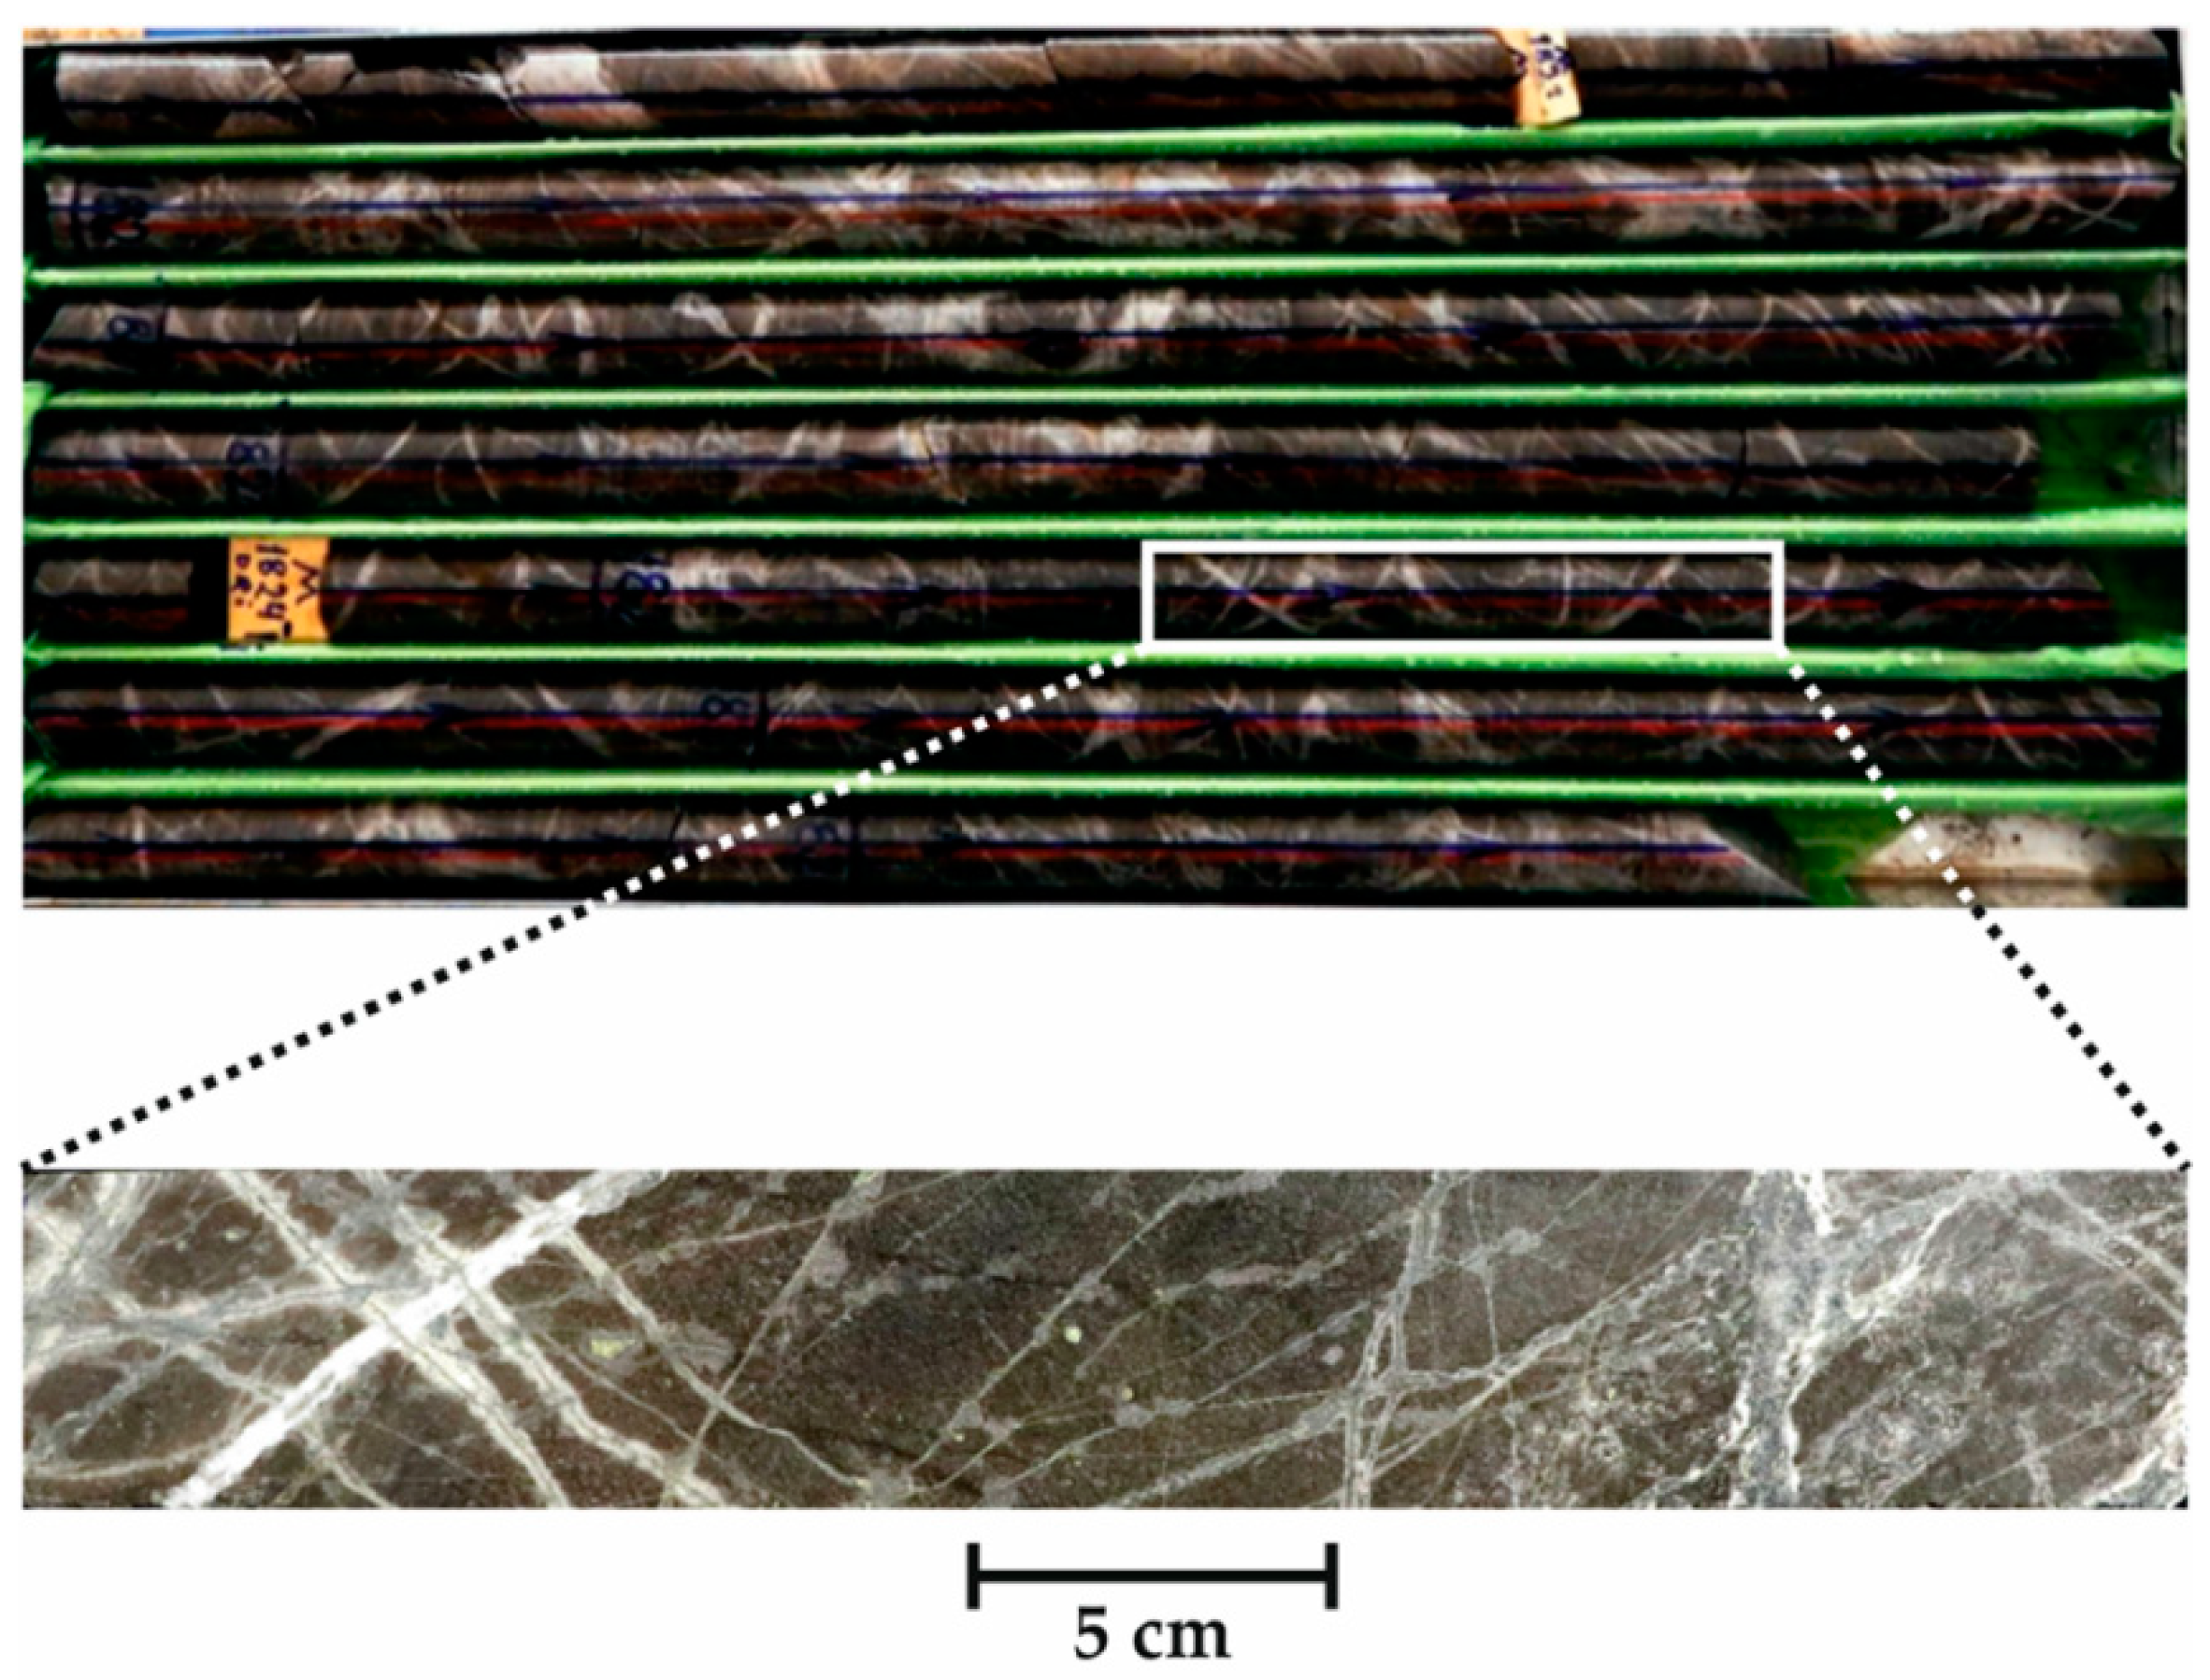
Three drill-core samples (here labelled DC-1, DC-2 and DC-3), which show variability in terms of pervasive alteration and vein types, were selected for testing of the proposed workflow. The drill-core samples were collected from the potassic, sodic-calcic and intermediate zones of the Bolcana porphyry copper-gold prospect. The samples are representative in terms of vein and alteration styles for a larger drill-core interval (
Figure 2). The three samples described in the current work consist of half cores. The analysed surfaces have 47 mm width for all samples and lengths around 290 mm. The drill-cores were selected from intervals of uniform appearance based on visual observations by a specialist. The presence of different vein types in terms of composition and thickness was also considered in the sampling.
3.1. Hyperspectral Drill-Core Scanning
The hyperspectral data was acquired using a SisuROCK drill-core scanner (Spectral Imaging Ltd., Oulu, Finland) equipped with an AisaFENIX VNIR-SWIR hyperspectral sensor (Spectral Imaging Ltd., Oulu, Finland). The sensor specification and chosen settings are listed in
Table 1. The spatial resolution of the resulting hyperspectral scans is 1.5 mm/pixel.
The conversion to reflectance was performed with the acquisition software (LUMO Scanner version 2018-5, Spectral Imaging Ltd., Oulu, Finland) using PTFE reference panels (>99% VNIR and >95% SWIR). For the pre-processing, the scans of the selected core samples were corrected and averaged using the MEPHySTo toolbox [
39]. A correction was applied between the VNIR and SWIR sensors to compensate for the spatial shift and a geometric correction was used to neutralize the lens effect. The corrected hyperspectral data were smoothed using the Savitzky-Golay (SavGol) filter [
40] in order to correct for the noise present particularly at the beginning of the spectrum in the VNIR. The smoothing was considered necessary, as noise in this region of the spectrum would otherwise strongly influence the performance of the endmember extraction algorithms. After testing different parameters, a radius of 5 and a 3rd degree polynomial were used for the SavGol filter.
3.2. SEM-MLA
Regions considered representative for the entire core samples were cut and prepared into 25 mm × 40 mm thin sections and further analysed with scanning electron microscopy. The sample preparation consisted of grinding and polishing of the sample surface. This leads to the removal of a small fraction of the material of a thickness up to 0.5 mm. The change in analysed surface causes a small shift in the location of the veins, but for the current purpose it is considered neglectable.
Quantitative mineralogical data were collected from each thin section using an automated approach [
30,
41]. The analyses were performed using a Mineral Liberation Analyser (MLA) equipped with a FEI Quanta 650 F field emission SEM (FEI, Hillsboro, OR, USA) with two Bruker Quantax X-Flash 5030 energy-dispersive X-ray (EDX) detectors (Bruker, Billerica, MA, USA). Backscattered electron (BSE) images are used to define mineral grains. BSE images are greyscale images, in which the greyscale level ranges from 0–255 according to the average atomic number (AAN) of the elements comprising a mineral/phase. Lower AAN values correspond to darker grey appearance and indicate that minerals comprise of light elements (in this case, for example, quartz and silicates). Brighter grey shades, in contrast, reflect higher AAN values, and indicate minerals comprised of elements with high atomic weight (e.g., native gold). Mineral grains were discriminated based on their grayscale level in the BSE images and then identified by performing EDS X-ray measurements on a closely spaced grid. The operating conditions used for SEM and MLA are listed in
Table 2.
Data processing was carried out using the MLA Suite software package (version 3.1.4.686, FEI, Hillsboro, OR, USA) (MLA Image Processing, MLA Mineral Reference Editor and MLA Dataview). The mineral reference editor was used in online mode in order to complete the mineral list required for the classification of the tested samples. MLA Image Processing software was used for preliminary corrections of data, such as frame edge removal, and for further processing steps. The first processing step consists of the spectral classification with a spectrum matching threshold of 90% and a low count threshold of 2000 counts. Two touch-up scripts were used in order to assign the glass spectrum from voids to the background and to assign minerals with a grain size lower than 4 μm to the host mineral.
4. Methods
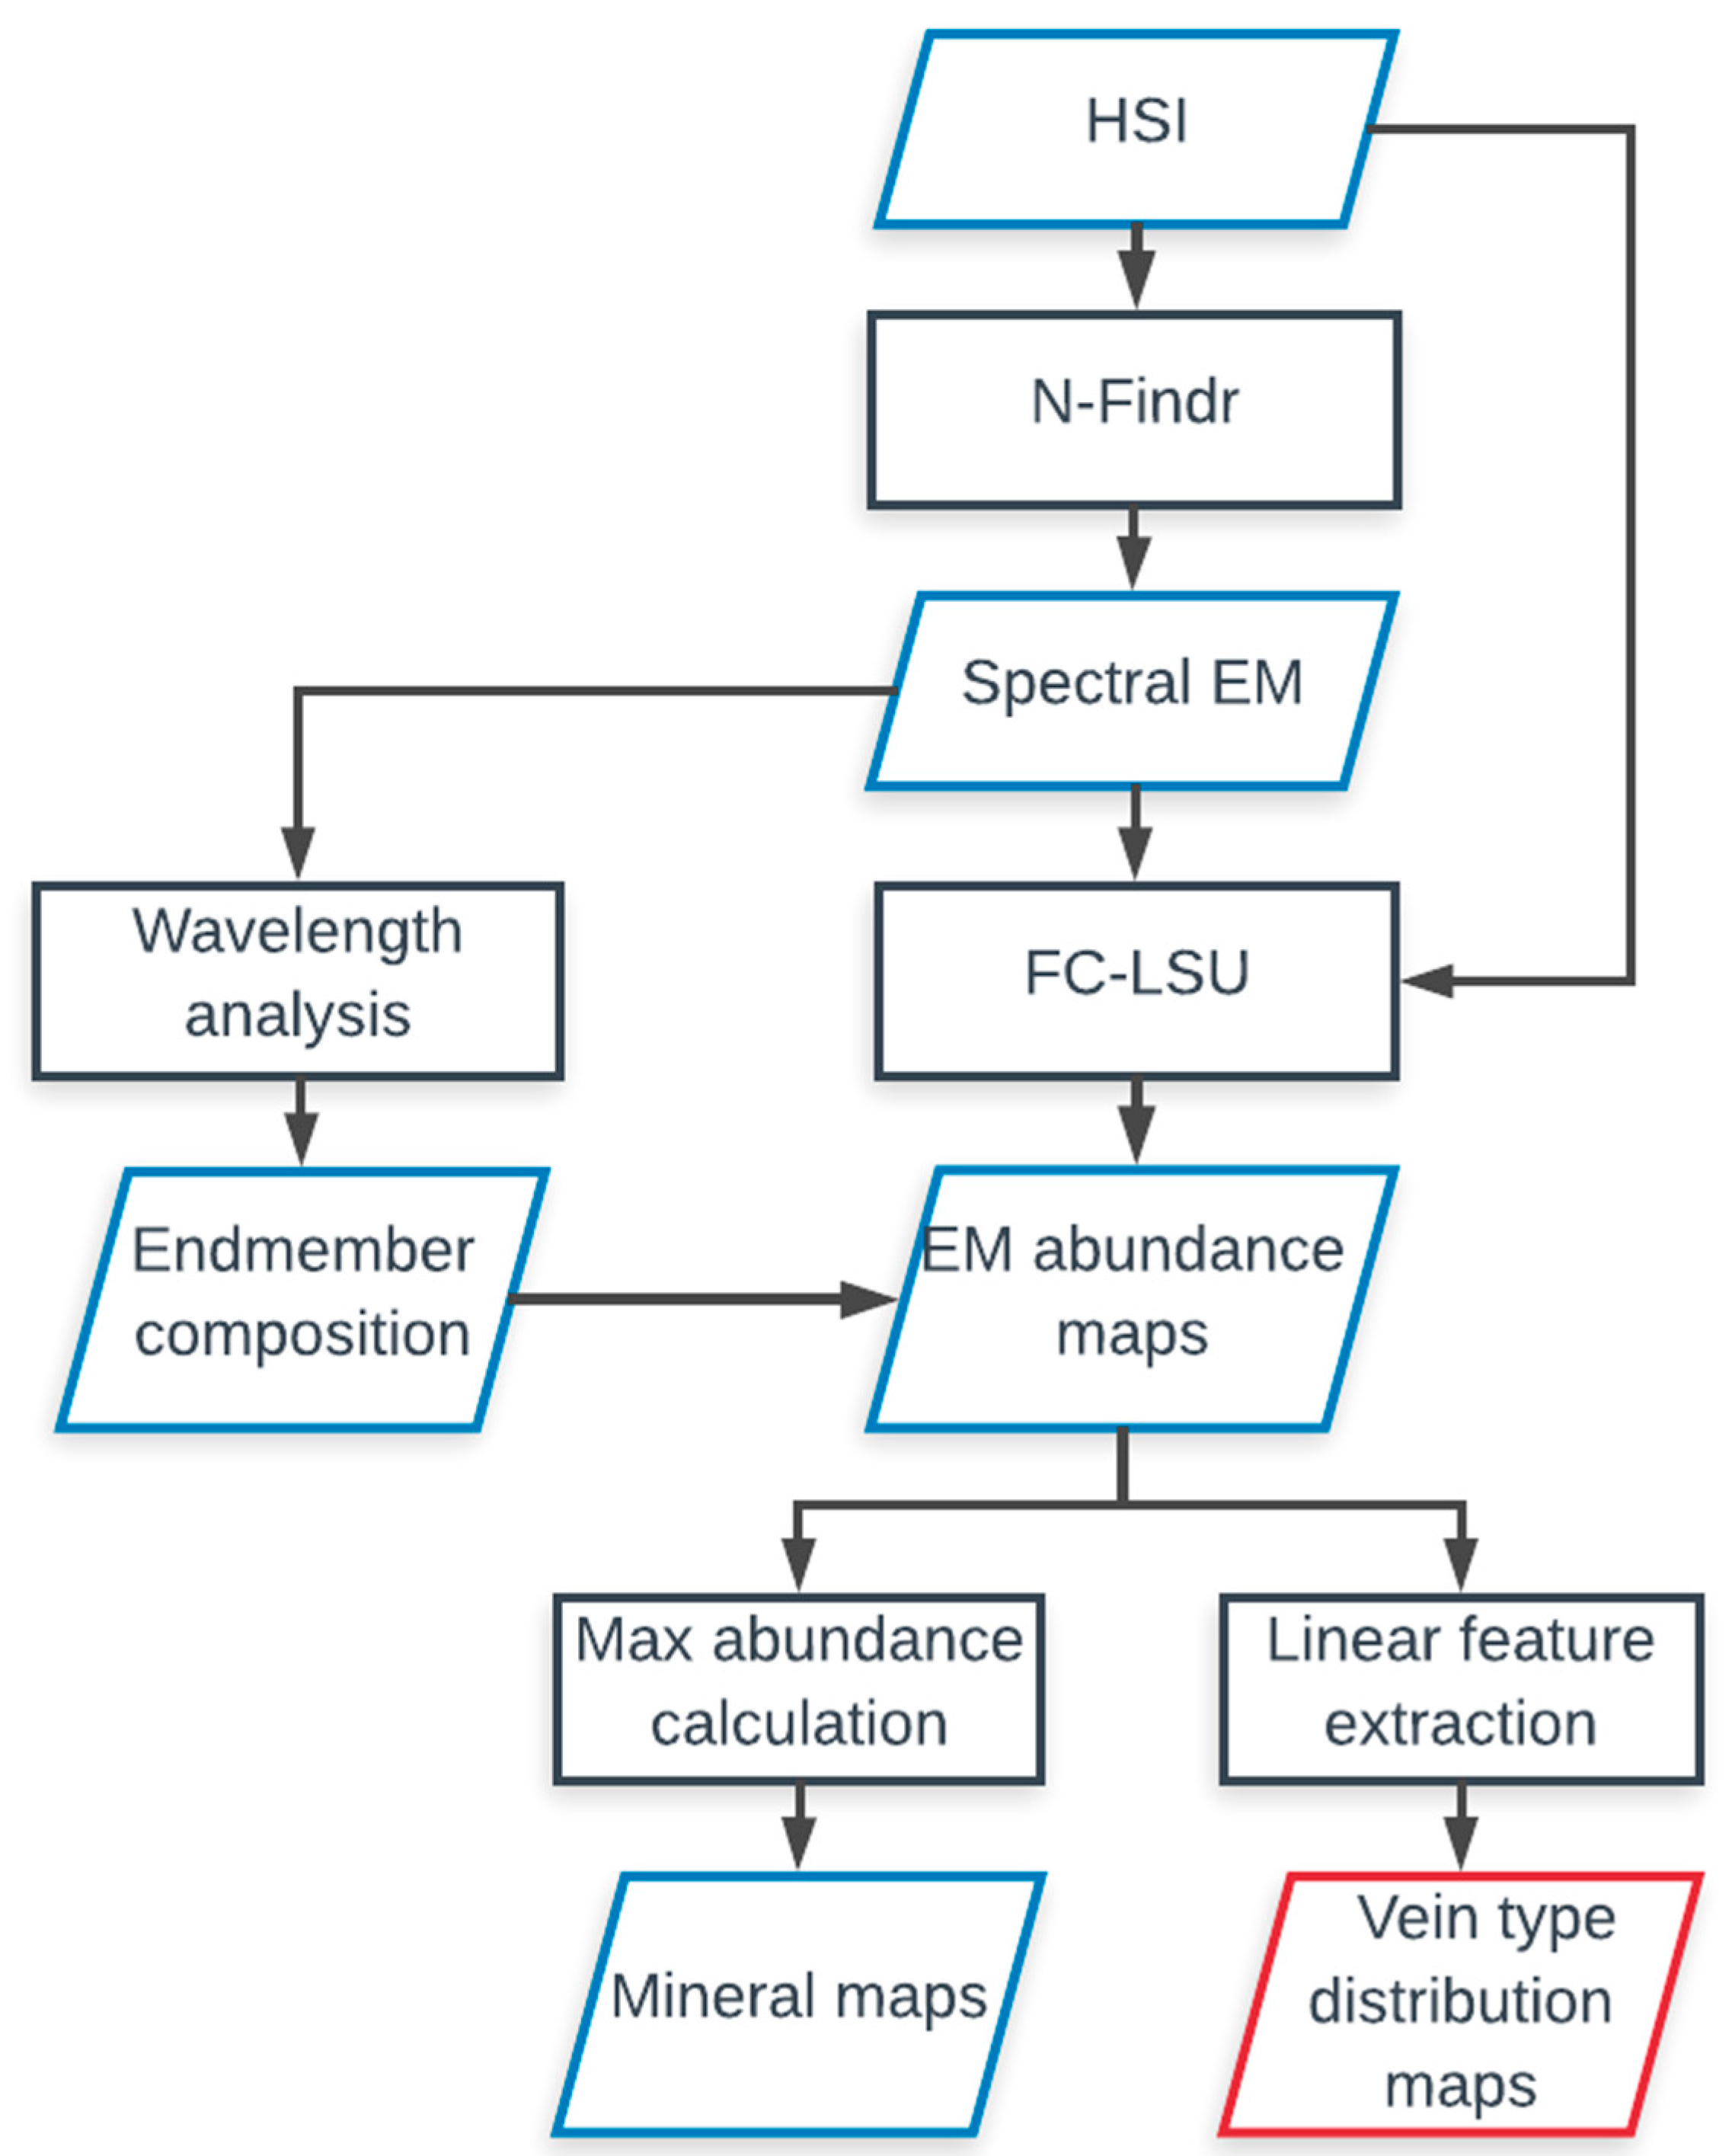
The proposed methodology includes a parallel workflow consisting of mineral mapping on one side and extraction of linear features, here veins, on the other (
Figure 3). Additional tools are used for endmember analysis, mineral chemistry and abundance mapping.
4.1. Mineral Mapping
The first step of the proposed technique consists of endmember extraction. Several algorithms for endmember extraction were tested. Among all tested methods, the N-Findr algorithm proved to give the best results with the current dataset and is thus used in the current study. This method assumes that the N-volume contained by a simplex formed by the purest pixels in a dataset is larger than any other potential volume formed from other selected combinations [
42,
43]. Virtual dimensionality estimation techniques are known to be used for the estimation of the appropriate number of endmembers in hyperspectral data. An attempt to implement these techniques was made. However, results yielded a higher number of endmembers than minerals actually present according to the previous knowledge of the samples (petrographic observations and validation data). The choice of three endmembers for each of the selected drill-cores proves to be appropriate considering the variability within the samples. The endmember spectra are then subjected to wavelength analyses in different ranges in order to identify the main occurring SWIR active minerals such as white mica, chlorite group minerals, gypsum, biotite, phlogopite, amphiboles and carbonates. SWIR inactive phases such as some rock-forming minerals (e.g., quartz, feldspars, pyroxenes) or sulphides cannot be identified with the spectral ranges used. For the purpose of defining veins with specific alteration halos, consisting dominantly of SWIR active minerals; however, the used sensors provide the necessary information. The selected minerals are identified based on the depth of their specific absorption features. The location of the minima in the selected spectral ranges indicates the presence or absence of a specific mineral as well as the relative chemical variation within specific mineral groups.
The obtained endmembers are used for unmixing to develop mineral abundance maps. The fully constrained linear spectral unmixing (FC-LSU) method is used for this purpose based on the consideration of a linear contribution of each mineral within the pixel. The method is based on the hypothesis that meaningful endmember fractions must respect two constraints: they must sum up to one and they must be nonnegative. The fractional contribution of each endmember is then calculated through an inversion of the linear model [
44,
45]. Once the endmember abundance maps are obtained, each pixel is classified corresponding to the maximum abundance of the endmembers.
4.2. Vein Extraction
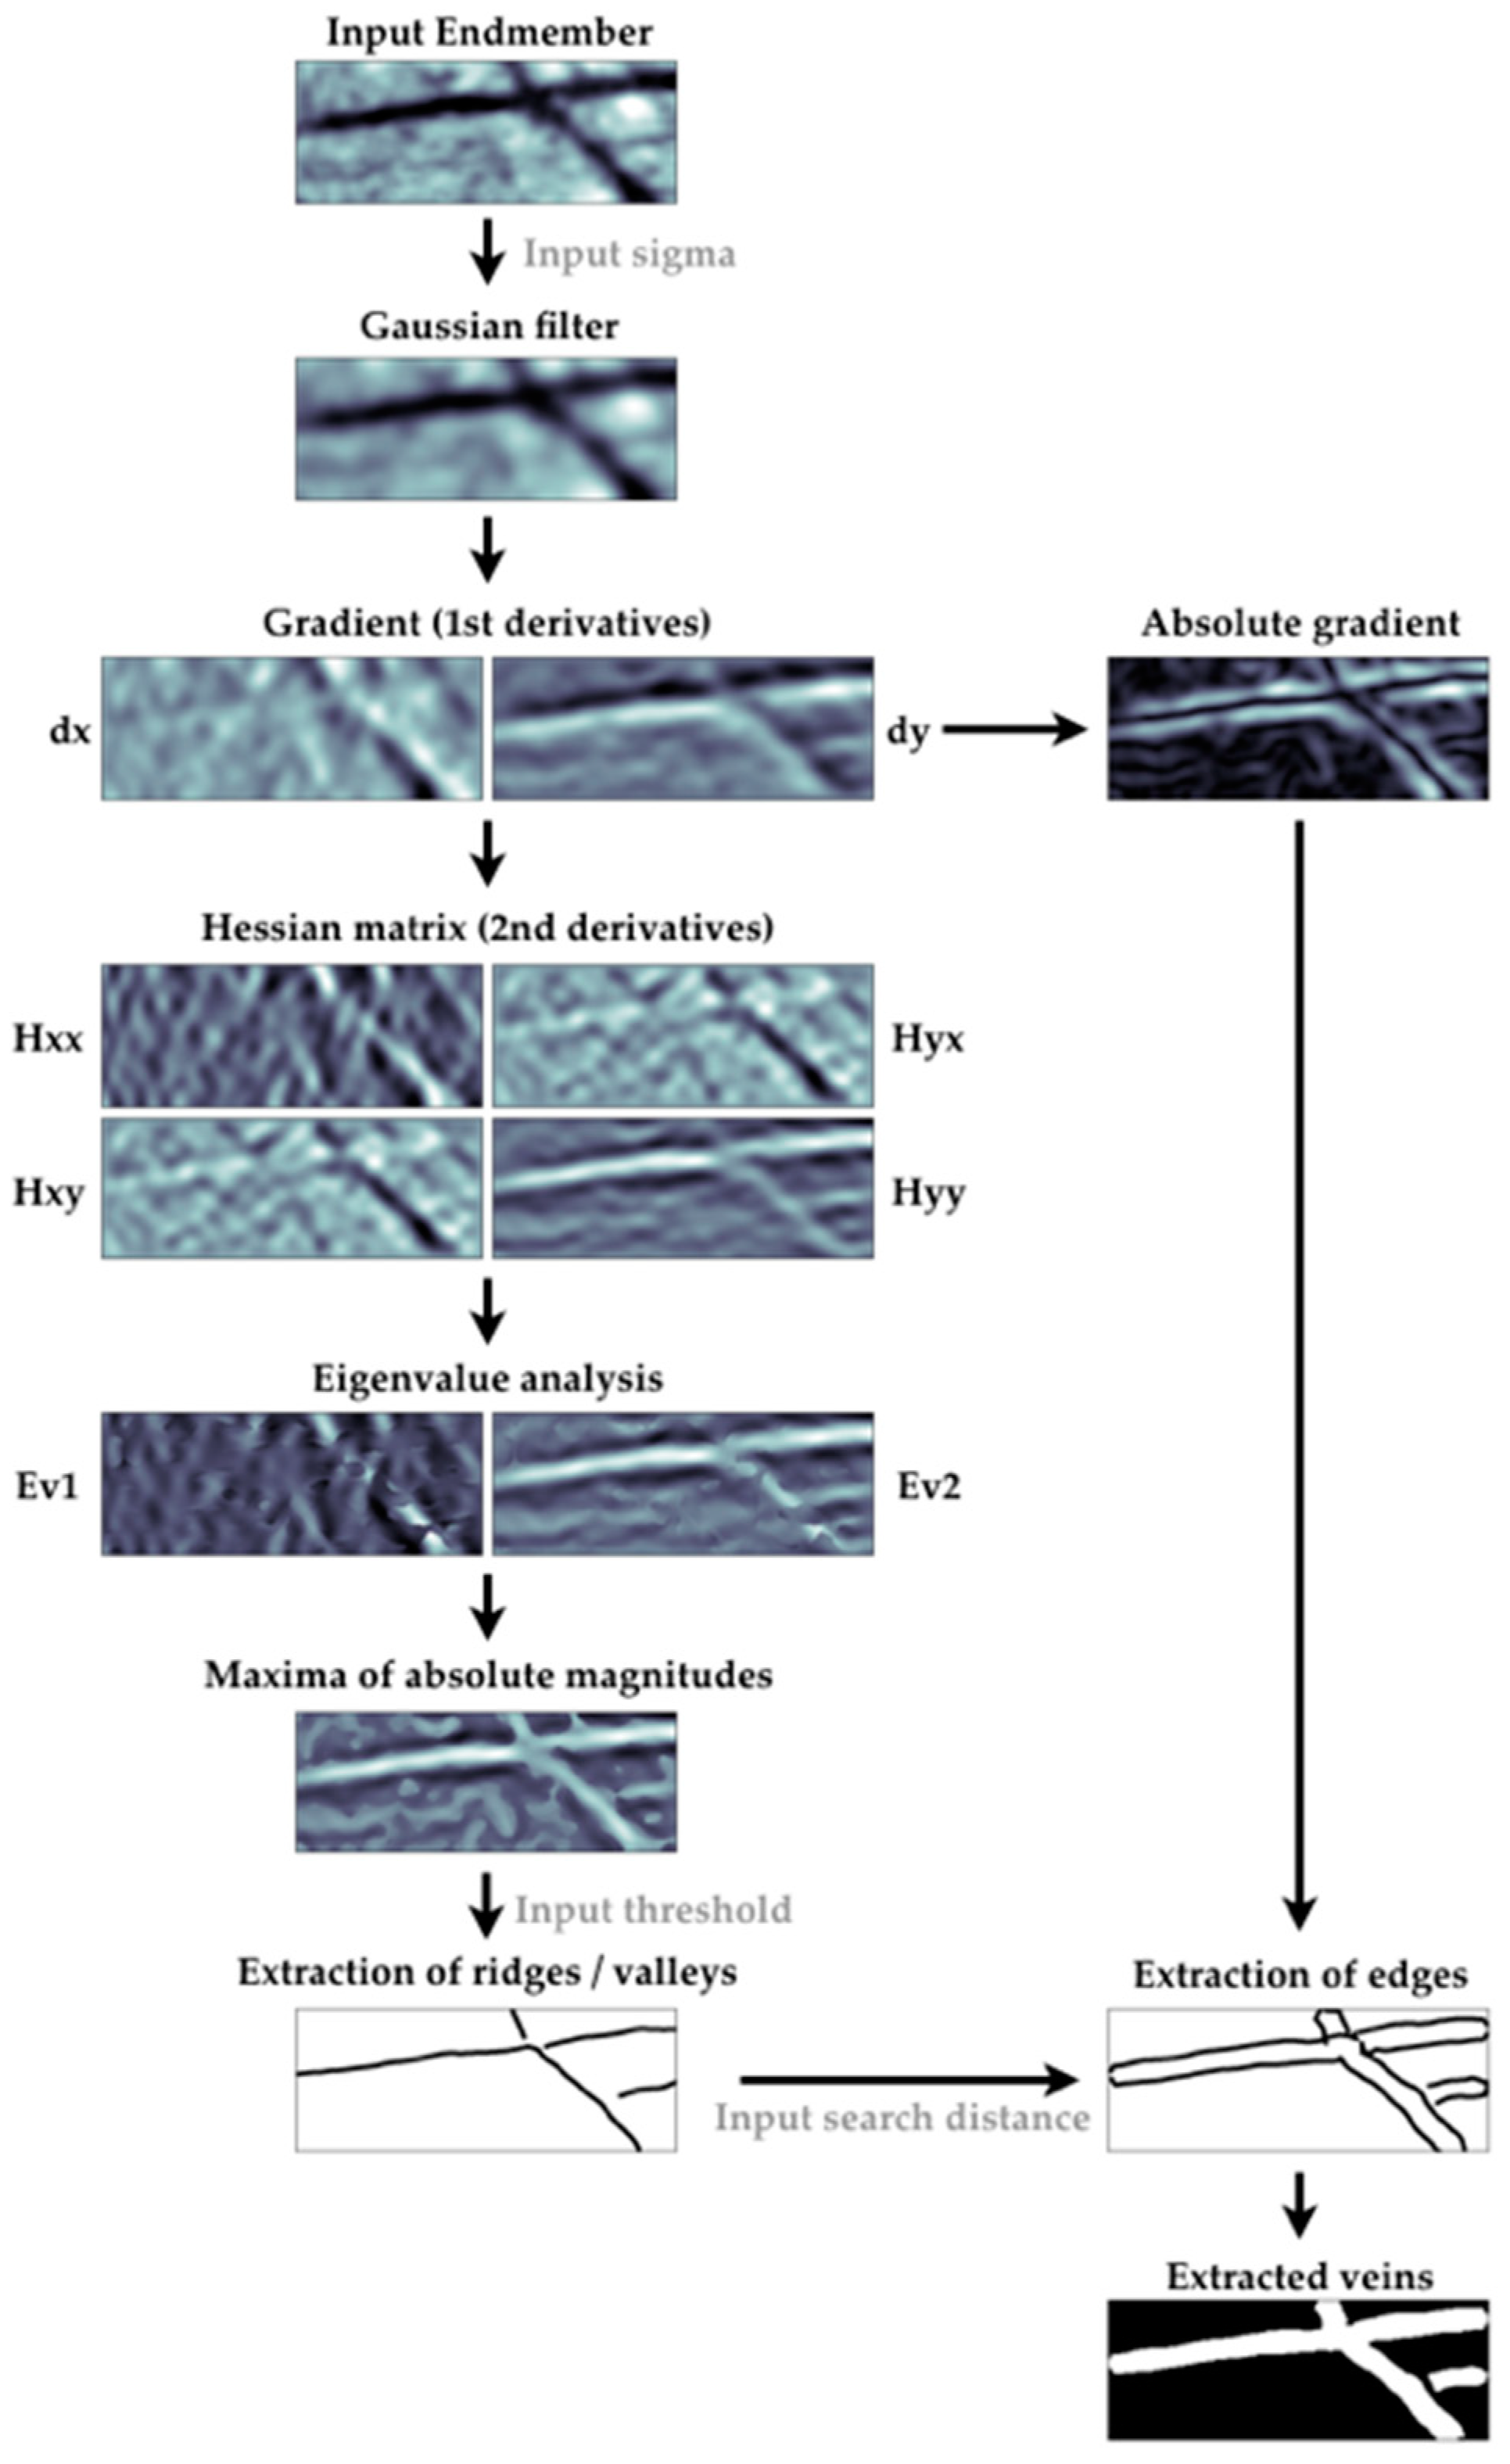
An approach based on Steger’s detector of curvilinear structures [
29] was developed. This method allows for the extraction of vein traces from mineral abundance maps together with their true shapes and extents (
Figure 4).
The first step of the vein extraction process consists of the identification of the points of maximum curvature in an image. These correspond to the specific signature of a mineral or mineral association related to the vein composition or vein alteration halo. The analysis of the image curvature is based on the eigenvalues of the Hessian matrix [
27,
28]. The 2 × 2 Hessian matrix is composed of second-order partial derivatives of an input image. The second-order partial derivatives are defined as a convolution with derivatives of Gaussian filter at scale σ. The eigenvalue analysis allows for the extraction of the principal directions and the magnitude in which the local second order structure of the image can be decomposed. Each pixel is assigned a set of eigenvectors such as |
λ1| ≤ |
λ2|. Linear features are characterised by a very small magnitude of
λ1 (ideally close to zero) and a large magnitude of
λ2. Point features will show similar magnitudes of
λ1 and
λ2 and features without preferential directions or random variation will have low magnitudes for both of the eigenvectors. The approach developed by Steger [
29] is used, and this allows us to identify the points of maximum curvature within the image. These points are then connected into lines using a recursive approach. Each line is constructed by identifying the point with maximum second derivative and then by adding the appropriate neighbours to the current line. The choice regarding the appropriate neighbour is based on the distance as well as the angle difference between the points. The procedure is repeated until no more points with a curvature above a defined threshold are left. This threshold is introduced to avoid extracting “weak” features. Edges can be detected using the absolute gradient derived from the first-order partial derivatives. A Gaussian filter is first applied in order to remove the noisy component of the image. However, the smallest possible scale (σ = 3) is used in order to obtain the most accurate localisation of the edge points. For each pair of points of an extracted line, the closest absolute gradient maxima along an orthogonal line with a defined length are located in order to extract the contours of the veins. In case no peak values are found in the vicinity of a pair of points, the position of the edge is interpolated based on valid edges for previous and following pairs.
This approach is highly sensitive to the scale of the Gaussian filter used to extract the axial traces of the veins in the first place. To tackle this problem, the procedure is repeated for a range of parameters and then the results are combined, ensuring the detection of both thin and thick veins.
5. Results
The potential and limitations of the proposed method are illustrated on three samples from the Bolcana porphyry system (DC-1, DC-2 and DC-3). The samples contain different vein types and styles of pervasive alteration. Macroscopic observations of the drill-core pieces and SEM-MLA data acquired on polished thin sections are used as ground truth for data validation.
5.1. Validation Data
Minerals that absorb parts of the incoming light between 1000 and 2500 nm are further called SWIR-active minerals. The SWIR active minerals identified in the samples are white micas, chlorites, biotite, epidotes, carbonates and amphiboles. Calcium sulphates are present as either gypsum (SWIR active) or anhydrite (SWIR inactive). MLA mineral maps are used for the identification and validation of the main alteration styles and mineral assemblages recognized in the samples (
Figure 5). The distribution of SWIR active and non-active minerals is illustrated in these results. The association of specific SWIR active and inactive minerals can help define a specific alteration zone. In this way, specific SWIR-active assemblages can be further linked to a defined location within the porphyry system. The main alteration styles encountered in the samples are phyllic (quartz–white mica–pyrite), potassic (k-feldspar–biotite) and calcic-sodic (plagioclase-chlorite/actinolite and subordinate white mica). Additionally, transitions between these alteration styles are noted. The main vein types present in the samples are B-type veins consisting of mainly quartz or calcium sulphate with a sulphide dominant centreline and D-type late veins consisting dominantly of sulphides and subordinately calcium sulphate. The nomenclature of the vein stage and morphology follows the description provided by Gustafson and Hunt [
46].
Sample DC-1 is marked by pervasive potassic alteration characterized by the presence of K-feldspars, biotite and minor chlorite. Two main vein types are present in this sample. D-type veins consist of sulphides and show a strong phyllic alteration halo caused by the late reaction of mineralizing hydrothermal fluids with the host rock. B-veins consist dominantly of quartz with sulphide or sulphide and calcium sulphate (gypsum or anhydrite) centreline.
Sample DC-2 shows a less intense potassic alteration with a transition towards sodic-calcic alteration. The matrix is composed of feldspars, chlorite and minor amounts of biotite. Two main vein types are encountered. These are quartz B-veins with a centreline of sulphides and calcium sulphate, and calcium sulphate B-veins with a sulphide centreline and a transition towards D-veins. The complexity of the vein architecture can be explained by a late opening of a B-vein and a D-vein overprint. This overprint also explains the formation of an alteration halo of strong phyllic composition.
A sodic-phyllic rock matrix hosting two main vein-types characterizes sample DC-3. The first vein type is a D-vein with a large white mica alteration halo. The second vein type consists predominantly of quartz, calcium sulphate and sulphides. The changing symmetry and mineral association in these latter veins indicate the reopening of an initially present quartz or B-vein.
5.2. Mineral Mapping
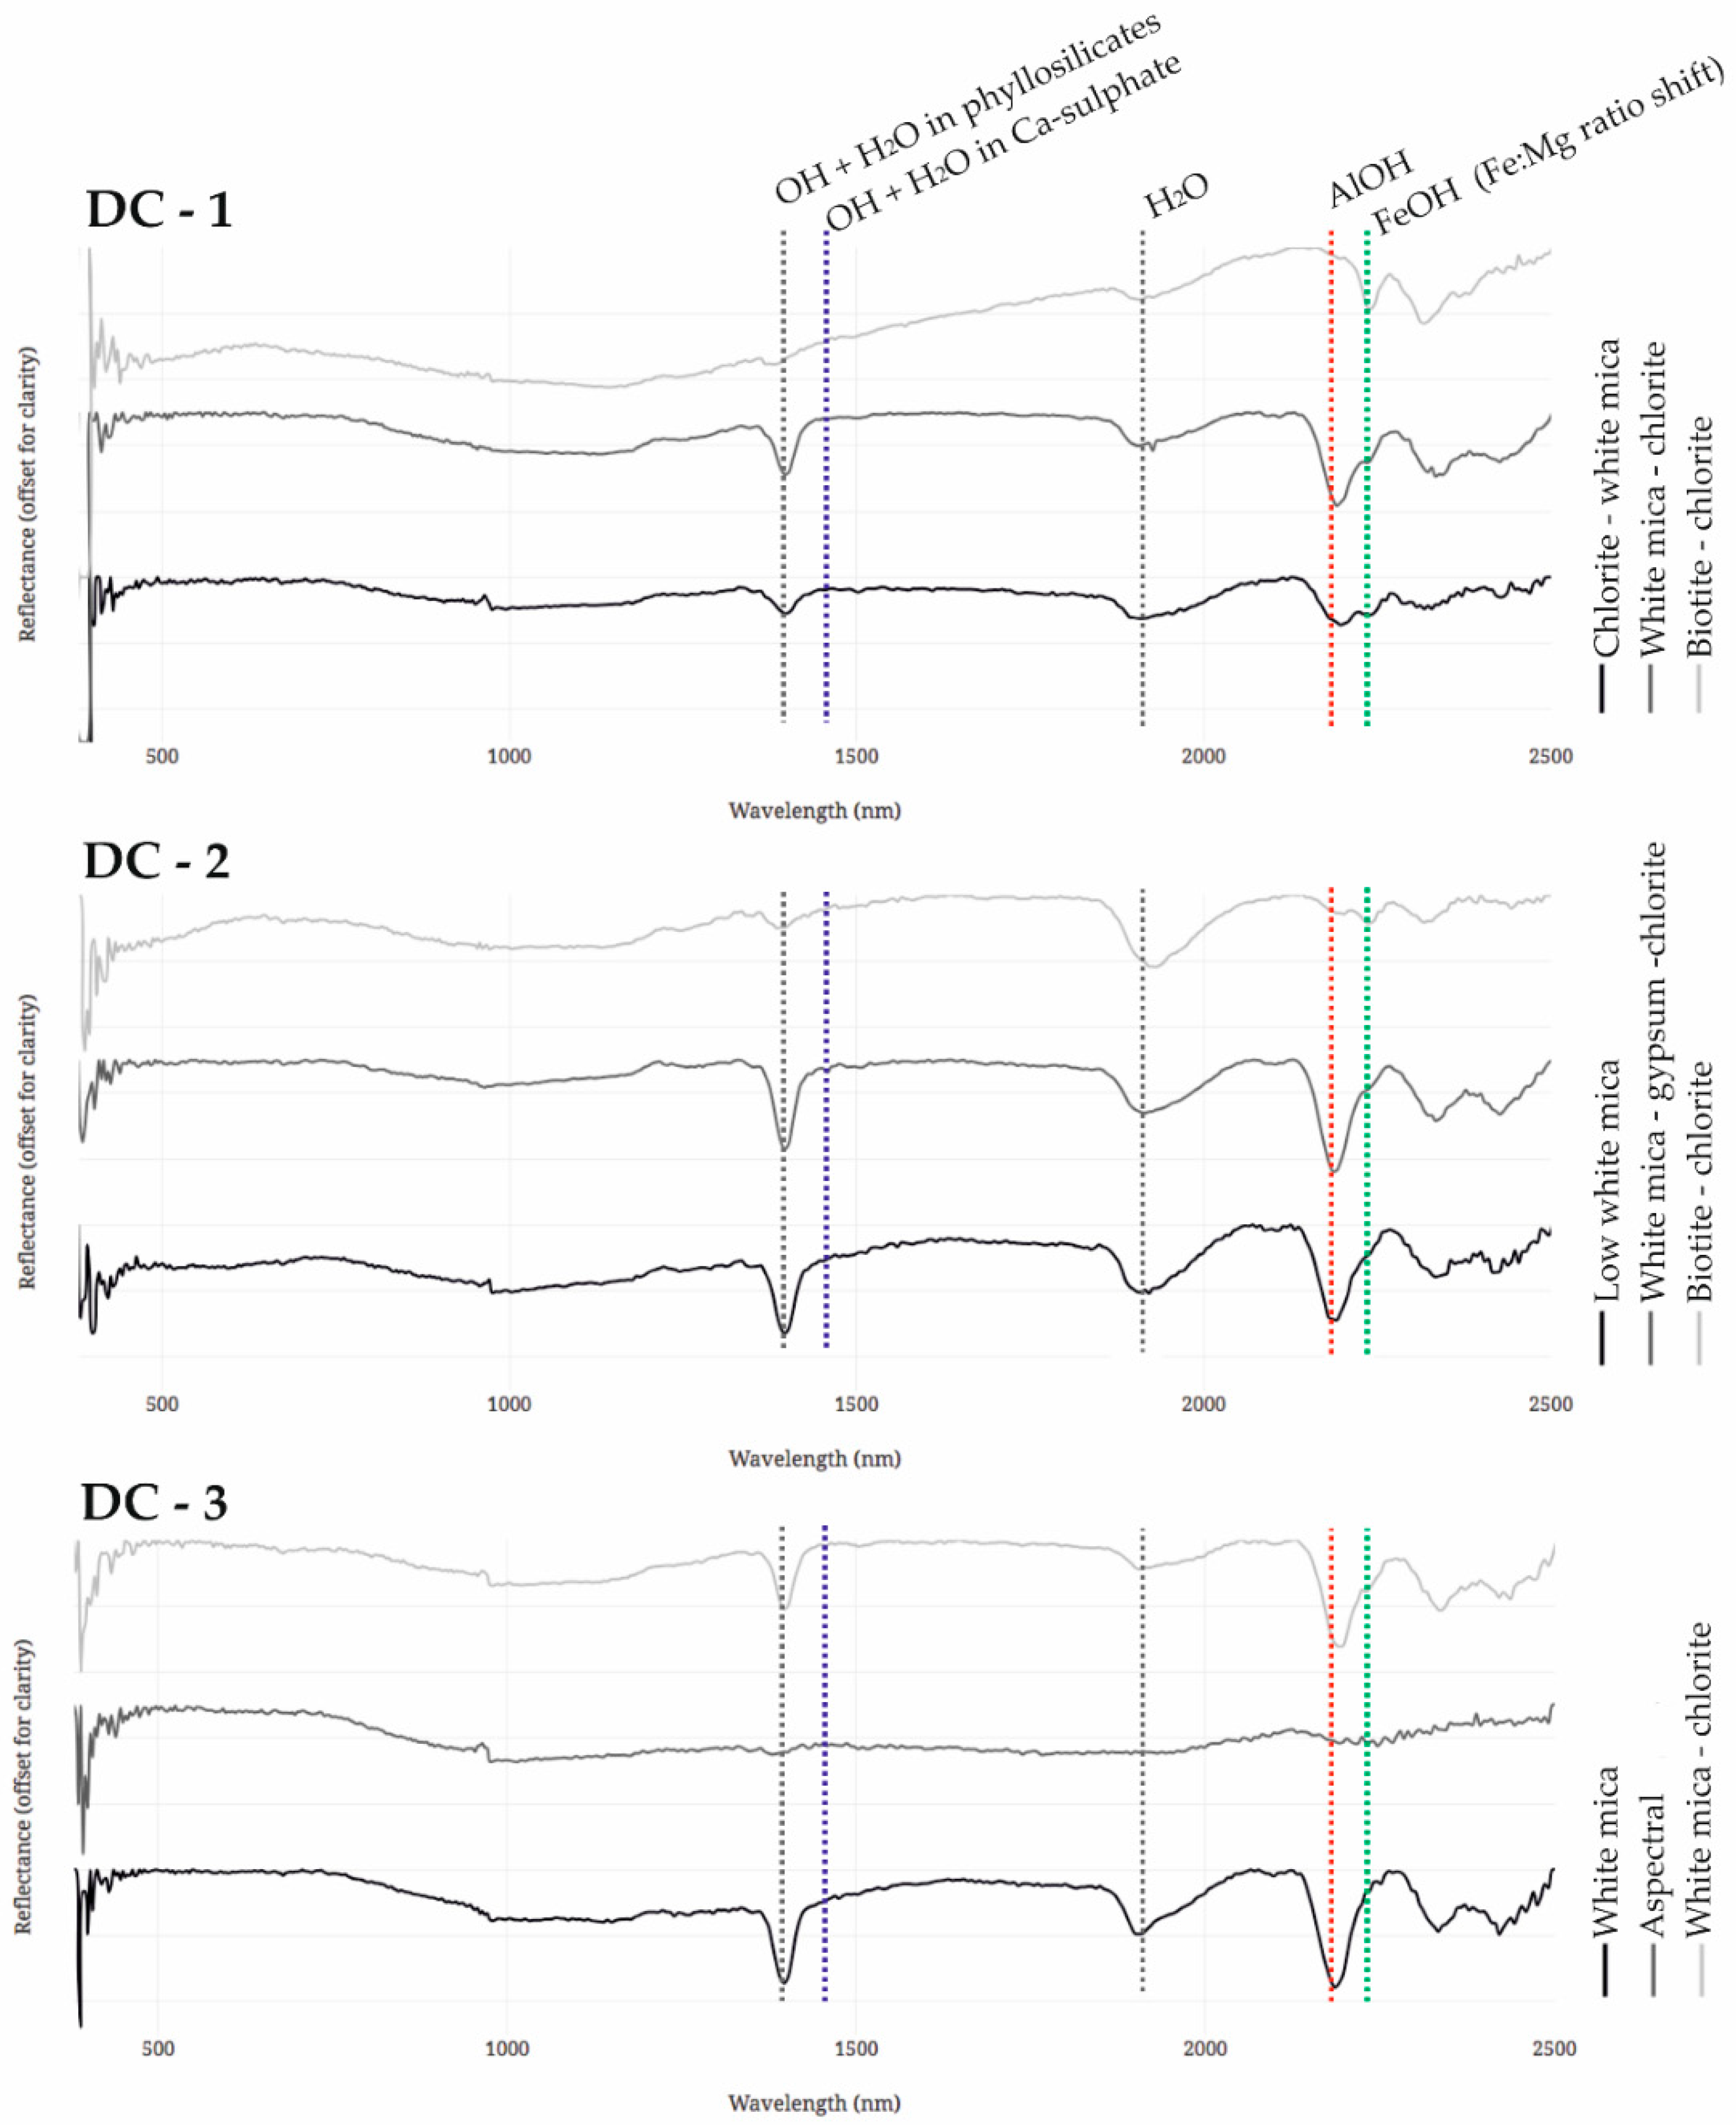
As a first stage of the hyperspectral data processing, endmembers are extracted using the N-Findr algorithm. Three endmembers are considered in the present study, as they cover the strongest variability within the alteration mineralogy (
Figure 6). The analysis of the endmembers is performed using a decision tree-based wavelength analysis tool for the identification of the main minerals present in the endmembers. For white mica, for instance, three types are identified based on the minimum wavelength position within the selected ranges: paragonitic (2180–2195 nm), intermediate (2195–2210 nm) and phengitic (2210–2228 nm).
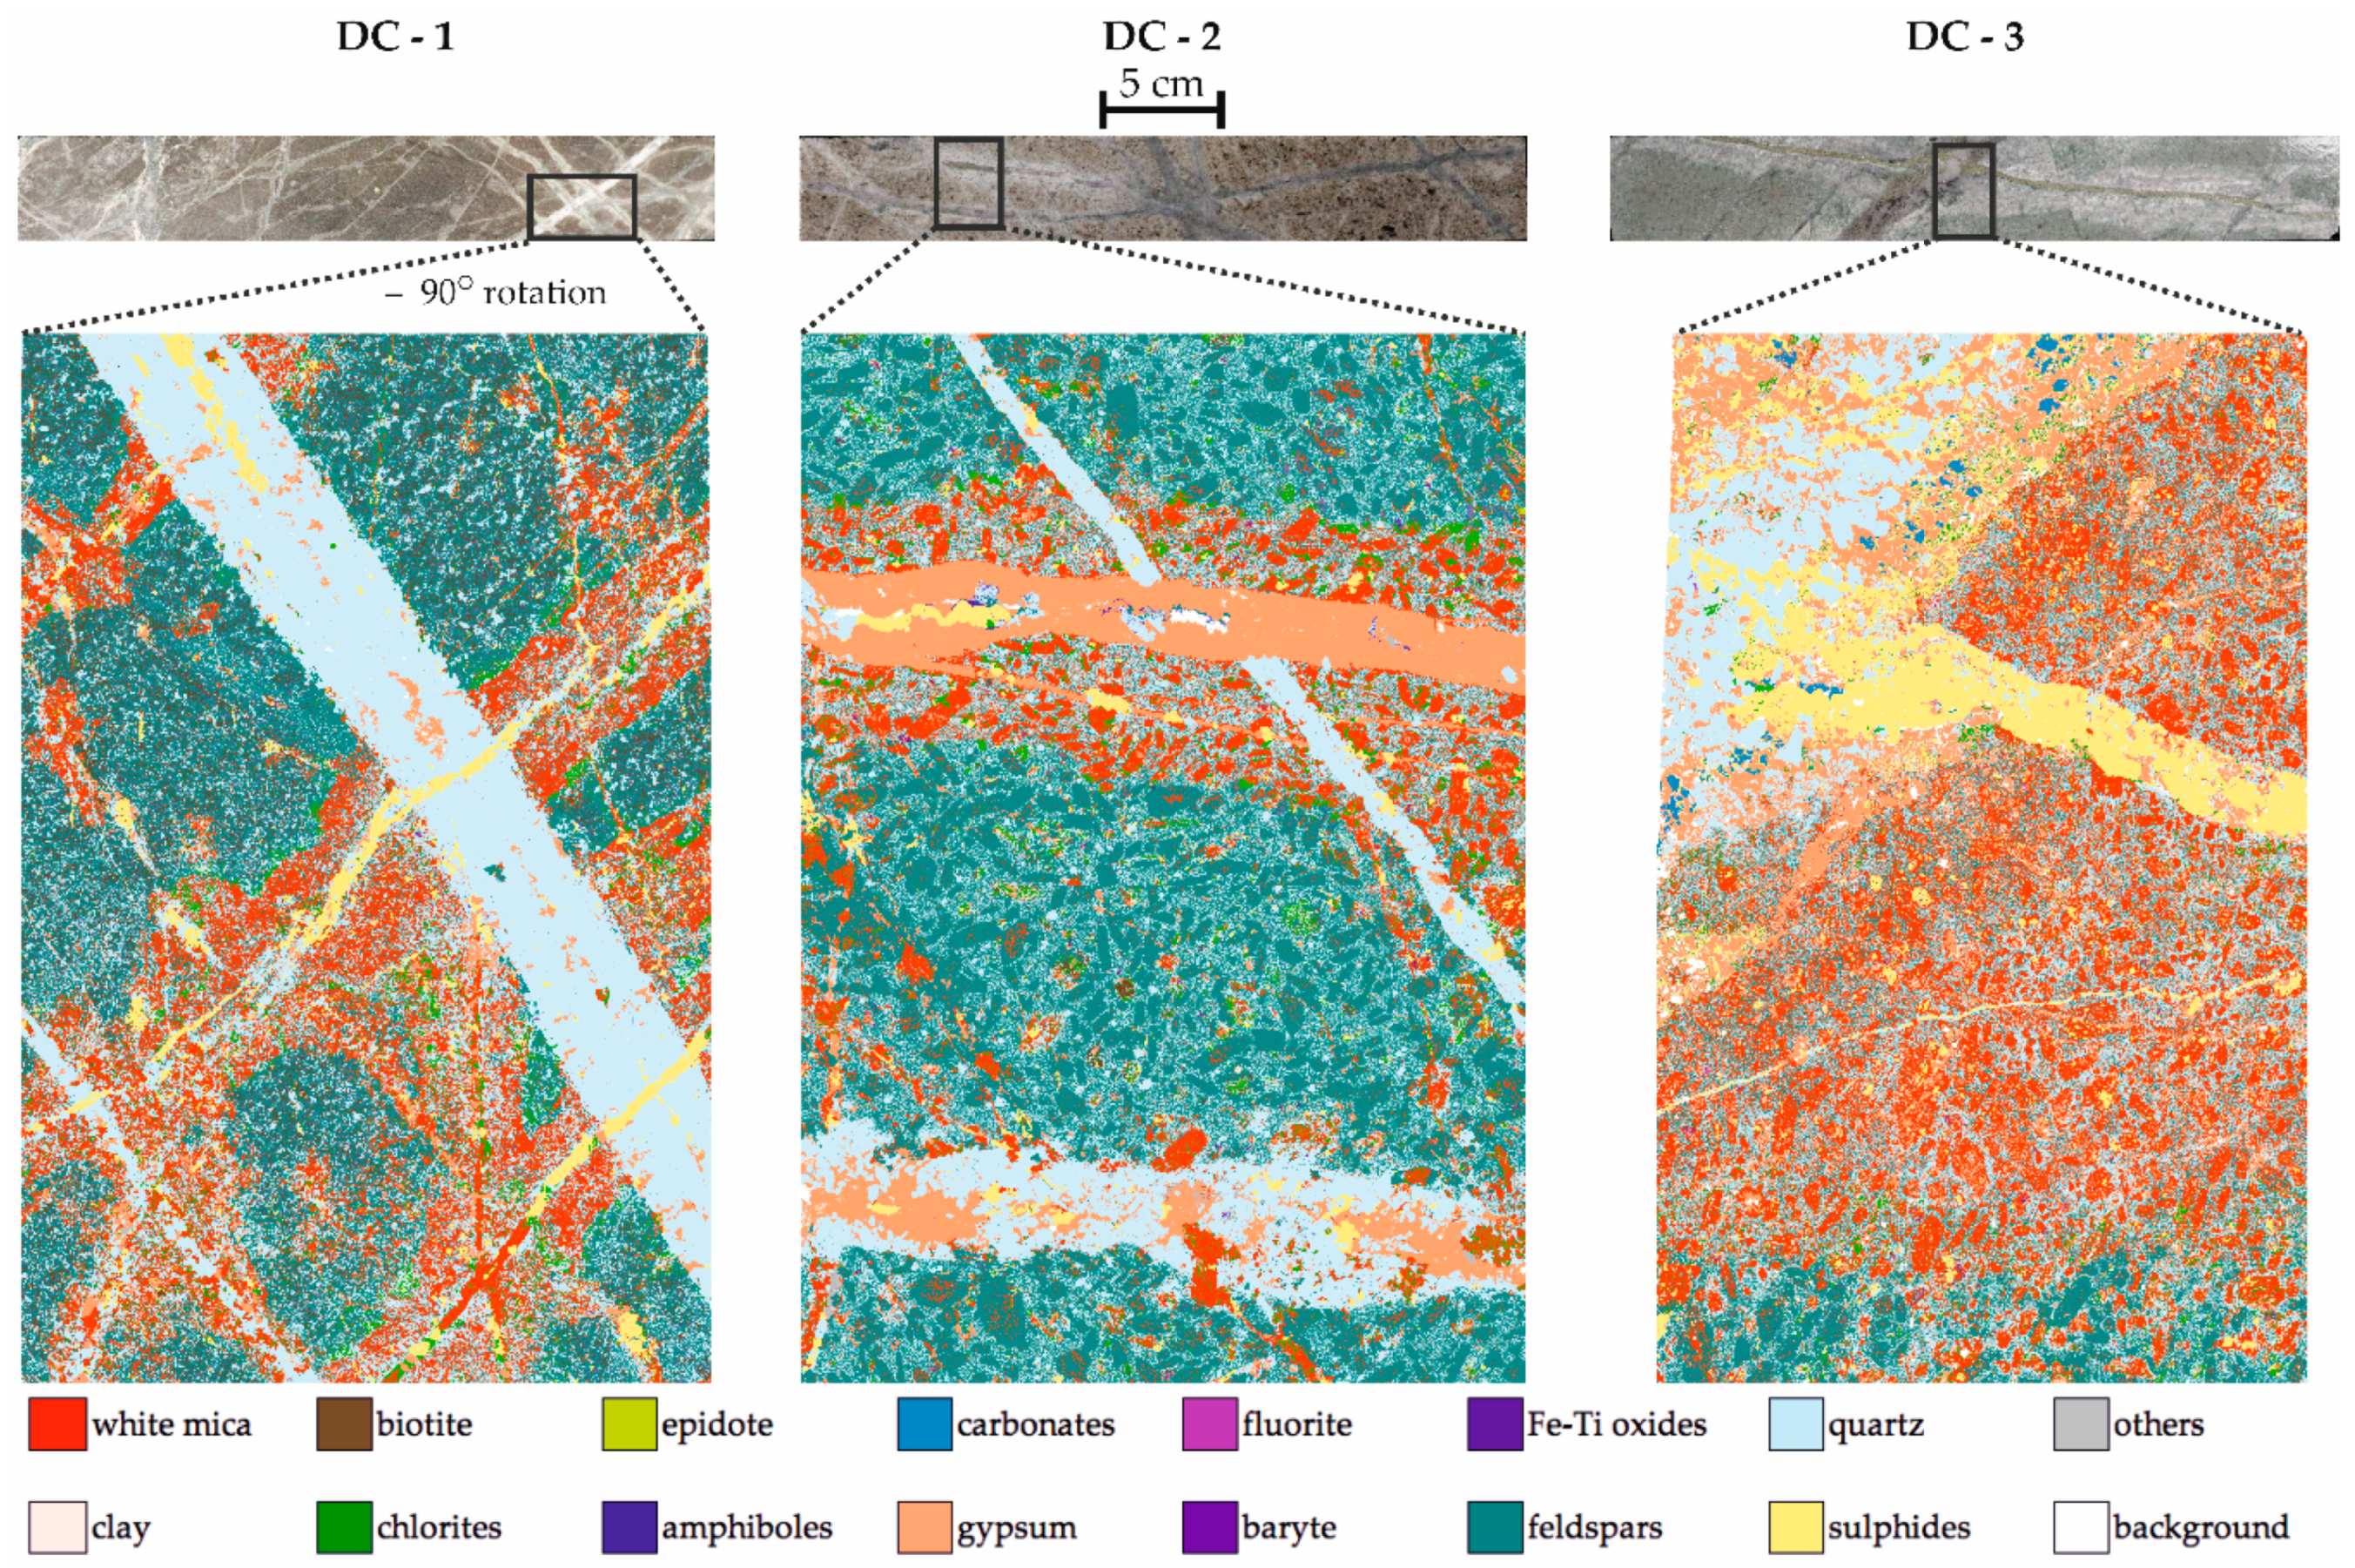
After applying FC-LSU for estimation of the abundance, the final mineral maps are obtained by using the maximum abundance among the three endmembers in each pixel. Please note that in FC-LSU the endmember abundances sum to one (
Figure 7).
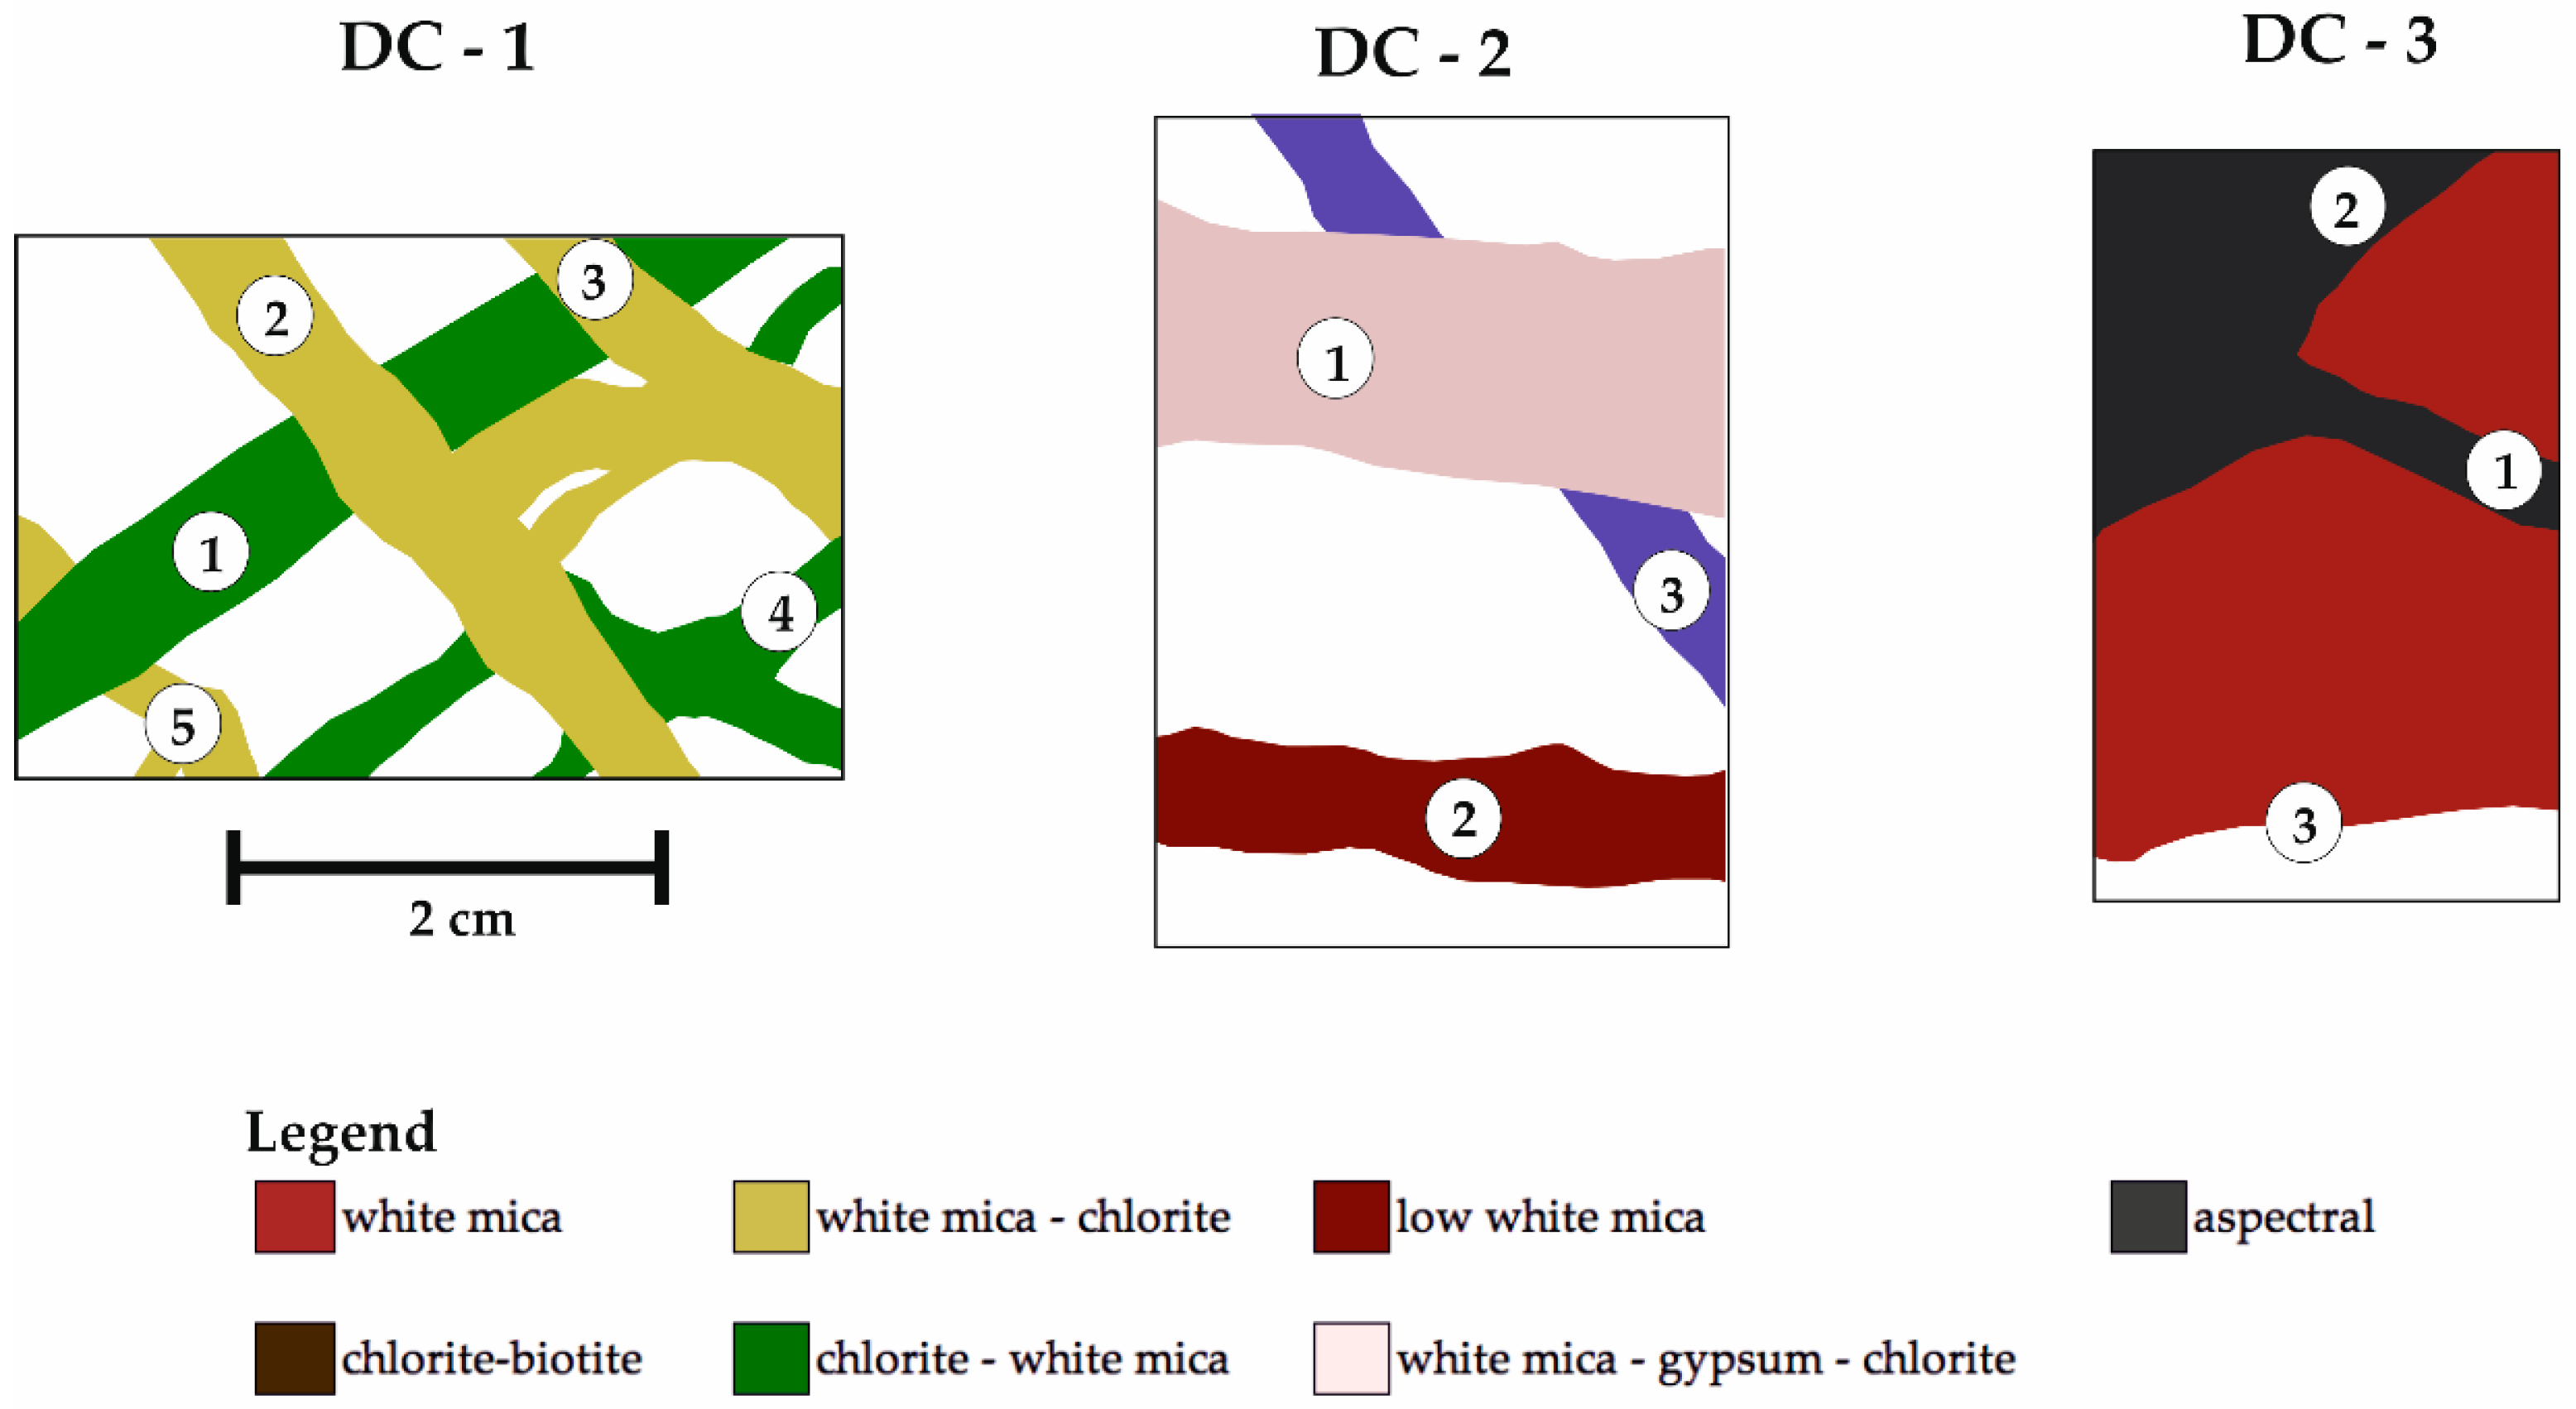
The main spectrally active assemblages observed in sample DC-1 are chlorite–white mica, white mica–chlorite and chlorite–biotite. The first two constitute alteration selvages around the main vein types, while the latter assemblage is dominant in the rock matrix. In sample DC-2, the main vein-related alteration assemblages are white mica and white mica–gypsum–chlorite. The matrix in sample DC-2, as in sample DC-1, is characterized by the dominance of chlorite and biotite among the SWIR active minerals. In sample DC-3, an aspectral endmember corresponding to the occurrence of sulphide and quartz is mapped. The alteration selvage of these veins is dominated by white mica whereas the pervasive alteration consists mostly of a white mica–chlorite assemblage.
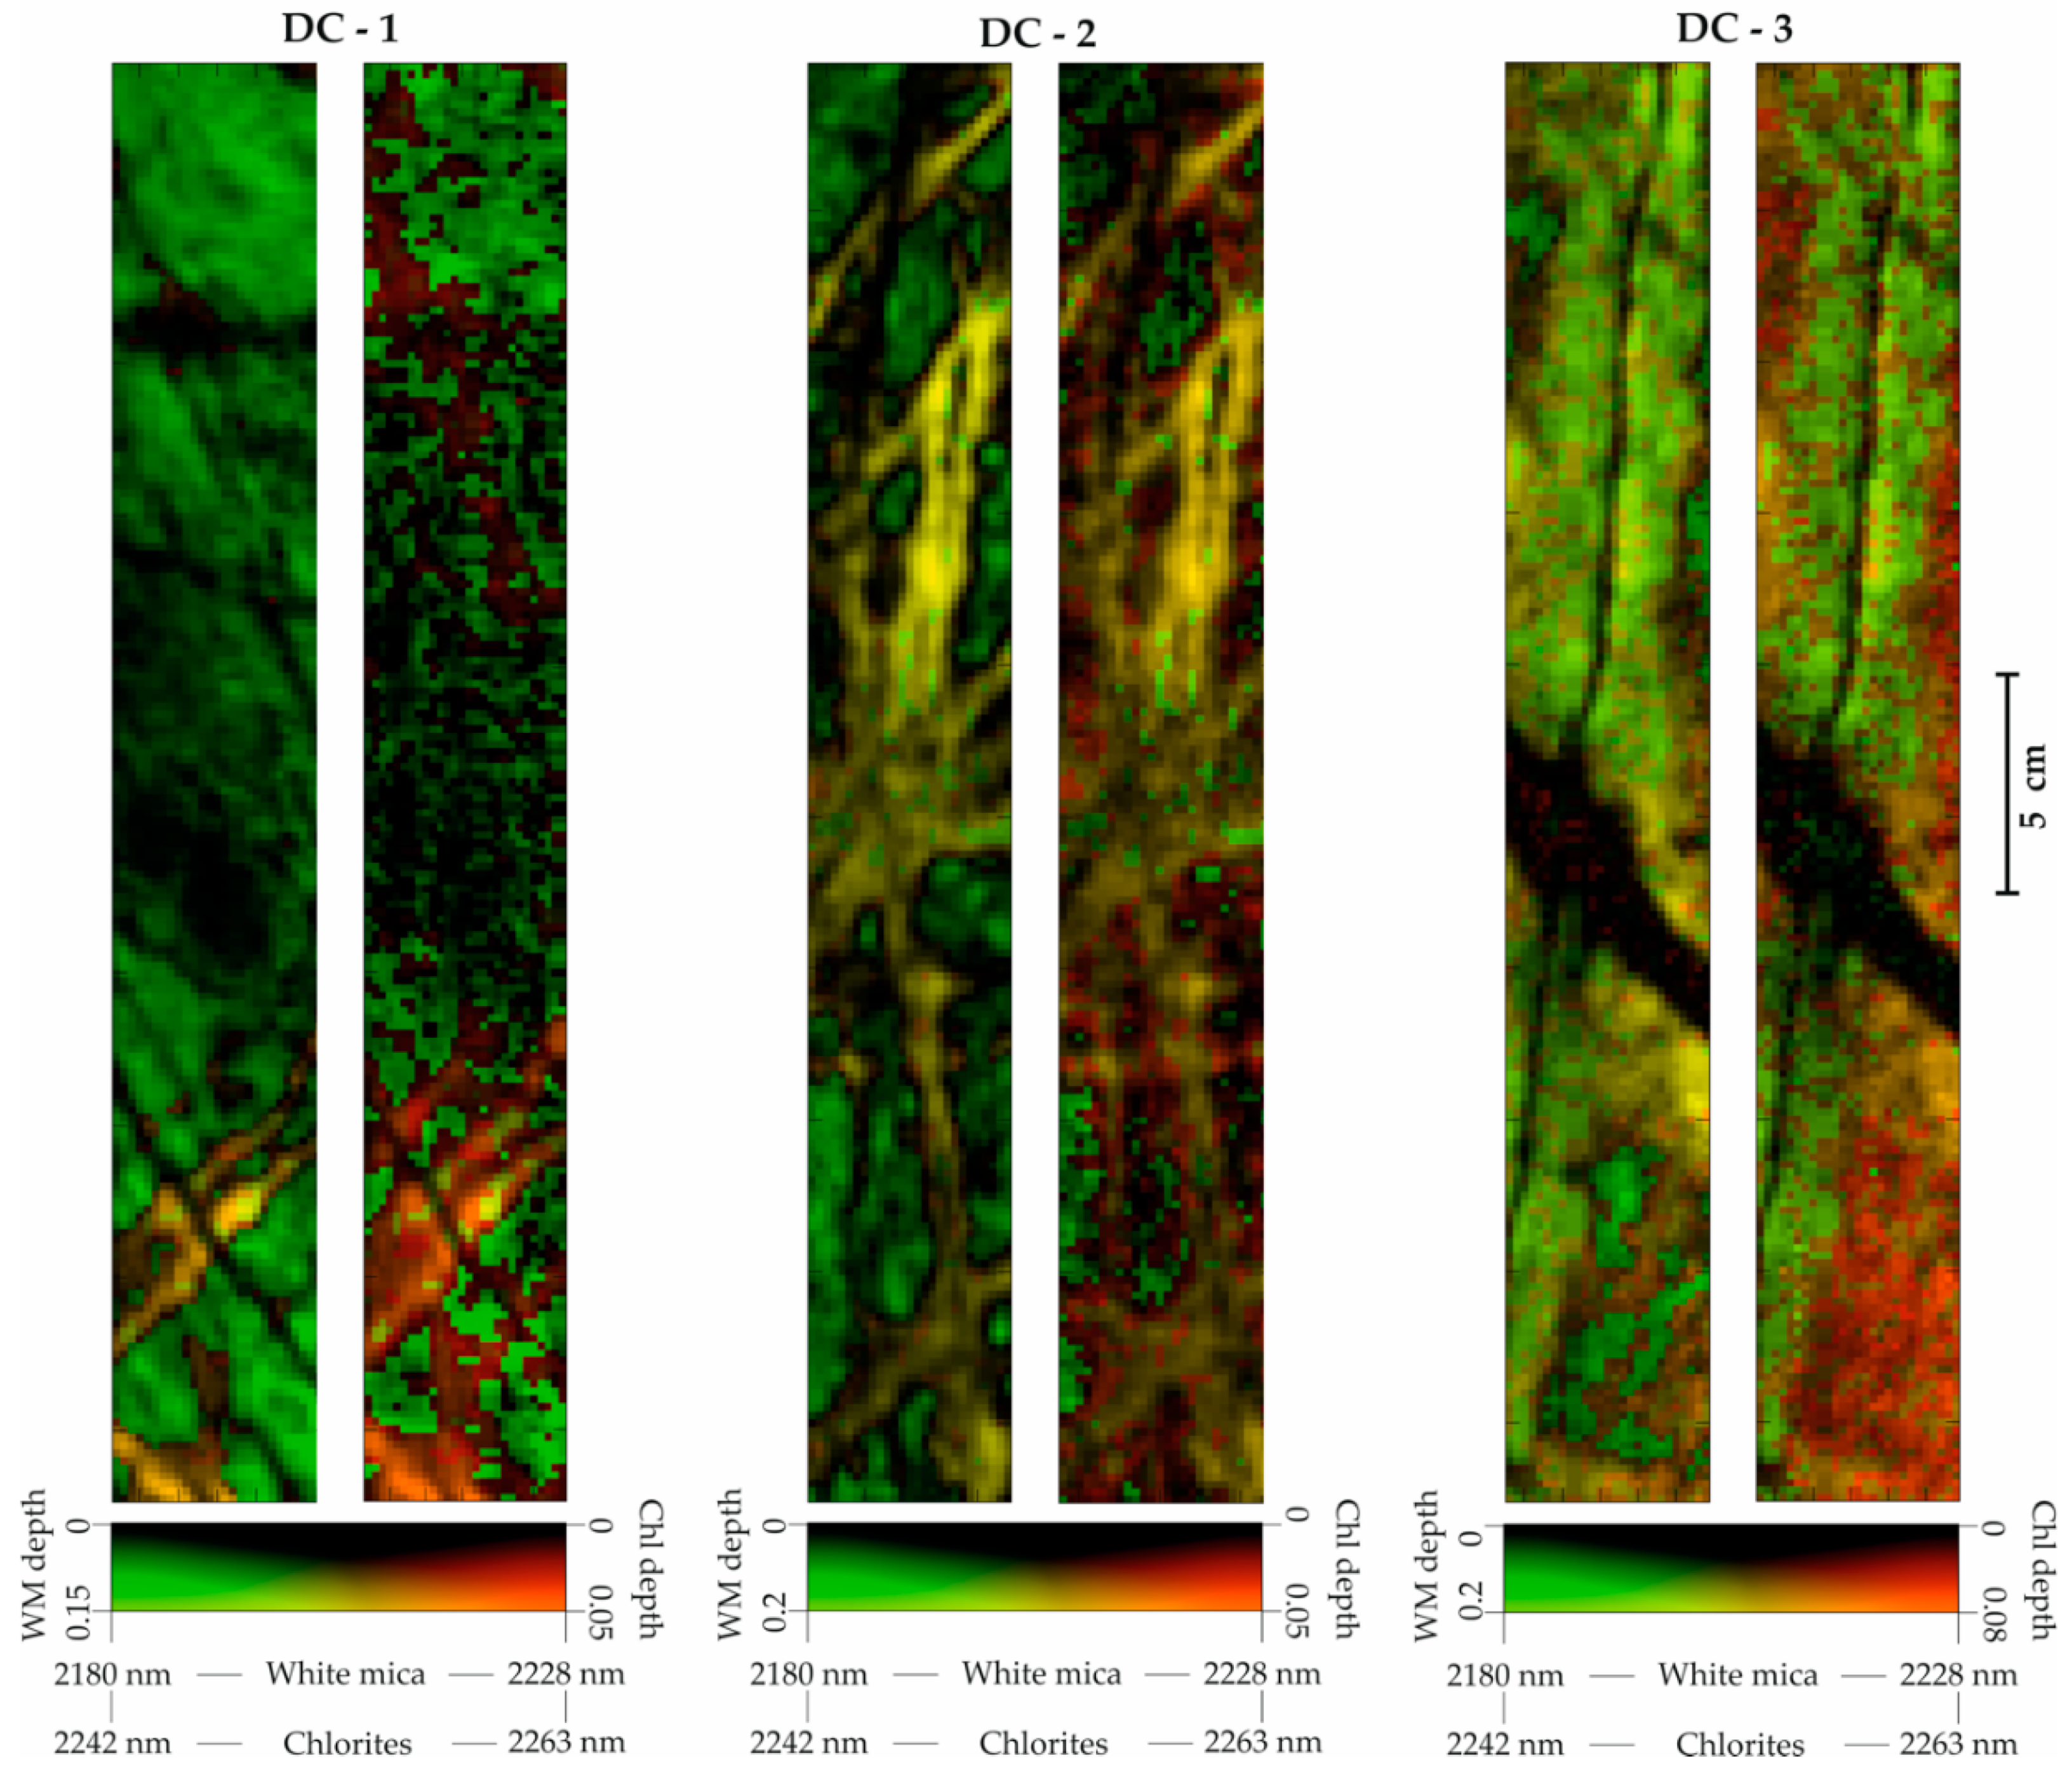
Sample DC-1 hosts two endmembers containing white mica. In the white mica–chlorite endmember, white mica shows an intermediate composition while in the chlorite–white mica it has a phengitic composition. The low-intensity absorption white mica endmember (called low white mica) in Sample DC-2 has a paragonitic composition in comparison to the endmember white mica–gypsum–chlorite, where the white mica has an intermediate character. Sample DC-3 shows an inverse relationship between the composition of the micas in the veins and in the matrix compared to sample DC-1. The matrix-characteristic endmember here has a phengitic composition while the vein selvage has a paragonitic one. These results were confirmed and supported by minimum wavelength maps in the ranges of 2180–2228 nm for white mica and 2240–2263 for chlorite (
Appendix A).
5.3. Structural Feature Extraction
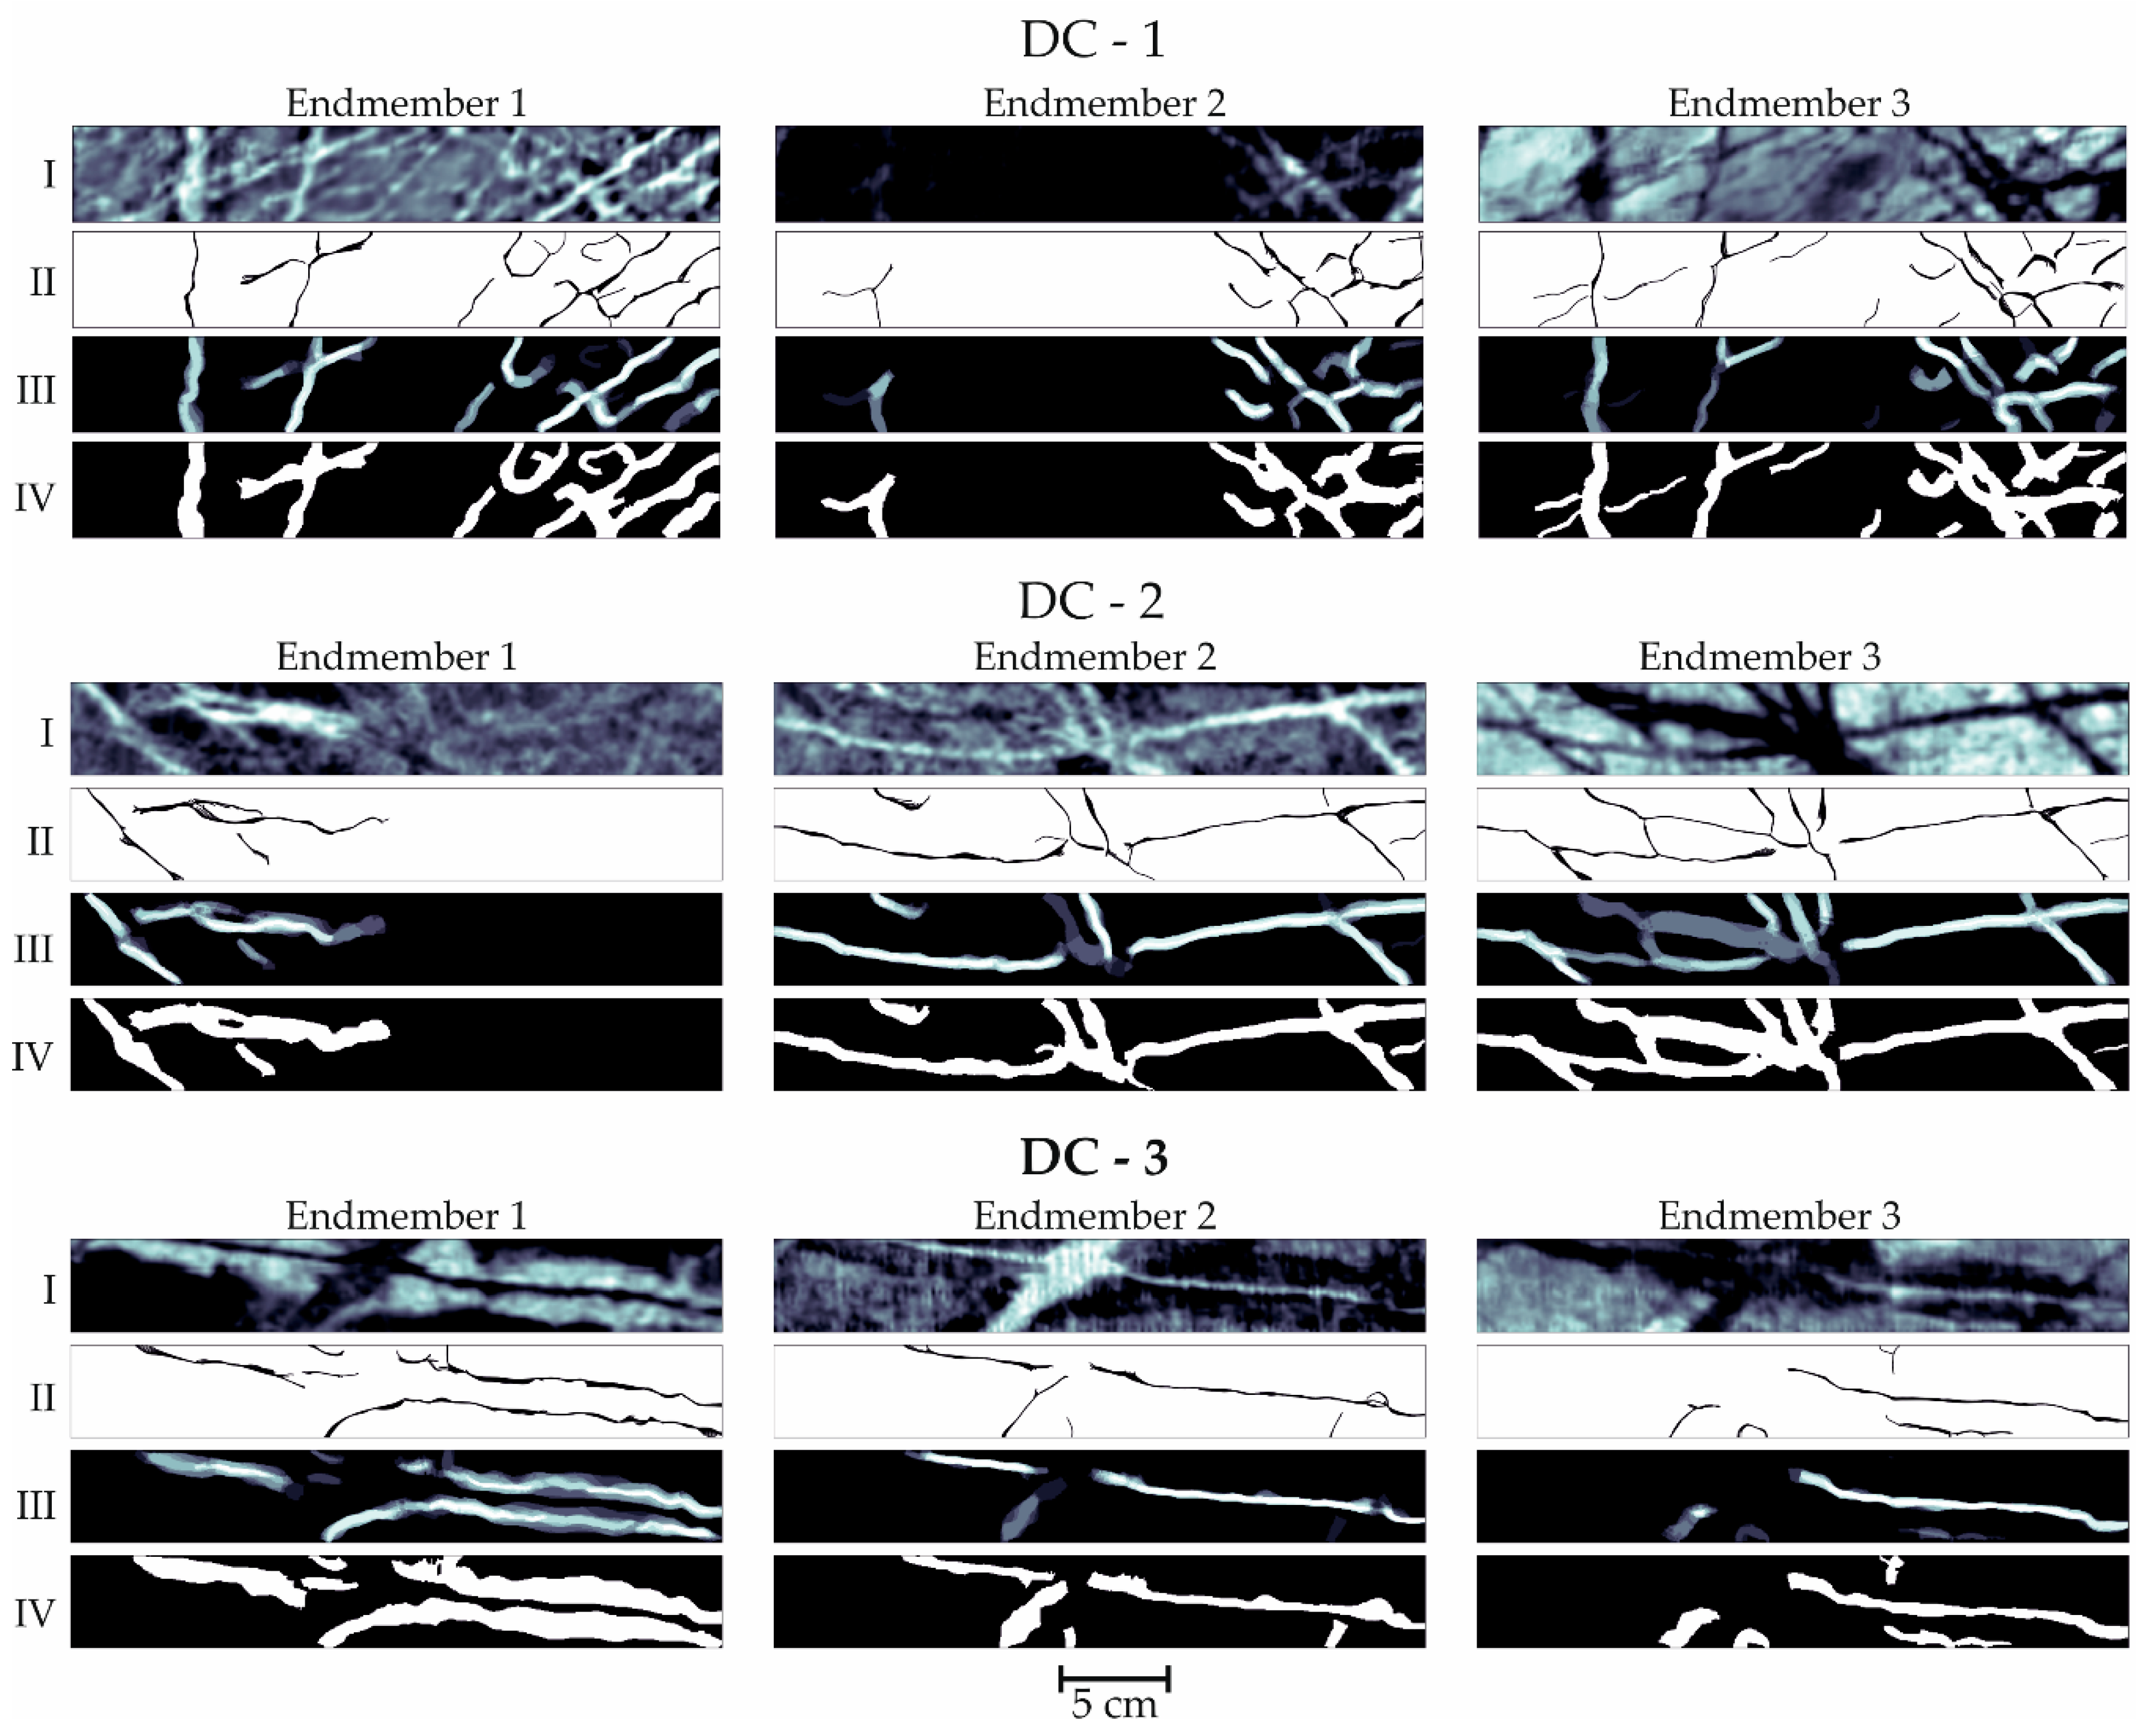
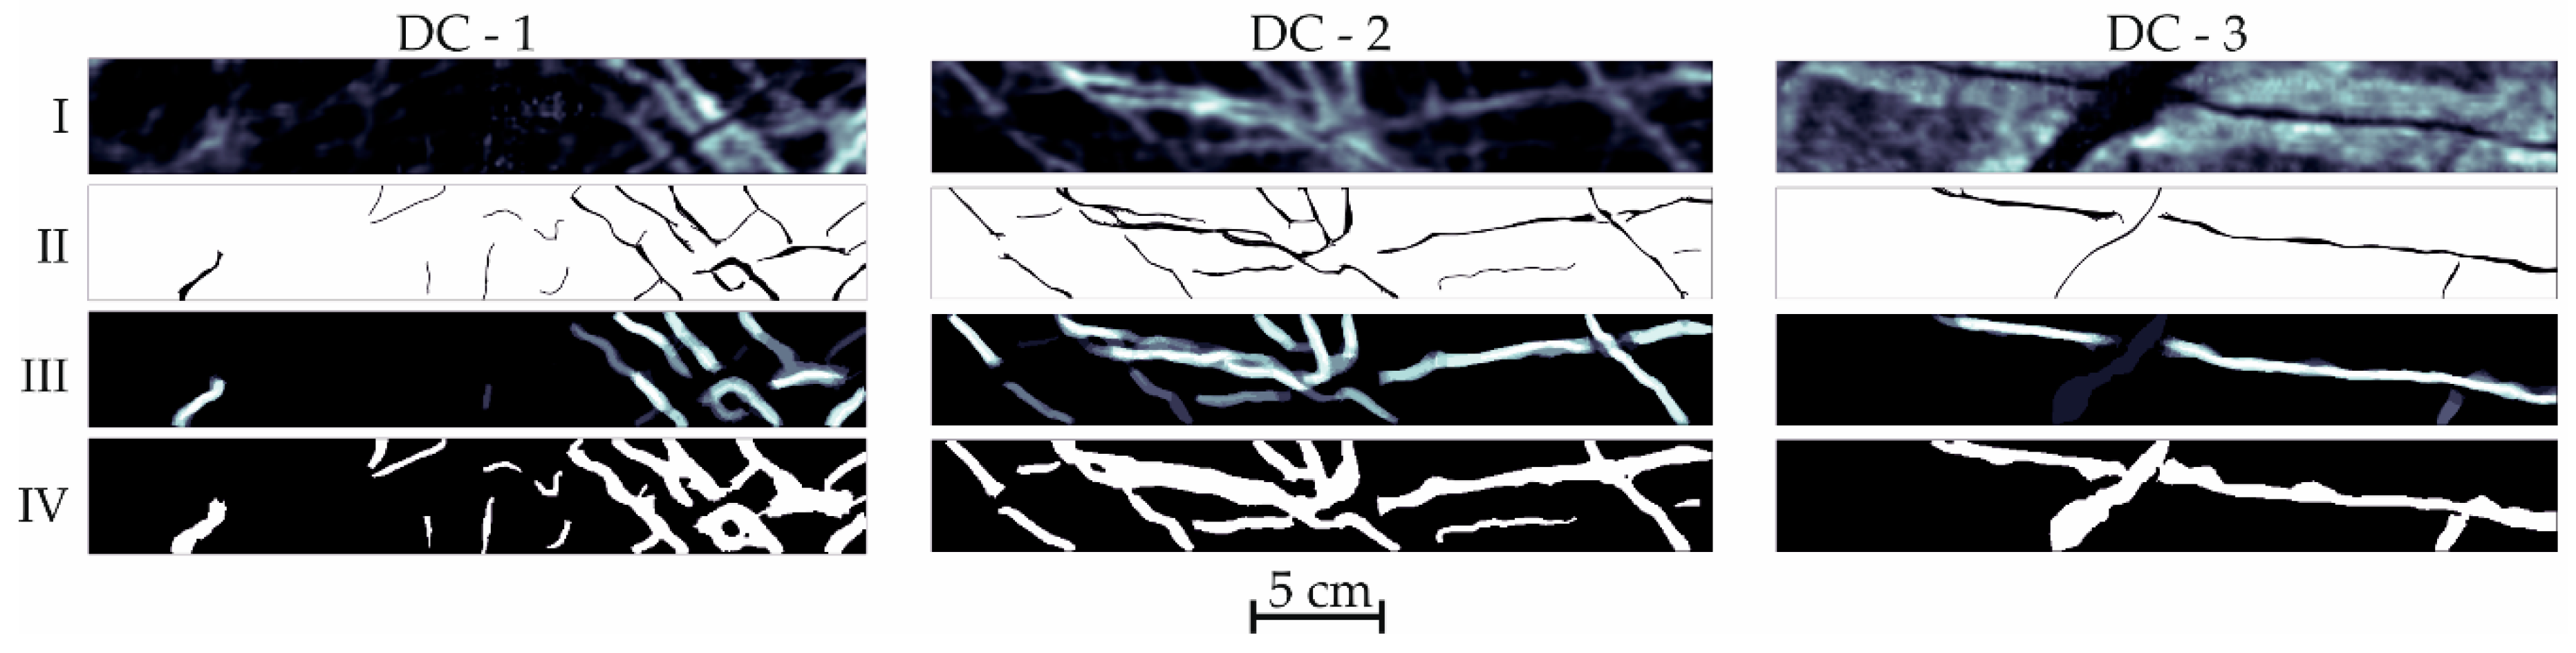
The extraction of structural features is performed on each of the endmember abundance maps obtained by FC-LSU (
Figure 8). For each of the samples, endmembers 1 and 2 correspond to vein alteration selvage or vein internal composition, while endmember 3 reflects pervasive alteration.
For sample DC-1, a combination of two vein types is present. One of the endmembers shows a white mica-dominant alteration selvage, while the other a chlorite-dominant selvage. However, in places, due to vein reopening and compositional complexity, the endmember abundances as well as the extracted vectors show a partial overlap of the two vein-related endmembers. This can be observed particularly in the left-hand side of the sample.
For sample DC-2, the mineral mapping and vein extraction results show a good overlap in terms of vein mineralogy mapping. For endmember 1, a good performance of the extraction consistent with the macroscopic observations and the validation data is achieved. Moreover, the artefacts from mineral mapping observed in the vicinity of the second vein type are not present here. Additionally, a distinction between the thick, sub-horizontal vein at the top of the image and the intersecting oblique vein is made, which was not possible in the mineral maps. For endmember 2, due to the low intensity in the endmember abundance map, the third vein present and mapped at the centre of the image is not extracted here with the selected parameters. Yet, with a decrease in the sigma value or in the threshold ranges it was possible to extract this vein. However, the drawback of decreasing the sigma value or the minimum threshold would be the risk to map noise as veins. We therefore refrained from pursuing this further.
Sample DC-3 was chosen as an example with exceptionally thick alteration selvages exceeding one centimetre in width. The D-vein present in this sample shows a particularly wide alteration halo of similar composition to the quartz–anhydrite–sulphide vein. Extending the ranges for the sigma parameter would still not allow for an accurate extraction of this vein. Here, the use of endmember 1 corresponding to the alteration halo of both veins leads to the extraction of two features parallel to the D-vein. The vein extraction from the abundance map of endmember 2, characterized as aspectral, leads to the detection of structural features characteristic to the intrinsic composition of both veins.
For all three samples, endmember 3 is characteristic of the pervasive alteration. The vein extraction should allow for the mapping of all veins based on the areas of minimum abundance of endmember 3. For samples DC-1 and DC-2, the results show an overlap of the vein types mapped from the first 2 endmembers. Exceptions occur particularly for sample DC-2, where some veins are very thin and the alteration halo has a low intensity in comparison to the matrix and in relation to the compositional variability of the pervasive alteration. The expected vein thickness to be extracted is estimated at 0.5 mm. This value, however, can vary, as the performance of the method is highly dependent on the abundance of the SWIR active phases in the veins or vein alteration halos. Depending on the location within the system, as well as the stage of mineralization, the contrast between the abundance of the SWIR active phases within and in proximity to veins compared to the matrix varies.
In addition to the use of the linear extraction tool for the extraction of veins from endmember abundance maps, the same approach can be used for other input files such as images resulting from band math calculation or minimum wavelength analysis. The band math (2170/2206 nm) characteristic of white mica’s distribution for the studied samples is performed on continuum-removed spectra [
47]. As only the intermediate composition white mica is considered here, the vein extraction results (
Appendix B) will not be entirely consistent with the distribution of all white mica types illustrated in the endmember abundance maps.
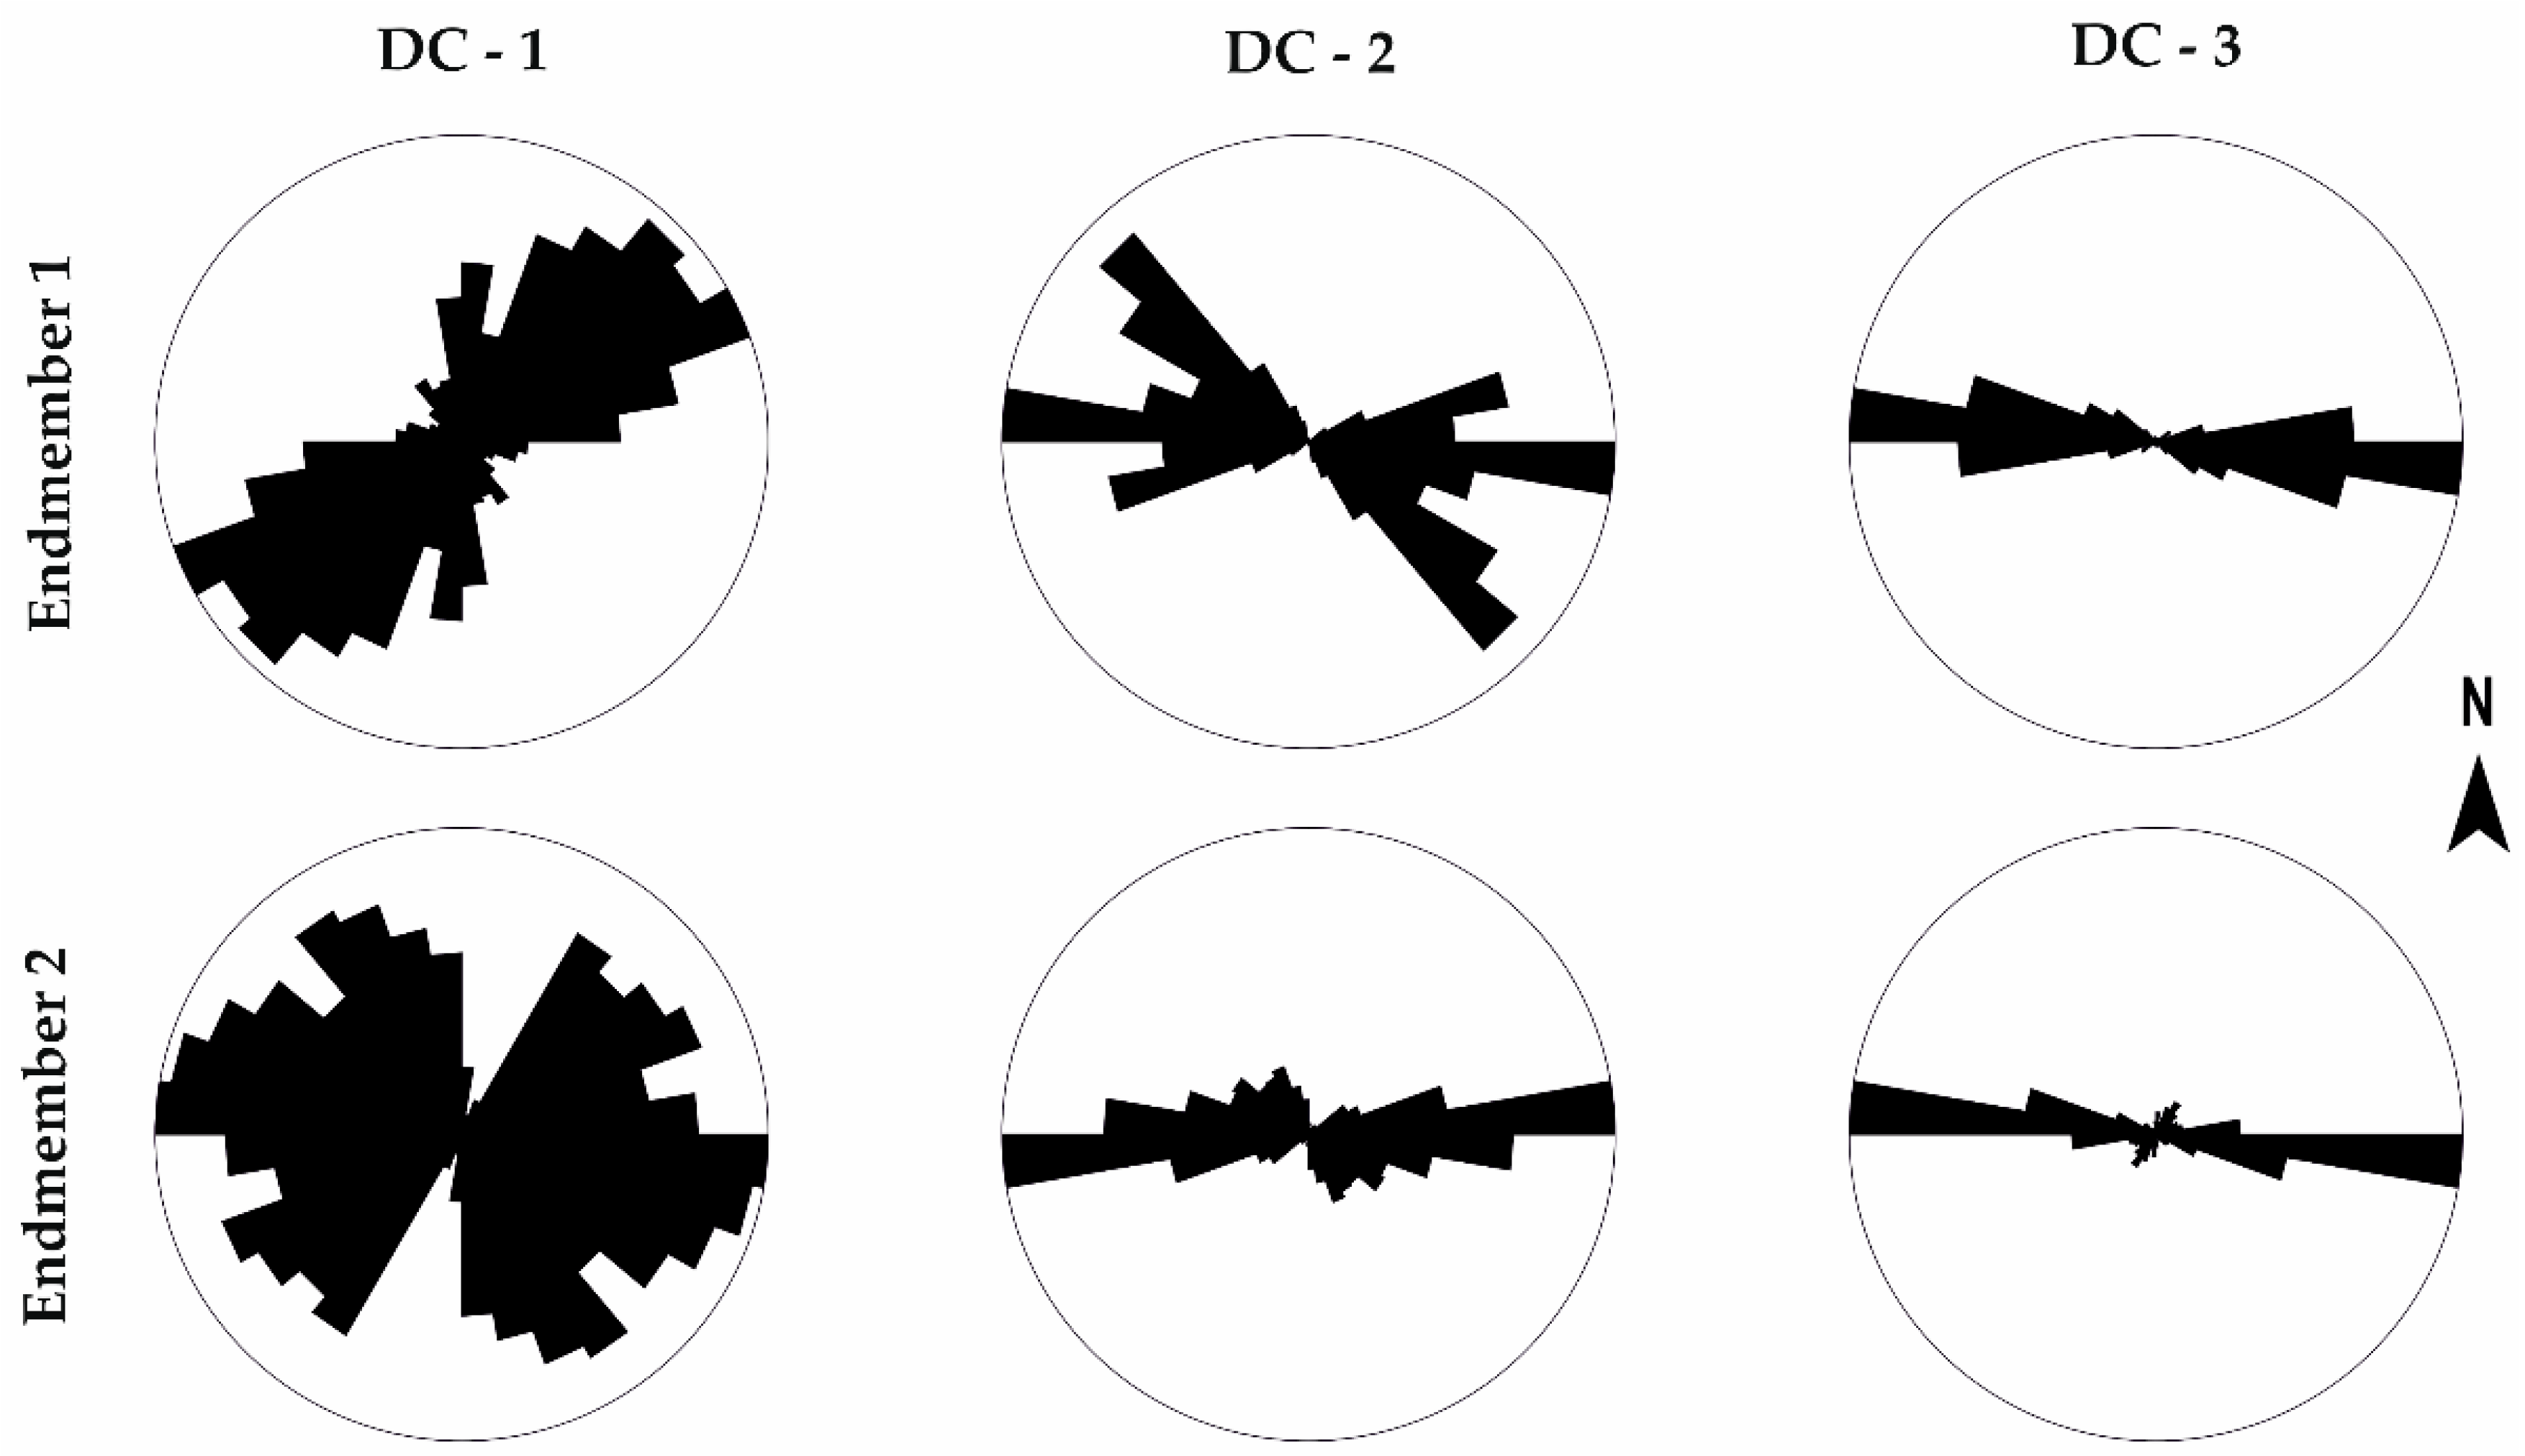
By using the centreline of the extracted features, the azimuth of the different vein types can be evaluated in each of the endmembers (
Figure 9). An E-W horizontal orientation of the drill-cores is considered as shown in
Figure 8, for illustrative purposes. For the integration of the data into a 3D model, the orientation of the drill-hole should be considered. The orientation and abundance of the veins are highly variable within the three tested drill-core samples, particularly in samples DC-1 and DC-2, which were taken from the same drill-hole at different depths. Additionally, an overlap in the orientation of the veins identified in the two vein-related endmembers can also be observed. In sample DC-2, the overlap between the two orientations is mostly caused by the similar dominant azimuth between the two main vein types. In sample DC-3, however, the overlap is due to the extraction of the inner composition of the vein from the first endmember and the extraction of the vein alteration halo from the second endmember.
The abundance of each vein type is quantified based on the surface percent within the samples (
Table 3). For samples DC-1 and DC-2, endmembers 1 and 2 are representative of particular vein types. For sample DC-3, endmember 1 is representative of the alteration halo whereas endmember 2 is characteristic of the internal vein composition, which is aspectral, being composed predominantly of sulphides. Endmember 3, for samples DC-1 and DC-2, refers to the rock matrix, so by mapping the minimum abundance in the image (dark phase), the total amount of veins with a considerable thickness or distinct alteration halo are extracted. Due to the large thickness of the alteration halo of the D-vein in Sample DC-3, for endmember 3, mainly characteristic of pervasive alteration, the edges of the alteration halo and the small presence of chlorite with the sulphide in the vein are extracted as linear structures.
The structural features extracted from images obtained from band ratios are characteristic of white mica abundance. Due to the location of the samples in the potassic and sodic-calcic zones of the system, the phyllic alteration is be dominantly related to vein halos.
6. Validation of Results
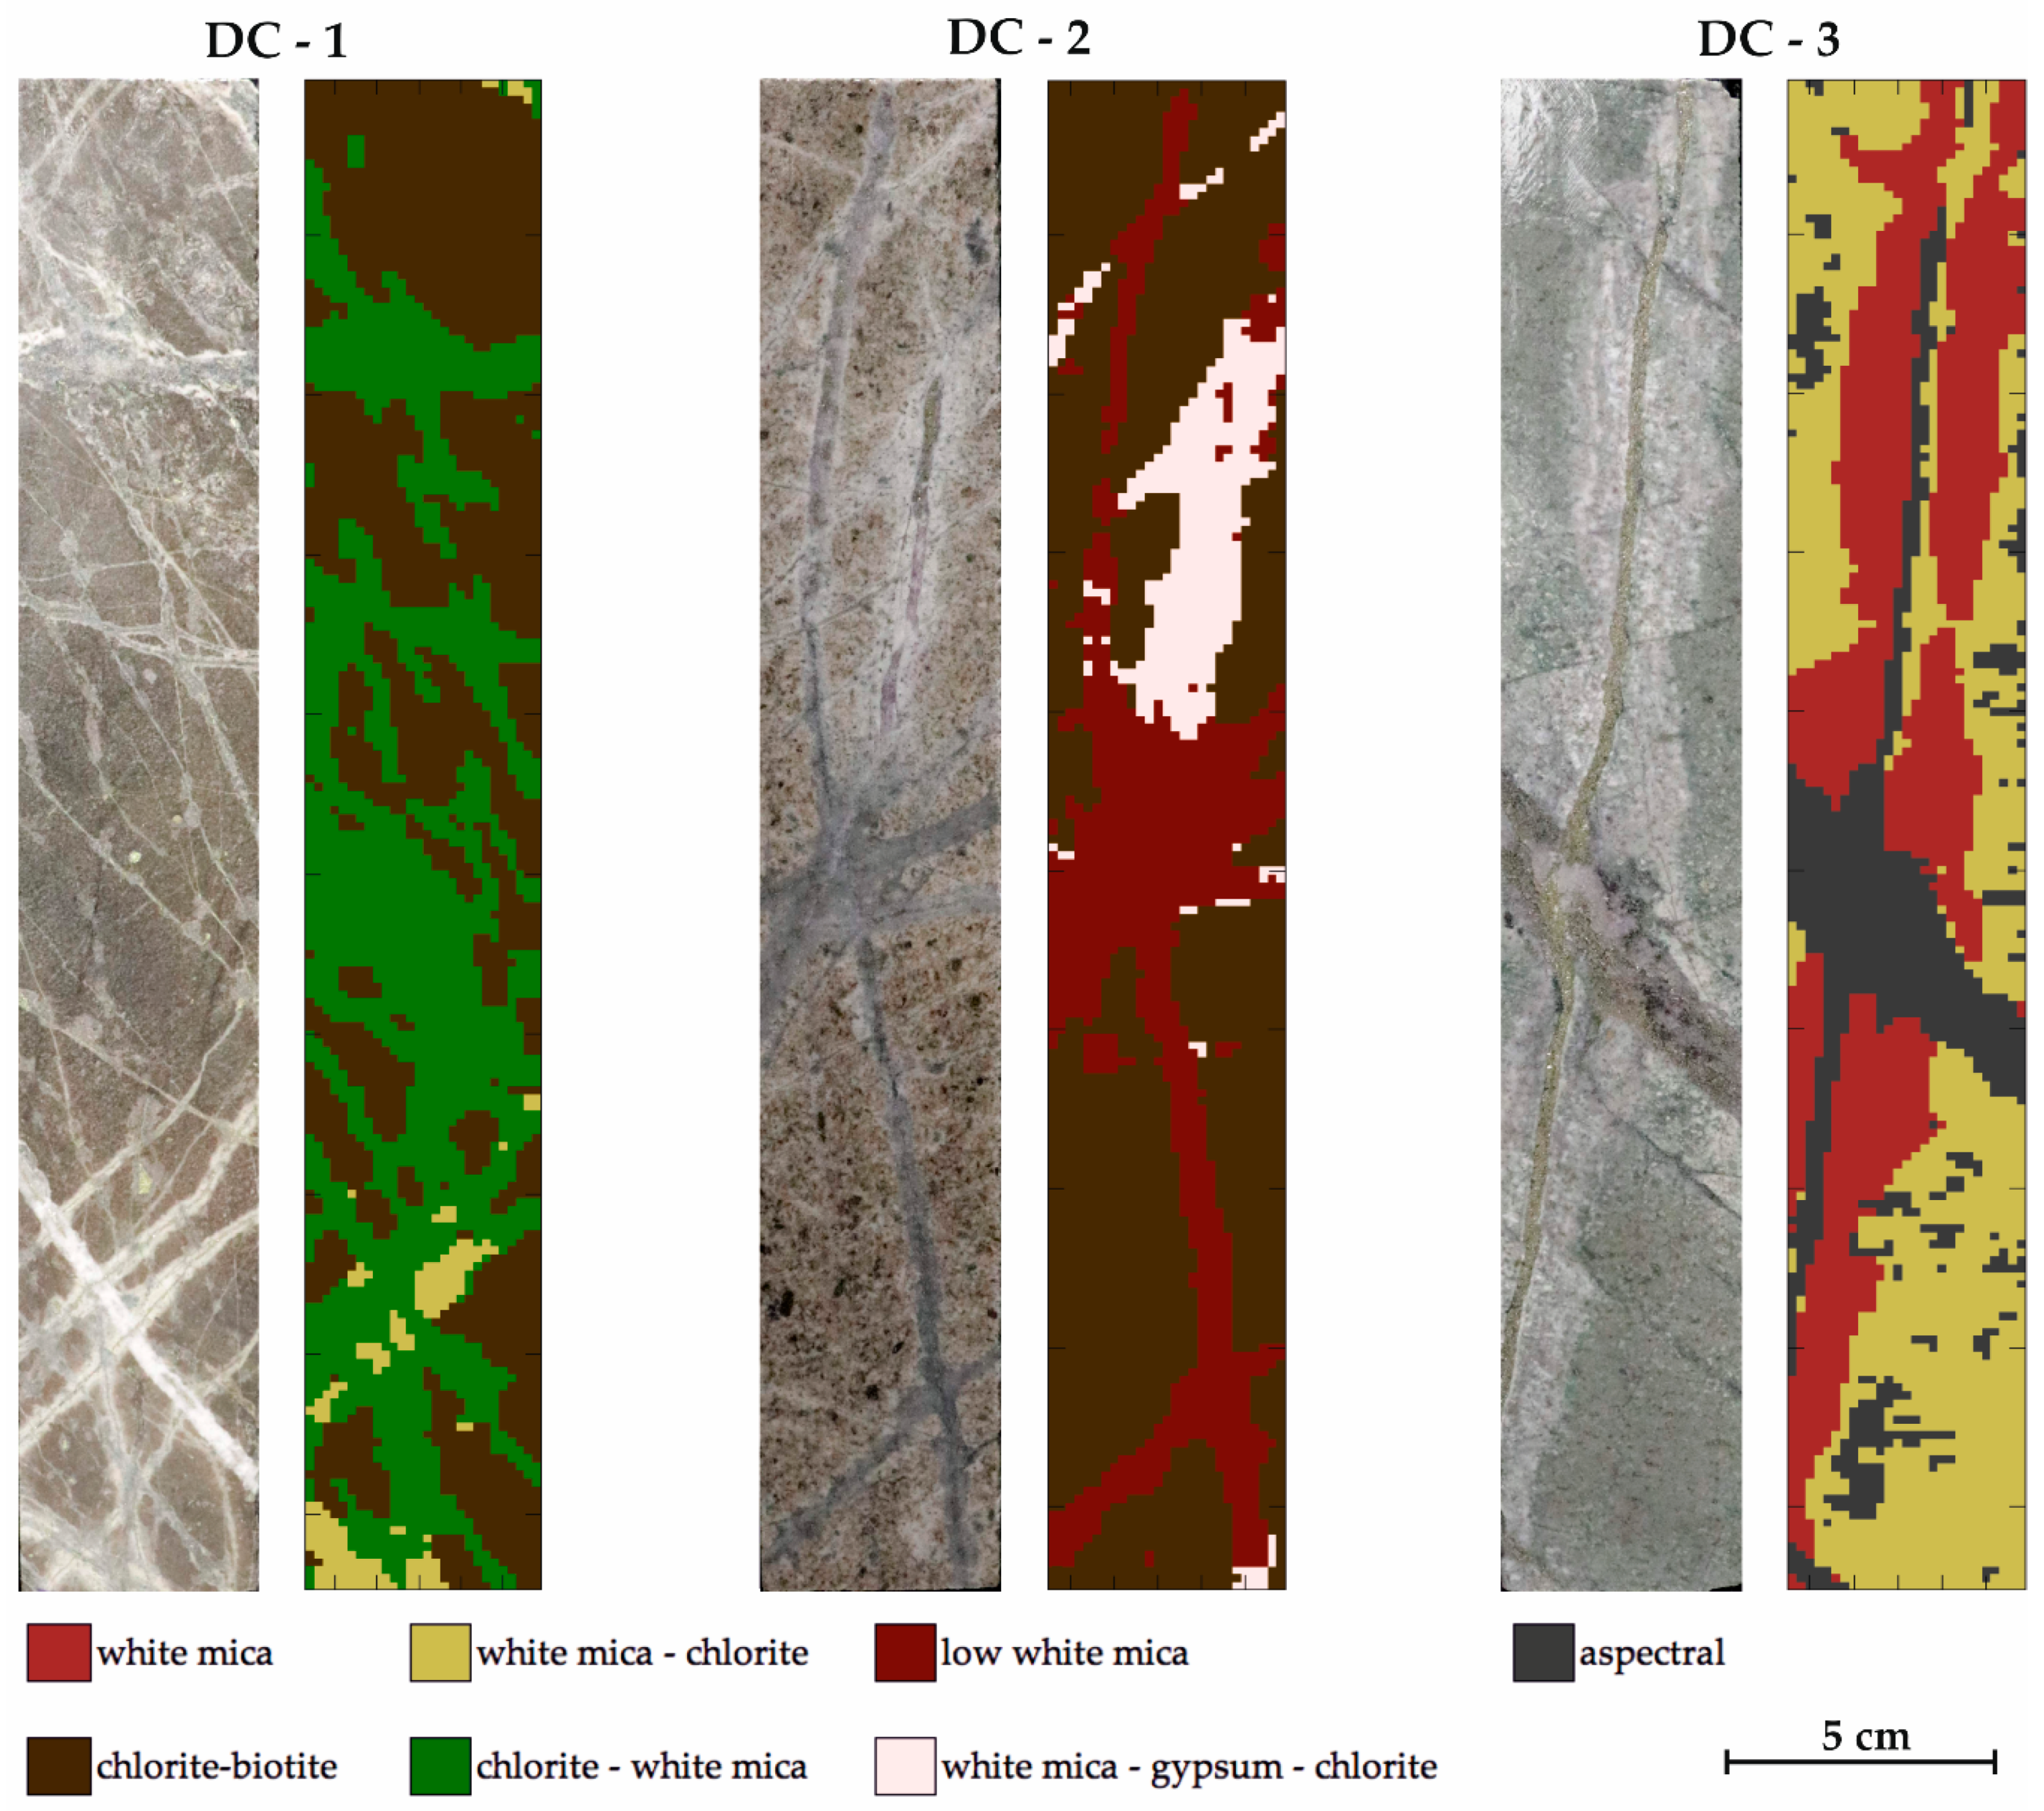
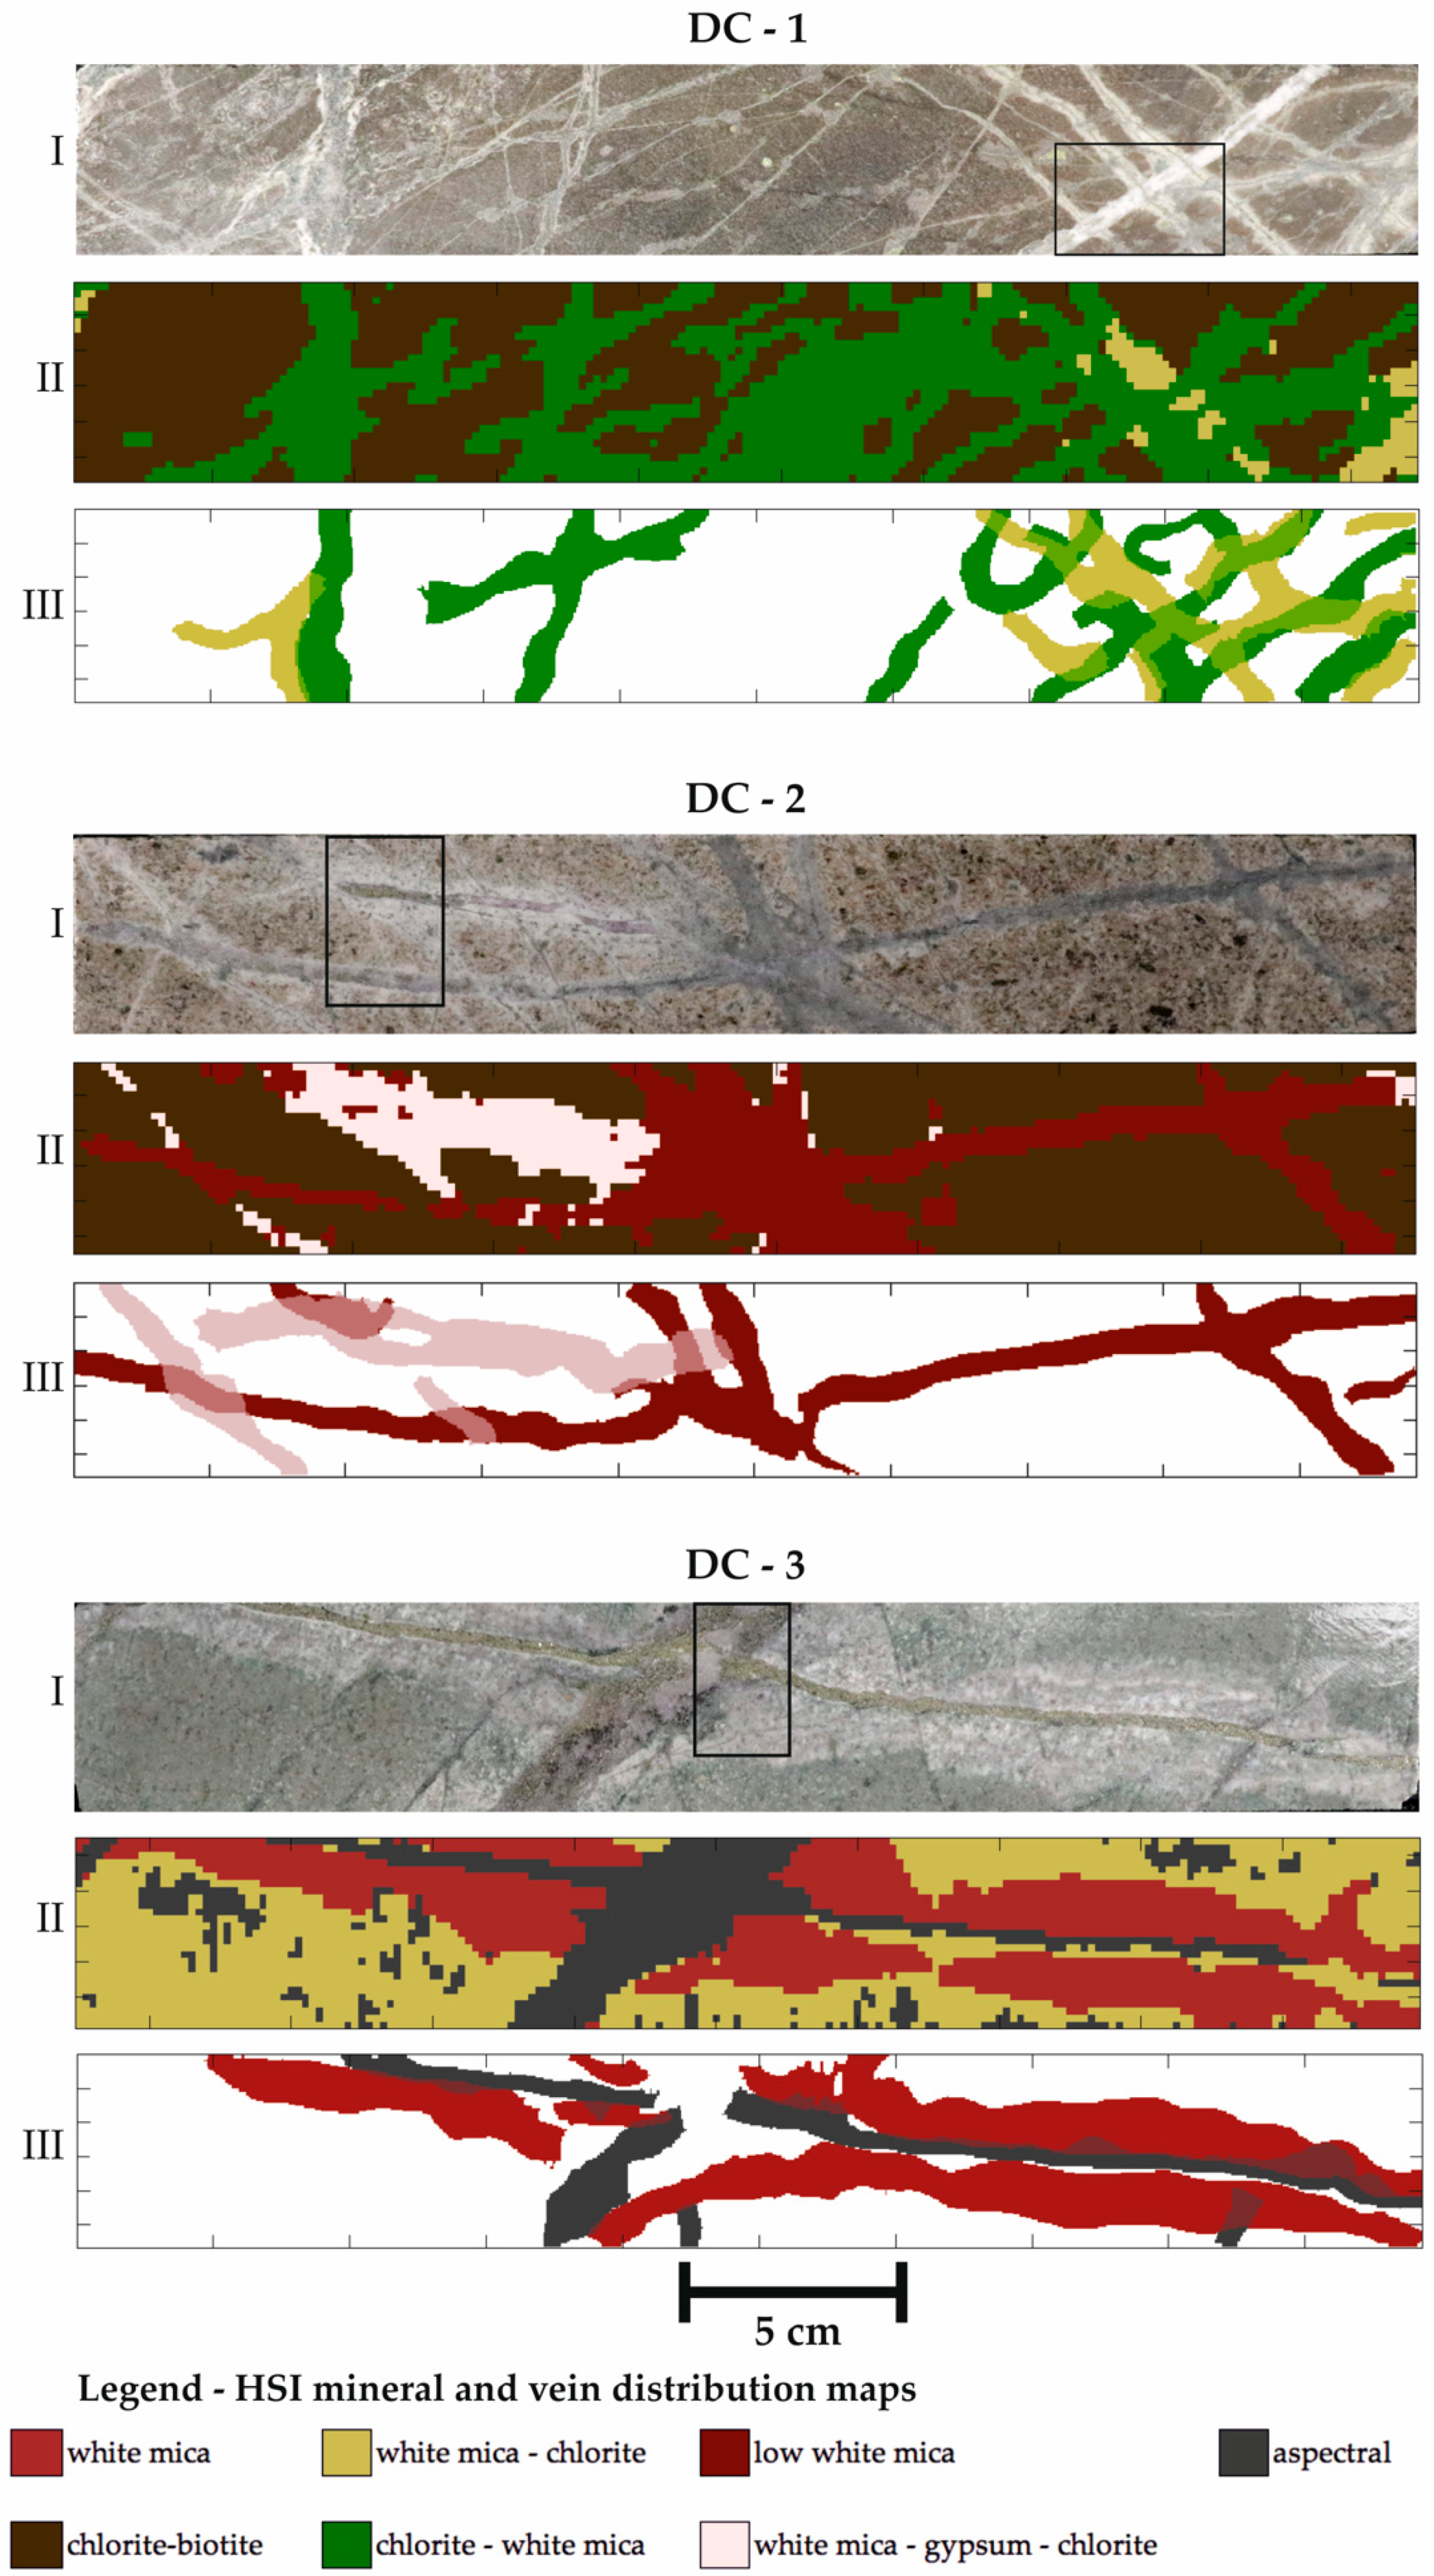
MLA mineral maps can be used to locally validate hyperspectral data processing results. As a first step, the RGB images, HSI-based maximum abundance mineral maps and vein distribution maps are illustrated together with markings of the location of the thin sections analysed by MLA on the RGB images (
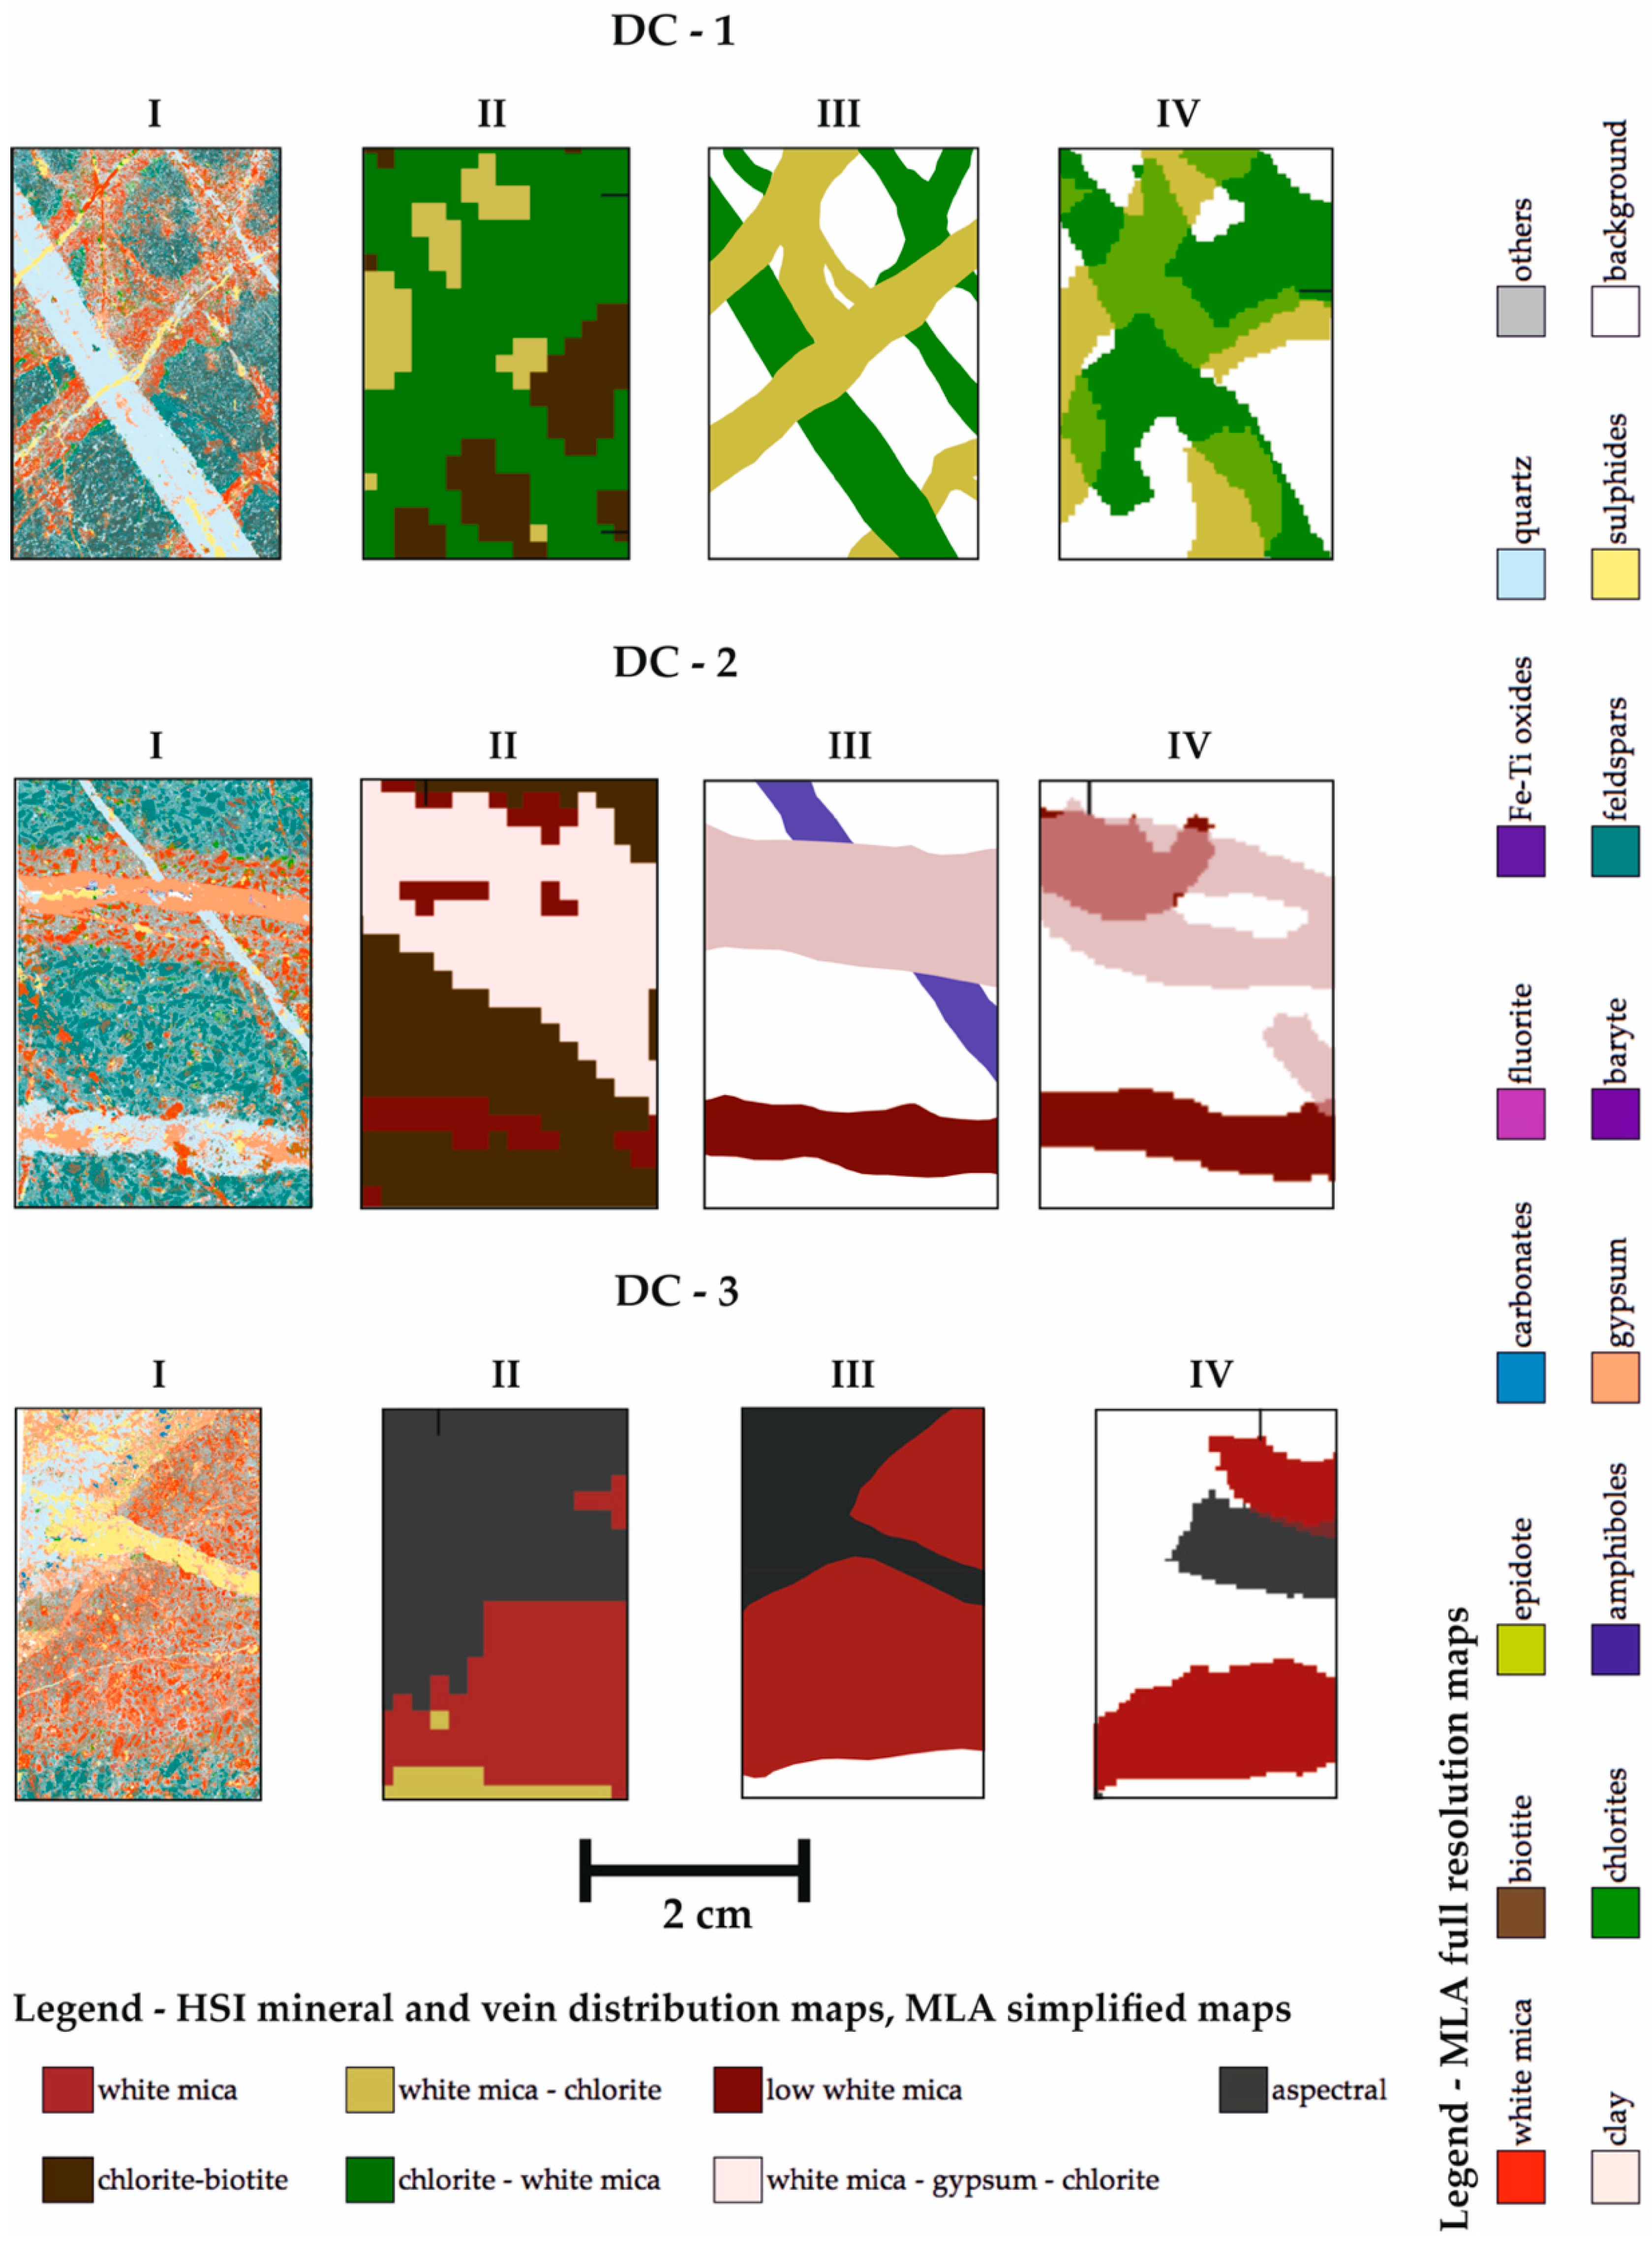
Figure 10). For further analysis, the MLA mineral maps, digitised simplified MLA maps, HIS-based maximum abundance maps, and the vein distribution maps are presented together at the field of view of the thin section (
Figure 11). A slight but consistent shift between the MLA maps and HSI vein maps can be observed for most of the samples. This shift is caused by the orientation (dip) of the vein, as around 0.5 mm of material is lost during sample preparation between the analysed surface of the drill-core and the surface of the thin section. As most vein types are vertical and subvertical in relation to the surface of the sample, the presence of the small shift in the location of the vein is generally 1 mm or smaller, and it does not strongly impact the hyperspectral data classification validation procedure.
For the three studied samples, the evaluation of the SWIR-active mineralogy is consistent with the main minerals identified by MLA, including white mica, chlorites, biotite and calcium sulphate, here described as gypsum. The presence of calcium sulphate in some of the MLA maps and the absence of gypsum in the mineral maps suggests the occurrence of SWIR inactive anhydrite rather than SWIR-active gypsum.
Based on the abundance of the different veins in each sample, several features were selected and marked on the simplified MLA vein maps, for the evaluation of the vein extraction performance (
Figure 12). Five veins were selected in sample DC-1, three in sample DC-2, and three features characteristic of either vein, or vein halos in sample DC-3.
Most of the marked features in sample DC-1 show a good correspondence between the data obtained from MLA and the extracted structural features. The areas where 2 veins crosscut each other cause, however, overlaps and shifts between the extracted features. This is similar in sample DC-2, where features 1 and 2 are well extracted. Yet, one of the veins described in the MLA map (in purple) is not identified in the HSI-based vein distribution map as distinct but rather as a mixture or overlap between two vein types. The reason for this is the small width of the vein in relation to the spatial resolution of the hyperspectral camera (1.5 mm/pixel), as well as its composition, intermediate between the two main veins, which were extracted. In sample DC-3, a relatively good extraction of feature 1, representative of the sulphide vein, is observed, as well as a good overlap of its alteration halo extent (feature 3). The thicker aspectral vein (feature 2), on the other hand, was not well extracted from the HSI data.
For numerical evaluation of the performance of the vein extraction tool, vein distribution maps and digitised simplified MLA maps are used. For this purpose, the orientation and thickness accuracy of each selected feature is analysed where possible (
Table 4). Features 2 and 3 in sample DC-3 could not be evaluated in terms of thickness and orientation due to their incomplete capture in the MLA mineral map.
The orientation is analysed using the average angle of the veins on different centre segments. The average thickness calculated on the intersection of the overlap is used for the vein thickness evaluation. Up to 4.5° azimuth deviation was observed for the vein orientation between the HSI and MLA-based vein analysis. Regarding the extracted thickness, the accuracy ranged between 65% and 95%, with a mean value of 81%, by considering all the veins and of 85% by considering only veins of thickness higher than the spatial resolution of the used hyperspectral sensor.
7. Discussion
The suggested workflow for processing of the VNIR-SWIR hyperspectral drill-core scans consists of a sequence of endmember extraction, spectral unmixing, mineral mapping and vein extraction techniques. The workflow is used for development of mineral maps; a suite of geomorphological analysis tools can then be used to extract the vein distribution and architecture from endmember abundance and band ratio images.
The mapping of veins, quantification of their distribution and understanding of the dependency between the alteration assemblage surrounding different vein-types is essential to the mapping and evaluation of stockwork-type deposits, such as Cu porphyry type deposits. The proposed methodology is shown to provide insight into the vein type variability, distribution and quantification within the selected samples. This methodology has the potential to provide fast and unbiased compositional and quantitative vein information which can become a valuable tool for a running exploration project, allowing for fast evaluation of the distribution and abundance of vein-related and pervasive alteration assemblages.
Visual analysis of drill-core trays from the studied porphyry has shown that in the core of the system, the degree of mineralogical variation in one drill-core tray is similar to what is observed and analysed at drill-core sample scale. As a result, implementation of the proposed method at the scale of the drill-core tray (
Figure 2) would be appropriate for providing a fast evaluation of the main vein and alteration styles. Even though the three endmembers provide sharp abundance maps for both mineral mapping and vein extraction, a necessity for more information on the composition of the alteration minerals arises. It is common that a general zonality of the white mica and chlorite compositions is observed at deposit scale [
48]; however, in the case of porphyry deposits, this zonation can also be observed at drill-core scale. Both white mica and chlorite tend to be present in variable amounts within the sample, but their composition is highly dependent on the proximity to the different vein types. In samples DC-1 and DC-2, the mica shows a more phengitic composition, and the chlorites a rather high Fe: Mg ratio in the proximity of the veins, while in sample DC-3, an inverse relationship is observed. Although the location of the absorption minima for white mica is likely to be shifted to higher wavelengths when chlorite is abundant, a strong heterogeneity in white mica chemistry was observed in SEM spectra. The dependency of the white mica and chlorite chemistry to the stage of the mineralization or to the composition of the pervasive alteration is still to be researched.
For vein extraction, the results appear promising, in terms of both vein thickness and orientation estimation, considering the high degree of automation of the method. By using different values of the sigma filter for each sample a more controlled extraction of the veins could be achieved. However, using thresholds for vein thickness is difficult when the alteration halo around veins shows a diffuse character and gradual transition into the (less altered) host rock. In such cases, the choice in threshold remains rather subjective. Furthermore, features which do not represent veins but rather clusters in the matrix may also be included.
Due to the difficulty in the selection of the number of endmembers in an industry-scale operation, the extraction of veins could also be achieved from minimum wavelength maps or band ratio images characteristic of a specific mineral or mineral assemblages such as hydrated calcium sulphate in any pervasive alteration zone, white mica in the potassic and sodic-calcic alteration zones, or chlorite in the phyllic zone. The high abundance-based extraction of these features could lead to the mapping of selected veins. A positive performance for this purpose was obvious for sample DC-1 where some of the thinner veins, which are not extracted from endmember abundance maps, were recognized in the band ratio image illustrative of white mica abundance. Another approach could be the mapping of the low abundance of hydrated phases using the abundance of the water feature around either 1400 nm or 1900 nm. In this manner, wide sulphide veins presenting an alteration halo would be extracted. Such an example can be seen also for the band ratio for sample DC-3 where the sulphide and sulphide-quartz veins are extracted.
8. Conclusions
In this contribution, a novel methodology for extracting and complementing mineralogical and structural features from hyperspectral drill-core scans is introduced. The workflow consists of three main steps: (1) endmember extraction and spectral unmixing, followed by (2) mineral mapping, and (3) vein extraction. The N-Findr algorithm is used on hyperspectral scans to extract potential endmembers. Fully constrained linear spectral unmixing is then performed in order to obtain mineral abundance maps. These maps are further used for mineral mapping by the analysis of the maximum abundance in each pixel. Finally, potential veins are identified in abundance maps using an approach based on Steger’s detector of curvilinear features, which combines ridge and edge detection. This approach allows for the extraction of veins as vectorised lines or polygons. The proposed methodology shows very good performance with regard to:
Distinguishing between pervasive and vein-related alteration mineralogy through mineral maps and vein distribution maps;
Mapping different vein types based on their alteration halo or intrinsic composition when minerals such as gypsum or carbonates are part of the vein;
Vein density estimation based on their surface abundance;
Evaluation of the orientation (azimuth) of different vein types;
The degree of automation in comparison with existent techniques;
High potential for the compositional and numerical data to be integrated in a 3D model in ongoing exploration campaigns;
There is a strong link between the performance of the vein extraction tool, the chosen number of endmembers, and the performance of the endmember extraction algorithm. With an increase in the selected number of endmembers, a higher resolution is added to the mineralogical variation within the samples. However, this will lead to abundance maps of reduced sharpness, and therefore will negatively influence the performance of the vein extraction algorithm. Further work is necessary for the development of algorithms for the estimation of the virtual dimensionality of the data and therefore a consistent number of endmembers.
Author Contributions
Conceptualization, L.T., L.A., R.G. and J.G.; methodology, L.T. and L.A.; software, L.T., L.A., M.K. and C.C.; validation, L.T. and R.G.; formal analysis, L.T., L.A., M.K. and C.C.; investigation, L.T. and L.A.; resources, P.I.; data curation, L.T. and L.A.; writing—original draft preparation, L.T. and L.A.; writing—review and editing, all authors.; visualization, L.T. and L.A.; supervision, R.G. and J.G.; project administration, L.T., L.A., R.G. and J.G.
Funding
This research received no external funding.
Acknowledgments
Eldorado Gold Corporation is acknowledged for sample availability and on-site support. Robert Zimmerman is gratefully thanked for the support during data acquisition and Sandra Lorenz for the MEPHySTo toolbox for the hyperspectral data pre-processing. Reviews from Moritz Kirsch and Margret Fuchs have improved the manuscript. The Assistant Editor is thanked for handling the manuscript and the two anonymous reviewers for constructive comments.
Conflicts of Interest
The authors declare no conflict of interest.
Appendix A
The analysis of the white mica composition and abundance is performed in the wavelength range of 2175 and 2235 nm and for chlorites between 2235 and 2273 nm on continuum removed spectral subsamples in the mentioned ranges. However, only the ranges with a minimum representative of mica (2180–2228 nm) and chlorite (2240–2263 nm) are illustrated (
Figure A1), lower and higher wavelengths of minima being masked. A variation in the maximum feature depth between the samples is present for both chlorite and white mica and therefore the different depths are shown for each drill-core. For the first two samples it can be observed that an intermediate phengitic (higher wavelength) composition of the white mica and an intermediate to iron-rich composition of the chlorites are dominant surrounding the veins, while the pervasive alteration is characterized by a low abundance of the mica of paragonitic composition and a high abundance of chlorites and biotite of magnesian composition. These properties are inversed in the third sample. For the thinner sulphide vein where the white mica has a paragonitic composition next to the vein and an intermediate composition in the halo with phengitic spots. The chlorite composition for this vein halo is intermediate towards magnesian. In the matrix the chlorite shows a strong ferric composition. The second vein, however, exhibits a dominance of the intermediate mica and intermediate to ferric chlorites. The spectral analyses results obtained from minimum wavelength are overall consistent with the analyses of the endmembers spectral features.
Figure A1.
Minimum wavelength maps for white mica (left) and chlorites (right) for the three analyzed samples (WM = white micas, Chl = chlorites).
Figure A1.
Minimum wavelength maps for white mica (left) and chlorites (right) for the three analyzed samples (WM = white micas, Chl = chlorites).
Appendix B
Figure A2.
Results of the vein extraction performed on binary images resulting from a band math calculation representative of the abundance of white mica: 2170/2206. I = endmember abundance map, II = extracted ridges for sigma ranging from 3 to 10 and thresholds ranging from 98% to 92%, III = overlapping polygons after connecting extracted lines to their respective edges (features detected with wider range of sigma are brighter), IV = extracted veins after merging all polygons.
References
- Kruse, F.A. Identification and Mapping of Minerals in Drill Core Using Hyperspectral Image Analysis of Infrared Reflectance Spectra. Int. J. Remote Sens. 1996, 17, 1623–1632. [Google Scholar] [CrossRef]
- Wang, D.; Lagerstrom, R.; Sun, C.; Laukamp, C.; Quigley, M.; Whitbourn, L.; Mason, P.; Connor, P.; Fisher, L. Automated Vein Detection for Drill Core Analysis by Fusion of Hyperspectral and Visible Image Data. In Proceedings of the 2016 23rd International Conference on Mechatronics and Machine Vision in Practice (M2VIP), Nanjing, China, 28–30 November 2017. [Google Scholar] [CrossRef]
- Clark, R.N.; Boardman, J.; Mustard, J.; Kruse, F.; Ong, C.; Pieters, C.; Swayze, G.A. Mineral Mapping and Applications of Imaging Spectroscopy. In Proceedings of the 2006 IEEE International Symposium on Geoscience and Remote Sensing, Denver, CO, USA, 31 July–4 August 2006; pp. 1986–1989. [Google Scholar] [CrossRef]
- Kruse, F.A.; Weatherbee, O.; Peppin, W.; Bedell, R.; Calvin, W.; Taranik, J.V. HSI Mineral Mapping from Airborne, Outcrop, and Drill-Core Perspectives. In Proceedings of the SPIE Symposium on Defense and Security, Orlando, FL, USA, 4 May 2010. [Google Scholar] [CrossRef]
- Tappert, M.; Rivard, B.; Giles, D.; Tappert, R.; Mauger, A. Automated Drill Core Logging Using Visible and Near-Infrared Reflectance Spectroscopy: A Case Study from the Olympic Dam Iocg Deposit, South Australia. Econ. Geol. 2011, 106, 289–296. [Google Scholar] [CrossRef]
- Kruse, F.A.; Bedell, R.L.; Taranik, J.V.; Peppin, W.A.; Weatherbee, O.; Calvin, W.M. Mapping Alteration Minerals at Prospect, Outcrop and Drill Core Scales Using Imaging Spectrometry. Int. J. Remote Sens. 2012, 33, 1780–1798. [Google Scholar] [CrossRef] [PubMed]
- GMEX. Spectral Interpretation Field Manual; AusSpec International Ltd.: Arrowtown, New Zealand, 1997; Volume I. [Google Scholar]
- Schwartz, G.M. Hydrothermal Alteration. Econ. Geol. 1959, 54, 161–183. [Google Scholar] [CrossRef]
- Pour, A.B.; Hashim, M. Identification of Hydrothermal Alteration Minerals for Exploring of Porphyry Copper Deposit Using ASTER Data, SE Iran. J. Asian Earth Sci. 2011, 42, 1309–1323. [Google Scholar] [CrossRef]
- Roache, T.J.; Walshe, J.L.; Huntington, J.F.; Quigley, M.A.; Yang, K.; Bil, B.W.; Blake, K.L.; Hyvärinen, T. Epidote-Clinozoisite as a Hyperspectral Tool in Exploration for Archean Gold. Aust. J. Earth Sci. 2011, 58, 813–822. [Google Scholar] [CrossRef]
- Wilkinson, J.J.; Chang, Z.; Cooke, D.R.; Baker, M.J.; Wilkinson, C.C.; Inglis, S.; Chen, H.; Bruce Gemmell, J. The Chlorite Proximitor: A New Tool for Detecting Porphyry Ore Deposits. J. Geochem. Explor. 2015, 152, 10–26. [Google Scholar] [CrossRef]
- Taylor, G.S. Mineral and Lithology Mapping of Drill Core Pulps Using Visible and Infrared Spectrometry. Nat. Resour. Res. 2000, 9, 257–268. [Google Scholar] [CrossRef]
- Huntington, J.F.; Mauger, A.J.; Skirrow, R.G.; Bastrakov, E.N.; Connor, P.; Mason, P.; Keeling, J.L.; Coward, D.A.; Berman, M.; Phillips, R.; et al. Automated Mineralogical Core Logging at the Emmie Bluff Iron Oxide- Copper- Gold Prospect. Mesa J. 2006, 41, 38–44. [Google Scholar]
- Mauger, A.J.; Keeling, J.L.; Huntington, J.F. Alteration Mapping of the Tarcoola Goldfield (South Australia) Using a Suite of Hyperspectral Methods. Appl. Earth Sci. 2007, 116, 2–12. [Google Scholar] [CrossRef]
- Asadzadeh, S.; de Souza Filho, C.R. A Review on Spectral Processing Methods for Geological Remote Sensing. Int. J. Appl. Earth Obs. Geoinf. 2016, 47, 69–90. [Google Scholar] [CrossRef]
- Mathieu, M.; Roy, R.; Launeau, P.; Cathelineau, M.; Quirt, D. Alteration Mapping on Drill Cores Using a HySpex SWIR-320m Hyperspectral Camera: Application to the Exploration of an Unconformity-Related Uranium Deposit (Saskatchewan, Canada). J. Geochemical Explor. 2017, 172, 71–88. [Google Scholar] [CrossRef]
- Van Ruitenbeek, F.J.A.; Bakker, W.H.; Van Der Werff, H.M.A.; Zegers, T.E.; Oosthoek, J.H.P.; Omer, Z.A.; Marsh, S.H.; Van Der Meer, F.D. Mapping the Wavelength Position of Deepest Absorption Features to Explore Mineral Diversity in Hyperspectral Images. Planet. Space Sci. 2014, 101, 108–117. [Google Scholar] [CrossRef]
- Asadzadeh, S.; De Souza Filho, C.R. Iterative Curve Fitting: A Robust Technique to Estimate the Wavelength Position and Depth of Absorption Features from Spectral Data. IEEE Trans. Geosci. Remote Sens. 2016, 54, 5964–5974. [Google Scholar] [CrossRef]
- Kopăcková, V.; Koucká, L. Integration of Absorption Feature Information from Visible to Longwave Infrared Spectral Ranges for Mineral Mapping. Remote Sens. 2017, 9, 1006. [Google Scholar] [CrossRef]
- Simpson, M.P. Reflectance Spectrometry [SWIR] of Alteration Minerals Surrounding the Favona Epithermal Vein. Waihi Vein System, Hauraki Goldfield. In Proceedings of the AusIMM New Zealand Branch Annual Conference, Dunedin, New Zeeland, 30 August–2 September 2015; pp. 490–499. [Google Scholar]
- Turner, D.; Rivard, B.; Groat, L. Rare Earth Element Ore Grade Estimation of Mineralized Drill-Core from Hyperspectral Imaging Spectroscopy. In Proceedings of the 2014 IEEE Geoscience and Remote Sensing Symposium, Quebec City, QC, Canada, 13–18 July 2014; pp. 4612–4615. [Google Scholar]
- Farooq, A.; Qurat-ul-ain, F. Pixel Purity Index Algorithm and N-Dimensional Visualization for ETM+ Image Analysis: A Case of District Vehari. Glob. J. Hum. Soc. Sci. Arts Hum. 2012, 12, 23–32. [Google Scholar]
- Lowell, J.D.; Guilbert, J.M. Lateral and Vertical Alteration-Mineralization Zoning in Porphyry Ore Deposit. Econ. Geol. 1970, 65, 35. [Google Scholar] [CrossRef]
- Sillitoe, R.H. Porphyry Copper Systems. Econ. Geol. 2010, 105, 3–41. [Google Scholar] [CrossRef]
- Papari, G.; Petkov, N. Edge and Line Oriented Contour Detection: State of the Art. Image Vis. Comput. 2011, 29, 79–103. [Google Scholar] [CrossRef]
- Kirbas, C.; Quek, F. A Review of Vessel Extraction Techniques and Algorithms. ACM Comput. Surv. 2004, 36, 81–121. [Google Scholar] [CrossRef]
- Frangi, A.; Niessen, W.; Vincken, K.; Viergever, M. Multiscale Vessel Enhancement Filtering. In International Conference on Medical Image Computing and Computer-Assisted Intervention; Springer: Berlin/Heidelberg, Germany, 1998; pp. 130–137. [Google Scholar]
- Jin, J.; Yang, L.; Shang, X.; Ding, M. Vascular Tree Segmentation in Medical Images Using Hessian-Based Multiscale Filtering and Level Set Method. Comput. Math. Methods Med. 2013, 9, 502013. [Google Scholar] [CrossRef] [PubMed]
- Steger, C. An Unbiased Detector of Curvilinear Structures. IEEE Trans. Pattern Anal. Mach. Intell. 1998, 20, 113–125. [Google Scholar] [CrossRef]
- Gu, Y. Automated Scanning Electron Microscope Based Mineral Liberation Analysis. J. Miner. Mater. Charact. Eng. 2003, 2, 33–41. [Google Scholar] [CrossRef]
- Milu, V.; Leroy, J.L.; Piantone, P. Le Gisement de Cuivre-or de Bolcana (Monts Métallifères Roumanie): Premières Données Sur Les Altérations et Minéralisations Associées. Comptes R. Geosci. 2003, 335, 671–680. [Google Scholar] [CrossRef]
- Berbeleac, I.; Udubaşa, S.S.; Iatan, E.-L.; Vişan, M. Geological and Structural Constraints on the Localization of Neogene Porphyry—Epithermal Related Cu-Au (Mo), and Epigenetic Hydrothermal Deposits/Prospects from South Apuseni Mts., Romania. J. Miner. Depos. 2014, 87, 47–52. [Google Scholar]
- Cioacǎ, M.E.; Munteanu, M.; Qi, L.; Costin, G. Trace Element Concentrations in Porphyry Copper Deposits from Metaliferi Mountains, Romania: A Reconnaissance Study. Ore Geol. Rev. 2014, 63, 22–39. [Google Scholar] [CrossRef]
- Roşu, E.; Pécskay, Z.; Stefan, A.; Popescu, G.C.; Panaiotu, C.; Panaiotu, C.E. The Evolution Of the Neogene Volcanism In the Apuseni Mountains (Rumania) - Constraints From New K-Ar Data. Geol. Carpathica 1997, 48, 353–359. [Google Scholar]
- Roşu, E.; Seghedi, I.; Downes, H.; Alderton, D.H.M.; Szakács, A.; Pécskay, Z.; Panaiotu, C.; Panaiotu, C.; Nedelcu, L. Extension-Related Miocene Calc-Alkaline Magmatism in the Apuseni Mountains, Romania: Origin of Magmas. Schweiz. Mineral. Petrogr. Mitt. 2004, 84, 153–172. [Google Scholar] [CrossRef]
- Neubauer, F.; Lips, A.; Kouzmanov, K.; Lexa, J.; Ivǎşcanu, P. 1: Subduction, Slab Detachment and Mineralization: The Neogene in the Apuseni Mountains and Carpathians. Ore Geol. Rev. 2005, 27, 13–44. [Google Scholar] [CrossRef]
- Pécskay, Z.; Lexa, J.; Szakács, A.; Seghedi, I.; Balogh, K.; Konečný, V.; Zelenka, T.; Kovacs, M.; Póka, T.; Fülöp, A.; et al. Geochronology of Neogene Magmatism in the Carpathian Arc and Intra-Carpathian Area. Geol. Carpath. 2006, 57, 511–530. [Google Scholar]
- Blannin, R. Metal Deportment and Ore Variability Studies of the Bolcana Porphyry Copper—Gold System, Apuseni Mountains, Romania. Master’s Thesis, TU Bergakademie Freiberg, Freiberg, Germany, 2018. [Google Scholar]
- Jakob, S.; Zimmermann, R.; Gloaguen, R. The Need for Accurate Geometric and Radiometric Corrections of Drone-Borne Hyperspectral Data for Mineral Exploration: MEPHySTo-A Toolbox for Pre-Processing Drone-Borne Hyperspectral Data. Remote Sens. 2017, 9, 88. [Google Scholar] [CrossRef]
- Ruffin, C.; King, R.L. The Analysis of Hyperspectral Data Using Savitzky-Golay Filtering-Theoretical Basis. 1. In Proceedings of the IEEE 1999 International Geoscience and Remote Sensing Symposium IGARSS’99 (Cat. No. 99CH36293), Hamburg, Germany, 28 June–2 July 1999; pp. 756–758. [Google Scholar] [CrossRef]
- Fandrich, R.; Gu, Y.; Burrows, D.; Moeller, K. Modern SEM-Based Mineral Liberation Analysis. Int. J. Miner. Process. 2007, 84, 310–320. [Google Scholar] [CrossRef]
- Winter, M.E. N-FINDR: An Algorithm for Fast Autonomous Spectral End_Member Determination in Hyperspectral Data. In Proceedings of the SPIE’s International Symposium on Optical Science, Engineering, and Instrumentation, Denver, CO, USA, 27 October 1999. [Google Scholar] [CrossRef]
- Plaza, A.; Chang, C.-I. An Improved N-FINDR Algorithm in Implementation; Proceedings of SPIE—The International Society for Optical Engineering: Bellingham, WA, USA, 2005; p. 298. [Google Scholar] [CrossRef]
- Silván-Cárdenas, J.L.; Wang, L. Fully Constrained Linear Spectral Unmixing: Analytic Solution Using Fuzzy Sets. IEEE Trans. Geosci. Remote Sens. 2010, 48, 3992–4002. [Google Scholar] [CrossRef]
- Li, H.; Chang, C.I. Linear Spectral Unmixing Using Least Squares Error, Orthogonal Projection and Simplex Volume for Hyperspectral Images. In Proceedings of the 2015 7th Workshop on Hyperspectral Image and Signal Processing: Evolution in Remote Sensing (WHISPERS), Tokyo, Japan, 2–5 June 2015; pp. 1–4. [Google Scholar]
- Gustafson, L.B.; Hunt, J.P. The Porphyry Copper Deposit at El Salvador, Chile. Econ. Geol. 1975, 70, 857–912. [Google Scholar] [CrossRef]
- Gomez, C.; Lagacherie, P.; Coulouma, G. Continuum Removal versus PLSR Method for Clay and Calcium Carbonate Content Estimation from Laboratory and Airborne Hyperspectral Measurements. Geoderma 2008, 148, 141–148. [Google Scholar] [CrossRef]
- Maydagán, L.; Franchini, M.; Impiccini, A.; Lentz, D.; Patrier, P.; Beaufort, D. Chlorite, White Mica and Clay Minerals as Proximity Indicators to Ore in the Shallow Porphyry Environment of Quebrada de La Mina Deposit, Argentina. Ore Geol. Rev. 2018, 92, 297–317. [Google Scholar] [CrossRef]
Figure 1.
Geological map of the Brad-Sacaramb metallogenic district (left) and E–W cross section through the Bolcana porphyry system with shown location of the sampled drill-holes (right).
Figure 1.
Geological map of the Brad-Sacaramb metallogenic district (left) and E–W cross section through the Bolcana porphyry system with shown location of the sampled drill-holes (right).
Figure 2.
Representative sample selection from homogenous drill-core intervals.
Figure 2.
Representative sample selection from homogenous drill-core intervals.
Figure 3.
Schematic workflow of the proposed methodology (HSI = hyperspectral images, EM = endmembers, FC-LSU = fully constrained linear spectral unmixing).
Figure 3.
Schematic workflow of the proposed methodology (HSI = hyperspectral images, EM = endmembers, FC-LSU = fully constrained linear spectral unmixing).
Figure 4.
Proposed workflow for vein extraction.
Figure 4.
Proposed workflow for vein extraction.
Figure 5.
SEM-MLA mineral maps used for the validation and evaluation of the mineral mapping based on hyperspectral scans.
Figure 5.
SEM-MLA mineral maps used for the validation and evaluation of the mineral mapping based on hyperspectral scans.
Figure 6.
VNIR-SWIR spectra of the endmembers extracted from the three drill-core scans.
Figure 6.
VNIR-SWIR spectra of the endmembers extracted from the three drill-core scans.
Figure 7.
RGB image of the drill core samples and mineral maps obtained from N-Findr, FC-LSU and maximum abundance mapping using 3 endmembers.
Figure 7.
RGB image of the drill core samples and mineral maps obtained from N-Findr, FC-LSU and maximum abundance mapping using 3 endmembers.
Figure 8.
Results of the vein extraction performed on the endmember abundance maps obtained by FC-LSU. I = endmember abundance map, II = extracted ridges for sigma ranging from 3 to 10 and thresholds ranging from 98% to 92%, III = overlapping polygons after connecting extracted lines to their respective edges (features detected with wider range of sigma are brighter), IV = extracted veins after merging all polygons.
Figure 9.
Rose diagrams illustrating the orientation of the veins in the first two endmembers of each sample. The azimuth is calculated here based on the horizontal (E–W) layout of the drill-cores as illustrated in
Figure 7.
Figure 9.
Rose diagrams illustrating the orientation of the veins in the first two endmembers of each sample. The azimuth is calculated here based on the horizontal (E–W) layout of the drill-cores as illustrated in
Figure 7.
Figure 10.
Illustrative diagram of data validation for each of the three samples. I = RGB image of the drill cores with marked area of the location of the SEM-MLA mineral map, II = HSI-based maximum abundance mineral map, III = vein distribution maps.
Figure 10.
Illustrative diagram of data validation for each of the three samples. I = RGB image of the drill cores with marked area of the location of the SEM-MLA mineral map, II = HSI-based maximum abundance mineral map, III = vein distribution maps.
Figure 11.
Comparison of SEM-MLA and HSI-based analyses: I—SEM-MLA mineral map at full resolution, II—HSI-based maximum abundance mineral map, III—digitised SEM-MLA map emphasizing the main vein types, IV—HSI-based vein distribution map.
Figure 11.
Comparison of SEM-MLA and HSI-based analyses: I—SEM-MLA mineral map at full resolution, II—HSI-based maximum abundance mineral map, III—digitised SEM-MLA map emphasizing the main vein types, IV—HSI-based vein distribution map.
Figure 12.
Simplified MLA mineral maps with markers on selected features for the vein width and azimuth validation.
Figure 12.
Simplified MLA mineral maps with markers on selected features for the vein width and azimuth validation.
Table 1.
Specifications and setup parameters of the SisuROCK drill-core scanner and AisaFENIX VNIR-SWIR hyperspectral sensor.
Table 1.
Specifications and setup parameters of the SisuROCK drill-core scanner and AisaFENIX VNIR-SWIR hyperspectral sensor.
| Parameter | Value |
|---|
| Wavelength Range | VNIR 380–970 nm
SWIR 970–2500 nm |
| Sampling Distance | VNIR 1.7 nm
SWIR 5.7 nm |
| Number of Bands | 450 |
| Spectral Binning | VNIR 4
SWIR 1 |
| Field of View (FOV) | 32.3° |
| Samples | 384 |
| Frame Rate | 15 Hz |
| Scanning Speed | 25.06 mm/s |
| Integration Time | VNIR 15 ms
SWIR 4 ms |
| Spatial Binning | VNIR 2
SWIR 1 |
Table 2.
SEM-MLA data acquisition parameters.
Table 2.
SEM-MLA data acquisition parameters.
| SEM Settings | MLA Settings |
|---|
| Acceleration voltage (kV) | 25 | Pixel size (µm) | 3 |
| Probe current (nA) | 10 | Resolution (pixels) | 1000 × 1000 |
| Spot size (µm) | 5.6 | Step size (pixels) | 6 × 6 |
| Frame width (pixels) | 1500 | Acquisition time (ms) | 5 |
| Brightness | 96.2 | BSE trigger | 26–255 |
| Contrast | 18.5 | Minimum particle size (pixels) | 3 |
| BSE calibration (Au) | 254 | Minimum grain size (pixels) | 3 |
Table 3.
Summary of vein extraction results (EM = endmember, BR = band ratio). The estimated density is represented by the surface percent covered by a particular vein type extracted from the input image; for the extracted features, bright indicates high abundance, while dark indicates low abundance.
| Sample | Input | Mineralogy | Distribution | Extracted Feature | Estimated Surface Abundance (%) |
|---|
| DC-1 | EM 1 | Chlorite–white mica | Vein halo | Bright | 22 |
| EM 2 | White mica–chlorite | Vein halo | Bright | 14 |
| EM 3 | Biotite–chlorite | Matrix | Dark | 23 |
| BR | White mica | Vein halo | Bright | 18 |
| DC-2 | EM 1 | White mica–gypsum–chlorite | Vein halo | Bright | 13 |
| EM 2 | Low white mica | Vein halo | Bright | 23 |
| EM 3 | Chlorite–biotite | Matrix | Dark | 30 |
| BR | White mica | Vein halo | Bright | 26 |
| DC-3 | EM 1 | White mica | Vein halo | Bright | 33 |
| EM 2 | Aspectral | Vein halo | Bright | 13 |
| EM 3 | White mica–chlorite | Matrix | Bright | 11 |
| BR | White mica | Vein halo | Dark | 145 |
Table 4.
Results of vein extraction validation for selected features (
Figure 12).
Table 4.
Results of vein extraction validation for selected features (
Figure 12).
| Feature | DC-1 | DC-2 | DC-3 |
|---|
| Azimuth Deviation (°) | Width Accuracy (%) | Azimuth Deviation (°) | Width Accuracy (%) | Azimuth Deviation (°) | Width Accuracy (%) |
|---|
| F1 | 1.3 | 91 | 4 | 82 | 4.5 | 75 |
| F2 | 4 | 95 | 0.5 | 90 | - | - |
| F3 | 3.7 | 93 | 0.5 | 92 | - | - |
| F4 | 0.2 | 67 | - | - | - | - |
| F5 | 2.5 | 65 | - | - | - | - |
© 2019 by the authors. Licensee MDPI, Basel, Switzerland. This article is an open access article distributed under the terms and conditions of the Creative Commons Attribution (CC BY) license (http://creativecommons.org/licenses/by/4.0/).

 ,
, 


