3.2.1. Effect of Contact Time
By studying the kinetics of metal adsorption from aqueous solutions on glauconite, the time required to obtain the equilibrium concentration (ionic equilibrium state) was determined. The resulting values of adsorption capacity and removal efficiency for individual metal ions are shown in
Table 2.
Within the first five minutes of the contact time, 41% of the total Pb(II), 28%—Cd(II), Cu(II)—27%, and 23% Zn(II) was immobilized by glauconite. The time required to reach the ionic equilibrium was about 360 min for Cu(II), Cd(II), Pb(II), and for Zn(II)—180 min. The amount of adsorbed ions at equilibrium were as follows—1.98 mg/g for zinc, 2.291 mg/g for copper, 2.596 mg/g for cadmium, and 3.875 mg/g for lead ions. After this, the adsorption capacity was maintained at a constant level indicating a total saturation of the active sites of the material. Glauconite exhibited the highest adsorption capacity with respect to Pb(II), followed by Cd(II), then Cu(II), and Zn(II). The greater the adsorption capacity, the higher was the removal efficiency. Removal efficiency in the equilibrium was the highest for the Pb(II) ions and the lowest for the Zn(II).
The kinetics of adsorption described the rate of adsorbate uptake on adsorbent and it controlled the equilibrium time [
29]. The kinetics parameters were used to determine the adsorption rate necessary for the design and modeling of the removal processes [
30]. In order to analyze the rate of heavy metal adsorption on glauconite, pseudo-first-order (PFO), pseudo-second-order (PSO), and intraparticle diffusion models (IPD) were used [
31,
32]. In the pseudo-first-order kinetics model, the reaction rate was directly proportional to the difference in the equilibrium adsorbate concentration and the temporary concentration in the solid phases:
The pseudo-second-order kinetics model assumes the proportionality of process rate proportional to the square of the difference in the adsorbate equilibrium concentration and temporary concentration in the adsorbent solid phase:
After the integration and ordering of the equation, they take the following linear form:
pseudo-first-order model,
pseudo-second-order model,
Linear regression of the above relationships allows to estimate the model value of the adsorbate concentration on the adsorbent surface and the constant saturation rate of the sorbent capacity (k1 and k2). If the outlined curves lay in a straight line, then the confirmation of the order of saturation process of the deposit (first or second) was obtained. Linear regression of both models allowed to determine, both, the metal ion concentration values on the sorbent surface and the process rate values (k1, k2).
The Weber and Morris model, known as intraparticle diffusion, assumes that adsorption varies linearly with the square of the contact time. It is expressed by the following equation:
where,
Kid is the rate constant of intraparticle diffusion (mg/(g·min
0.5)),
t0.5 is the square root of the time, and
D is the intercept related to the thickness of the boundary layer.
When the plot
qt vs.
t0.5 is linear and passes through the origin, the main rate-limiting step for the adsorption is intraparticle diffusion process. On the other hand, if the relationship
qt vs.
t0.5 does not pass through the origin or is non-linear, the adsorption process is accompanied by other mechanisms [
33].
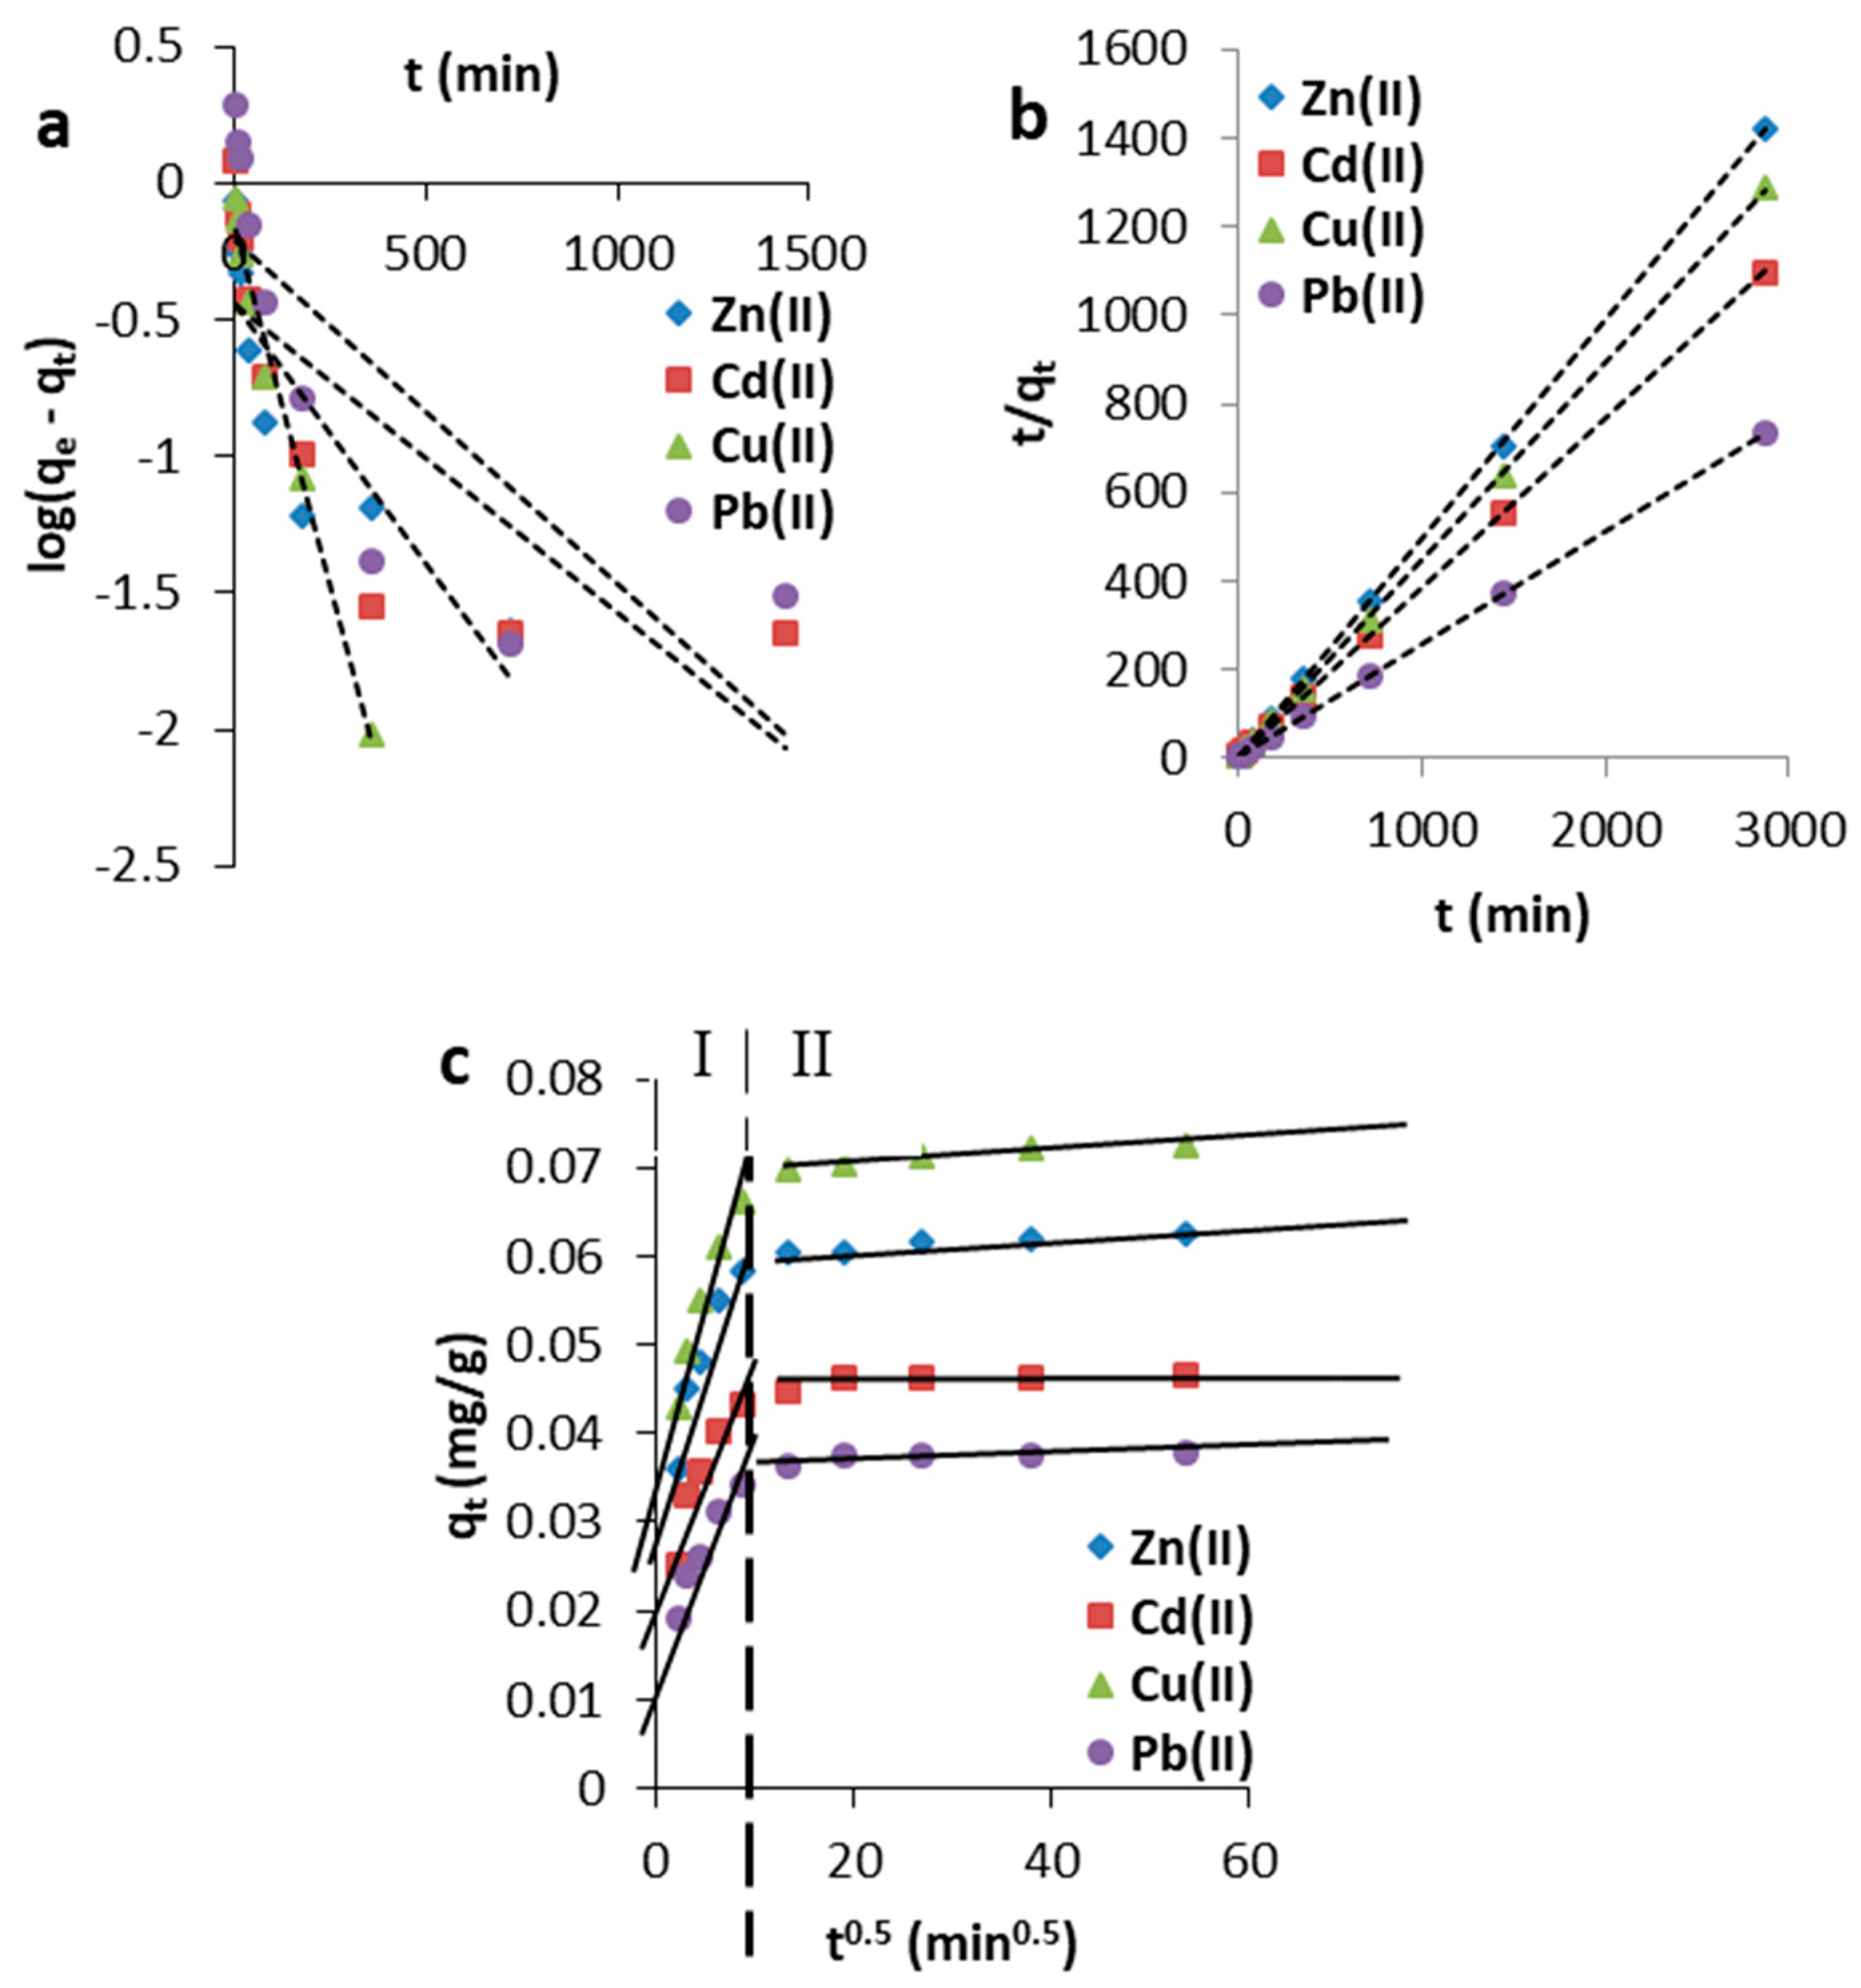
Figure 5 shows the kinetic plots for the three examined models and
Table 3 presents the kinetic parameters determined from the PFO, PSO, and the IPD equations. The PFO equation could not be applied to interpret the adsorption kinetics due to the low quality of fitting to the experimental data and the consequent large deviations from linearity, especially near the equilibrium state. The PSO equation fitted very well to the experimental data, evidenced by high correlation coefficients close to 1 (
Table 3), as well as similar values of adsorption capacity to the experimental values. Therefore, it was more likely that the adsorption behaviour might involve valence forces through electrons sharing between the metal ions and the adsorbent [
34]. The velocity constant
k2 determined from the PSO model had the greatest value for Cu(II) and the lowest value for the Pb(II) ions.
Intraparticle diffusion was not the sole rate-limiting step (the plots
qt vs.
t0.5 do not pass through the origin). As shown in
Figure 5c the adsorption involved two steps: (a) the initial step (I) represented by the steep linear plot, which might be associated with surface diffusion (external surface adsorption); and a second step (II) represented by the less steep plot, which might be assigned to the very slow adsorption of adsorbates in the equilibrium state. The slope of the line at stages (a) and (b) was denoted as the rate parameters
Kida and
Kidb, respectively (
Table 3). The adsorption rate
Kida was much higher than
Kidb for each metal. The resistance to the external mass transfer increased as the intercept (constant
D) increased [
35]. The constant
D was higher for the second stage of adsorption, indicating an increase of the boundary layer and a decrease of external mass transfer, which simultaneously might be attributed to the increase of internal mass transfer. Lowest values of
D for Pb ions reflected their lowest resistance to the external mass transfer.
3.2.2. Effect of Initial Concentration
The effect of initial concentration on the adsorption of Pb(II), Cu(II), Zn(II), and Cd(II) metal ions was studied at concentrations 5, 10, 20, 50, 100, and 220 mg/L. Under equilibrium conditions, the amount of a substance adsorbed by the adsorbent could be determined by the equation:
where
X/
M (typically expressed as mg pollutant/g media) is mass of pollutant per mass of media,
C0 is the initial concentration in solution (mg/L),
Ce is the equilibrium concentration (mg/L),
V is the volume of the solution to which the media mass is exposed (L), and
M is the mass of the media (g).
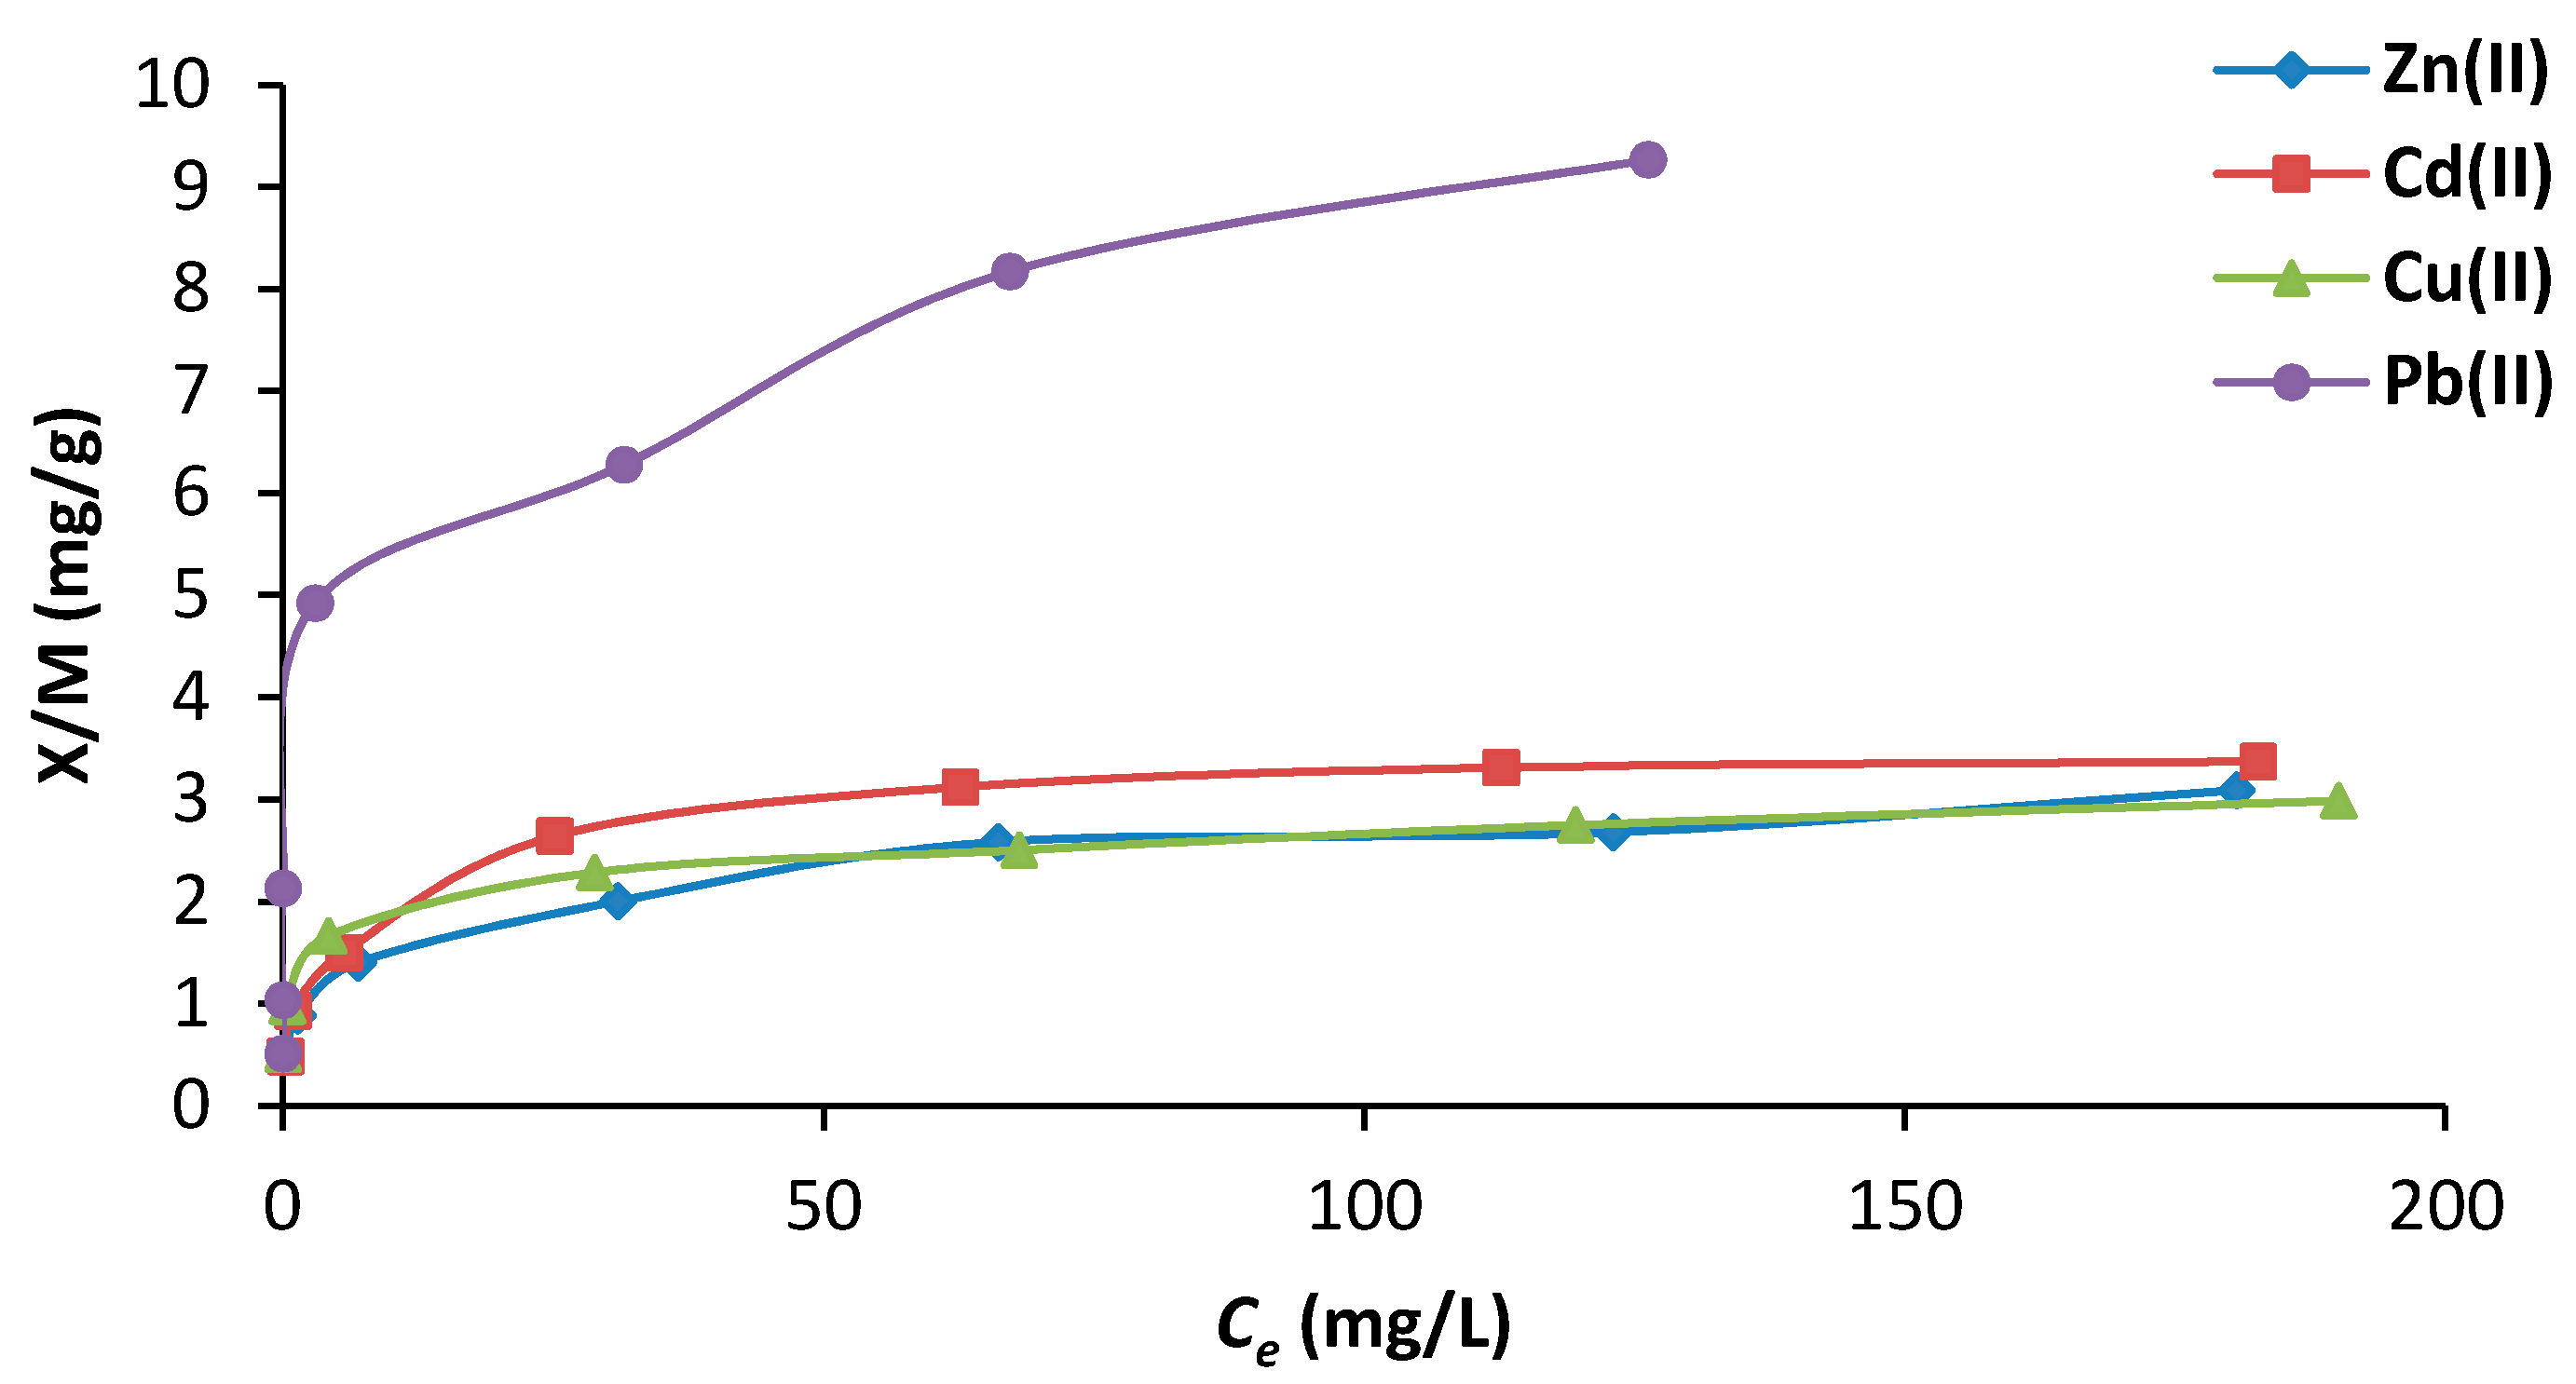
Adsorption isotherms are presented in
Figure 6. The amount of adsorbed metals increased with an increase in the initial adsorbate concentration from 5 to 50 mg/L. At lower concentrations the ratio of the number of heavy metal ions to the number of available adsorption sites was relatively small. The process of adsorption was independent of the initial concentration, but with the increase of heavy metals ions/glauconite ratio, exchangeable sites became saturated, which caused a decrease in the adsorption efficiency [
36].
The compatibility of the adsorption results with the Freundlich, Langmuir, and Temkin adsorption isotherms was tested. The Langmuir adsorption isotherm has been successfully applied to many adsorption processes and has been the most widely used adsorption isotherm model applied to aqueous media [
37,
38]. The Langmuir isotherm is based on the assumption that adsorption occurs at specific active sites of identical energy on the surface of the adsorbent, without significant interaction between the adsorbate molecules, which form a monolayer on the adsorbent surface.
The general Langmuir model is defined by the equation:
where
X/M is the amount of solute retained per unit weight of the sorbent (mg/g),
Ce is equilibrium concentration of solute remaining in the solution (mg/L),
KL (L/mg), and
aL (mg/g) are the isotherm constants that can be determined using linear regression.
KL is related to the energy of adsorption and
aL is the maximum adsorption capacity. The higher the
KL value, the stronger the bond between the metal ion and the mineral surface.
The essential characteristics of the Langmuir isotherm could be characterized by a separation factor or equilibrium constant
KR [
39], which is defined as:
where
KR is a dimensionless separation factor,
C0 is the initial concentration (mg/L), and
KL is the Langmuir constant (L/mg).
The parameter KR indicates the shape of the isotherm, accordingly, KR > 1-unfavorable, KR = 1-linear, 0 < KR </1-favourable, and KR = 0-irreversible.
The Freundlich model could be applied to the non-ideal systems, including multilayer adsorption processes on heterogeneous surfaces. The Freundlich adsorption isotherm equation was as follows:
where,
KF [mg/g·(L/mg)1/
n] and
n are adsorption capacity and affinity, respectively, determined from the linear plot of ln
X/
M vs. log
Ce.
The Freundlich constant Kf expressed the adsorbent capacity and n was the heterogeneity factor. For favourable adsorption n value ranged between 0 and 1 (and 1/n should be in the range of 1–10).
The Temkin model [
40] took into account the effects of indirect adsorbate–adsorbate interactions on adsorption isotherms, and assumed that the heat of adsorption would more often decrease than increase with increasing coverage. The equation is as follows:
where
T is the absolute temperature (K),
R is the gas constant,
Ti is the Temkin isotherm constant (L/g),
b is the Temkin constant related to the heat of adsorption (kJ/mol), and
Ce is the equilibrium concentration (mg/L). The parameters
Ti and
b and the correlation coefficient
R2 can be determined by the linear regression from the relationship
X/M versus ln
Ce.
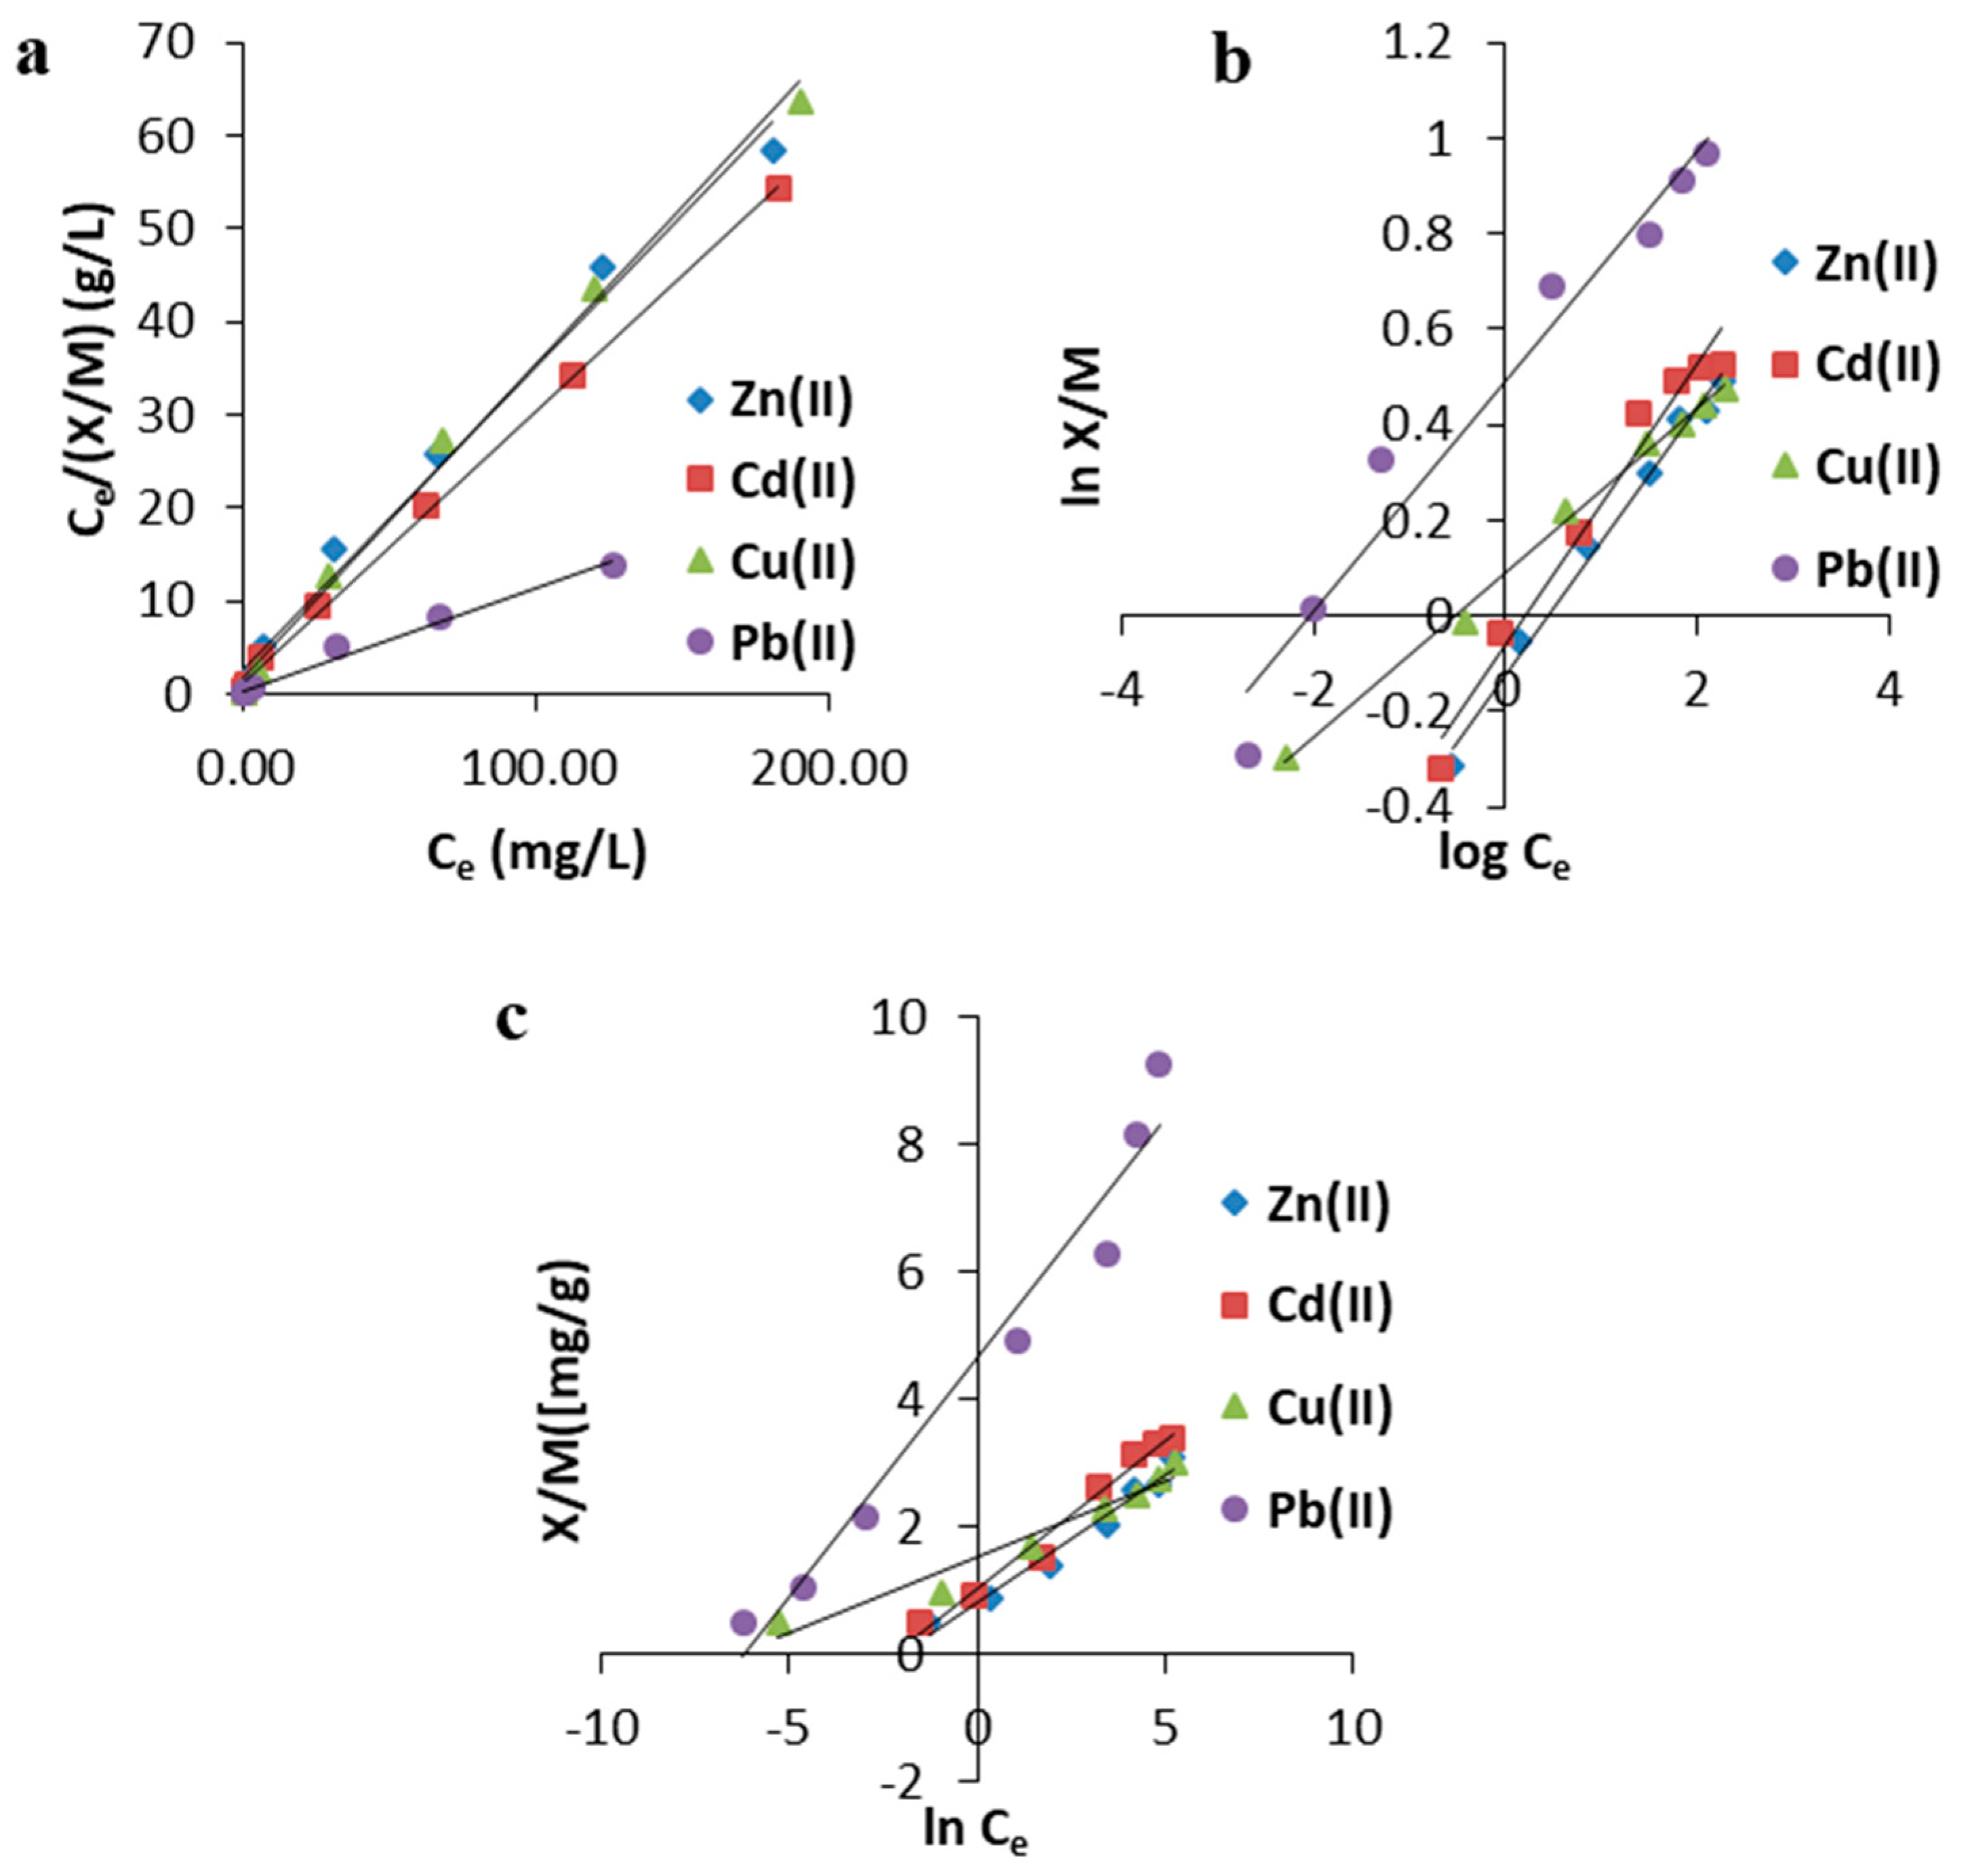
The linear plots of the adsorption isotherms as well as isotherm constants, together with the correlation coefficients (
R2) from the linear regressions are presented in
Figure 7 and
Table 4, respectively.
Analysis of the correlation coefficient R2 suggested that the Langmuir model was the best at describing the adsorption equilibrium. The monolayer saturation capacities, aL, followed the order, Pb > Cd > Zn > Cu and corresponded well with the adsorption capacities determined experimentally. However, taking into account the R2, the Freundlich and Temkin models also fit the sorption of heavy metal ions. Adsorption on a heterogeneous surface might be considered since glauconite as a raw mineral might exhibit heterogenic surface. The values of 1/n suggested a favourable adsorption. A value of the constant b determined from the Temkin isotherm model for Pb was the lowest, which could be attributed to the highest degree of surface coverage. A strong relationship between b (degree of coverage) and the adsorption capacity could be observed, where a higher b value corresponded to a smaller sorption capacity.
The
KR values (
Figure 8) indicated that adsorption was more favorable for higher initial metal concentrations. Adsorption was the most favourable for lead ions and least for Zn. In contrast,
KR for Cd and Cu was at a very similar level. According to this classification, the favorability system tended to be in the order, Pb > Cu > Cd > Zn.
3.2.3. Effect of pH
The solution pH had a significant impact on the heavy metals capture, as it determined the adsorbent surface charge, ionization degree, and adsorbate speciation. Changes in pH caused that the adsorption processes that coexisted with the precipitation of hydroxides. Typically, the adsorption of cations increases with the increase of pH from zero to almost 100% [
41]. The gradual increase in pH lead to (a) the formation of complex ions; and (b) precipitation of metal ions in the form of hydroxides. The decrease of heavy metal ions in the solution was the result of the adsorption process of cations on the glauconite surface. The adsorption was accompanied by the formation of complexes MeOH
+ and the precipitation of hydroxides Me(OH)
2, at higher pH values [
42]. Theoretical hydroxide precipitation pH using the values of the solubility product
Ksp was estimated for each metal.
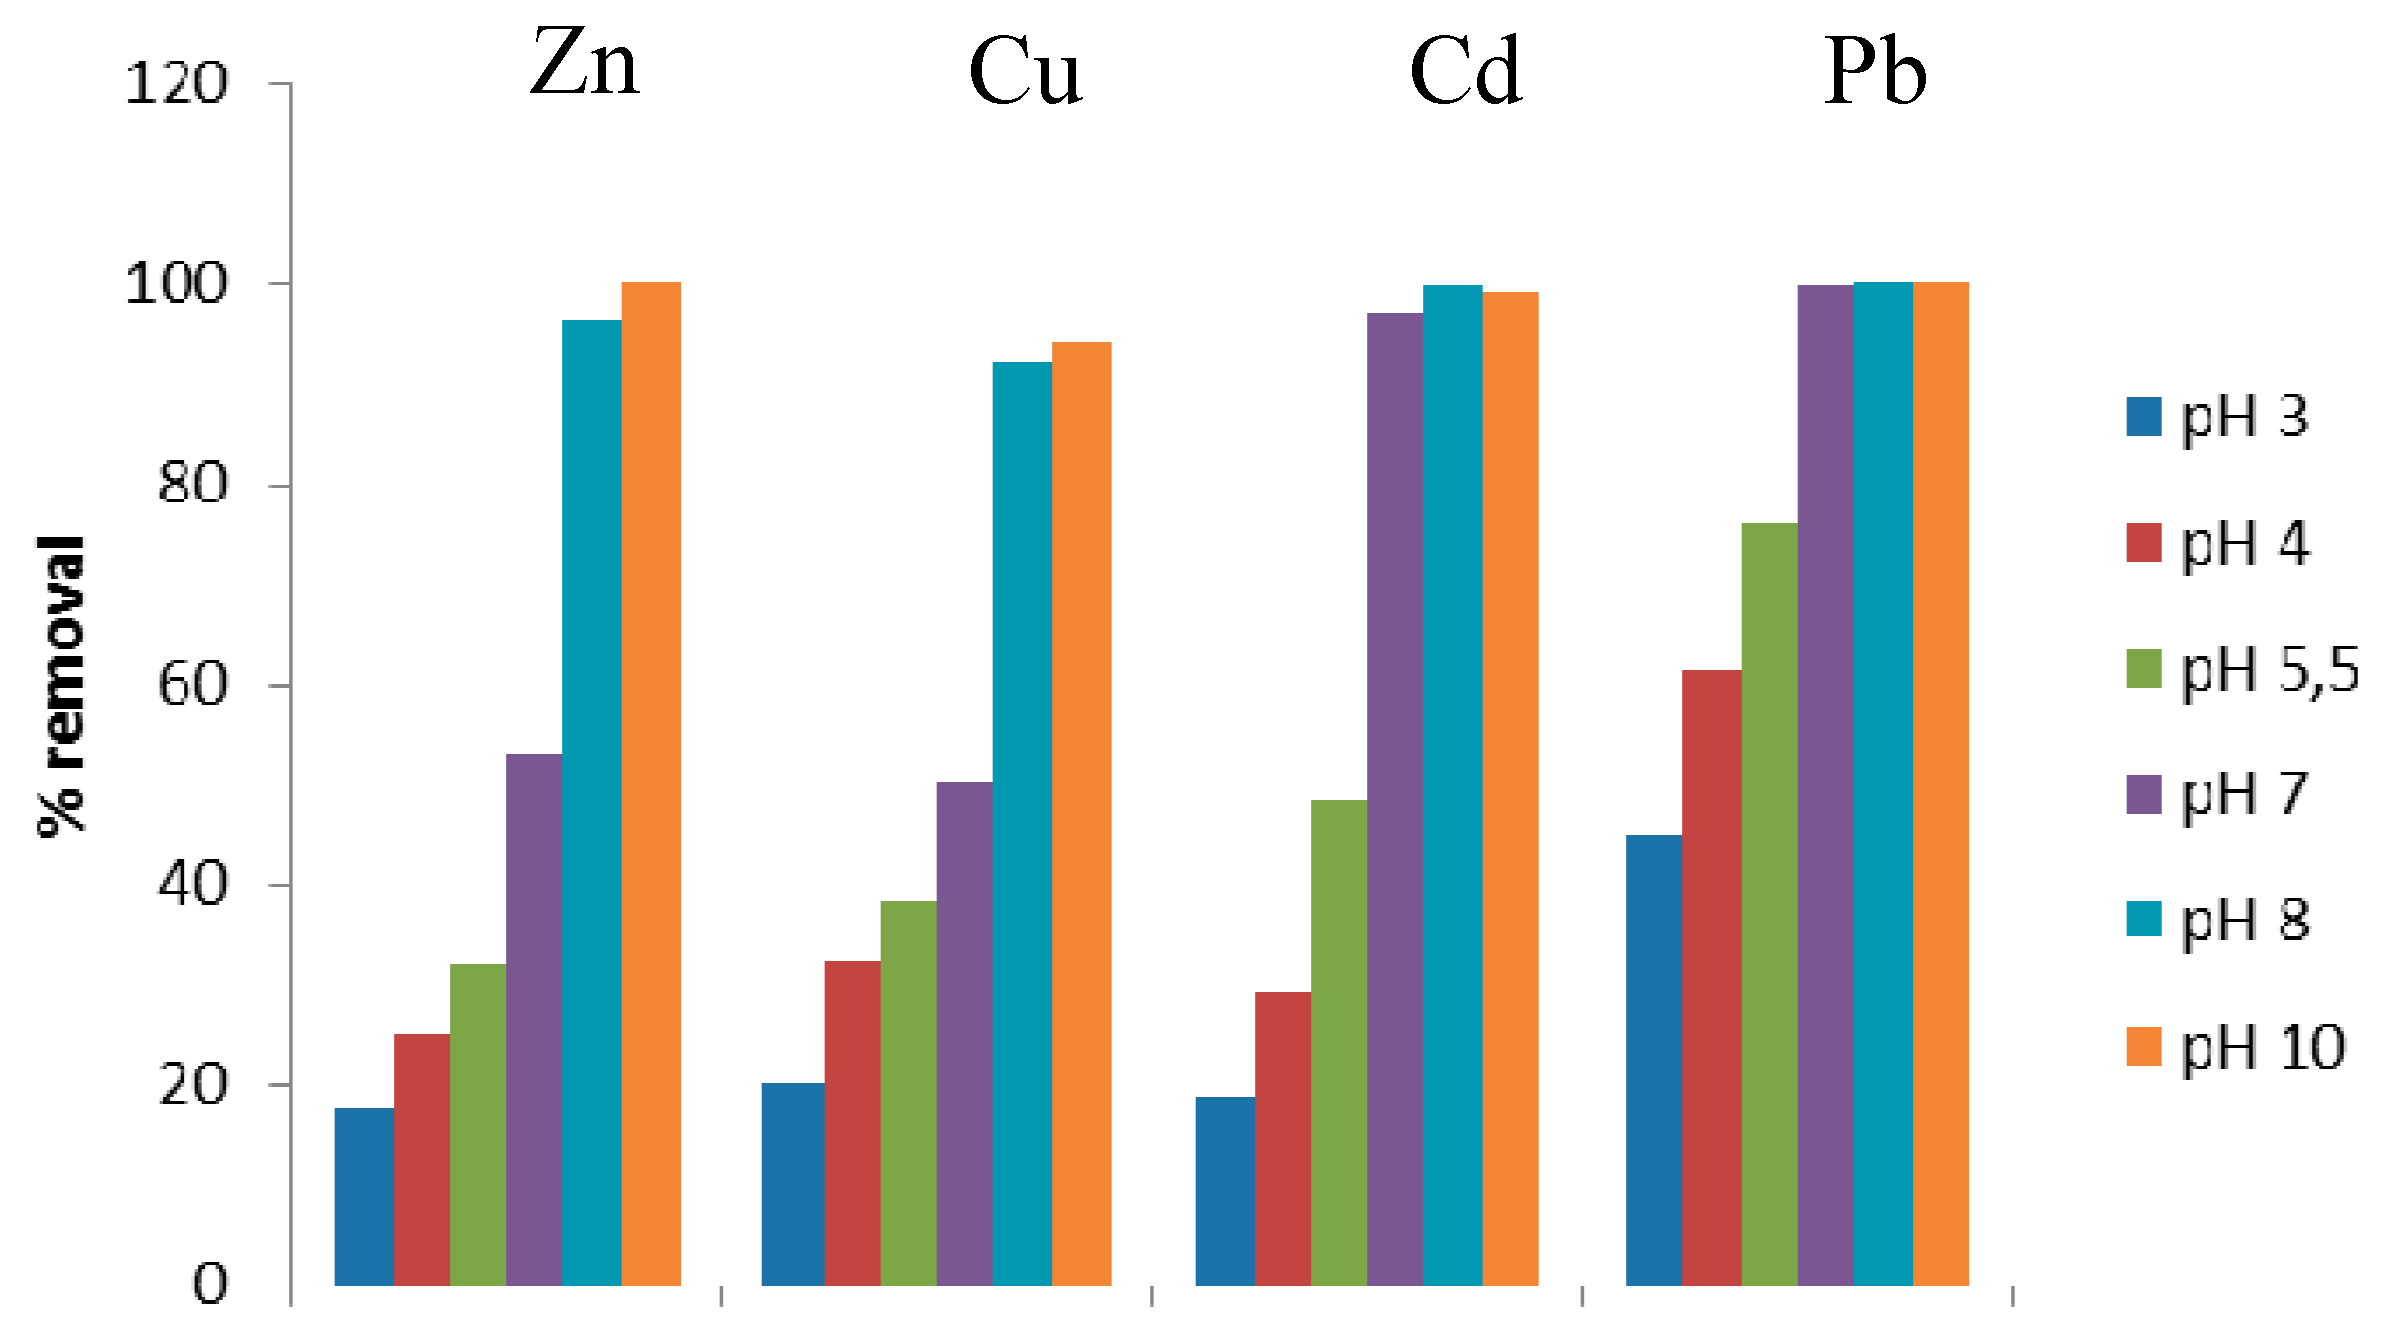
Figure 9 shows the removal efficiency of the heavy metals as a function of pH at a heavy metal concentration of 50 mg/L and a glauconite concentration of 20 g/L. In general, the
E(%) increased as the pH increased, and sharply reached over 90% at a specific pH value.
Lead sorption processes were dominant at the pH range 3.0–5.5. In this range E(%) increased from 45.16% to 76%, respectively. At pH 7, more than 99% of lead ions were removed from the solution. It was connected with the negatively charged surface of the glauconite, when pH of the equilibrium solution was higher than pHpzc. In a higher pH, a significant amount of lead hydroxide might begin to precipitate.
The precipitation pH was also theoretically calculated (pH about 6), according to the maximum concentration of lead and its constant solubility product (Ksp = 1.43 × 10⁻²⁰).
Zinc was predominantly adsorbed at the pH range 3–7. With a further pH increase up to 8.0, zinc removal efficiency increased to 98.8% and at pH above 8.0 to almost 100%. In all probability, significant amounts of zinc hydroxide were precipitated at pH 7.1, which meant that zinc ions were removed from the solution by hydrolysis (Ksp = 1.2 × 10⁻¹⁷).
In the case of copper removal efficiency at a pH of 3.0 to 5.5, about 18.88% to 48.52% of the ions were removed. The pH increase up to 7 led to the immobilization of 97% of the copper ions. In all probability, a significant amount of copper hydroxide Cu(OH)2 was precipitated at around pH 5.7, which was determined on the basis of the constant solubility product (Ksp = 2.2 × 10⁻²⁰).
In the pH range from 3 to 7, glauconite removed about 20.18% to 50.31% of the cadmium from the aqueous solution. The increase in pH to 8 resulted in a rapid removal of Cd(II) ions from the solution (92%). As pH > pHpzc, the surface of glauconite became negatively charged. The increase in pH up to 10 resulted in a complete immobilization of cadmium ions (100%). At higher pH, a hydrolysis reaction might occur, causing a precipitation of Cd(II) in the form of hydroxides. The theoretical pH value for cadmium hydroxide precipitation was above 8 and could be calculated on the basis of the solubility product Ksp = 7.2 × 10⁻¹⁵.
In general, the removal efficiency was the highest above the pHpzc of glauconite.


