Article

zPasteurAIzer: An AI-Enabled Solution for Product Quality Monitoring in Tunnel Pasteurization Machines

by
Samuel Olaiya Afolaranmi
1,
Michalis Drakoulelis
2,
Gabriel Filios
2,3,
Christian Melchiorre
4,
Sotiris Nikoletseas
3,5,
Stefanos H. Panagiotou
3,* and
Konstantinos Timpilis
3
1
FAST-Lab., Faculty of Engineering and Natural Sciences, Tampere University, 33100 Tampere, Finland
2
INDUST Systems, 26222 Patras, Greece
3
Computer Engineering and Informatics Department, University of Patras, 26504 Patras, Greece
4
algoWatt S.p.A, 20123 Milan, Italy
5
Computer Technology Institute and Press “Diophantus”, 26504 Patras, Greece
*
Author to whom correspondence should be addressed.
Submission received: 2 January 2023 / Revised: 24 January 2023 / Accepted: 28 January 2023 / Published: 1 February 2023

Abstract

:
In the food and beverage industry, many foods, beers, and soft drinks need to be pasteurized in order to minimize the effect of micro-organisms on the physical stability, quality, and flavour of the product. Although modern tunnel pasteurizers provide integrated solutions for precise process monitoring and control, a great number of packaging plants continue to operate with legacy pasteurizers that require irregular manual measurements to be performed by shop floor operators in order to monitor the process. In this context, the present paper presents zPasteurAIzer, an end-to-end system that provides real-time quality monitoring for legacy tunnel pasteurization machines and constitutes a low-cost alternative to replacement or the upgrading of installed equipment by leveraging IoT technologies and AI-enabled virtual sensing techniques. We share details on the design and implementation of the system, which is based on a microservice-oriented architecture and includes functionalities such as configuration of the pasteurizer machine, data acquisition, and preprocessing methodology as well as machine learning-based estimation and live dashboard monitoring of the process parameters. Experimental work has been conducted in a real-world use case at a large brewing manufacturing plant in Greece, and the results indicate the value and potential of the proposed system.

1. Introduction

Tunnel pasteurization. The food and beverage industry relies heavily on pasteurization to ensure the safety and quality of their products. This process, which involves heating the product to a specific temperature for a specific duration, eliminates harmful microorganisms and preserves the physical stability and flavor of the product. In the case of beer manufacturing, the tunnel pasteurization process has been extensively studied in the past [1,2,3,4,5]. It involves filling cans or bottles with the produced beer and then passing them through a stainless-steel tunnel where hot water is sprayed onto the packages. The bottles or cans are then transported through the tunnel slowly on a conveyor belt or walking beam, passing through various temperature zones designed to bring the product up to pasteurization temperature, hold it there for a specified duration, and then bring it back down to room temperature. This process ensures the safety of the final product and preserves its taste and longevity, making it ready for consumption. Advanced tunnel pasteurization systems are equipped with complex control mechanisms that regulate the temperatures involved and handle any delays or slowdowns in the process to ensure the proper pasteurization of the product without over- or underprocessing it.
Pasteurization Units (PUs). The pasteurization process is measured in terms of Pasteurization Units (PUs), which represent the amount of microorganism death that occurs when the beverage is held at a certain temperature for a specific duration. The required number of PUs for a given product is determined by its specific characteristics. The total number of PUs for a batch of beer can be calculated using the formula below, which takes into account the temperature and duration of the pasteurization process. Specifically, T is the temperature in degrees Celsius and t is the time in minutes for which the beer is held at that temperature.
P U = t × 1 . 393 T 60
To ensure proper pasteurization of the beer, it is crucial that the temperature of the beer at its “cold spot” (usually near the bottom of the can or bottle) reaches at least 60 °C for a sufficient duration to achieve the desired number of PUs. Additionally, it is important to minimize the peak temperature of the cold spot point (above 60 °C) in order to avoid overheating the rest of the product. The temperature in the different zones of the pasteurization tunnel is adjusted accordingly in order to slowly raise and lower the temperature of the product.
Problem definition and thermograph recordings: In order to guarantee that a product has undergone complete pasteurization, a specific amount of Pasteurization Units (PUs) must be added to the product, while not exceeding a maximum limit, as this may adversely impact the taste and appearance of the product. In order to determine the accumulated PUs during the critical pasteurization process, it is crucial to monitor the temperature at the “cold spot” of the packaged product. Despite the availability of advanced pasteurizers that offer integrated solutions for accurate PU estimation, monitoring, and control, most packaging facilities use legacy pasteurizers and manual PU measurements due to high upgrade costs and a lack of technical expertise. As monitoring the temperature inside a packaged product is not feasible, operators use a monitoring kit that includes a product with a temperature sensor placed at the cold spot and a device to record the measurements. The kit is passed through the tunnel at regular intervals throughout each shift to collect enough samples and to ensure that the process meets relevant quality standards. However, due to production and time constraints, it is not possible to perform live PU monitoring, inevitably leading to batches of defective products that must be reworked.
Zero Defect Manufacturing Platform. This work has been implemented in the context of an EU-funded research and innovation open-call project under the Zero Defect Manufacturing Platform (ZDMP) H2020 project [6,7]. The Zero Defect Manufacturing Platform (ZDMP) is a comprehensive solution for quality assurance in the manufacturing process from product design to delivery. The platform is designed to ensure the quality of products throughout the entire value chain by utilizing advanced modeling, detection, inspection, and predictive techniques. Additionally, ZDMP is geared towards increasing efficiency in the manufacturing process by implementing AI-based solutions for equipment, resource, and energy optimization. The ZDMP platform enables the interconnection of manufacturing and shopfloor systems, allowing for the integration of various zero-defect functionalities. It additionally allows for extensibility through provision of the ZDMP SDK, which allows users to create new zero-defect applications and components, thereby expanding the features of the platform.
ZDMP is built on a microservices architecture and comprises various software tools and components known as ZDMP components. These components include Data Acquisition, AI Analytics Runtime, and Digital Twins, and form the building blocks of the ZDMP platform. To simplify the identification of components based on their functionality, they are classified into three categories: design-time, use-time, and run-time. Design-time components aid in the design of zero defect applications, while use-time components handle the installation, buying, and selling of these applications. Finally, run-time components embed zero-defect functionality within the applications, guaranteeing a defect-free manufacturing process. Additionally, the ZDMP platform can be extended through the provision of a Software Development Kit (SDK), allowing for the creation of new zero-defect applications and components.
The objective of ZDMP is to establish an open Industry 4.0 ecosystem that guarantees zero defects during the manufacturing process. This is accomplished by means of a user-friendly platform for SMEs that offers tools, applications, and components, an Application Studio for creating new solutions, and a Marketplace for providing new applications and services. By building an ecosystem around the ZDMP platform, key stakeholders and other users can connect, collaborate, and generate synergies, thereby enhancing the competitiveness of European platform providers in the market.
zPasteurAIzer. In this work, we present zPasteurAIzer, an end-to-end system that aims to tackle the issue of defective products and equipment malfunction in the food and beverage industry by utilizing Industrial IoT and AI-based virtual sensing techniques. It offers real-time monitoring for older tunnel beer pasteurizer machines as an affordable option instead of replacing or upgrading the equipment. The goal of this system is to ensure product quality and prevent any bad pasteurized products from being distributed in the supply chain. In particular, zPasteurAIzer currently supports the following functionalities:
  • Configuration of the main parameters of the pasteurizer machine and the pasteurization process based on each product (tunnel length, conveyor speed, zones with sprayed water in different temperature, PU limits, etc.).
  • Real-time production data collection, including temperatures in the water tanks from each zone of the pasteurizer machine and process states from the machine PLCs.
  • Real-time monitoring of the temperature zone tanks.
  • Using virtual sensing techniques based on machine learning (ML) algorithms to create a virtual thermograph recorder (like a digital twin) by providing real-time estimation of the temperatures for (a) the sprayed water on the product and (b) the product’s cold spot inside the machine during the pasteurization process; these estimations are then utilized to calculate the total accumulated PUs in each batch of products.
  • Alerting end users by setting trigger thresholds for the temperature and PU values.
Contributions of this paper. Overall, the main contributions of this paper can be summarized as follows:
  • We are the first, to the best of our knowledge, to propose and publish an end-to-end AI-based system for real-time product quality monitoring in real beer pasteurization processes.
  • We provide an integrated solution for beer pasteurization that covers the whole product loop, starting from the data to the IIoT controllers, cloud system, ML models, ZDMP platform, and finally the user interface and dashboard for the end user.
  • We validate the data and ML-driven soft sensing approach first introduced in [8], demonstrating an integrated solution for temperature and PU estimation during the tunnel pasteurization process in the case of a real pasteurization machine and production line conditions in a large brewing manufacturing plant in Greece.
Roadmap of the paper. The rest of this paper is organized as follows. Section 2 elaborates the related works in ML-driven solutions for manufacturing processes and systems or platforms that address such applications. In Section 3, we provide the details of the design and implementation of the system, including the specification of requirements, the design based on a microservice-oriented architecture, the hardware and software setup, the integration with ZDMP components, and the methodology for data collection and ML model development. Afterwards, in Section 4, we describe the main functionalities of zPasteurAIzer and the way it was validated. Finally, in Section 5 we summarize the subject of the work and report our next steps for further exploitation.

2. Related Work

Over the past years, the field of manufacturing has attracted many researchers from the research community involving big data, AI/ML, and IoT technologies. Numerous works have been conducted that deal with real-world applications and data from production lines and the overall manufacturing and Industry 4.0 domain [9,10,11,12,13,14,15,16,17,18,19,20,21]. A great number of research works in this context focus on building ML models and providing proof of concept results, without proceeding to demonstration of their integration into real-time end-to-end systems. To the best of our knowledge, there is a gap in the literature concerning applications involving AI/ML and beer tunnel pasteurizer machines. Therefore, in this section we present research works which can be considered as related to the aim of the current paper. Specifically, we focus on and outline research works that deal with (a) the food and beverage domain, to which our study is related, and (b) end-to-end systems and platforms in manufacturing applications.
Previous research has examined the utilization of Digital Twin (DT) technology in the context of pasteurization machines and other applications within the food and beverage industry, such as beer production. For instance, in [22], a DT approach for a beer pasteurization system was proposed that could simulate the process and prevent high-risk events for operators. The study provided a step-by-step implementation of this approach using LabView and aimed to predict potential anomalies in the plant by comparing the simulated model’s results with real-time data from the plant. Subsequently, in [23], the same authors advanced this DT model by incorporating and evaluating various machine learning algorithms for anomaly detection, such as Polynomial Linear Regression, Artificial Neural Network, and k-means. These algorithms were found to deliver satisfactory results in terms of the precision and recall metrics when used to identify the “ok” and “failure” status of the pilot plant.
In [24], the authors proposed a cutting-edge control system combining various technologies such as ML, IoT, cyber–physical systems, and cloud computing to optimize the performance of legacy equipment in a traditional food production facility. The paper highlighted the design, implementation, and challenges faced during the development of the system. The system continuously monitors various production parameters (e.g., oven temperatures, environmental conditions, belt/cutter speeds, etc.) during the baking process and uses ML models to predict the quality of the final product. Using a K-Nearest Neighbors (KNN) classifier, the system achieved an accuracy rate of 94.6%. Additionally, the research work presented in [25] shows the application of soft control techniques in thermal treatment in the dairy industry, with fuzzy logic and neural networks used to predict pasteurization temperatures in a plate heat exchanger (PHE); in addition, real-time experiments were conducted to confirm the feasibility of the approach.
In another study, the authors of [26] delved into the field of thermal processing of multiphase fluids within the food industry, with a specific focus on developing a model that was both easy to understand and implement. The goal of their research was to create a model that could predict the pressure gradient required in a pipe, as well as the reduction of the food channel width caused by fouling, while taking into account the movement of particle-laden fluids through the channel. To accomplish this, the authors employed a fully connected Artificial Neural Network (ANN) to forecast the fouling rate of the food channel after the final food processing time, with the aim of reaching the desired food temperature. This approach resulted in an average Root Mean Squared Error (RMSE) of 0.003, indicating a high level of accuracy in the predictions.
In [27], the authors suggested utilizing an electronic nose (e-nose) sensor network composed of gas sensors as a cost-effective method for evaluating beer quality through machine learning. The study employed a multivariate data analysis approach utilizing Principal Component Analysis (PCA) and Artificial Neural Network, resulting in a high level of accuracy (97%) in identifying fermentation types by classifying the beers studied into top, bottom, and spontaneous fermentation categories with e-nose data.
Concerning end-to-end methodologies and systems in real-world manufacturing applications, in [28] the authors introduced a comprehensive machine learning-based predictive maintenance method for the manufacturing industry. This system integrates all aspects, from IoT sensor data collection to ML model development and alert notifications, to enhance the efficiency of assembly lines in a real-world consumer goods production plant. The approach was validated by predicting the remaining useful time before failure of assembly lines producing baby diapers. The results showed that ensemble learning algorithms such as Random Forest, XGBoost, and Gradient Boosting outperform individual MLP Regressor and SVR algorithms, with a Mean Average Percentage Error of only 3.27%. In [29], the authors introduced the Smart Maintenance Platform (SMP) as a supporting tool for the maintenance team in a Philips facility. The proposed SMP is equipped with a set of tools for monitoring the condition of machinery equipment, and employs Industry 4.0 technologies to achieve this end. The system is composed of microservices that communicate with each other through a central event bus, with different microservices responsible for data acquisition from external sources, analysis for the detection and prediction of faults in machinery equipment using the Micro-Cluster-based Continuous Outlier Detection Algorithm, and presentation of visualizations and mobile notifications for the maintenance engineers.
In [30], a system for predictive maintenance was presented and evaluated in two separate scenarios involving an autonomous transfer vehicle and an electric motor. The authors employed machine learning-based data enhancement techniques as well as automated machine learning and workflow automation technologies to improve the system’s ability to collect and classify data related to potential equipment faults or operational issues. In addition, they proposed a strategy for making predictions and decisions about maintenance needs based on specific system metrics and key performance indicators. In [31,32], the authors presented a prototype IIoT platform known as SERENA built on a lightweight microservices architecture, which was developed in the context of a case study involving a production plant for white goods. The authors described the architecture of SERENA and presented the results of a data-driven approach using decision tree and linear support vector machine classifiers with the goal of predicting potential alarms and failures in a specific stage of the production line. In [33], the authors presented a cutting-edge analytics system for identifying anomalies in factory machine data. The system was built on a microservice architecture comprising three core components: Data Acquisition, Knowledge Management, and Predictive Maintenance. The modules work together to predict machine failures and initiate preventative maintenance procedures. The platform utilizes advanced machine learning techniques and deep learning architectures with continuous re-training capabilities, enabling a self-learning approach. The system provides users with advanced visualizations; the authors presented a case study to showcase the platform’s practical use and functionality in an injection moulding machine setting.
In [34], the authors presented an innovative approach to monitoring and fault detection in the manufacturing industry. In particular, they proposed a system that utilizes IoT-based sensors to collect data such as temperature, humidity, and accelerometer and gyroscope data, then employed big data processing techniques to analyze these data in real-time. The system uses a combination of Density-Based Spatial Clustering (DBSCAN) and Random Forest to identify any abnormal sensor readings, providing early detection of faults. The system was demonstrated in an automotive manufacturing assembly line in Korea. Lastly, in [35], the authors created an advanced predictive maintenance platform known as UPTIME that adheres to the RAMI 4.0 architecture model. This platform is divided into three main components, the Presentation, Logic, and Data tiers, and was tested in a realistic manufacturing setting from the steel industry through integration with the sensors and PLC of the machinery. The collected data are fed into Stream Data Analytics functionalities for feature extraction and anomaly detection (diagnosis) using algorithms such as Long Short-Term Memory (LSTM) and failure predictions (prognosis) such as Remaining Useful Life with the use of algorithms such as curve fitting, neural networks, and Hidden Markov Models (HMM).

3. System Design and Implementation

3.1. Requirements Specifications

In this section, we outline a number of the most important requirements for zPasteurAIzer design and development. Based on modern IoT, web application development, and UI/UX practices and in collaboration with the production stakeholders of the brewing factory, we collected all the important information according to the real needs of a pasteurization process and the requirements for designing an effective predictive quality tool for the shop floor operators. The main requirements concerning the process and its adaptation to the needs of the industrial environment are:
  • Non-invasive: The system should not be invasive to the pasteurization process, as the machines already control the pasteurization of the products based on their programs. The scope of the system is to monitor the process, detect malfunctions, and issue timely alerts about upcoming quality issues. In the future, these alerts could be made available to machine PLCs in order to integrate this knowledge into their operation.
  • Flexible: The entire system should be compatible with the different modern and legacy tunnel pasteurizers that are already installed in different production lines and in different food and beverage industries.
  • Adaptable: It should be possible to adapt the system for specific pasteurization machines based on the key relevant parameters, i.e., the number of pasteurization zones, the length of each zone, the operation speed of the conveyor, the capacity of the machine, etc.
  • Simple configuration: It should be easy for the industrial end users to parameterize the system without the need for software developers, data scientists, or other experts through an easy-to-use setup interface that allows users to adapt it by introducing or changing a few parameters for the pasteurization process.
  • Easy of Use: The user interface of the system should be very simple, providing only the necessary information to the operators, in order to help them in fast and safe decision-making and support them in effectively maintaining the product quality. The UI should be responsive, handling as many different screen sizes as possible in a manner that utilizes them while respecting the UX.
  • Availability: Provide 24/7 uptime of the IIoT network and continue to serve historical data in case the controllers are offline. Data should be cached and any disruption in the operation of the controllers (either by power shutdown or disconnection from the sensors) handled in such a way as to avoid loss of data and lack of results for that period.
  • Accessibility: zPasteurAIzer should operate on the latest browser versions of Google Chrome, Mozilla Firefox, etc., and should be responsive and accessible from mobile devices (e.g., smartphones, tablets).
  • Product profiles: The system should be able to keep the parameters of the pasteurization process (PU limits, product volume, conveyor speed, etc.) for each different product family. The operator, through the UI, need only select the product that is currently in production on the line without needing to change the parameters.
  • Quality standards: Through the system, the production supervisors should be able to set the production standards of the pasteurization process. These standards then automatically set the trigger points for issuing alerts to the operators.
  • Live monitoring: The system should periodically measure the temperature of sprayed water (e.g., every 10 s) and the movement of products into the tunnel, estimate online the temperature of the cold spot of the products, and calculate the PUs. The measurements and calculations should be provided continuously (e.g., every 1 min) to the operator through the system’s dashboard.
  • Historic data: The measurements from the sensors and the system’s PU estimations should be logged for further analysis. Users should be able to look up the historic data about the quality parameters through statistics or graphs.
  • Alerts: The system should provide live monitoring of measurements and enable alarms for the operators when temperatures or the PU estimations are outside of quality standards.

3.2. Microservice-Oriented Architecture & ZDMP Components

The design and implementation of zPasteurAIzer is based on a microservice-oriented architecture. Microservices are an architectural and organizational approach to software development in which software is composed of small independent services that communicate over well-defined APIs [36]. These services are owned by small self-contained teams. Microservices are used in this work, as they make applications easier to scale and faster to develop, and because the architecture and components of ZDMP are based on microservices. Figure 1 depicts the overall end-to-end architecture guiding zPasteurAIzer, while Figure 2 provides an overview of the ZDMP architecture. Starting from the bottom, the end-user industrial equipment (in our case, the temperature sensors and PLC signals) are connected to the IIoT controllers, which collect the data for forwarding to the centralized cloud platform and database.
The zPasteurAIzer application then continuously fetches the data and interacts with the respective ZDMP components to perform the data acquisition and processing and ML model inference and to provide the live dashboard monitoring and alerting. The zPasteurAIzer application runs as a Docker container, and can be scaled as any typical web application by clustering, for example, via Kubernetes. A sample docker-compose is available for the orchestration, demonstrating the container dependencies and setup configuration of the application. One such dependency is the MySQL database container that stores the measurements and ML model results for better performance. The data processing for virtual sensing of the temperatures and PUs as well as the API for serving the ML model predictions are standalone services that run as Docker containers.
For live dashboard updates, WebSocket connections are used to connect to the server. The WebSocket server was developed using NodeJS, which offers a WebSocket capabilities out of the box. The websocket connection to the backend service is always maintained, ensuring that new measurements are synchronized with the dashboards. Below, we outline the main specifications of the server that hosts the application.
  • CPU: AMD Ryzen Thread ripper 3970X
  • RAM: 256GiB
  • GPU: 2x NVIDIA GeForce RTX 3080
  • OS: Ubuntu Server
  • Virtual machines (VMs): Qemu KVM with Cockpit web-based graphical interface for VM management.
Concerning the ZDMP components, below we briefly discuss the components that were used to realize zPasteurAIzer:
  • Service and Message Bus: a core component used to access and connect the different ZDMP components.
  • AI Analytics Runtime: used to run and manage the generated AI models in real-time and access them as API endpoints.
  • Application Runtime: the platform where our system is be deployed as docker containers along with their dependencies.
  • Secure Authentication and Authorization: this component is used to provide access to authorized data of other layer components, such as the AI Analytics Runtime.
  • Data Acquisition: this component is used as an abstraction for data storage and real-time access of the raw measurements of the pasteurization machine from the INDUST platform. For this, the component ingests the data by connecting to the INDUST data sync subsystem on a pull model, then asynchronously retrieves new measurements in a polling manner via the available REST endpoints. Each batch of new data is forwarded to the Service and Message Bus, which makes it available to the running AI Analytics Runtime.

3.3. Hardware Setup and Data Collection

The IIoT controllers were deployed at the production line facility, close to where the pasteurizer machine is situated. The IIoT controllers are composed from RevolutionPi gateway stack, which is essentially an industrial version of Raspberry Pi [37]. Figure 3 displays the installed electrical panel that includes the IIoT Controller and the connections for all signals, while Figure 4 demonstrates the graphical representation of the tunnel pasteurizer.
The IIoT controller supports analog and digital I/O for data acquisition from sensors and PLCs, and the communication with the cloud platform is made by ethernet connection. For this particular use case, the controller has one digital input from the pasteurizer’s PLC for the status (RUN/STOP) of the conveyor belt into the tunnel, which is collected in an event-driven manner (i.e., when the status changes). In addition, temperature sensors (PT-100) are installed in the water tanks in each zone of the pasteurizer; thus, the controller has six analog inputs (4–20 mA) with a range of 0–100 °C and polls the sensors every 10 s. The IoT data flow follows a bottom-up flow, meaning that the controllers are responsible for communicating and synchronizing with the cloud, and are not server-agnostic. Communication between all parts of the flow, from the controller to the INDUST cloud storage, is encrypted using TLS 1.3 and protected by passwords. The IIoT controllers preprocess the measurements and log them locally, then synchronize them periodically every minute. Eventually, the measurements are stored in the cloud MySQL database.
Lastly, we describe the methodology for collecting the measurements from the thermograph recorder, as a means to (a) evaluate the quality of the pasteurization process from the operator’s point of view and (b) gather the data needed to train and eventually validate the ML models from the zPasteurAIzer’s point of view. Data collection from the thermograph recorder is executed manually by the shop floor workers in the plant by placing a monitoring device that passes through the pasteurization tunnel alongside the cans during normal operation. This is usually performed only a few times per shift, i.e., twice, and the recorder collects the complete timeseries of the temperature data (for sprayed water and the cold spot of the product) as well as the accumulated pasteurization units (PUs). The thermograph recorder is then connected to a local workstation to export the data as .csv files from the thermograph software.

3.4. ML-Driven Virtual Sensing

Considering the high-level view of ML-driven virtual sensing, the goal is to create a virtual thermograph recorder for every batch of products that is monitored (see Section 1 for the problem definition). The need to use ML models to replicate the response of a thermograph recorder arises from the fact that the operation of the pasteurizer machine (and the previous machines that affect its operation) is not deterministic due to frequent small or major stoppages that affect the pasteurization process, e.g., the temperatures in certain zones may change dynamically based on the stoppage duration.
To realize virtual sensing in real-time, it is necessary to utilize only the six analog temperatures and the digital status from the PLC that are collected by the IIoT controller in order to estimate (predict) the underlying sprayed water and cold spot temperatures before calculating the accumulated PUs. To perform this virtual sensing, the data have to first be prepared in order to create a meaningful dataset for ML model training as well as for the actual inference (prediction). The following steps are executed:
  • The initial input data (raw measurements) need to be cleaned. This includes removing outliers and data points outside of normal/use case operation, e.g., before and after the pasteurization process, etc.
  • The dataset needs to be prepared by aggregating the sensor values in the correct format and order, accounting for their time series nature, in order to obtain valid and usable data for the feature extraction process and later for the ML models.
  • To complete the dataset creation process, data from IIoT controllers need to be correlated with data from thermograph samplings to align the time of pasteurization, sensor readings, and accumulated PUs for each pasteurization.
  • The dataset needs to be transformed to include the features of Table 1 below.
  • The final prepared dataset is split into training (for ML model building), validation (for ML model tuning), and test (for real evaluation on unseen data) datasets.
The ML models performing the virtual sensing need to solve the following regression type of problems/targets, as their output concerns continuous values: (a) predict the temperature of the spraying water, which impacts the temperature of the product inside the pasteurizer machine; (b) predict the temperature at the cold spot of the product; and (c) calculate the accumulated PUs at the end of each product batch using the estimated cold spot temperature time-series and Equation (1) when the batch exits the pasteurizer machine.
Utilizing the same ML development as in our previous work [8], the tested models included the Ridge Regression and Extra Tree regressors, Random Forest Regressor, Decision Tree (DT), and Stacked Ensembles (SE). All models were implemented in Python using the Scikit-learn [38] and TPOT [39] libraries. Model descriptions are provided below.
  • Ridge Regression is a model tuning method that is used to analyze data that is subject to multicollinearity, which happens when predictor variables exhibit correlation amongst themselves. This method performs L2 regularization and imposes a penalty on the size of the coefficients. It aims to reduce the standard error by adding bias to the estimates of the regression.
  • The Extra Trees regressor is a meta-estimator that fits a number of randomized decision trees (that is, extra trees) onto various subsamples of the dataset, then uses averaging to improve the predictive accuracy and control overfitting. As in random forests, a random subset of candidate features is used; however, instead of looking for the most discriminative thresholds, thresholds are drawn at random for each candidate feature and the best of these randomly-generated thresholds is picked as the splitting rule. This usually reduces the variance of the model at the expense of a slight increase in bias.
  • The Random Forest regressor is a meta-estimator that fits a number of decision trees onto various subsamples of the dataset and uses averaging to improve the predictive accuracy and control overfitting. The random forest algorithm is an extension of the bagging ensemble learning method, known as bootstrap aggregation, and utilizes both bagging and feature randomness to create an uncorrelated forest of decision trees.
  • A Decision Tree is a non-parametric supervised learning algorithm that can be utilized for both classification and regression tasks. It has a hierarchical tree-like structure which consists of a root node, branches, internal nodes, and leaf nodes. It learns from data to approximate a value with a set of if–then–else decision rules; a deeper the tree allows more complex decision rules to be composed.
  • Stacked Ensembles consist of two or more base (single) models that are trained individually. The predictions of the base models are then used as features to train a meta-learning model, with the aim of achieving better results by combining the predictions of the single models and improving on the flaws that either single model may have. The benefit of stacking is that it can harness the capabilities of a range of well-performing models towards a classification or regression task while making predictions that have better performance than any of base models in the ensemble.

4. System Functionalities and Validation

In this section, we provide a detailed overview of the system functionalities and their validation, accompanied by screenshots of the respective graphical user interfaces; the displayed data and values are indicative, and not necessarily the actual data from the production line validation. zPasteurAIzer has the following main front-end pages:
  • Settings: this page contains the forms that an end user has to fill out in order to set up the pasteurizer machine and the parameters of the pasteurization process (program, duration, etc.)
  • Dashboard: this page contains the charts that display the real-time temperature sensor measurements for all the zones of the pasteurizer machine as well as the estimated process parameters from the ML models; the user has the ability to select and view previous pasteurization runs instead of the current run.
  • History: this page contains a detailed history of all pasteurization runs and the ML-driven estimations of their respective process parameters. The operator is able to filter the data according to predefined criteria, and most importantly, to input the recorded values from the thermograph recorder for the accumulated PUs of a specific pasteurization in order to perform validation.

4.1. Configuration of Machine and Process Settings

After installation of IIoT controllers on the production line of the factory for data collection, the end user must make all the required configurations through the system UI. This is an easy procedure that only requires the end user to provide basic information about the machine and process, which is done through “fill-in” forms under the settings menu of the front-end interface.
In the first settings tab, called “Resource Settings”, all the resources that are available in this project through the INDUST platform are listed and grouped into two categories, namely, sensors and process signals. For each resource, the first column depicts the resource’s ID in the INDUST platform (which is unique for each signal) and the second column shows the name of the resource in the system. The user can change the names of resources and rename them to desired names for use as identifiers in zPasteurAIzer.
In the second settings tab (Figure 5) the user provides basic details concerning the pasteurization machine, such as the name of the machine, the length of the tunnel in meters, and the process signal that states when the conveyor belt of the machine is moving (the RUN/STOP status of the machine). Then, the user has to set the different thermal zones of the machine. For each zone, the user has to provide its name and length in meters, then select the sensor that monitors the temperature in that zone. The user can delete or reorder zones using the corresponding buttons next to the zone names.
Finally, in the Pasteurization Profiles tab (Figure 6), the user can set production quality standards for each product or family of products. For each product category, the user provides (a) the name of the category and (b) the duration of pasteurization (in minutes) for a product of this category or the associated conveyor belt speed. As the length of the tunnel is set in the machine configuration tab, when the user provides one of the last two setting values the other is automatically calculated. Then, the user provides the lower and upper PU limits that are accepted for products of this category according to the quality standards. This is the most critical parameter of the pasteurization process monitored by the system. Finally, for each zone, the user sets the lower and upper limits of the operating temperatures.

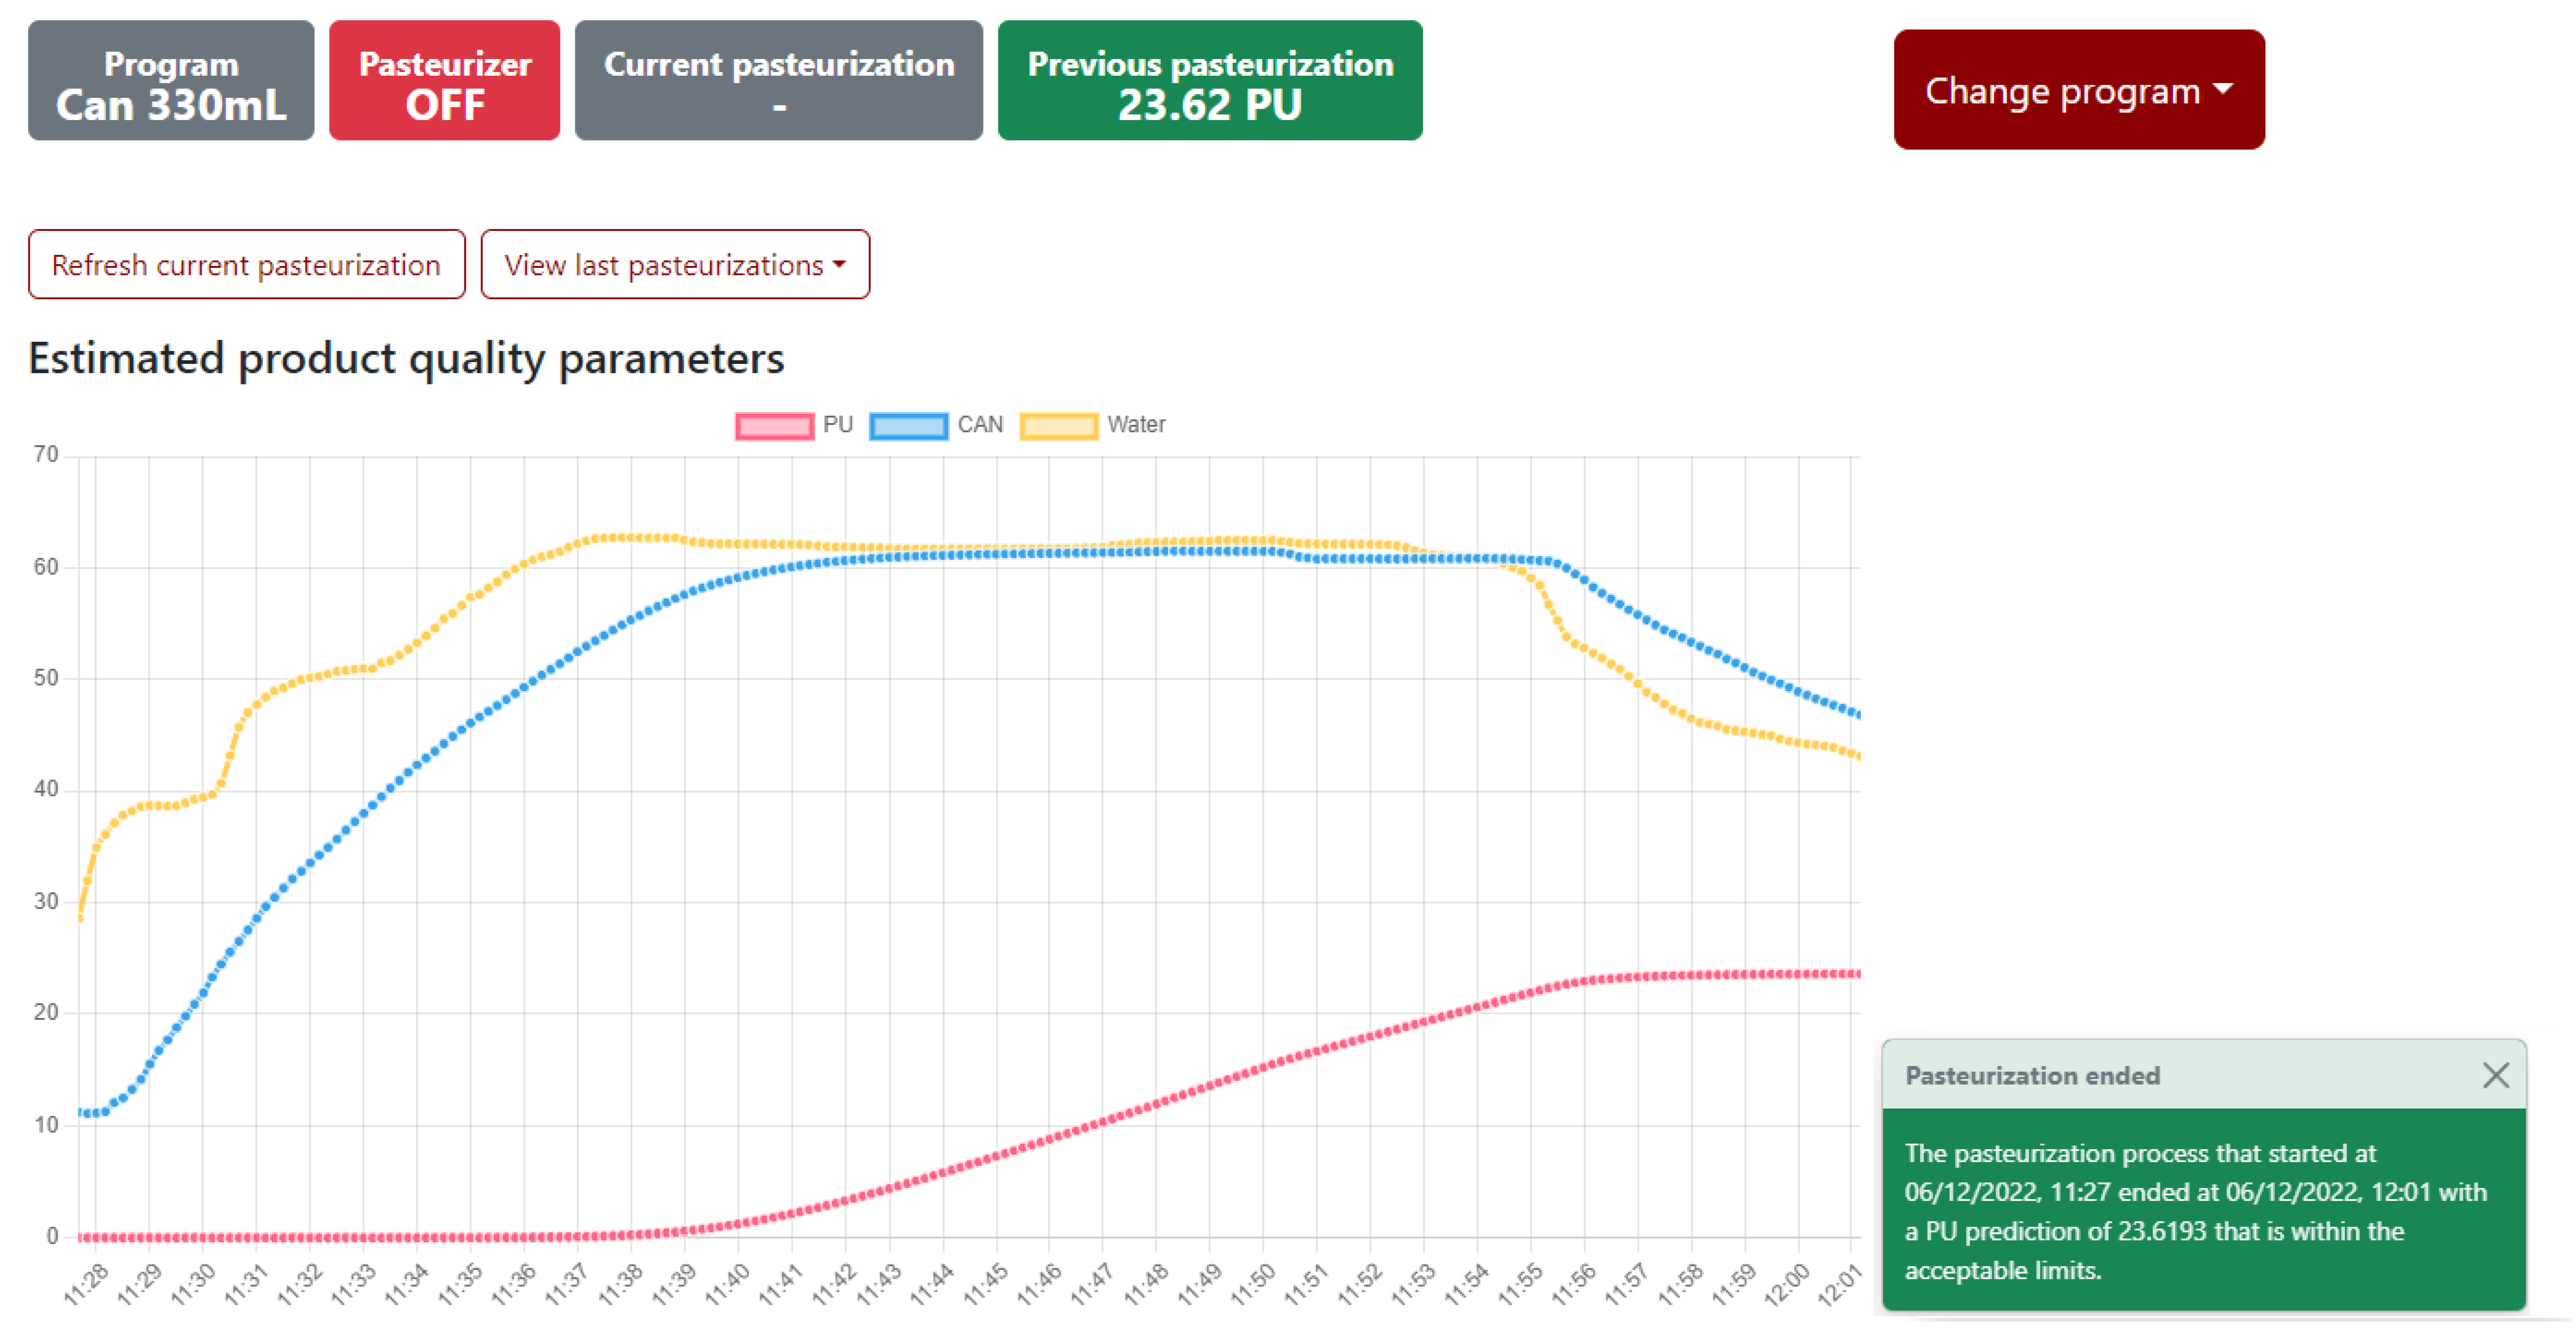
4.2. Live Dashboard Monitoring

The dashboard page enables operators to visually monitor the trend of the temperatures inside the pasteurizer machine as well as the estimated process temperatures and PUs. The following process indicators are included on top of the dashboard page, from left to right:
  • Program: indicates the current program and product of pasteurization (e.g., Can 500 mL, Can 330 mL).
  • Pasteurizer: indicates the operational status of the machine (ON/OFF), i.e., whether or not the conveyors of the pasteurizer machine are moving.
  • Current pasteurization: indicates the accumulated PUs of the current running pasteurization, i.e., the PUs up to the stage/time it has reached thus far; this is frequently updated.
  • Previous pasteurization: the total accumulated PUs of the previous (last) pasteurized batch of products.
  • Change program: this button s used to update the program and change the product undergoing pasteurization.
Figure 7 depicts these five indicators at the top, followed by a line chart (indexed by time) presenting the trend of the estimated sprayed water temperature (yellow line), product cold spot temperature (blue line), and accumulated PUs (red line) for the current pasteurization. On the corner right, a pop-up notification box appears when the pasteurization batch ends to alert users that the pasteurization batch with the given timestamps and PUs falls within the specified acceptable limits. Figure 8 displays the measured temperatures in the water tank of each zone of the pasteurizer. Both charts include a zoom-in functionality, allowing the operator to look more closely at the values of interest within a certain time frame and at specific minutes.
Using the “Refresh Current Pasteurization” button, the user can sync all the measurements and estimated values up to the latest time of the current pasteurization. As mentioned in Section 3.3, the sampling frequency for the zone temperatures and the predictions of the ML models for the temperature estimations is set to every 10 s. The “View Last Pasteurization” button provides operators with the ability to view the respective temperatures and estimations for the previous batch of pasteurized products, allowing them to visually inspect the trend and determine whether the process response is normal.

4.3. Evaluation of Historical PU Estimations

Figure 9 displays a view of the History page, in which the operators can review the estimated accumulated PUs for every batch of products that has been monitored. In particular, each row in the History table corresponds to a single pasteurization batch containing the following information in each column, from left to right:
  • Start and End timestamps for every monitored batch of products.
  • The associated pasteurization program and product.
  • The estimated PUs for the given batch of products.
  • The Within Limits tag, which indicates whether the estimated PUs fell within the acceptable PU range for that pasteurization program.
  • The Thermograph Measurement button used to enter the actual PU data. When an operators has used the thermograph recorder to sample the PUs, either from a single or multiple pasteurizations, they are able to input the PU measurements in the corresponding rows of the history table. In this way, they can directly assess the quality (accuracy) of the estimations by comparing them with the actual PU values.
  • Estimation accuracy, by using Equation (3) below to compare the estimated PUs and the actual thermograph PUs (only in cases where the latter have been provided by the operator).
In addition, users can filter the History table in order to narrow down the results and view specific past pasteurizations. The available filters consist of the date filter, used to fetch pasteurizations that fall within a given timeframe, “Only With Thermograph”, which displays the pasteurizations (rows) in which a thermograph measurement has been entered, and “Only Outside Limits”, which displays those pasteurizations that had estimated PUs in excess of their predefined normal range thresholds.
Validation results. The data collection process lasted several months between February and September 2022, and included the collection of IIoT data and thermograph recordings. Concerning the statistics gathered during this phase, the sampling procedure took place as follows: for each of the six PT sensors, we sampled every 10 s; for the digital signals, the sampling took place each time the state changed, meaning that the total zPAsteurAIzer database contained more than 20 million values. In addition, the experiments, i.e., the monitored pasteurization batches or PU predictions, had an average duration of 35 min, totaling 10,000 experiments conducted (irrespective of the thermograph recordings).
The evaluation of ML-driven virtual sensing estimation of PUs is based on two metrics, namely, the Mean Absolute Percentage Error (MAPE), which expresses the average of the absolute percentage errors, and the Mean Absolute Error (MAE), which is a data scale-dependent metric indicating how large of an error can be expected on average in a given prediction. The mathematical definition of these metrics are as follows:
M A P E = 100 % n t = 1 n y y p r e d y
E s t i m a t i o n a c c u r a c y = 100 % ( 1 y y p r e d y )
M A E = 1 n t = 1 n | y y p r e d |
where y is the actual value, y p r e d is the predicted value, and n is the sample size.
The best-performing model (SE) resulted in an MAPE of 7.22% (or 92.78 total estimation accuracy) and MAE of 2.17 when predicting the PUs. During this validation period, zPasteurAIzer detected 16 issues in total (irrespective of their criticality), of which the operators detected only one via manual thermograph sampling, which is the usual approach in the absence of continuous live monitoring.

5. Conclusions and Future Work

In this work, we have presented zPasteurAIzer, an end-to-end system that addresses Zero Defect Manufacturing (ZDM) aspects in the large food and beverage industry through digitalization of legacy pasteurizers with the use of AI/ML, IIoT, virtual sensing, and modern web technologies. Our proposal is an AI-enabled predictive quality solution adapted to industrial environments and the needs of shop floor operators for live quality monitoring, early detection of process malfunctions, prevention of defective products, and quality assurance in the pasteurization process. We conclude that zPasteurAIzer is an affordable solution, represents an alternative to replacing or upgrading legacy equipment, and offers real-time estimation of the pasteurization process parameters, thereby contributing to product quality assurance. zPasteurAIzer can increasing shop floor productivity, as operators do not need to conduct manual sampling of the process with the thermograph recorders. In addition, it should be mentioned that while the application of zPasteurAIzer has been validated on one pasteurizer machine, its design and development support scaling to multiple pasteurizers and product profiles, making it applicable to any tunnel pasteurizer used in packaging production lines independent of the legacy of the systems and products involved. Overall, the results demonstrate that zPasteurAIzer can feasibly provide product quality monitoring by estimating the accumulated PUs during the pasteurization process with an acceptable accuracy of 92% through estimation of the underlying temperatures; furthermore, there is potential for additional improvements in the future.
Considering the potential for future research and development, additional ML models and techniques could be explored in order to increase PU estimation accuracy. Moreover, a useful addition to the platform would be an explainable AI interface in the front end of the application. Such an interface could provide explanations about how the models work and generate their predictions based on the input data and features, thereby contributing to increasing industrial operators’ trust in application’s outputs. Further steps in future work could involve the integration of additional data from PLC signals from other machines in the production line, both to enhance the studied problem and to enable new ML-driven applications. A last step in fully automating the ZDM cycle would be to integrate zPasteurAIzer’s outputs with the automation process of the production line in order to make real-time adjustments and handle the reworking of unacceptable pasteurization batches.

Author Contributions

Conceptualization, G.F., S.N. and S.H.P.; methodology and software, M.D., S.H.P. and K.T.; validation, S.O.A., M.D., G.F., C.M., S.H.P. and K.T.; resources, M.D., G.F. and S.N.; writing—original draft preparation, G.F. and S.H.P.; writing—review and editing, S.O.A., C.M. and S.H.P.; supervision, project administration, funding acquisition, S.N. All authors have read and agreed to the published version of the manuscript.

Funding

The research leading to these results received cascading funding from the European Union’s Horizon 2020 research and innovation program under grant agreement no. 825631, corresponding to the project shortly entitled ZDMP (Zero Defect Manufacturing Platform).

Institutional Review Board Statement

Not applicable.

Informed Consent Statement

Not applicable.

Data Availability Statement

The collected data come from an actual industrial production line of a large company in the food and beverages sector. A non disclosure agreement prevents us from providing more details about the company, production environment and publishing the data used for the research.

Acknowledgments

The present work was financially supported by the Andreas Mentzelopoulos Foundation.

Conflicts of Interest

The authors declare no conflict of interest.

References

  1. Rahman, M.S. Handbook of Food Preservation; CRC Press: Boca Raton, FL, USA, 2007. [Google Scholar]
  2. Briggs, D.E.; Brookes, P.; Stevens, R.; Boulton, C. Brewing: Science and Practice; Woodhead Publishing: Sawston, UK, 2004; Volume 108. [Google Scholar]
  3. Horn, C.; Franke, M.; Blakemore, F.; Stannek, W. Modelling and Simulation of Pasteurization and Staling Effects During Tunnel Pasteurization of Bottled Beer. Food Bioprod. Process. 1997, 75, 23–33. [Google Scholar] [CrossRef]
  4. Dilay, E.; Vargas, J.; Amico, S.; Ordonez, J. Modeling, simulation and optimization of a beer pasteurization tunnel. J. Food Eng. 2006, 77, 500–513. [Google Scholar] [CrossRef]
  5. Bhuvaneswari, E.; Anandharamakrishnan, C. Heat transfer analysis of pasteurization of bottled beer in a tunnel pasteurizer using computational fluid dynamics. Innov. Food Sci. Emerg. Technol. 2014, 23, 156–163. [Google Scholar] [CrossRef]
  6. Zero Defect Manufacturing Platform. Available online: https://www.zdmp.eu/ (accessed on 15 December 2022).
  7. Campbell, S.; Cáceres, S.; Pagalda, G.; Poler, R.; Jardim-Gonçalves, R. A European Manufacturing Platform for Zero-Defects. In Proceedings of the I-ESA Workshops, Tarbes, France, 17–19 November 2020. [Google Scholar]
  8. Filios, G.; Kyriakopoulos, A.; Livanios, S.; Manolopoulos, F.; Nikoletseas, S.; Panagiotou, S.H.; Spirakis, P. Data-driven soft sensing towards quality monitoring of industrial pasteurization processes. In Proceedings of the 2022 18th International Conference on Distributed Computing in Sensor Systems (DCOSS), Los Angeles, CA, USA, 30 May–1 June 2022; pp. 167–174. [Google Scholar] [CrossRef]
  9. Bampoula, X.; Siaterlis, G.; Nikolakis, N.; Alexopoulos, K. A Deep Learning Model for Predictive Maintenance in Cyber-Physical Production Systems Using LSTM Autoencoders. Sensors 2021, 21, 972. [Google Scholar] [CrossRef] [PubMed]
  10. Filios, G.; Katsidimas, I.; Nikoletseas, S.; Panagiotou, S.; Raptis, T.P. An Agnostic Data-Driven Approach to Predict Stoppages of Industrial Packing Machine in Near Future. In Proceedings of the 16th International Conference on Distributed Computing in Sensor Systems (DCOSS), Marina del Rey, CA, USA, 25–27 May 2020; pp. 236–243. [Google Scholar] [CrossRef]
  11. Ou, X.; Huang, J.; Chang, Q.; Hucker, S.; Lovasz, J.G. First Time Quality Diagnostics and Improvement through Data Analysis: A Study of a Crankshaft Line. Procedia Manuf. 2020, 49, 2–8. [Google Scholar] [CrossRef]
  12. Zhou, B.; Svetashova, Y.; Byeon, S.; Pychynski, T.; Mikut, R.; Kharlamov, E. Predicting Quality of Automated Welding with Machine Learning and Semantics: A Bosch Case Study. In Proceedings of the 29th ACM International Conference on Information and Knowledge Management, CIKM’20, Virtual, 19–23 October 2020; Association for Computing Machinery: New York, NY, USA, 2020; pp. 2933–2940. [Google Scholar] [CrossRef]
  13. Filios, G.; Katsidimas, I.; Nikoletseas, S.; Panagiotou, S.H.; Raptis, T.P. Agnostic learning for packing machine stoppage prediction in smart factories. ITU J. Future Evol. Technol. 2022, 3, 793–807. [Google Scholar] [CrossRef]
  14. Zhou, B.; Pychynski, T.; Reischl, M.; Kharlamov, E.; Mikut, R. Machine learning with domain knowledge for predictive quality monitoring in resistance spot welding. J. Intell. Manuf. 2022, 33, 1139–1163. [Google Scholar]
  15. Sharp, M.; Ak, R.; Hedberg, T. A survey of the advancing use and development of machine learning in smart manufacturing. J. Manuf. Syst. 2018, 48, 170–179. [Google Scholar] [CrossRef]
  16. Nti, I.K.; Adekoya, A.F.; Weyori, B.A.; Nyarko-Boateng, O. Applications of artificial intelligence in engineering and manufacturing: A systematic review. J. Intell. Manuf. 2021, 33, 1581–1601. [Google Scholar]
  17. Kang, Z.; Catal, C.; Tekinerdogan, B. Machine learning applications in production lines: A systematic literature review. Comput. Ind. Eng. 2020, 149, 106773. [Google Scholar] [CrossRef]
  18. Tercan, H.; Meisen, T. Machine learning and deep learning based predictive quality in manufacturing: A systematic review. J. Intell. Manuf. 2022, 33, 1879–1905. [Google Scholar] [CrossRef]
  19. Bertolini, M.; Mezzogori, D.; Neroni, M.; Zammori, F. Machine Learning for industrial applications: A comprehensive literature review. Expert Syst. Appl. 2021, 175, 114820. [Google Scholar] [CrossRef]
  20. Li, W.; Zhang, L.; Wu, C.; Cui, Z.; Niu, C. A new lightweight deep neural network for surface scratch detection. Int. J. Adv. Manuf. Technol. 2022, 123, 1999–2015. [Google Scholar] [CrossRef] [PubMed]
  21. Konovalenko, I.; Maruschak, P.; Brezinová, J.; Prentkovskis, O.; Brezina, J. Research of U-Net-Based CNN Architectures for Metal Surface Defect Detection. Machines 2022, 10, 327. [Google Scholar] [CrossRef]
  22. Bottani, E.; Vignali, G.; Carlo Tancredi, G.P. A digital twin model of a pasteurization system for food beverages: Tools and architecture. In Proceedings of the 2020 IEEE International Conference on Engineering, Technology and Innovation (ICE/ITMC), Cardiff, UK, 15–17 June 2020; pp. 1–8. [Google Scholar] [CrossRef]
  23. Tancredi, G.P.; Vignali, G.; Bottani, E. Integration of Digital Twin, Machine-Learning and Industry 4.0 Tools for Anomaly Detection: An Application to a Food Plant. Sensors 2022, 22, 4143. [Google Scholar] [CrossRef]
  24. Konur, S.; Lan, Y.; Thakker, D.; Morkyani, G.; Polovina, N.; Sharp, J. Towards design and implementation of Industry 4.0 for food manufacturing. Neural Comput. Appl. 2021, 1–13. [Google Scholar] [CrossRef]
  25. Riverol, C.; Ricart, G.; Carosi, C.; Di Santis, C. Application of advanced soft control strategies into the dairy industry. Innov. Food Sci. Emerg. Technol. 2008, 9, 298–305. [Google Scholar] [CrossRef]
  26. Kim, D.; Zohdi, T.; Singh, R. Modeling, simulation and machine learning for rapid process control of multiphase flowing foods. Comput. Methods Appl. Mech. Eng. 2020, 371, 113286. [Google Scholar] [CrossRef]
  27. Gonzalez Viejo, C.; Fuentes, S. Low-Cost Methods to Assess Beer Quality Using Artificial Intelligence Involving Robotics, an Electronic Nose, and Machine Learning. Fermentation 2020, 6, 104. [Google Scholar] [CrossRef]
  28. Ayvaz, S.; Alpay, K. Predictive maintenance system for production lines in manufacturing: A machine learning approach using IoT data in real-time. Expert Syst. Appl. 2021, 173, 114598. [Google Scholar] [CrossRef]
  29. Naskos, A.; Nikolaidis, N.; Naskos, V.; Gounaris, A.; Caljouw, D.; Vamvalis, C. A micro-service-based machinery monitoring solution towards realizing the Industry 4.0 vision in a real environment. Procedia Comput. Sci. 2021, 184, 565–572. [Google Scholar] [CrossRef]
  30. Cinar, E.; Kalay, S.; Saricicek, I. A Predictive Maintenance System Design and Implementation for Intelligent Manufacturing. Machines 2022, 10, 1006. [Google Scholar] [CrossRef]
  31. Cerquitelli, T.; Nikolakis, N.; Bethaz, P.; Panicucci, S.; Ventura, F.; Macii, E.; Andolina, S.; Marguglio, A.; Alexopoulos, K.; Petrali, P.; et al. Enabling predictive analytics for smart manufacturing through an IIoT platform⁎⁎This research leading has been partially funded by the European Commission under the H2020-IND-CE-2016-17 program, FOF-09-2017, Grant agreement no. 767561 ”SERENA” project, VerSatilE plug-and-play platform enabling REmote predictive mainteNAnce. IFAC-PapersOnLine 2020, 53, 179–184. [Google Scholar] [CrossRef]
  32. Marguglio, A.; Veneziano, G.; Greco, P.; Jung, S.; Siegburg, R.; Schmitt, R.H.; Monaco, S.; Apiletti, D.; Nikolakis, N.; Cerquitelli, T.; et al. A Hybrid Cloud-to-Edge Predictive Maintenance Platform. In Predictive Maintenance in Smart Factories: Architectures, Methodologies, and Use-Cases; Cerquitelli, T., Nikolakis, N., O’Mahony, N., Macii, E., Ippolito, M., Makris, S., Eds.; Springer: Singapore, 2021; pp. 19–37. [Google Scholar] [CrossRef]
  33. Rousopoulou, V.; Vafeiadis, T.; Nizamis, A.; Iakovidis, I.; Samaras, L.; Kirtsoglou, A.; Georgiadis, K.; Ioannidis, D.; Tzovaras, D. Cognitive analytics platform with AI solutions for anomaly detection. Comput. Ind. 2022, 134, 103555. [Google Scholar] [CrossRef]
  34. Syafrudin, M.; Alfian, G.; Fitriyani, N.L.; Rhee, J. Performance Analysis of IoT-Based Sensor, Big Data Processing, and Machine Learning Model for Real-Time Monitoring System in Automotive Manufacturing. Sensors 2018, 18, 2946. [Google Scholar] [CrossRef] [PubMed]
  35. Bousdekis, A.; Lepenioti, K.; Ntalaperas, D.; Vergeti, D.; Apostolou, D.; Boursinos, V. A RAMI 4.0 View of Predictive Maintenance: Software Architecture, Platform and Case Study in Steel Industry. In Proceedings of the Advanced Information Systems Engineering Workshops, Rome, Italy, 3–7 June 2019; Proper, H.A., Stirna, J., Eds.; Springer International Publishing: Cham, Switzerland, 2019; pp. 95–106. [Google Scholar]
  36. Jamshidi, P.; Pahl, C.; Mendonça, N.C.; Lewis, J.; Tilkov, S. Microservices: The Journey So Far and Challenges Ahead. IEEE Softw. 2018, 35, 24–35. [Google Scholar] [CrossRef]
  37. Revolution Pi–Industrial Raspberry Pi. Available online: https://revolutionpi.com/ (accessed on 15 December 2022).
  38. Pedregosa, F.; Varoquaux, G.; Gramfort, A.; Michel, V.; Thirion, B.; Grisel, O.; Blondel, M.; Prettenhofer, P.; Weiss, R.; Dubourg, V.; et al. Scikit-learn: Machine Learning in Python. J. Mach. Learn. Res. 2011, 12, 2825–2830. [Google Scholar]
  39. Olson, R.S.; Bartley, N.; Urbanowicz, R.J.; Moore, J.H. Evaluation of a Tree-based Pipeline Optimization Tool for Automating Data Science. In Proceedings of the Genetic and Evolutionary Computation Conference 2016, GECCO’16, Denver, CO, USA, 20–24 July 2016; ACM: New York, NY, USA, 2016; pp. 485–492. [Google Scholar] [CrossRef] [Green Version]
Figure 1. High-level overview of zPasteurAIzer architecture.
Machines 11 00191 g001
Figure 2. ZDMP architecture overview.
Machines 11 00191 g002
Figure 3. IIoT controller setup in the production line.
Machines 11 00191 g003
Figure 4. Overhead and side view of the tunnel pasteurizer.
Machines 11 00191 g004
Figure 5. UI page for configuring the tunnel pasteurizer and zone settings.
Machines 11 00191 g005
Figure 6. UI page for setting the pasteurization profiles of each product category.
Machines 11 00191 g006
Figure 7. Dashboard view for monitoring the ML-estimated product quality parameters.
Machines 11 00191 g007
Figure 8. Dashboard view for monitoring the actual zone temperatures.
Machines 11 00191 g008
Figure 9. History page for reviewing and filtering the PU estimations.
Machines 11 00191 g009
Table 1. Dataset features used as input for the ML models.
Feature NameDescription
Factory temperatureThe recorded temperature in the factory environment.
Paster. statusA binary value indicating whether the pasteurizer machine is running or not.
Paster. timerThe time slot in which the pasteurization is currently running.
Paster. programThe pasteurization program running currently in operation.
Bath numberThe bath zone in which the monitored pasteurization batch is currently.
Bath temperatureThe temperature of the bath zone in which the monitored pasteurization batch is currently.
Previous|next
Bath temperature
The temperature of the (previous/next) bath zone from where the monitored pasteurization batch is currently.
Previous water temp.The temperature of the previous spraying water temperature estimation.
Previous can temp.The temperature of the previous temperature estimation in the middle of the cold spot of the beer can.
Disclaimer/Publisher’s Note: The statements, opinions and data contained in all publications are solely those of the individual author(s) and contributor(s) and not of MDPI and/or the editor(s). MDPI and/or the editor(s) disclaim responsibility for any injury to people or property resulting from any ideas, methods, instructions or products referred to in the content.

