
Computer Vision Method for In Situ Measuring Forming Accuracy of 3D Sand Mold Printing

State Key Laboratory of Materials Processing and Die & Mould Technology, School of Materials Science and Engineering, Huazhong University of Science and Technology, Wuhan 430074, China
*
Author to whom correspondence should be addressed.
Machines 2023, 11(3), 330; https://0-doi-org.brum.beds.ac.uk/10.3390/machines11030330
Submission received: 18 January 2023
/
Revised: 13 February 2023
/
Accepted: 24 February 2023
/
Published: 27 February 2023
(This article belongs to the Special Issue Advance in Additive Manufacturing)
Abstract
:The three-dimensional sand mold printing technology (3DSP) for casting sand molds via a binding jet is a breakthrough in the casting mold-making process. It is a favorable combination of digital forming technology and sand casting, which is a significantly interesting research area in the foundry industry. This study has proposed an edge extraction approach for the forming region in the sand bed image. With the edge information, the study measures the forming accuracy of the printed molds, which offers a basis for assessing the forming quality after 3DSP. The extracted edges essentially match the original image through the validation of cube printing. The error between the measured and actual size is below 0.6 mm, and the standard deviation of the straight line edge is below 0.170 mm, which fulfills the accuracy requirements for 3D sand mold printing.
1. Introduction
Casting is a long-standing material-forming process, which provides a high degree of forming freedom and can accommodate a wide variety of metallic materials, shape, quality, and size requirements [1]. Sand casting is the most commonly used technique in the casting process. The classical sand-casting mold-making process consists of mixing raw sand and binding materials, and then the mixture is poured into a pattern to shape pieces for a sand mold assembly. Finally, molten metal or alloy is poured into the mold cavity within a sand mold assembly and solidifies inside [2].
With the advent of additive manufacturing (AM) technology, a new sand-casting molding process named three-dimensional sand mold printing (3DSP) forms casting molds using a binder jet [3]. This method does not rely on patterns but transforms the digital 3D models directly into sand molds by jetting binder materials into the molding sand layer by layer. The technique exhibits inherent qualities of the database and information-driven production. The AM method of forming has a greater degree of structural freedom than that of conventional modeling techniques, allowing for technical advancements in casting. Multiple sand cores spread in the mold can be formed as a single core without considering the geometric limits of the core box, generating minimized errors caused by the core assembly procedure. Sama et al. [4,5] utilized the modeling versatility of 3DSP to design a gating system with complex structures and curves, which significantly improved the metallurgical and mechanical properties of the castings. Their conical-helix-sprue casting exhibits reduced inclusion, reduced defect volume, and higher ultimate flexural strength. Stebbins et al. [6] designed an additional hollow structure at the end of the runner, which greatly reduced the incidence of casting flaws such as air entrainment and porosity. Deng et al. [7] constructed the hollow structure in the sand mold for the risers’ insulation, which decreased the solidification time of the molten metal by 30% and thus improved the riser’s insulation performance. These structural improvements to the mold make significant contributions towards the improvement of the castings’ quality, which is challenging to achieve via the conventional sand molding processes, whereas it is ready via the 3DSP molding approach.
In contrast to using the geometric shape of the pattern to physically restrict the shape of the sand mold to assure forming accuracy, 3DSP controls the mold shape through the precision of the digital control system [8]. The entire sand mold might only be measured with measuring instruments once the lengthy molding process is complete. This measurement technique is labor- and time-consuming. With the continued advancement of computer vision technology, measuring the geometric size of a target through machine vision has become the most prevalent non-contact measurement technique [9]. Via a variety of image acquisition equipment and working environments, the computer vision measurement could reach micron-level measurement accuracy, which is sufficient for measuring the size of sand molds.
The study describes a method for measuring molding dimensions by computer vision during the 3DSP production. The dimensional accuracy and error of the present layer forming are examined layer by layer, allowing the overall forming accuracy and error of the sand molds to be swiftly determined once the forming is complete. Monitoring layer-by-layer dimensions and estimating the overall forming correctness is supposed to save a substantial cost during the molds’ quality inspection.
2. Related Works
Diverse non-contact dimensional measurement techniques based on computer vision are now widely utilized. Commonly, the process involves capturing a clear image of the target to be measured, segmenting the identified target from the background, extracting various attributes from the target image, and finally calculating the target parameters. The research focuses on how to accurately partition the detection areas.
In digital image processing, region segmentation primarily employs threshold and edge detection to separate target regions from the background with different brightness and edge distinction. Gao et al. [10] segmented cloth cracks using the Sobel operator and edge sharpening during detection. Zhou et al. [11] employed a two-step method to find and segment the target area. Firstly, they used the Laplacian operator, Otsu binarization, and the Canny algorithm to place the edge roughly. Then, the Zernike moment [12] algorithm was applied to reach a finer positioning of the edge. The Zernike moment could conduct sub-pixel level detection in digital images. Yuan et al. [13] exploited the machine vision to identify fractures in components. The image was first segmented using a convolutional neural network (CNN) to produce the uncertain crack regions. Then, the cracks were validated and quantified by tip detection. The function of the CNN was used to roughly locate and eliminate the interference from crack-like areas.
With the advancement of artificial intelligence, Xie et al. [14] devised a Holistically nested Edge Detection (HED) network, an end-to-end edge extraction neural network structure. The method based on machine learning is precise, efficient, and robust. Furthermore, various deep neural network architectures, such as SegNet [15], UNet [16], PSPNet [17], and DeepLab [18], et al., are designed to handle the segmentation. In contrast to edge detection, these networks classify, merge, and join pixels with the same practical importance immediately to achieve semantic segmentation. The semantic segmentation via deep neural networks shows an excellent performance in medical image processing that aims to identify pathological regions.
Numerous computer vision-based monitoring techniques have also been widely applied in additive manufacturing. These approaches continually capture images during the equipment operation to evaluate the health status of the equipment or work quality. For real-time extrusion quality monitoring for construction 3D printing, Kazemian et al. [19] proposed four techniques, including power consumption measurements for agitator motors, extrusion pressure measurements, electrical resistivity measurements, and computer vision. The compared results indicate that computer vision is the most reliable and accurate technique. Caggiano et al. [20] developed a computer-vision method for identifying powder bed printing flaws in the selective laser melting (SLM) process. They constructed and trained a deep CNN for the defect identification. Zhang et al. [21] examined the surface image of powder bed molding with fringe projection. In contrast, Grasso et al. [22] used a high-speed camera to study local heat and discovered overheating flaws. In the absence of visible light, infrared cameras [23] were utilized to monitor the working surface’s temperature and surface defects.
From the above, digital monitoring in manufacturing has become the basic configuration of digital and even intelligent machine equipment. Among various monitoring methods, the machine-vision process is the most popular one. In addition to monitoring the equipment’s operation status and health to prevent damage, it can predict product quality in advance and provides conditions for optimizing processes. This study aims to monitor the dimensional accuracy during 3DSP processing and provide raw data for evaluating sand model quality and optimizing the subsequent process.
3. Methods
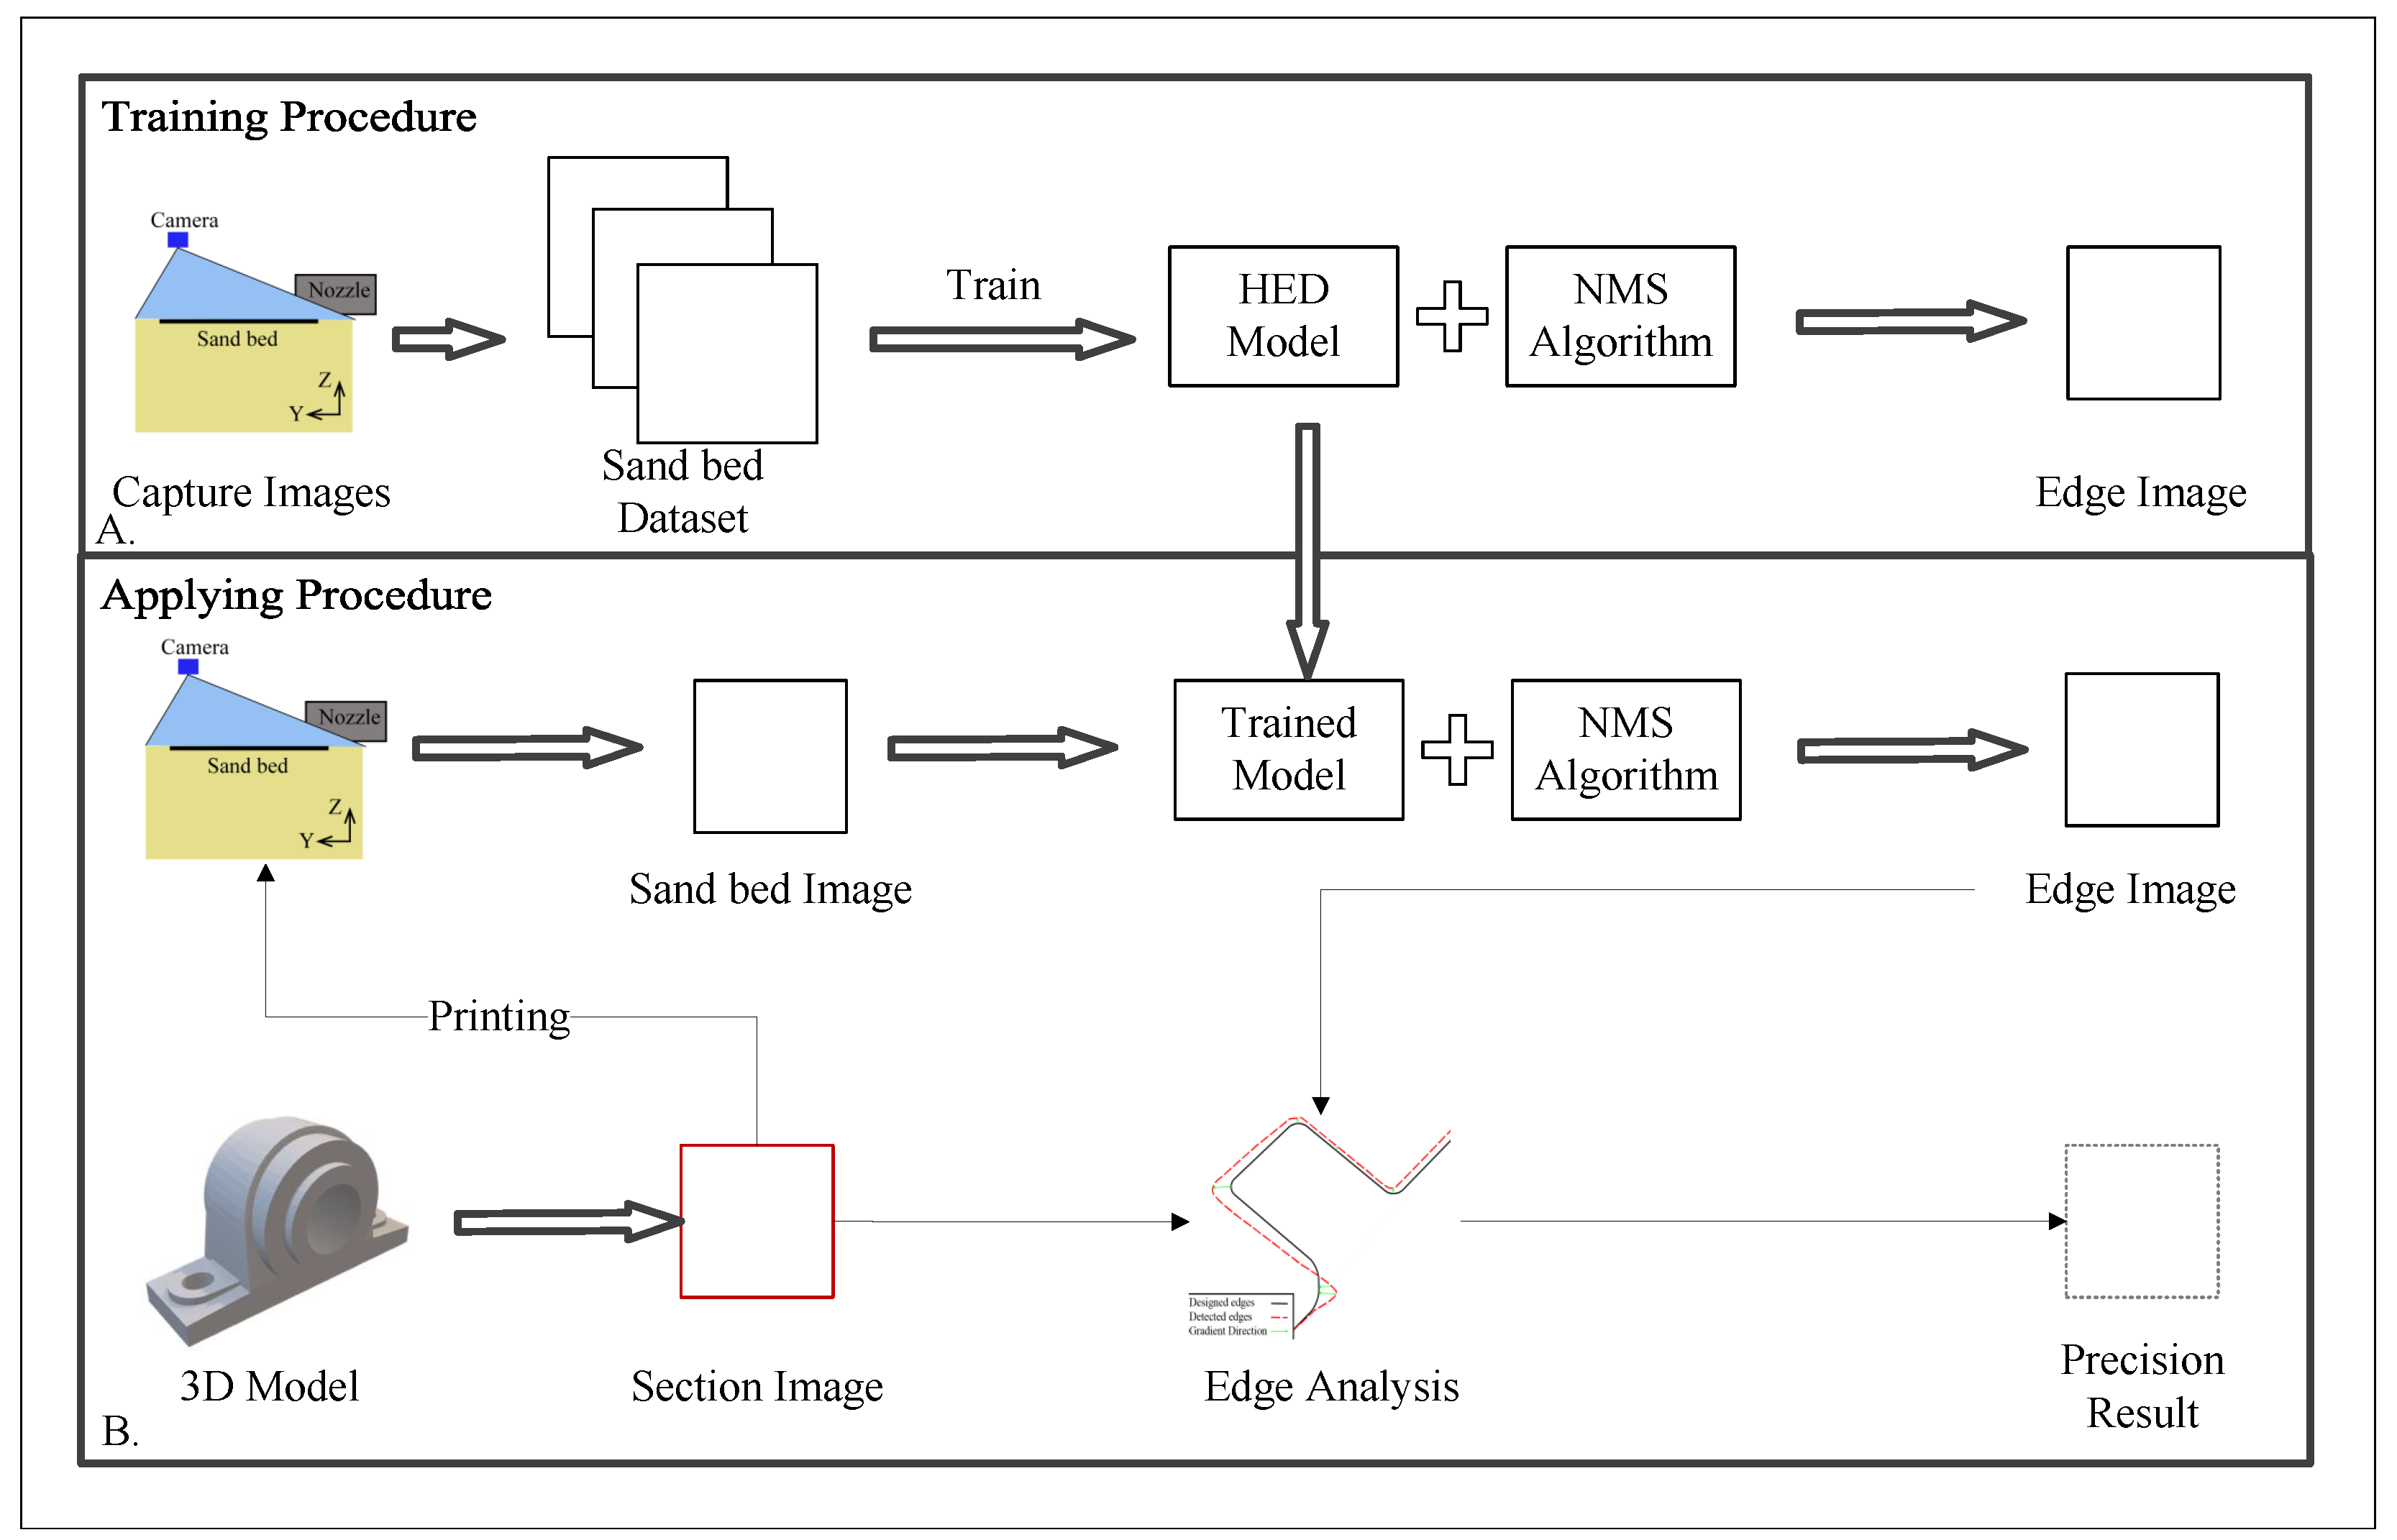
The key challenge of computer vision dimensional measurement is the object segmentation algorithm to separate the binder-sprayed from the non-sprayed area in the sand bed image. An algorithm for edge extraction is designed and trained above all. The printed image of each layer is captured continually during the processing and processed by the algorithm to the extract edge information, followed by measurements of the current layer’s geometric and printing accuracy. The accuracy from each layer is tailored after forming to provide an overall printing accuracy assessment. The algorithm flow is shown in Figure 1.
3.1. Data Collection
The materials and specifications of the equipment are as follows: The raw sand is 70/100 mesh silica sand, the maximum particle size of the molding sand is 270 μm, the binder is furan resin, the thickness of the print layer is 0.3 mm, and the forming size is 200 mm × 200 mm. The surface roughness of the formed sand mold is 200 μm. The camera employed in the study is a HikRobot MV-CE-200-10GM grayscale camera with an image resolution of pixels. The captured image is trimmed to remove irrelevant elements and the forming zone is left with a size of pixels, as shown in Figure 2b. The outline of the binder-sprayed area is schematically drawn, as shown in Figure 2e.
3.2. Edge Extraction Method
3.2.1. Digital Image Processing
Commonly used edge extraction methods in digital image processing include the Sobel operator, Laplacian operator, and Canny operator. These all examine the probable edge locations in the gradient of brightness in the image. The study initially attempts to extract the edge using the aforementioned methods, and the results are depicted in Figure 3. It demonstrates that the Laplacian operator and the Canny operator are unable to distinguish the edge of the binder-sprayed area, whereas the Sobel operator could provide relatively clear information. However, noise points are diffused everywhere. There is no definite edge in the zoomed-in view, such as the second-row images in Figure 3.
As observed in the magnified images of each detection result shown in Figure 3, a great number of noise points are identified because the surface of the sand bed is formed by large particle-size mold sand. The noise points are recognized as edge points because these produce the brightness gradient in the image. However, under the crucial requirements of maintaining precision, it is still extremely difficult to cope with image noise.
3.2.2. CNN Model and Train Procedure
The CNN model used in this study is a pre-trained HED network, which is an end-to-end multi-scale fusion edge detection network. As seen in Figure 4, it contains five convolutional blocks. Each of them has a pooling layer and numerous convolutional layers. Every block’s result becomes the next block’s input and is convolved to a single channel image simultaneously, which is called the bypass output. At the end of the network, all bypass outputs formed a five-channel image and then convolved into a single-channel image as the final output. Through multiple pooling, the image’s edge information is retrieved at various scales and is then merged. For a better situation for the model, additional training has been performed using the sand bed image dataset produced in Section 3.1. Limited by computation cost and memory size, the image is cropped into pieces of and scaled into the same size as the input of the model. The outputs were combined into an integral edge picture.
Around 800 sand bed images are prepared, where 90% of them are randomly picked as training data, and the rest are considered as validation or testing data.
3.2.3. Edge Thining
The output of the model is the probability that each pixel on the input image belongs to the edge. However, it is impossible to locate the singe-pixel-width edge precisely. On the contrary, it is usually like halos centered on the ideal edge and spreading outwards. To exactly pinpoint the edge, it is required to refine the trained model’s output. The non-maximum suppression (NMS) algorithm [24] could identify the maximum neighborhood values and suppress non-maximum items so that only maximum elements are retained. In a digital image, the gradient direction of the edge is theoretically perpendicular to the edge. Therefore, the study picks the region with the gradient as the candidate area and uses NMS in this neighborhood. In the area perpendicular to the edge, only the pixel with the highest probability is reserved as the confirmed edge, and the others are suppressed, as shown in Figure 5 and Equation (1).
where is the current pixel, N is the radius of suppressed area, is the value of point i distance away from in the gradient direction, and is calculated using the bilinear interpolation.
3.3. Accuracy Analysis
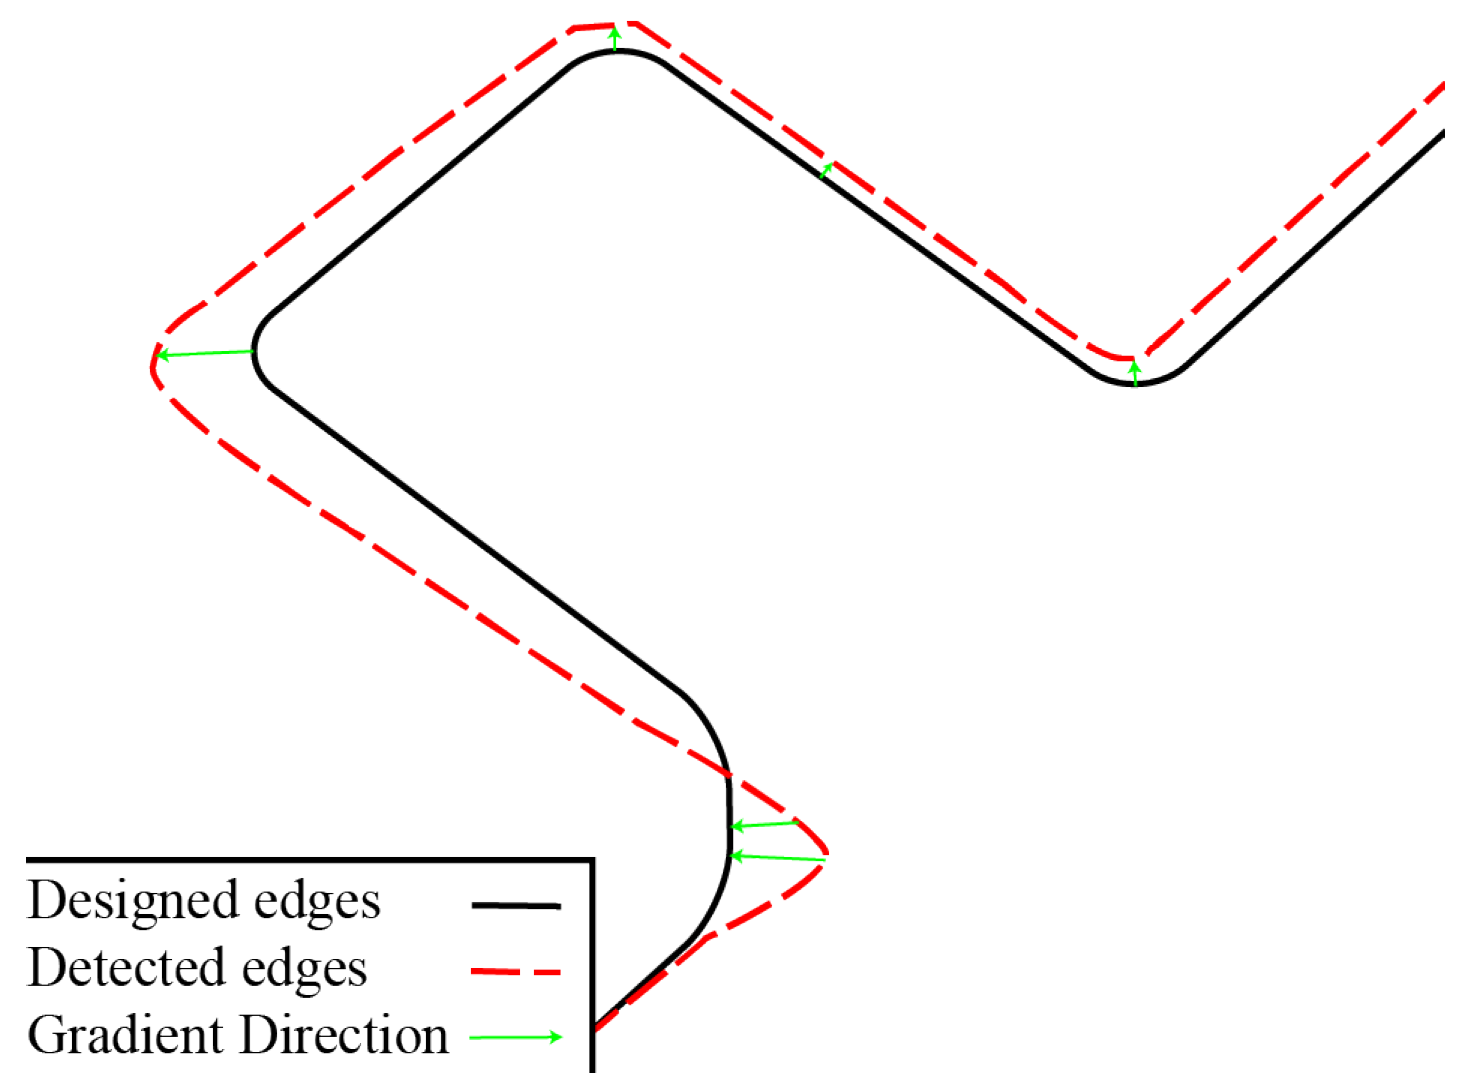
An accurate single-pixel-width edge image is generated after the processing of the sand bed image via the edge extraction algorithm. Meanwhile, the section image of the current layer, which is also the graphic sprayed on the sand bed, has been taken into account for the accuracy analysis processing as the standard edge. As shown in Figure 6, for every point in the standard edge, there are various points in its gradient direction on the detected edge. The closest point of these candidate points, which is the point with the smallest distance to the point in the designed edge, will be marked as the corresponding point. The distance between the two is regarded as the forming error.
4. Results and Discussion
4.1. Performance of Edge Extraction
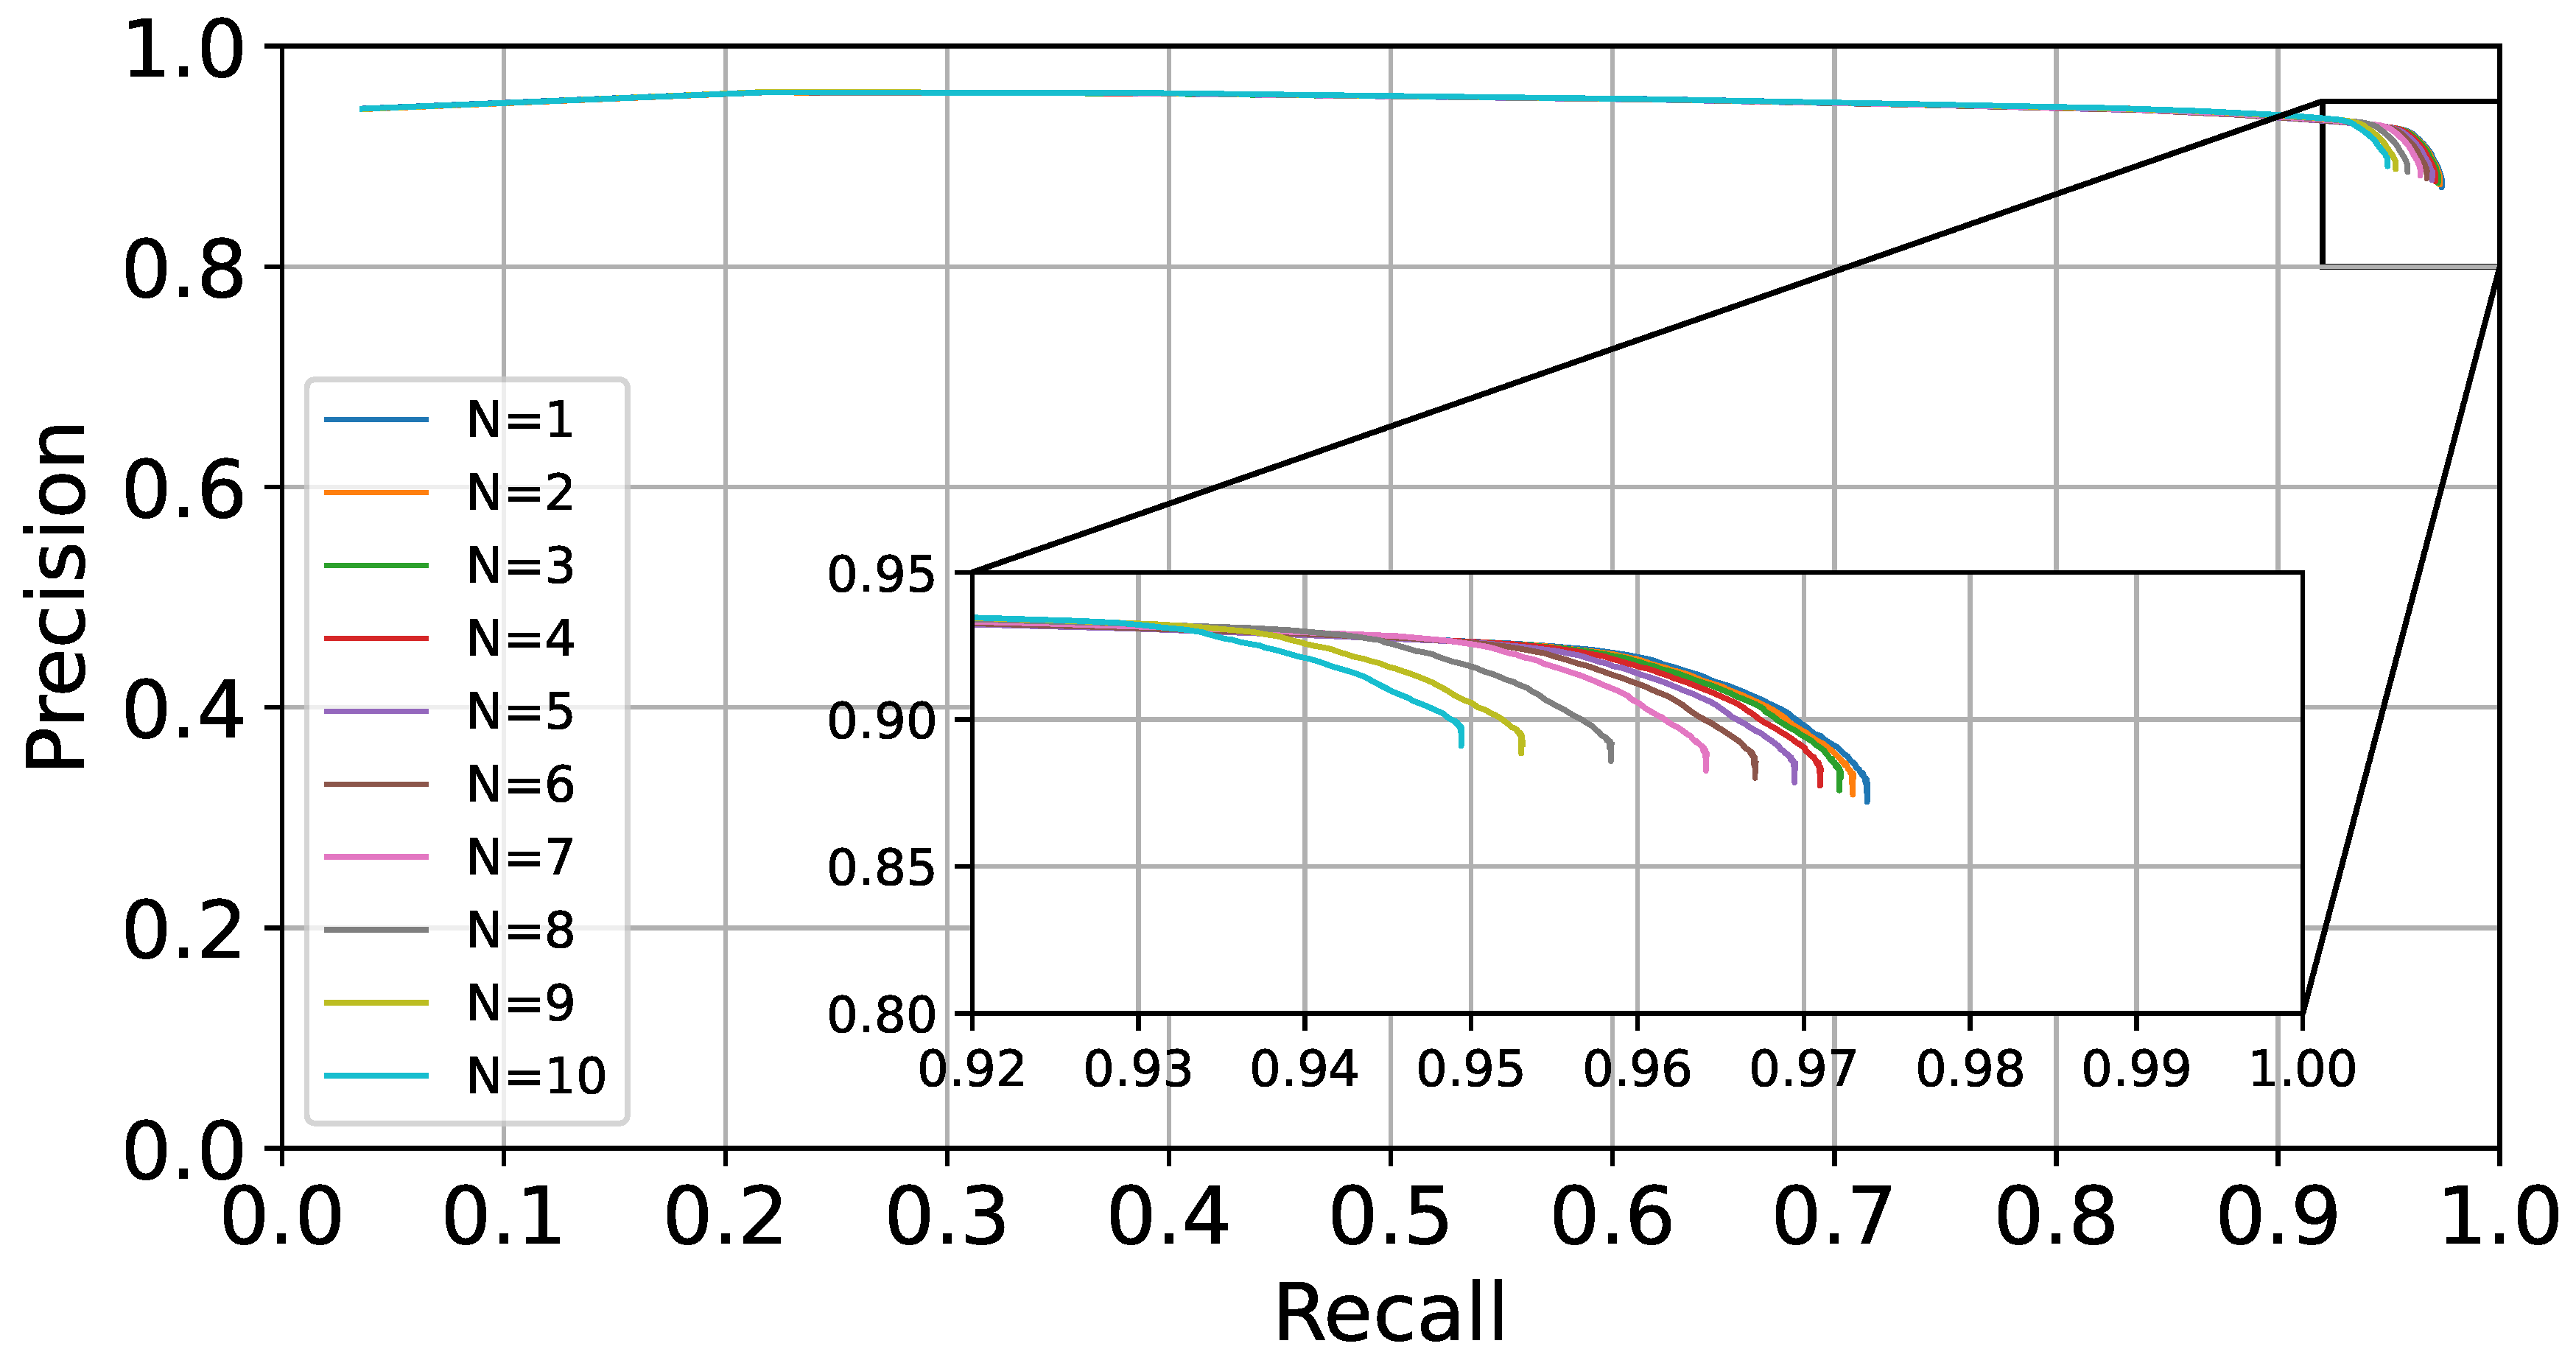
The edge extraction algorithm is the essential component of the complete printing accuracy monitoring system. It is used to precisely extract the binder-sprayed region. After the HED delivers the edge results, the precision and recall rates are computed by using various NMS suppression ranges for the edge refinement.
From the P-R curve in Figure 7, the trained model used in the study can maintain an over 85% recognition accuracy while achieving an over 95% recall rate. In terms of overall performance, it can gain an edge extraction performance of more than 90% precision and recall rate. As shown in Figure 8, when the suppression radius increases, the noise at the edge of the image can be more satisfactorily suppressed, making the thinned edge smoother, thereby reducing the frequency of false edges. However, the ensuing problem is that the increase in the suppression range would also affect the adjacent edges, and the original correct adjacent edges could be suppressed, consequently leading to a decrease in the recall.
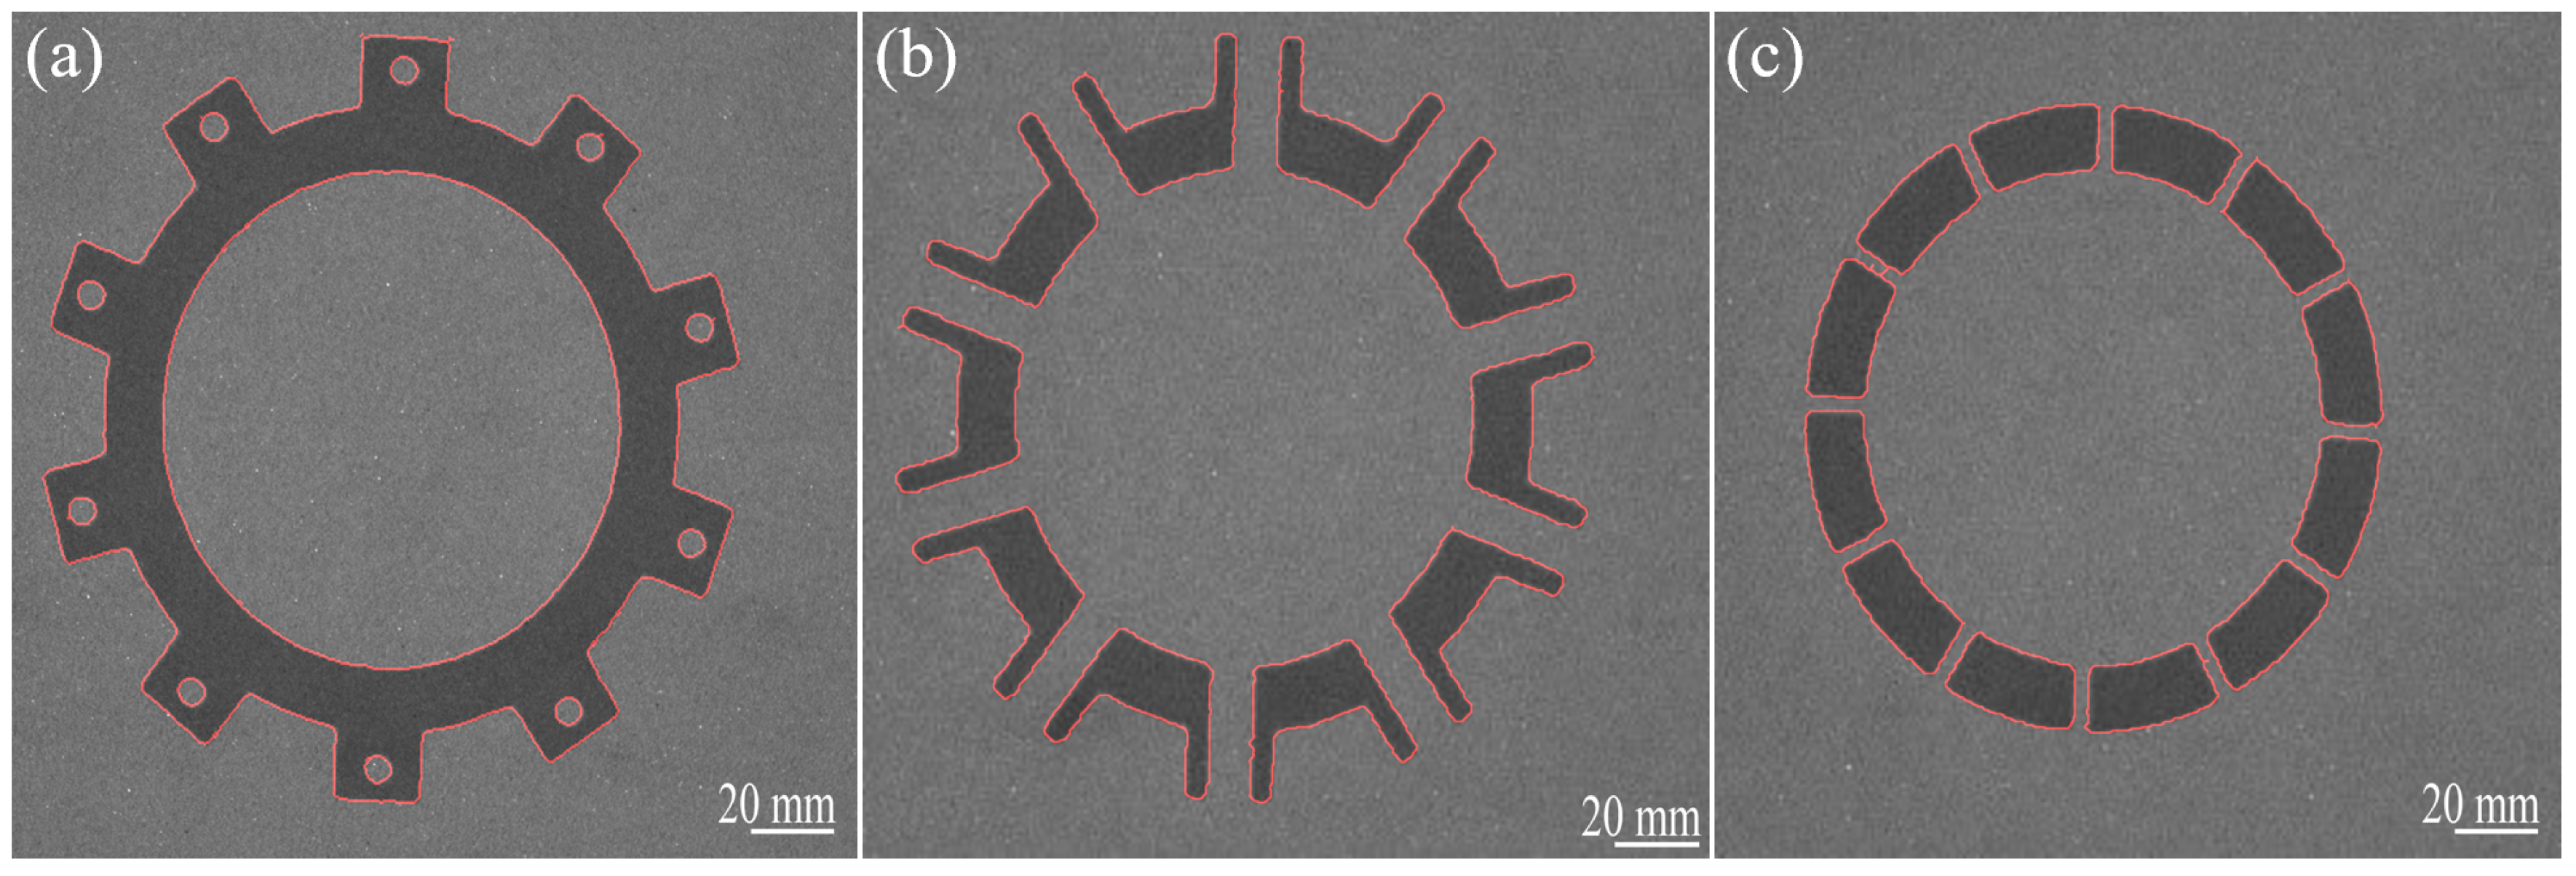
This study uses several cross-sectional printed images to extract edges (Figure 9). The extracted edges are effective at segmenting the binder-sprayed areas from the background. (a), (b) and (c) in Figure 9 are images and extracted edges of different slice layers. The extracted contours are not smooth curves or straight lines, and there are still some fluctuations. Figure 9c shows that the connection between contours with small distances is somewhat disconnected. Nevertheless, the recognized edges are very similar to the edges of binder-sprayed areas.
4.2. Performance of Measuring Accuracy
In the experiment, the hexahedrons with a height of 10 mm and section of 10 mm × 10 mm, 20 mm × 20 mm, 30 mm × 30 mm, 40 mm × 40 mm, and 50 mm × 50 mm are formed using 3DSP. They are measured geometrically with vernier calipers and computer vision, respectively. The equipment parameters are as same as those in Section 3.1. The sand molds and results of edge extraction are depicted in Figure 10. Figure 10c shows that the edge-derived corresponds to the real edge, which also overcomes the interference of noise points.
Figure 11a depicts the actual and measured size of specimens, and the errors between them are shown in Figure 11b. The two sets of data are identical, and the errors are both within 0.6 mm. The smaller design size would give rise to a larger error. Under the same resolution of images, the smaller area deforms more efficiently and results in more inaccuracies.
To validate the method’s stability, the study intercepts straight lines in the edge and computes the standard deviation. Figure 11c shows that the average standard deviation of measurements is within 150 μm. Moreover, the surface roughness of the 3DSP mold is 200 μm. Therefore, the method can sufficiently meet the criteria for the 3DSP sand mold measurement precision.
Errors in all samples from the test dataset are measured and shown in Figure 11d. The results show errors, and standard deviations of these samples increase compared to the simple cube. However, Figure 11c is the standard deviation of the distance from the point of the measured line to the actual line. Moreover, Figure 11d is the standard deviation of the estimated data of different models of the same size. The measurement errors and standard deviations for models of different designed sizes do not exhibit a clear relationship.
5. Conclusions
The study presents a computer-vision-based technique for the forming-accuracy analysis of 3D-printing molds during processing. Through the pre-selection via the CNN model and edge refinement, the edge extraction algorithm can effectively eliminate the surface noise interference caused by the granularity of the sand bed and extract the edge information that corresponds to the binder injection pattern. Through the verification of the hexahedron, the average measurement error is within 0.6 mm, and the average measurement disturbance is within 0.170 mm, which meets the requirements for the precise measurement of the 3DSP sand bed pattern. However, this technology currently could only estimate the geometrics on the printing plane, since it lacks the tools to measure the Z axis. In future studies, the stability and accuracy of the edge extraction will be further improved, and forming errors will be displayed in 3D.
Author Contributions
Conceptualization, X.D. and S.G.; methodology, S.G., L.W. and D.X.; software, S.G. and L.W.; validation, S.G.; resources, X.D.; data curation, S.G. and L.W.; writing—original draft preparation, S.G.; writing—review and editing, H.C., S.L. and X.D.; project administration, X.D. All authors have read and agreed to the published version of the manuscript.
Funding
This research received no external funding.
Data Availability Statement
Publicly available datasets were analyzed in this study. This data can be found here: [https://github.com/ridfer/PublicData, accessed on 17 January 2023].
Acknowledgments
The authors acknowledge the high-performance computing (HPC) Platform of Huazhong University of Science and Technology (HUST) for computation.
Conflicts of Interest
The authors declare no conflict of interest.
References
- Prasad, D.; Ratna, S. Decision Support Systems in the Metal Casting Industry: An Academic Review of Research Articles. Mater. Today Proc. 2018, 5, 1298–1312. [Google Scholar] [CrossRef]
- Sivarupan, T.; Balasubramani, N.; Saxena, P.; Nagarajan, D.; El Mansori, M.; Salonitis, K.; Jolly, M.; Dargusch, M.S. A Review on the Progress and Challenges of Binder Jet 3D Printing of Sand Moulds for Advanced Casting. Addit. Manuf. 2021, 40, 101889. [Google Scholar] [CrossRef]
- Upadhyay, M.; Sivarupan, T.; El Mansori, M. 3D Printing for Rapid Sand Casting—A Review. J. Manuf. Process. 2017, 29, 211–220. [Google Scholar] [CrossRef] [Green Version]
- Sama, S.R. Investigation into Non-Conventional Mold Designs Using 3D Sand-Printing in Castings. Master’s Thesis, The Pennsylvania State University, University Park, PA, USA, 2018. [Google Scholar]
- Sama, S.R.; Badamo, T.; Lynch, P.; Manogharan, G. Novel sprue designs in metal casting via 3D sand-printing. Addit. Manuf. 2019, 25, 563–578. [Google Scholar] [CrossRef]
- Stebbins, R.; King, P.; Manogharan, G. A Computational Study on Novel Runner Extension Designs via 3D Sand-Printing to Improve Casting Performance. In Proceedings of the MSEC2021, Online, 21–25 June 2021. [Google Scholar] [CrossRef]
- Deng, C.; Kang, J.; Shangguan, H.; Hu, Y.; Huang, T.; Liu, Z. Effects of Hollow Structures in Sand Mold Manufactured Using 3D Printing Technology. J. Mater. Process. Technol. 2018, 255, 516–523. [Google Scholar] [CrossRef]
- Mitra, S.; Rodríguez de Castro, A.; El Mansori, M. On the Rapid Manufacturing Process of Functional 3D Printed Sand Molds. J. Manuf. Process. 2019, 42, 202–212. [Google Scholar] [CrossRef] [Green Version]
- Zhuang, Y.; Chen, W.; Jin, T.; Chen, B.; Zhang, H.; Zhang, W. A Review of Computer Vision-Based Structural Deformation Monitoring in Field Environments. Sensors 2022, 22, 3789. [Google Scholar] [CrossRef] [PubMed]
- Gao, H.L.; Shen, S.S.; Yun, Y. Fatigue Crack Length Real Time Measurement Method Based on Camera Automatically Tracking and Positioning. Appl. Mech. Mater. 2012, 130–134, 3111–3118. [Google Scholar] [CrossRef]
- Zhou, J.; Yu, J. Chisel Edge Wear Measurement of High-Speed Steel Twist Drills Based on Machine Vision. Comput. Ind. 2021, 128, 103436. [Google Scholar] [CrossRef]
- Teague, M.R. Image Analysis via the General Theory of Moments. Josa 1980, 70, 920–930. [Google Scholar] [CrossRef]
- Yuan, Y.; Ge, Z.; Su, X.; Guo, X.; Suo, T.; Liu, Y.; Yu, Q. Crack Length Measurement Using Convolutional Neural Networks and Image Processing. Sensors 2021, 21, 5894. [Google Scholar] [CrossRef] [PubMed]
- Xie, S.; Tu, Z. Holistically-Nested Edge Detection. In Proceedings of the IEEE International Conference on Computer Vision, Santiago, Chile, 7–13 December 2015; pp. 1395–1403. [Google Scholar]
- Badrinarayanan, V.; Kendall, A.; Cipolla, R. Segnet: A Deep Convolutional Encoder-Decoder Architecture for Image Segmentation. IEEE Trans. Pattern Anal. Mach. Intell. 2017, 39, 2481–2495. [Google Scholar] [CrossRef] [PubMed]
- Ronneberger, O.; Fischer, P.; Brox, T. U-Net: Convolutional Networks for Biomedical Image Segmentation. In Proceedings of the Medical Image Computing and Computer-Assisted Intervention—MICCAI 2015; Navab, N., Hornegger, J., Wells, W.M., Frangi, A.F., Eds.; Lecture Notes in Computer Science; Springer International Publishing: Cham, Switzerland, 2015; pp. 234–241. [Google Scholar] [CrossRef] [Green Version]
- Zhao, H.; Shi, J.; Qi, X.; Wang, X.; Jia, J. Pyramid Scene Parsing Network. In Proceedings of the IEEE Conference on Computer Vision and Pattern Recognition, Honolulu, HI, USA, 21–26 July 2017; pp. 2881–2890. [Google Scholar]
- Chen, L.C.; Papandreou, G.; Kokkinos, I.; Murphy, K.; Yuille, A.L. Deeplab: Semantic Image Segmentation with Deep Convolutional Nets, Atrous Convolution, and Fully Connected Crfs. IEEE Trans. Pattern Anal. Mach. Intell. 2017, 40, 834–848. [Google Scholar] [CrossRef] [PubMed] [Green Version]
- Kazemian, A.; Khoshnevis, B. Real-Time Extrusion Quality Monitoring Techniques for Construction 3D Printing. Constr. Build. Mater. 2021, 303, 124520. [Google Scholar] [CrossRef]
- Caggiano, A.; Zhang, J.; Alfieri, V.; Caiazzo, F.; Gao, R.; Teti, R. Machine Learning-Based Image Processing for on-Line Defect Recognition in Additive Manufacturing. CIRP Ann. 2019, 68, 451–454. [Google Scholar] [CrossRef]
- Zhang, B.; Ziegert, J.; Farahi, F.; Davies, A. In Situ Surface Topography of Laser Powder Bed Fusion Using Fringe Projection. Addit. Manuf. 2016, 12, 100–107. [Google Scholar] [CrossRef] [Green Version]
- Grasso, M.; Laguzza, V.; Semeraro, Q.; Colosimo, B.M. In-Process Monitoring of Selective Laser Melting: Spatial Detection of Defects Via Image Data Analysis. J. Manuf. Sci. Eng. 2016, 139, 051001. [Google Scholar] [CrossRef]
- Doubenskaia, M.A.; Zhirnov, I.V.; Teleshevskiy, V.I.; Bertrand, P.; Smurov, I.Y. Determination of True Temperature in Selective Laser Melting of Metal Powder Using Infrared Camera. Mater. Sci. Forum 2015, 834, 93–102. [Google Scholar] [CrossRef]
- Neubeck, A.; Van Gool, L. Efficient Non-Maximum Suppression. In Proceedings of the 18th International Conference on Pattern Recognition (ICPR’06), Hong Kong, China, 20–24 August 2006; Volume 3, pp. 850–855. [Google Scholar] [CrossRef]
Figure 1.
The system workflow comprises a training procedure and real-time monitoring. (A) training procedure, (B) real-time monitoring.
Figure 1.
The system workflow comprises a training procedure and real-time monitoring. (A) training procedure, (B) real-time monitoring.

Figure 2.
Image acquisition device and examples; (a) The camera is mounted above the entire forming region, and the image is captured after printing every layer; (b) The image captured by the camera excludes portions unrelated to the forming zone; (c) The magnified image of the marked region in (b) and the forming plane paved with molding sand revealing light and dark interwoven picture texture; (d) The image of the formed area after the brightness of the image has been averaged; (e) The artificially marked ground truth image for the outline of the binder-sprayed areas.

Figure 3.
Images depicting the outcomes of applying several edge extraction operators. The second row of images are magnified images of contents inside the white boxes in first-row images.
Figure 3.
Images depicting the outcomes of applying several edge extraction operators. The second row of images are magnified images of contents inside the white boxes in first-row images.

Figure 4.
The schematic diagram for the model’s structure. Bypass outputs make up a 5-channel image as indicated by the colors.
Figure 4.
The schematic diagram for the model’s structure. Bypass outputs make up a 5-channel image as indicated by the colors.

Figure 5.
Diagram of the NMS algorithm in the gradient direction.

Figure 6.
Analytical calculation diagram for a single layer.

Figure 7.
P-R curve for various suppression radii of NMS.

Figure 8.
Specimens of edge refinement outcomes with varying suppression radius N.

Figure 9.
Edge extraction results for various sections graphics. (a–c) are the folding of printed images and extracted edges at different layers. The red points in the images are the extracted edges.
Figure 9.
Edge extraction results for various sections graphics. (a–c) are the folding of printed images and extracted edges at different layers. The red points in the images are the extracted edges.

Figure 10.
Printed samples and edge extraction results: (a) Specimen used to validate the accuracy of computer vision models; (b) The sand bed image captured during processing; (c) The edge extracted by the algorithm corresponds to the read edge.
Figure 10.
Printed samples and edge extraction results: (a) Specimen used to validate the accuracy of computer vision models; (b) The sand bed image captured during processing; (c) The edge extracted by the algorithm corresponds to the read edge.

Figure 11.
(a) Actual size and measurements of various design sizes; (b) The error between measurements and actual ones for various design sizes; (c) The standard deviation of a detected straight line for various design sizes; (d) The error and standard deviation of measurements for images in the test dataset.

Disclaimer/Publisher’s Note: The statements, opinions and data contained in all publications are solely those of the individual author(s) and contributor(s) and not of MDPI and/or the editor(s). MDPI and/or the editor(s) disclaim responsibility for any injury to people or property resulting from any ideas, methods, instructions or products referred to in the content. |
© 2023 by the authors. Licensee MDPI, Basel, Switzerland. This article is an open access article distributed under the terms and conditions of the Creative Commons Attribution (CC BY) license (https://creativecommons.org/licenses/by/4.0/).
Share and Cite
MDPI and ACS Style
Guo, S.; Li, S.; Wang, L.; Cao, H.; Xiang, D.; Dong, X. Computer Vision Method for In Situ Measuring Forming Accuracy of 3D Sand Mold Printing. Machines 2023, 11, 330. https://0-doi-org.brum.beds.ac.uk/10.3390/machines11030330
AMA Style
Guo S, Li S, Wang L, Cao H, Xiang D, Dong X. Computer Vision Method for In Situ Measuring Forming Accuracy of 3D Sand Mold Printing. Machines. 2023; 11(3):330. https://0-doi-org.brum.beds.ac.uk/10.3390/machines11030330
Chicago/Turabian StyleGuo, Shuren, Shang Li, Lanxiu Wang, Huatang Cao, Dong Xiang, and Xuanpu Dong. 2023. "Computer Vision Method for In Situ Measuring Forming Accuracy of 3D Sand Mold Printing" Machines 11, no. 3: 330. https://0-doi-org.brum.beds.ac.uk/10.3390/machines11030330
Note that from the first issue of 2016, this journal uses article numbers instead of page numbers. See further details here.