1. Introduction
Wire and arc additive manufacturing (WAAM) is one of the most popular direct energy deposition (DED) methods [
1,
2]. The WAAM technique for manufacturing metallic components, as its name suggests, implements the use of a combination of a tubular welding wire (solid or cored) and an electric arc as the heat source. The primary advantage of this method compared to other DED techniques, such as laser-based ones, is the high material input in the structure of the component to be built, thus the high deposition speed [
3,
4]. This defines the potential of this method for manufacturing large components to be used in automotive, aircraft, shipbuilding, and various other industries. Due to the high energy input of the electric arc and the substantial electromagnetic forces that affect the weld bead, the formed layer has an irregular shape. This results in a worsening of the manufacturing accuracy of the metallic components, meaning that manufacturing small-sized components with intricate designs is an incredibly difficult (sometimes impossible) task. The low accuracy of deposition is the main disadvantage of arc-based additive manufacturing technologies [
5], along with the formation of pores during the layer deposition process [
6].
The highly sought-after materials used for industrial applications are aluminum and its alloys [
7]. Al5356, in particular, is a vastly studied material. Previous researchers have shown the possibility of building Al5356 components using the cold metal transfer (CMT) operating mode [
8]. This mode is characterized by a very low heat input, which improves the physical and mechanical properties of the deposited component and allows better controllability in the layer deposition process. In their studies, researchers have shown the expected morphology, structure, and mechanical properties of CMT-built Al5356 components as a function of the different technological conditions of layer deposition. Su et al. [
9], for example, studied the effect of the heat input on the microstructure and mechanical properties of Al5356 WAAM-CMT build components. They achieved this by varying the wire feeding rate and the welding speed and report that, in all cases, a high concentration of pores and cracks were observed in the structure of the specimens, particularly in the zone between the different layers. They report a decrease in the micro-volumes (a refinement of the aluminum particles) by increasing the deposition (welding) speed. In all cases, however, the resultant mechanical properties are in the range of 70–76 HV in terms of microhardness, and 250–260 MPa in terms of the ultimate tensile strength (UTS). Geng et al. [
10] also studied the possibility of manufacturing Al5356 components and reported obtaining specimens with similar mechanical properties. Valkov et al. [
11] produced an Al5356 specimen with superb mechanical properties and suggested that the crystal structure of the specimen was uniform with no significant change in the preferred crystallographic orientation (texture) as a function of the height of the component. Köhler et al. [
12] studied the evolution of the thermal gradients with the increase in the height of the specimens and reported the accumulation of heat within the structure of the specimens, which resulted in an increase in the interpass temperature. Additionally, they have studied the morphology of the specimens as a function of the wait time between the layers and reported that the increase in the wait time leads to a worsening of the accuracy of deposition. Derekar et al. [
13] reported that varying the interpass temperature can lead to some variation in the porosity and tensile strength of Al5356 WAAM-produced components.
Finding the optimal technological conditions is the main priority of all experimental work, which can be very difficult in the case of WAAM due to the different responses of the manufactured components to the heat input during the welding process. The increase in the size of the metallic component leads to an increase in the interpass temperature. This affects the process, not only by physically changing the characteristics of the specimen, but also by changing its structure and mechanical properties. Taking all of these factors into account, the most cost-effective method of WAAM deposition of components is the unification of the technological conditions of layer deposition so that depositing different sized and shaped components is possible without changing the preset work program. In order to achieve this, the influence of the size of the produced components on the resultant microstructure and mechanical properties needs to be extensively studied. The cold arc pulse (CAP) method used in this work differs from the cold metal transfer one in the technique used for the implementation of the weld bead into the structure of the specimen. The cold metal transfer mode uses a mechanical approach for the detachment of the weld bead formed during the welding process. Once a short circuit occurs, using a special wire feeding system, the welding wire is retracted back into the torch, which detaches the bead from the welding electrode and introduces it into the secondary electrode (the substrate) [
14]. The cold arc pulse method is generally known for having a higher heat input compared to CMT, which further hinders finding the optimal technological conditions of layer deposition in order to achieve uniformity in the formed specimens regardless of their physical attributes. During the cold arc pulse welding regime, a number of forces affect the formed weld bead, which have both an electromagnetic and a more strictly mechanical character. The surface tension of the material, the applied protective gas flow, and the gravitational forces all attempt to elongate and detach the weld bead from the electrode. Due to the high heat input of the arc welding process, a certain amount of the welded material is vaporized, which, in the case of aluminum, is particularly easy to achieve. This creates the so-called reactive force, which also affects the weld bead by trying to elongate it. The primary electromagnetic forces that affect the weld bead can be explained by the so-called pinching effect, which is used in the cold arc pulse mode to detach the bead from the primary electrode. During the welding process, an electromagnetic force is observed influencing the shape and size of the weld bead in both the axial and radial directions. They are both influenced by the permeability of the material, and the square root of the welding current. In the cold arc pulse mode, a short pulse higher than the welding current is sent to the electrodes, which results in the rapid “pinching” of the bead and its detaching from the welding wire. Due to the short current bursts and the slightly worse controllability of the welding bead, the cold arc pulse mode is known to have a higher heat input compared to the CMT mode.
A key question from a practical point of view is, therefore, to what extent the assessment of the WAAM process parameters on a small test specimen can be assumed to be valid for larger-scale components and ones with different geometries. This is particularly important when considering the geometry-related change in the interpass temperature. Since the effect of the physical size (volume) of WAAM build components, i.e., the transferability of the approved process with regard to the geometry-related variation in the thermal conditions, is not well studied, this research hopes to provide some insight on the matter. Furthermore, the cold arc pulse mode is not a very well-studied method for wire and arc additive manufacturing. This is why, in this work, the influence of the size of WAAM build Al5356 components in the cold arc pulse mode was studied, with special emphasis on practical applications and the relationship between the dimensions of the specimens and their structural and mechanical properties was established.
2. Materials and Methods
In order to study the effect of the size of Al5356 (AlMg5Cr) specimens on their structure, two specimens were built to lengths of 200 mm and 400 mm, which, for ease of future reference in this study, will be denoted as specimen A and specimen B, respectively. All experiments were performed using a KUKA KR15 robotic system combined with an EWM Alpha Q 552 Pulse MM RC welding unit. In order to exclude the influence on the structure of any other factors, identical technological conditions of build-up were used. The arc voltage was 18.3 V and the arc current was 88 A. A welding wire with a diameter of 1.2 mm was used. The wire feeding speed was 100 mm/s and the welding speed was 12 mm/s. This means that, in both cases, the heat input calculated using the heat input formula for MIG/MAG welding presented in [
15] was 105 J/mm. In the present study, the metal inert gas (MIG) welding process was employed using Ar as a protective gas with a 99.999% purity. A constant flow of 18 l/min was used in all cases. The offset of the welding torch in the direction of build-up was 1.0 mm per layer. The distance between the electrodes was kept at 10 mm at all times. Previous test experiments with the same technological conditions of layer deposition indicated that, using that setup, the thickness of each subsequent layer is about 0.96 mm, thus a 1.00 mm offset is adequate to keep the electrode distance the same (or within an acceptable range). In all cases, the wait time between the layers was 30 s. The manufactured specimens are shown in
Figure 1. Specimen A is presented in
Figure 1a, and specimen B is presented in
Figure 1b. In the present study, the ambient temperature was equal to RT and no extra cooling of the substrate was applied.
In order to study the manufactured specimens in detail, metallographic samples of different sections of the specimens were prepared. A scheme of the samples’ locations in the structure of the specimens is shown in
Figure 2a,b, corresponding to specimens A and B. The samples corresponding to specimen A are denoted as A-1, A-2, and A-3 starting from the bottom towards the highest section of the ovals. Similarly, the samples corresponding to specimen B were denoted as B-1, B-2, and B-3. All samples correspond to the face-side of the specimens. The prepared samples were mechanically treated using abrasive paper of the following types—P250, P400, P600, P800, P1000, and P2000. All samples were ground for 10 min at each stage. Subsequently, the samples were polished using a diamond polishing agent. The surface of the samples was treated with a 10% HF acid solution.
The phase composition of the built components at the different stages of the manufacturing process was studied using X-ray diffraction (XRD) experiments with a 1.54 Ǻ wavelength of the CuKα radiation. All of the experiments were carried out using a symmetrical Bragg–Brentano mode in the range of 20–80 degrees. The detected phases were identified using the International Centre for Diffraction Data (ICDD) database by comparing the results to those of the database for Al (PDF #040787).
The microstructure of the manufactured specimens was further observed using scanning electron microscopy (SEM) using back-scattered electrons (BSE). The chemical composition of the studied samples was determined by energy dispersive X-ray spectroscopy (EDX).
Microhardness experiments were also performed during the experimental stage on a ZwickRoell Dura Scan 10/20 G5 microhardness tester unit at a constant load of 1 N. The experiments were performed in agreement with the ISO 6507-1 standard [
16]. The distance between each measurement was kept, in all cases, larger than three times the diameter of the previous measurement point (3d). This guaranteed the accuracy of the measurements.
The tensile properties of the specimens in a vertical and horizontal orientation of build-up were studied using a ZwickRoell Vibrophone 100 in the static strain mode. All measurements were performed in accordance with the ISO 6892-1 standard [
17]. The location of the samples in the specimens is shown in
Figure 2a,b and the dimensions of the tensile test probes are shown in
Figure 2c. The length of the entire sample is 100 mm but the actual test area has a length of 47.5 mm. The width of the test area is 12.5 mm and the thickness of each sample is 5 mm. This means that the test area has a cross-sectional area of 62.5 mm
2.
3. Results
The X-ray diffraction patterns of both specimens are shown in
Figure 3a,b, where the first corresponds to specimen A, and the second to specimen B. In both cases, a polycrystalline structure was observed, confirmed by the absence of amorphous-like halos. All detected peaks correlate to a face-centered cubic (fcc) structure characteristic of aluminum samples [
18]. Both specimen A and specimen B have a highly textured structure at all stages of build-up with diffraction maxima corresponding to (111), (200), (220), and (311) crystallographic planes, which belong to the {111}, {100}, {110}, and {311} families of crystallographic planes, respectively. No significant change in the texture of the samples was observed as a function of the build-up stage or the size of the components. In addition, all detected peaks have a narrow width indicating the presence of low internal defects within the crystal lattice of the aluminum phase. Similar results were observed in previous studies [
11], where no preferred crystallographic orientation was detected and the diffraction maxima had a narrow width corresponding to a low concentration of crystal defects. In addition, in that work, an Al
2O
3 phase was detected on the surface of the substrates. This was caused by defects in the sample preparation procedure, which were avoided in the present study. Su et al. [
9] have also studied diffractograms obtained for Al5356 samples. Most likely due to the multi-pass approach, they managed to detect peaks corresponding to the Al
3Mg
2 intermetallic phase in the range of 25–35° at the 2θ scale. In the present work, however, even if small contents of the Al
3Mg
2 phase are present in the structure of the samples, this is not enough to be detected by the diffractometer.
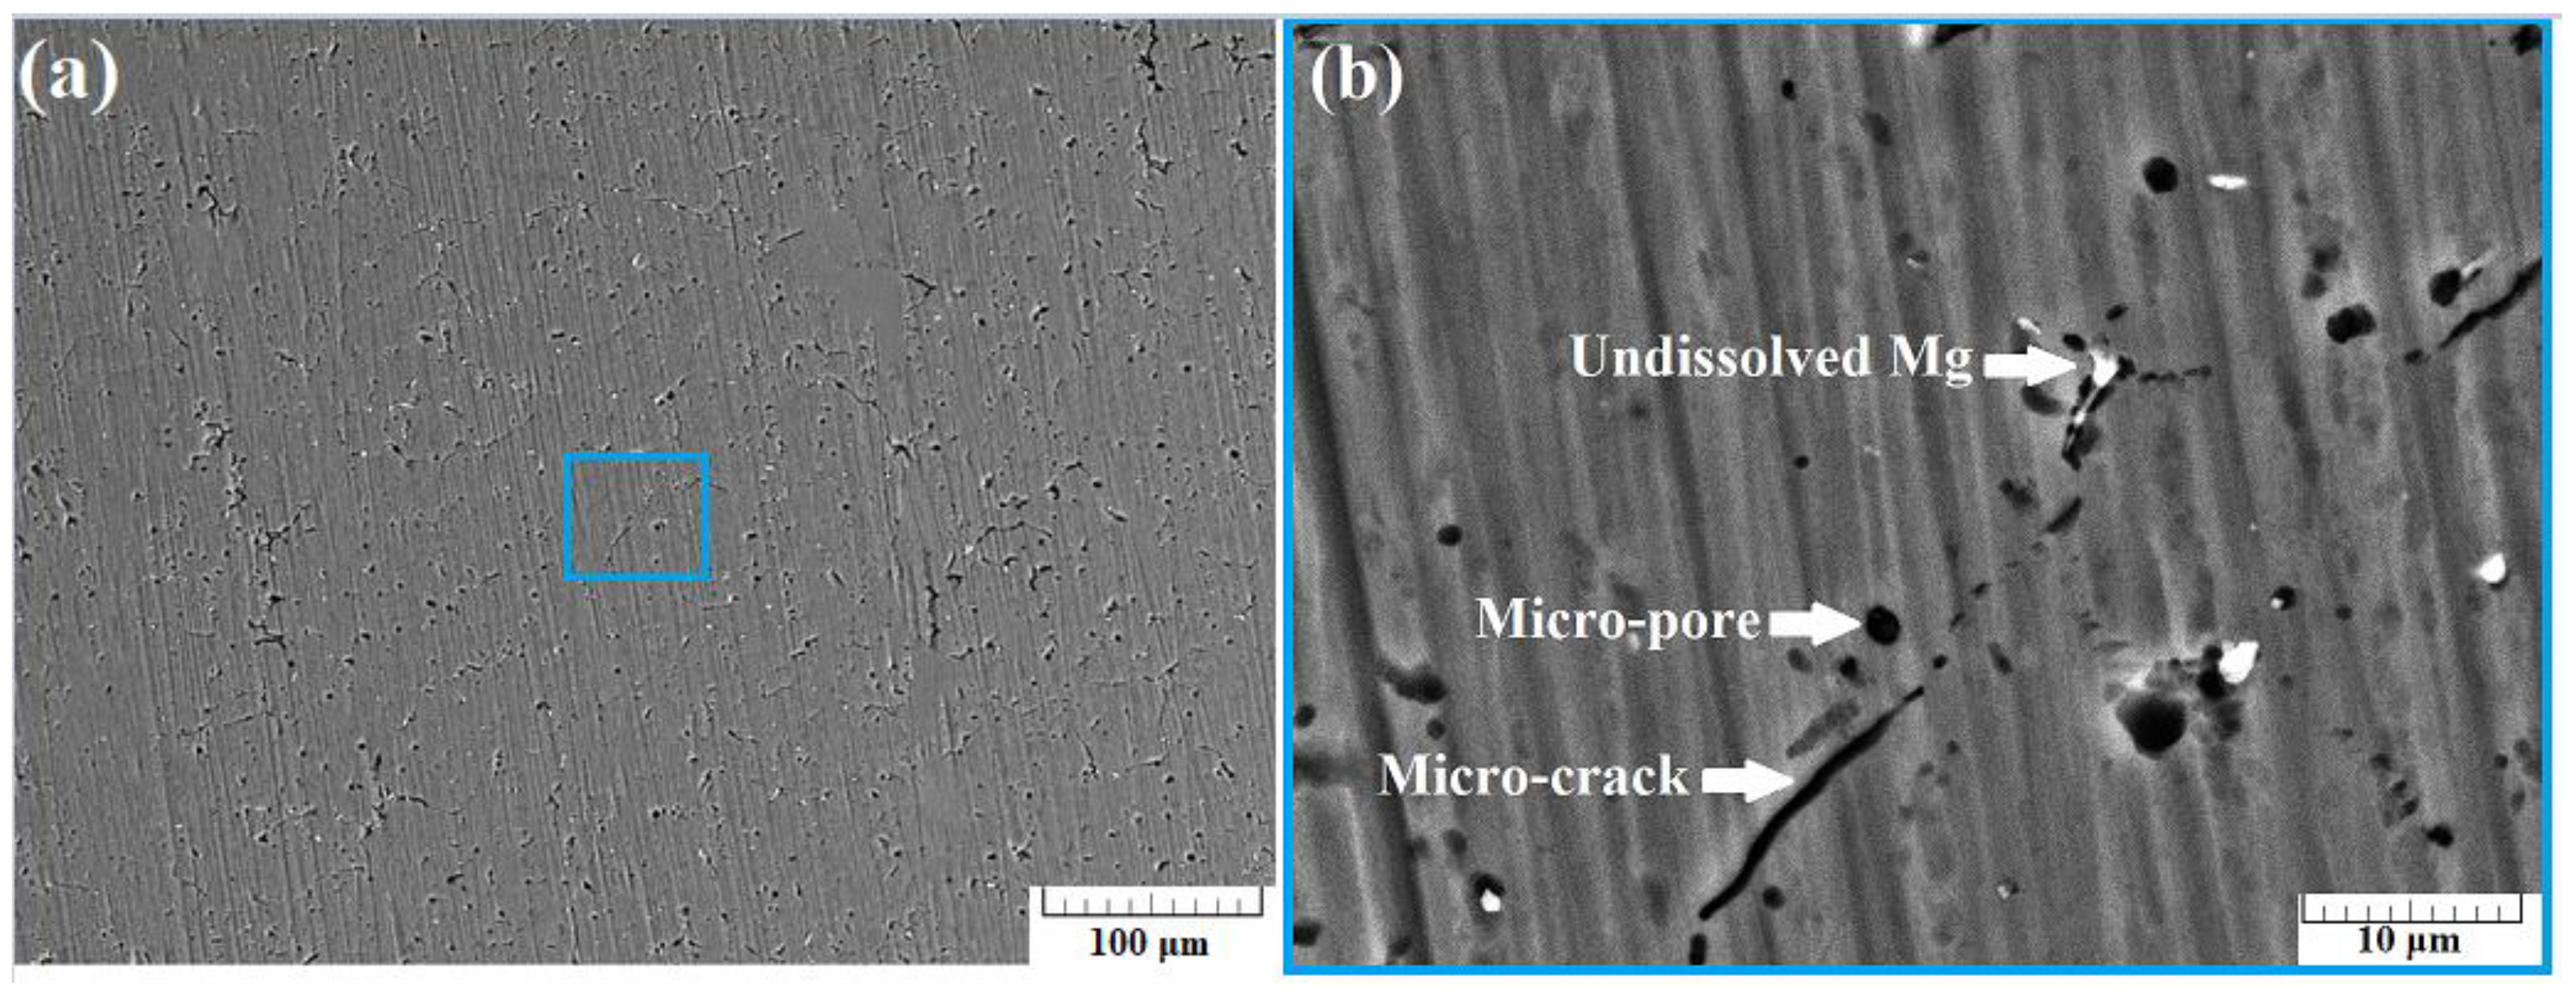
Figure 4a presents a SEM image of the surface of sample A-1 taken using back-scattered electrons (BSE) at a 500× zoom. In the image, two micro-cracks with a length of about 70 µm were observed. Increasing the zoom to 5000× results in obtaining the image presented in
Figure 4b. Some quantity of micro-pores was observed in the structure of the specimen, along with some undissolved Mg particles.
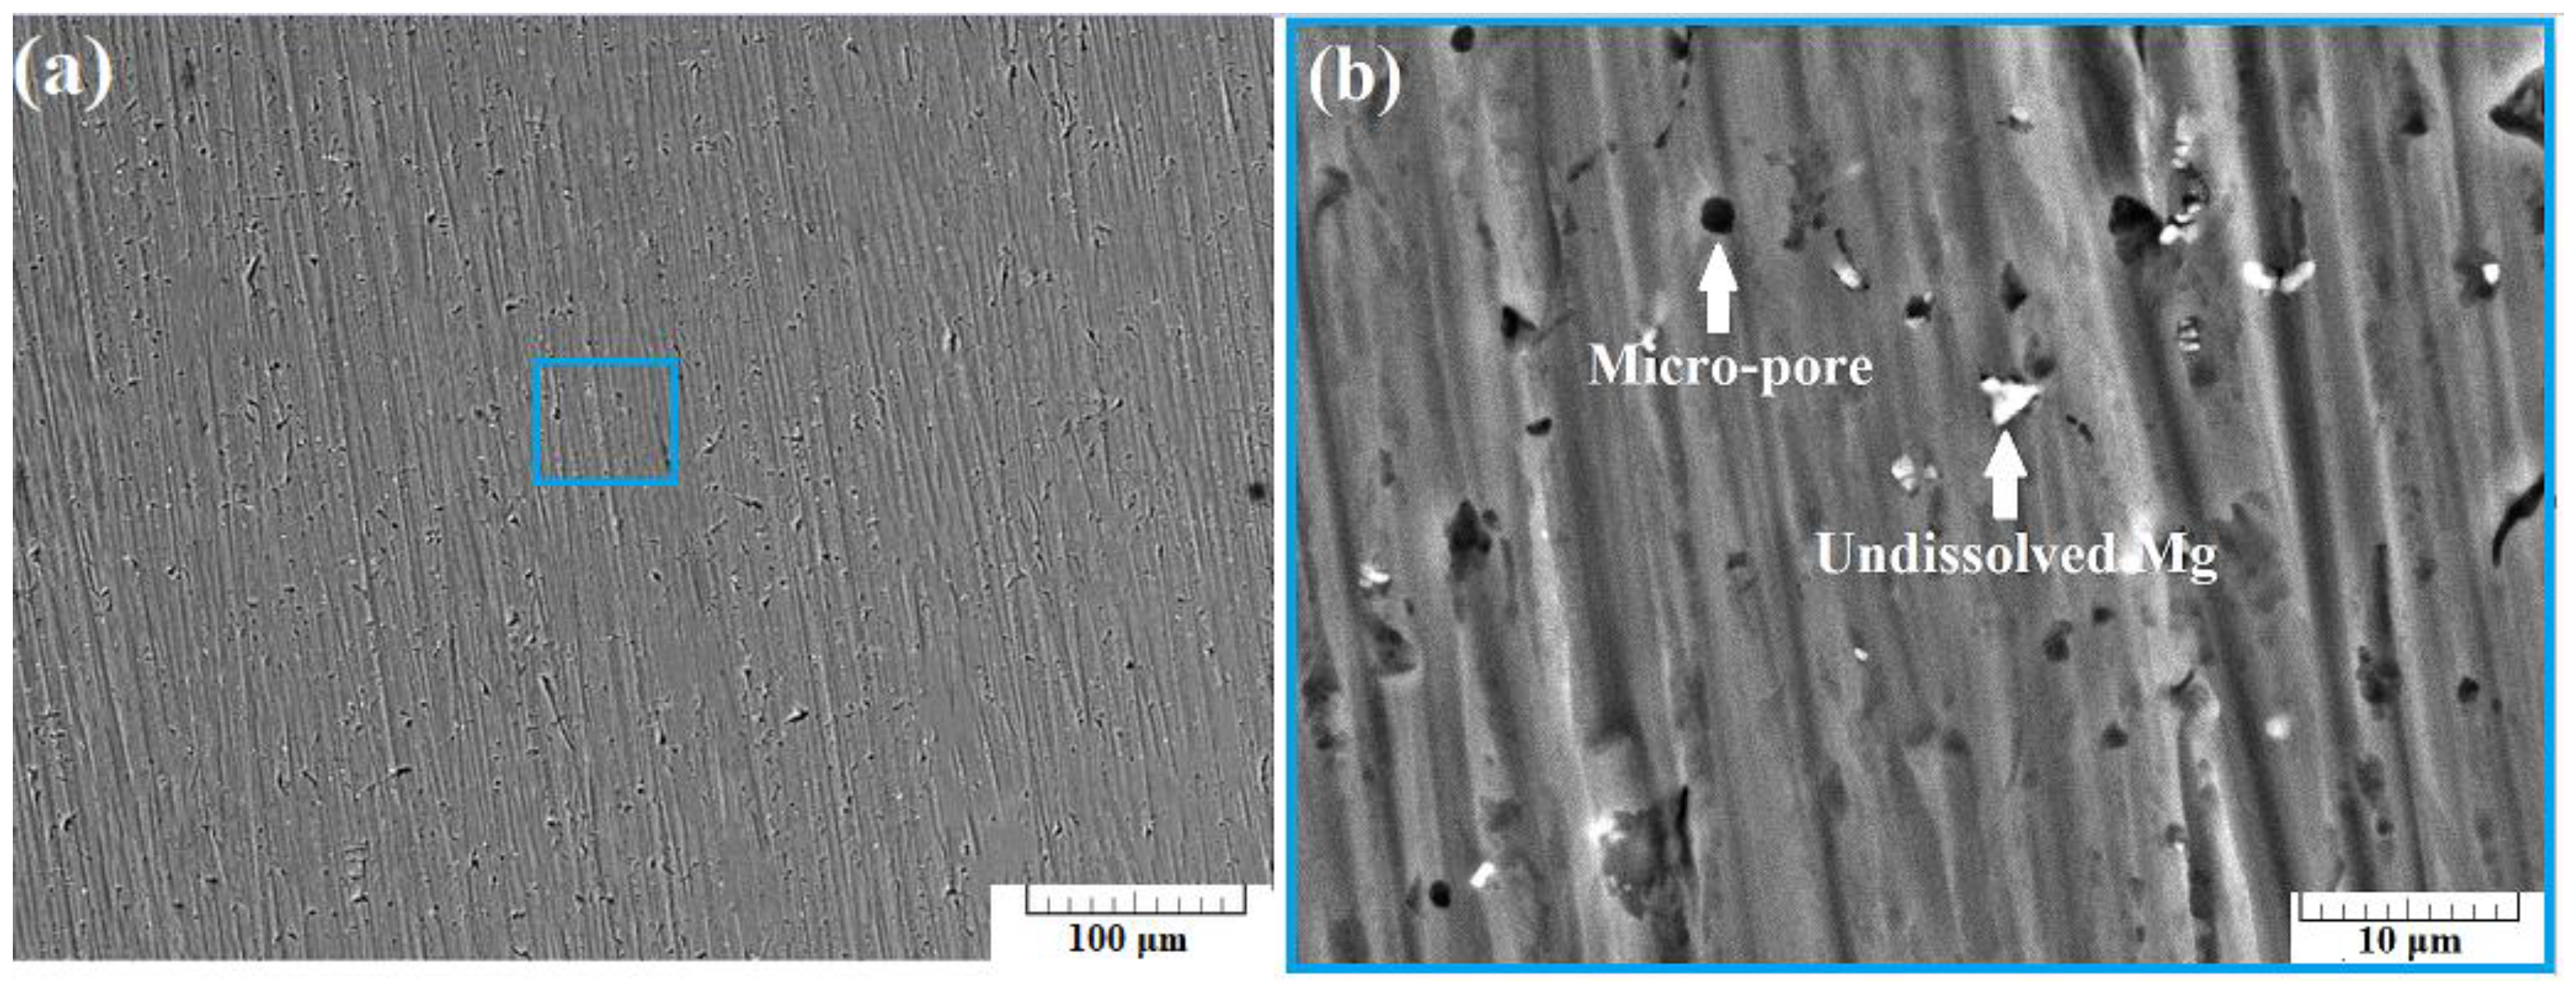
Figure 5a presents a SEM image of the surface of sample A-2 taken using back-scattered electrons (BSE) at a 500× zoom. In the image, no cracks were observed. Increasing the zoom to 5000× results in obtaining the image presented in
Figure 5b. Some quantity of micro-pores was observed in the structure of the specimen, along with some undissolved Mg particles. A large undissolved Si particle was also observed.
Figure 6a presents a SEM image of the surface of sample A-3 taken using back-scattered electrons (BSE) at a 500× zoom. In the image, some small cracks were observed with an approximate length of 30 µm. Increasing the zoom to 5000× results in obtaining the image presented in
Figure 6b. Some quantity of micro-pores was observed in the structure of the specimen. In this case, a number of undissolved Mg particles was also detected, as with the previous cases.
Figure 7a presents a SEM image of the surface of sample B-1 taken using back-scattered electrons (BSE) at a 500× zoom. In this instance, no substantial cracks were observed. Increasing the zoom to 5000× results in obtaining the image presented in
Figure 6b. Some micro-pores were observed in the structure of the specimen. A number of undissolved Mg particles were also detected.
Figure 8a presents a SEM image of the surface of sample B-2 taken using back-scattered electrons (BSE) at a 500× zoom. A few micro-cracks were observed, with their average length being about 10 µm. Furthermore, some undissolved Mg particles were also noticed.
Figure 9a presents a SEM image of the surface of sample B-3 taken using back-scattered electrons (BSE) at a 500× zoom. Micro-sized pores with an irregular shape distributed across the surface of the sample were observed. Once again, undissolved Mg particles were also noticed.
Figure 10,
Figure 11 and
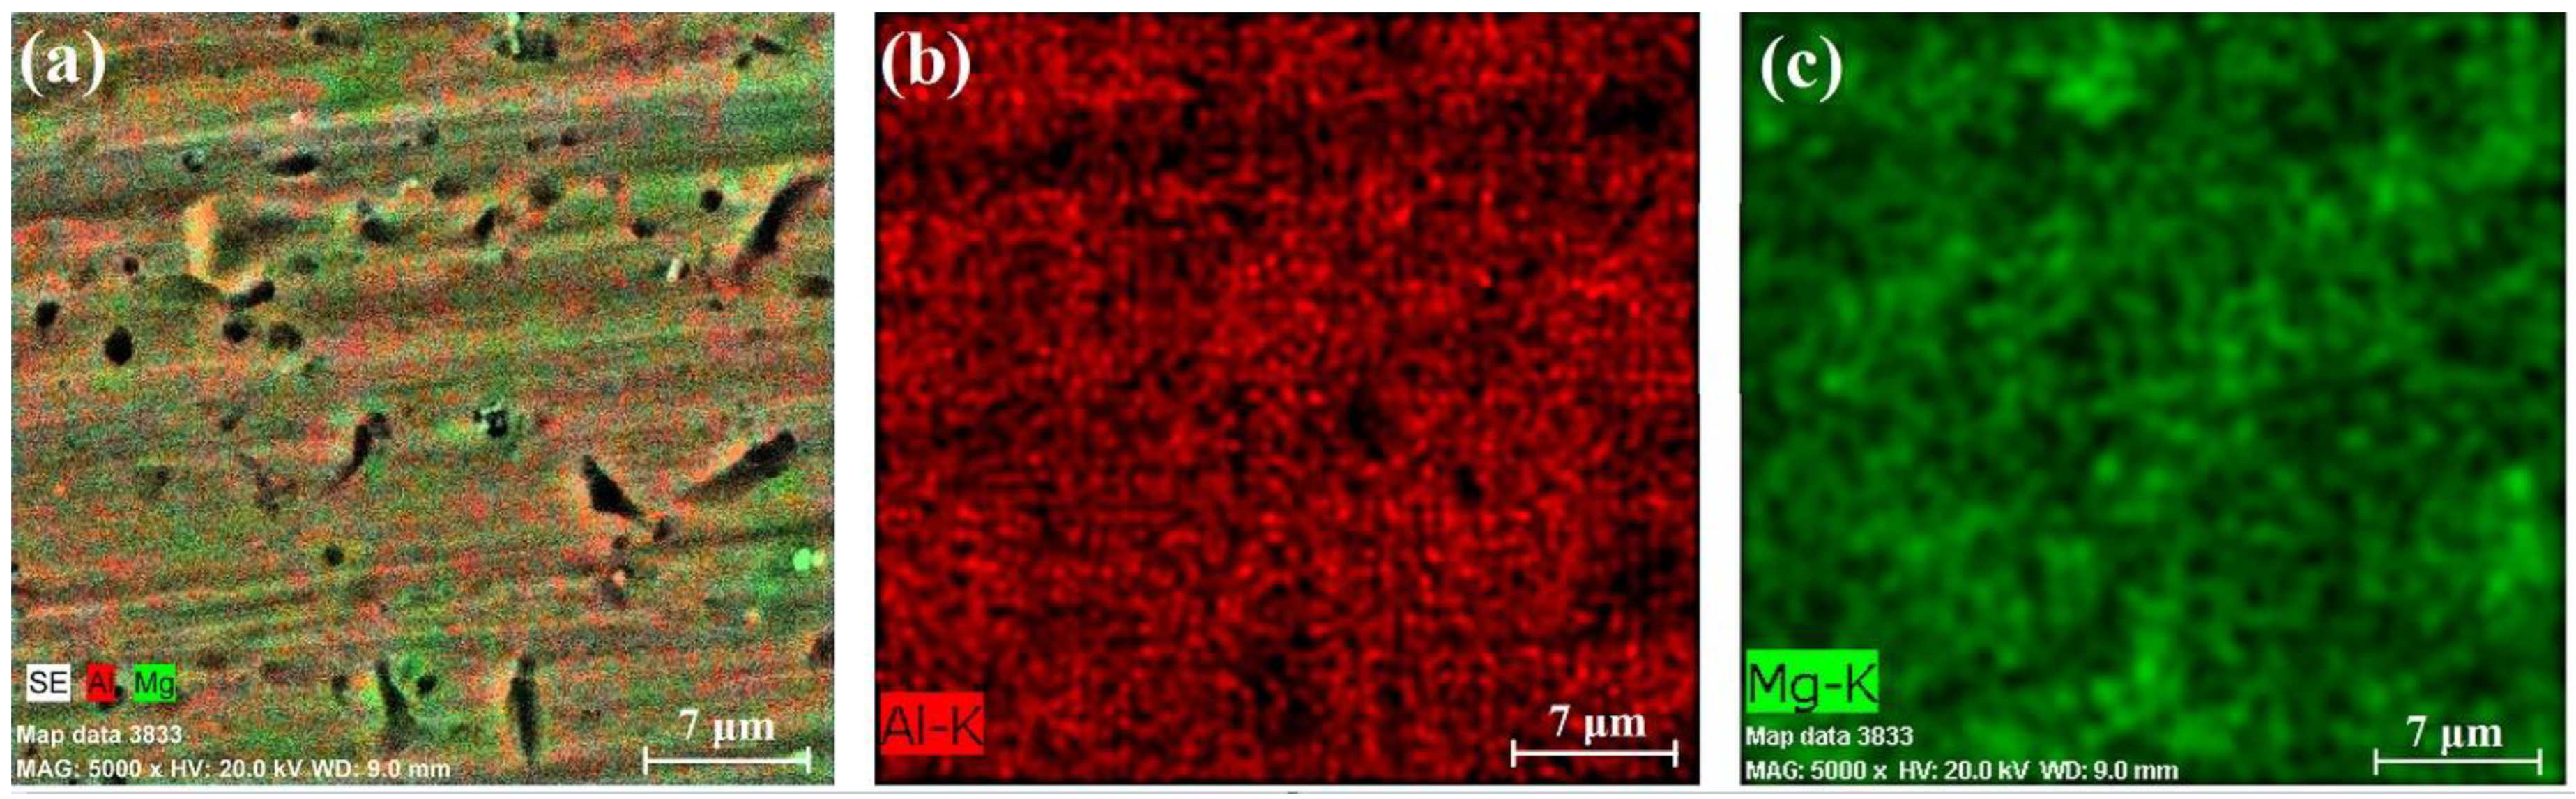
Figure 12 present the results of the performed EDX experiments concerning specimen A. In all cases, irregularly shaped micro-pores were observed caused predominantly by the thermal expansion and shrinkage of the primary αAl grains. In the case of sample A-1, the Mg concentration within the structure of the sample is 5.14 wt%; in the case of the A-2 sample, the concentration of Mg is 4.82 wt%; and in the case of sample A-3, it is 5.17 wt%.
Figure 13,
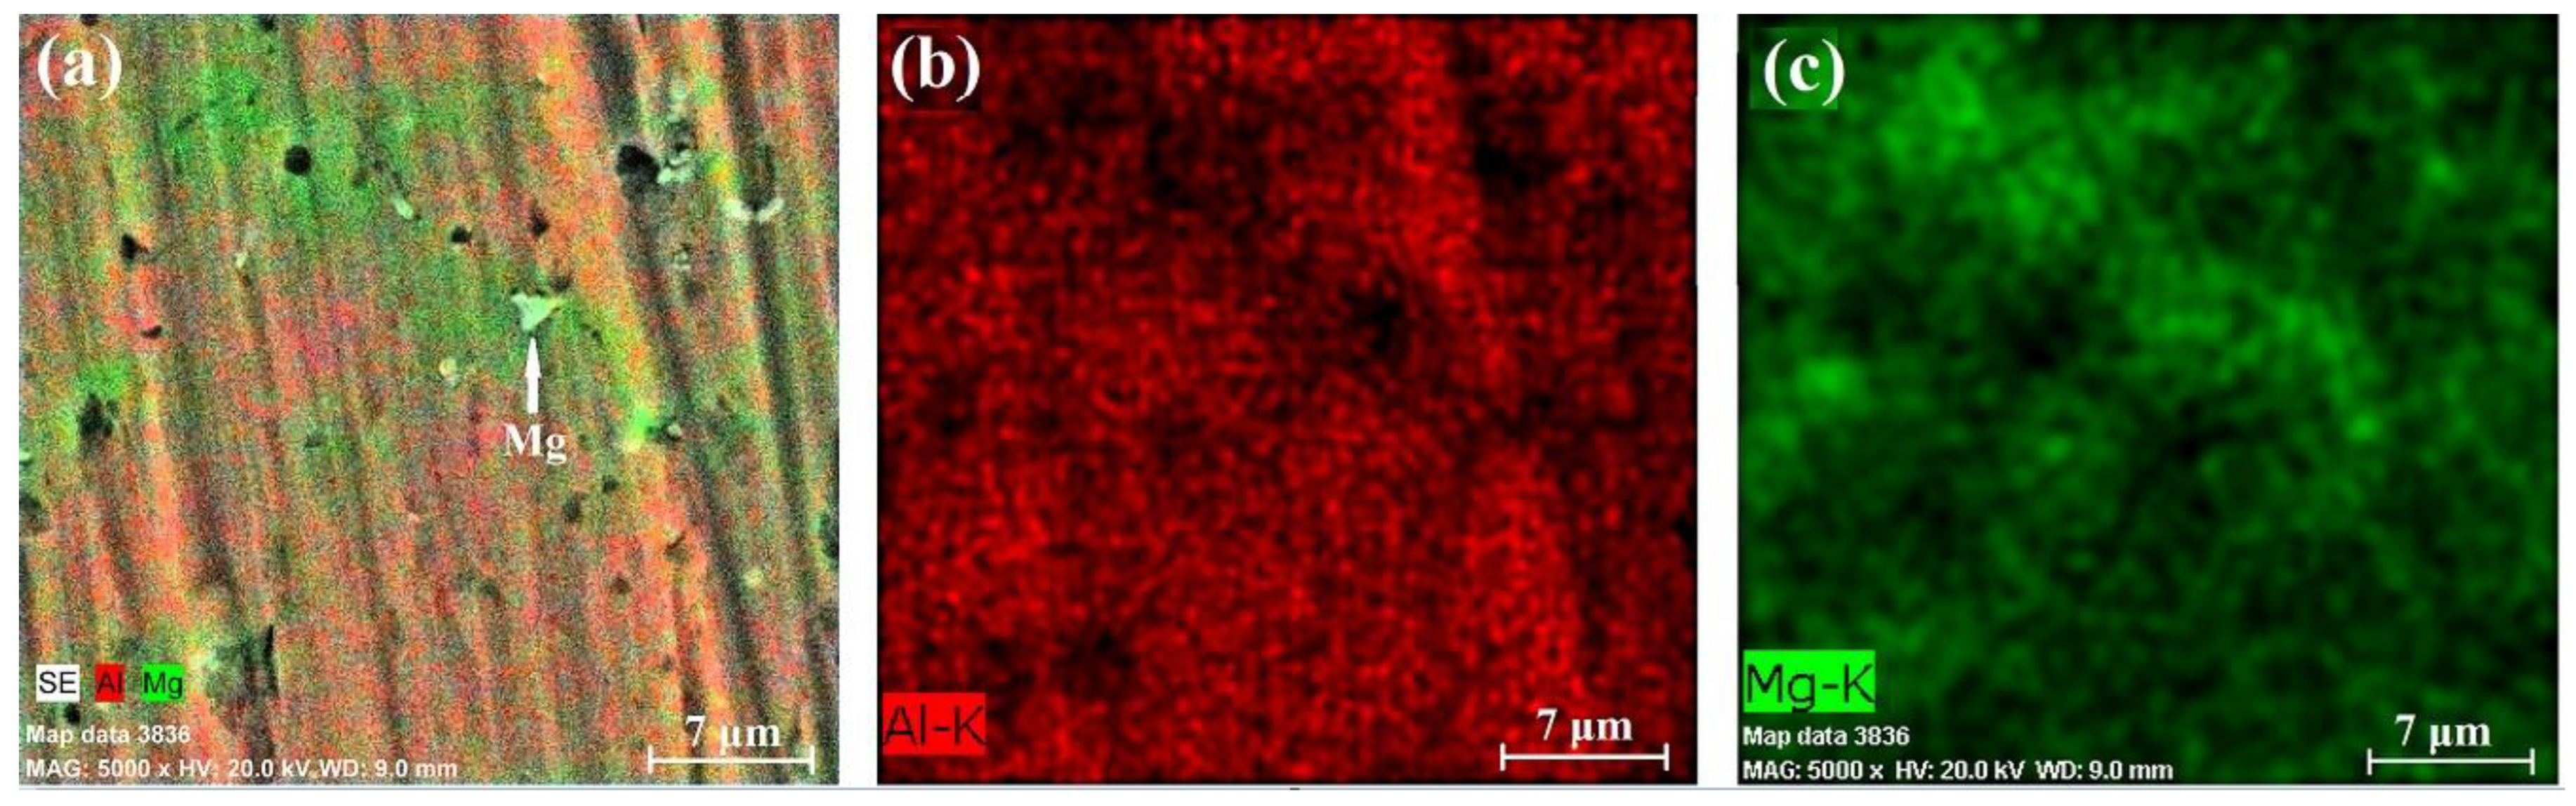
Figure 14 and
Figure 15 show the results of the performed EDX experiments where sample B was studied. The concentration of the Mg within the structure of the different samples is as follows: B-1—5.36 wt%, B-2—6.15 wt%, and B-3—5.89 wt%. Evidently, in the case of specimen A, the lowest concentration of the Mg particles dissolved within the structure of the specimen resides in its middle section. The exact opposite tendency is observed considering specimen B. Furthermore, the concentration of Mg is higher in all cases in the case of the larger specimen B, compared to the smaller specimen A. Within the structure of sample A-2, a large solid Si particle was observed as well. In all considered cases, most of the Mg particles reside close to the borders of the aluminum grains in the αAl solid solution.
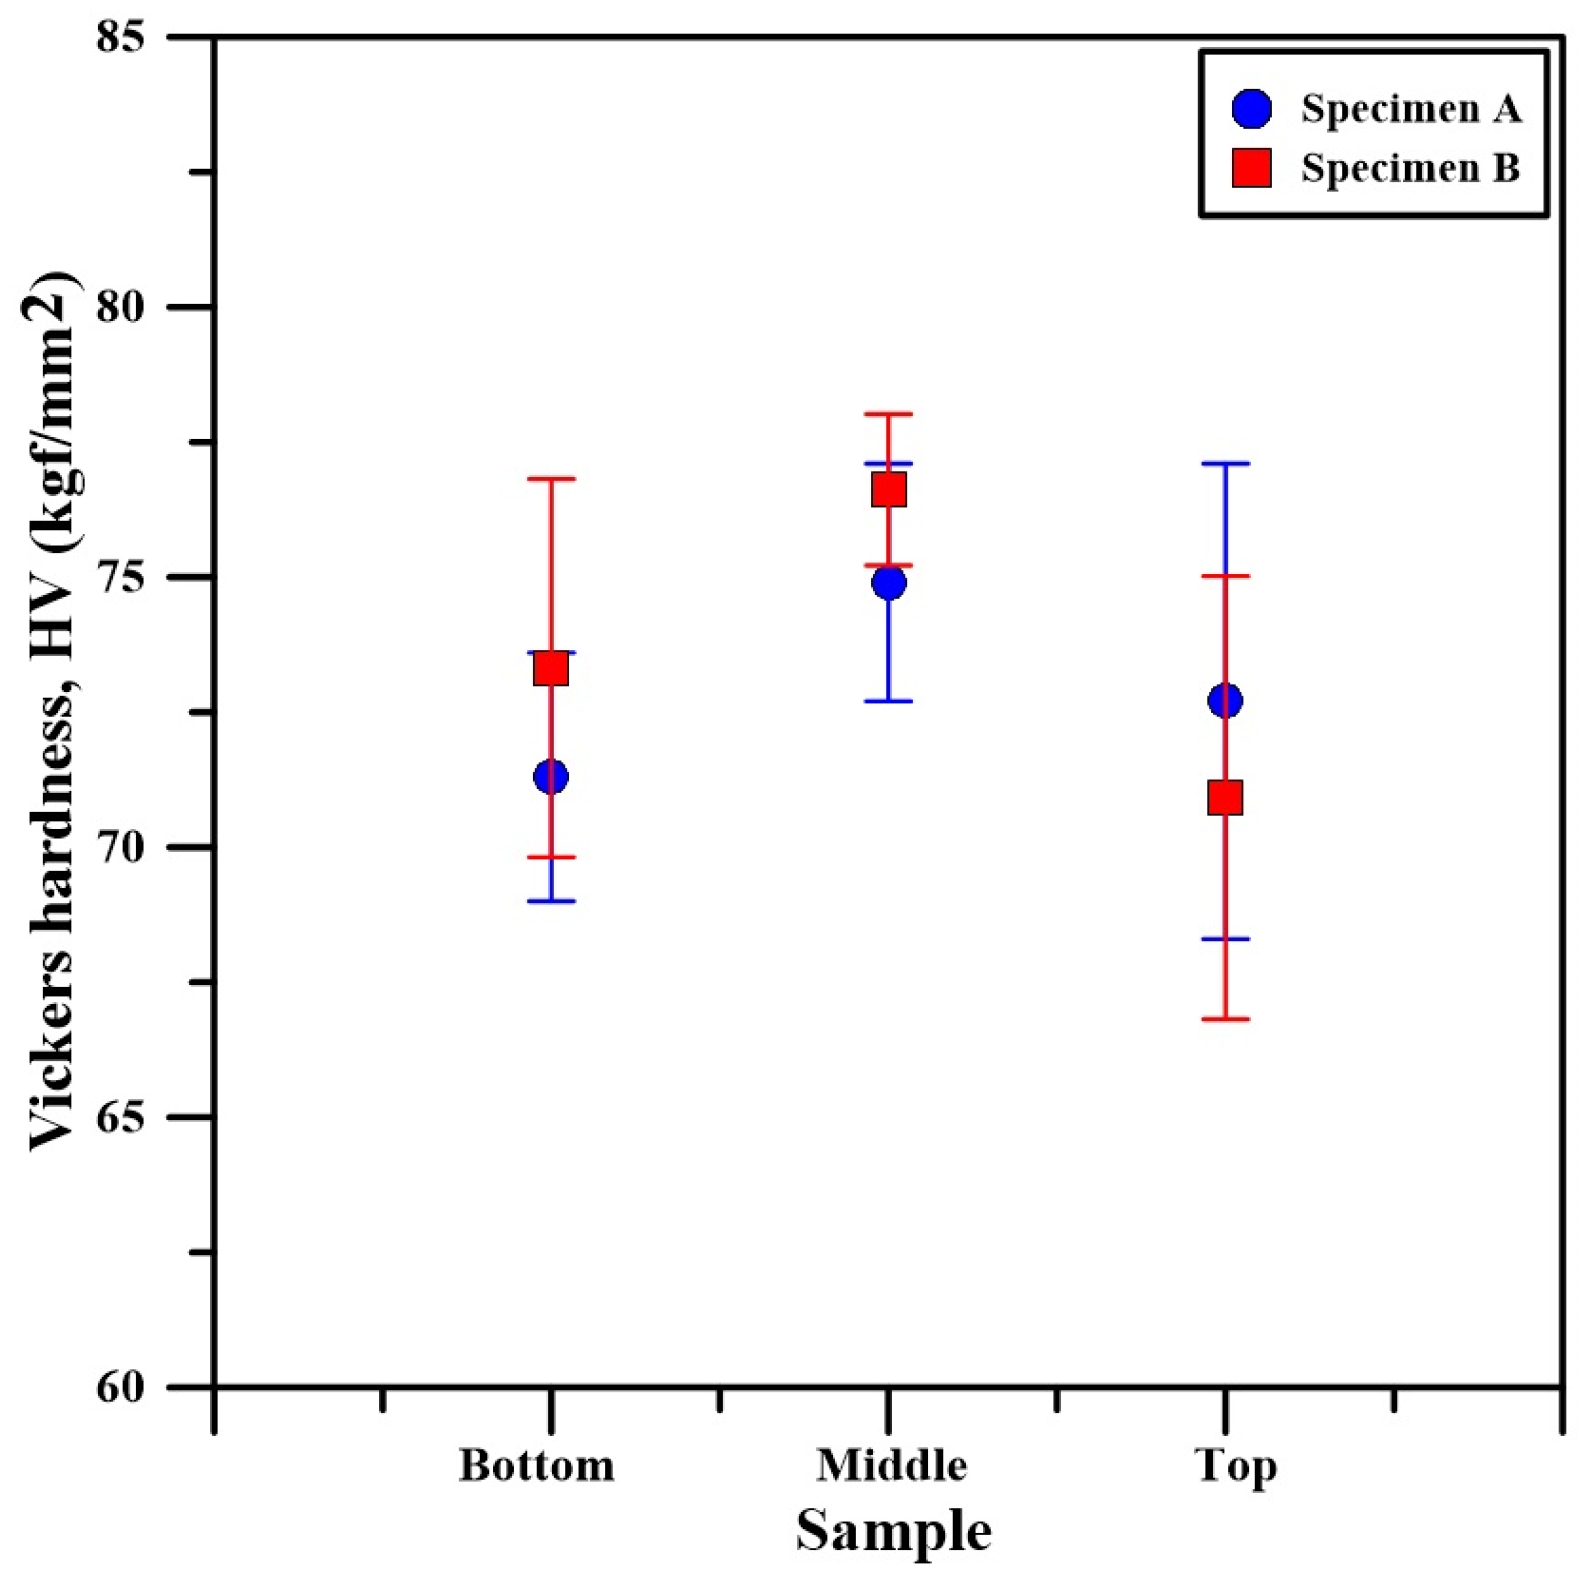
The microhardness results of both specimens is shown in
Figure 16. The microhardness of specimen A at the bottom, middle, and top sections is 71.3 ± 2.3 HV
0.1, 74.9 ± 2.2 HV
0.1, and 72.7 ± 4.4 HV
0.1, respectively. In comparison, the microhardness at the bottom of specimen B is 73.3 ± 3.5 HV
0.1, at the middle section is 76.6 ± 1.4 HV
0.1, and at the top section it is 70.9 ± 4.1 HV
0.1. According to the obtained data, both specimens exhibit the same tendency where the microhardness is the highest in the section of the specimens corresponding to the middle of the deposition process. All microhardness values are nearly identical and within the margin of error of each other. Due to this, it is possible to conclude that the slight increase in the microhardness in the middle could be a result of the statistical variation in the microhardness during the measuring process. The average microhardness of both specimens can be summarized and the results indicate an average value along their entire cross-section of 74 ± 3 HV
0.1. Wang et al. [
19] have studied the microstructure and mechanical properties of a WAAM-CMT built specimen using an Al5356 welding wire. They also reported an average microhardness of the specimen of 73.9 HV. In comparison, Li et al. [
20] have studied the influence of the shielding gas on the resultant microstructure and mechanical properties. According to their research, the application of an N
2 shielding gas results in the refining of the aluminum crystals. This leads to an increase in the average microhardness of the specimens; however, their experiments with an Ar shielding gas indicate a specimen microhardness of 75.1 HV. Evidently, the results of this work are in complete agreement with the results obtained by previous researchers. Therefore, the influence of the volume of the specimen on porosity, structure, and hardness, in this particular case, when building components with the Al5356 alloy is concerned, is, however, insignificant using the technological conditions previously referred to.
The ultimate tensile strength (UTS) test experiments results, consisting of four repeats, are shown in
Figure 17 as a function of the strain rate.
Figure 17a shows the results corresponding to specimen A in the vertical orientation of the specimen build-up process, and
Figure 17b shows the results of the same specimen in the horizontal direction of build-up. Likewise,
Figure 17c,d present the results for specimen B in the vertical direction and horizontal direction of build-up. The yield strength (YS) of all samples depending on the specimen and the direction of build-up is in the range of 106–111 MPa. The ultimate tensile strengths (UTS) of the studied samples are in the range of 267–275 MPa. The elongation is in the range of 25–27% in all cases. The breaking force F
b, in other words the maximum sustainable load, is in the range of 20.66–21.31 kN. Wang et al. [
19] performed tensile experiments on a WAAM-CMT built specimen and have found that the manufactured component had an YS of 114 MPa in the horizontal and 85 MPa in the vertical direction with an elongation ranging between 19.3 and 24.9% depending on the orientation. Apparently, the concentration of macro-defects within the structure of that specimen in the vertical direction is slightly higher compared to the ones in the present research. The UTS of the sample obtained by Wang et al. [
19] is in the range of 220–263 MPa. Wieczorowski [
21] also studied the possibility of manufacturing of an Al5356 specimen using WAAM-CMT; however, they employ a very low heat input during the process by limiting the power input. The obtained results regarding the tensile experiments are YS of 120 MPa and UTS of 252 MPa with a 17.4% elongation. All experiments are performed in the horizontal direction. Li et al. [
20] have also performed tensile experiments on WAAM-CMT built specimens and found the YS and the UTS of the specimens in both directions of build-up to be 125 MPa and 270 MPa, accordingly. Similarly, Derekar et al. [
13] have reported an YS of 115 MPa and an UTS of 265 MPa in all directions of build-up of WAAM-CMT built Al5356 specimens. Comparatively, the obtained results in the present data are in complete agreement with those obtained by previous researchers.
Figure 18a shows a comparison between the yield strength of the different specimens in both the vertical and horizontal direction. Evidently, there is an ever-so-slight difference between the average data obtained for the vertical samples. The average YS of the horizontal samples is completely identical.
Figure 18b shows the same comparison made for the UTS of the specimens. In all cases, the UTS is also nearly identical. The presented results suggest that almost identical tensile properties were obtained regardless of the length of the specimens.
4. Discussion
During the process of wire and arc additive manufacturing, a repeated process of the layer-by-layer deposition of materials is conducted. A constant heating, cooling, and then reheating of the manufactured components is observed. A vast number of factors influence this process, such as the currently chosen welding parameters, the welding technological conditions, the structure of the welding wire, its purity, the structure of the previously deposited layer, the ambient temperature, convection flows (natural of forced), and even the humidity of the air. A very important factor that could also affect the resultant structure and properties of the manufactured specimens is their volume. As the volume of the specimen increases, the thermally conductive surface area of the specimen also increases, resulting in a more efficient process of temperature dissipation. This means that, theoretically, the interpass temperature of the smaller specimen (specimen A) should increase faster compared to the larger specimen (specimen B). An increase in the interpass temperature as a function of the height of the specimens was also reported by Geng et al. [
22]. The increase in the temperature leads to a decrease in the thermal conductivity of the material. This means that the increase in the height of the specimen is, in any case, accompanied by a worsening of its thermal dissipation capability. Due to this, it is possible that the difference in size of the components is mitigated by the natural thermal accumulation process.
Considering the results of the X-ray diffraction experiments, it can be concluded that the different volumes of the specimens did not affect the structure formation as far as the crystal structure is concerned. In addition, no substantial effect of the size of the components on the crystal defects formation and concentration was observed. As mentioned above, Chuanchu Su et al. [
9] managed to obtain the Al
3Mg
2 intermetallic phase within the structure of their specimen, despite the low concentration of Mg in the Al5356 welding wire. Generally, such intermetallic phases form when high concentrations of Mg are present within the material (above 10 wt%), as shown by Zhou et al. [
23]. In the case of Su et al. [
9], however, this was most probably caused by the multi-pass approach of manufacturing, where a higher accumulation of heat is to be expected. This improves and favors the possibility of Al bonding with any undissolved Mg particles spread across the alloy and forming the Al
3Mg
2 phase. Of course, this is just a hypothesis, and more experimentation needs to be performed to prove such a relationship.
Where the structure of the specimens in the present study is concerned, a noticeably high concentration of undissolved Mg particles is noticed, suggesting either one of two things. Either the applied technological conditions of layer deposition are incorrect, resulting in a solidification speed that is too high, such that the Mg particles cannot fully dissolve within the primary αAl solid solution, or a complete saturation of the dissolved Mg within the structure of the solid solution is observed, resulting in the dissociation of Mg from the solid solution and the formation of solid Mg particles. Interestingly, the dissolved Mg particles predominantly form close to the boundary of the defects observed in the structure. A number of micro-sized irregularly shaped pores is also observed within the structure of the specimens, and, in some cases, some microscopic cracks are also detected. According to Li et al. [
24], hot cracking in alloys of metals occurs dependent on the concentration of the alloying elements and their type. Apparently, the possibility of the formation of hot cracking in AlMg alloys during thermal processes increases linearly with the decrease in the concentration of the Mg particles. The formation of hot cracks is also related to the initial, i.e., interpass, temperature. The increase in the interpass temperature reduces the chance of the formation of hot cracks. Since most of the larger cracks of the specimens included in this study form closer to their top sections (where the interpass temperature is the highest), it can be concluded that those microscopic cracks form most probably due to the poor recombination of the aluminum grains during the solidification stage and due to the thermal expansion/shrinkage of the material. The presence of pores within the structure of specimen A and specimen B indicates that both the thermal input and the solidification speed are too high. As Ardika et al. [
25] suggested, pores in aluminum welded joints form due to two reasons—the rapid solidification of the material or the absorption of gases within the weld pool. Gas pores usually have a spherical shape and a larger size compared to solidification pores [
26]. Since no large spherical-shaped pores were detected in the structure of the specimens, the most probable cause for the formation of pores in the present case is the high solidification speed. In the case of the smaller specimen, the concentration of micro-pores is slightly higher compared to the larger specimen, but the difference should be considered as irrelevant. Similarly, the microhardness of that specimen is slightly lower. Theoretically, the last could primarily be attributed to an increase in the size of the aluminum grains, although such a relationship was not the object of investigation in the present study.
Despite the high concentration of defects and the formation of small solidification cracks, the mechanical properties of both specimens have satisfactory values comparable to those obtained by previous researchers using WAAM and to cast components. Furthermore, a unification of the microhardness and the tensile properties was achieved between specimens of different sizes. This indicates that the applied technological conditions of layer deposition are applicable to the production of different components regardless of their size.

 ,
, 


