
Identifying Lung Cancer Cell Markers with Machine Learning Methods and Single-Cell RNA-Seq Data


1
School of Life Sciences, Shanghai University, Shanghai 200444, China
2
Department of Mechanical and Energy Engineering, Shaoyang University, Shaoyang 422000, China
3
Channing Division of Network Medicine, Brigham and Women’s Hospital, Harvard Medical School, Boston, MA 02115, USA
4
Department of College of Information Engineering, Shanghai Maritime University, Shanghai 201306, China
5
CAS Key Laboratory of Tissue Microenvironment and Tumor, Shanghai Institute of Nutrition and Health, Chinese Academy of Sciences, Shanghai 200031, China
*
Authors to whom correspondence should be addressed.
†
These authors contributed equally to this work.
Life 2021, 11(9), 940; https://0-doi-org.brum.beds.ac.uk/10.3390/life11090940
Submission received: 11 July 2021
/
Revised: 3 September 2021
/
Accepted: 6 September 2021
/
Published: 9 September 2021
(This article belongs to the Section Biochemistry, Biophysics and Computational Biology)
Abstract
:Non-small cell lung cancer is a major lethal subtype of epithelial lung cancer, with high morbidity and mortality. The single-cell sequencing technique plays a key role in exploring the pathogenesis of non-small cell lung cancer. We proposed a computational method for distinguishing cell subtypes from the different pathological regions of non-small cell lung cancer on the basis of transcriptomic profiles, including a group of qualitative classification criteria (biomarkers) and various rules. The random forest classifier reached a Matthew’s correlation coefficient (MCC) of 0.922 by using 720 features, and the decision tree reached an MCC of 0.786 by using 1880 features. The obtained biomarkers and rules were analyzed in the end of this study.
1. Introduction
Non-small cell lung cancer is a major lethal subtype of epithelial lung cancer with high morbidity and mortality [1,2]. According to the epidemiological statistics from the American Society of Clinical Oncology [3], more than 84% of all clinical lung cancer cases can be attributed to non-small cell lung cancer. Annually, more than 116,300 men and 112,520 women in the United States alone are newly diagnosed with non-small cell lung cancer [4,5]. Owing to the development of pharmacological and clinical treatment techniques, the averaged death rate of non-small cell lung cancer has dropped by approximately 50%, especially in men [5]. However, the actual death rates vary with clinical background and disease stage. Therefore, exploring detailed pathological mechanisms and treatment strategies for this disease is necessary.
Previous studies on non-small cell lung cancer showed that genetic background and variations are major pathogenic factors for non-small cell lung cancer [6,7,8,9]. As driver genes, various pathogenic genes are specific and essential for the initiation and progression of the disease. For instance, the top identified gene associated with non-small cell lung cancer is EGFR. In 2004, the gene was identified as an effective clinical biomarker for the pathogenesis of non-small cell lung cancer [10]. Since then, various variation-based drugs (either targeted or chemotherapeutic drugs) have been developed, including necitumumab [11], cetuximab [12], and erlotinib [13]. Apart from EGFR, KRAS [14], EML4-ALK [15], ERBB2 [16], BRAF [17], and PIK3CA [18] participate in the pathogenesis of non-small cell lung cancer. Similar to EGFR, some of these typical genes have been used in developing novel drugs against non-small cell lung cancer, such as alpelisib targeting PIK3CCA, MK-2206 targeting AKT, and AZD6244 targeting MEK, confirming a complicated genetic background for the initiation and progression of non-small cell lung cancer.
Developments in sequencing techniques have stimulated research on non-small cell lung cancer at a single-cell level, and thus the internal heterogeneity of the disease has been revealed [19,20]. Single-cell RNA sequencing is one of the most widely applied and robust techniques for disease pathogenesis studies at the single-cell level [21]. By using single-cell RNA sequencing techniques, not only the transcriptomic heterogeneity of cancer cells but also different cell subgroups in microenvironments surrounding malignant tissues (cancer-adjacent tissues) can be further revealed [21], and thus research on non-small cell lung cancer has become extensive. In May 2020, researchers from Samsung Genome Institute applied systematic single-cell RNA sequencing to more than 0.2 million cells from 44 individuals to reveal specific and heterogeneous cell subgrouping patterns in pre-invasive and metastatic tumors and respective tumor microenvironments [22], providing novel systematic single-cell-level transcriptomic datasets of non-small cell lung cancers. The study mainly focused on showing differences among the transcriptomic profiles of different cell subtypes and among those of clinical pathological regions. However, key differentially expressed molecules (biomarkers) distinguishing different cells or cancers of different regions have not been fully revealed.
Here, to fulfill the research gap in identifying specific biomarkers for each cell subtype or pathological region, we divided transcriptomic data into 32 groups according to their tissue specificity, such as normal lung tissue (nLung), tumor lung tissue (tlung), brain metastatic tissue (mBrain), lymph node metastatic tissue (mLN), lymph node normal tissue (nLN), and pleural effusion (PE), and to cell subtypes, including B lymphocytes, endothelial cells, epithelial cells, fibroblasts, mast cells, myeloid cells, and T/NK cells. With advanced computational methods, we identified a group of qualitative classification criteria (biomarkers) distinguishing different cell subtypes from different pathological regions for the first time and established various rules for further quantitative distinction. Therefore, this study may not only confirm the applicability of computational methods on biomarker screening at the single-cell level but may also lay a solid foundation for further biomarker discovery on non-small cell lung cancer.
2. Materials and Methods
We downloaded the processed single-cell RNA sequencing data of metastatic lung adenocarcinoma from Gene Expression Omnibus (GEO) under accession number GSE131907 [22]. This dataset included cells from mBrain, mLN, nLN, nLung, PE, and tLung. For each tissue, it included various cell types. We only considered the cell types with cell numbers greater than 100 for further analysis. In Table 1, we list the sample sizes of filtered cell types from six tissues. A total of 180,035 cells were obtained. In each cell, the expression levels of 29,634 genes were represented with normalized log2(TPM+1), as described by Kim et al. [22].
2.1. Boruta Feature Selection
Not all the adopted attributes were related to the target for most datasets. To remove or reduce redundancy between attributes, we employed the Boruta algorithm [23] for feature selection. The Boruta algorithm is a wrapper, using random forest [24] as a classifier. The basic idea behind such an algorithm is the removal of the most redundant feature each time. The Boruta algorithm is composed of the following steps: (1) shadow attributes are created by copying original attributes. (2) Each shadow attribute is shuffled for the removal of correlation with a target. (3) The shadow and the original attributes are used to train random forest and yield the importance of each attribute. (4) The maximum score is determined using the shadow attribute, and the original attribute whose score is more than the maximum score is marked as important. For each attribute with a score that is less than the maximum score, a two-sided test of equality is performed. (5) Unimportant attributes are removed. (6) The above steps are repeated until all the attributes are marked “important.”
In this study, we used the Boruta program, available at https://github.com/scikit-learn-contrib/boruta_py (accessed on 5 March 2019). The single-cell RNA sequencing data of metastatic lung adenocarcinoma was fed into the program. Genes were termed as attributes and cell types were targets. Some genes marked as “important” were selected for further analysis.
2.2. Max-Relevance and Min-Redundancy
The Max-Relevance and Min-Redundancy (mRMR) proposed by Peng et al. [25] are filters for measuring correlations between attributes and targets on the basis of mutation information criteria. Mutation information between attribute x and target y is defined by:
where p(x, y) denotes the joint probabilistic density of x and y, and p(x) and p(y) denote the marginal probabilistic densities of x and y, respectively. The correlations of attribute x and target y increase with the value of MI(x, y). The mutation information between the set of attribute S and target is defined by:
where the operator || denotes the number of elements in a set. The goal of the mRMR is to search a subset S from n attributes containing mutation information in which target y satisfies the maximum relevance and subset S satisfies the minimum redundancy. The max-relevance and min-redundancy is modeled by
Equation (3) is an NP-hard question. The mRMR uses a greed strategy of searching; that is, it produces a list to sort attributes according to their importance.
This study adopted the mRMR program retrieved from http://penglab.janelia.org/proj/mRMR/ (accessed on 9 October 2017). Default parameters were used. The single-cell RNA sequencing data with genes selected by the Boruta method were fed into the mRMR program. Likewise, genes were termed as attributes and cell types were considered as targets. Accordingly, we obtained a gene list. Genes with high ranks were more important than those with low ranks.
2.3. Incremental Feature Selection
Incremental feature selection (IFS) [26] is a strategy for searching informative attributes. Owing to its simplicity and efficiency, IFS has been extensively used in feature selection. For the gene list obtained by the mRMR method, we added 10 genes each a time. That is, the decision tree and random forest first performed 10-fold cross-validation over the training set, in which cells were represented by the top 10 genes in the list, then those with top 20 genes, top 30 genes, and so on. When all genes were added, this procedure stopped. For each classification algorithm (decision tree or random forest), the gene set on which the classification algorithm provided the best performance was found. This set was called the optimum set and genes in this set were called optimum genes.
2.4. Synthetic Minority Over-Sampling Technique
As listed in Table 1, the sizes of 32 cell types have great differences. The largest cell type contains much more cells than the smallest type. Thus, such a dataset is imbalanced. Classifiers built on such a dataset may be apt to the largest cell type. To solve such problem, we used the synthetic minority over-sampling technique (SMOTE) [27] to yield new samples for all cell types except the largest cell type. The SMOTE was described as follows. First, k nearest cells to one randomly selected cell of one minority cell type (cell type other than the largest cell type) were identified on the basis of Euclidean distance. Second, one nearest cell b was randomly selected from the above k nearest cells. The new cell c was computed by:
where rand(0,1) denotes a random number between 0 and 1. This newly produced cell was put into the minority cell type. After this procedure was performed several times, all cell types contained same number of cells. For convenience, the tool “SMOTE” in Weka (https://www.cs.waikato.ac.nz/ml/weka/ accessed on 15 December 2016) [28] was employed to tackle the imbalanced problem of single-cell RNA sequencing data.
2.5. Classification Algorithm
The IFS method needs one classification algorithm. This study selected decision tree [29] and random forest [24]. In a decision tree, each node represents a decision of one attribute. ID3, C5.0, and Classification and Regression Tree (CART) belong to the decision tree. CART with the Gini index was used in constructing a decision tree in this study. Random forest is an ensemble learning algorithm comprising many decision trees. Each decision tree is constructed by randomly selecting some attributes and some samples (with replacement). For a new sample, all the decision trees vote for a final decision.
In this study, we used the corresponding packages in Scikit-learn (https://scikit-learn.org/stable/ accessed on 26 August 2019) to implement the above decision tree and random forest. They were executed with their default parameters. The single-cell RNA sequencing data, where samples were represented by some genes, were fed into the program of decision tree or random forest to construct classifiers.
2.6. Cross-Validation and Metrics
We performed 10-fold cross-validation [30,31,32,33,34] to examine all classifiers in IFS. In 10-fold cross-validation, all cells were divided into 10 parts of equal or approximately equal size. Nine parts were used for training, and one part was used for testing. This process was repeated ten times.
Matthew’s correlation coefficient (MCC) in multi-class [35] was mainly used in assessing performance, which was computed by:
where X and Y are two matrices, representing the predicted and actual class of each sample. Similar to the original MCC for binary classification [36], such an MCC ranges from −1 to 1, and 1 means perfect prediction, 0 means random prediction, and −1 means completely opposite of prediction.
In addition, we computed the accuracy of each cell type and overall accuracy for each classifier. These measurements were provided for reference.
2.7. Functional Enrichment Analysis
With the IFS method, we can obtain optimum genes. To reveal their potential cell subtype specific biological functions, functional enrichment analysis was conducted. The results can be evidence for the further exploration of different contributions of different cell subtypes on lung tumorigenesis. In this study, we used R package topGO (v2.42.0) to perform gene ontology (GO) enrichment analyses. The p-value threshold for statistical significance was set to 0.001.
3. Results
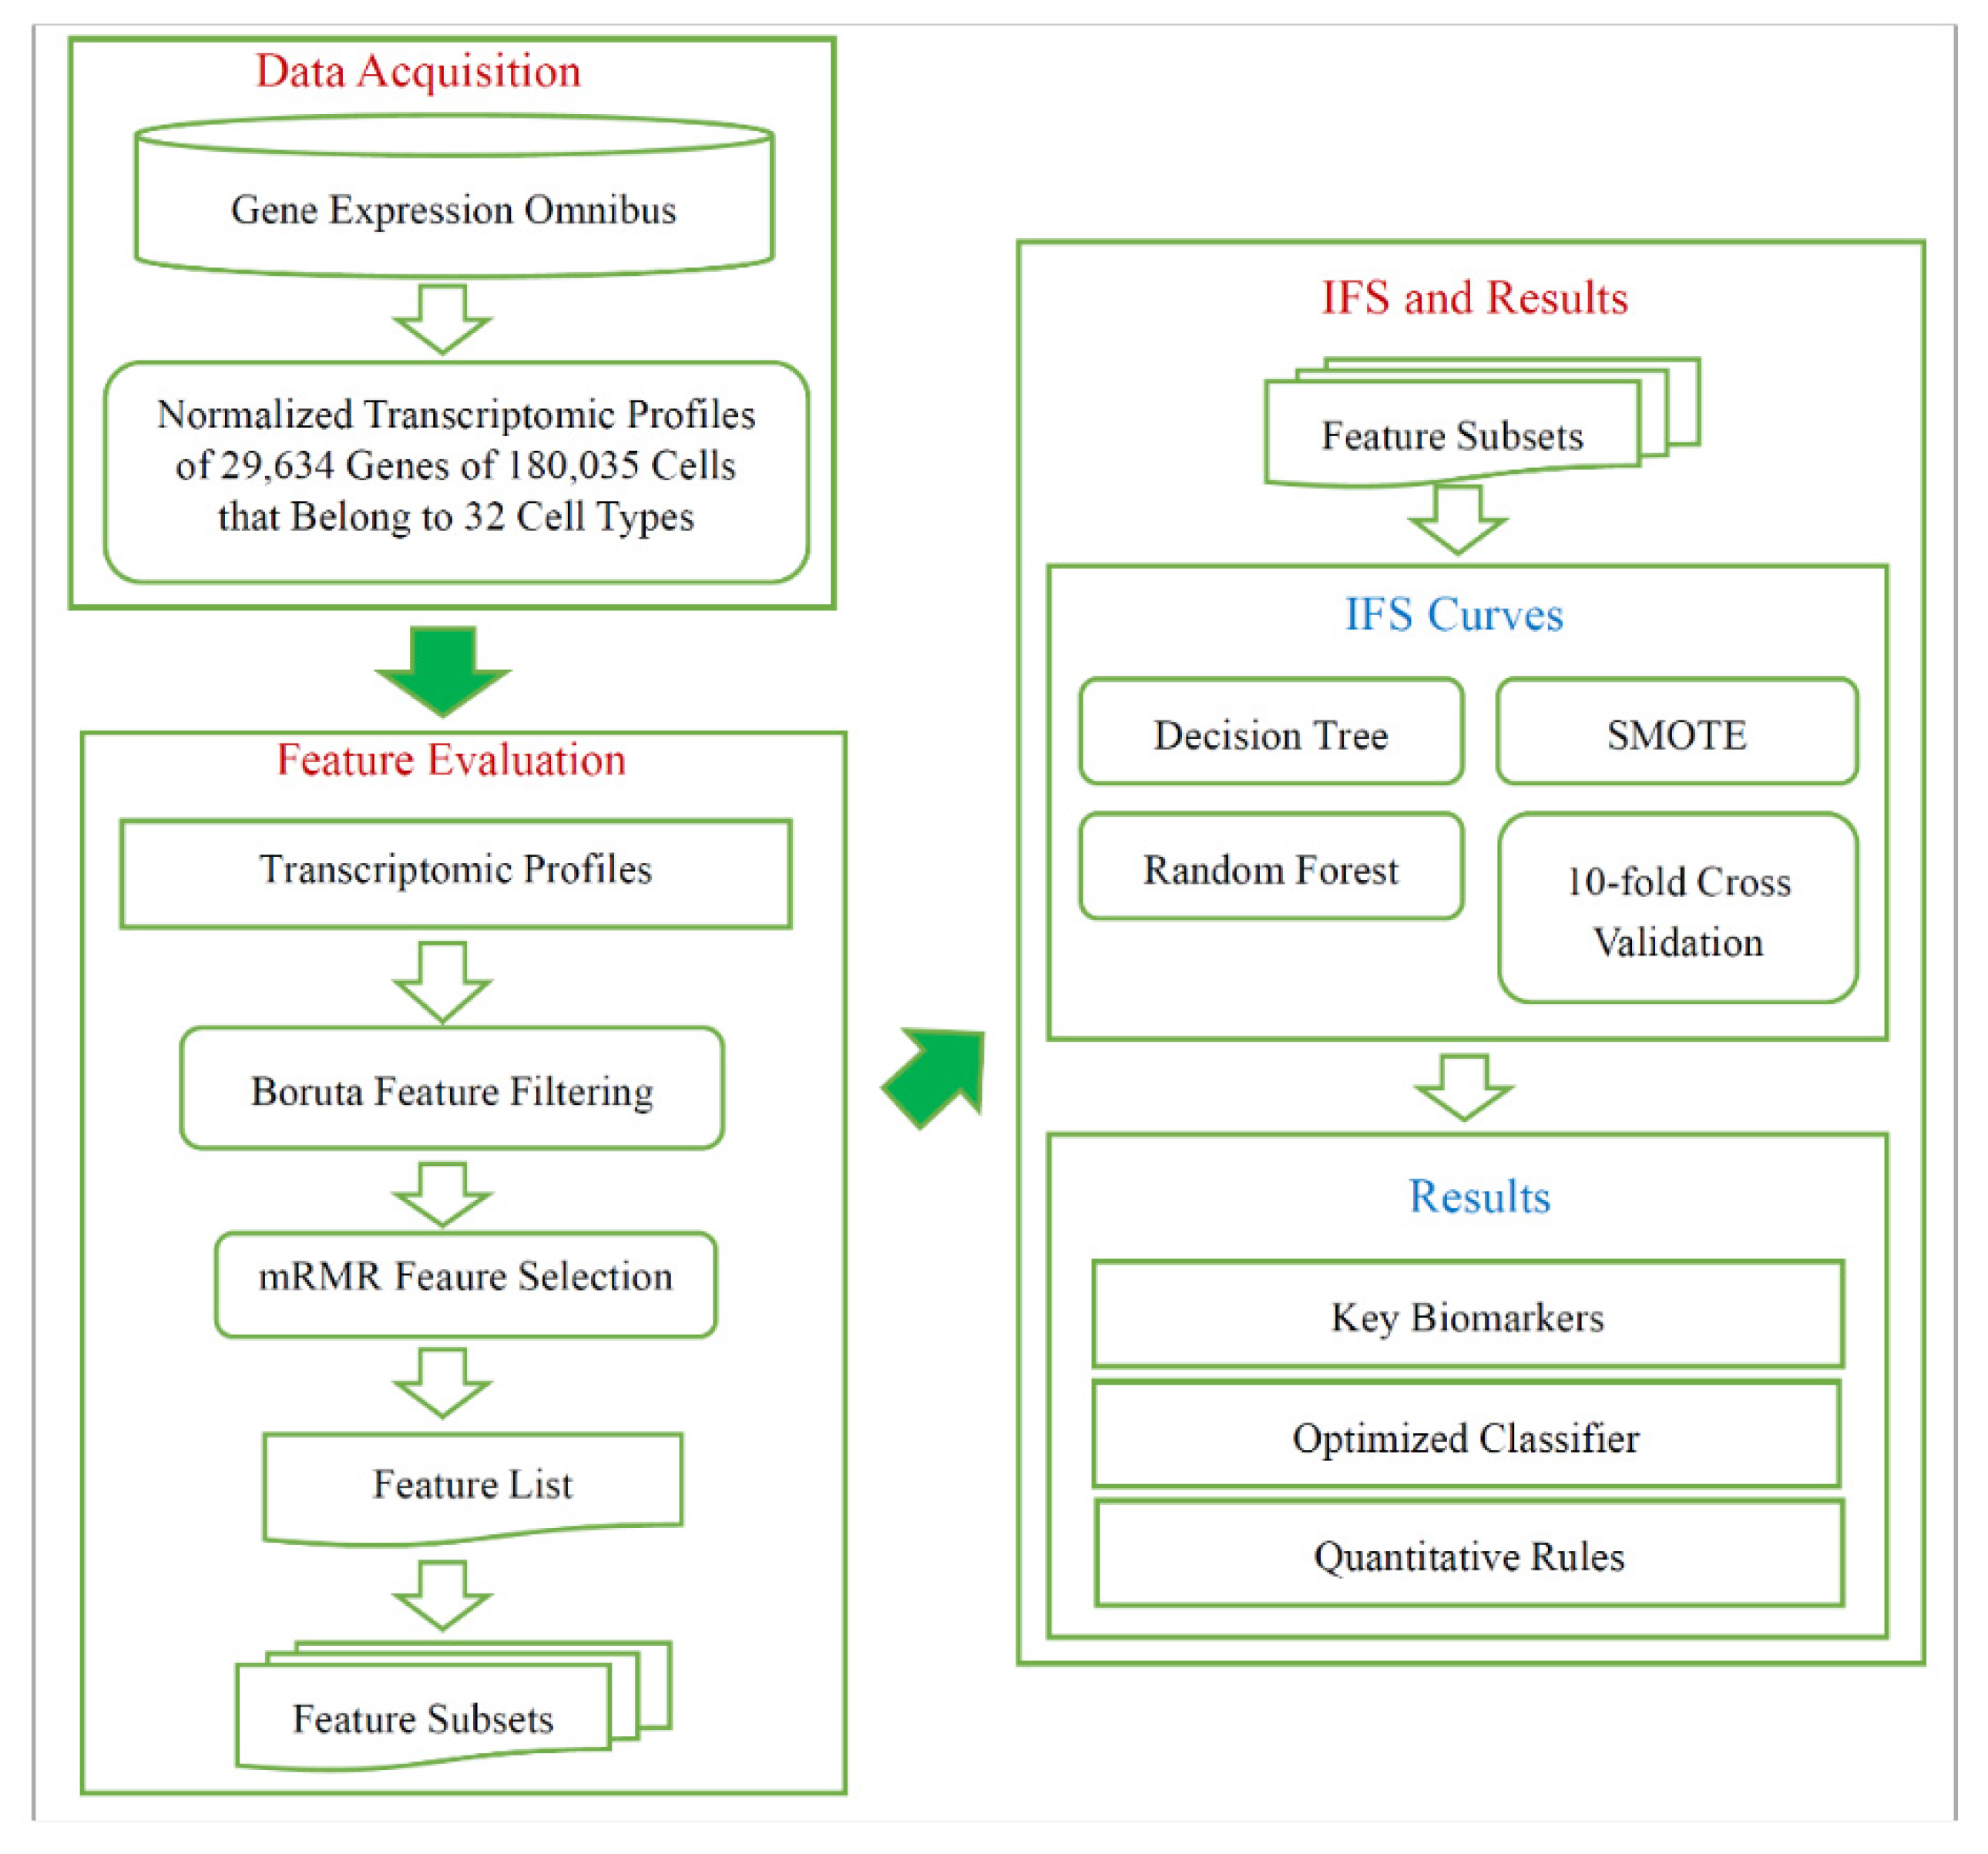
As shown in Figure 1, a computational procedure was used in investigating cell subtypes from the different pathological regions of non-small cell lung cancer. A total of 180,035 cells from 32 types were collected from GEO, and each cell had the expression levels of 29,634 genes. Then, Boruta feature selection and mRMR were performed successively. The 10-fold cross-validation was performed with the decision tree or random forest over the datasets generated by the SMOTE. We introduced results generated by all computational procedures.
3.1. Results of Boruta and mRMR Methods
We first applied the Boruta feature selection method to the single-cell RNA sequencing dataset. A total of 3880 genes were preserved, which are provided in Table S1. These genes were further analyzed by the mRMR method, yielding an ordered list of genes, which were ranked by importance (from highest to lowest). This list is also provided in Table S1.
3.2. Results of IFS with Random Forest
The ordered list of genes was fed into the IFS method with random forest as the classification algorithm. We used step 10 to construct gene subsets and a random forest classifier was built on each gene subset. Each classifier was evaluated by 10-fold cross-validation. When evaluating the performance of classifiers, the SMOTE was used to balance samples from different cell types. The performance of each classifier, including accuracy for each cell type, overall accuracy and MCC, is available in Table S2. For an easy observation, an IFS curve was plotted, as shown in Figure 2, which set MCC as the Y-axis and the number of features (genes) as the X-axis. Evidently, random forest yielded the best MCC (0.922) with the top 720 features (genes). Accordingly, these top 720 genes constituted the optimum genes for random forest. The overall accuracy of such a classifier was 0.927 (see Table 2). The accuracy on each cell type was illustrated in a boxplot, as shown in Figure 3. These results indicated the good performance of this classifier. However, the efficiency of this classifier was not very high due to the large number of features (genes). By checking the curve in Figure 2 and MCCs in Table S2, random forest generates the MCC of 0.884 when the top 100 features (genes) were used. The overall accuracy was 0.891 (Table 2). They were a little lower than those of the best random forest classifier. As for the accuracy on each cell type, as shown in Figure 3, they were almost at the same level of those yielded by the best random forest classifier. Considering that much fewer features (genes) were used, this classifier was a more proper tool to identify cell types.
3.3. Results of IFS with Decision Tree
Although above random forest classifiers provided high performance, it is almost impossible to understand them and obtain new insights on the differences of cell types because they were absolute black-box classifiers. Thus, we further employed another classification algorithm, the decision tree, in the IFS method. This algorithm can learn a decision tree on a given dataset, from which several decision rules can be extracted. These rules can give a clearer picture on the differences of cell types.
The IFS results on decision tree are provided in Table S2. Likewise, an IFS curve was also plotted, as illustrated in Figure 2. The best MCC was 0.786, which was obtained based on the top 1880 features (genes). The overall accuracy of this classifier was 0.799, listed in Table 2. Its performance on 32 cell types is shown in Figure 3. Evidently, the performance of such a classifier was much lower than the two above-mentioned random forest classifiers. However, it can give more insights. Accordingly, all cells, represented by the top 1880 features (genes), were learnt by the decision tree algorithm and a big tree was built. From such a tree, we extracted 19,032 decision rules, which are available in Table S3. Further analysis of these rules was helpful to uncover the differences of cell types.
Due to the huge number of rules, we tried to extract the most important information from these rules. For each cell type, the genes that only occurred in rules of such a cell type were extracted. We called them exclusive genes. Because these genes played critical roles for identifying a certain cell type, they can be latent biomarkers for some cell types. By counting the 19,032 rules, ten cell types received at least one exclusive gene, which are listed in Table 3. In Section 4.3, further analyses are conducted on them.
3.4. Enrichment Analysis on Essential Genes
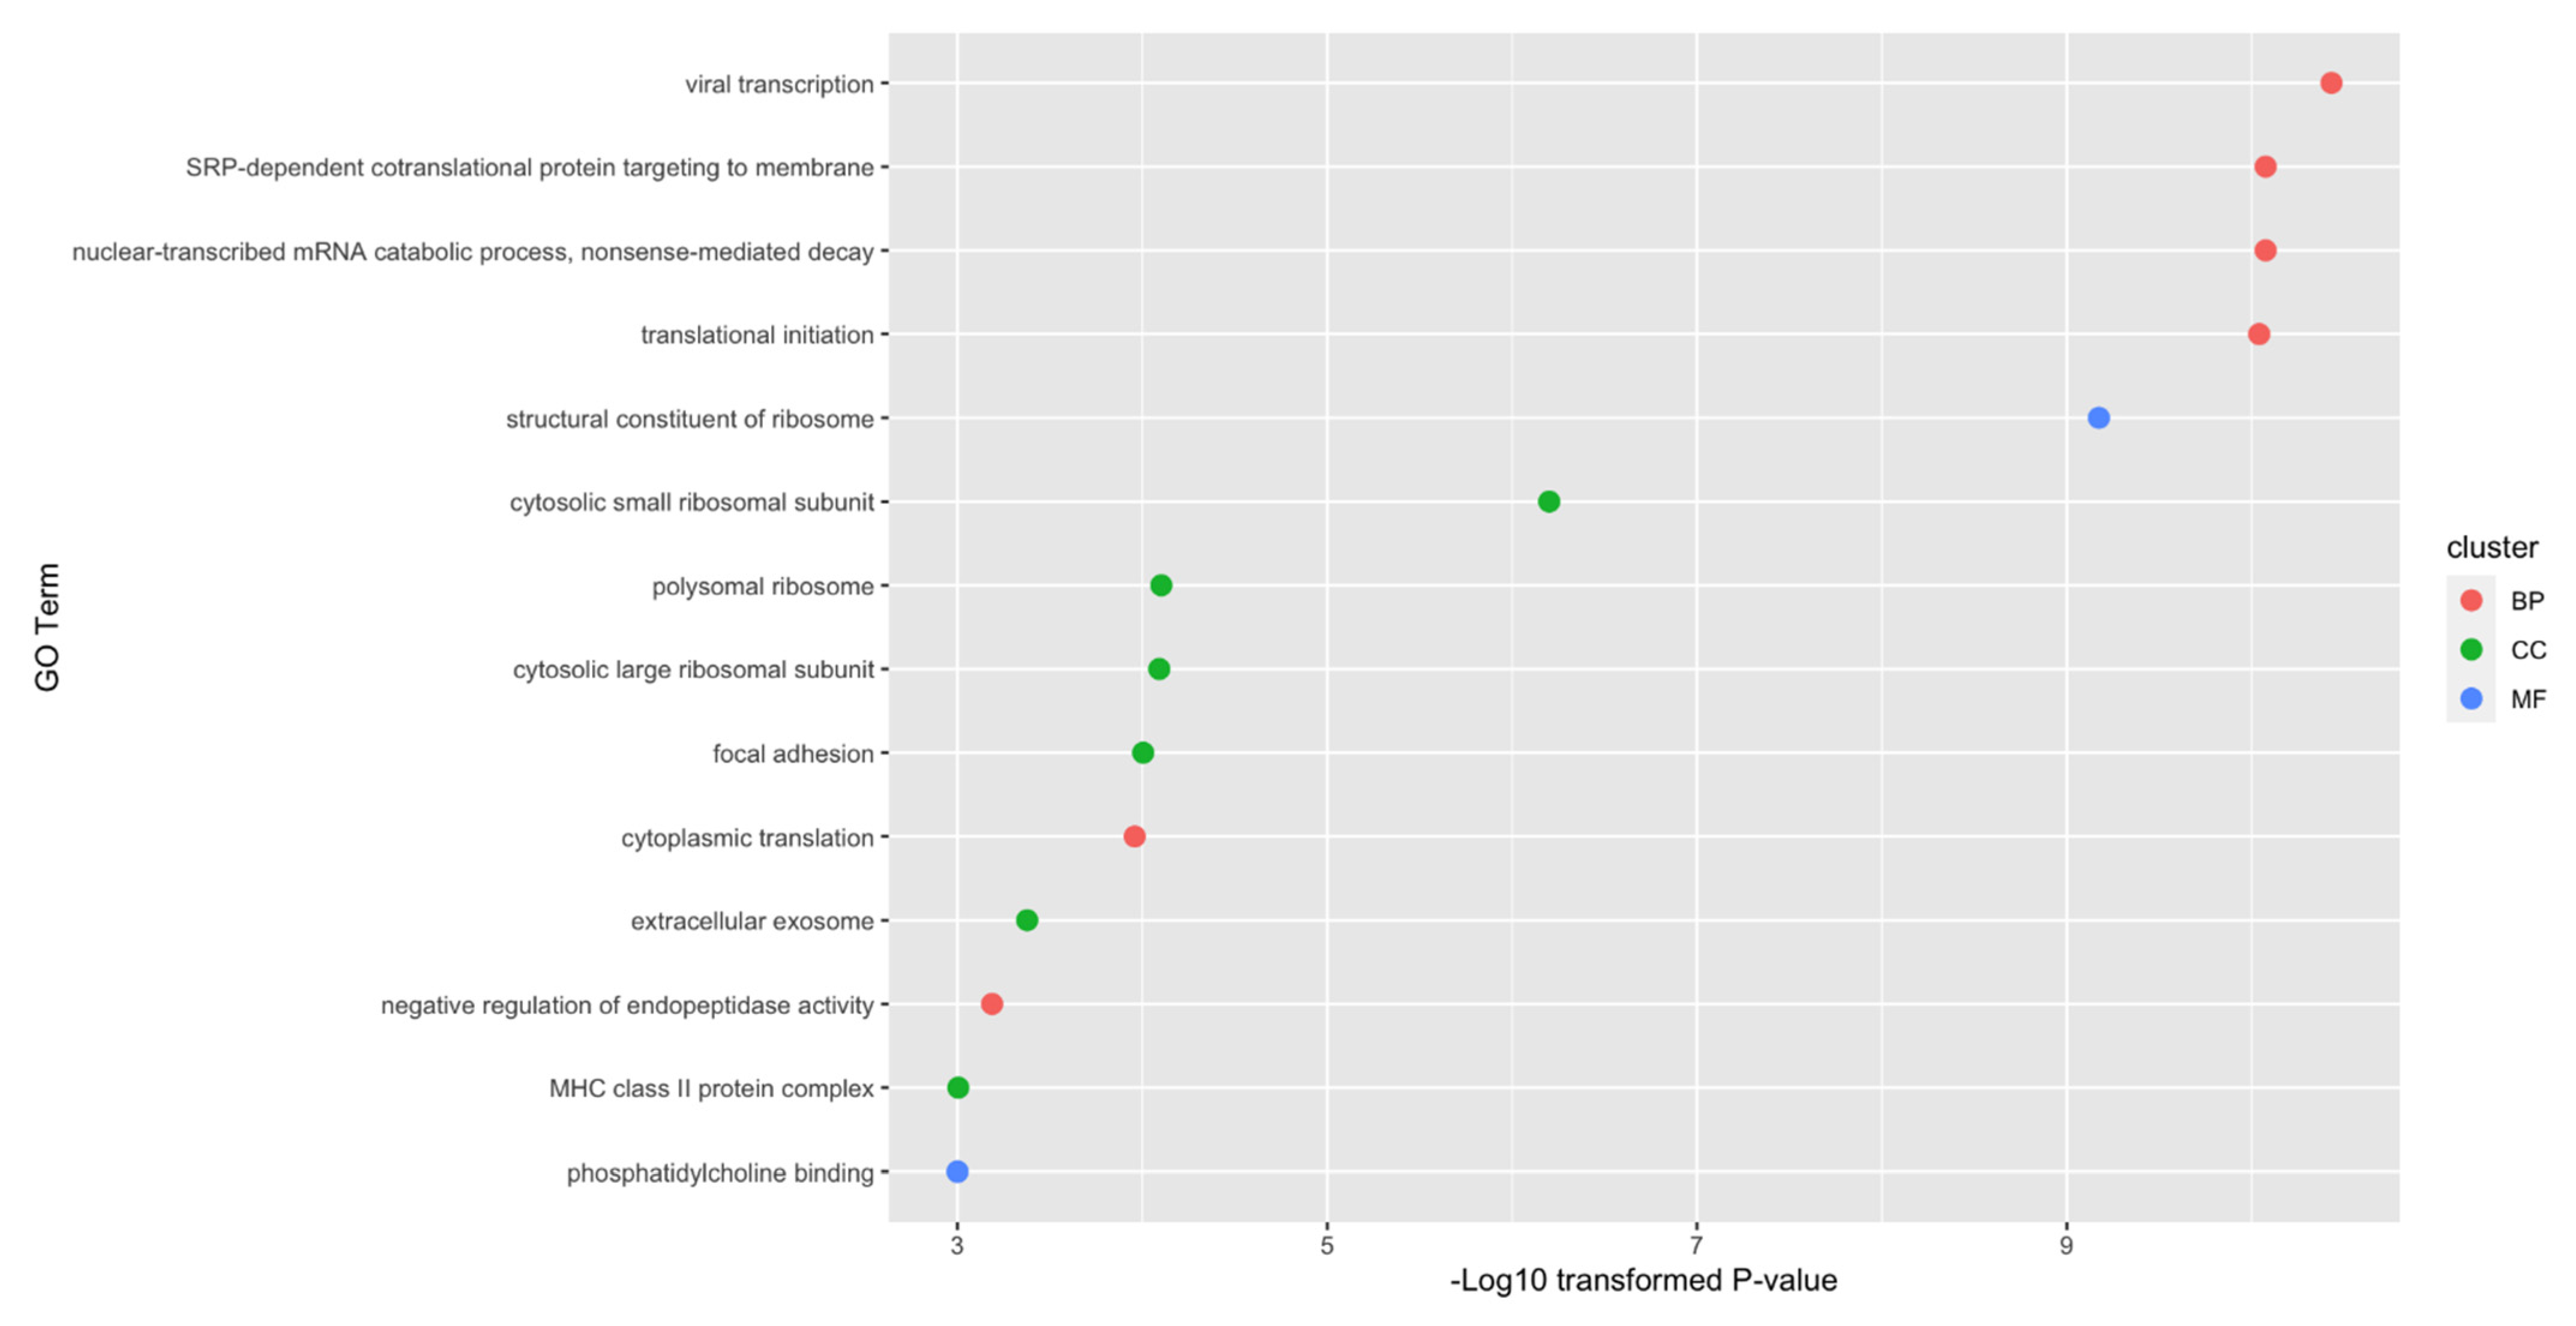
As mentioned in Section 3.2, the top 720 genes were the optimum genes for random forest. The enrichment analysis was conducted on them. As shown in Figure 4, 14 enriched GO terms with p-value threshold 0.001 were identified. Among these fourteen terms, there are six biological processes, six cellular components and two molecular functions. Among these enriched GO terms, specific functions such as viral transcription, focal adhesion and extracellular exosome have already been reported to be associated with specific cell types of lung cancer. The detailed discussion and interpretation of results can be seen in Section 4.4.
4. Discussion
We used our proposed computational methods to identify specific biomarkers or rules for distinguishing different cell subtypes from different tumor regions at the single-cell level in the primary and metastatic loci of non-small cell lung cancer. Recent publications have shown that several screened out qualitative biomarkers and quantitative rules contribute to the classification of 32 cell groups (six tissues and seven cell types) in the different stages and pathological regions of non-small cell lung cancer, implying the efficacy and accuracy of our proposed method. Detailed analyses on the correlations between non-small cell lung cancer and the top optimal biomarkers or rules are provided below.
4.1. Biomarkers for Tissue Specificity and Cell Subtype Classification
In our prediction list, we identified multiple biomarkers that contribute to the distinction of different cell types from the different regions of non-small cell lung cancers. Genes in such a list have been confirmed to distinguish at least two groups of cells according to recent publications. Here, we chose the top genes for detailed analyses as outlined below.
The first gene in our prediction list turned out to be TYROBP, which encodes an effective immune signaling adapter. According to previous studies, this gene has different expression patterns in different non-small cell lung cancer tissues. In early 2004, TYROBP was shown to be differentially expressed in tumor tissues in contrast in normal tissues [37], indicating that the gene may help distinguish tumor cells from normal cells. In May 2020, another study revealed that TYROBP was found to be one of the most significant biomarkers reflecting the immune status of tumor microenvironments and contributing to the distinction of functional and dysfunctional immune cells [38]. Therefore, the gene may play a role in distinguishing between normal and tumorous lymph node tissues because of differences in immune characteristics under physical or pathological (tumorigenic) conditions. As for the applications, such a gene can identify lung cancer using the biopsy sample directly from lung tissue, acting as additional lung tissue tumorigenesis monitoring biomarkers.
Apart from TYROBP, several candidate biomarkers encode functional Cluster of Differentiation (CD) molecules and contribute to the classification of different immune cells during the initiation and progression of non-small cell lung cancer. Hence, they are key immune biomarkers distinguishing immune cells under different conditions. CD52, as the top optimal CD molecule, is differentially expressed in the activated T cells compared with that in T cells that are not activated (in normal tissues) or inhibited. Therefore, the expression level of the CD52 gene may be used in distinguishing T cells from different environments, validating the efficacy and accuracy of our prediction [39]. Further studies on immune cells in multiple non-small cell lung cancer confirmed that the gene is differentially expressed in tumor tissues unlike in normal tissues [40], consistent with our speculation. Apart from CD52, another gene in our prediction list from the CD family was CD3D, which encodes the delta of the CD3 complex of the T-cell receptor and is involved in T cell development [41] and T cell-mediated immune response [42,43]. Similar to CD52, CD3D is differentially expressed in the normal and malignant lung tissues of non-small cell lung cancer [44], consistent with our prediction. A systematic study [20] published in 2018 investigated T cell expression pattern in non-small cell lung cancer at the single-cell level, which confirmed that CD3D has differential expression levels not only in normal tissues and malignant tissues but also in the lung tissues and lymph nodes, implying that the gene is a potential biomarker distinguishing T cells from different tissues during the initiation and progression of non-small cell lung cancers. Such a cluster of differentiation proteins can monitor the immune status of the tumor microenvironment at the single-cell level. Theses biomarkers can provide valuable information for the comprehensive immune evaluation of tumor patients in clinic.
Apart from the two clusters of differentiation biomarkers, CD79A as a key biomarker for B cells [45] and CD37 as a significant regulator for T–B interactions [46] are effective biomarkers identified by our proposed computational methods. According to recent publications, CD79A has a specific expression level in carcinoma-associated fibroblasts in non-small cell lung cancers [47]. Therefore, considering the gene a potential biomarker for subgrouping non-small cell lung cancer-associated cells is reasonable, especially tumor-associated fibroblasts. As for CD37, an independent study, published in 2019, on the brain metastasis of non-small cell lung cancer identified CD37 as an effective biomarker for lung cancer brain metastasis [48], consistent with our prediction of CD37 as a potential biomarker for non-small cell lung cancer-associated cell subgrouping. Therefore, our predicted genes, such as CD79A and CD37, definitely contributed to the subgrouping of the 32 candidate groups of cells with different cell types and tissue specificity and proved at least useful in identifying specific cell subtypes, such as fibroblasts, in tumor tissues and brain metastatic tumor tissues. Similar with CD3D and CD52, CD79A and CD37 can not only help us monitor specific T–B interactions, which is one of the major parts of the anti-cancer immune response, but can also provide us a new biomarker to evaluate the alteration of cancer microenvironment during tumorigenesis.
The next predicted gene in our prediction list, HLA-DRA, is also associated with the immune system. As one of the major genes involved in immune recognition processes, it is mainly expressed in antigen-presenting cells, including B cells [49], mast cells [50], and fibroblasts [51]. Therefore, its expression level can be used in distinguishing the three groups of cells from other cells regardless of tissue specificity. As for the distinctive potential of the gene in non-small cell lung cancer, researchers from MD Anderson Cancer reported in 2018 that HLA-DRA has different expression levels in the normal and tumor tissue sections in clinical FFPE samples [52]. Therefore, our predicted gene HLA-DRA can also be an effective biomarker distinguishing different cell subtypes from different tissues in non-small cell lung cancers. HLA-DRA is a potential biomarker that can be used to evaluate the antigen-presenting efficacy for cancer monitoring or immune therapy effectiveness evaluation.
Apart from the genes described above, other genes, such as SRGN, which mediates specific mast cell-related granules secretion [53], S100A11, which mediates leukocyte differentiation [54], GPX1, which protects hemoglobin in circulating systems [55], and FCER1G, which regulates IgE-mediated immune response [56] in mast cells, contribute to the identification of specific subtypes of cells in certain tissues in non-small cell lung cancers. Moreover, SRGN [57], S100A11 [58], and FCER1G [59] contribute to the identification of mast cells in tumor microenvironments. This finding is consistent with our prediction on their specific capacities on cell subgrouping. As for GPX1, it has a specific expression level in the brain [55] and may thus be useful in distinguishing the cells of brain metastasis from other cell subtypes. These features validated our prediction. Such genes can also be used as potential biomarkers to monitor abnormal alteration during the initiation, progression and metastasis of lung cancer.
In summary, the optimal features or genes in our prediction list are definitely useful in qualitatively subgrouping the non-small cell lung cancer-associated cells of different cell subtypes and tissue specificity. They represent the expression profiling characteristics of their respective cell types from different tissues. As for their application, they can be used as potential biomarkers to evaluate and monitor the abnormal proliferation, metastasis or cell type transformation for each cell subtype, which may be quite important and valuable for the clinical diagnosis and therapy of lung cancers and their progression. Thus, they can be candidate lung cancer biomarkers marking different stages, regions and cell groups of malignant lung cancers. This finding also indicated the efficacy of our proposed computational methods.
4.2. Rules for Quantitative Tissue Specificity and Cell Subtype Classification
Apart from qualitative genes, we set up a group of quantitative rules for the accurate classification of different cell subtypes and tumorigenic regions of non-small lung cancers. All the parameters from the rules were correlated with single-cell level classification and showed corresponding expression tendency with the predicted rules, validating the efficacy and accuracy of our prediction. Here, we selected the most typical rule for each class of cells for further discussion. All the rules are listed in Table S3. Detailed analyses are shown below.
The first seven classes of cells were derived from the brain metastasis of non-small cell lung cancer. According to our predicted rules for Class 1–7, the seven groups of rules shared a specific expression pattern, that is, the low expression level of TPSB2, except rule 4, which described the fibroblasts of the brain metastasis. As for the other six cell subtypes, previous studies showed that a low TPSB2 expression level is one of the typical expression patterns in cells from the brain metastasis of non-small cell lung cancer [60], implying the accuracy and efficacy of our predicted rules. As for the fibroblasts in brain metastasis, TPSB2 expression is upregulated in fibroblasts from inflammatory environments [61], corresponding to the microenvironment of metastases. As for cell type specificity distinction, B2M expression is upregulated in B cell subgroups, which can help identify cells from class 1 (rule 687, mBrain_B lymphocytes) [62]. PLPP2 expression is downregulated in the endothelial cells of the brain [63], contributing to the identification of cells from class 2 (rule 6292, mBrain_Endothelial cells). As for class 3 (rule 0, mBrain_Epithelial cells), another parameter named DCN is downregulated in epithelial cells. Given that DCN [64] is downregulated in the epithelial cells of brain tissues, considering it a quantitative parameter is reasonable. Class 4 (rule 72) described the fibroblasts with a specific expression pattern (low expression level of SFTPC). The low expression level and extremely high level of the gene are correlated with the brain metastases of malignant lung diseases, including non-small cell lung cancer [65], validating the efficacy and accuracy of our prediction. As for class 5–7, contributing to the identification of specific cell types mast cells, myeloid cells and T/NK cells, specific quantitative biomarkers with specific expression tendencies, such as a high SPP1 expression level (rule 678) for mast cells [66], a low TRAC expression level (rule 700) for myeloid cells [67], and a high CD79A expression level (rule 883) for T/NK cells [47,68] contribute to the establishment of immune microenvironments under certain pathological conditions, including the pathogenesis of non-small cell lung cancers, validating the efficacy and accuracy of our prediction.
As for the next seven classes of cell subtypes contributing to the identification of normal or metastatic lymph node-associated cells, the rules of such a group all contained a specific biomarker with IFI44L, which has a specific high expression level in metastatic lymph nodes and a relatively low expression level in normal lymph nodes (rule 16 and 53), corresponding with recent publications on the potential clinical predictive capacities of the gene [69]. As for the detailed cell subtypes, similar with cells in brain metastasis, metastatic B cells, epithelial cells, myeloid cells and T/NK cells also have specific biomarkers with similar expression tendencies to TGM2 (rule 35) [70,71], TYROBP (rule 82) [72], TRAC (rule 94) [73], and CD79A (rule 156) [74] confirmed in the lymph node under pathological/malignant conditions with corresponding variation trends. As for the normal controls, we found a group of specific biomarkers with expression tendencies confirmed by recent publications. Class 10 normal lymph nodes have a specific expression level of CD79A, marking different groups of B cells [46]. In rule 8, the high level of the gene indicated the target cell as B cells from lymph nodes, validating the efficacy and accuracy of our prediction. In normal lymph nodes, the specific expression level of RPS27 (upregulated, rule 53) [75] and TRAC (rule 75) [76] shared similar expression levels with tumor comparison [77], and SFTPC (rule 174) [76] was involved in the identification of specific cell groups: B lymphocytes, myeloid cells, and T/NK cells, validating the efficacy and accuracy of our prediction.
For the next 14 classes: class 15-21, class26-32, various cell subgroups from lung tumor tissues, and normal tissues were gradually analyzed, and specific quantitative biomarkers were identified for each group. For each cell subgroup with specific tissue specificity, we identified some optimal biomarkers for accurate subgrouping. In our prediction rules for normal lung tissues, ITGA5 (rule 167), MT-ND2 (rule 45), SFTPC (rule 114), ADH1B (rule 21), MMP7 (rule 60), TYROBP (rule 92), and SYK (rule 71) are typical biomarkers for seven clusters of lung normal cells (B lymphocytes [78], endothelial cells [79], epithelial cells [80], fibroblasts [81], mast cells [82], myeloid cells, and T/NK cells [83]), which had specific expression tendencies and had been validated by recent publications. As for the malignant tissues, for each of the seven cell subgroups of lung malignant tissues in non-small cell lung cancer, IGLC2 (rule 17), AXL (rule 189), SERPINA1 (rule 190), CALD1 (rule 265), APOE (rule 383), S100A8 (rule 393), and GSN (rule 405) are useful in distinguishing the following cell subgroups: B lymphocytes [84], endothelial cells [85], epithelial cells [86], fibroblasts [87], mast cells [88], myeloid cells [89], and T/NK cells [90]. The correlations between gene expression levels and cell subgrouping were confirmed by recent publications, validating the prediction efficacy of our newly presented computational method.
As for the remaining four classes describing pleural effusion-associated cells, rule-predicted cells from the four classes were validated by recent publications. For the first subgroup of cells from pleural effusion, the B lymphocytes, recent publications confirmed that one of our predicted upregulated parameters, TPT1 (rule 47), can definitely contribute to the identification of B lymphocytes in samples obtained from pleural effusion [91,92], validating the efficacy and accuracy of our prediction. Similarly, the upregulated genes, APRT in rule 138, S100A8 in rule 14, and GIMAP7 in rule 90, are all typical biomarkers for the identification of specific cell subtypes: epithelial cells, myeloid cells, and T/NK cells, which are further supported by recent publications [93,94,95,96].
4.3. Analysis of Exclusive Genes
As one of the main results of this study, several quantitative rules to distinguish cell types were established. We extracted exclusive genes for each cell type as described in Section 3.3. Ten cell types had their own exclusive genes, which are listed in Table 3. They may provide their specific contributions on their respective cell types. To reveal their linkage to the corresponding cell types, we conducted an extensive discussion on them.
Two genes, C5orf38 and MLLT4, have been shown to be specific biomarkers for lung cancer epithelial cells in situ. C5orf38 has been shown to be associated with multiple epithelial tumorigenesis [97,98], implying its specific expression pattern in lung cancer epithelial cells compared to other cell types. As for MLLT4, this gene has also been reported as a risk factor for lung epithelial tumorigenesis [99], validating such a result. Using such two biomarkers, it is easy to identify whether lung epithelial cells have been malignantly transformed or not.
Three genes, P4HA2, TJP3, and BAIAP2L1, have been shown to be associated with lung cancer B lymphocytes in situ. P4HA2 has been reported to be an extracellular matrix signaling-associated gene and was shown to participate in B-cell-mediated immune responses [100]. As for TJP3, although no direct evidence has connected such a gene with lung cancer B cells, it has been reported to participate in the regulation of antibody-mediated immune responses during lung tumorigenesis [101], validating such a result. Another gene, BAIAP2L1, is a general regulator associated with the tumor microenvironment [102], which may identify lung cancer B lymphocytes.
Three genes, TFAP2A, TJP1 and TMEM63B, have been shown to be associated with the B lymphocytes in lymph node metastasis of lung cancer. TFAP2A [103] and TJP1 [104] have both been identified in the lymph node of lung adenocarcinoma as potential biomarkers. As for TMEM63B, it has also been shown to be associated with immune responses during the metastasis of lung cancer [105], associated with the summarized cell subtype.
As for other clusters, RAB40B and SLC9A3R2 have been shown to be associated with T/NK cells in the lymph node metastasis of lung cancer [106]. TMEM45B has been shown to be associated with myeloid cells in lymph node metastasis of lung cancer [107]. TM7SF2 has been shown to be associated with T/NK cells in normal lymph nodes [103]. ZDHHC9 has been shown to be associated with myeloid cells in pleural effusion [108]. GNG12 and ITGA2 have been reported to relate to T/NK cells in pleural effusion [109]. FNBP1L and PTPN13 have been shown to be related to endothelial cells of lung tumors [110]. FAM83H has been shown to be associated with the T/NK cells in brain metastasis of lung cancer [109]. All these findings validated our results.
4.4. Functional Enrichment Results on Optimum Genes
As mentioned in Section 3.4, 14 enriched GO terms with p-values less than 0.001 were identified. All such GO terms were shown to be associated with cell-subgroup-specific contribution to lung tumorigenesis, validating the idea that the optimum genes can distinguish different cell subtypes and reveal their potential biological mechanisms. The detailed discussion on significant GO terms can be seen below.
Due to the limitation of the length of the manuscript, we selected three typical GO terms with the lowest p-value from each GO cluster. They were viral transcription (GO:0019083) for biological processes, the cytosolic small ribosomal subunit (GO:0022627) for cellular components and the structural constituent of ribosome (GO:0003735) for molecular functions.
According to recent publications, viral infections and transcriptions have been shown to be associated with the metastasis of lung cancer [111]. Thus, it is reasonable for the optimum genes to be enriched in the viral-transcription-associated biological processes. Specifically, viral infections have already been confirmed in multiple cancer subtypes to be associated with different kinds of malignant metastasis [112,113]. Other biological process terms may also be linked to the tumorigenesis of lung cancer in their respective ways. For the cellular component cytosolic small ribosomal subunit, it has been shown to be abnormally regulated during the initiation and metastasis of lung cancer [114], corresponding with our results. As for the structural constituent of ribosome, in the same paper [114], authors also validated the specific role of ribosome during lung cancer tumorigenesis.
5. Conclusions
We presented a random forest- and decision tree-based method for classifying cell subtypes from different pathological regions of non-small cell lung cancer. The selected the qualitative features (genes) and quantitative rules were confirmed to be correlated with non-small cell lung cancer and involved in the complicated classification of different cell subtypes. Therefore, the identified genes and rules can be potential biomarkers for the clinical diagnosis and monitoring of non-small cell lung cancer targeting different cell subtypes and tumorigenic focus, enriching techniques for the clinical treatment of non-small cell lung cancer. The key codes are available in Code S1.
Supplementary Materials
The following are available online at https://0-www-mdpi-com.brum.beds.ac.uk/article/10.3390/life11090940/s1, Table S1: feature list yielded by the mRMR method, Table S2: performance of two classification algorithms on different feature subsets, Table S3: rules extracted from decision tree. Code S1: key codes used in this study.
Author Contributions
Conceptualization, T.H. and Y.-D.C.; methodology, G.-H.H. and Y.-H.Z.; validation, L.C., Y.L. and T.H.; formal analysis, G.-H.H. and Y.-H.Z.; data curation, T.H.; writing—original draft preparation, G.-H.H. and Y.-H.Z.; writing—review and editing, T.H.; supervision, Y.-D.C. funding acquisition, T.H. and Y.-D.C. All authors have read and agreed to the published version of the manuscript.
Funding
This research was funded by the Strategic Priority Research Program of Chinese Academy of Sciences (XDB38050200), the National Key R&D Program of China (2017YFC1201200), the Shanghai Municipal Science and Technology Major Project [2017SHZDZX01], the National Key R&D Program of China [2018YFC0910403], the National Natural Science Foundation of China [31701151], the Shanghai Sailing Program [16YF1413800], the Youth Innovation Promotion Association of Chinese Academy of Sciences (CAS) [2016245], and the Fund of the Key Laboratory of Tissue Microenvironment and Tumor of Chinese Academy of Sciences [202002].
Institutional Review Board Statement
Not applicable.
Informed Consent Statement
Not applicable.
Data Availability Statement
The data presented in this study are openly available in Gene Expression Omnibus at https://0-www-ncbi-nlm-nih-gov.brum.beds.ac.uk/geo/query/acc.cgi?acc=GSE131907, reference number [22].
Conflicts of Interest
The authors declare no conflict of interest.
References
- Molina, J.R.; Yang, P.; Cassivi, S.D.; Schild, S.E.; Adjei, A.A. Non-small cell lung cancer: Epidemiology, risk factors, treatment, and survivorship. Mayo. Clin. Proc. 2008, 83, 584–594. [Google Scholar] [CrossRef]
- Goldstraw, P.; Ball, D.; Jett, J.R.; Le Chevalier, T.; Lim, E.; Nicholson, A.G.; Shepherd, F.A. Non-small-cell lung cancer. Lancet 2011, 378, 1727–1740. [Google Scholar] [CrossRef]
- Bartsch, R. An update from the 2019 ASCO Annual Meeting. Memo-Mag. Eur. Med Oncol. 2019, 12, 285. [Google Scholar] [CrossRef] [Green Version]
- Arbour, K.C.; Riely, G.J. Systemic Therapy for Locally Advanced and Metastatic Non-Small Cell Lung Cancer: A Review. JAMA 2019, 322, 764–774. [Google Scholar] [CrossRef] [PubMed]
- Carney, D.N.; Hansen, H.H. Non–Small-Cell Lung Cancer—Stalemate or Progress? N. Engl. J. Med. 2000, 343, 1261–1262. [Google Scholar] [CrossRef] [PubMed]
- Jakobsen, J.N.; Santoni-Rugiu, E.; Grauslund, M.; Melchior, L.; Sørensen, J.B. Concomitant driver mutations in advanced EGFR-mutated non-small-cell lung cancer and their impact on erlotinib treatment. Oncotarget 2018, 9, 26195–26208. [Google Scholar] [CrossRef] [PubMed] [Green Version]
- Faehling, M.; Schwenk, B.; Kramberg, S.; Eckert, R.; Volckmar, A.L.; Stenzinger, A.; Sträter, J. Oncogenic driver mutations, treatment, and EGFR-TKI resistance in a Caucasian population with non-small cell lung cancer: Survival in clinical practice. Oncotarget 2017, 8, 77897–77914. [Google Scholar] [CrossRef] [PubMed] [Green Version]
- Huang, Q.; Zhang, H.; Hai, J.; Socinski, M.A.; Lim, E.; Chen, H.; Stebbing, J. Impact of PD-L1 expression, driver mutations and clinical characteristics on survival after anti-PD-1/PD-L1 immunotherapy versus chemotherapy in non-small-cell lung cancer: A meta-analysis of randomized trials. Oncoimmunology 2018, 7, e1396403. [Google Scholar] [CrossRef] [PubMed] [Green Version]
- Heist, R.S.; Shim, H.S.; Gingipally, S.; Mino-Kenudson, M.; Le, L.; Gainor, J.F.; Zheng, Z.; Aryee, M.; Xia, J.; Jia, P.; et al. MET Exon 14 Skipping in Non-Small Cell Lung Cancer. Oncologist 2016, 21, 481–486. [Google Scholar] [CrossRef] [Green Version]
- Pao, W.; Chmielecki, J. Rational, biologically based treatment of EGFR-mutant non-small-cell lung cancer. Nat. Rev. Cancer 2010, 10, 760–774. [Google Scholar] [CrossRef] [Green Version]
- Garnock-Jones, K.P. Necitumumab: First Global Approval. Drugs 2016, 76, 283–289. [Google Scholar] [CrossRef]
- Mazzarella, L.; Guida, A.; Curigliano, G. Cetuximab for treating non-small cell lung cancer. Expert Opin. Biol. Ther. 2018, 18, 483–493. [Google Scholar] [CrossRef]
- Spigel, D.R.; Edelman, M.J.; O’Byrne, K.; Paz-Ares, L.; Mocci, S.; Phan, S.; Shames, D.S.; Smith, D.; Yu, W.; Paton, V.E.; et al. Results From the Phase III Randomized Trial of Onartuzumab Plus Erlotinib Versus Erlotinib in Previously Treated Stage IIIB or IV Non-Small-Cell Lung Cancer: METLung. J. Clin. Oncol. 2017, 35, 412–420. [Google Scholar] [CrossRef] [Green Version]
- Ferrer, I.; Zugazagoitia, J.; Herbertz, S.; John, W.; Paz-Ares, L.; Schmid-Bindert, G. KRAS-Mutant non-small cell lung cancer: From biology to therapy. Lung Cancer 2018, 124, 53–64. [Google Scholar] [CrossRef] [Green Version]
- Tan, S.; Sun, D.; Pu, W.; Gou, Q.; Guo, C.; Gong, Y.; Li, J.; Wei, Y.Q.; Liu, L.; Zhao, Y.; et al. Circular RNA F-circEA-2a derived from EML4-ALK fusion gene promotes cell migration and invasion in non-small cell lung cancer. Mol. Cancer 2018, 17, 138. [Google Scholar] [CrossRef] [Green Version]
- Chuang, J.C.; Stehr, H.; Liang, Y.; Das, M.; Huang, J.; Diehn, M.; Wakelee, H.A.; Neal, J.W. ERBB2-Mutated Metastatic Non-Small Cell Lung Cancer: Response and Resistance to Targeted Therapies. J. Thorac. Oncol. 2017, 12, 833–842. [Google Scholar] [CrossRef] [Green Version]
- Leonetti, A.; Facchinetti, F.; Rossi, G.; Minari, R.; Conti, A.; Friboulet, L.; Tiseo, M.; Planchard, D. BRAF in non-small cell lung cancer (NSCLC): Pickaxing another brick in the wall. Cancer Treat. Rev. 2018, 66, 82–94. [Google Scholar] [CrossRef]
- Jing, C.; Mao, X.; Wang, Z.; Sun, K.; Ma, R.; Wu, J.; Cao, H. Next-generation sequencing-based detection of EGFR, KRAS, BRAF, NRAS, PIK3CA, Her-2 and TP53 mutations in patients with non-small cell lung cancer. Mol. Med. Rep. 2018, 18, 2191–2197. [Google Scholar] [CrossRef] [PubMed]
- Su, Z.; Wang, Z.; Ni, X.; Duan, J.; Gao, Y.; Zhuo, M.; Li, R.; Zhao, J.; Ma, Q.; Bai, H.; et al. Inferring the Evolution and Progression of Small-Cell Lung Cancer by Single-Cell Sequencing of Circulating Tumor Cells. Clin. Cancer Res. 2019, 25, 5049–5060. [Google Scholar] [CrossRef]
- Guo, X.; Zhang, Y.; Zheng, L.; Zheng, C.; Song, J.; Zhang, Q.; Kang, B.; Liu, Z.; Jin, L.; Xing, R.; et al. Global characterization of T cells in non-small-cell lung cancer by single-cell sequencing. Nat. Med. 2018, 24, 978–985. [Google Scholar] [CrossRef]
- Hwang, B.; Lee, J.H.; Bang, D. Single-cell RNA sequencing technologies and bioinformatics pipelines. Exp. Mol. Med. 2018, 50, 1–14. [Google Scholar] [CrossRef] [PubMed] [Green Version]
- Kim, N.; Kim, H.K.; Lee, K.; Hong, Y.; Cho, J.H.; Choi, J.W.; Lee, J.I.; Suh, Y.L.; Ku, B.M.; Eum, H.H.; et al. Single-cell RNA sequencing demonstrates the molecular and cellular reprogramming of metastatic lung adenocarcinoma. Nat. Commun. 2020, 11, 2285. [Google Scholar] [CrossRef]
- Kursa, M.B.; Rudnicki, W.R. Feature selection with the Boruta package. J. Stat. Softw. 2010, 36, 1–13. [Google Scholar] [CrossRef] [Green Version]
- Breiman, L. Random forests. Mach. Learn. 2001, 45, 5–32. [Google Scholar] [CrossRef] [Green Version]
- Peng, H.; Fulmi, L.; Ding, C. Feature selection based on mutual information criteria of max-dependency, max-relevance, and min-redundancy. IEEE Trans. Pattern Anal. Mach. Intell. 2005, 27, 1226–1238. [Google Scholar] [CrossRef] [PubMed]
- Liu, H.A.; Setiono, R. Incremental feature selection. Appl. Intell. 1998, 9, 217–230. [Google Scholar] [CrossRef]
- Chawla, N.V.; Bowyer, K.W.; Hall, L.O.; Kegelmeyer, W.P. SMOTE: Synthetic minority over-sampling technique. J. Artif. Intell. Res. 2002, 16, 321–357. [Google Scholar] [CrossRef]
- Frank, E.; Hall, M.; Trigg, L.; Holmes, G.; Witten, I.H. Data mining in bioinformatics using Weka. Bioinformatics 2004, 20, 2479–2481. [Google Scholar] [CrossRef] [Green Version]
- Safavian, S.R.; Landgrebe, D. A survey of decision tree classifier methodology. IEEE Trans. Syst. Man Cybern. 1991, 21, 660–674. [Google Scholar] [CrossRef] [Green Version]
- Kohavi, R. A study of cross-validation and bootstrap for accuracy estimation and model selection. In Proceedings of the International Joint Conference on Artificial Intelligence, Montreal, QB, Canada, 20–25 August 1995; pp. 1137–1145. [Google Scholar]
- Zhang, Y.-H.; Zeng, T.; Chen, L.; Huang, T.; Cai, Y.-D. Detecting the multiomics signatures of factor-specific inflammatory effects on airway smooth muscles. Front. Genet. 2021, 11, 599970. [Google Scholar] [CrossRef] [PubMed]
- Zhang, Y.-H.; Li, H.; Zeng, T.; Chen, L.; Li, Z.; Huang, T.; Cai, Y.-D. Identifying transcriptomic signatures and rules for SARS-CoV-2 infection. Front. Cell Dev. Biol. 2021, 8, 627302. [Google Scholar] [CrossRef]
- Chen, L.; Wang, S.; Zhang, Y.-H.; Li, J.; Xing, Z.-H.; Yang, J.; Huang, T.; Cai, Y.-D. Identify key sequence features to improve CRISPR sgRNA efficacy. IEEE Access 2017, 5, 26582–26590. [Google Scholar] [CrossRef]
- Zhang, Y.-H.; Zeng, T.; Chen, L.; Huang, T.; Cai, Y.-D. Determining protein–protein functional associations by functional rules based on gene ontology and KEGG pathway. Biochim. Biophys. Acta (BBA) Proteins Proteom. 2021, 1869, 140621. [Google Scholar] [CrossRef]
- Gorodkin, J. Comparing two K-category assignments by a K-category correlation coefficient. Comput. Biol. Chem. 2004, 28, 367–374. [Google Scholar] [CrossRef]
- Matthews, B. Comparison of the predicted and observed secondary structure of T4 phage lysozyme. Biochim. Biophys. Acta (BBA) Protein Struct. 1975, 405, 442–451. [Google Scholar] [CrossRef]
- Kettunen, E.; Anttila, S.; Seppänen, J.K.; Karjalainen, A.; Edgren, H.; Lindström, I.; Salovaara, R.; Nissén, A.M.; Salo, J.; Mattson, K.; et al. Differentially expressed genes in nonsmall cell lung cancer: Expression profiling of cancer-related genes in squamous cell lung cancer. Cancer Genet. Cytogenet. 2004, 149, 98–106. [Google Scholar] [CrossRef]
- Qu, Y.; Cheng, B.; Shao, N.; Jia, Y.; Song, Q.; Tan, B.; Wang, J. Prognostic value of immune-related genes in the tumor microenvironment of lung adenocarcinoma and lung squamous cell carcinoma. Aging 2020, 12, 4757–4777. [Google Scholar] [CrossRef]
- Samten, B. CD52 as both a marker and an effector molecule of T cells with regulatory action: Identification of novel regulatory T cells. Cell Mol. Immunol. 2013, 10, 456–458. [Google Scholar] [CrossRef] [Green Version]
- Zhang, Y.; Wang, H.; Wang, J.; Bao, L.; Wang, L.; Huo, J.; Wang, X. Global analysis of chromosome 1 genes among patients with lung adenocarcinoma, squamous carcinoma, large-cell carcinoma, small-cell carcinoma, or non-cancer. Cancer Metastasis Rev. 2015, 34, 249–264. [Google Scholar] [CrossRef]
- Ohno, H.; Aoe, T.; Taki, S.; Kitamura, D.; Ishida, Y.; Rajewsky, K.; Saito, T. Developmental and functional impairment of T cells in mice lacking CD3 zeta chains. Embo. J. 1993, 12, 4357–4366. [Google Scholar] [CrossRef] [PubMed]
- McLachlan, S.M.; Prummel, M.F.; Rapoport, B. Cell-mediated or humoral immunity in Graves’ ophthalmopathy? Profiles of T-cell cytokines amplified by polymerase chain reaction from orbital tissue. J. Clin. Endocrinol. Metab. 1994, 78, 1070–1074. [Google Scholar] [CrossRef] [PubMed]
- Venner, J.M.; Famulski, K.S.; Badr, D.; Hidalgo, L.G.; Chang, J.; Halloran, P.F. Molecular landscape of T cell-mediated rejection in human kidney transplants: Prominence of CTLA4 and PD ligands. Am. J. Transplant. 2014, 14, 2565–2576. [Google Scholar] [CrossRef] [PubMed] [Green Version]
- Prat, A.; Navarro, A.; Paré, L.; Reguart, N.; Galván, P.; Pascual, T.; Martínez, A.; Nuciforo, P.; Comerma, L.; Alos, L.; et al. Immune-Related Gene Expression Profiling After PD-1 Blockade in Non-Small Cell Lung Carcinoma, Head and Neck Squamous Cell Carcinoma, and Melanoma. Cancer Res. 2017, 77, 3540–3550. [Google Scholar] [CrossRef] [PubMed] [Green Version]
- Patel, A.J.; Richter, A.; Drayson, M.T.; Middleton, G.W. The role of B lymphocytes in the immuno-biology of non-small-cell lung cancer. Cancer Immunol. Immunother. 2020, 69, 325–342. [Google Scholar] [CrossRef] [Green Version]
- Knobeloch, K.P.; Wright, M.D.; Ochsenbein, A.F.; Liesenfeld, O.; Löhler, J.; Zinkernagel, R.M.; Horak, I.; Orinska, Z. Targeted inactivation of the tetraspanin CD37 impairs T-cell-dependent B-cell response under suboptimal costimulatory conditions. Mol. Cell. Biol. 2000, 20, 5363–5369. [Google Scholar] [CrossRef] [Green Version]
- Navab, R.; Strumpf, D.; Bandarchi, B.; Zhu, C.Q.; Pintilie, M.; Ramnarine, V.R.; Ibrahimov, E.; Radulovich, N.; Leung, L.; Barczyk, M.; et al. Prognostic gene-expression signature of carcinoma-associated fibroblasts in non-small cell lung cancer. Proc. Natl. Acad. Sci. USA 2011, 108, 7160–7165. [Google Scholar] [CrossRef] [Green Version]
- Dohm, A.; Su, J.; McTyre, E.R.; Taylor, J.M.; Miller, L.D.; Petty, W.J.; Xing, F.; Lo, H.W.; Metheny-Barlow, L.J.; O’Neill, S.; et al. Identification of CD37, cystatin A, and IL-23A gene expression in association with brain metastasis: Analysis of a prospective trial. Int. J. Biol. Markers 2019, 34, 90–97. [Google Scholar] [CrossRef]
- Brown, P.J.; Wong, K.K.; Felce, S.L.; Lyne, L.; Spearman, H.; Soilleux, E.J.; Pedersen, L.M.; Møller, M.B.; Green, T.M.; Gascoyne, D.M.; et al. FOXP1 suppresses immune response signatures and MHC class II expression in activated B-cell-like diffuse large B-cell lymphomas. Leukemia 2016, 30, 605–616. [Google Scholar] [CrossRef] [Green Version]
- Yunhui, L.I.; Na, R.E.N. Screening of tumor microenvironment-related prognostic genes in breast cancer by data mining. Res. Sq. 2021. [Google Scholar] [CrossRef] [Green Version]
- Xu, H.; Zheng, S.G.; Fox, D. Editorial: Immunomodulatory Functions of Fibroblast-like Synoviocytes in Joint Inflammation and Destruction during Rheumatoid Arthritis. Front. Immunol. 2020, 11, 955. [Google Scholar] [CrossRef]
- Tang, X.; Lu, W.; Zhang, J.; Berhens, C.; Parra, E.R.; Wineman, J.; Zhang, J.; Gibbons, D.L.; Koeppel, M.; Kerns, B.J.; et al. Gene expression difference (GED) revealed immune function gene down-regulation as tumor-associated inflammatory cell (TAIC) infiltration in microenvironment in non-small cell lung cancer. In Proceedings of the AACR Annual Meeting 2018, Chicago, IL, USA, 14–18 April 2018. [Google Scholar]
- Wernersson, S.; Pejler, G. Mast cell secretory granules: Armed for battle. Nat. Rev. Immunol 2014, 14, 478–494. [Google Scholar] [CrossRef]
- Hao, J.; Wang, K.; Yue, Y.; Tian, T.; Xu, A.; Hao, J.; Xiao, X.; He, D. Selective expression of S100A11 in lung cancer and its role in regulating proliferation of adenocarcinomas cells. Mol. Cell Biochem. 2012, 359, 323–332. [Google Scholar] [CrossRef]
- Crack, P.J.; Taylor, J.M.; Flentjar, N.J.; de Haan, J.; Hertzog, P.; Iannello, R.C.; Kola, I. Increased infarct size and exacerbated apoptosis in the glutathione peroxidase-1 (Gpx-1) knockout mouse brain in response to ischemia/reperfusion injury. J. Neurochem 2001, 78, 1389–1399. [Google Scholar] [CrossRef] [PubMed]
- Tsuboi, N.; Asano, K.; Lauterbach, M.; Mayadas, T.N. Human neutrophil Fcgamma receptors initiate and play specialized nonredundant roles in antibody-mediated inflammatory diseases. Immunity 2008, 28, 833–846. [Google Scholar] [CrossRef] [Green Version]
- Taketomi, Y.; Ueno, N.; Kojima, T.; Sato, H.; Murase, R.; Yamamoto, K.; Tanaka, S.; Sakanaka, M.; Nakamura, M.; Nishito, Y.; et al. Mast cell maturation is driven via a group III phospholipase A2-prostaglandin D2-DP1 receptor paracrine axis. Nat. Immunol 2013, 14, 554–563. [Google Scholar] [CrossRef] [PubMed]
- Sinniah, A. Annexin A1 as an endogenous regulator of mast cell degranulation. Front Pharmacol. 2019, 10, 1313. [Google Scholar] [CrossRef] [Green Version]
- Yu, M.; Eckart, M.R.; Morgan, A.A.; Mukai, K.; Butte, A.J.; Tsai, M.; Galli, S.J. Identification of an IFN-γ/mast cell axis in a mouse model of chronic asthma. J. Clin. Investig. 2011, 121, 3133–3143. [Google Scholar] [CrossRef] [Green Version]
- Huang, Y.; Xu, C.; Wang, W.; Zhang, Q.; Zhuang, W.; Zhu, Y.; Huang, Y.; Chen, G.; Fang, M.; Lv, T.; et al. EP1.03-28 Frequency and Molecular Characteristics of BRCA1 Mutations in Non-Small Cell Lung Cancer from East Asian Patients. J. Thorac. Oncol. 2019, 14, S963–S964. [Google Scholar] [CrossRef]
- Takata, K.; Uchida, K.; Mukai, M.; Takano, S.; Aikawa, J.; Iwase, D.; Sekiguchi, H.; Miyagi, M.; Inoue, G.; Takaso, M. Increase in Tryptase and Its Role in the Synovial Membrane of Overweight and Obese Patients with Osteoarthritis of the Knee. Diabetes Metab. Syndr. Obes. 2020, 13, 1491–1497. [Google Scholar] [CrossRef] [PubMed]
- Calder, E.A.; Urbaniak, S.J.; Irvine, W.J.; James, K. The effect of anti-alpha2-macroglobulin on K-cell cytolysis and T- and B-cell rosette formation. Clin. Exp. Immunol. 1975, 22, 112–120. [Google Scholar] [PubMed]
- Kiss, T.; Nyúl-Tóth, Á.; Balasubramanian, P.; Tarantini, S.; Ahire, C.; DelFavero, J.; Yabluchanskiy, A.; Csipo, T.; Farkas, E.; Wiley, G.; et al. Single-cell RNA sequencing identifies senescent cerebromicrovascular endothelial cells in the aged mouse brain. Geroscience 2020, 42, 429–444. [Google Scholar] [CrossRef]
- Uchida, T.; Baba, A.; Pérez-Martínez, F.J.; Hibi, T.; Miyata, T.; Luque, J.M.; Nakajima, K.; Hattori, M. Downregulation of functional Reelin receptors in projection neurons implies that primary Reelin action occurs at early/premigratory stages. J. Neurosci. 2009, 29, 10653–10662. [Google Scholar] [CrossRef] [Green Version]
- Guillot, L.; Carré, A.; Szinnai, G.; Castanet, M.; Tron, E.; Jaubert, F.; Broutin, I.; Counil, F.; Feldmann, D.; Clement, A.; et al. NKX2-1 mutations leading to surfactant protein promoter dysregulation cause interstitial lung disease in “Brain-Lung-Thyroid Syndrome”. Hum. Mutat. 2010, 31, E1146–E1162. [Google Scholar] [CrossRef]
- Rudich, N.; Dekel, O.; Sagi-Eisenberg, R. Down-regulation of the A3 adenosine receptor in human mast cells upregulates mediators of angiogenesis and remodeling. Mol. Immunol. 2015, 65, 25–33. [Google Scholar] [CrossRef]
- Zhao, Z.Z.; Savage, N.W.; Sugerman, P.B.; Walsh, L.J. Mast cell/T cell interactions in oral lichen planus. J. Oral Pathol. Med. 2002, 31, 189–195. [Google Scholar] [CrossRef]
- Corrales, J.J.; López, A.; Ciudad, J.; Mories, M.T.; Miralles, J.M.; Orfao, A. Methimazole therapy in Graves’ disease influences the abnormal expression of CD69 (early activation antigen) on T cells. J. Endocrinol. 1997, 155, 491–500. [Google Scholar] [CrossRef] [PubMed] [Green Version]
- Yano, S.; Kakiuchi, S.; Zhang, H.; Sone, S. Organotropism of Lung Cancer Metastasis and Its Molecular Targeted Therapy. In Integration/Interaction of Oncologic Growth; Springer: Dordrecht, The Netherlands, 2005; pp. 387–405. [Google Scholar]
- Ganea, D.; Teodorescu, A.; Dray, S.; Teodorescu, M. Polyclonal B-cell activator with esterolytic activity and polyclonal gammopathy induced by allogeneic cells in rabbits. Immunology 1982, 45, 227–237. [Google Scholar]
- Gottschling, S.; Jauch, A.; Kuner, R.; Herpel, E.; Mueller-Decker, K.; Schnabel, P.A.; Xu, E.C.; Muley, T.; Sültmann, H.; Bender, C.; et al. Establishment and comparative characterization of novel squamous cell non-small cell lung cancer cell lines and their corresponding tumor tissue. Lung Cancer 2012, 75, 45–57. [Google Scholar] [CrossRef]
- Tomasello, E.; Desmoulins, P.O.; Chemin, K.; Guia, S.; Cremer, H.; Ortaldo, J.; Love, P.; Kaiserlian, D.; Vivier, E. Combined natural killer cell and dendritic cell functional deficiency in KARAP/DAP12 loss-of-function mutant mice. Immunity 2000, 13, 355–364. [Google Scholar] [CrossRef] [Green Version]
- Persons, D.A.; Allay, J.A.; Riberdy, J.M.; Wersto, R.P.; Donahue, R.E.; Sorrentino, B.P.; Nienhuis, A.W. Use of the green fluorescent protein as a marker to identify and track genetically modified hematopoietic cells. Nat. Med. 1998, 4, 1201–1205. [Google Scholar] [CrossRef] [PubMed]
- Thomas, R.; Smith, K.C.; Gould, R.; Gower, S.M.; Binns, M.M.; Breen, M. Molecular cytogenetic analysis of a novel high-grade canine T-lymphoblastic lymphoma demonstrating co-expression of CD3 and CD79a cell markers. Chromosome Res. 2001, 9, 649–657. [Google Scholar] [CrossRef]
- Floristán, A.; Morales, L.; Hanniford, D.; Martinez, C.; Castellano-Sanz, E.; Dolgalev, I.; Ulloa-Morales, A.; Vega-Saenz de Miera, E.; Moran, U.; Darvishian, F.; et al. Functional analysis of RPS27 mutations and expression in melanoma. Pigment. Cell Melanoma Res. 2020, 33, 466–479. [Google Scholar] [CrossRef]
- Travaglini, K.J.; Nabhan, A.N.; Penland, L.; Sinha, R.; Gillich, A.; Sit, R.V.; Chang, S.; Conley, S.D.; Mori, Y.; Seita, J.; et al. A molecular cell atlas of the human lung from single-cell RNA sequencing. Nature 2020, 587, 619–625. [Google Scholar] [CrossRef] [PubMed]
- Bronte, V. Myeloid-derived suppressor cells in inflammation: Uncovering cell subsets with enhanced immunosuppressive functions. Eur. J. Immunol. 2009, 39, 2670–2672. [Google Scholar] [CrossRef]
- Zheng, W.; Jiang, C.; Li, R. Integrin and gene network analysis reveals that ITGA5 and ITGB1 are prognostic in non-small-cell lung cancer. Onco Targets Ther. 2016, 9, 2317–2327. [Google Scholar] [CrossRef] [Green Version]
- Ma, J.; Zheng, J.; Li, Y.; Zhang, S.; Bai, D.; Zou, H.; Han, C. CXCL12 induces lung cancer cell migration by polarized mtDNA redistribution. Hum. Cell 2014, 27, 22–28. [Google Scholar] [CrossRef] [PubMed]
- Li, B.; Meng, Y.Q.; Li, Z.; Yin, C.; Lin, J.P.; Zhu, D.J.; Zhang, S.B. MiR-629-3p-induced downregulation of SFTPC promotes cell proliferation and predicts poor survival in lung adenocarcinoma. Artif. Cells Nanomed. Biotechnol. 2019, 47, 3286–3296. [Google Scholar] [CrossRef] [Green Version]
- Mercier, I.; Casimiro, M.C.; Wang, C.; Rosenberg, A.L.; Quong, J.; Minkeu, A.; Allen, K.G.; Danilo, C.; Sotgia, F.; Bonuccelli, G.; et al. Human breast cancer-associated fibroblasts (CAFs) show caveolin-1 downregulation and RB tumor suppressor functional inactivation: Implications for the response to hormonal therapy. Cancer Biol. Ther. 2008, 7, 1212–1225. [Google Scholar] [CrossRef] [Green Version]
- Ito, T.K.; Ishii, G.; Chiba, H.; Ochiai, A. The VEGF angiogenic switch of fibroblasts is regulated by MMP-7 from cancer cells. Oncogene 2007, 26, 7194–7203. [Google Scholar] [CrossRef] [PubMed] [Green Version]
- Melhem, A.; Muhanna, N.; Bishara, A.; Alvarez, C.E.; Ilan, Y.; Bishara, T.; Horani, A.; Nassar, M.; Friedman, S.L.; Safadi, R. Anti-fibrotic activity of NK cells in experimental liver injury through killing of activated HSC. J. Hepatol. 2006, 45, 60–71. [Google Scholar] [CrossRef]
- Pan, J.; Chen, H.Q.; Sun, Y.H.; Zhang, J.H.; Luo, X.Y. Comparative proteomic analysis of non-small-cell lung cancer and normal controls using serum label-free quantitative shotgun technology. Lung 2008, 186, 255–261. [Google Scholar] [CrossRef] [PubMed]
- Wimmel, A.; Glitz, D.; Kraus, A.; Roeder, J.; Schuermann, M. Axl receptor tyrosine kinase expression in human lung cancer cell lines correlates with cellular adhesion. Eur. J. Cancer 2001, 37, 2264–2274. [Google Scholar] [CrossRef]
- Enewold, L.; Mechanic, L.E.; Bowman, E.D.; Platz, E.A.; Alberg, A.J. SERPINA1 and ELA2 polymorphisms are not associated with COPD or lung cancer. Anticancer. Res. 2012, 32, 3923–3928. [Google Scholar] [PubMed]
- Schliekelman, M.J.; Creighton, C.J.; Baird, B.N.; Chen, Y.; Banerjee, P.; Bota-Rabassedas, N.; Ahn, Y.H.; Roybal, J.D.; Chen, F.; Zhang, Y.; et al. Thy-1(+) Cancer-associated Fibroblasts Adversely Impact Lung Cancer Prognosis. Sci. Rep. 2017, 7, 6478. [Google Scholar] [CrossRef]
- Wang, C.; Chen, H.; Zhu, W.; Xu, Y.; Liu, M.; Zhu, L.; Yang, F.; Zhang, L.; Liu, X.; Zhong, Z.; et al. Nicotine Accelerates Atherosclerosis in Apolipoprotein E-Deficient Mice by Activating α7 Nicotinic Acetylcholine Receptor on Mast Cells. Arterioscler. Thromb. Vasc. Biol. 2017, 37, 53–65. [Google Scholar] [CrossRef] [PubMed] [Green Version]
- Lim, S.Y.; Yuzhalin, A.E.; Gordon-Weeks, A.N.; Muschel, R.J. Tumor-infiltrating monocytes/macrophages promote tumor invasion and migration by upregulating S100A8 and S100A9 expression in cancer cells. Oncogene 2016, 35, 5735–5745. [Google Scholar] [CrossRef] [Green Version]
- Mehta, A.; Dobersch, S.; Romero-Olmedo, A.J.; Barreto, G. Epigenetics in lung cancer diagnosis and therapy. Cancer Metastasis Rev. 2015, 34, 229–241. [Google Scholar] [CrossRef] [PubMed]
- Sun, X.; Su, S.; Zhang, G.; Zhang, H.; Yu, X. MiR-204 suppresses cell proliferation and promotes apoptosis in ovarian granulosa cells via targeting TPT1 in polycystic ovary syndrome. Biochem. Cell Biol. 2019, 97, 554–562. [Google Scholar] [CrossRef]
- Buenestado, A.; Grassin-Delyle, S.; Guitard, F.; Naline, E.; Faisy, C.; Israël-Biet, D.; Sage, E.; Bellamy, J.F.; Tenor, H.; Devillier, P. Roflumilast inhibits the release of chemokines and TNF-α from human lung macrophages stimulated with lipopolysaccharide. Br. J. Pharmacol. 2012, 165, 1877–1890. [Google Scholar] [CrossRef] [Green Version]
- Rodríguez-Piñeiro, A.M.; Blanco-Prieto, S.; Sánchez-Otero, N.; Rodríguez-Berrocal, F.J.; de la Cadena, M.P. On the identification of biomarkers for non-small cell lung cancer in serum and pleural effusion. J. Proteom. 2010, 73, 1511–1522. [Google Scholar] [CrossRef]
- Wu, H.; Haag, D.; Muley, T.; Warth, A.; Zapatka, M.; Toedt, G.; Pscherer, A.; Hahn, M.; Rieker, R.J.; Wachter, D.L.; et al. Tumor-microenvironment interactions studied by zonal transcriptional profiling of squamous cell lung carcinoma. Genes Chromosomes Cancer 2013, 52, 250–264. [Google Scholar] [CrossRef] [Green Version]
- Catacchio, I.; Scattone, A.; Silvestris, N.; Mangia, A. Immune Prophets of Lung Cancer: The Prognostic and Predictive Landscape of Cellular and Molecular Immune Markers. Transl. Oncol. 2018, 11, 825–835. [Google Scholar] [CrossRef]
- Salvi, S.; Semper, A.; Blomberg, A.; Holloway, J.; Jaffar, Z.; Papi, A.; Teran, L.; Polosa, R.; Kelly, F.; Sandström, T.; et al. Interleukin-5 production by human airway epithelial cells. Am. J. Respir Cell. Mol. Biol. 1999, 20, 984–991. [Google Scholar] [CrossRef]
- Angenard, G.; Merdrignac, A.; Louis, C.; Edeline, J.; Coulouarn, C. Expression of long non-coding RNA ANRIL predicts a poor prognosis in intrahepatic cholangiocarcinoma. Dig. Liver Dis. 2019, 51, 1337–1343. [Google Scholar] [CrossRef] [PubMed]
- Luo, S.S.; Liao, X.W.; Zhu, X.D. Genome-wide analysis to identify a novel microRNA signature that predicts survival in patients with stomach adenocarcinoma. J. Cancer 2019, 10, 6298–6313. [Google Scholar] [CrossRef] [PubMed]
- Morton, S.U.; Shimamura, A.; Newburger, P.E.; Opotowsky, A.R.; Quiat, D.; Pereira, A.C.; Jin, S.C.; Gurvitz, M.; Brueckner, M.; Chung, W.K.; et al. Association of Damaging Variants in Genes With Increased Cancer Risk Among Patients With Congenital Heart Disease. JAMA Cardiol. 2021, 6, 457–462. [Google Scholar] [CrossRef] [PubMed]
- Jiang, W.; Zhou, X.; Li, Z.; Liu, K.; Wang, W.; Tan, R.; Cong, X.; Shan, J.; Zhan, Y.; Cui, Z.; et al. Prolyl 4-hydroxylase 2 promotes B-cell lymphoma progression via hydroxylation of Carabin. Blood 2018, 131, 1325–1336. [Google Scholar] [CrossRef] [Green Version]
- Han, X.; Fink, M.P.; Uchiyama, T.; Yang, R.; Delude, R.L. Increased iNOS activity is essential for pulmonary epithelial tight junction dysfunction in endotoxemic mice. Am. J. Physiol Lung Cell Mol. Physiol 2004, 286, L259–L267. [Google Scholar] [CrossRef]
- Katoh, M. FGFR inhibitors: Effects on cancer cells, tumor microenvironment and whole-body homeostasis (Review). Int. J. Mol. Med. 2016, 38, 3–15. [Google Scholar] [CrossRef] [Green Version]
- Yuanhua, L.; Pudong, Q.; Wei, Z.; Yuan, W.; Delin, L.; Yan, Z.; Geyu, L.; Bo, S. TFAP2A Induced KRT16 as an Oncogene in Lung Adenocarcinoma via EMT. Int. J. Biol. Sci. 2019, 15, 1419–1428. [Google Scholar] [CrossRef]
- Kudinov, A.E.; Deneka, A.; Nikonova, A.S.; Beck, T.N.; Ahn, Y.H.; Liu, X.; Martinez, C.F.; Schultz, F.A.; Reynolds, S.; Yang, D.H.; et al. Musashi-2 (MSI2) supports TGF-β signaling and inhibits claudins to promote non-small cell lung cancer (NSCLC) metastasis. Proc. Natl. Acad. Sci. USA 2016, 113, 6955–6960. [Google Scholar] [CrossRef] [Green Version]
- Zhao, X.; Yan, X.; Liu, Y.; Zhang, P.; Ni, X. Co-expression of mouse TMEM63A, TMEM63B and TMEM63C confers hyperosmolarity activated ion currents in HEK293 cells. Cell Biochem. Funct. 2016, 34, 238–241. [Google Scholar] [CrossRef]
- Park, S.; Holmes-Tisch, A.J.; Cho, E.Y.; Shim, Y.M.; Kim, J.; Kim, H.S.; Lee, J.; Park, Y.H.; Ahn, J.S.; Park, K.; et al. Discordance of molecular biomarkers associated with epidermal growth factor receptor pathway between primary tumors and lymph node metastasis in non-small cell lung cancer. J. Thorac. Oncol. 2009, 4, 809–815. [Google Scholar] [CrossRef] [Green Version]
- Hu, R.; Hu, F.; Xie, X.; Wang, L.; Li, G.; Qiao, T.; Wang, M.; Xiao, H. TMEM45B, up-regulated in human lung cancer, enhances tumorigenicity of lung cancer cells. Tumor Biol. 2016, 37, 12181–12191. [Google Scholar] [CrossRef]
- Yoshimura, A.; Yamada, T.; Tsuji, T.; Hamashima, R.; Shiotsu, S.; Yuba, T.; Takumi, C.; Uchino, J.; Hiraoka, N.; Takayama, K. Prognostic impact of pleural effusion in EGFR-mutant non-small cell lung cancer patients without brain metastasis. Thorac. Cancer 2019, 10, 557–563. [Google Scholar] [CrossRef] [PubMed] [Green Version]
- Sears, C.R.; Mazzone, P.J. Biomarkers in Lung Cancer. Clin. Chest Med. 2020, 41, 115–127. [Google Scholar] [CrossRef] [PubMed]
- Hoseok, I.; Cho, J.Y. Lung Cancer Biomarkers. Adv. Clin. Chem. 2015, 72, 107–170. [Google Scholar] [CrossRef]
- Ho, M.Y.; Hung, S.W.; Liang, C.M.; Liang, S.M. Recombinant viral capsid protein VP1 suppresses lung cancer metastasis by inhibiting COX-2/PGE2 and MIG-7. Oncotarget 2014, 5, 3931–3943. [Google Scholar] [CrossRef] [PubMed] [Green Version]
- Stoff-Khalili, M.A.; Rivera, A.A.; Mathis, J.M.; Banerjee, N.S.; Moon, A.S.; Hess, A.; Rocconi, R.P.; Numnum, T.M.; Everts, M.; Chow, L.T.; et al. Mesenchymal stem cells as a vehicle for targeted delivery of CRAds to lung metastases of breast carcinoma. Breast Cancer Res. Treat. 2007, 105, 157–167. [Google Scholar] [CrossRef]
- Raykov, Z.; Balboni, G.; Aprahamian, M.; Rommelaere, J. Carrier cell-mediated delivery of oncolytic parvoviruses for targeting metastases. Int. J. Cancer 2004, 109, 742–749. [Google Scholar] [CrossRef]
- Wang, X.; Zhang, H.; Sapio, R.; Yang, J.; Wong, J.; Zhang, X.; Guo, J.Y.; Pine, S.; Van Remmen, H.; Li, H.; et al. SOD1 regulates ribosome biogenesis in KRAS mutant non-small cell lung cancer. Nat. Commun. 2021, 12, 2259. [Google Scholar] [CrossRef] [PubMed]
Figure 1.
Flow chart illustrating the entire procedures. The single-cell RNA sequencing data are retrieved from Gene Expression Omnibus, which are analyzed by Boruta and mRMR methods. A feature list is generated, and it is fed into incremental feature selection (IFS), incorporating several methods (decision tree, random forest, SMOTE, 10-fold cross-validation), to extract key biomarkers, optimized classifier, and quantitative rules.

Figure 2.
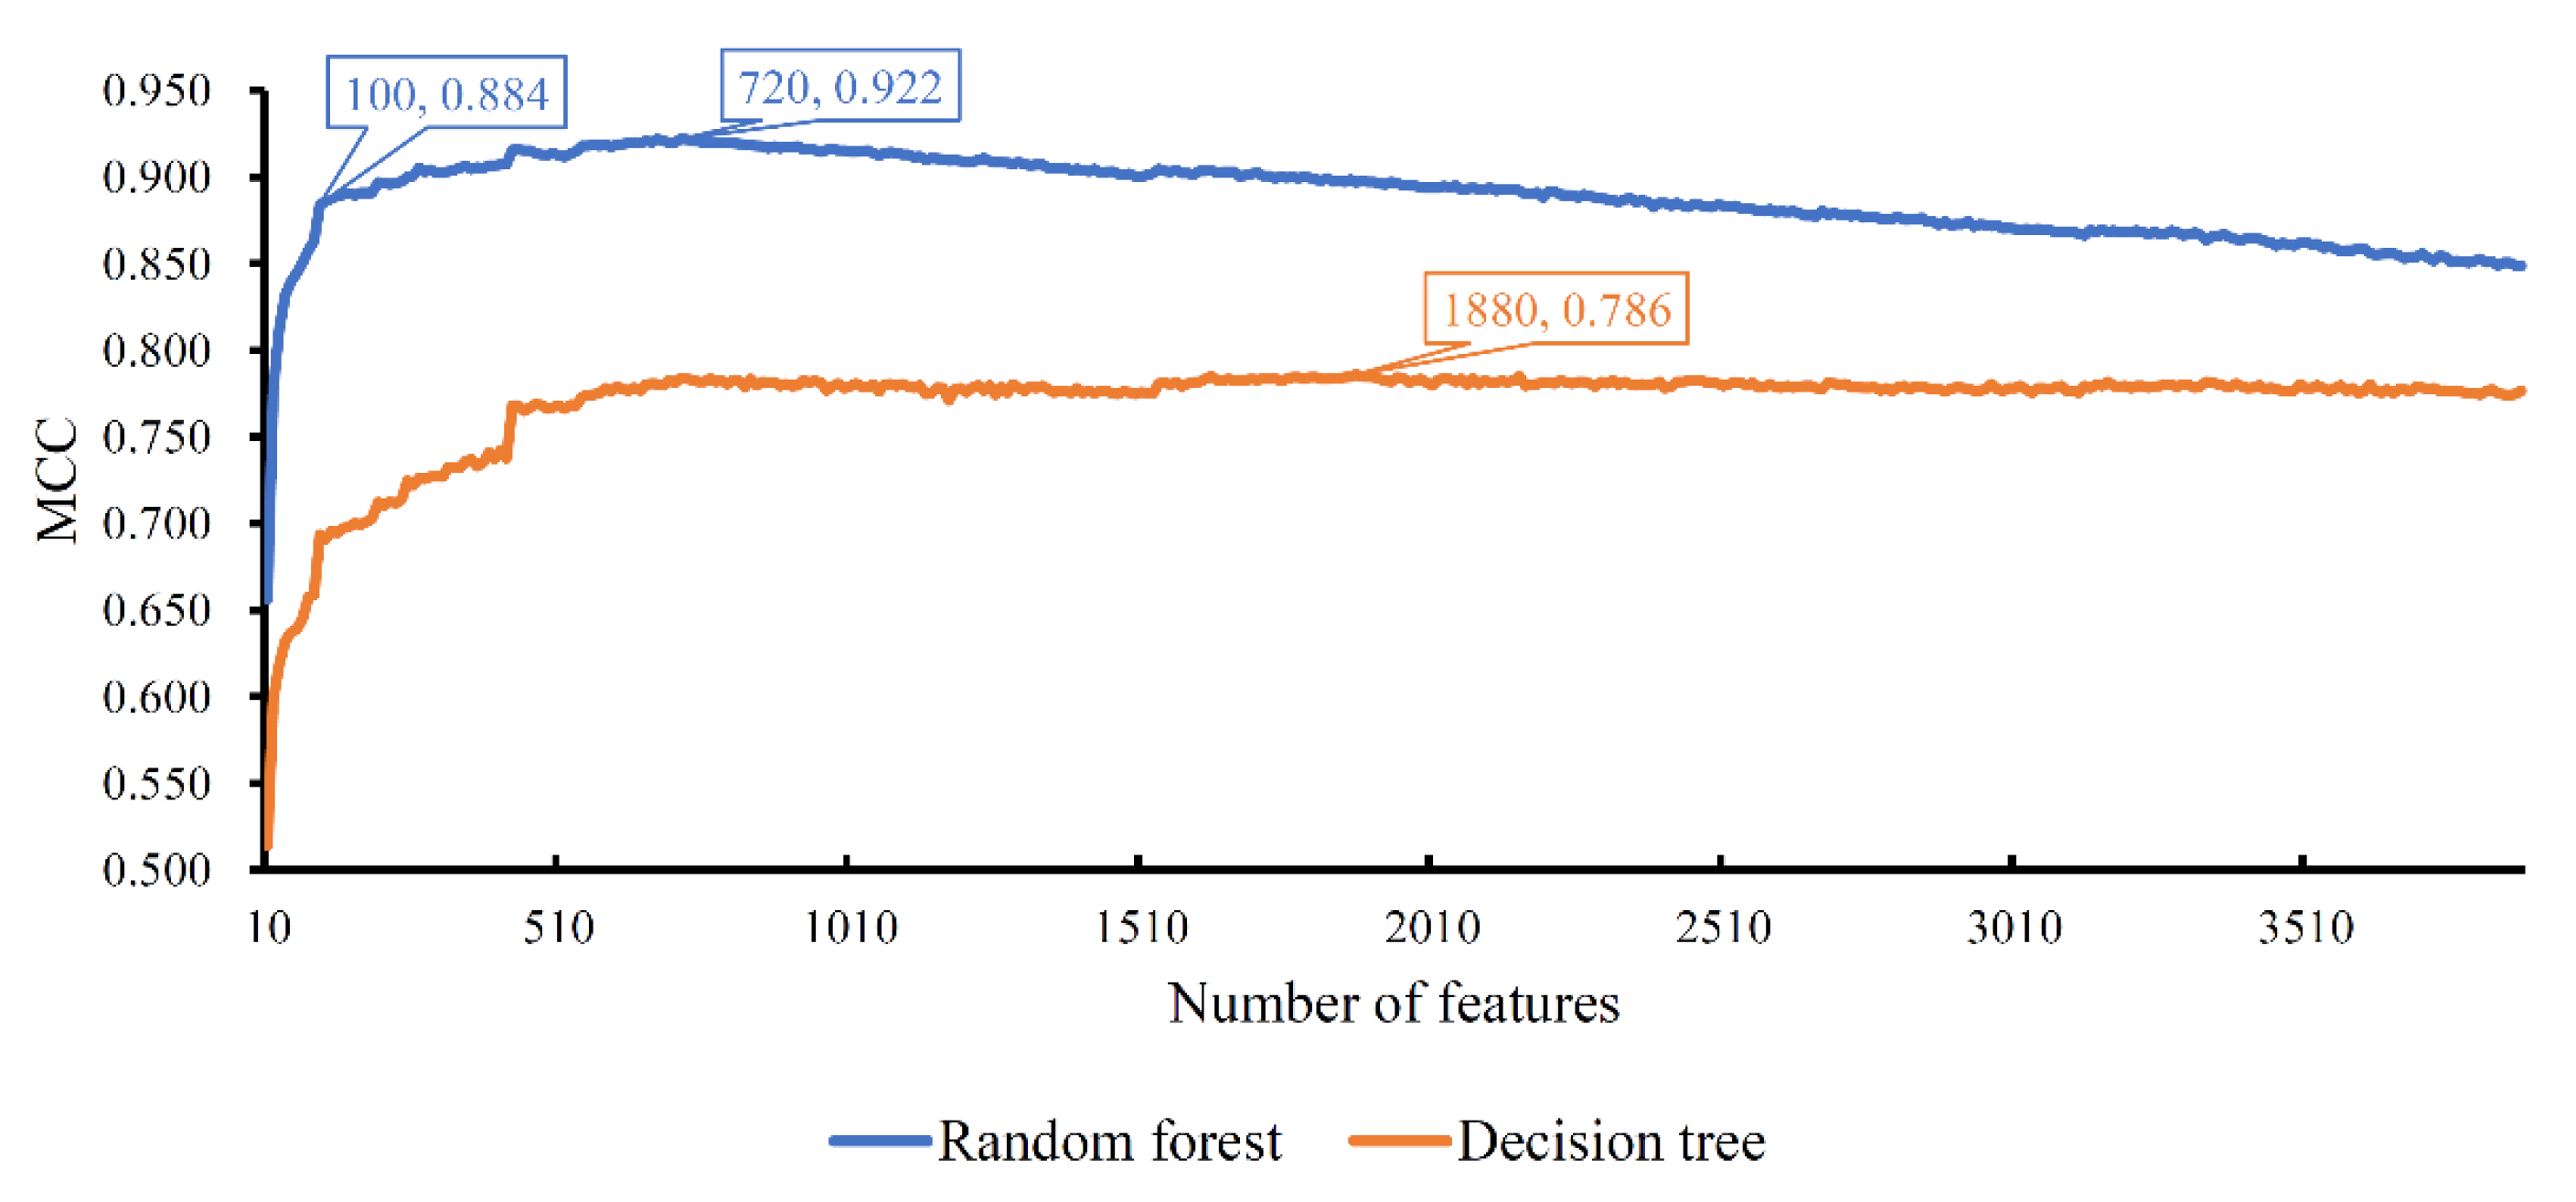
Curve of the incremental feature selection with different classification algorithms. Random forest yields the highest MCC (0.922) when top 720 features (genes) are used, whereas decision tree generates the highest MCC (0.786) when top 1880 features (genes) are adopted. Random forest with top 100 features (genes) also yields the high performance with MCC of 0.884, which can be a proper tool to identify cell types due to its higher efficiency compared with the random forest with top 720 features (genes).
Figure 2.
Curve of the incremental feature selection with different classification algorithms. Random forest yields the highest MCC (0.922) when top 720 features (genes) are used, whereas decision tree generates the highest MCC (0.786) when top 1880 features (genes) are adopted. Random forest with top 100 features (genes) also yields the high performance with MCC of 0.884, which can be a proper tool to identify cell types due to its higher efficiency compared with the random forest with top 720 features (genes).

Figure 3.
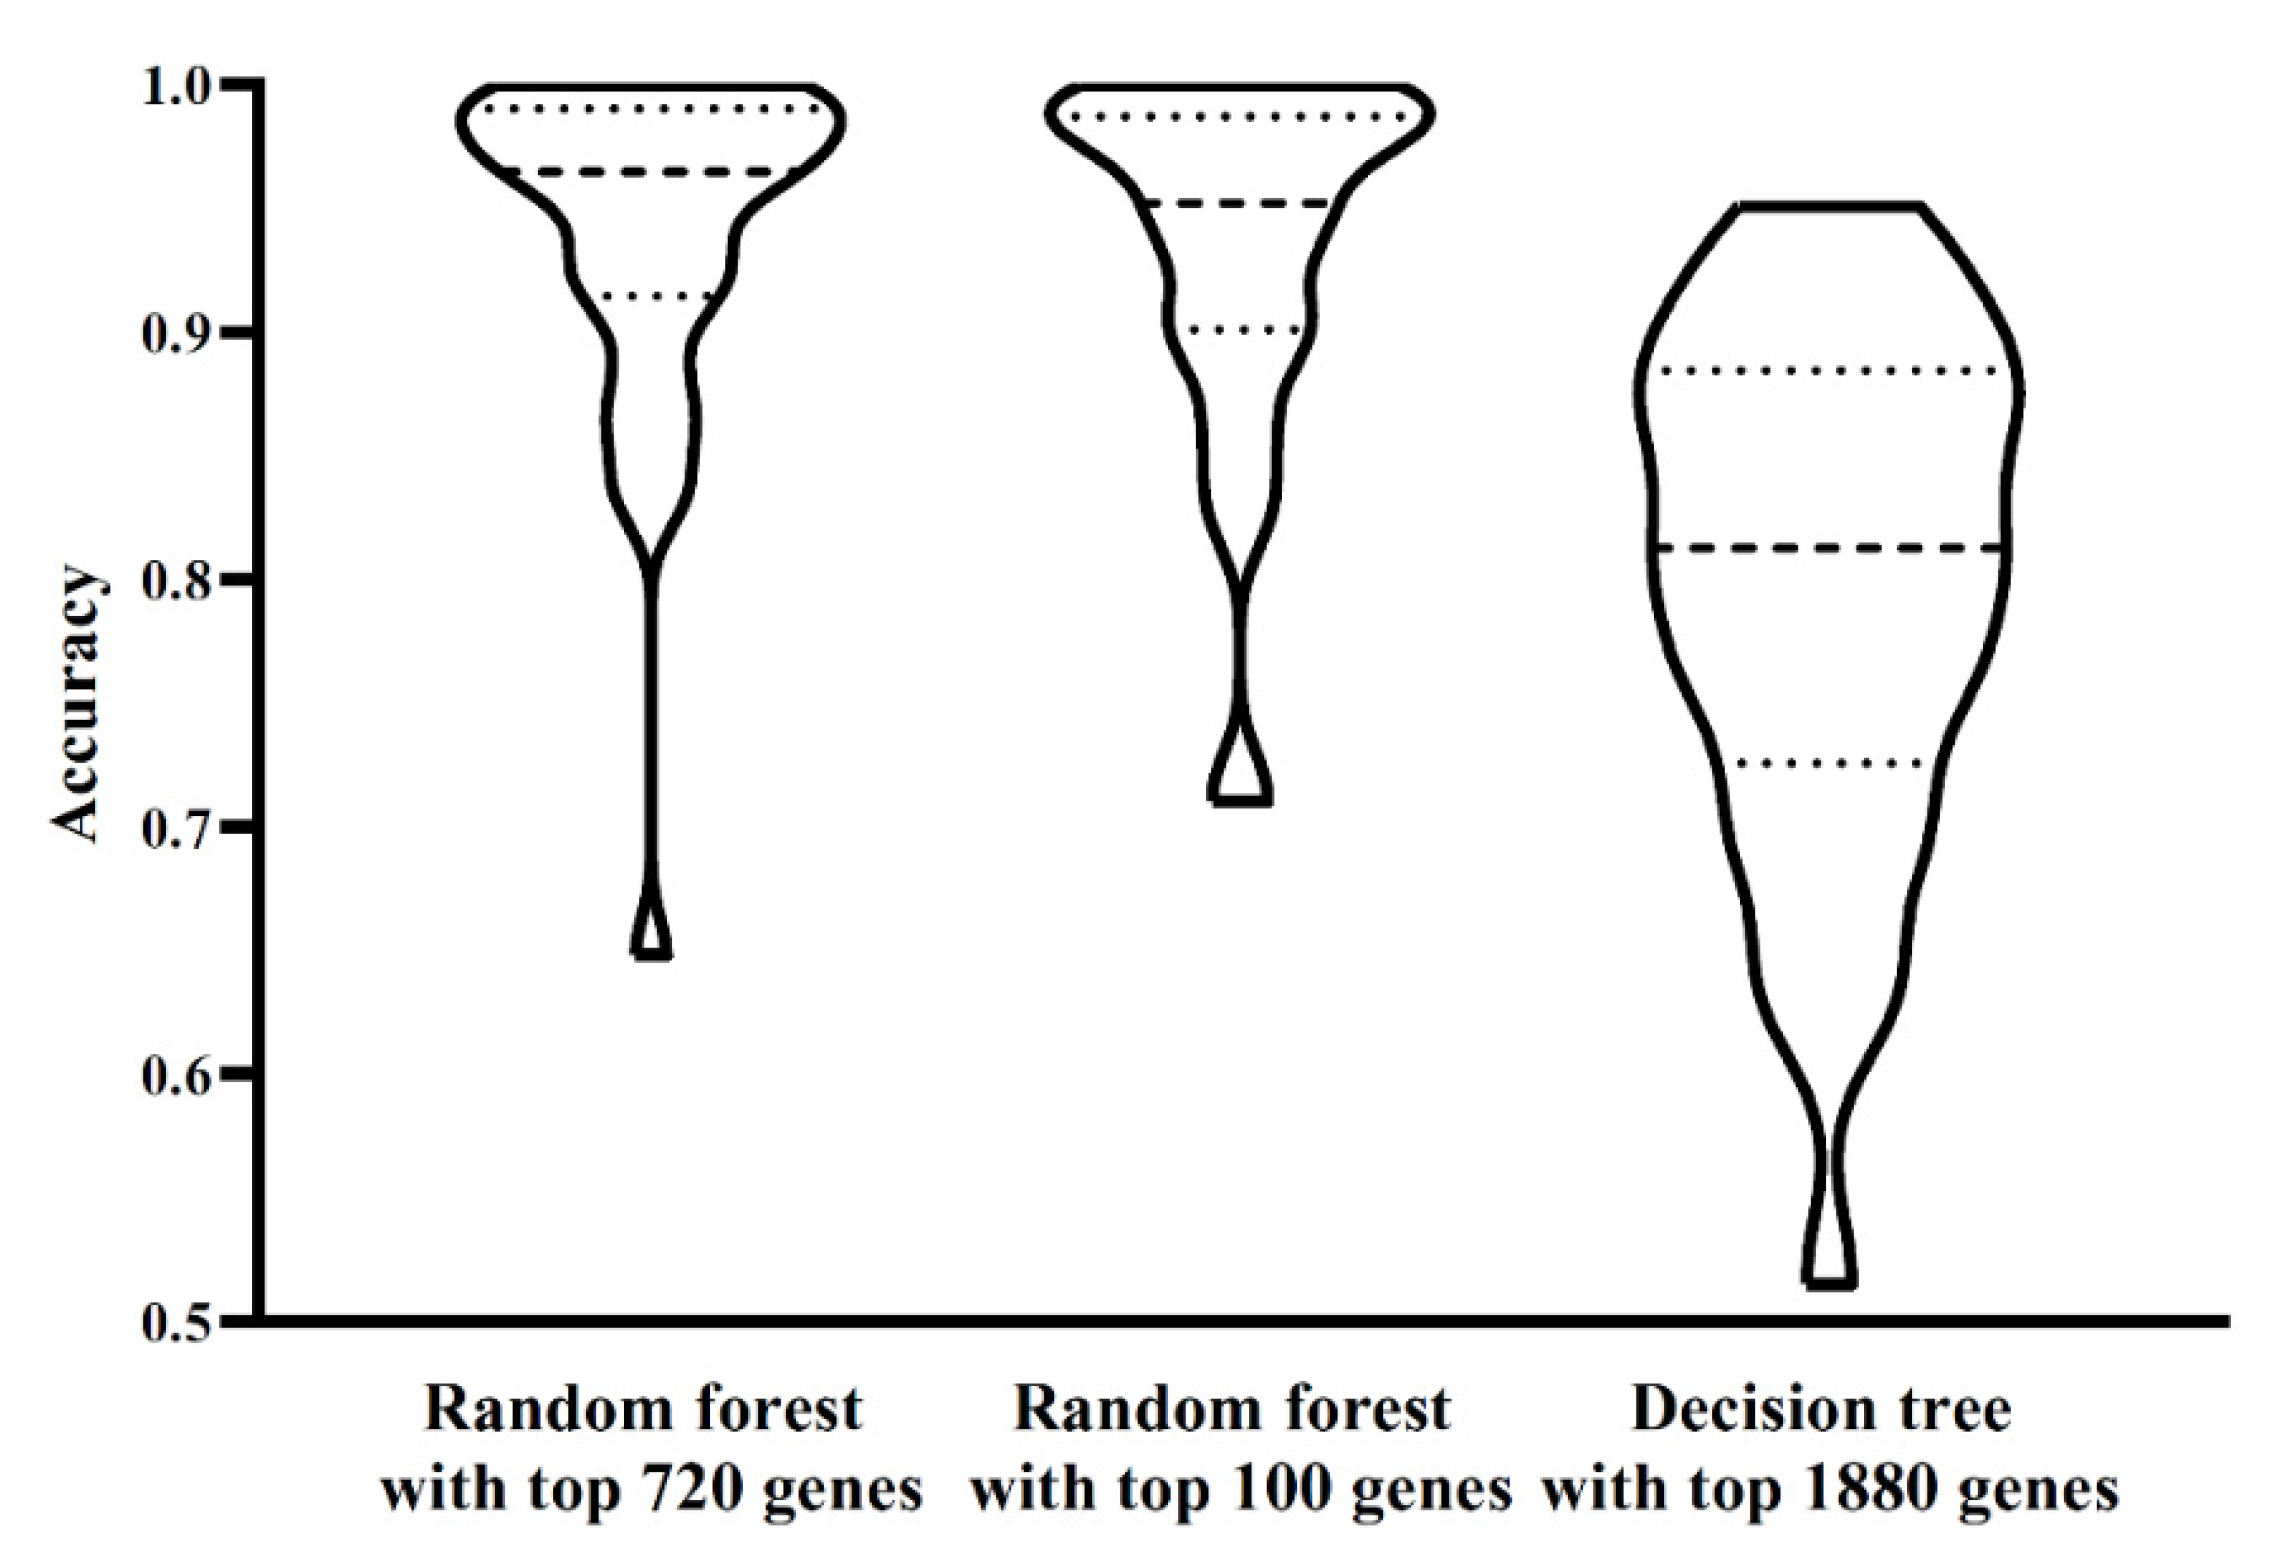
Performance of three classifiers on 32 cell types. The performance of two random forest classifiers is almost at the same level, whereas the decision tree classifier is inferior to two random forest classifiers.
Figure 3.
Performance of three classifiers on 32 cell types. The performance of two random forest classifiers is almost at the same level, whereas the decision tree classifier is inferior to two random forest classifiers.

Figure 4.
Gene ontology enrichment analysis on optimum genes. Fourteen gene ontology terms with p-value less than 0.001 are identified.
Figure 4.
Gene ontology enrichment analysis on optimum genes. Fourteen gene ontology terms with p-value less than 0.001 are identified.


Table 1.
The sample sizes of different cell types.
| Tag | Cell Types | Sample Size |
|---|---|---|
| Class 1 | mBrain B lymphocytes | 1311 |
| Class 2 | mBrain Endothelial cells | 159 |
| Class 3 | mBrain Epithelial cells | 15,463 |
| Class 4 | mBrain Fibroblasts | 444 |
| Class 5 | mBrain MAST cells | 508 |
| Class 6 | mBrain Myeloid cells | 5657 |
| Class 7 | mBrain T/NK cells | 2683 |
| Class 8 | mLN B lymphocytes | 6062 |
| Class 9 | mLN Epithelial cells | 3053 |
| Class 10 | mLN Myeloid cells | 5442 |
| Class 11 | mLN T/NK cells | 5069 |
| Class 12 | nLN B lymphocytes | 10,584 |
| Class 13 | nLN Myeloid cells | 1288 |
| Class 14 | nLN T/NK cells | 19,478 |
| Class 15 | nLung B lymphocytes | 634 |
| Class 16 | nLung Endothelial cells | 1295 |
| Class 17 | nLung Epithelial cells | 3703 |
| Class 18 | nLung Fibroblasts | 1585 |
| Class 19 | nLung MAST cells | 1079 |
| Class 20 | nLung Myeloid cells | 16,672 |
| Class 21 | nLung T/NK cells | 11,413 |
| Class 22 | PE B lymphocytes | 3285 |
| Class 23 | PE Epithelial cells | 396 |
| Class 24 | PE Myeloid cells | 3063 |
| Class 25 | PE T/NK cells | 9192 |
| Class 26 | tLung B lymphocytes | 5781 |
| Class 27 | tLung Endothelial cells | 645 |
| Class 28 | tLung Epithelial cells | 13,852 |
| Class 29 | tLung Fibroblasts | 1739 |
| Class 30 | tLung MAST cells | 1809 |
| Class 31 | tLung Myeloid cells | 10,123 |
| Class 32 | tLung T/NK cells | 16,568 |
Table 2.
Performance of random forest and decision tree with some top features.
| Classification Algorithm | Number of Features | Overall Accuracy | MCC |
|---|---|---|---|
| Random forest | 720 | 0.927 | 0.922 |
| Random forest | 100 | 0.891 | 0.884 |
| Decision tree | 1880 | 0.799 | 0.786 |
Table 3.
Exclusive genes for some cell types.
| Tag | Cell Type | Exclusive Gene a |
|---|---|---|
| Class 7 | mBrain T/NK cells | FAM83H |
| Class 8 | mLN B lymphocytes | TFAP2A, TJP1, TMEM63B |
| Class 10 | mLN Myeloid cells | TMEM45B |
| Class 11 | mLN T/NK cells | RAB40B, SLC9A3R2 |
| Class 14 | nLN T/NK cells | TM7SF2 |
| Class 24 | PE Myeloid cells | ZDHHC9 |
| Class 25 | PE T/NK cells | GNG12, ITGA2 |
| Class 26 | tLung B lymphocytes | P4HA2, TJP3, BAIAP2L1 |
| Class 27 | tLung Endothelial cells | FNBP1L, PTPN13, |
| Class 28 | tLung Epithelial cells | C5orf38, MLLT4 |
a: Exclusive gene for one cell type is defined as the genes that only occur in rules for such a cell type.
Publisher’s Note: MDPI stays neutral with regard to jurisdictional claims in published maps and institutional affiliations. |
© 2021 by the authors. Licensee MDPI, Basel, Switzerland. This article is an open access article distributed under the terms and conditions of the Creative Commons Attribution (CC BY) license (https://creativecommons.org/licenses/by/4.0/).
Share and Cite
MDPI and ACS Style
Huang, G.-H.; Zhang, Y.-H.; Chen, L.; Li, Y.; Huang, T.; Cai, Y.-D. Identifying Lung Cancer Cell Markers with Machine Learning Methods and Single-Cell RNA-Seq Data. Life 2021, 11, 940. https://0-doi-org.brum.beds.ac.uk/10.3390/life11090940
AMA Style
Huang G-H, Zhang Y-H, Chen L, Li Y, Huang T, Cai Y-D. Identifying Lung Cancer Cell Markers with Machine Learning Methods and Single-Cell RNA-Seq Data. Life. 2021; 11(9):940. https://0-doi-org.brum.beds.ac.uk/10.3390/life11090940
Chicago/Turabian StyleHuang, Guo-Hua, Yu-Hang Zhang, Lei Chen, You Li, Tao Huang, and Yu-Dong Cai. 2021. "Identifying Lung Cancer Cell Markers with Machine Learning Methods and Single-Cell RNA-Seq Data" Life 11, no. 9: 940. https://0-doi-org.brum.beds.ac.uk/10.3390/life11090940
Note that from the first issue of 2016, this journal uses article numbers instead of page numbers. See further details here.