
Clinicopathological Association of Autophagy Related 5 Protein with Prognosis of Colorectal Cancer

 , ,
, ,  ,
,
Abstract
:1. Introduction
2. Experimental Procedure
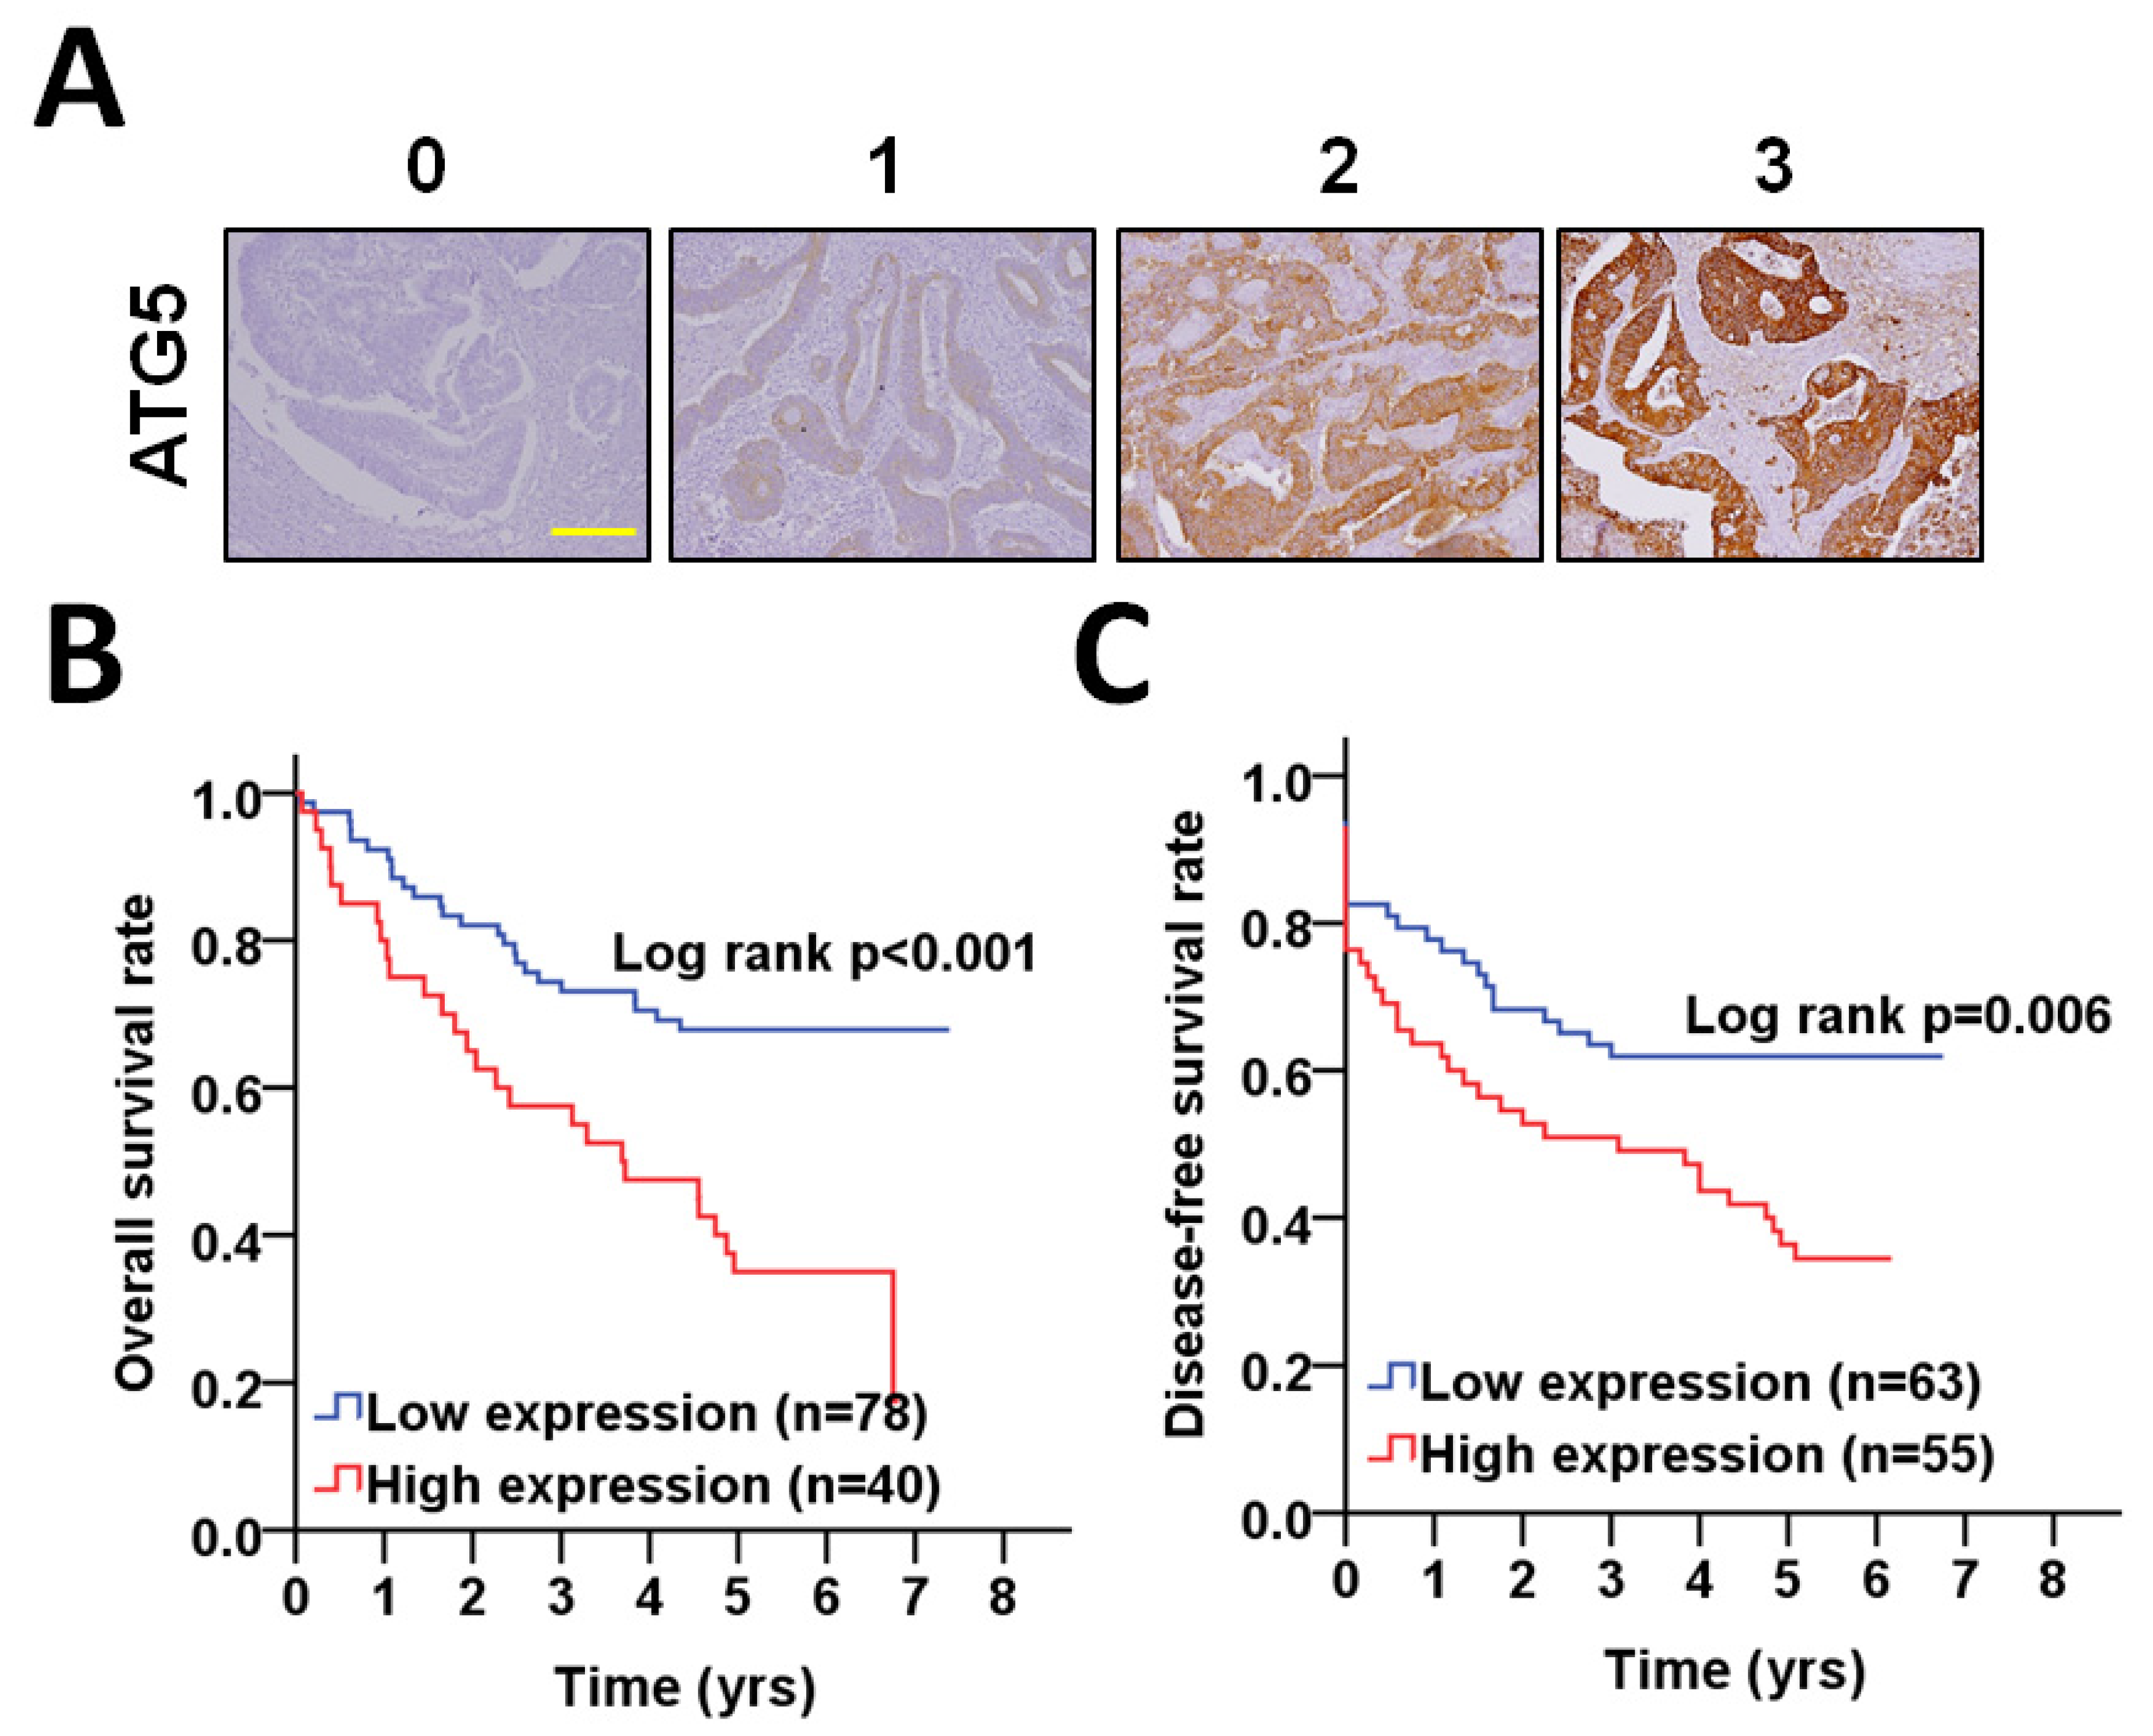
2.1. Immunohistochemistry (IHC)
2.2. Evaluation of IHC
2.3. Cell Culture and Stable Transfection
2.4. Sphere Culture and Live/Dead Assay
2.5. Statistical Analysis
3. Results
4. Discussion
Author Contributions
Funding
Institutional Review Board Statement
Informed Consent Statement
Data Availability Statement
Conflicts of Interest
References
- Hepatology, T.L.G. Colorectal Cancer Screening: Is Earlier Better? Lancet Gastroenterol. Hepatol. 2018, 3, 519. [Google Scholar] [CrossRef]
- Kuipers, E.J.; Grady, W.M.; Lieberman, D.; Seufferlein, T.; Sung, J.J.; Boelens, P.G.; Van De Velde, C.J.H.; Watanabe, T. Colorectal cancer. Nat. Rev. Dis. Prim. 2015, 1, 15065. [Google Scholar] [CrossRef] [Green Version]
- Tariq, K.; Ghias, K. Colorectal Cancer Carcinogenesis: A Review of Mechanisms. Cancer Biol. Med. 2016, 13, 120–135. [Google Scholar] [CrossRef] [PubMed] [Green Version]
- Wong, S.H.; Yu, J. Gut Microbiota in Colorectal Cancer: Mechanisms of Action and Clinical Applications. Nat. Rev. Gastroenterol. Hepatol. 2019, 16, 690–704. [Google Scholar] [CrossRef] [PubMed]
- Arakawa, S.; Honda, S.; Yamaguchi, H.; Shimizu, S. Molecular Mechanisms and Physiological Roles of Atg5/Atg7-Independent Alternative Autophagy. Proc. Jpn. Acad. Ser. B 2017, 93, 378–385. [Google Scholar] [CrossRef] [PubMed] [Green Version]
- Yu, K.; Xiang, L.; Li, S.; Wang, S.; Chen, C.; Mu, H. HIF1α Promotes Prostate Cancer Progression by Increasing ATG5 Expression. Anim. Cells Syst. 2019, 23, 326–334. [Google Scholar] [CrossRef]
- Liu, P.-F.; Farooqi, A.A.; Peng, S.-Y.; Yu, T.-J.; Dahms, H.-U.; Lee, C.-H.; Tang, J.-Y.; Wang, S.-C.; Shu, C.-W.; Chang, H.-W. Regulatory Effects of Noncoding RNAs on the Interplay of Oxidative Stress and Autophagy in Cancer Malignancy and Therapy. Semin. Cancer Biol. 2020. [Google Scholar] [CrossRef]
- Klionsky, D.J.; Abdel-Aziz, A.K.; Abdelfatah, S.; Abdellatif, M.; Abdoli, A.; Abel, S.; Abeliovich, H.; Abildgaard, M.H.; Abudu, Y.P.; Acevedo-Arozena, A.; et al. Guidelines for the Use and Interpretation of Assays for Monitoring Autophagy (4th Edition)1. Autophagy 2021, 17, 1–382. [Google Scholar] [CrossRef]
- Lin, C.; Tsao, Y.; Shu, C. Autophagy Modulation as a Potential Targeted Cancer Therapy: From Drug Repurposing to New Drug Development. Kaohsiung J. Med. Sci. 2021, 37, 166–171. [Google Scholar] [CrossRef]
- Cho, D.-H.; Jo, Y.K.; Kim, S.C.; Park, I.J.; Kim, J.C. Down-Regulated Expression of ATG5 in Colorectal Cancer. Anticancer. Res. 2012, 32, 4091–4096. [Google Scholar]
- Fîlfan, M.; Sandu, R.E.; Zăvăleanu, A.D.; GreşiŢă, A.; Glăvan, D.G.; Olaru, D.G.; Popa-Wagner, A. Autophagy in Aging and Disease. Rom. J. Morphol. Embryol. 2017, 58, 27–31. [Google Scholar] [PubMed]
- Hu, W.-H.; Chen, H.-H.; Yen, S.-L.; Huang, H.-Y.; Hsiao, C.-C.; Chuang, J.-H. Increased Expression of Interleukin-23 Associated with Progression of Colorectal Cancer. J. Surg. Oncol. 2017, 115, 208–212. [Google Scholar] [CrossRef] [PubMed]
- Liu, P.-F.; Leung, C.-M.; Chang, Y.-H.; Cheng, J.-S.; Chen, J.-J.; Weng, C.-J.; Tsai, K.-W.; Hsu, C.-J.; Liu, Y.-C.; Hsu, P.-C.; et al. ATG4B Promotes Colorectal Cancer Growth Independent of Autophagic Flux. Autophagy 2014, 10, 1454–1465. [Google Scholar] [CrossRef] [Green Version]
- Liu, P.-F.; Tsai, K.-L.; Hsu, C.-J.; Tsai, W.-L.; Cheng, J.-S.; Chang, H.-W.; Shiau, C.-W.; Goan, Y.-G.; Tseng, H.-H.; Wu, C.-H.; et al. Drug Repurposing Screening Identifies Tioconazole as an ATG4 Inhibitor that Suppresses Autophagy and Sensitizes Cancer Cells to Chemotherapy. Theranostics 2018, 8, 830–845. [Google Scholar] [CrossRef] [PubMed]
- Berg, K.C.G.; Eide, P.W.; Eilertsen, I.A.; Johannessen, B.; Bruun, J.; Danielsen, S.A.; Bjørnslett, M.; Meza-Zepeda, L.A.; Eknæs, M.; Lind, G.E.; et al. Multi-Omics of 34 Colorectal Cancer Cell Lines-a Resource for Biomedical Studies. Mol. Cancer 2017, 16, 1–16. [Google Scholar] [CrossRef]
- Holloway, K.R.; Calhoun, T.N.; Saxena, M.; Metoyer, C.F.; Kandler, E.F.; Rivera, C.A.; Pruitt, K. SIRT1 regulates Dishevelled Proteins and Promotes Transient and Constitutive Wnt Signaling. Proc. Natl. Acad. Sci. USA 2010, 107, 9216–9221. [Google Scholar] [CrossRef] [PubMed] [Green Version]
- Moon, B.-S.; Jeong, W.-J.; Park, J.; Kim, T.I.; Min, D.S.; Choi, K.-Y. Role of Oncogenic K-Ras in Cancer Stem Cell Activation by Aberrant Wnt/β-Catenin Signaling. J. Natl. Cancer Inst. 2014, 106, djt373. [Google Scholar] [CrossRef] [Green Version]
- Chang, H.-W.; Liu, P.-F.; Tsai, W.-L.; Hu, W.-H.; Hu, Y.-C.; Yang, H.-C.; Lin, W.-Y.; Weng, J.-R.; Shu, C.-W. Xanthium Strumarium Fruit Extract Inhibits ATG4B and Diminishes the Proliferation and Metastatic Characteristics of Colorectal Cancer Cells. Toxins 2019, 11, 313. [Google Scholar] [CrossRef] [Green Version]
- Antoni, D.; Burckel, H.; Josset, E.; Noel, G. Three-Dimensional Cell Culture: A Breakthrough in Vivo. Int. J. Mol. Sci. 2015, 16, 5517–5527. [Google Scholar] [CrossRef]
- Chen, K.-L.; Pan, F.; Jiang, H.; Chen, J.-F.; Pei, L.; Xie, F.-W.; Liang, H.-J. Highly Enriched CD133+CD44+ Stem-Like Cells with CD133+Cd44high Metastatic Subset in HCT116 Colon Cancer Cells. Clin. Exp. Metastasis 2011, 28, 751–763. [Google Scholar] [CrossRef]
- Deretic, V.; Saitoh, T.; Akira, S. Autophagy in Infection, Inflammation and Immunity. Nat. Rev. Immunol. 2013, 13, 722–737. [Google Scholar] [CrossRef] [PubMed]
- Classen, F.; Kranz, P.; Riffkin, H.; Pompsch, M.; Wolf, A.; Göpelt, K.; Baumann, M.; Baumann, J.; Brockmeier, U.; Metzen, E. Autophagy Induced by Ionizing Radiation Promotes Cell Death Over Survival in Human Colorectal Cancer Cells. Exp. Cell Res. 2019, 374, 29–37. [Google Scholar] [CrossRef] [PubMed]
- Wible, D.J.; Chao, H.-P.; Tang, D.G.; Bratton, S.B. ATG5 Cancer Mutations and Alternative mRNA Splicing Reveal a Conjugation Switch that Regulates ATG12–ATG5-ATG16L1 Complex Assembly and Autophagy. Cell Discov. 2019, 5, 1–19. [Google Scholar] [CrossRef] [PubMed] [Green Version]
- Takamura, A.; Komatsu, M.; Hara, T.; Sakamoto, A.; Kishi, C.; Waguri, S.; Eishi, Y.; Hino, O.; Tanaka, K.; Mizushima, N. Autophagy-Deficient Mice Develop Multiple Liver Tumors. Genes Dev. 2011, 25, 795–800. [Google Scholar] [CrossRef] [PubMed] [Green Version]
- Li, X.; He, S.; Ma, B. Autophagy and Autophagy-Related Proteins in Cancer. Mol. Cancer 2020, 19, 1–16. [Google Scholar] [CrossRef]
- Lambert, A.W.; Pattabiraman, D.R.; Weinberg, R.A. Emerging Biological Principles of Metastasis. Cell 2017, 168, 670–691. [Google Scholar] [CrossRef] [Green Version]
- Görgülü, K.; Diakopoulos, K.N.; Ai, J.; Schoeps, B.; Kabacaoglu, D.; Karpathaki, A.-F.; Ciecielski, K.J.; Kaya-Aksoy, E.; Ruess, D.A.; Berninger, A.; et al. Levels of the Autophagy-Related 5 Protein Affect Progression and Metastasis of Pancreatic Tumors in Mice. Gastroenterology 2019, 156, 203–217. [Google Scholar] [CrossRef] [Green Version]
- Mao, D.; Zhang, Z.; Zhao, X.; Dong, X. Autophagy-Related Genes Prognosis Signature as Potential Predictive Markers for Immunotherapy in Hepatocellular Carcinoma. PeerJ 2020, 8, e8383. [Google Scholar] [CrossRef] [Green Version]
- Hu, D.; Jiang, L.; Luo, S.; Zhao, X.; Hu, H.; Zhao, G.; Tang, W. Development of an Autophagy-Related Gene Expression Signature for Prognosis Prediction in Prostate Cancer Patients. J. Transl. Med. 2020, 18, 160. [Google Scholar] [CrossRef] [Green Version]
- Liu, Y.; Wu, L.; Ao, H.; Zhao, M.; Leng, X.; Liu, M.; Ma, J.; Zhu, J. Prognostic Implications of Autophagy-Associated Gene Signatures in Non-Small Cell Lung Cancer. Aging 2019, 11, 11440–11462. [Google Scholar] [CrossRef]
- Lebovitz, C.B.; Robertson, A.G.; Goya, R.; Jones, S.J.; Morin, R.D.; Marra, M.A.; Gorski, S.M. Cross-Cancer Profiling of Molecular Alterations Within the Human Autophagy Interaction Network. Autophagy 2015, 11, 1668–1687. [Google Scholar] [CrossRef] [PubMed] [Green Version]


| Variable | No. (%) | CHR (95% CI) | p Value * | AHR (95% CI) | p Value † | |
|---|---|---|---|---|---|---|
| Overall survival | ||||||
| ATG5 | Low | 78 (66.1) | 1.00 | 1.00 | ||
| High | 40 (33.9) | 2.58 (1.49–4.45) | 0.001 | 2.76 (1.58–4.82) | <0.001 | |
| Disease-free survival | ||||||
| ATG5 | Low | 63 (53.4) | 1.00 | 1.00 | ||
| High | 55 (46.6) | 1.98 (1.18–3.32) | 0.010 | 2.11 (1.25–3.54) | 0.005 |
| Variable | No. (%) | CHR (95% CI) | p Value * | AHR (95% CI) | p Value † | |
|---|---|---|---|---|---|---|
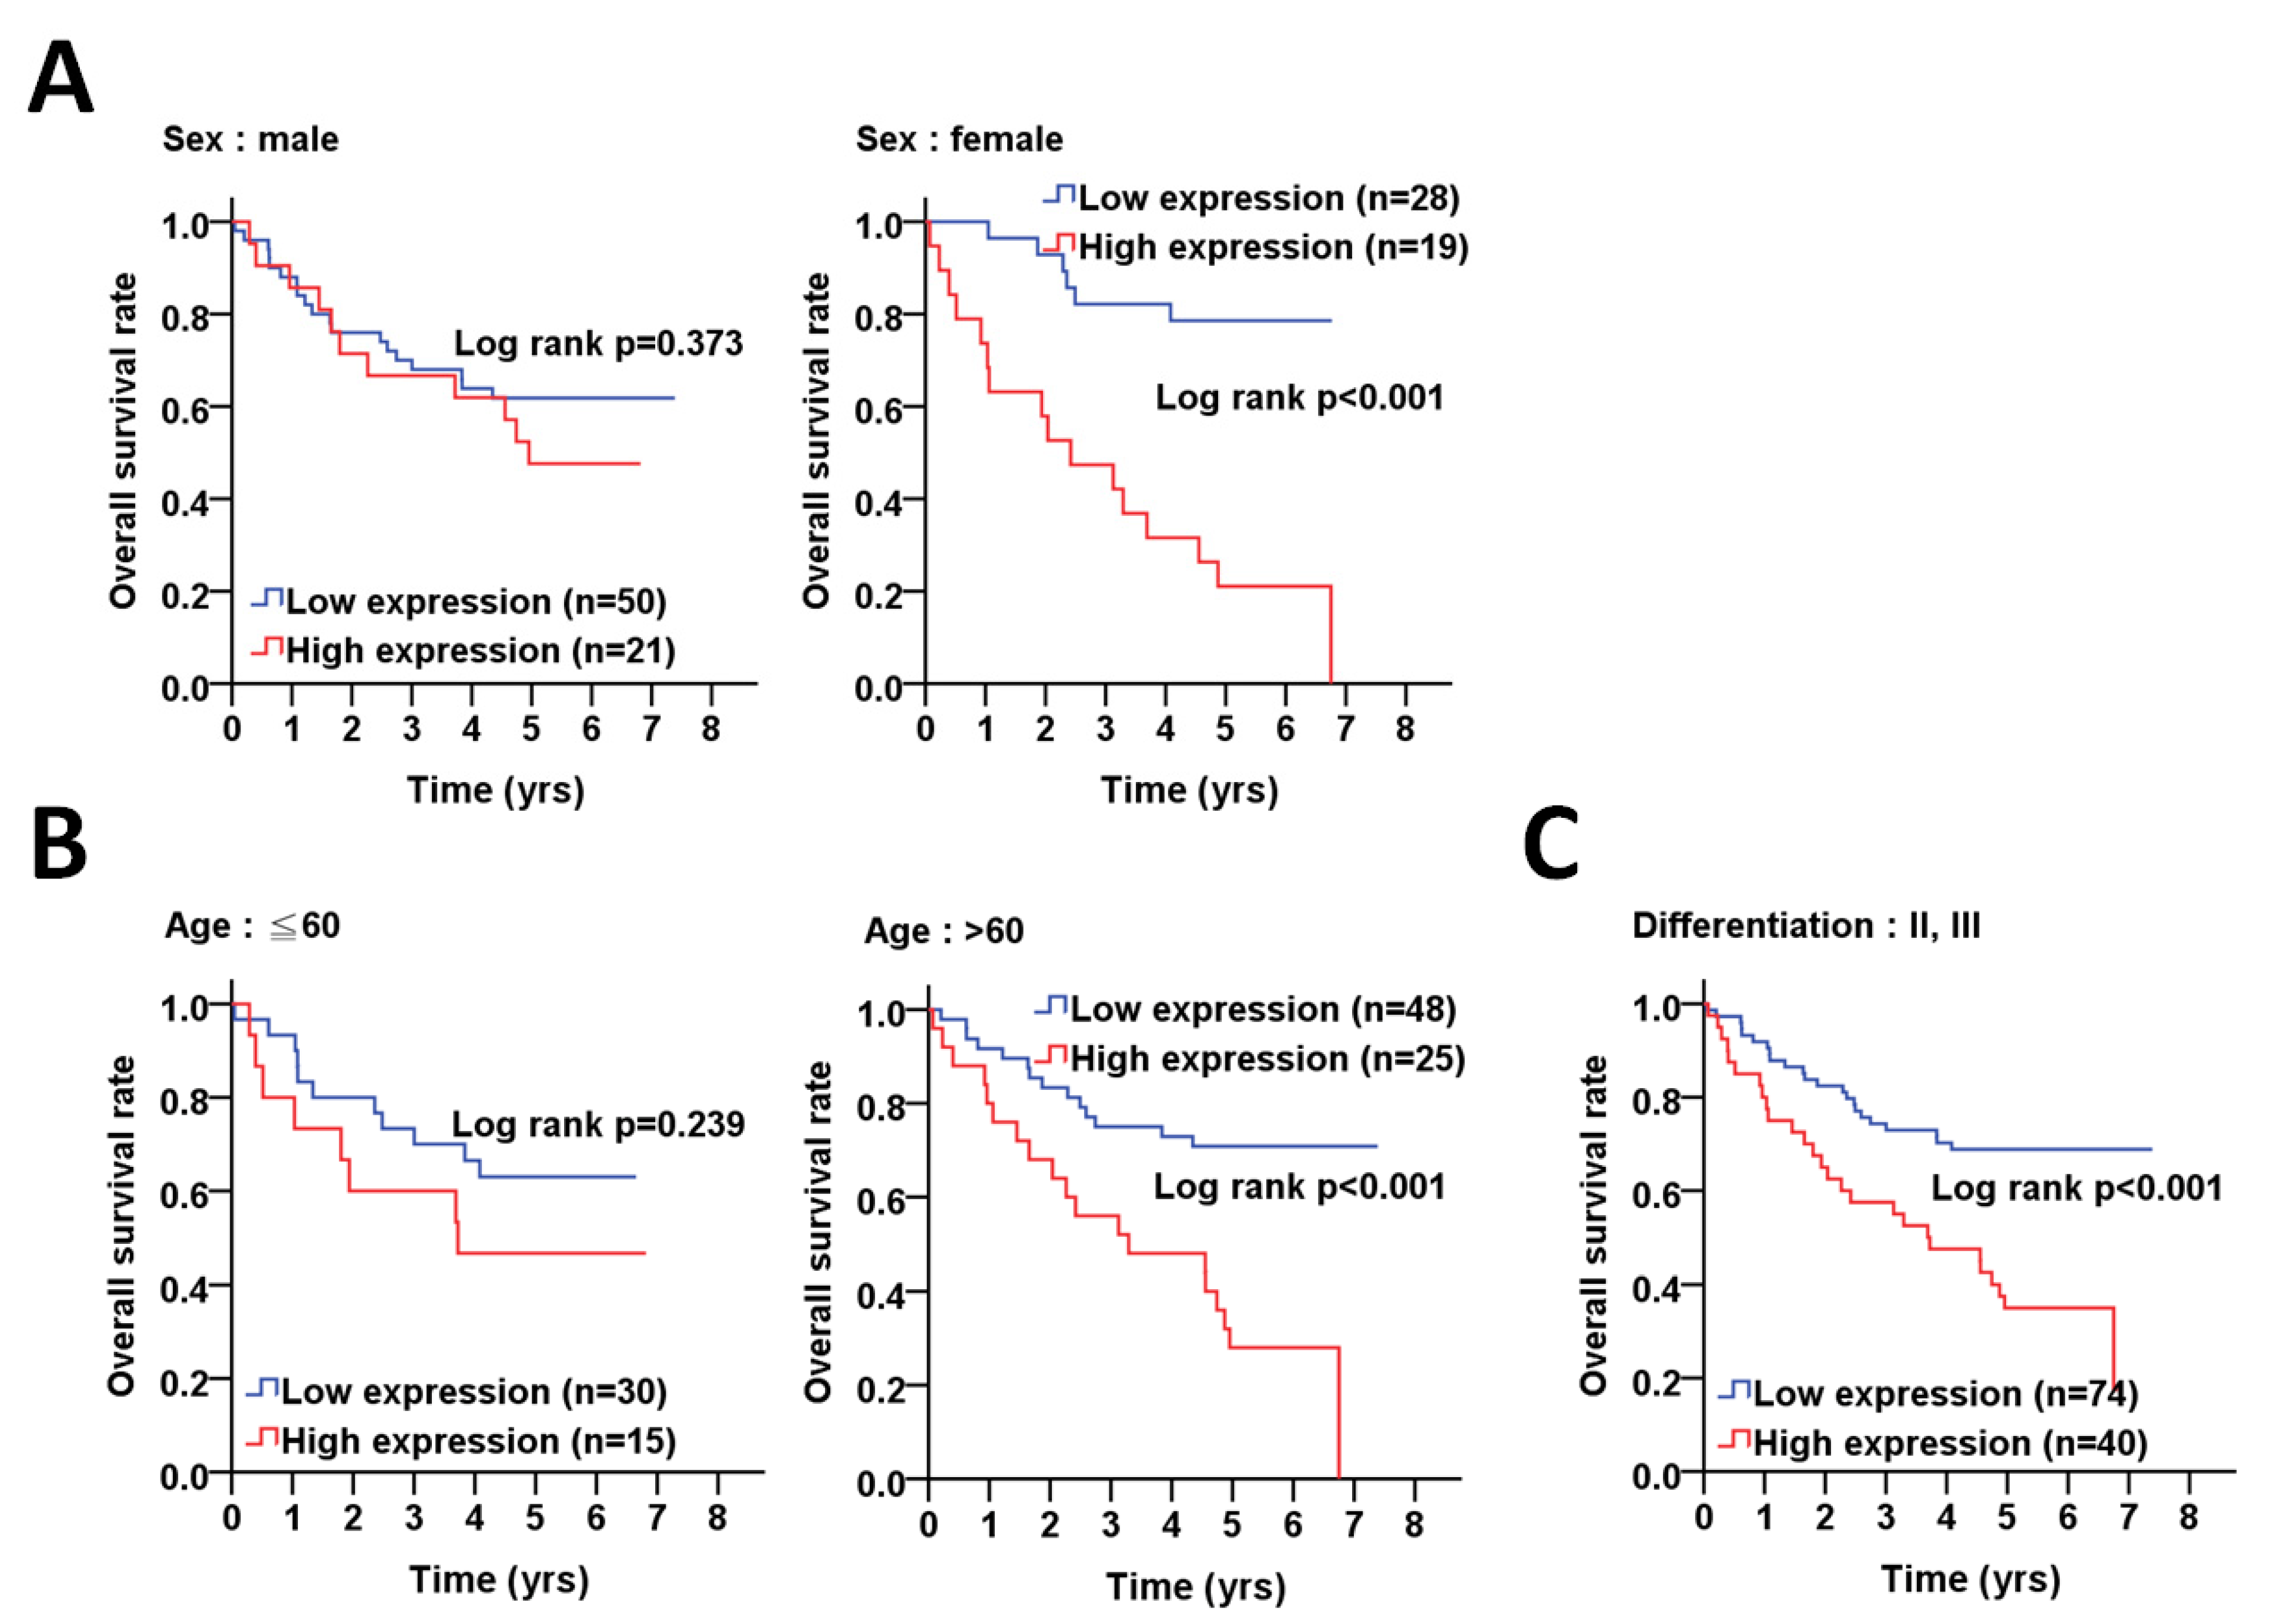
| Sex | ||||||
| Female | Low | 28 (59.6) | 1.00 | 1.00 | ||
| High | 19 (40.4) | 6.25 (2.42–16.13) | <0.001 | 6.61 (2.54–17.19) | <0.001 a | |
| Male | Low | 50 (70.4) | 1.00 | 1.00 | ||
| High | 21 (29.6) | 1.40 (0.67–2.94) | 0.375 | 1.51 (0.71–3.23) | 0.285 a | |
| Age, years | ||||||
| ≦60 | Low | 30 (66.7) | 1.00 | 1.00 | ||
| High | 15 (33.3) | 1.72 (0.69–4.28) | 0.244 | 1.64 (0.66–4.08) | 0.289 a | |
| >60 | Low | 48 (65.8) | 1.00 | 1.00 | ||
| High | 25 (34.2) | 3.36 (1.68–6.73) | 0.001 | 4.13 (1.98–8.58) | <0.001 a | |
| Cell differentiation | ||||||
| Well | Low | 4 (100.0) | 1.00 | 1.00 | ||
| High | 0 (0) | Incalculable | Incalculable | |||
| Moderate, poor | Low | 74 (64.9) | 1.00 | 1.00 | ||
| High | 40 (35.1) | 2.66 (1.52–4.65) | 0.001 | 2.75 (1.57–4.80) | <0.001 b | |
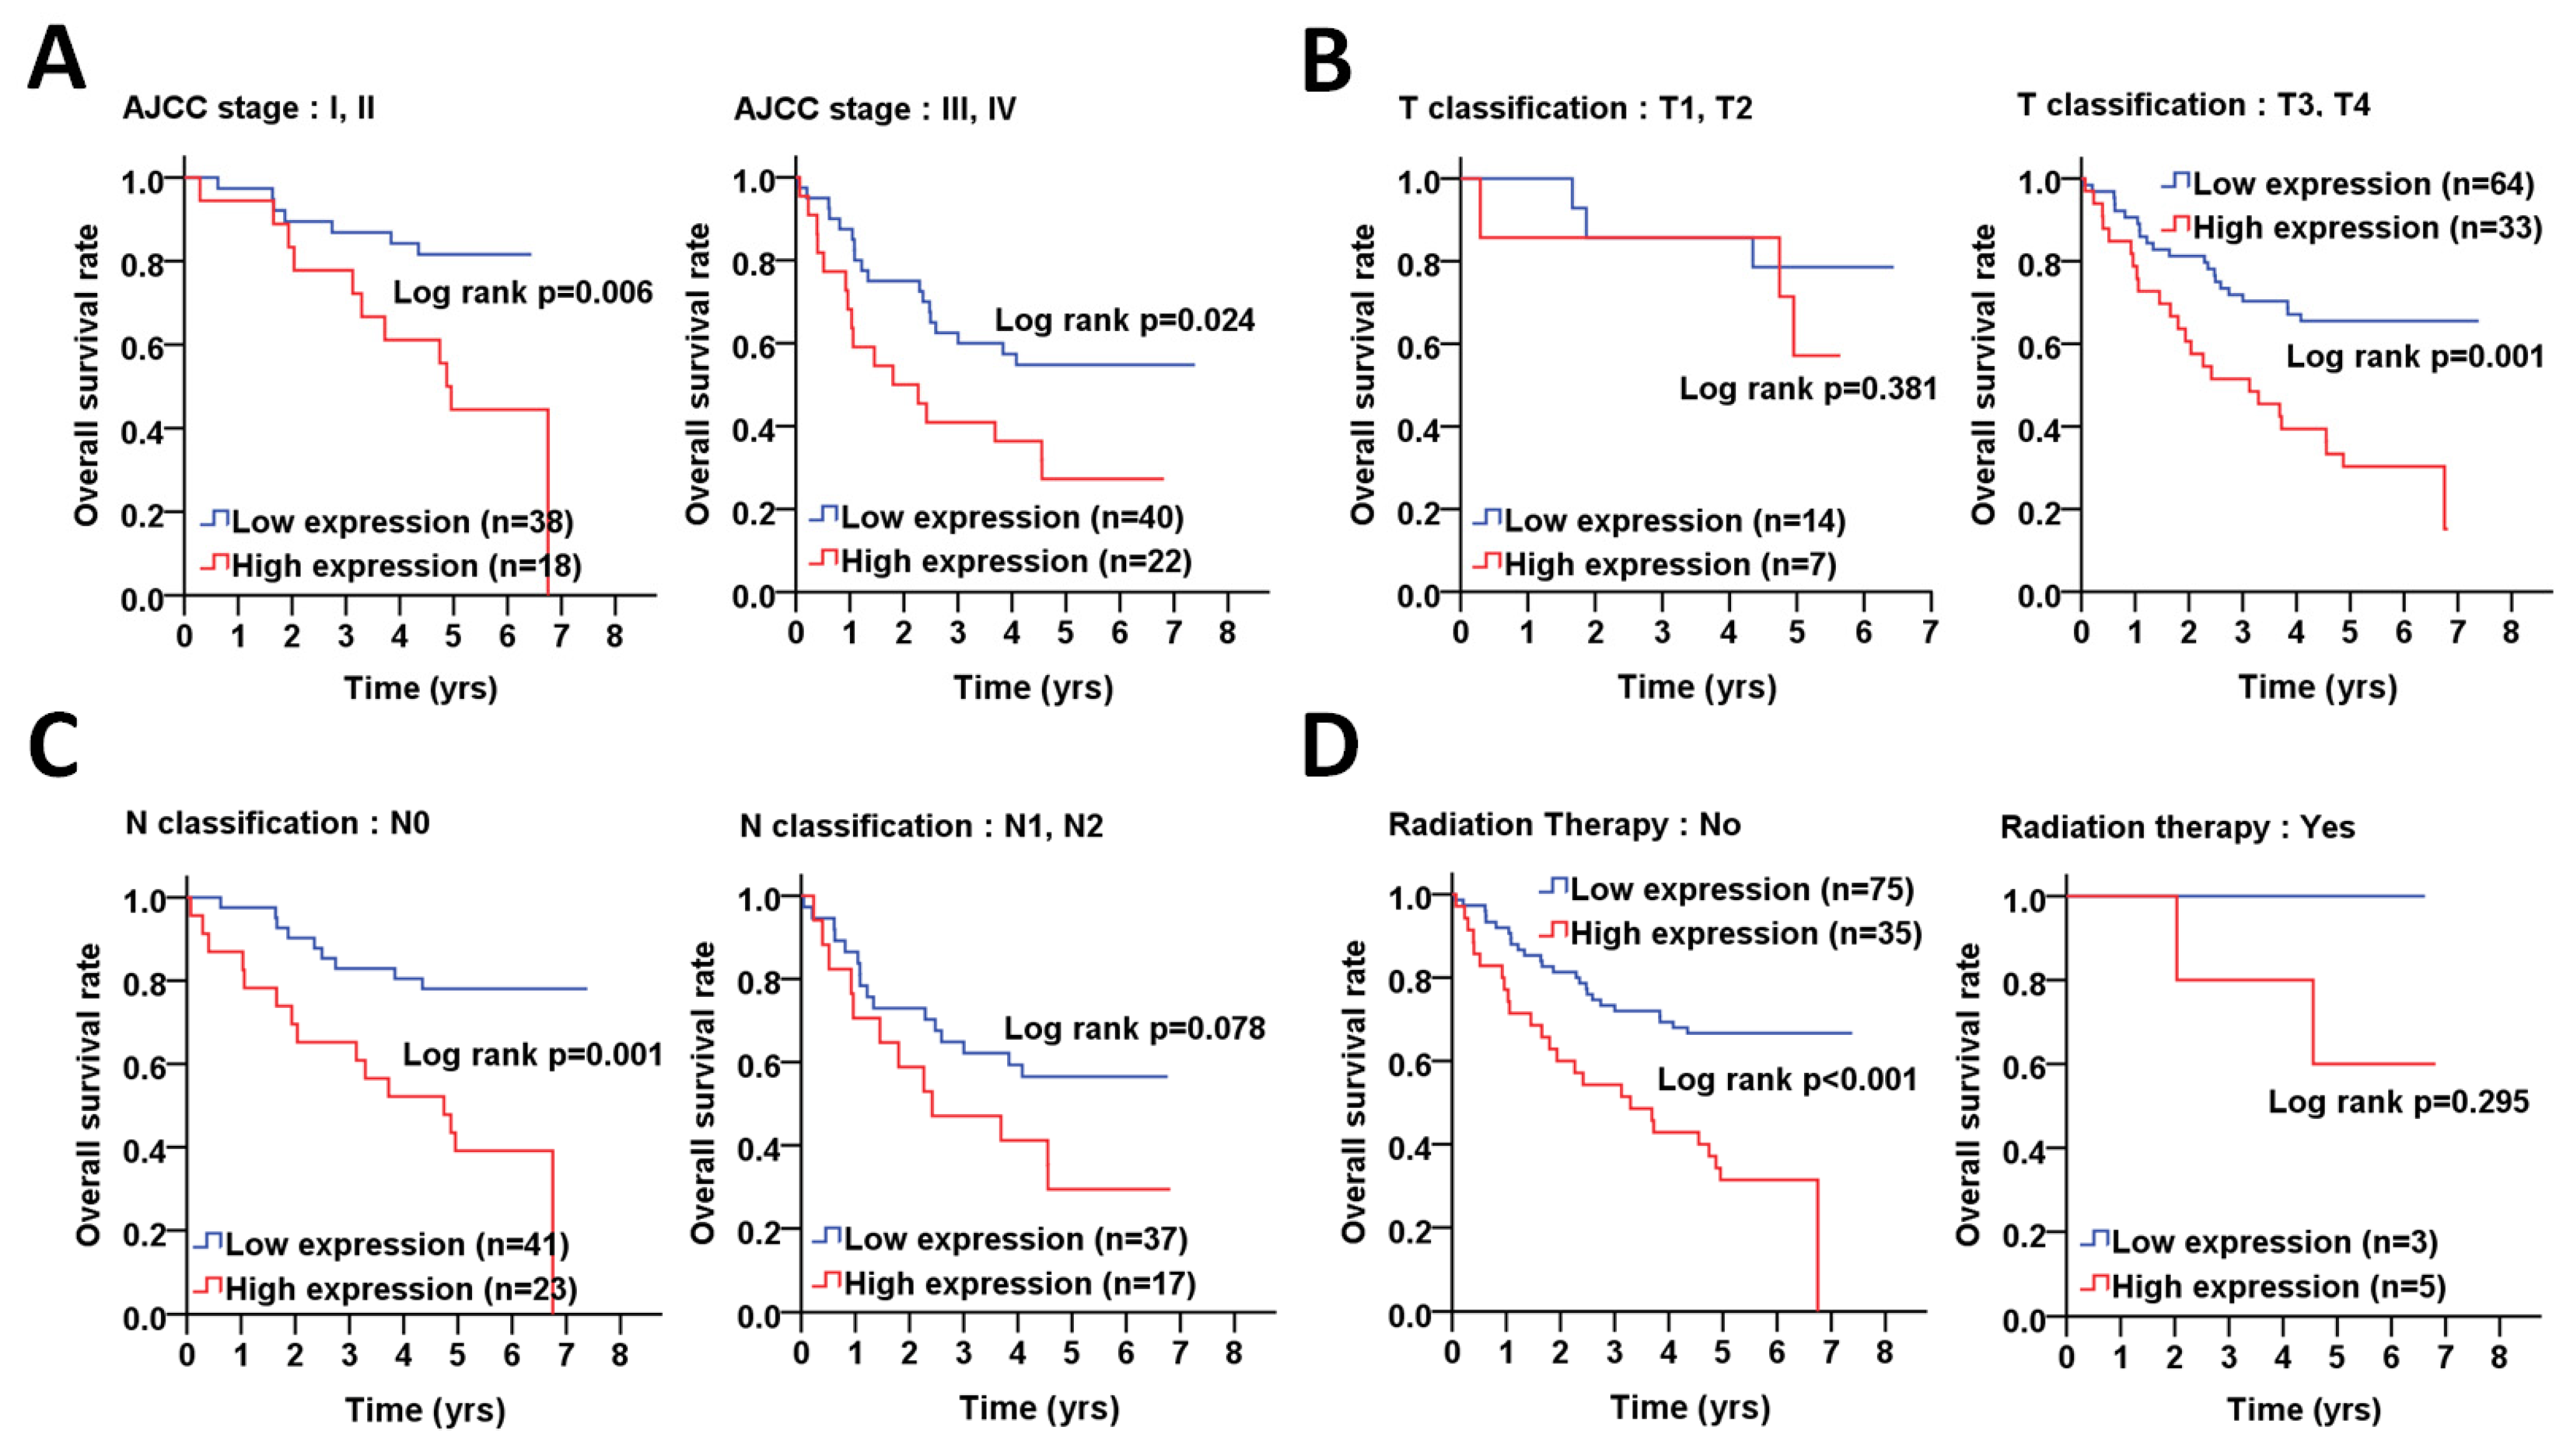
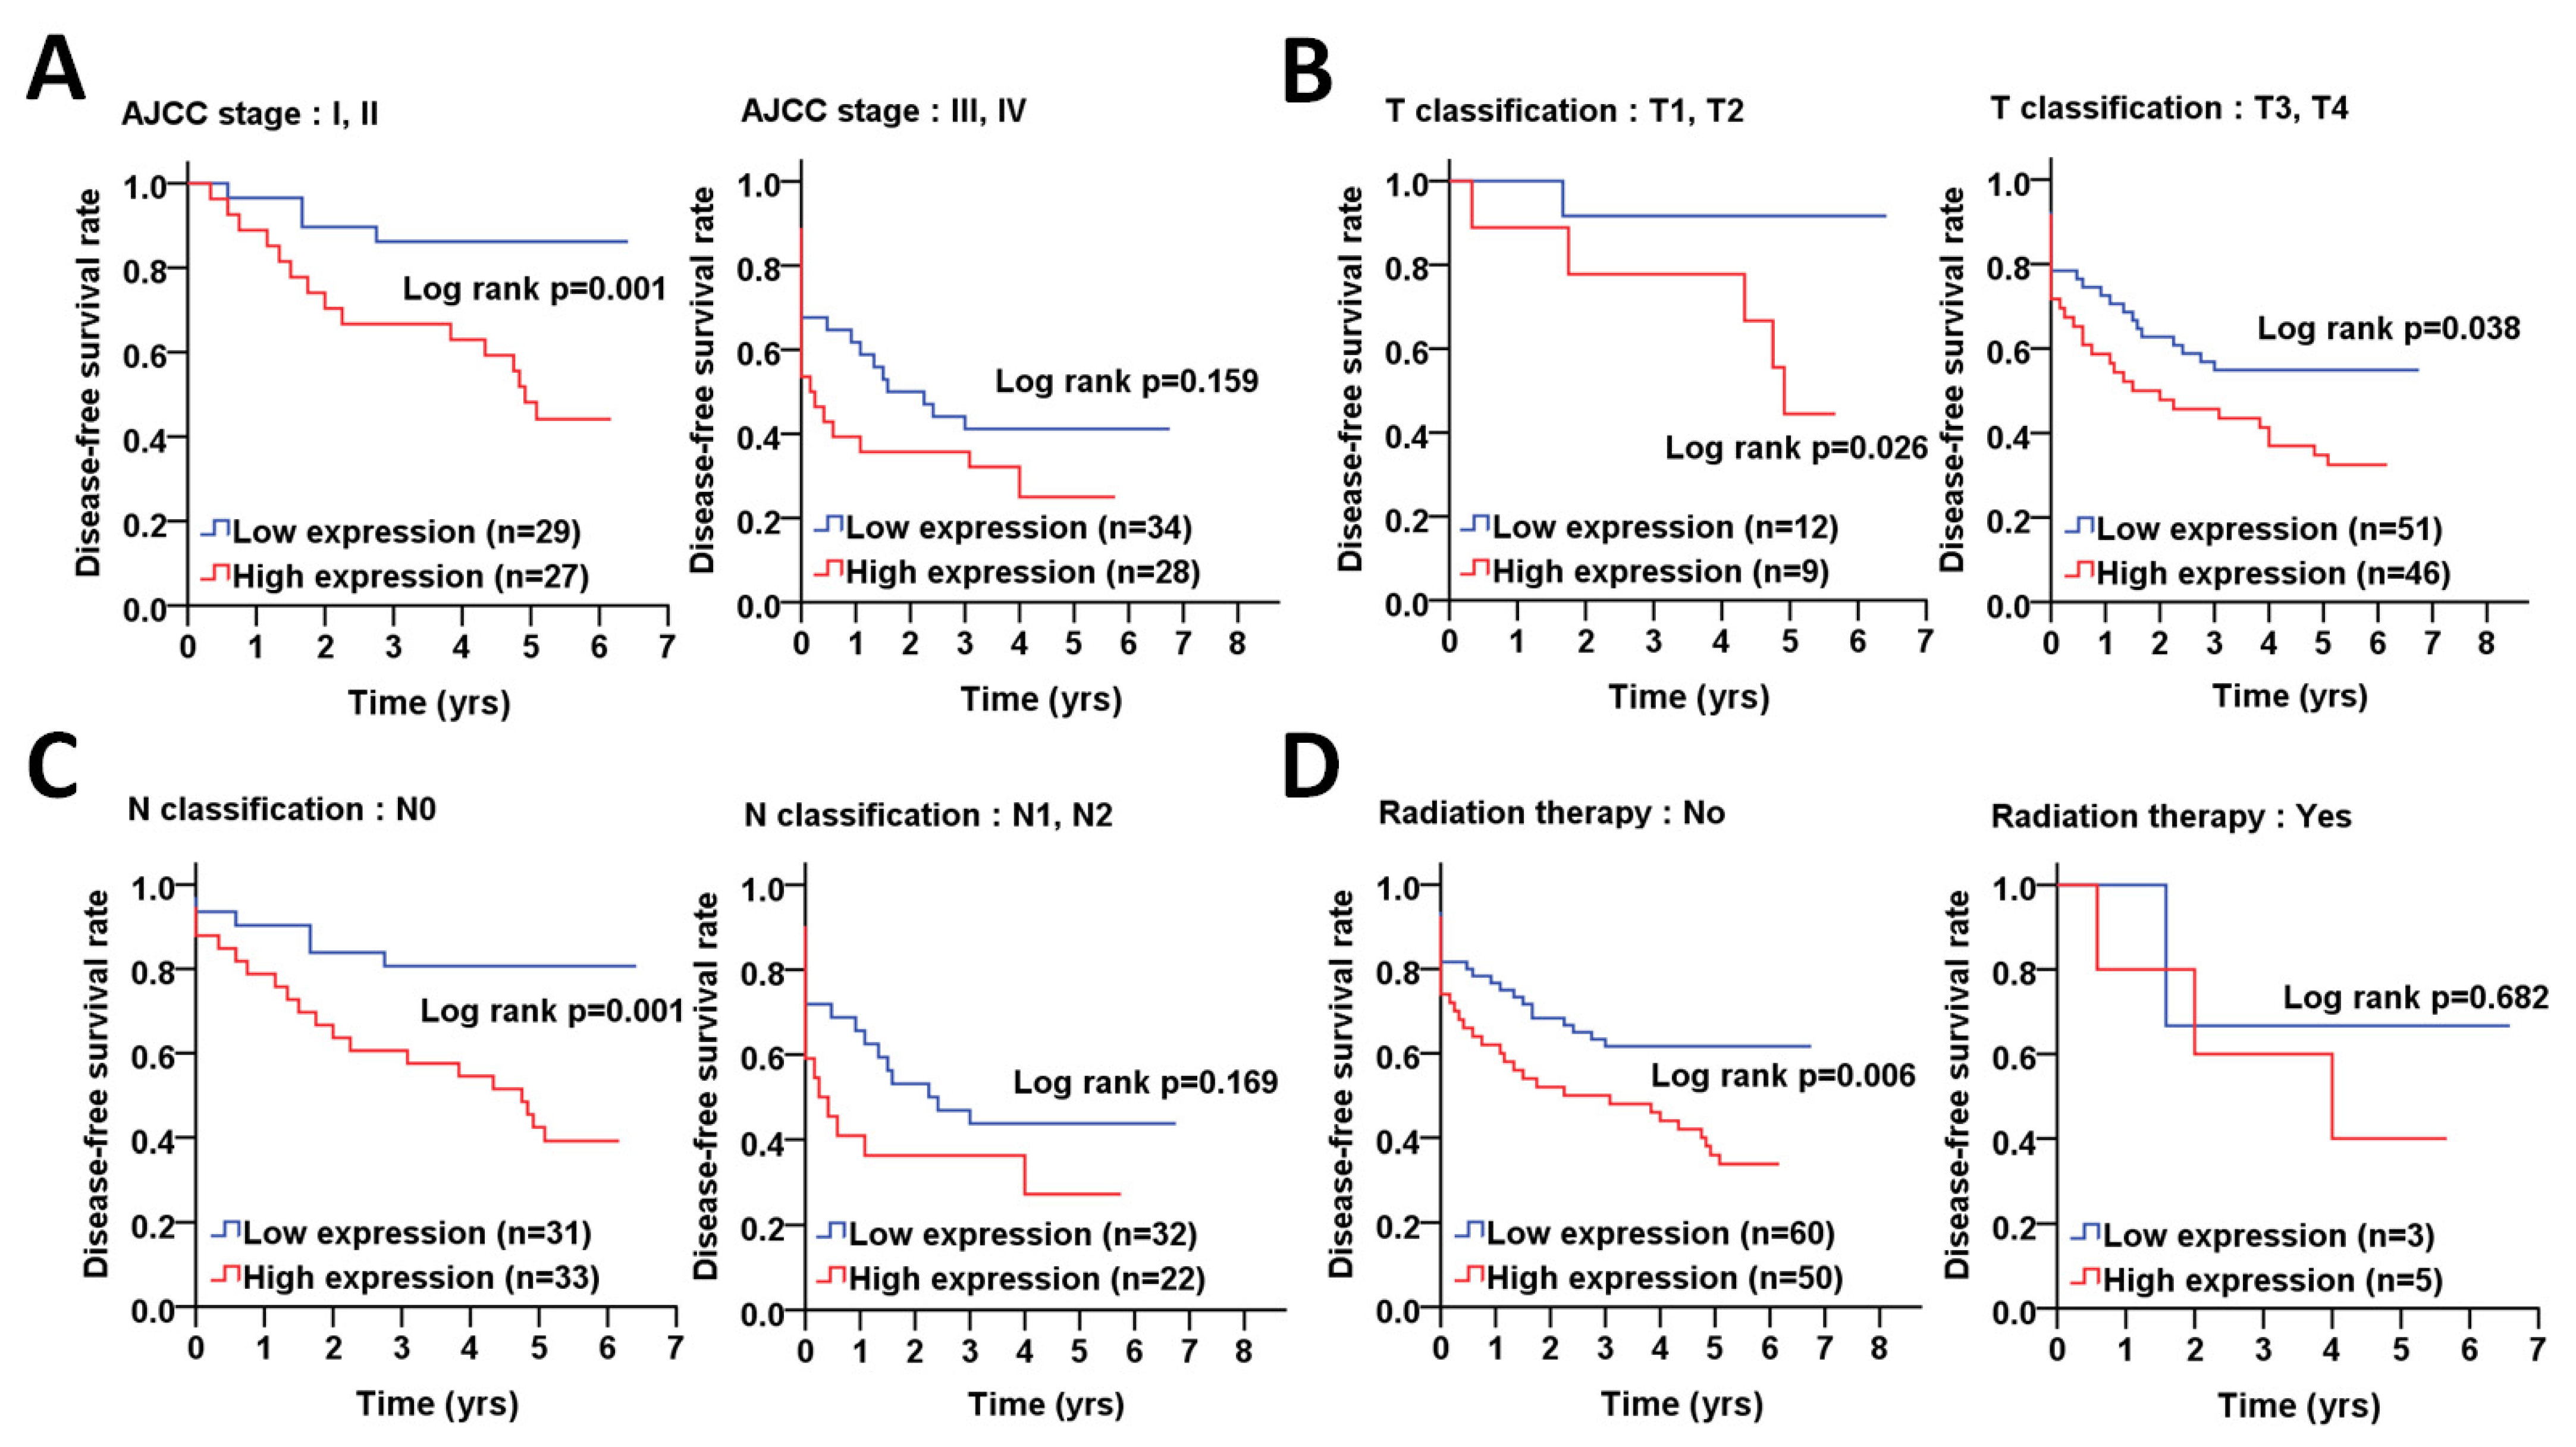
| AJCC pathological stage | ||||||
| I, II | Low | 38 (67.9) | 1.00 | 1.00 | ||
| High | 18 (32.1) | 3.54 (1.35–9.33) | 0.010 | 3.79 (1.37–10.45) | 0.010 c | |
| III, IV | Low | 40 (64.5) | 1.00 | 1.00 | ||
| High | 22 (35.5) | 2.14 (1.09–4.21) | 0.027 | 2.25 (1.13–4.45) | 0.021 c | |
| T classification | ||||||
| T1, T2 | Low | 14 (66.7) | 1.00 | 1.00 | ||
| High | 7 (33.3) | 2.02 (0.41–10.02) | 0.391 | 2.62 (0.44–15.68) | 0.293 d | |
| T3, T4 | Low | 64 (66.0) | 1.00 | 1.00 | ||
| High | 33 (34.0) | 2.68 (1.50–4.79) | 0.001 | 2.77 (1.54–5.00) | 0.001 d | |
| N classification | ||||||
| N0 | Low | 41 (64.1) | 1.00 | 1.00 | ||
| High | 23 (35.9) | 3.75 (1.64–8.61) | 0.002 | 4.03 (1.70–9.57) | 0.002 e | |
| N1, N2 | Low | 37 (68.5) | 1.00 | 1.00 | ||
| High | 17 (31.5) | 1.94 (0.92–4.11) | 0.084 | 2.05 (0.96–4.38) | 0.065 e | |
| Postoperative RT | ||||||
| No | Low | 75 (68.2) | 1.00 | 1.00 | ||
| High | 35 (31.8) | 2.76 (1.58–4.81) | <0.001 | 3.29 (1.85–5.85) | <0.001 a | |
| Yes | Low | 3 (37.5) | 1.00 | 1.00 | ||
| High | 5 (62.5) | 40.74 (0.00–7251250.11) | 0.548 | 21.31 (0.00–10349447.27) | 0.647 a |
| Variable | No. (%) | CHR (95% CI) | p Value * | AHR (95% CI) | p Value † | |
|---|---|---|---|---|---|---|
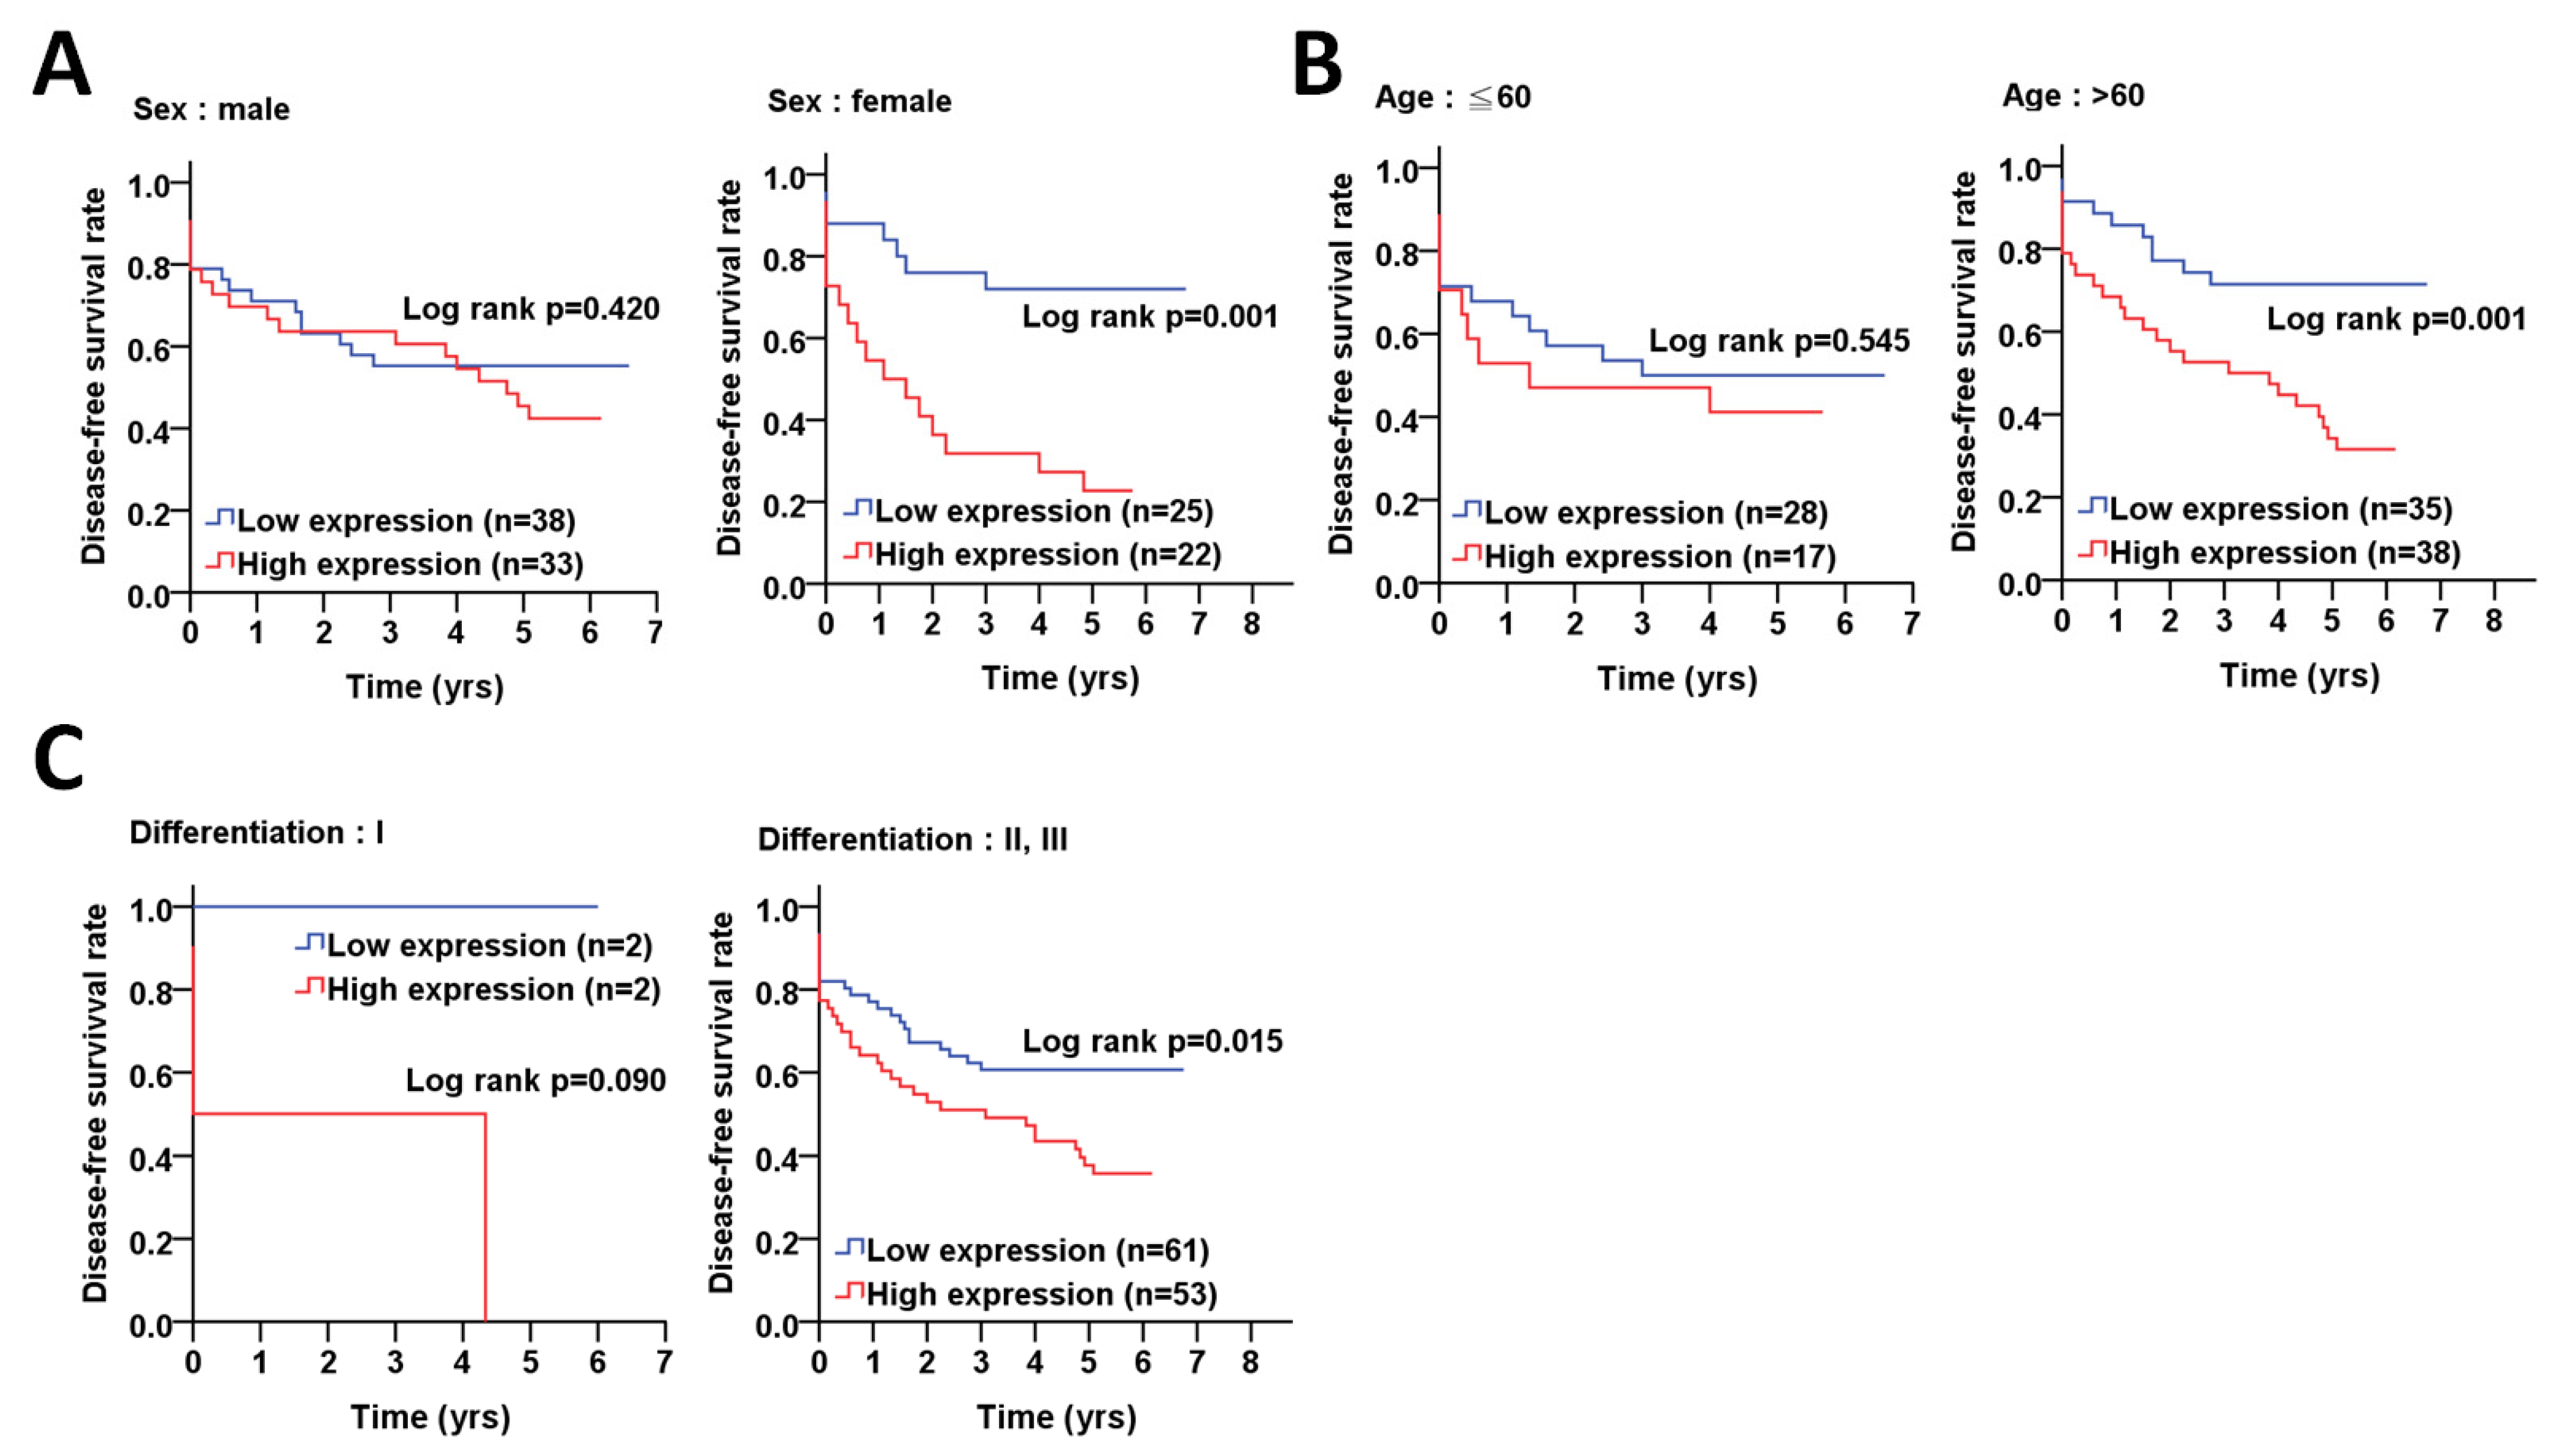
| Sex | ||||||
| Female | Low | 25 (53.2) | 1.00 | 1.00 | ||
| High | 22 (46.8) | 3.95 (1.62–9.61) | 0.002 | 3.75 (1.54–9.13) | 0.004 a | |
| Male | Low | 38 (53.5) | 1.00 | 1.00 | ||
| High | 33 (46.5) | 1.29 (0.67–2.49) | 0.442 | 1.34 (0.68–2.63) | 0.398 a | |
| Age, years | ||||||
| ≦60 | Low | 28 (62.2) | 1.00 | 1.00 | ||
| High | 17 (37.8) | 1.26 (0.56–2.84) | 0.578 | 1.24 (0.55–2.80) | 0.608 a | |
| >60 | Low | 35 (47.9) | 1.00 | 1.00 | ||
| High | 38 (52.1) | 3.05 (1.47–6.34) | 0.003 | 3.18 (1.51–6.70) | 0.002 a | |
| Cell differentiation | ||||||
| Well | Low | 2 (50.0) | 1.00 | 1.00 | ||
| High | 2 (50.0) | 104.94 (0.00–13651960.31) | 0.439 | 57.55 (0.00–2876455.83) | 0.463 b | |
| Moderate, poor | Low | 61 (53.5) | 1.00 | 1.00 | ||
| High | 53(46.5) | 1.85 (1.10–3.12) | 0.021 | 1.99 (1.18–3.37) | 0.010 b | |
| AJCC pathological stage | ||||||
| I, II | Low | 29 (51.8) | 1.00 | 1.00 | ||
| High | 27 (48.2) | 5.06 (1.68–15.28) | 0.004 | 5.09 (1.68–15.44) | 0.004 c | |
| III, IV | Low | 34 (54.8) | 1.00 | 1.00 | ||
| High | 28 (45.2) | 1.47 (0.80–2.72) | 0.219 | 1.43 (0.77–2.67) | 0.256 c | |
| T classification | ||||||
| T1, T2 | Low | 12 (57.1) | 1.00 | 1.00 | ||
| High | 9 (42.9) | 7.85 (0.91–67.35) | 0.060 | 7.98 (0.93–68.86) | 0.059 d | |
| T3, T4 | Low | 51 (52.6) | 1.00 | 1.00 | ||
| High | 46 (47.4) | 1.70 (0.99–2.92) | 0.054 | 1.89 (1.09–3.27) | 0.023 d | |
| N classification | ||||||
| N0 | Low | 31 (48.4) | 1.00 | 1.00 | ||
| High | 33 (51.6) | 3.91 (1.56–9.75) | 0.004 | 3.74 (1.49–9.42) | 0.005 e | |
| N1, N2 | Low | 32 (59.3) | 1.00 | 1.00 | ||
| High | 22 (40.7) | 1.53 (0.78–3.01) | 0.217 | 1.48 (0.74–2.94) | 0.266 e | |
| Postoperative RT | ||||||
| No | Low | 60 (54.5) | 1.00 | 1.00 | ||
| High | 50 (45.5) | 2.00 (1.17–3.41) | 0.011 | 2.22 (1.30–3.80) | 0.004 a | |
| Yes | Low | 3 (37.5) | 1.00 | 1.00 | ||
| High | 5 (62.5) | 1.61 (0.16–15.70) | 0.684 | 1.23(0.11–14.18) | 0.868 a |
Publisher’s Note: MDPI stays neutral with regard to jurisdictional claims in published maps and institutional affiliations. |
© 2021 by the authors. Licensee MDPI, Basel, Switzerland. This article is an open access article distributed under the terms and conditions of the Creative Commons Attribution (CC BY) license (https://creativecommons.org/licenses/by/4.0/).
Share and Cite
Hu, W.-H.; Yang, W.-C.; Liu, P.-F.; Liu, T.-T.; Morgan, P.; Tsai, W.-L.; Pan, H.-W.; Lee, C.-H.; Shu, C.-W. Clinicopathological Association of Autophagy Related 5 Protein with Prognosis of Colorectal Cancer. Diagnostics 2021, 11, 782. https://0-doi-org.brum.beds.ac.uk/10.3390/diagnostics11050782
Hu W-H, Yang W-C, Liu P-F, Liu T-T, Morgan P, Tsai W-L, Pan H-W, Lee C-H, Shu C-W. Clinicopathological Association of Autophagy Related 5 Protein with Prognosis of Colorectal Cancer. Diagnostics. 2021; 11(5):782. https://0-doi-org.brum.beds.ac.uk/10.3390/diagnostics11050782
Chicago/Turabian StyleHu, Wan-Hsiang, Wen-Chi Yang, Pei-Feng Liu, Ting-Ting Liu, Paul Morgan, Wei-Lun Tsai, Hung-Wei Pan, Cheng-Hsin Lee, and Chih-Wen Shu. 2021. "Clinicopathological Association of Autophagy Related 5 Protein with Prognosis of Colorectal Cancer" Diagnostics 11, no. 5: 782. https://0-doi-org.brum.beds.ac.uk/10.3390/diagnostics11050782