Article

In-Situ Cartilage Functionality Assessment Based on Advanced MRI Techniques and Precise Compartmental Knee Joint Loading through Varus and Valgus Stress

1
Department of Diagnostic and Interventional Radiology, Aachen University Hospital, 52074 Aachen, Germany
2
Department of Diagnostic and Interventional Radiology, Medical Faculty, University Dusseldorf, 40225 Dusseldorf, Germany
3
Department of Orthopedic and Trauma Surgery, Lucerne Cantonal Hospital, 6000, Lucerne, Switzerland
4
Institute of Molecular and Cellular Anatomy, RWTH Aachen University, 52074 Aachen, Germany
*
Author to whom correspondence should be addressed.
Submission received: 26 July 2021 / Revised: 9 August 2021 / Accepted: 12 August 2021 / Published: 14 August 2021
(This article belongs to the Section Medical Imaging and Theranostics)

Abstract

:
Stress MRI brings together mechanical loading and MRI in the functional assessment of cartilage and meniscus, yet lacks basic scientific validation. This study assessed the response-to-loading patterns of cartilage and meniscus incurred by standardized compartmental varus and valgus loading of the human knee joint. Eight human cadaveric knee joints underwent imaging by morphologic (i.e., proton density-weighted fat-saturated and 3D water-selective) and quantitative (i.e., T1ρ and T2 mapping) sequences, both unloaded and loaded to 73.5 N, 147.1 N, and 220.6 N of compartmental pressurization. After manual segmentation of cartilage and meniscus, morphometric measures and T2 and T1ρ relaxation times were quantified. CT-based analysis of joint alignment and histologic and biomechanical tissue measures served as references. Under loading, we observed significant decreases in cartilage thickness (p < 0.001 (repeated measures ANOVA)) and T1ρ relaxation times (p = 0.001; medial meniscus, lateral tibia; (Friedman test)), significant increases in T2 relaxation times (p ≤ 0.004; medial femur, lateral tibia; (Friedman test)), and adaptive joint motion. In conclusion, varus and valgus stress MRI induces meaningful changes in cartilage and meniscus secondary to compartmental loading that may be assessed by cartilage morphometric measures as well as T2 and T1ρ mapping as imaging surrogates of tissue functionality.

1. Introduction

Magnetic Resonance Imaging (MRI) is considered the most powerful and multifaceted imaging technique of modern medicine and provides the reference standard for joint assessment. Even though clinical MRI techniques are characterized by good-to-excellent diagnostic accuracy in the evaluation of the knee joint [1], early degenerative changes of articular cartilage and the medial and lateral menisci remain difficult to diagnose based on clinical standard MRI techniques [2,3]. Detecting early cartilage and meniscus degeneration at the pre-structural level is merited by the fact that early degeneration may still be reversible. Once structural damage of cartilage and meniscus becomes visible, the damage to the tissue matrix is likely irreversible [4].
Despite recent advances in knee MRI acquisition and processing that relate to morphologic and compositional cartilage imaging, automated image analysis, and hardware improvements (excellently reviewed in [5]), the unphysiological patient position in the MRI scanner, i.e., supine with the joints completely unloaded, may be partially responsible for the diagnostic shortcomings of clinical standard MRI techniques [6,7]. Consequently, recent approaches have combined MRI techniques with simultaneous loading to assess the tissue’s response to loading as an imaging surrogate parameter of its functionality. Recently, static mechanical loading has been combined with continuous 3D-MRI acquisition to measure the intra-tissue strain of articular cartilage [8], while earlier approaches aimed to determine displacement under applied loading by synchronizing loading with the MRI acquisition [9]. Principally, imaging of the knee joint under loading is possible in open low-field MRI scanners (i.e., B0 ≤ 0.5 T) where the patient bears weight [10] or in closed-bore high-field (clinical) MRI scanners (i.e., B0 ≥ 1.5 T) where the patient is loaded by prototypical devices. These devices are positioned in the horizontal bore alongside the patient and make use of optimized signal-to-noise ratio, image resolution, and examination times afforded by higher magnetic field strengths. Such devices most often apply axial loading along the lower extremity’s mechanical axis [7]. However, their handling is oftentimes inconvenient in scientific (and clinical) practice as these devices use suspended weights and pulley systems [11] or induce indirect compressive loading by control of displacement [12] or pressure [13]. Additionally, the lower extremity must be mechanically immobilized as the joint necessarily undergoes flexion and tibial rotation [14], thereby challenging intra- and inter-patient reproducibility and standardization [11,13].
To overcome these difficulties, our group recently proposed an alternative loading mechanism that applies compartmental pressurization of the medial or lateral femorotibial compartment by varus or valgus loading along the joint line, i.e., perpendicular to the mechanical axis [15]. Preliminary evidence in a single human cadaveric knee joint indicated efficient areal pressurization with average decreases in cartilage thickness of 6–9% (medial compartment) and 3–7% (lateral compartment) in response to loading of 15 kp.
The present study aimed to further substantiate these preliminary findings by (i) studying larger sample sizes, by (ii) using quantitative MRI techniques, i.e., T2 and T1ρ mapping, to evaluate the effects of loading on the compositional and (ultra-)structural levels, and by (iii) referencing the loading-induced changes to histologic and biomechanical tissue measures. Our hypotheses were that (i) precise varus and valgus stress MRI induces consistent compartmental pressurization and decreases in cartilage thickness of the loaded compartment (i.e., medial under varus loading and lateral under valgus loading), that (ii) the loading-induced changes in tissue thickness, composition, and (ultra)structure are reflected by associated changes in the T2 and T1ρ maps, and that (iii) these changes are related to histologic and biomechanical measures of cartilage and meniscus.

2. Materials and Methods

2.1. Study Design and Sample Size Estimation

Designed as a prospective in-situ imaging study on human knee joint specimens with intra-individual histologic and biomechanical referencing, the present study had been approved by the responsible Institutional Review Board (Ethical Committee, RWTH Aachen University, AZ-EK180/16) prior to its initiation.
Eight fresh and structural intact knee joints (2 right, 6 left) were obtained from body donors (aged 79.3 ± 4.0 years (mean ± standard deviation)), who had deceased because of unrelated medical conditions. Consequently, body donors whose medical history indicated the presence of bone or knee joint pathology (such as established diagnoses of osteoarthritis, rheumatoid arthritis, soft tissue injuries, Paget’s disease, and others) were excluded a priori. The body donors’ written informed consent was available at study initiation. All relevant local guidelines and regulations were strictly obeyed. Minimum sample size was estimated as five by performing power analyses on the initial three knee joint specimens as is commonly performed in exploratory settings [16]. Using the following framework parameters: power 0.8; probability of type-I-error 0.05; two-tailed procedure; www.statstodo.com (accessed on 1 June 2018)), the effect size (defined as the mean of the paired difference to be detected divided by the expected standard deviation of the paired difference) was determined as 1.6 after measuring the T2 relaxation times of the unloaded and loaded configurations (to 15 kp varus) of a rectangular region-of-interest placed in the central weight-bearing cartilage of the medial femorotibial compartment. To reflect the anticipated variability between T2 and T1ρ, femur and tibia, medial and lateral, and the distinct varus and valgus configurations, the number of included specimens to be included was increased to eight.

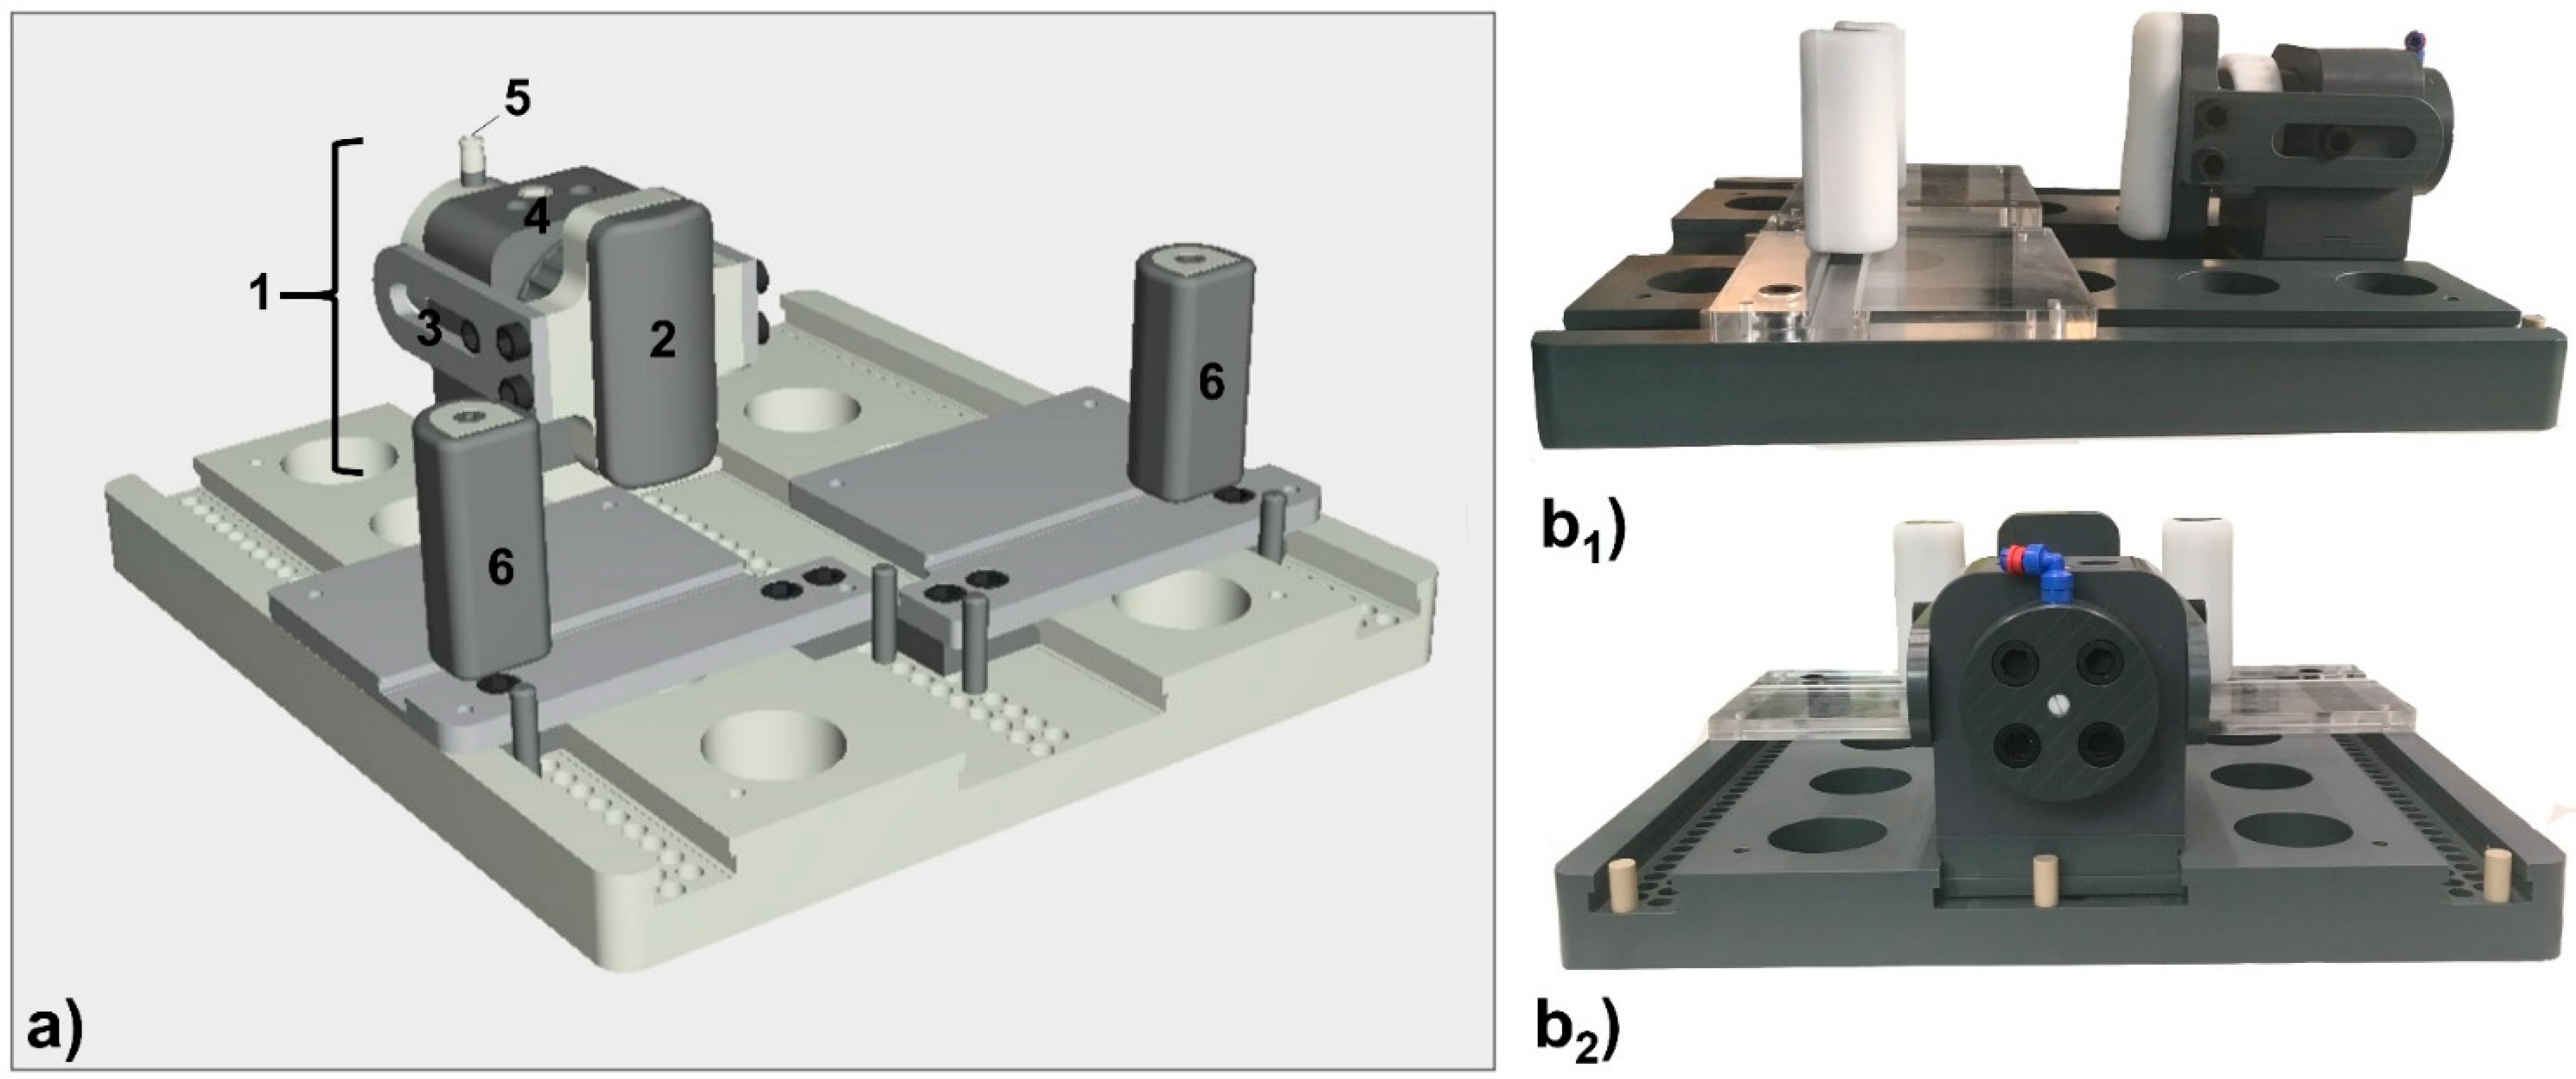
2.2. MRI-Compatible Loading Device

The loading device for compartmental femorotibial compression has been validated before [15] and is shown in detail in Figure A1. Briefly, the device is controlled by pressure and consists of a control unit (outside of the scanner room) and a loading unit (inside the scanner room) that are connected by standard pressure lines. The device is designed along the leverage principle, where compartmental pressurization of the joint is realized by aligning the padded load applicator with the joint line. With two adjustable counter-bearings as opposite fixed points at the thigh and lower leg, the medial (or lateral) femorotibial compartments are loaded by medial (or lateral) pressurization of the joint by inducing varus (or valgus) stress. In the present study, forces of 7.5 kp (=73.5 N), 15 kp (=147.1 N), and 22.5 kp (=220.6 N) were applied to the joints to induce varus and valgus stress and, secondarily, medial and lateral compartment loading.

2.3. Preparation of The Knee Joint Specimens

For the MRI measurements, the knee joints were positioned in the loading device at full extension. Positioning aids and sandbags were used to fix the joints and standardize their positions, while reducing adaptive motion secondary to loading. Practically, the center of the padded load applicator was aligned with the medial and lateral joint line, while the counter-bearings were adjusted to the individual joint’s anatomy and positioned as distant from each other as possible at the lower third of the thigh and the upper third of the lower leg. For the unloaded reference measurements, the components were brought in loose contact with the joint. Subsequently, after connecting the control and loading units to the in-house pressure supply, the system was fully operational.

2.4. Imaging Studies

2.4.1. MRI Studies

For scanning, a clinical 3.0T scanner (Achieva, Philips, Best, The Netherlands) and two-element general-purpose coils (Sense-Flex L, Philips) positioned above and below the joint were used. By means of B0 mapping, the absence of excessive magnetic field inhomogeneity had been determined before [15]. For each joint, serial MRI measurements were conducted in seven sequential configurations:
  • unloaded (δ0);
  • under low intensity of varus loading (7.5 kp, δvar1);
  • under moderate intensity of varus loading (15 kp, δvar2);
  • under high intensity of varus loading (22.5 kp, δvar3);
  • under low intensity of valgus loading (7.5 kp, δvlg1);
  • under moderate intensity of valgus loading (15 kp, δvlg2);
  • and under high intensity of valgus loading (22.5 kp, δvlg3).
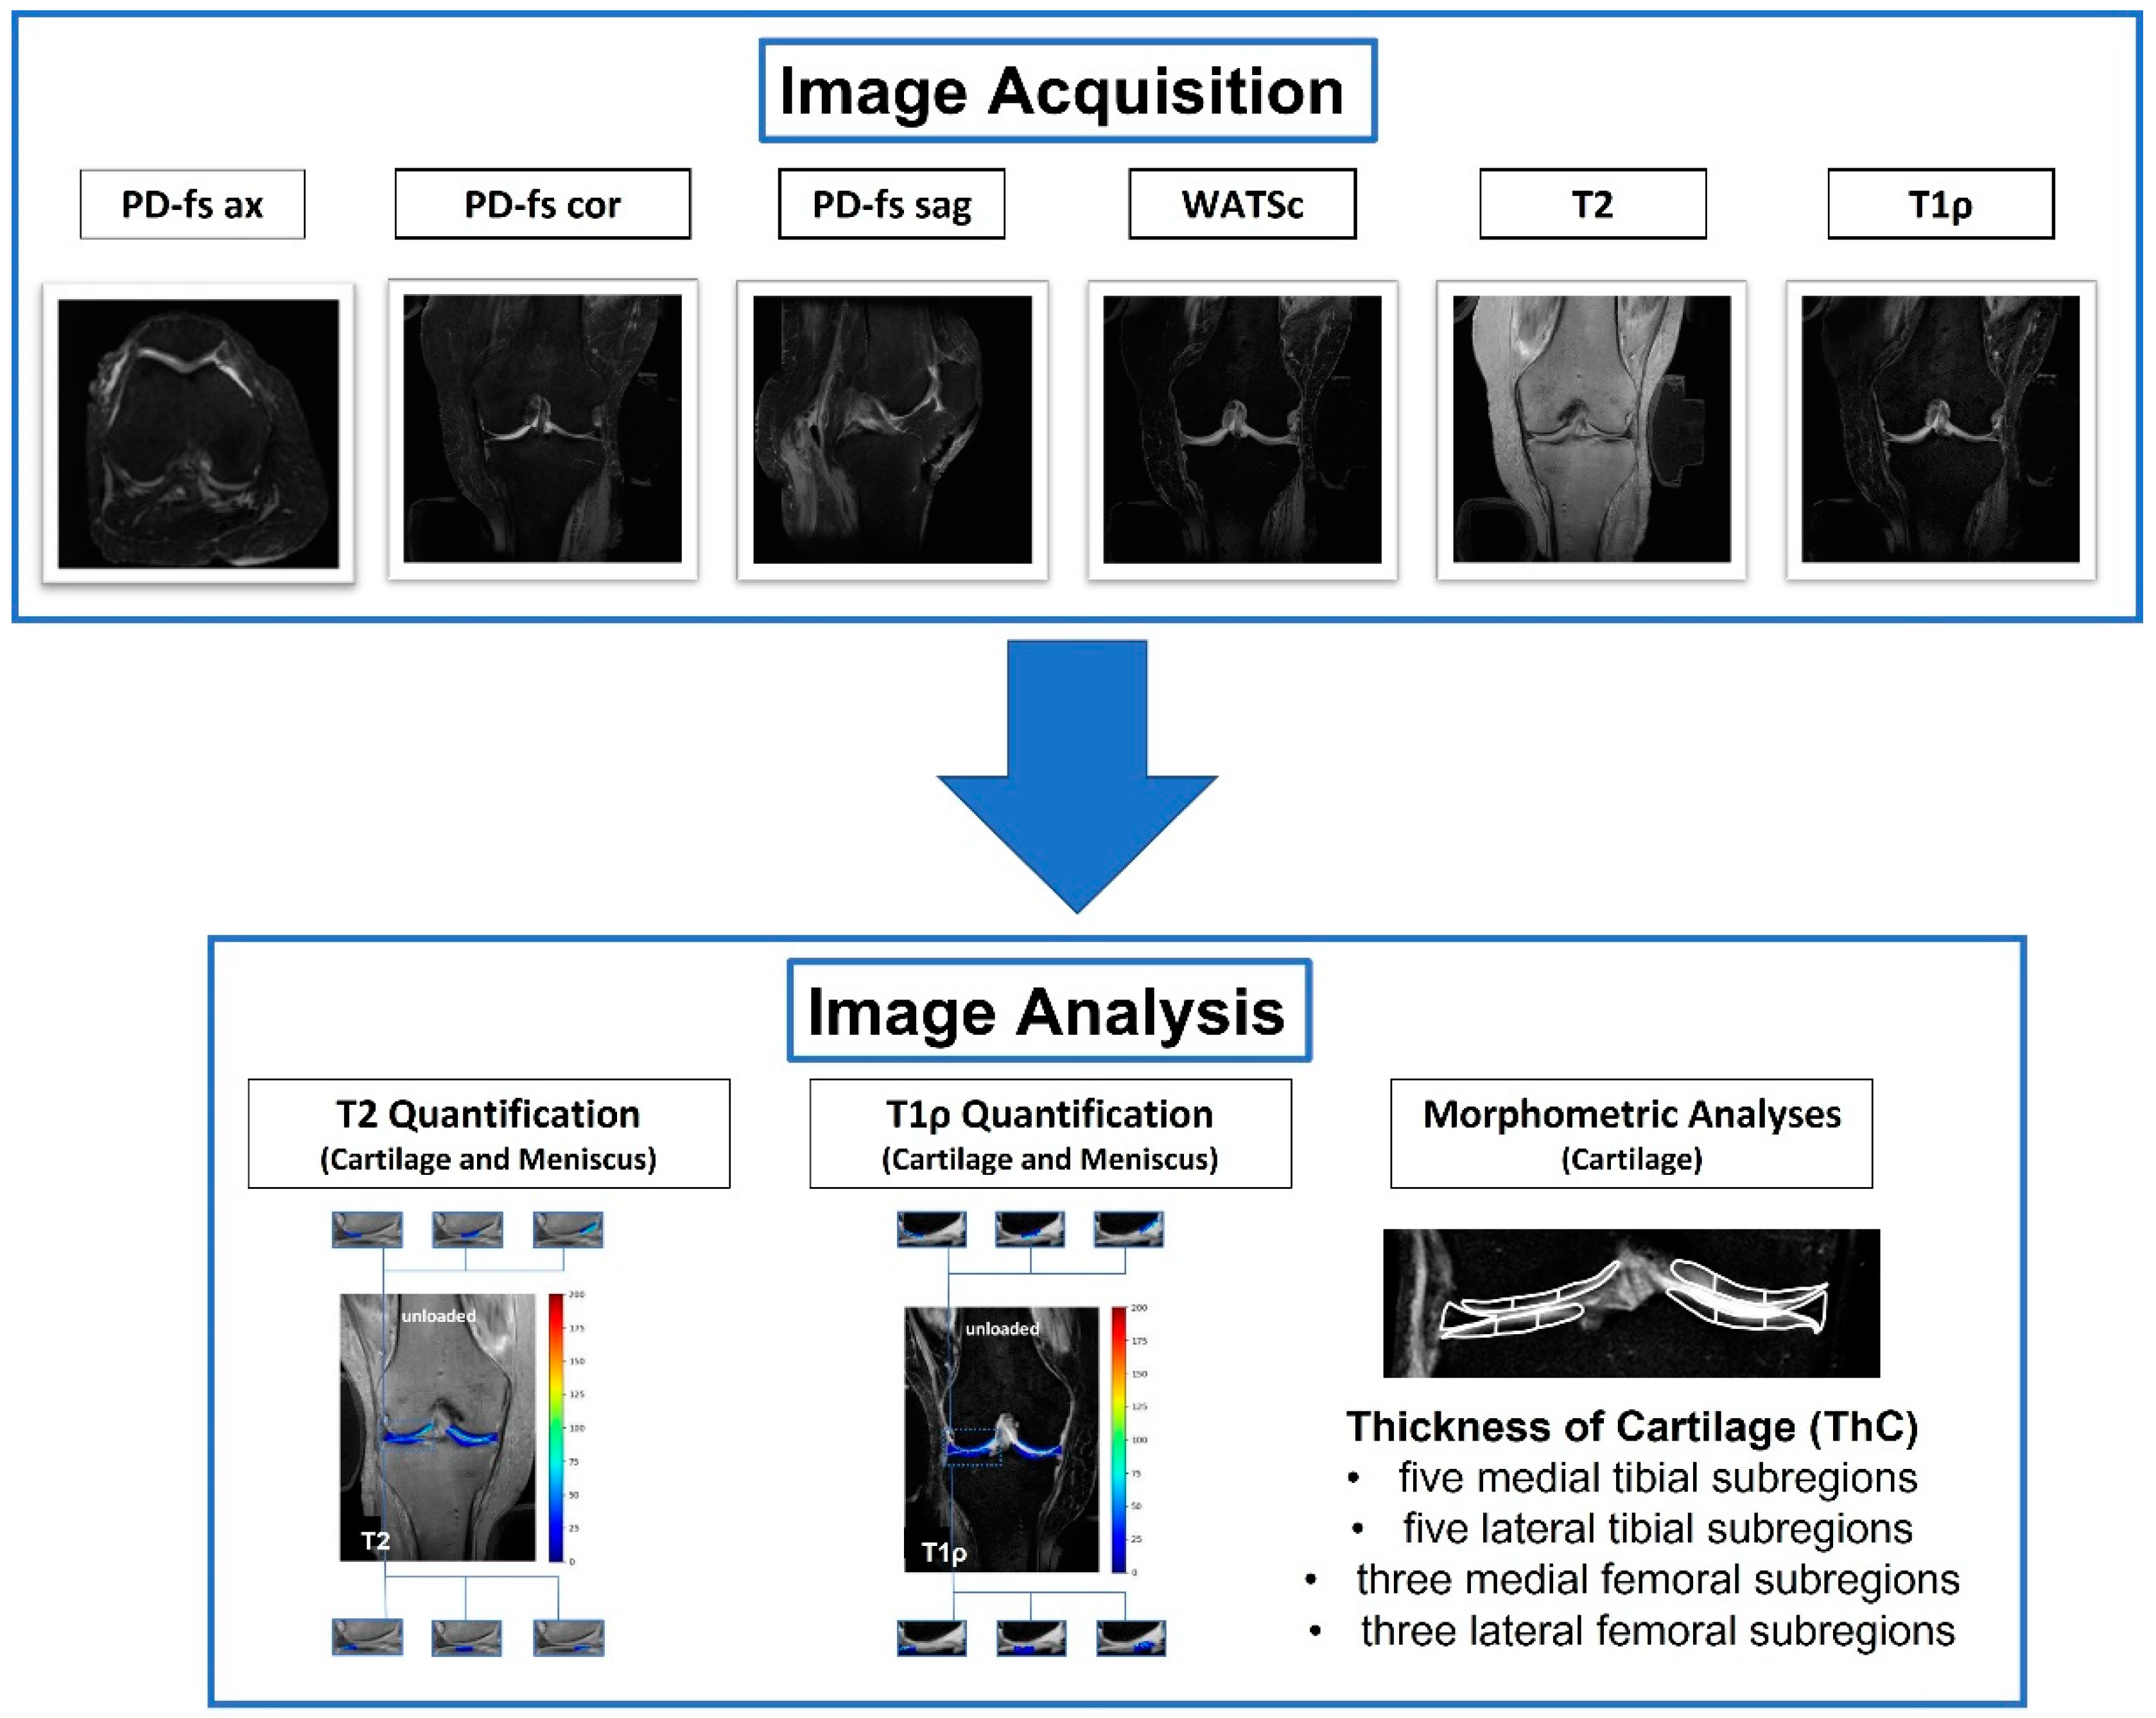
After each change in pressure, an equilibration period of 5 min was observed prior to image acquisition. For each configuration, morphologic sequences, i.e., proton density-weighted fat-saturated (PD-fs) sequences and 3D water-selective cartilage scans (WATSc), and quantitative T2 and T1ρ mapping sequences were acquired as detailed in Table 1. We intended to include the clinical reference sequence for cartilage assessment, i.e., the PD-fs sequence [17], a representative and scientifically validated high-resolution sequence for cartilage segmentation and morphometric analyses, i.e., the WATSc sequence [18], and clinically validated quantitative T2 and T1ρ mapping sequences for assessment of tissue functionality [19]. Proper joint position at each successive configuration was confirmed using the PD-fs sequences. While the PD-fs sequences were acquired in three (δ0) or two orientations (δvar1 to δvlg3), the WATSc and T2 and T1ρ mapping sequences were acquired in the coronal orientation only. For the T2 and T1ρ mapping sequences, only the mid-coronal images were analyzed to reduce the processing burden. Oriented parallel to the posterior condylar line, the mid-coronal plane was identified as the center of the anteroposterior distance between the posterior condylar line and the deepest point of the trochlear groove on axial views. MRI measurements were performed at room temperature and completed within 12 h.
During the unloaded initial scan, the femoral and tibial cartilage of the medial and lateral joint compartments was qualitatively assessed by SN (clinical radiologist, 8 years of experience in musculoskeletal imaging) and any specimens with areal full-thickness cartilage loss, denudation, or eburnation were discarded (two specimens).

2.4.2. CT Studies

Following completion of the MRI studies, the knee joints underwent sequential scanning in the seven sequential configurations and based on the same loading device and configuration on a clinical multidetector-row CT scanner (SOMATOM Force, Siemens, Erlangen, Germany) using the following scan parameters: craniocaudal direction, tube voltage 120 kV, tube current 800 mAs, slice thickness 0.6 mm, rotation time 1 s, increment 3 mm, pitch 0.8, spatial resolution 0.31 × 0.31 mm/pixel, reconstruction kernel Br64s, scan duration 2 s (per configuration). Axial, coronal, and sagittal reconstructions of the joint in the device were generated for each configuration. Analogous to the MRI studies, equilibration periods of 5 min were observed after each change in pressure.

2.5. Image Post-Processing and Analyses

2.5.1. MRI—Morphometric Analysis of Cartilage

For each joint and configuration, the 3D WATSc sequences were used for manual segmentations and morphometric analyses using dedicated software (Chondrometrics GmbH, Ainring, Germany) [20]. In each image, the cartilage surfaces and subchondral bone plates of the medial and lateral femorotibial compartments were labelled manually by blinded readers. An expert reader ascertained reading quality. Based on the segmentation outlines, 3D morphometric reconstructions of the cartilage plates were quantified in terms of cartilage thickness (ThC). Morphometric cartilage measures were thus obtained for the medial femorotibial compartment (MFTC), the lateral femorotibial compartment (LFTC), the medial tibia, the lateral tibia, the central medial femur, and the central lateral femur. For subregional analysis of cartilage changes under loading, the medial and lateral tibia were further partitioned into five subregions, i.e., central, external, internal, anterior, and posterior, while the central medial and lateral femur were further partitioned into three subregions, i.e., central, external, and internal.

2.5.2. MRI—Quantitative Analysis

T2 and T1ρ characteristics were quantified for each cartilage plate, joint, and configuration. By manually delineating each structure using the polygon mode and brush tool of ITK-SNAP software (v3.8, Cognitica, Philadelphia, PA, US), OS (radiologist, 2 years of experience in musculoskeletal imaging) manually segmented the medial and lateral tibial and femoral cartilage plates and the medial (MM) and lateral meniscus (LM) on the respective mid-coronal images. Boundary pixels were eliminated to reduce partial volume effects. Segmentation outlines of the articular cartilage were automatically partitioned into three subregions, i.e., internal, central, and peripheral (from the joint center to the joint periphery), by using a dedicated routine implemented in MATLAB (MatlabR2019a, Natick, MA, US) that divided the horizontal dimension of the entire cartilage plate into thirds. Segmentation outlines were checked by SN and validated against the corresponding WATSc images. These post-processing routines were implemented in MATLAB as before [21,22].
For each joint and configuration, meniscal extrusion was measured by OS using the mid-coronal images of the PD-fs sequence and the in-house picture archiving and communication system (PACS, iSite®, Philips) and its standard image analysis features. To this end, the horizontal distance was determined between the tibia plateau’s point of transition from horizontal to vertical and the outermost contour of the medial or lateral meniscus body [23].

2.5.3. CT

CT datasets were analyzed to determine the joint’s alignment as a function of configuration. Because of the larger field of view, CT scans visualized the entire joint and loading device so that measures of joint alignment in the device could be taken on the respective CT scans. Joint alignment was quantified by determining the angles between the tibial and femoral shafts on sagittal (“joint extension” (popliteal angle)) and coronal reconstructions (“joint deviation” (lateral angle)) as well as between a line joining both corners of the patella and the horizontal line on axial reconstructions (“joint rotation”) (Figure 1). OS performed these measurements using the in-house PACS. Blinding proved impractical because each joint’s configuration was easily discernible.

2.6. Reference Measures

After imaging, the knee joints underwent histologic and biomechanical referencing. The joints were accessed through the medial parapatellar approach, and the cartilage surfaces and menisci were fully exposed after transection of the collateral and cruciate ligament complex. To align the mid-coronal plane (identified during imaging) with the central weightbearing portion of the femur and tibia (identified during post-hoc preparations), tissue-marking dye (Polysciences, Warrington, FL, US) was applied to mark the respective planes and to guide sampling of the adjacent joint surfaces. The medial and lateral meniscus body regions were sampled similarly.

2.6.1. Histologic Reference

Following simultaneous decalcification and fixation using Ossa fixona (Diagonal, Münster, Germany) for cartilage or fixation using 4% paraformaldehyde for meniscus, cartilage and meniscus were sectioned along the mid-coronal plane as identified above. Sectioned tissues were embedded in paraffin, sliced to 5-µm sections, stained with Safranin O and hematoxylin/eosin, and visualized using a standard light microscope (Leica DMI6000 B, Leica, Wetzlar, Germany) [24,25]. If necessary, individual micrographs were automatically stitched to obtain entire-sample visualizations by use of dedicated software applications (Leica Application Suite X, Leica). Semi-quantitative grading was individually performed by two investigators (OS and SN). Grading of the cartilage was based on a modified OARSI (Osteoarthritis Research Society International) grading system [26] that only considered the grade of degeneration (score, 0 (intact)—6 (most severe degeneration)) to describe the extent of degenerative changes along the cartilage thickness. Meniscus samples were graded in line with the Pauli classification [27] that takes into account surface integrity (score, 0–3 (for the femoral, tibial, and inner surface each)), cellularity (score, 0–3), collagen organization (score, 0–3), and matrix staining (score, 0–3). The itemized scores were summed (range, 0–18) and used to allocate the tissue to one of four grades, i.e., grade 1 (intact; sum score, 0–4), grade 2 (early degenerative; sum score 5–9), grade 3 (moderately degenerative; sum score, 10–14), and grade 4 (severely degenerative; sum score, 15–18). If scores differed between the readers, histologic sections were re-evaluated until consensus was reached.

2.6.2. Biomechanical Reference

Cartilage-only tissue was prepared from the femoral and tibial surfaces by harvesting cartilage plugs of 8 mm diameter through a skin biopsy punch (pfm-medical, Cologne, Germany) and by removing the subchondral lamella and bone. Tissue thickness was determined via digital micrometry (Mitutoyo 293-521; Mitutoyo, Tokyo, Japan). Then, the cartilage-only samples underwent unconfined compression tests using a mechanical testing machine (Zwick/Roell Z2.5; Zwick/Roell, Ulm, Germany) that was equipped with a compressive piston (20 mm diameter) and a load cell (200 N force range). The loading protocol employed a strain rate of 0.15% strain/s to a maximum strain of 21% [28] and assessed primarily the contribution of fluid pressurization and—to a lesser extent—the contribution of fibril reinforcement [29]. Displacement–load data were obtained (TestXpert, Zwick/Roell) and used to compute the Instantaneous Young Modulus (IYM) as the ratio of stress and strain by fitting a tangent to the strain range of 10–20%. Samples were kept hydrated throughout the measurements.

2.7. Statistical Analysis

Statistical analysis was carried out by OS using SPSS Statistics (v28, Armonk, NY, US). δ0 denotes the respective parameter value in the unloaded configuration, while δvar1, δvar2, δvar3, δvlg1, δvlg2, and δvlg3 refer to the parameter values in the various configurations of loading. Relative changes were determined by referencing the parameter values to δ0. Assuming normal distributions, measurements of ThC, meniscus extrusion, joint extension, deviation, and rotation were compared between each configuration using repeated-measures ANOVA followed by Tukey’s post-hoc test. Not assuming normal distributions, the absolute T2 and T1ρ values were compared using Friedman’s test followed by Dunn’s post-hoc test. To reduce the number of comparisons and to counteract the problem of multiple comparisons, post-hoc tests were performed only between the loaded compartment’s configurations, for example, between δ0, δvar1, δvar2, and δvar3 (in case of varus loading of the medial compartment), and the Bonferroni correction was applied. Additionally, the level of significance was set to p ≤ 0.01 to reduce the number of statistically significant, yet scientifically (most likely) irrelevant findings.

3. Results

All knee joints underwent full MRI and CT imaging under loading and subsequent biomechanical and histologic referencing.
Mean ThC values decreased significantly in response to varus loading, both in the femoral and tibial cartilage of the MFTC (p < 0.001). Corresponding decreases were noted for the LFTC in response to valgus loading, even though statistical significance was only found for the femoral (p < 0.001) and not for the tibial cartilage (p = 0.117) (Table 2).
By and large, ThC gradually decreased with increasing loading intensity. Analysis of the distinct subregions corroborated these findings and indicated that significant decreases in ThC occurred primarily in the external, central, and internal subregions of the femoral and tibial cartilage (p ≤ 0.002) (Table A1 (Appendix A)).
In cartilage, T1ρ decreased under loading in both compartments (Table 3). Significant decreases in T1ρ were found for the lateral tibia only (p = 0.001), while for the medial femur, they tended towards significance (p = 0.034). These findings were confirmed by the subregional decreases in T1ρ that were significant in the internal, central, and peripheral regions of the lateral tibia (0.001 ≤ p ≤ 0.009) (Table A2 (Appendix A)).
In cartilage, T2 increased under loading in both compartments. These increases were statistically significant for the medial femur (p = 0.004) and the lateral tibia (p < 0.001) (Table 4). Subregionally, these increases were significant primarily in the central subregion (p ≤ 0.006) (Table A3 (Appendix A)).
Interestingly, loading-induced changes in ThC, T1ρ, and T2 tended to plateau between the δvar2 (or δvlg2) and δvar3 (or δvlg3) configurations despite increasing loading intensities. Consequently, no linear association of the respective parameters’ changes and increased loading intensities were found.
For the medial and lateral menisci (Table 5), loading-induced decreases in T1ρ were gradual and closely related to loading intensity. These decreases were significant for the medial meniscus under varus loading (p = 0.001) and tended towards significance for the lateral meniscus under valgus loading (p = 0.020). Loading-induced increases in T2 were not significant, neither for the medial (p = 0.247) nor for the lateral meniscus (p = 0.022). Similarly, meniscal extrusion increased slightly, yet not significantly under loading.
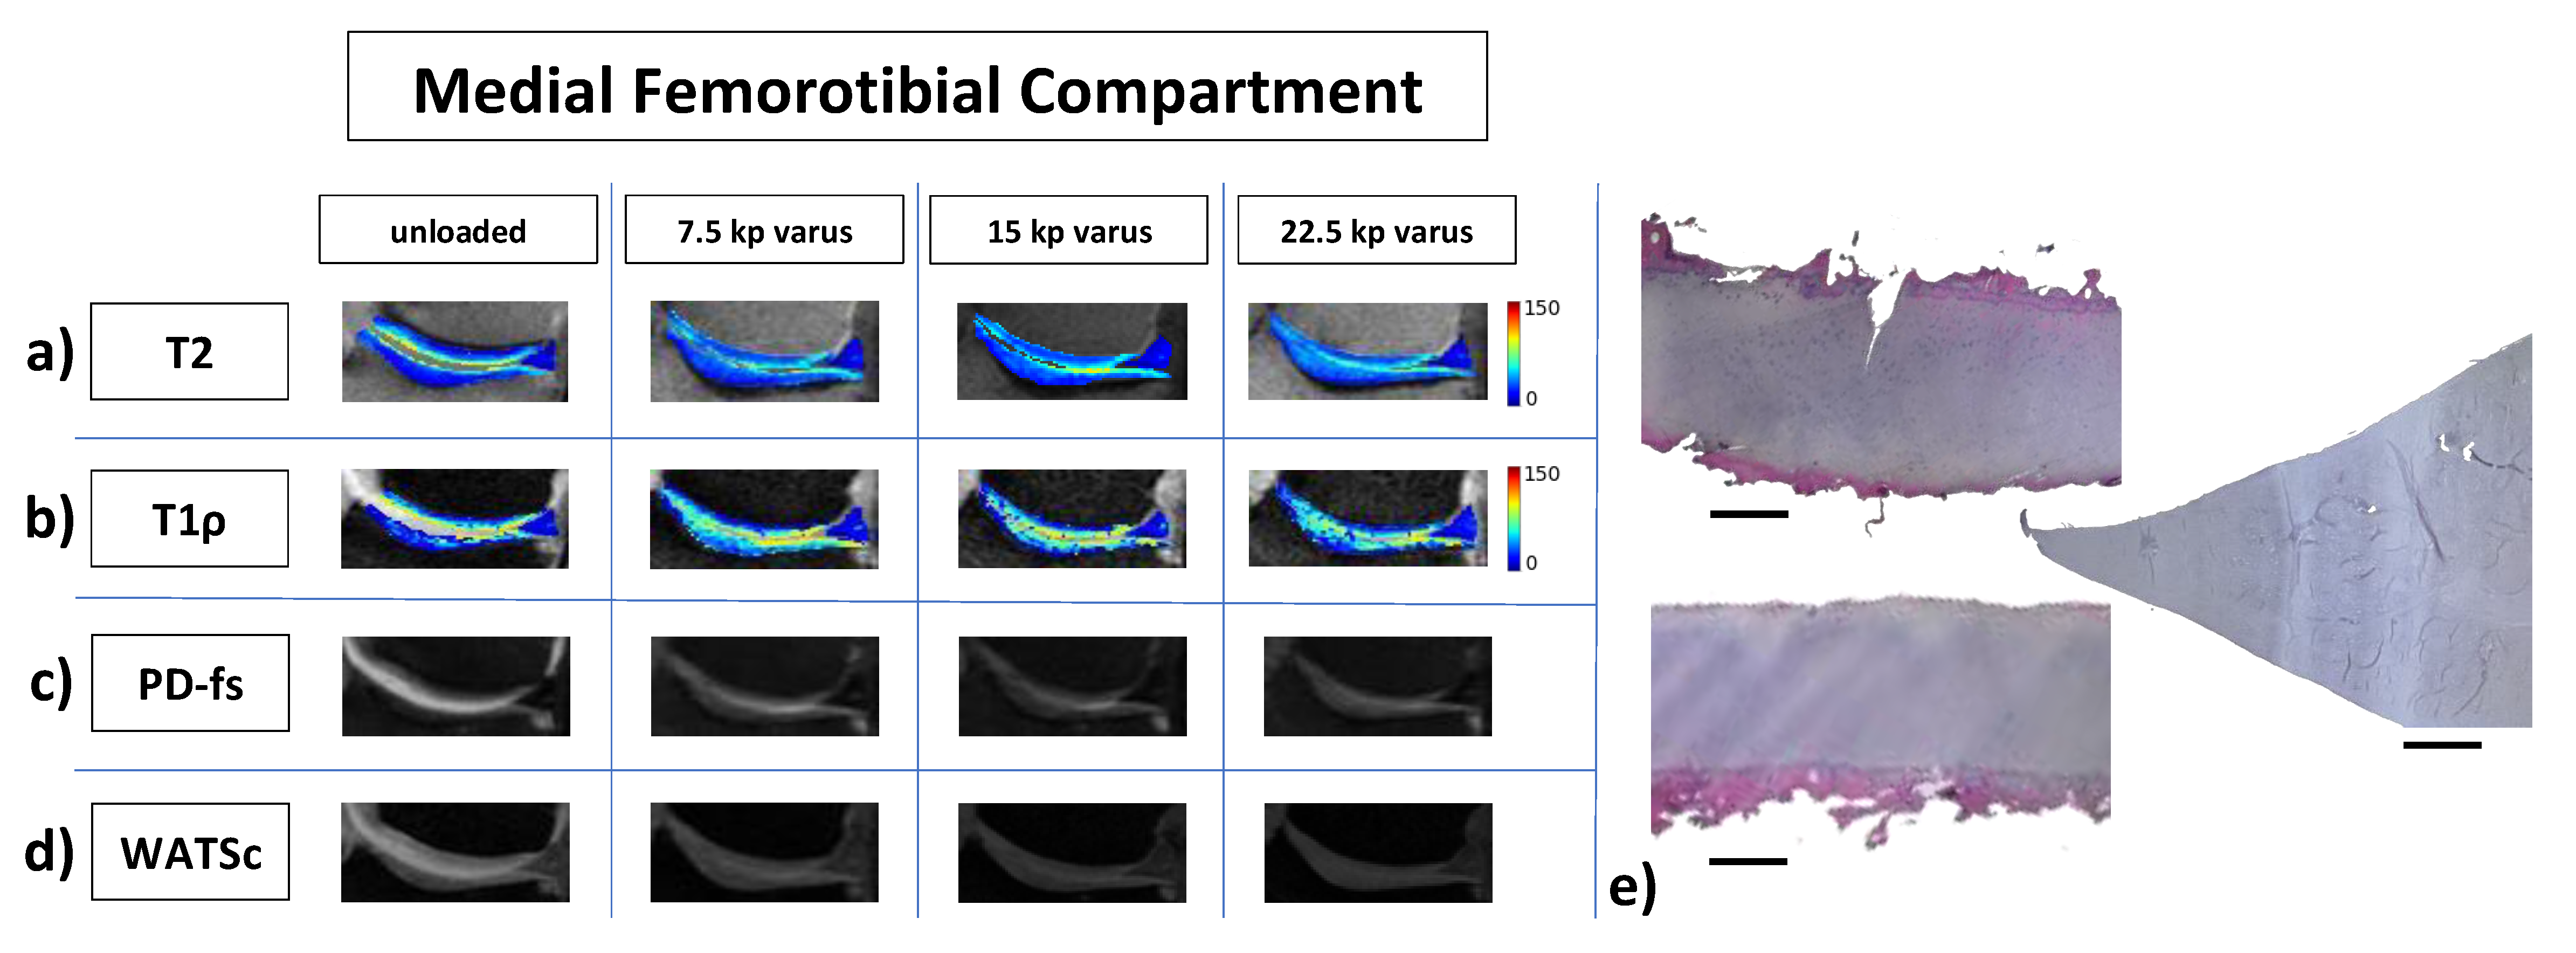
Qualitatively, Figure 2 and Figure 3 indicate the loading-induced changes of the MFTC (Figure 2) and the LFTC (Figure 3) in a representative knee joint and in reference to respective histologic sections.
Joint alignment as assessed by CT was related to loading intensity and configuration (Table 6). As expected, joint deviation angles that were measured on the lateral side of the joint increased (or decreased) significantly under varus (or valgus) loading (p < 0.001), thereby indicating more varus and valgus morphotypes under loading. Joint extension angles decreased significantly under loading (p < 0.001), indicating steadily increasing joint flexion under loading, yet changes were more pronounced under varus than valgus loading. Joint rotation was significantly different, too, with external rotation observed under varus loading and internal rotation under valgus loading. Taken together, the joints tended to undergo moderate flexion and external rotation under varus loading as well as slight flexion and internal rotation under valgus loading.
Reference evaluation indicated variable, yet largely mild-to-moderate histologic degeneration of cartilage and meniscus and relatively uniform biomechanical properties of cartilage. Mean modified OARSI scores for cartilage were 1.9 ± 1.2 (range, 0–3) for the medial tibia, 2.1 ± 1.6 (range, 0–4.5) for the medial femur, 1.4 ± 1.3 (range, 0–3.5) for the lateral tibia, and 1.8 ± 1.2 (range, 0–4) for the lateral femur. These findings were reflected by mean Pauli grades for the medial (2.1 ± 1.1 (range, 1–4)) and lateral meniscus (2.3 ± 1.2 (range, 1–4)), indicating mild-to-moderate degeneration of both menisci. Mean IYM values of the cartilage-only samples were 1.0 ± 0.7 MPa (range, 0.3–2.1) for the medial tibia, 1.4 ± 1.0 MPa (range, 0.1–3.4) for the medial femur, 1.0 ± 1.1 MPa (range, 0.1–2.5) for the lateral tibia, and 1.0 ± 0.7 MPa (range, 0.3–2.4) for the lateral femur.
Because of the small sample size, correlations between image-based measures of tissue functionality, i.e., loading-induced changes in T2 or T1ρ, and histologic or biomechanical reference measures were not determined.

4. Discussion

The most important finding of this study is that, in situ, T1ρ and T2 are reflective of loading-induced adaptive changes of cartilage and meniscus under varus and valgus loading and thereby complement the morphologic and morphometric evaluation of these tissues. Moreover, this study defines normative values of the response-to-loading patterns in cartilage and meniscus as a function of the joint compartment, region, subregion and in reference to histologic and biomechanical measures.
Across the joint, T1ρ decreased in cartilage and meniscus under loading, even though these changes were only significant in the lateral tibia and medial meniscus. Considering the still unclear association of T1ρ with the distinct structural and compositional cartilage constituents, these changes are most likely brought about by a variety of processes. Some authors highlighted the association of T1ρ to tissue hydration [30], proteoglycan content [31], and collagen network properties [32] and the loading-induced changes in these tissue properties are likely responsible for the underlying changes in T1ρ. Literature data on changes of T1ρ under loading are heterogeneous, with some authors reporting decreases [33,34] and increases [35]. Nonetheless, decreases in T1ρ are plausible as cartilage is compressed under loading and its solid phase, largely made up of proteoglycan and collagen [36], is densified [37], thereby increasing the relative amount and density of proteoglycans and collagens and decreasing T1ρ values [38]. Additionally, rheological properties of the fluid phase, made up of the interstitial fluid [36], within this densified framework are consequently reduced [39] and fluid is secondarily redistributed within the tissue [40] as well as partially lost into the synovial fluid [37], which also decreases T1ρ values [41].
For T2, our findings were more ambiguous with variable and—in parts—undulating increases in articular cartilage and meniscus found in response to loading. These increases were only significant for the medial femur and lateral tibia, however. The exact correlates of T2 remain controversial, too, with associations to water content [42], concentration of proteoglycans [43] and collagens [44], and anisotropy of the collagen network [45] discussed in the literature. Similarly, the changes in cartilage and meniscus to be expected under loading remain controversial, too, with some authors reporting increases [6,46] and others reporting decreases [33,47]. Despite our best efforts, our study does not clarify this situation and indicates the need for additional research.
Likely, the substantial standard deviations prevented clearer inferences for both T2 and T1ρ. Yet, the overall changes under loading and, thus, the dynamic range were larger for T1ρ, which is in line with earlier reports [13]. This, in turn, confirms that the distinctly different structural, compositional, and biophysical profiles of both parameters translate to distinctly different mechanosensitivities.
Caution should be exercised when directly comparing our and other studies because differences in study design, experimental setup, and the imaging framework need to be considered. Most previous studies were conducted in vitro on excised cartilage samples [46,48,49] and did thus not consider the actual physiological interactions of cartilage and meniscus with the surrounding joint structures. Differences in MRI acquisition parameters, e.g., the number and spacing of echo times (for T2) and the number, duration, and amplitude of spin-lock pulses (for T1ρ), in-plane resolution and slice thickness, let alone variable post-processing methodologies, add another layer of complexity to the interpretation of these findings. While most previous studies focused on axial compression of the joint along the mechanical axis, we used varus and valgus loading perpendicular to the mechanical axis. Obviously, this type of loading is inherently different and characterized by substantially lower forces within the joint [15], thereby decreasing comparability, too. Another important aspect pertains to the coil to be used for imaging. In this study, standard two-element general-purpose coils as provided by the MRI vendor were used. When bearing the future in vivo application in mind, flexible coils provide a close fit around the joint and, thus, increased signal-to-noise ratio and patient comfort, which is a promising alternative for stress MRI of the knee joint [50,51].
Surprisingly, the quantitative values of ThC, T1ρ, and T2 were not linearly associated with loading intensity but plateaued for moderate and strong loading. Even though earlier studies investigating stress radiography of the knee joint applied various pressure levels ranging between 3 and 30 kp [52], our findings indicate that moderate loading of up to 15 kp is sufficiently efficient to study cartilage functionality, thereby corroborating earlier findings [15]. Higher loading intensities seem not justified in the context of functional joint imaging as the additional diagnostic benefit is unclear, while the risk of harm to the patient is increased.
Another important aspect to consider is the reversibility of the loading-induced changes in cartilage. During post-loading recovery, (ultra)structural and compositional recovery is guided by elastic and osmotic adaptive processes that eventually restore the tissue to its original shape and height, which involves equilibration and homoeostasis of associated biophysical processes. The time demand of the post-loading recovery is related to the loading magnitude, type, and other biomechanical parameters, and literature data indicate that it may be slow and that it may take minutes to hours until full recovery of the pre-loading configuration has been reached [34,49,53,54,55]. As the cartilage changes over time were not addressed in this study, future studies need to further assess the temporal interplay of mechanical loading and image acquisition in the interest of equally safe, efficient, and diagnostically beneficial clinical translation.
Biomechanical reference measures were relatively homogeneous which is most likely due to the fact that biomechanical properties of cartilage are more closely associated with extracellular matrix integrity than with extracellular matrix composition [56]. As cartilage was found to display mild-to-moderate degeneration, biomechanical properties were not expected to be substantially altered.
Our study had several limitations. First, this study’s in situ design limits transferability to the clinical setting as we only studied the joint’s static stabilizers, while not considering the joint’s dynamic stabilizers. Nonetheless, our findings may provide guidance and direction for future in vivo studies on volunteers and patients. Second, cartilage zones were not considered in this pilot study that aimed to assess the diagnostic value of T1ρ and T2 mapping by stress MRI, while keeping the amount of data manageable. Third, this study focused on T1ρ and T2 that are considered to be the most promising cartilage imaging techniques [3,57], yet did not consider other advanced MRI techniques such as delayed gadolinium-enhanced MRI of cartilage (dGEMRIC) [58], glycosaminoglycan Chemical Exchange Saturation Transfer (gagCEST) [59] or sodium imaging [60]. Fourth, we only included knee joint specimens of elderly body donors, which account for the tissues’ mild-to-moderate degeneration (as assessed histologically) and may be responsible for slightly different biomechanical behavior as compared to clinical populations [6]. Fifth, the joints underwent substantial adaptive motion and altered joint alignment that was related to the type and intensity of loading. Since the femur and tibia were not mechanically confined when loaded (unlike the in vivo situation in patients), the adaptive motion certainly changed the femorotibial contact areas that gradually moved posteriorly with increasing flexion, peripherally with increasing deviation, and variably with increasing rotation. Consequently, despite our best efforts to exactly match the mid-coronal imaging plane (for T2 and T1ρ quantification) with the histologic and biomechanical reference modalities, matching may have been inaccurate due to the loading-induced adaptive motion.

5. Conclusions

In conclusion, precise varus and valgus loading of the knee induces compartmental pressurization and alters the structure and composition of cartilage and meniscus that may be assessed by cartilage morphometry and T2 and T1ρ mapping. Once validated in future clinical and basic research studies, the response-to-loading patterns may be used as imaging surrogates of tissue functionality.

Author Contributions

Conceptualization, O.S., J.S., P.S. and S.N.; methodology, O.S., J.S., P.S. and S.N.; software, O.S., J.S., M.K., D.T. and S.N.; validation, O.S., J.S., C.K., T.N., D.T. and S.N.; formal analysis, O.S., J.S., D.B.A., P.S., C.K., T.N., M.K., A.P., D.T. and S.N.; investigation, O.S., J.S., D.B.A., D.T. and S.N.; resources, O.S, J.S., C.K., A.P. and S.N; data curation, O.S, J.S., P.S., D.T. and S.N..; writing—original draft preparation, O.S.; writing—review and editing, J.S. and S.N.; visualization, O.S., J.S., D.B.A., T.N. and S.N.; supervision, P.S., S.N.; project administration, P.S., D.T. and S.N.; funding acquisition, S.N. All authors have read and agreed to the published version of the manuscript.

Funding

This work was supported by the Deutsche Forschungsgemeinschaft (grant number: NE 2136/3-1) and the START Program of the Faculty of Medicine, RWTH Aachen, Germany (grant number: 691905).

Institutional Review Board Statement

The study was conducted according to the guidelines of the Declaration of Helsinki, and approved by the Ethical Committee, Medical Faculty, RWTH Aachen University (EK180/16).

Informed Consent Statement

Informed consent was obtained from all body donors involved in the study prior to their demise.

Data Availability Statement

The data not contained in the manuscript or appendix is available from the corresponding author upon reasonable request.

Acknowledgments

The authors would like to acknowledge the MR image segmentation and computation work provided by Chondrometrics GmbH (Ainring, Germany) and the assistance of the Institute of Anatomy (“Körperspendewesen”, RWTH Aachen University).

Conflicts of Interest

The authors do not have any financial, consulting, or personal relationships with other people or organizations to disclose. The acknowledged sponsors, i.e., Deutsche Forschungsgemeinschaft and RWTH Aachen University, had no role in the study design; in the collection, analysis and interpretation of data, in the writing of the report; and in the decision to submit the manuscript for publication.

Appendix A

Figure A1. Loading unit of the MRI-compatible pressure-controlled loading device. (a) Schematic visualization of the components. (1) Pneumatic mechanism, (2) padded pressure applicator, (3) safety rails, (4) encasement, (5) pressure port, (6) padded counter-bearings. (b) Unloaded device as viewed from the side (b1) and the rear (b2).
Diagnostics 11 01476 g0a1
Figure A2. Workflow of image acquisition and analysis. For each joint specimen and loading configuration, PD-weighted fat-saturated (PD-fs) sequences were acquired in the axial (ax), coronal (cor) and sagittal (sag) orientation as well as 3D water-selective cartilage scans (WATSc), and quantitative T2 and T1ρ mapping sequences. The MR data were then analysed to reconstruct quantitative T2 and T1ρ maps, while morphologic sequences were used for segmentation and morphometric analyses.
Diagnostics 11 01476 g0a2
Table A1. Mean cartilage thickness of the distinct subregions of the medial and lateral femur and tibia as a function of loading. Mean ± standard deviation (mm) (mean percentage change versus δ0 (%)). Statistical analysis was performed using repeated measures ANOVA and statistically significant findings are highlighted in bold type. Abbreviations: central medial femur (cMF), central lateral femur (cLF), medial tibia (MT), lateral tibia (LT). Please refer to Table 2 for additional details on table organization.
CompartmentRegionSubregionδ0δvar1 or vlg1δvar2 or vlg2δvar3 or vlg3p-Value
Medial CompartmentTibiaCentral subregion of MT2.14 ± 0.392.10 ± 0.37 (−1.9)2.06 ± 0.35 (−3.6)2.04 ± 0.35 (−4.5)0.002
External subregion of MT1.25 ± 0.261.21 ± 0.29 (−3.2)1.18 ± 0.29 (−5.8)1.20 ± 0.31 (−4.6)<0.001
Internal subregion of MT1.79 ± 0.221.76 ± 0.20 (−1.7)1.73 ± 0.20 (−3.4)1.73 ± 0.20 (−3.4)<0.001
Anterior subregion of MT1.54 ± 0.191.51 ± 0.18 (−1.9)1.52 ± 0.19 (−1.4)1.50 ± 0.20 (−2.6)0.124
Posterior subregion of MT1.30 ± 0.221.27 ± 0.19 (−2.6)1.25 ± 0.20 (−4.2)1.26 ± 0.21 (−3.4)0.104
FemurCentral subregion of cMF1.93 ± 0.401.90 ± 0.44 (−1.3)1.89 ± 0.44 (−2.0)1.87 ± 0.46 (−2.8)0.002
External subregion of cMF1.20 ± 0.291.17 ± 0.30 (−2.4)1.17 ± 0.30 (−2.8)1.14 ± 0.30 (−5.3)<0.001
Internal subregion of cMF1.62 ± 0.451.62 ± 0.46 (−0.1)1.60 ± 0.45 (−1.5)1.61 ± 0.45 (−1.0)0.011
Lateral CompartmentTibiaCentral subregion of LT3.06 ± 0.713.02 ± 0.64 (−1.2)3.00 ± 0.67 (−1.7)2.97 ± 0.64 (−2.9)0.256
External subregion of LT1.44 ± 0.201.44 ± 0.19 (−0.1)1.40 ± 0.21 (−2.8)1.40 ± 0.21 (−2.8)0.303
Internal subregion of LT1.91 ± 0.361.89 ± 0.39 (−1.1)1.90 ± 0.39 (−0.3)1.89 ± 0.38 (−1.3)0.426
Anterior subregion of LT1.66 ± 0.281.65 ± 0.26 (−1.0)1.64 ± 0.27 (−1.6)1.63 ± 0.29 (−2.2)0.141
Posterior subregion of LT1.64 ± 0.391.67 ± 0.38 (1.9)1.65 ± 0.39 (0.4)1.61 ± 0.36 (−2.0)0.103
FemurCentral subregion of cLF2.19 ± 0.442.19 ± 0.36 (0.1)2.16 ± 0.36 (−1.6)2.18 ± 0.36 (−0.7)<0.001
External subregion of cLF1.52 ± 0.281.50 ± 0.28 (−1.1)1.46 ± 0.27 (−3.7)1.47 ± 0.26 (−3.1)<0.001
Internal subregion of cLF1.67 ± 0.341.68 ± 0.32 (0.5)1.67 ± 0.33 (−0.2)1.68 ± 0.31 (0.6)0.288
Table A2. Mean absolute T1ρ relaxation times of femoral and tibial cartilage subregions in response to loading. Mean ± standard deviation (ms) (mean percentage change versus δ0 (%)). Statistical analysis was performed using Friedman’s test and statistically significant findings are highlighted in bold type. Please refer to Table 2 for additional details on table organization.
CompartmentRegionSubregionδ0δvar1 or vlg1δvar2 or vlg2δvar3 or vlg3p-Value
Medial compartmentTibiaInternal third of MT43.8 ± 22.435.6 ± 18.0 (−18.7)33.4 ± 10.6 (−23.7)31.6 ± 8.8 (−27.9)0.092
Central third of MT56.7 ± 36.446.8 ± 22.3 (−17.5)41.8 ± 18.3 (−26.3)36.8 ± 17.0 (−35.1)0.772
Peripheral third of MT71.5 ± 46.651.2 ± 21.1 (−28.4)44.7 ± 14.3 (−37.5)46.5 ± 26.6 (−35.0)0.754
FemurInternal third of MF97.5 ± 28.365.0 ± 24.4 (−33.3)69.1 ± 24.6 (−29.1)69.1 ± 35.8 (−29.1)0.186
Central third of MF81.8 ± 32.361.6 ± 18.3 (−24.7)61.7 ± 21.0 (−24.6)57.4 ± 27.2 (−29.8)0.138
Peripheral third of MF87.7 ± 42.350.4 ± 13.9 (−41.1)49.9 ± 18.8 (−42.5)49.5 ± 24.8 (−43.6)0.064
Lateral compartmentTibiaInternal third of LT69.5 ± 34.749.4 ± 20.9 (−28.9)43.9 ± 26.0 (−36.8)36.4 ± 20.0 (−47.6)0.006
Central third of LT50.4 ± 30.539.9 ± 17.1 (−20.8)29.7 ± 13.8 (−41.1)34.7 ± 17.1 (−31.2)0.001
Peripheral third of LT62.2 ± 30.650.9 ± 25.1 (−18.2)44.9 ± 26.2 (−27.8)40.9 ± 22.8 (−34.2)0.009
FemurInternal third of LF78.6 ± 31.873.4 ± 25.8 (−6.6)78.8 ± 33.1 (0.3)80.9 ± 27.9 (2.9)0.768
Central third of LF70.2 ± 27.060.1 ± 17.6 (−14.4)51.1 ± 14.3 (−27.2)53.4 ± 16.5 (−23.9)0.674
Peripheral third of LF67.9 ± 17.454.3 ± 20.9 (−20.0)45.5 ± 18.8 (−33.0)47.4 ± 22.9 (−30.2)0.053
Table A3. Mean absolute T2 relaxation times of femoral and tibial cartilage subregions in response to loading. Mean ± standard deviation (ms) (mean percentage change versus δ0 (%)). Statistical analysis was performed using Friedman’s test and statistically significant findings are highlighted in bold type. Please refer to Table 2 for additional details on table organization.
CompartmentRegionSubregionδ0δvar1 or vlg1δvar2 or vlg2δvar3 or vlg3p-Value
Medial compartmentTibiaInternal third of MT25.9 ± 7.524.8 ± 8.8 (−4.2)28.7 ± 12.3 (10.8)29.7 ± 10.9 (14.7)0.011
Central third of MT31.1 ± 10.430.4 ± 9.9 (−2.3)34.3 ± 17.9 (10.3)32.8 ± 14.4 (5.5)0.990
Peripheral third of MT38.7 ± 7.840.4 ± 9.1 (4.4)39.5 ± 9.3 (2.1)39.4 ± 7.8 (1.8)0.081
FemurInternal third of MF39.9 ± 11.144.1 ± 10.7 (10.5)44.7 ± 10.9 (12.0)46.4 ± 10.1 (16.3)0.186
Central third of MF32.7 ± 8.036.4 ± 14.5 (11.3)38.4 ± 13.7 (17.4)40.1 ± 14.8 (22.6)0.005
Peripheral third of MF35.4 ± 8.137.5 ± 10.0 (5.9)39.9 ± 10.6 (12.7)40.8 ± 16.6 (15.3)0.013
Lateral compartmentTibiaInternal third of LT31.6 ± 9.238.1 ± 11.4 (20.6)31.8 ± 9.5 (0.6)35.4 ± 11.6 (12.0)0.006
Central third of LT24.8 ± 4.425.1 ± 5.9 (1.2)24.1 ± 4.4 (−2.8)24.3 ± 8.2 (−2.0)<0.001
Peripheral third of LT36.9 ± 10.240.7 ± 9.3 (10.3)38.9 ± 7.6 (5.4)39.5 ± 11.1 (7.0)0.105
FemurInternal third of LF44.2 ± 9.444.7 ± 9.8 (1.1)44.6 ± 12.8 (0.9)44.9 ± 11.3 (1.6)0.782
Central third of LF35.9 ± 8.236.3 ± 8.0 (1.1)35.3 ± 6.9 (−1.7)35.0 ± 6.4 (−2.5)0.131
Peripheral third of LF34.2 ± 4.636.3 ± 6.3 (6.1)37.1 ± 5.8 (8.5)38.2 ± 3.9 (11.7)0.019

References

  1. Von Engelhardt, L.V.; Kraft, C.N.; Pennekamp, P.H.; Schild, H.H.; Schmitz, A.; Von Falkenhausen, M. The Evaluation of Articular Cartilage Lesions of the Knee With a 3-Tesla Magnet. Arthrosc. J. Arthrosc. Relat. Surg. 2007, 23, 496–502. [Google Scholar] [CrossRef]
  2. Kretzschmar, M.; Nevitt, M.; Schwaiger, B.; Joseph, G.; McCulloch, C.; Link, T. Spatial distribution and temporal progression of T2 relaxation time values in knee cartilage prior to the onset of cartilage lesions–data from the Osteoarthritis Initiative (OAI). Osteoarthr. Cartil. 2019, 27, 737–745. [Google Scholar] [CrossRef]
  3. Guermazi, A.; Alizai, H.; Crema, M.D.; Trattnig, S.; Regatte, R.; Roemer, F. Compositional MRI techniques for evaluation of cartilage degeneration in osteoarthritis. Osteoarthr. Cartil. 2015, 23, 1639–1653. [Google Scholar] [CrossRef] [Green Version]
  4. Bay-Jensen, A.-C.; Hoegh-Madsen, S.; Dam, E.; Henriksen, K.; Sondergaard, B.C.; Pastoureau, P.; Qvist, P.; Karsdal, M.A. Which elements are involved in reversible and irreversible cartilage degradation in osteoarthritis? Rheumatol. Int. 2009, 30, 435–442. [Google Scholar] [CrossRef] [PubMed]
  5. Chaudhari, A.S.; Kogan, F.; Pedoia, V.; Majumdar, S.; Gold, G.E.; Hargreaves, B.A. Rapid Knee MRI Acquisition and Analysis Techniques for Imaging Osteoarthritis. J. Magn. Reson. Imaging 2020, 52, 1321–1339. [Google Scholar] [CrossRef]
  6. Subburaj, K.; Souza, R.B.; Wyman, B.T.; Le Graverand-Gastineau, M.-P.H.; Li, X.; Link, T.M.; Majumdar, S. Changes in MR relaxation times of the meniscus with acute loading: An in vivo pilot study in knee osteoarthritis. J. Magn. Reson. Imaging 2015, 41, 536–543. [Google Scholar] [CrossRef] [Green Version]
  7. Jerban, S.; Chang, E.Y.; Du, J. Magnetic resonance imaging (MRI) studies of knee joint under mechanical loading: Review. Magn. Reson. Imaging 2020, 65, 27–36. [Google Scholar] [CrossRef]
  8. Menon, R.G.; Zibetti, M.V.; Regatte, R.R. In vivo tibiofemoral cartilage strain mapping under static mechanical loading using continuous GRASP-MRI. J. Magn. Reson. Imaging 2020, 51, 426–434. [Google Scholar] [CrossRef]
  9. Chan, D.D.; Cai, L.; Butz, K.D.; Trippel, S.B.; Nauman, E.A.; Neu, C.P. In vivo articular cartilage deformation: Noninvasive quantification of intratissue strain during joint contact in the human knee. Sci. Rep. 2016, 6, 19220. [Google Scholar] [CrossRef] [PubMed] [Green Version]
  10. Buchan, L.L.; Zhang, H.; Konan, S.; Heaslip, I.; Ratzlaff, C.R.; Wilson, D.R. Open-MRI measures of cam intrusion for hips in an anterior impingement position relate to acetabular contact force. J. Orthop. Res. 2016, 34, 205–216. [Google Scholar] [CrossRef] [PubMed]
  11. Subburaj, K.; Souza, R.B.; Stehling, C.; Wyman, B.T.; Le Graverand-Gastineau, M.-P.; Link, T.M.; Li, X.; Majumdar, S. Association of MR relaxation and cartilage deformation in knee osteoarthritis. J. Orthop. Res. 2012, 30, 919–926. [Google Scholar] [CrossRef] [Green Version]
  12. Wang, H.; Koff, M.F.; Potter, H.G.; Warren, R.F.; Rodeo, S.A.; Maher, S.A. An MRI-compatible loading device to assess knee joint cartilage deformation: Effect of preloading and inter-test repeatability. J. Biomech. 2015, 48, 2934–2940. [Google Scholar] [CrossRef] [PubMed]
  13. Lange, T.; Knowles, B.R.; Herbst, M.; Izadpanah, K.; Zaitsev, M. Comparative T 2 and T 1ρ mapping of patellofemoral cartilage under in situ mechanical loading with prospective motion correction. J. Magn. Reson. Imaging 2017, 46, 452–460. [Google Scholar] [CrossRef] [PubMed]
  14. Chen, H.-N.; Yang, K.; Dong, Q.-R.; Wang, Y. Assessment of tibial rotation and meniscal movement using kinematic magnetic resonance imaging. J. Orthop. Surg. Res. 2014, 9, 65. [Google Scholar] [CrossRef] [PubMed] [Green Version]
  15. Said, O.; Schock, J.; Krämer, N.; Thüring, J.; Hitpass, L.; Schad, P.; Kuhl, C.; Abrar, D.; Truhn, D.; Nebelung, S. An MRI-compatible varus–valgus loading device for whole-knee joint functionality assessment based on compartmental compression: A proof-of-concept study. Magma: Magn. Reson. Mater. Physics, Biol. Med. 2020, 33, 839–854. [Google Scholar] [CrossRef]
  16. Allaire, R.; Muriuki, M.; Gilbertson, L.; Harner, C.D. Biomechanical Consequences of a Tear of the Posterior Root of the Medial Meniscus. J. Bone Jt. Surg. Am. Vol. 2008, 90, 1922–1931. [Google Scholar] [CrossRef] [PubMed] [Green Version]
  17. Rogers, A.D.; Payne, J.E.; Yu, J.S. Cartilage Imaging: A Review of Current Concepts and Emerging Technologies. Semin. Roentgenol. 2013, 48, 148–157. [Google Scholar] [CrossRef] [PubMed]
  18. Eckstein, F.; Guermazi, A.; Gold, G.; Duryea, J.; Le Graverand, M.-P.H.; Wirth, W.; Miller, C. Imaging of cartilage and bone: Promises and pitfalls in clinical trials of osteoarthritis. Osteoarthr. Cartil. 2014, 22, 1516–1532. [Google Scholar] [CrossRef] [Green Version]
  19. MacKay, J.; Low, S.; Smith, T.; Toms, A.; McCaskie, A.; Gilbert, F. Systematic review and meta-analysis of the reliability and discriminative validity of cartilage compositional MRI in knee osteoarthritis. Osteoarthr. Cartil. 2018, 26, 1140–1152. [Google Scholar] [CrossRef] [Green Version]
  20. Eckstein, F.; Maschek, S.; Roemer, F.; Duda, G.; Sharma, L.; Wirth, W. Cartilage loss in radiographically normal knees depends on radiographic status of the contralateral knee–data from the Osteoarthritis Initiative. Osteoarthr. Cartil. 2019, 27, 273–277. [Google Scholar] [CrossRef] [Green Version]
  21. Nebelung, S.; Dötsch, L.; Shah, D.; Abrar, D.B.; Linka, K.; Knobe, M.; Sewerin, P.; Thüring, J.; Kuhl, C.; Truhn, D. Functional MRI Mapping of Human Meniscus Functionality and its Relation to Degeneration. Sci. Rep. 2020, 10, 1–14. [Google Scholar] [CrossRef] [PubMed]
  22. Hafner, T.; Schock, J.; Post, M.; Abrar, D.B.; Sewerin, P.; Linka, K.; Knobe, M.; Kuhl, C.; Truhn, D.; Nebelung, S. A serial multiparametric quantitative magnetic resonance imaging study to assess proteoglycan depletion of human articular cartilage and its effects on functionality. Sci. Rep. 2020, 10, 1–18. [Google Scholar] [CrossRef]
  23. Costa, C.R.; Morrison, W.B.; Carrino, J.A. Medial Meniscus Extrusion on Knee MRI:Is Extent Associated with Severity of Degeneration or Type of Tear? Am. J. Roentgenol. 2004, 183, 17–23. [Google Scholar] [CrossRef] [PubMed]
  24. Nebelung, S.; Post, M.; Knobe, M.; Tingart, M.; Emans, P.; Thüring, J.; Kuhl, C.; Truhn, D. Detection of Early-Stage Degeneration in Human Articular Cartilage by Multiparametric MR Imaging Mapping of Tissue Functionality. Sci. Rep. 2019, 9, 1–11. [Google Scholar] [CrossRef]
  25. Truhn, D.; Sondern, B.; Oehrl, S.; Tingart, M.; Knobe, M.; Merhof, D.; Kuhl, C.; Thüring, J.; Nebelung, S. Differentiation of human cartilage degeneration by functional MRI mapping—an ex vivo study. Eur. Radiol. 2019, 29, 6671–6681. [Google Scholar] [CrossRef] [PubMed]
  26. Pritzker, K.; Gay, S.; Jimenez, S.; Ostergaard, K.; Pelletier, J.-P.; Revell, P.; Salter, D.; Berg, W.V.D. Osteoarthritis cartilage histopathology: Grading and staging. Osteoarthr. Cartil. 2006, 14, 13–29. [Google Scholar] [CrossRef] [Green Version]
  27. Pauli, C.; Grogan, S.; Patil, S.; Otsuki, S.; Hasegawa, A.; Koziol, J.; Lotz, M.; D’Lima, D. Macroscopic and histopathologic analysis of human knee menisci in aging and osteoarthritis. Osteoarthr. Cartil. 2011, 19, 1132–1141. [Google Scholar] [CrossRef] [Green Version]
  28. Schad, P.; Wollenweber, M.; Thüring, J.; Schock, J.; Eschweiler, J.; Palm, G.; Radermacher, K.; Eckstein, F.; Prescher, A.; Kuhl, C.; et al. Magnetic resonance imaging of human knee joint functionality under variable compressive in-situ loading and axis alignment. J. Mech. Behav. Biomed. Mater. 2020, 110, 103890. [Google Scholar] [CrossRef]
  29. Li, L.; Herzog, W. Strain-rate dependence of cartilage stiffness in unconfined compression: The role of fibril reinforcement versus tissue volume change in fluid pressurization. J. Biomech. 2004, 37, 375–382. [Google Scholar] [CrossRef]
  30. Son, M.; Goodman, S.B.; Chen, W.; Hargreaves, B.A.; Gold, G.E.; Levenston, M.E. Regional Variation in T1rho and T2 Times in Osteoarthritis Human Menisci: Correlation with Mechanical Properties and Matrix Composition. Osteoarthr. Cartil. 2013, 21, 796–805. [Google Scholar] [CrossRef] [Green Version]
  31. Nishioka, H.; Hirose, J.; Nakamura, E.; Oniki, Y.; Takada, K.; Yamashita, Y.; Mizuta, H. T1ρ and T2 mapping reveal the in vivo extracellular matrix of articular cartilage. J. Magn. Reson. Imaging 2012, 35, 147–155. [Google Scholar] [CrossRef]
  32. Bolbos, R.; Link, T.; Ma, C.B.; Majumdar, S.; Li, X. T1ρ relaxation time of the meniscus and its relationship with T1ρ of adjacent cartilage in knees with acute ACL injuries at 3T. Osteoarthr. Cartil. 2009, 17, 12–18. [Google Scholar] [CrossRef] [Green Version]
  33. Subburaj, K.; Kumar, D.; Souza, R.B.; Alizai, H.; Li, X.; Link, T.M.; Majumdar, S. The Acute Effect of Running on Knee Articular Cartilage and Meniscus Magnetic Resonance Relaxation Times in Young Healthy Adults. Am. J. Sports Med. 2012, 40, 2134–2141. [Google Scholar] [CrossRef] [Green Version]
  34. Hamada, H.; Nishii, T.; Tamura, S.; Tanaka, H.; Wakayama, T.; Sugano, N. Comparison of load responsiveness of cartilage T1rho and T2 in porcine knee joints: An experimental loading MRI study. Osteoarthr. Cartil. 2015, 23, 1776–1779. [Google Scholar] [CrossRef] [Green Version]
  35. Stehling, C.; Luke, A.; Stahl, R.; Baum, T.; Joseph, G.; Pan, J.; Link, T.M. Meniscal T1rho and T2 measured with 3.0T MRI increases directly after running a marathon. Skelet. Radiol. 2011, 40, 725–735. [Google Scholar] [CrossRef] [Green Version]
  36. Fox, A.J.S.; Bedi, A.; Rodeo, S.A. The Basic Science of Articular Cartilage: Structure, Composition, and Function. Sports Heal. A Multidiscip. Approach 2009, 1, 461–468. [Google Scholar] [CrossRef]
  37. Liess, C.; Lüsse, S.; Karger, N.; Heller, M.; Glüer, C.-C. Detection of changes in cartilage water content using MRI T2-mapping in vivo. Osteoarthr. Cartil. 2002, 10, 907–913. [Google Scholar] [CrossRef] [Green Version]
  38. Menezes, N.M.; Gray, M.L.; Hartke, J.R.; Burstein, D. T 2 and T 1ρ MRI in articular cartilage systems. Magn. Reson. Med. 2004, 51, 503–509. [Google Scholar] [CrossRef]
  39. Mow, V.C.; Kuei, S.C.; Lai, W.M.; Armstrong, C.G. Biphasic Creep and Stress Relaxation of Articular Cartilage in Compression: Theory and Experiments. J. Biomech. Eng. 1980, 102, 73–84. [Google Scholar] [CrossRef]
  40. Mow, V.C.; Holmes, M.H.; Lai, W.M. Fluid transport and mechanical properties of articular cartilage: A review. J. Biomech. 1984, 17, 377–394. [Google Scholar] [CrossRef]
  41. Hatcher, C.C.; Collins, A.T.; Kim, S.Y.; Michel, L.C.; Mostertz, W.C.; Ziemian, S.N.; Spritzer, C.E.; Guilak, F.; DeFrate, L.E.; McNulty, A.L. Relationship between T1rho magnetic resonance imaging, synovial fluid biomarkers, and the biochemical and biomechanical properties of cartilage. J. Biomech. 2017, 55, 18–26. [Google Scholar] [CrossRef] [Green Version]
  42. Lüssea, S.; Claassen, H.; Gehrke, T.; Hassenpflug, J.; Schünke, M.; Heller, M.; Glüer, C.-C. Evaluation of water content by spatially resolved transverse relaxation times of human articular cartilage. Magn. Reson. Imaging 2000, 18, 423–430. [Google Scholar] [CrossRef]
  43. Regatte, R.; Ms, J.H.K.; Noyszewski, E.A.; Reddy, R. Sodium and proton MR properties of cartilage during compression. J. Magn. Reson. Imaging 1999, 10, 961–967. [Google Scholar] [CrossRef]
  44. Fragonas, E.; Mlynarik, V.; Jellús, V.; Micali, F.; Piras, A.; Toffanin, R.; Rizzo, R.; Vittur, F. Correlation between biochemical composition and magnetic resonance appearance of articular cartilage. Osteoarthr. Cartil. 1998, 6, 24–32. [Google Scholar] [CrossRef] [Green Version]
  45. Rubenstein, J.D.; Kim, J.K.; Morova-Protzner, I.; Stanchev, P.L.; Henkelman, R.M. Effects of collagen orientation on MR imaging characteristics of bovine articular cartilage. Radiology 1993, 188, 219–226. [Google Scholar] [CrossRef]
  46. Truhn, D.; Brill, N.; Braun, B.; Merhof, D.; Kuhl, C.; Knobe, M.; Thüring, J.; Nebelung, S. A multi-purpose force-controlled loading device for cartilage and meniscus functionality assessment using advanced MRI techniques. J. Mech. Behav. Biomed. Mater. 2020, 101, 103428. [Google Scholar] [CrossRef]
  47. Nishii, T.; Kuroda, K.; Matsuoka, Y.; Sahara, T.; Yoshikawa, H. Change in knee cartilage T2 in response to mechanical loading. J. Magn. Reson. Imaging 2008, 28, 175–180. [Google Scholar] [CrossRef]
  48. Juráš, V.; Bittsansky, M.; Majdisova, Z.; Szomolanyi, P.; Sulzbacher, I.; Gabler, S.; Stampfl, J.; Schuller, G.; Trattnig, S. In vitro determination of biomechanical properties of human articular cartilage in osteoarthritis using multi-parametric MRI. J. Magn. Reson. 2009, 197, 40–47. [Google Scholar] [CrossRef]
  49. Nebelung, S.; Sondern, B.; Jahr, H.; Tingart, M.; Knobe, M.; Thüring, J.; Kuhl, C.; Truhn, D. Non-invasive T1ρ mapping of the human cartilage response to loading and unloading. Osteoarthr. Cartil. 2018, 26, 236–244. [Google Scholar] [CrossRef] [Green Version]
  50. Melis, A.; Casu, S.; Fanti, A.; Mazzarella, G.; Puddu, C.; Boccacci, P. Robustness of flexible 7T-MRI coil behaviour. In Proceedings of the 2017 International Applied Computational Electromagnetics Society Symposium-Italy (ACES), Firenze, Italy, 26–30 March 2017; pp. 1–2. [Google Scholar]
  51. Brown, R.; Lakshmanan, K.; Madelin, G.; Alon, L.; Chang, G.; Sodickson, D.; Regatte, R.; Wiggins, G.C. A flexible nested sodium and proton coil array with wideband matching for knee cartilage MRI at 3T. Magn. Reson. Med. 2016, 76, 1325–1334. [Google Scholar] [CrossRef] [Green Version]
  52. James, E.W.; Williams, B.T.; LaPrade, R.F. Stress Radiography for the Diagnosis of Knee Ligament Injuries: A Systematic Review. Clin. Orthop. Relat. Res. 2014, 472, 2644–2657. [Google Scholar] [CrossRef] [Green Version]
  53. Greaves, L.; Gilbart, M.; Yung, A.; Kozlowski, P.; Wilson, D. Deformation and recovery of cartilage in the intact hip under physiological loads using 7T MRI. J. Biomech. 2009, 42, 349–354. [Google Scholar] [CrossRef]
  54. Nebelung, S.; Post, M.; Knobe, M.; Shah, D.; Schleich, C.; Hitpass, L.; Kuhl, C.; Thüring, J.; Truhn, D. Human articular cartilage mechanosensitivity is related to histological degeneration—A functional MRI study. Osteoarthr. Cartil. 2019, 27, 1711–1720. [Google Scholar] [CrossRef]
  55. Herberhold, C.; Faber, S.; Stammberger, T.; Steinlechner, M.; Putz, R.; Englmeier, K.-H.; Reiser, M.; Eckstein, F. In situ measurement of articular cartilage deformation in intact femoropatellar joints under static loading. J. Biomech. 1999, 32, 1287–1295. [Google Scholar] [CrossRef]
  56. Franz, T.; Hasler, E.; Hagg, R.; Weiler, C.; Jakob, R.; Mainil-Varlet, P. In situ compressive stiffness, biochemical composition, and structural integrity of articular cartilage of the human knee joint. Osteoarthr. Cartil. 2001, 9, 582–592. [Google Scholar] [CrossRef] [Green Version]
  57. Roemer, F.W.; Demehri, S.; Omoumi, P.; Link, T.M.; Kijowski, R.; Saarakkala, S.; Crema, M.D.; Guermazi, A. State of the Art: Imaging of Osteoarthritis—Revisited 2020. Radiology 2020, 296, 5–21. [Google Scholar] [CrossRef]
  58. Van Tiel, J.; Bron, E.; Tiderius, C.J.; Bos, P.K.; Reijman, M.; Klein, S.; Verhaar, J.A.N.; Krestin, G.P.; Weinans, H.; Kotek, G.; et al. Reproducibility of 3D delayed gadolinium enhanced MRI of cartilage (dGEMRIC) of the knee at 3.0 T in patients with early stage osteoarthritis. Eur. Radiol. 2012, 23, 496–504. [Google Scholar] [CrossRef]
  59. Abrar, D.B.; Schleich, C.; Radke, K.L.; Frenken, M.; Stabinska, J.; Ljimani, A.; Wittsack, H.-J.; Antoch, G.; Bittersohl, B.; Hesper, T.; et al. Detection of early cartilage degeneration in the tibiotalar joint using 3 T gagCEST imaging: A feasibility study. Magma: Magn. Reson. Mater. Phys. Biol. Med. 2021, 34, 249–260. [Google Scholar] [CrossRef]
  60. Müller-Lutz, A.; Kamp, B.; Nagel, A.M.; Ljimani, A.; Abrar, D.; Schleich, C.; Wollschläger, L.; Nebelung, S.; Wittsack, H.-J. Sodium MRI of human articular cartilage of the wrist: A feasibility study on a clinical 3T MRI scanner. Magma: Magn. Reson. Mater. Phys. Biol. Med. 2021, 34, 241–248. [Google Scholar] [CrossRef]
Figure 1. Measurements of joint alignment on CT images. Visualized are coronal (a), sagittal (b), and axial (c) reconstructions of a representative knee joint under various loading conditions, i.e., unloaded (a1c1), under 15 kp varus loading (a2c2) and under 15 kp valgus loading (a3a3). “Joint deviation” was determined on mid-coronal images as the lateral angle between the femoral and tibial shafts (a). “Joint extension” was determined on mid-sagittal images as the popliteal angle between the femoral and tibial shafts (b). “Joint rotation” was determined on the axial images that demonstrated the largest diameter of the patella by relating the trans-patellar line (through the outer corners of the patella) to the horizontal line (c). By convention, external rotation was indicated by positive angles and internal rotation by negative angles.
Diagnostics 11 01476 g001
Figure 2. Representative multiparametric MR images of the medial femorotibial compartment in response to varus loading and corresponding histologic sections. (ad) Displayed are T2 maps (a), T1ρ maps (b), and morphologic images, i.e., proton density-weighted fat-saturated (PD-fs, (c)) and water selective cartilage scan images (WATSc, (d)) as a function of increasing varus loading intensity. Segmentation outlines were overlaid onto the corresponding morphologic images and pixel intensities were color-coded (ms). MR images were cropped and zoomed to the areas of interest. (e) Corresponding histologic sections of the tibial cartilage (e1), the femoral cartilage (e2), and medial meniscus (e3) after hematoxylin-eosin staining. Bars indicate 1 mm. Same right knee joint as in Figure 1 and Figure 3.
Diagnostics 11 01476 g002
Figure 3. Representative multiparametric MR images of the lateral femorotibial compartment in response to varus loading and corresponding histologic sections. MR images (ad) are organized as in Figure 2. For the histologic sections (e), the lateral meniscus (e1) is positioned between the femoral (e2) and tibial cartilage (e3). Same right knee joint as in Figure 1 and Figure 2.
Diagnostics 11 01476 g003
Table 1. Acquisition parameters of the MRI sequences.
Sequence ParametersPD-fsWATScT2T1ρ
Orientationcor, ax (sag) *cormid-corcor ***
Type of fat saturationSPAIRwater-selective excitationn/an/a
Sequence type2D Turbo-spin-echo3D Gradient echo2D Multi-spin-echo3D Spin-lock multi-gradient echo
Repetition time (ms)4776 (ax)–7125 (sag)1014005
Echo time (ms)305n × 7.4 (n = 1–8) **3
Turbo spin-echo factor13 (ax)–15 (sag)11564
Field of view (mm)180 × 180180 × 180180 × 180180 × 180
Acquisition matrix (pixels)368 × 368368 × 368368 × 368368 × 368
Reconstruction matrix (pixels)720 × 720720 × 720720 × 720720 × 720
Pixel size (mm/pixel)0.25 × 0.250.25 × 0.250.25 × 0.250.25 × 0.25
Scan percentage (%)100100100100
Flip angle (°)90179010
Number of signal averages (n)1111
Slices (n)30 (sag)–33 (ax)266130
Slice Thickness/Gap (mm)3.0/0.51.5/0.03.0/n/a3.0/0.0
Spin-lock durations (ms)n/an/an/a0, 10, 20, 30, 40
Duration (min)4 min 37 s (ax)–5 min 56 s (sag)7 min 53 s8 min 38 s7 min 36 s ***
Abbreviations: Spectral attenuated inversion recovery (SPAIR), Proton Density (PD), Water selective cartilage scans (WATSc), fat-saturated (fs), not applicable (n/a), (mid-)coronal ((mid-)cor), axial (ax), sagittal (sag). * PD-fs sequences were acquired in all three orientations in the unloaded reference configuration and in the coronal and axial orientations under loading. ** Although echo times of up to 112 ms (n = 15) were sampled, only the first eight echoes were included in the T2 quantification because of insufficiently low signal-to-noise ratio at longer echo times. *** Only the mid-coronal slice was included in the analysis.
Table 2. Mean absolute thickness of the tibial and femoral articular cartilage regions as a function of loading. Unloaded (δ0) and loaded to 7.5 kp (δvar1, δvlg1), 15 kp (δvar2, δvlg2), and 22.5 kp (δvar3, δvlg3). Mean ± standard deviations (mm) (mean percentage change versus δ0 (%)). Values are given for the loaded compartment only, i.e., the medial compartment under varus loading and the lateral compartment under valgus loading. Statistical analysis was performed using repeated measures ANOVA with statistically significant findings highlighted in bold type.
CompartmentRegionδ0δvar1 or vlg1δvar2 or vlg2δvar3 or vlg3p-Value
Medial CompartmentTibia1.59 ± 0.211.56 ± 0.19 (−2.1)1.53 ± 0.19 (−3.5)1.53 ± 0.20 (−3.8)<0.001
Femur1.58 ± 0.341.56 ± 0.36 (−1.3)1.55 ± 0.36 (−1.9)1.54 ± 0.36 (−2.7)<0.001
Lateral CompartmentTibia1.93 ± 0.361.92 ± 0.35 (−0.5)1.91 ± 0.36 (−1.2)1.89 ± 0.35 (−2.1)0.117
Femur1.79 ± 0.321.78 ± 0.28 (−0.1)1.75 ± 0.29 (−1.7)1.77 ± 0.28 (−1.0)<0.001
Table 3. Mean absolute T1ρ relaxation times of femoral and tibial articular cartilage in response to loading. Mean ± standard deviation (ms) (mean percentage change versus δ0 (%)). Statistical analysis was performed using Friedman’s test with statistically significant findings highlighted in bold type. Please refer to Table 2 for additional details on table organization.
CompartmentRegionδ0δvar1 or vlg1δvar2 or vlg2δvar3 or vlg3p-Value
Medial CompartmentTibia55.8 ± 33.742.7 ± 17.0 (−23.5)39.0 ± 12.0 (−30.1)36.9 ± 12.3 (−33.9)0.675
Femur89.7 ± 30.760.6 ± 15.5 (−32.4)62.8 ± 18.7 (−30.0)60.8 ± 26.9 (−32.2)0.034
Lateral CompartmentTibia60.6 ± 31.046.3 ± 18.6 (−23.6)38.5 ± 18.6 (−36.5)37.2 ± 17.4 (−38.6)0.001
Femur73.4 ± 23.563.9 ± 18.4 (−12.9)60.3 ± 19.1 (−17.8)62.8 ± 20.4 (−14.4)0.761
Table 4. Mean absolute T2 relaxation times of femoral and tibial articular cartilage in response to loading. Mean ± standard deviation (ms) (mean percentage change versus δ0 (%)). Statistical analysis was performed using Friedman’s test with statistically significant findings highlighted in bold type. Please refer to Table 2 for additional details on table organization.
CompartmentRegionδ0δvar1 or vlg1δvar2 or vlg2δvar3 or vlg3p-Value
Medial compartmentTibia30.9 ± 7.930.6 ± 9.2 (−1.0)33.3 ± 13.2 (7.8)33.1 ± 11.0 (7.1)0.239
Femur36.4 ± 8.840.0 ± 11.6 (9.9)41.5 ± 11.2 (14.0)42.9 ± 12.0 (17.9)0.004
Lateral CompartmentTibia29.6 ± 6.433.3 ± 7.5 (12.5)30.1 ± 6.0 (1.7)31.9 ± 9.7 (7.8)<0.001
Femur38.6 ± 5.839.5 ± 7.3 (2.3)39.5 ± 7.7 (2.3)39.4 ± 6.4 (2.1)0.366
Table 5. Mean absolute T1ρ and T2 relaxation times (ms) and meniscal extrusion (mm) of the medial and lateral meniscus body region in response to varus and valgus loading. Mean ± standard deviation (mean percentage change versus δ0 (%)). Statistical analysis was performed using Friedman’s test for T1ρ and T2 and repeated measures ANOVA for meniscal extrusion. Statistically significant results are indicated by bold type. Please refer to Table 2 for additional details on table organization.
MeniscusParameterδ0δvar1 or vlg1δvar2 or vlg2δvar3 or vlg3p-Value
MedialT1ρ (ms)24.7 ± 6.221.6 ± 8.5 (−12.6)20.1 ± 8.0 (−18.6)17.5 ± 8.9 (−29.1)0.001
T2 (ms)14.4 ± 2.115.8 ± 3.4 (9.7)15.8 ± 3.6 (9.7)16.3 ± 3.6 (13.2)0.247
Extrusion (mm)3.3 ± 1.23.3 ± 1.1 (0)3.3 ± 1.2 (0)3.4 ± 1.4 (3.0)0.325
LateralT1ρ (ms)18.9 ± 4.817.4 ± 4.5 (−7.9)15.8 ± 5.5 (−16.4)15.7 ± 5.5 (−16.9)0.020
T2 (ms)13.1 ± 3.115.6 ± 3.0 (19.1)15.3 ± 3.9 (16.8)14.6 ± 3.8 (11.5)0.022
Extrusion (mm)1.6 ± 0.81.7 ± 1.3 (6.3)1.8 ± 1.2 (12.5)1.7 ± 1.2 (6.3)0.793
Table 6. Mean values of joint alignment, i.e., joint deviation (in the coronal plane), joint extension (in the sagittal plane), and joint rotation (in the axial plane) as a function of loading. Mean ± standard deviation (°). Statistical analysis was performed using repeated measures ANOVA and statistically significant results are indicated in bold type.
Parameterδ0δvar1δvar2δvar3δvlg1δvlg2δvlg3p-Value
Joint deviation (°)178.5 ± 4.0180.2 ± 4.8183.1 ± 7.1186.4 ± 7.6174.9 ± 3.4171.9 ± 2.5167.1 ± 14.9<0.001
Joint extension (°)162.7 ± 10.6159.8 ± 10.5154.8 ± 11.7150.9 ± 13.3163.8 ± 8.1162.1 ± 10.8161.1 ± 11.6<0.001
Joint rotation (°)7.7 ± 5.611.3 ± 7.415.5 ± 10.121.7 ± 14.5–1.5 ± 12.7–2.2 ± 17.1–3.7 ± 20.4<0.001
Publisher’s Note: MDPI stays neutral with regard to jurisdictional claims in published maps and institutional affiliations.

