
Hybrid Deep Learning Model for Endoscopic Lesion Detection and Classification Using Endoscopy Videos


 , ,
, ,
Abstract
:1. Introduction
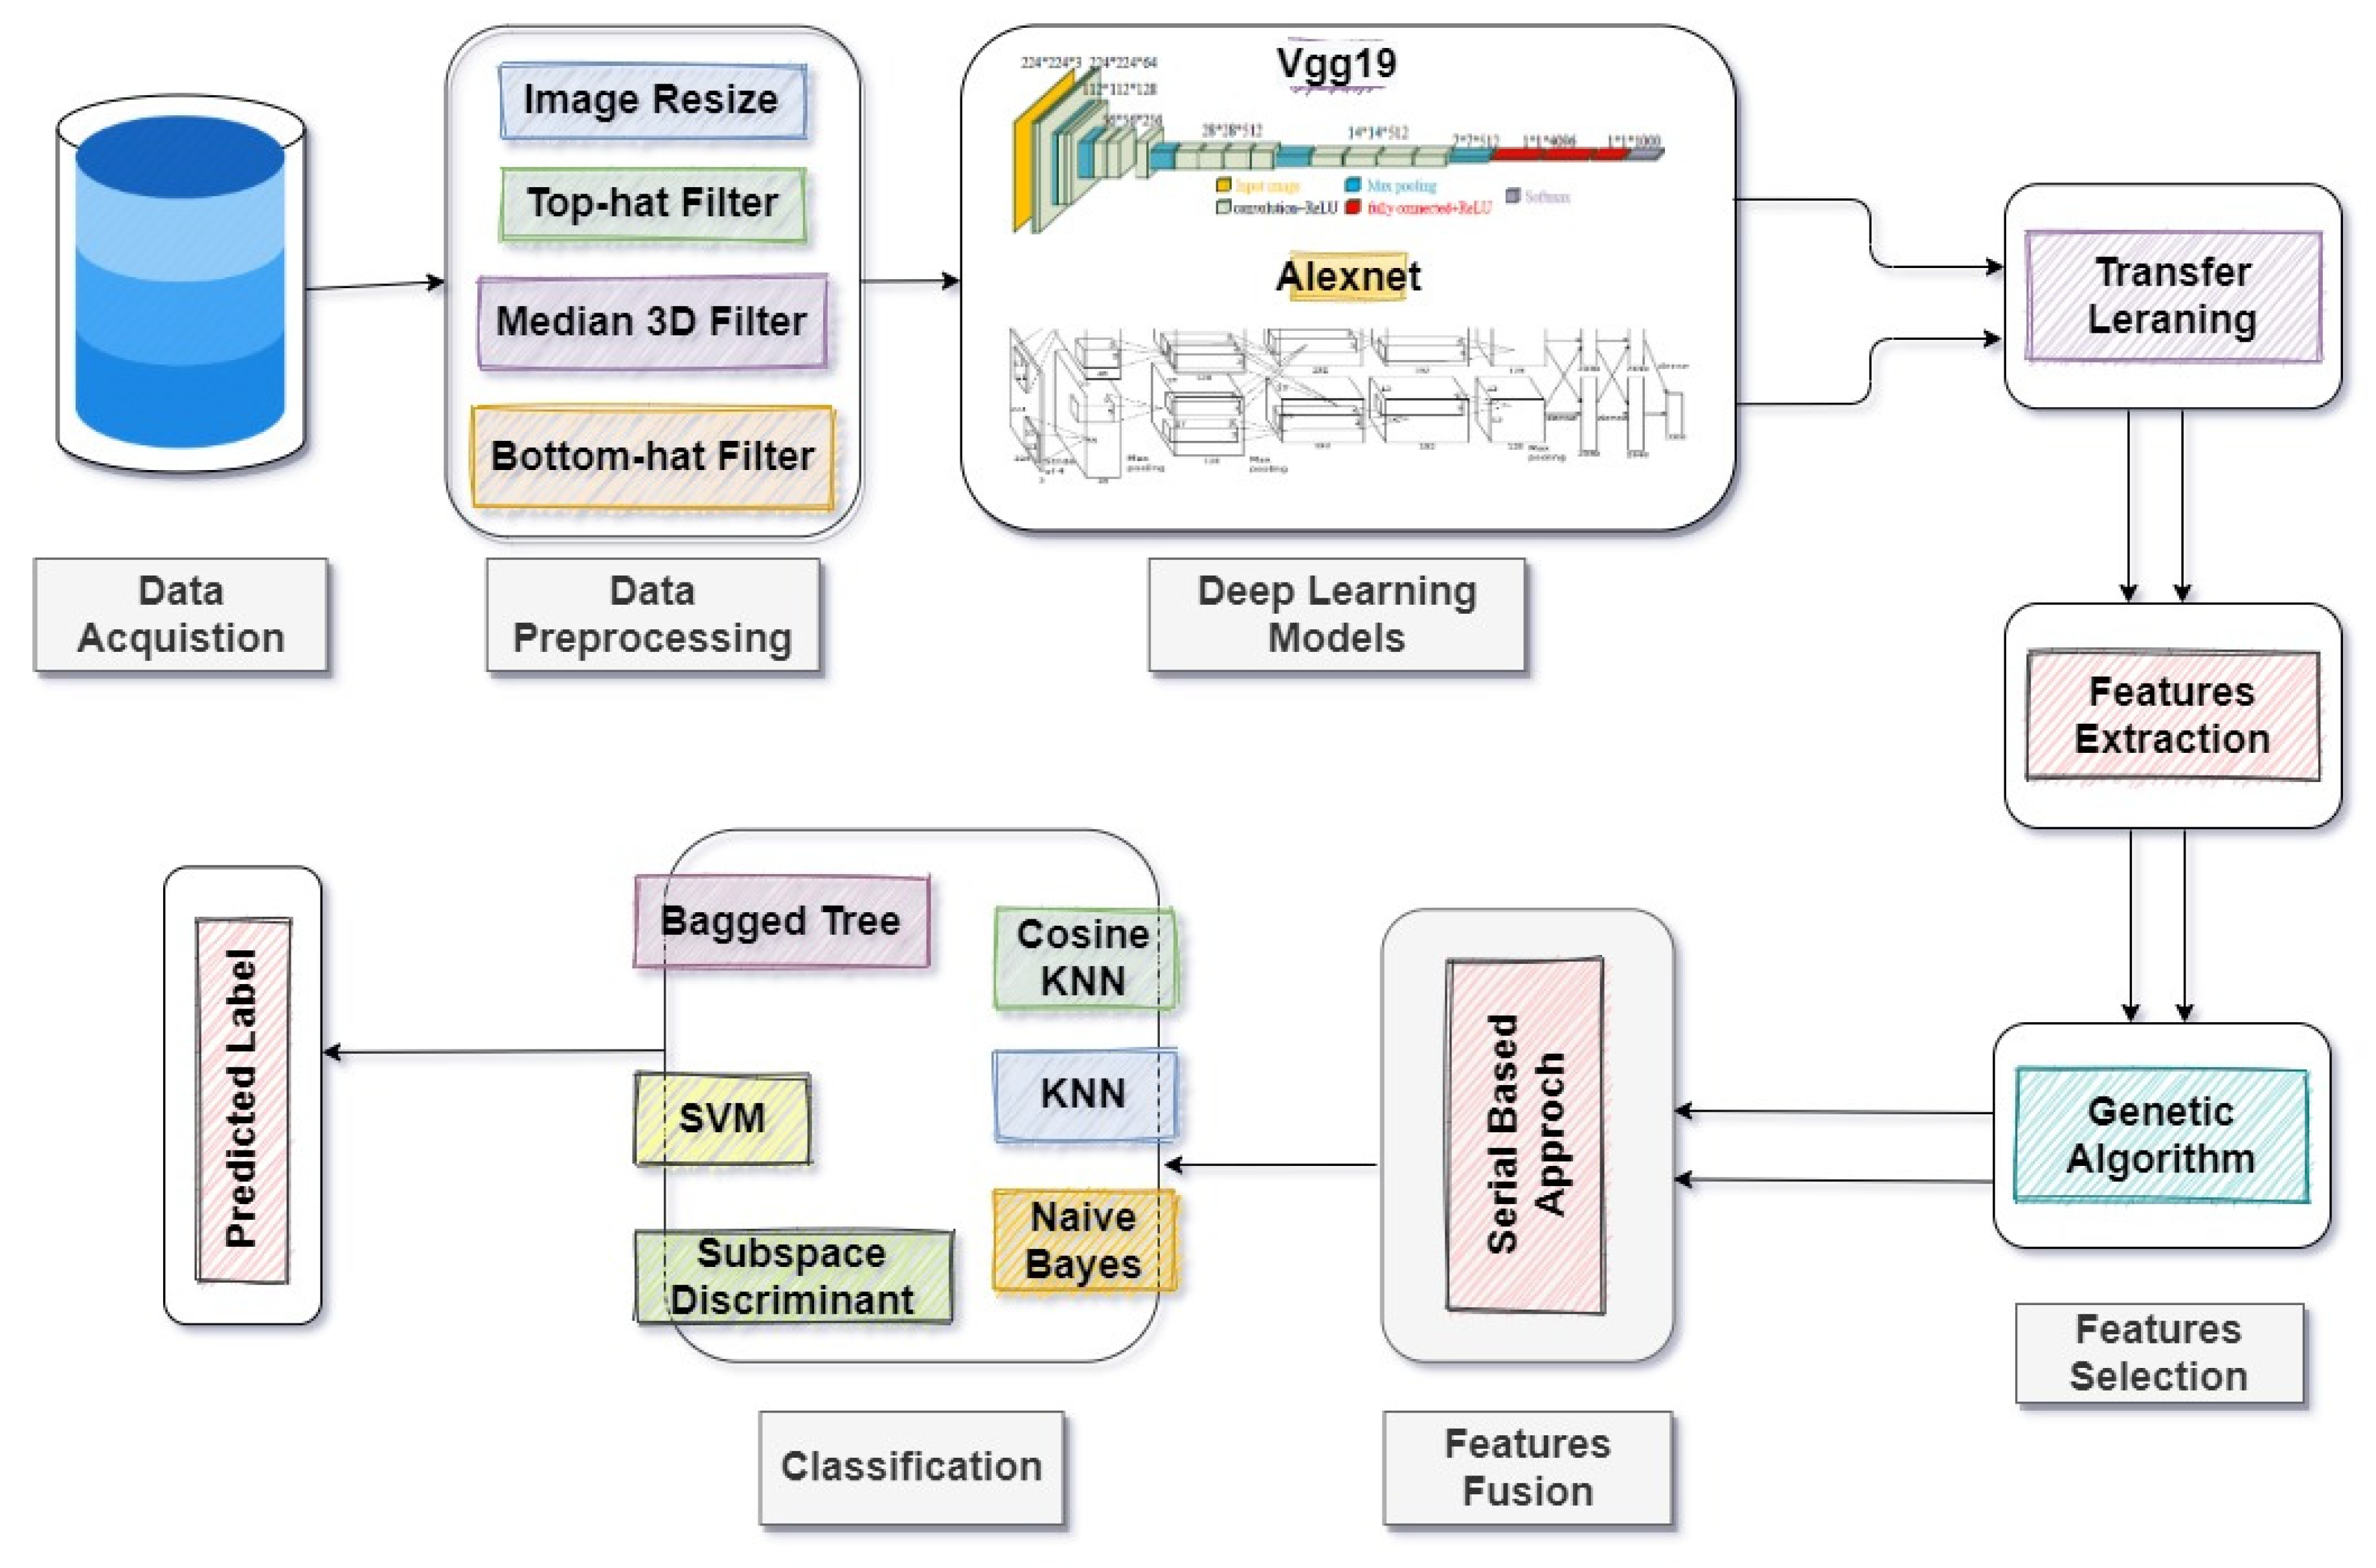
- The proposed methodology comprises seven significant steps: data acquisition, preprocessing of data, transfer learning of deep models, feature extraction, feature selection, hybridization, and classification.
- We selected two different CNN models (VGG19 and Alexnet) to extract features and then used transfer learning on the feature vectors before using them as feature extractors. In feature selection, heuristic GA was used to select rich information from the extracted feature vectors.
- The fusion was performed on the selected features of both models using a serial-based approach. Finally, the best features were provided to multiple machine learning classifiers for detection and classification.
2. Related Work
3. Materials and Methods
3.1. Data Acquisition
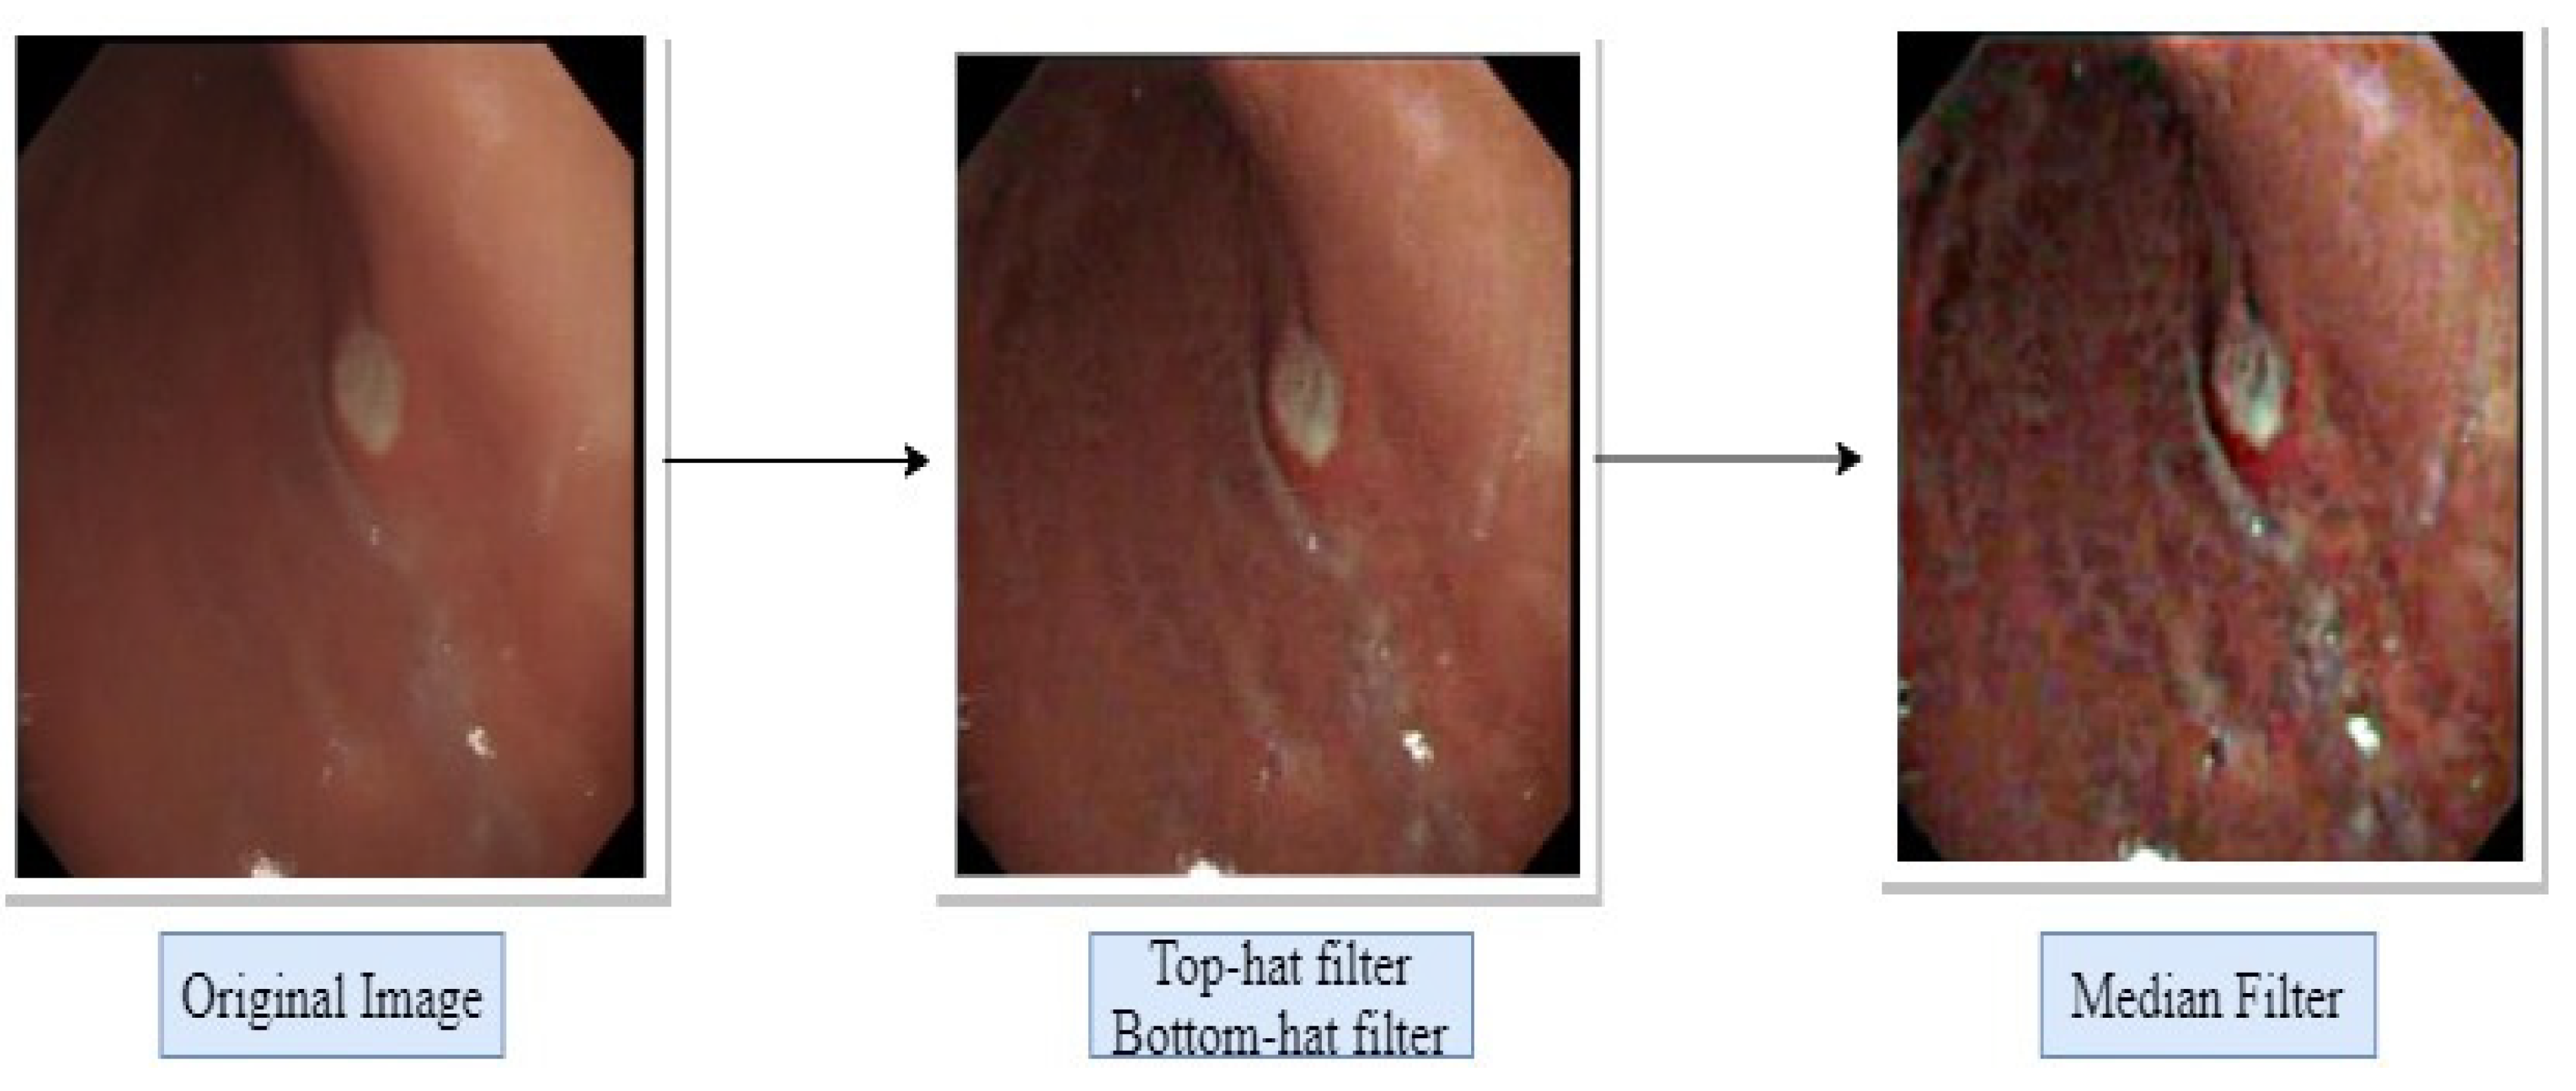
3.2. Data Preprocessing
3.3. Feature Extraction Using Alexnet and VGG19
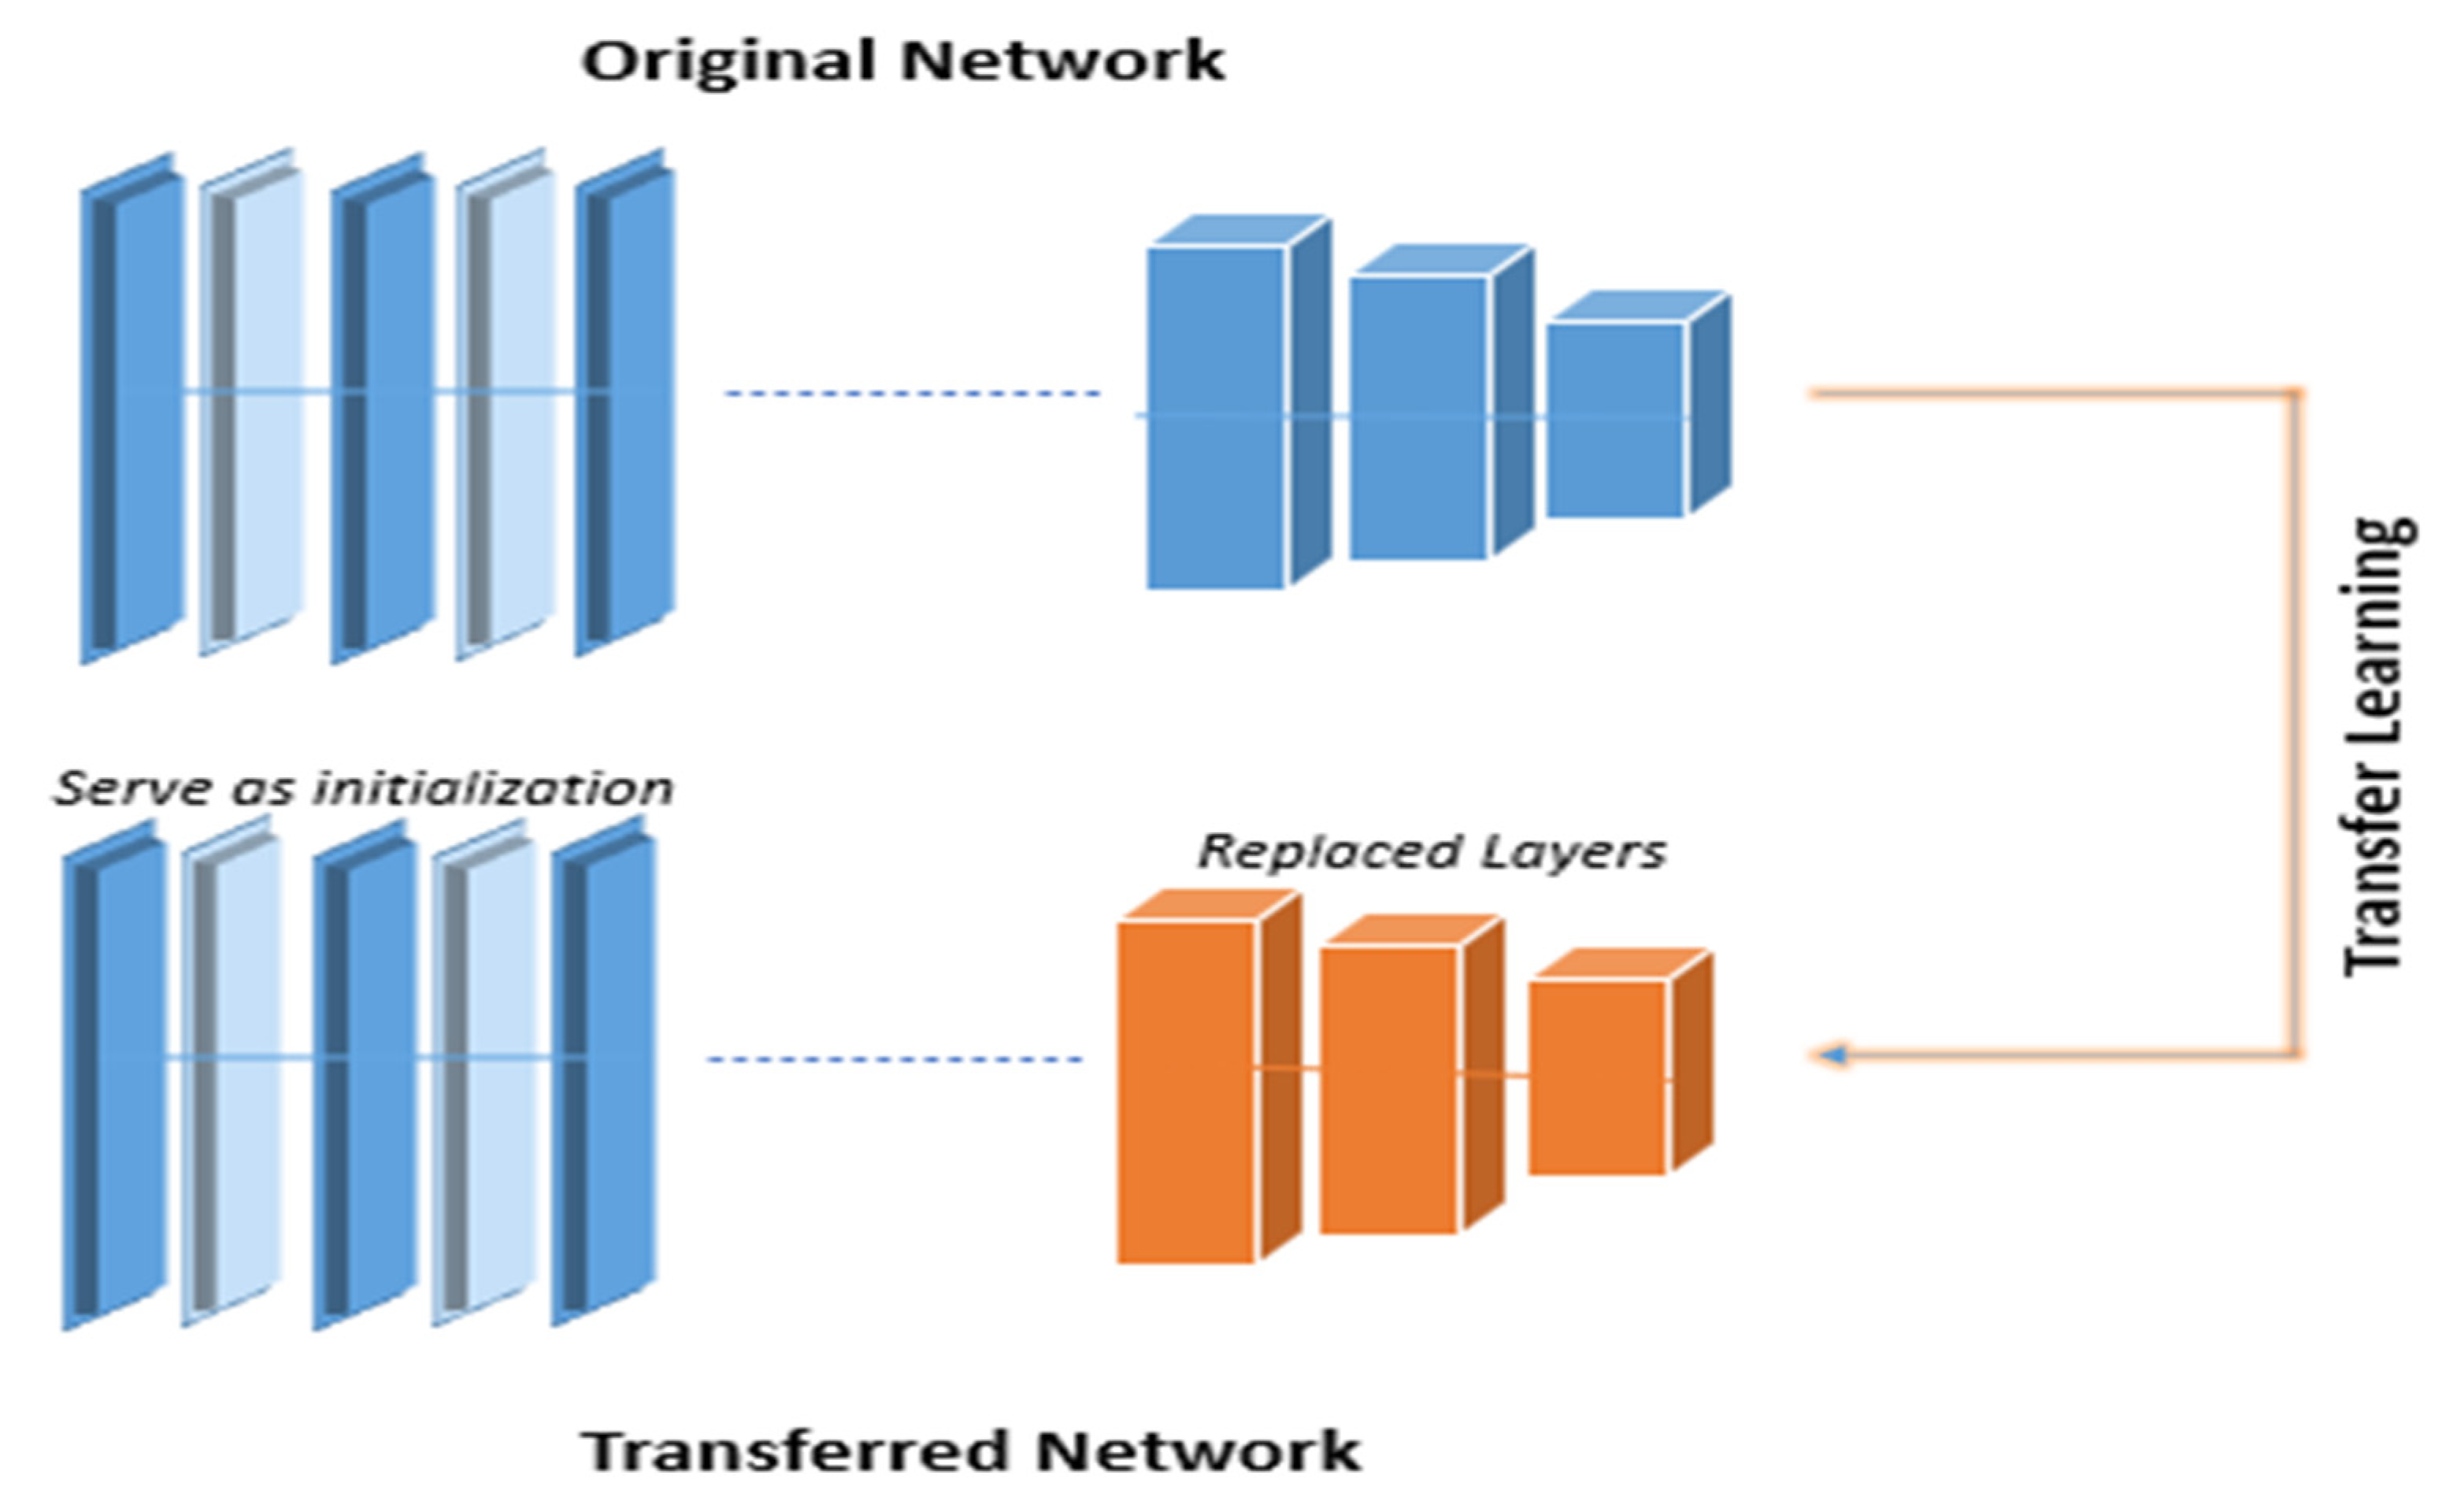
3.4. Transfer Learning
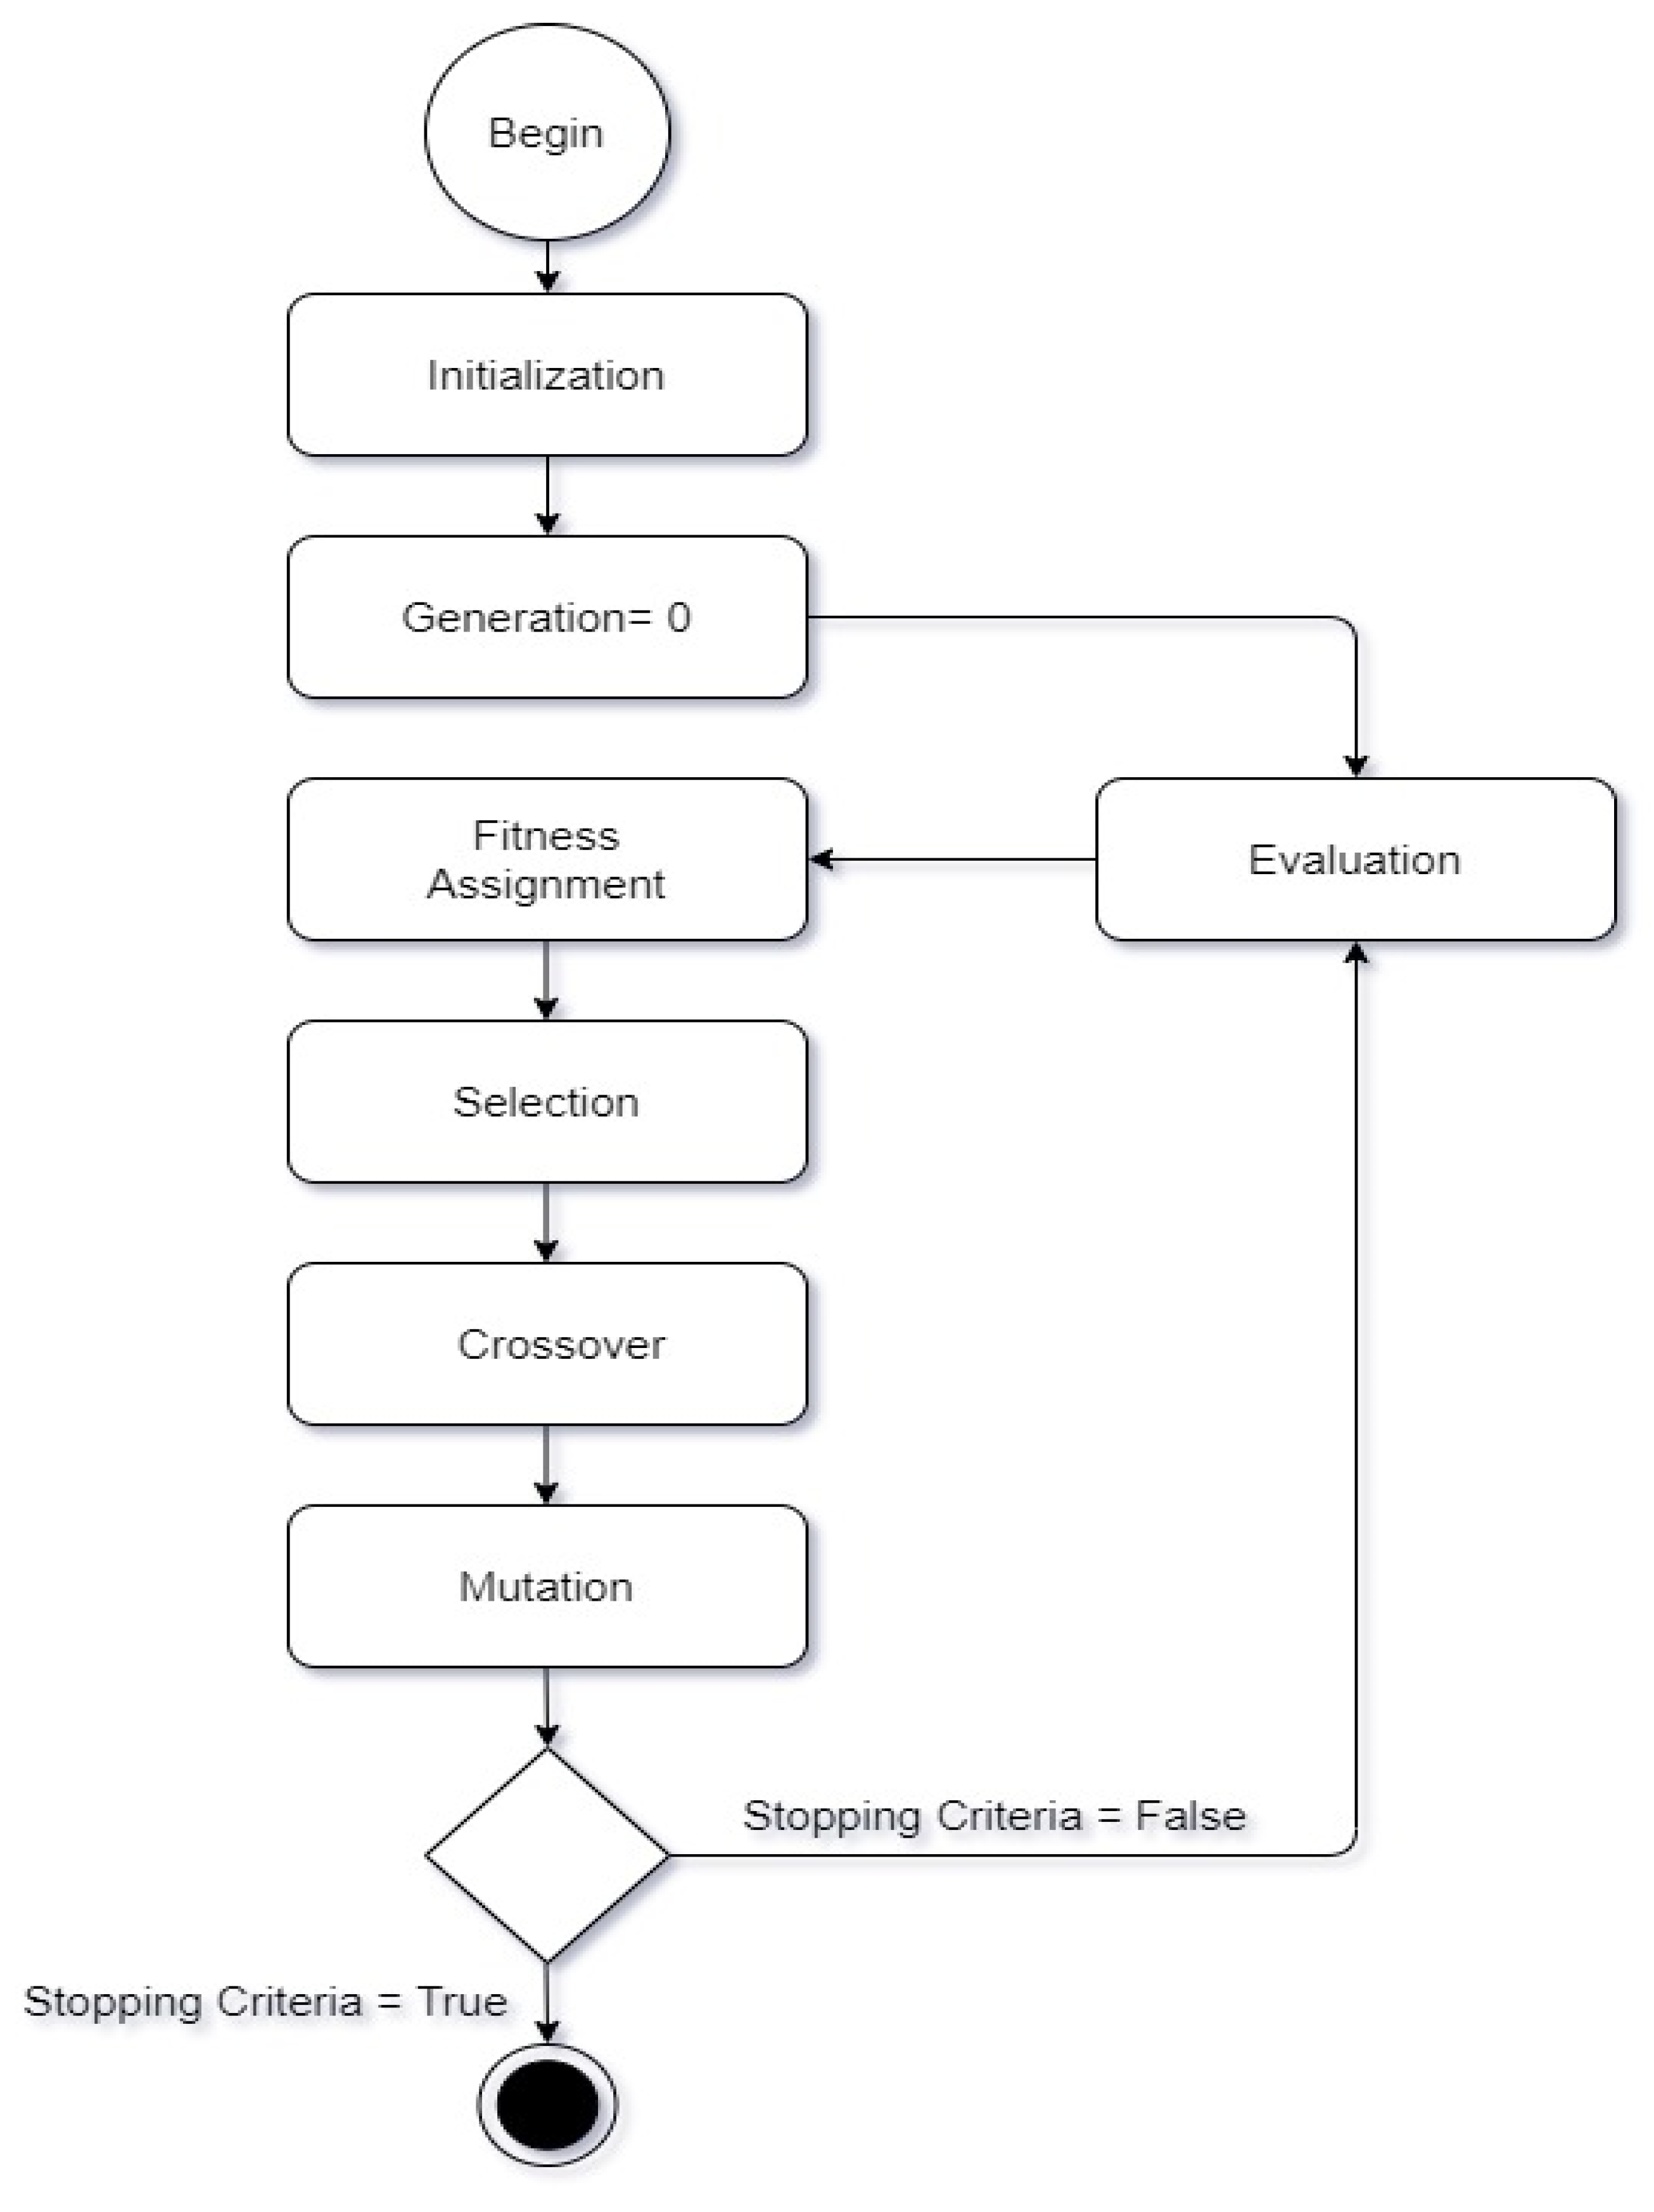
3.5. Feature Selection using a Genetic Algorithm
3.6. Hybridization and fusion of features
3.7. Classification
4. Results
4.1. Performance Matrix
4.2. Feature Extraction Accuracy
4.3. Feature Selection Accuracy
4.4. Classification Accuracy
5. Discussion
6. Conclusions and Future Work
Author Contributions
Funding
Institutional Review Board Statement
Informed Consent Statement
Data Availability Statement
Conflicts of Interest
References
- Dewi, A.K.; Novianty, A.; Purboyo, T.W. Stomach disorder detection through the Iris Image using Backpropagation Neural Network. In Proceedings of the 2016 International Conference on Informatics and Computing (ICIC), Mataram, Indonesia, 28–29 October 2016; pp. 192–197. [Google Scholar] [CrossRef]
- Zhao, A.-J.; Qian, Y.-Y.; Sun, H.; Hou, X.; Pan, J.; Liu, X.; Zhou, W.; Chen, Y.-Z.; Jiang, X.; Li, Z.-S.; et al. Screening for gastric cancer with magnetically controlled capsule gastroscopy in asymptomatic individuals. Gastrointest. Endosc. 2018, 88, 466–474.e1. [Google Scholar] [CrossRef]
- Korkmaz, M.F. Artificial Neural Network by using HOG Features HOG_LDA_ANN. 2017; 327–332. [Google Scholar]
- Li, C.; Shi, C.; Zhang, H.; Chen, Y.; Zhang, S. Multiple instance learning for computer aided detection and diagnosis of gastric cancer with dual-energy CT imaging. J. Biomed. Inform. 2015, 57, 358–368. [Google Scholar] [CrossRef] [Green Version]
- Balakrishnan, M.; George, R.; Sharma, A.; Graham, D.Y. Changing Trends in Stomach Cancer Throughout the World. Curr. Gastroenterol. Rep. 2017, 19, 1–10. [Google Scholar] [CrossRef]
- Sakai, Y.; Takemoto, S.; Hori, K.; Nishimura, M.; Ikematsu, H.; Yano, T.; Yokota, H. Automatic detection of early gastric cancer in endoscopic images using a transferring convolutional neural network. In Proceedings of the 2018 40th Annual International Conference of the IEEE Engineering in Medicine and Biology Society (EMBC), Honolulu, HI, USA, 18–21 July 2018; pp. 4138–4141. [Google Scholar]
- Brandstaeter, S.; Fuchs, S.; Aydin, R.C.; Cyron, C.J. Mechanics of the stomach: A review of an emerging field of biomechanics. GAMM-Mitteilungen 2019, 42, 1–17. [Google Scholar] [CrossRef] [Green Version]
- Nawarathna, R.; Oh, J.; Muthukudage, J.; Tavanapong, W.; Wong, J.; de Groen, P.C.; Tang, S.J. Abnormal image detection in endoscopy videos using a filter bank and local binary patterns. Neurocomputing 2014, 144, 70–91. [Google Scholar] [CrossRef] [PubMed] [Green Version]
- Lee, T.-C.; Lin, Y.-H.; Uedo, N.; Wang, H.-P.; Chang, H.-T.; Hung, C.-W. Computer-aided diagnosis in endoscopy: A novel application toward automatic detection of abnormal lesions on magnifying narrow-band imaging endoscopy in the stomach. In Proceedings of the 2013 35th Annual International Conference of the IEEE Engineering in Medicine and Biology Society (EMBC), Osaka, Japan, 3–7 July 2013; pp. 4430–4433. [Google Scholar] [CrossRef]
- Hirasawa, T.; Aoyama, K.; Tanimoto, T.; Ishihara, S.; Shichijo, S.; Ozawa, T.; Ohnishi, T.; Fujishiro, M.; Matsuo, K.; Fujisaki, J.; et al. Application of artificial intelligence using a convolutional neural network for detecting gastric cancer in endoscopic images. Gastric Cancer 2018, 21, 653–660. [Google Scholar] [CrossRef] [Green Version]
- Korkmaz, S.A.; Akcicek, A.; Binol, H.; Korkmaz, M.F. Recognition of the stomach cancer images with probabilistic HOG feature vector histograms by using HOG features. In Proceedings of the 2017 IEEE 15th International Symposium on Intelligent Systems and Informatics (SISY), Subotica, Serbia, 14–16 September 2017; pp. 000339–000342. [Google Scholar]
- Yu, J.-S.; Chen, J.; Xiang, Z.; Zou, Y.-X. A hybrid convolutional neural networks with extreme learning machine for WCE image classification. In Proceedings of the 2015 IEEE International Conference on Robotics and Biomimetics (ROBIO), Zhuhai, China, 6–9 December 2015; pp. 1822–1827. [Google Scholar]
- Yasar, A.; Saritas, I.; Korkmaz, H. Computer-Aided Diagnosis System for Detection of Stomach Cancer with Image Processing Techniques. J. Med. Syst. 2019, 43, 99. [Google Scholar] [CrossRef] [PubMed]
- Li, L.; Chen, Y.; Shen, Z.; Zhang, X.; Sang, J.; Ding, Y.; Yang, X.; Li, J.; Chen, M.; Jin, C.; et al. Convolutional neural network for the diagnosis of early gastric cancer based on magnifying narrow band imaging. Gastric Cancer 2020, 23, 126–132. [Google Scholar] [CrossRef] [PubMed] [Green Version]
- Maghsoudi, O.H.; Alizadeh, M.; Mirmomen, M. A computer aided method to detect bleeding, tumor, and disease regions in Wireless Capsule Endoscopy. In Proceedings of the 2016 IEEE Signal Processing in Medicine and Biology Symposium (SPMB), Philadelphia, PA, USA, 3 December 2016; pp. 1–6. [Google Scholar] [CrossRef]
- de Groen, P.C. Using artificial intelligence to improve adequacy of inspection in gastrointestinal endoscopy. Tech. Innov. Gastrointest. Endosc. 2020, 22, 71–79. [Google Scholar] [CrossRef]
- Charfi, S.; El Ansari, M. Computer-aided diagnosis system for ulcer detection in wireless capsule endoscopy videos. In Proceedings of the 2017 International Conference on Advanced Technologies for Signal and Image Processing (ATSIP), Fez, Morocco, 22–24 May 2017; pp. 1–5. [Google Scholar]
- Ahmed, S.S.; Dey, N.; Ashour, A.S.; Sifaki-Pistolla, D.; Bălas-Timar, D.; Balas, V.E.; Tavares, J.M.R.S. Effect of fuzzy partitioning in Crohn’s disease classification: A neuro-fuzzy-based approach. Med. Biol. Eng. Comput. 2017, 55, 101–115. [Google Scholar] [CrossRef] [PubMed] [Green Version]
- Alagappan, M.; Brown, J.R.G.; Mori, Y.; Berzin, T.M. Artificial intelligence in gastrointestinal endoscopy: The future is almost here. World J. Gastrointest. Endosc. 2018, 10, 239–249. [Google Scholar] [CrossRef] [PubMed]
- Kanesaka, T.; Lee, T.-C.; Uedo, N.; Lin, K.-P.; Chen, H.-Z.; Lee, J.-Y.; Wang, H.-P.; Chang, H.-T. Computer-aided diagnosis for identifying and delineating early gastric cancers in magnifying narrow-band imaging. Gastrointest. Endosc. 2018, 87, 1339–1344. [Google Scholar] [CrossRef]
- Hassan, A.R.; Haque, M.A. Computer-aided gastrointestinal hemorrhage detection in wireless capsule endoscopy videos. Comput. Methods Programs Biomed. 2015, 122, 341–353. [Google Scholar] [CrossRef]
- Korkmaz, S.A.; Binol, H. Classification of molecular structure images by using ANN, RF, LBP, HOG, and size reduction methods for early stomach cancer detection. J. Mol. Struct. 2018, 1156, 255–263. [Google Scholar] [CrossRef]
- Lu, S.; Lu, Z.; Zhang, Y.-D. Pathological brain detection based on AlexNet and transfer learning. J. Comput. Sci. 2019, 30, 41–47. [Google Scholar] [CrossRef]
- Liu, C.; Qi, L.; Feng, Q.-X.; Sun, S.-W.; Zhang, Y.-D.; Liu, X.-S. Performance of a machine learning-based decision model to help clinicians decide the extent of lymphadenectomy (D1 vs. D2) in gastric cancer before surgical resection. Abdom. Radiol. 2019, 44, 3019–3029. [Google Scholar] [CrossRef]
- Garcia, E.; Hermoza, R.; Castanon, C.B.; Cano, L.; Castillo, M.; Castanneda, C. Automatic Lymphocyte Detection on Gastric Cancer IHC Images Using Deep Learning. In Proceedings of the 2017 IEEE 30th International Symposium on Computer-Based Medical Systems (CBMS), Thessaloniki, Greece, 22–24 June 2017; pp. 200–204. [Google Scholar]
- Sharma, H.; Zerbe, N.; Klempert, I.; Hellwich, O.; Hufnagl, P. Deep convolutional neural networks for automatic classification of gastric carcinoma using whole slide images in digital histopathology. Comput. Med. Imaging Graph. 2017, 61, 2–13. [Google Scholar] [CrossRef]
- Xiao, J.; Wang, J.; Cao, S.; Li, B. Application of a Novel and Improved VGG-19 Network in the Detection of Workers Wearing Masks. J. Phys. Conf. Ser. 2020, 1518, 012041. [Google Scholar] [CrossRef]
- Das, S.; Mohan, A. Medical Image Enhancement Techniques by Bottom Hat and Median Filtering. Int. J. Electron. Commun. Comput. Eng. 2014, 5, 347–351. [Google Scholar]
- Owais, M.; Arsalan, M.; Choi, J.; Mahmood, T.; Park, K.R. Artificial Intelligence-Based Classification of Multiple Gastrointestinal Diseases Using Endoscopy Videos for Clinical Diagnosis. J. Clin. Med. 2019, 8, 986. [Google Scholar] [CrossRef] [Green Version]
- Muto, M.; Yao, K.; Kaise, M.; Kato, M.; Uedo, N.; Yagi, K.; Tajiri, H. Magnifying endoscopy simple diagnostic algorithm for early gastric cancer (MESDA-G). Dig. Endosc. 2016, 28, 379–393. [Google Scholar] [CrossRef] [PubMed] [Green Version]
- Jiang, Y.-G.; Wu, Z.; Tang, J.; Li, Z.; Xue, X.; Chang, S.-F. Modeling Multimodal Clues in a Hybrid Deep Learning Framework for Video Classification. IEEE Trans. Multimed. 2018, 20, 3137–3147. [Google Scholar] [CrossRef] [Green Version]
- Charfi, S.; El Ansari, M. Computer-aided diagnosis system for colon abnormalities detection in wireless capsule endoscopy images. Multimed. Tools Appl. 2018, 77, 4047–4064. [Google Scholar] [CrossRef]
- Korkmaz, S.A.; Esmeray, F. A New Application Based on GPLVM, LMNN, and NCA for Early Detection of the Stomach Cancer. Appl. Artif. Intell. 2018, 32, 1–17. [Google Scholar] [CrossRef]
- Sumiyama, K. Past and current trends in endoscopic diagnosis for early stage gastric cancer in Japan. Gastric Cancer 2016, 20, 20–27. [Google Scholar] [CrossRef]
- Ali, H.; Yasmin, M.; Sharif, M.; Rehmani, M.H. Computer assisted gastric abnormalities detection using hybrid texture descriptors for chromoendoscopy images. Comput. Methods Programs Biomed. 2018, 157, 39–47. [Google Scholar] [CrossRef] [PubMed]
- Khan, M.A.; Kadry, S.; Alhaisoni, M.; Nam, Y.; Zhang, Y.-D.; Rajinikanth, V.; Sarfaraz, M.S. Computer-Aided Gastrointestinal Diseases Analysis From Wireless Capsule Endoscopy: A Framework of Best Features Selection. IEEE Access 2020, 8, 132850–132859. [Google Scholar] [CrossRef]
- Caroppo, A.; Leone, A.; Siciliano, P. Deep transfer learning approaches for bleeding detection in endoscopy images. Comput. Med. Imaging Graph. 2021, 88, 101852. [Google Scholar] [CrossRef]
- Park, J.; Jang, B.G.; Kim, Y.W.; Park, H.; Kim, B.-H.; Kim, M.J.; Ko, H.; Gwak, J.M.; Lee, E.J.; Chung, Y.R.; et al. A Prospective Validation and Observer Performance Study of a Deep Learning Algorithm for Pathologic Diagnosis of Gastric Tumors in Endoscopic Biopsies. Clin. Cancer Res. 2021, 27, 719–728. [Google Scholar] [CrossRef]
- Klang, E.; Barash, Y.; Margalit, R.Y.; Soffer, S.; Shimon, O.; Albshesh, A.; Ben-Horin, S.; Amitai, M.M.; Eliakim, R.; Kopylov, U. Deep learning algorithms for automated detection of Crohn’s disease ulcers by video capsule endoscopy. Gastrointest. Endosc. 2020, 91, 606–613.e2. [Google Scholar] [CrossRef]
- Gong, J.; Ma, D.; Zhang, Y.; Jiang, J.; Pei, M. Image Classification to Diagnose Chronic Atrophic Gastritis Based on Squeeze-and-Excitation Block. In Proceedings of the 2020 IEEE 5th International Conference on Cloud Computing and Big Data Analytics (ICCCBDA), Chengdu, China, 10–13 April 2020; pp. 336–340. [Google Scholar] [CrossRef]
- Ma, B.; Guo, Y.; Hu, W.; Yuan, F.; Zhu, Z.; Yu, Y.; Zou, H. Artificial Intelligence-Based Multiclass Classification of Benign or Malignant Mucosal Lesions of the Stomach. Front. Pharmacol. 2020, 11, 572372. [Google Scholar] [CrossRef] [PubMed]
- Luo, S.; Fan, Y.; Chang, W.; Liao, H.; Kang, H.; Huo, L. Classification of human stomach cancer using morphological feature analysis from optical coherence tomography images. Laser Phys. Lett. 2019, 16, 095602. [Google Scholar] [CrossRef]
- Kim, J.H.; Nam, H.S.; Choi, C.W.; Kang, D.H.; Kim, H.W.; Park, S.; Kim, S.J.; Hwang, S.H.; Lee, S.H. Risk factors associated with difficult gastric endoscopic submucosal dissection: Predicting difficult ESD. Surg. Endosc. 2017, 31, 1617–1626. [Google Scholar] [CrossRef]
- Horiuchi, Y.; Fujisaki, J.; Yamamoto, N.; Shimizu, T.; Miyamoto, Y.; Tomida, H.; Omae, M.; Ishiyama, A.; Yoshio, T.; Hirasawa, T.; et al. Accuracy of diagnostic demarcation of undifferentiated-type early gastric cancers for magnifying endoscopy with narrow-band imaging: Endoscopic submucosal dissection cases. Gastric Cancer 2015, 19, 515–523. [Google Scholar] [CrossRef] [PubMed] [Green Version]
- MATLAB, version 9.4 (R2018a); The MathWorks Inc.: Natick, MA, USA, 2018.
- Zeng, M.; Li, J.; Peng, Z. The design of Top-Hat morphological filter and application to infrared target detection. Infrared Phys. Technol. 2006, 48, 67–76. [Google Scholar] [CrossRef]
- Liaqat, A.; Khan, M.A.; Shah, J.H.; Sharif, M.; Yasmin, M.; Fernandes, S.L. Automated ulcer and bleeding classification from WCE images using multiple features fusion and selection. J. Mech. Med. Biol. 2018, 18, 1–25. [Google Scholar] [CrossRef]
- Khan, M.A.; Khan, M.A.; Ahmed, F.; Mittal, M.; Goyal, L.M.; Hemanth, D.J.; Satapathy, S.C. Gastrointestinal diseases segmentation and classification based on duo-deep architectures. Pattern Recognit. Lett. 2020, 131, 193–204. [Google Scholar] [CrossRef]


| Techniques/Methods | Disease | Dataset | Accuracy | Reference |
|---|---|---|---|---|
| Inception V3 and SVM | Bleeding | 2352 Images | 97.71% | [37] |
| CNN | Gastric Cancer | 2434 Images | 95% | [38] |
| VGG16 and SVM | Ulcer and Bleeding | 6000 Images | 98.4% | [36] |
| CNN | Gastric Cancer | 2088 Images | 90.91% | [14] |
| CNN | Ulcer | 17640 Images | 96.7% | [39] |
| CNN | Gastritis | 5470 Images | 88.15% | [40] |
| DCNN | Gastric Cancer | 763 Images | 96% | [41] |
| ResNet and LSTM | Ulcer and Crohn’s | 52,471 Frames | 97.05% | [29] |
| SVM and RF | Stomach cancer | 3106 Images | 96.36% | [42] |
| CNN | Gastric Cancer | 13,584 Images | 92.2% | [10] |
| CNN | Gastric Cancer | 1000 Images | 87.6% | [6] |
| DFT and NB | Stomach Cancer | 900 Images | 90.27% | [33] |
| SVM and MLP | Colon Abnormalities | 1670 Images | 96.5% | [32] |
| CNN | Gastric Cancer | 3257 Images | 96.88% | [25] |
| ANN, RF, LBP, and HOG | Stomach Cancer | 180 Images | 96.29% | [22] |
| SVM | Gastric Cancer | 207 Images | 96.3% | [20] |
| ANN | Stomach Cancer | 270 Images | 88.9% | [11] |
| SVM and MLP | Ulcer | 2333 Images | 94.07% | [17] |
| BPNN | Stomach Disorder | 40 Images | 87.5% | [1] |
| ESD | Gastric Neoplasms | 1052 Patients | 93.3% | [43] |
| BPNN | Crohn’s Disease | 387 Patients | 97.67% | [18] |
| ME-NBI | Gastric Cancer | 76 Patients | 81.6% | [44] |
| SVM | Gastrointestinal Hemorrhage | 2920 Images | 98.95% | [21] |
| CNN and ELM | Digestion Disease | 25 Examinations | 97.25% | [12] |
| Sr. No | Performance Matrix | Formula | Description |
|---|---|---|---|
| 1. | Where, Pt = True Positives Pf = False positives Nf = False Negatives Nt = True Negatives | ||
| 2. | |||
| 3. | |||
| 4. | |||
| 5. | |||
| 6. |
| Classifier | Recall (%) | Precision (%) | F1 Score (%) | FPR | AUC | Accuracy (%) | FNR (%) |
|---|---|---|---|---|---|---|---|
| Fine Tree | 88.6 | 88.8 | 88.7 | 0.028 | 0.946 | 88.7 | 11.4 |
| Cubic SVM | 99.8 | 99.8 | 99.8 | 0 | 1 | 99.9 | 0.2 |
| Fine KNN | 99.6 | 99.6 | 99.6 | 0 | 1 | 99.8 | 0.4 |
| Cosine KNN | 98.2 | 98.2 | 98.2 | 0.006 | 1 | 98.2 | 1.8 |
| Bagged Tree | 97.8 | 97.2 | 97.4 | 0.006 | 1 | 97.2 | 2.2 |
| Linear SVM | 97.4 | 96.6 | 96.9 | 0.01 | 1 | 96.6 | 2.6 |
| Coarse Tree | 73 | 63.6 | 67.9 | 0.068 | 0.91 | 73.1 | 27 |
| Classifier | Recall (%) | Precision (%) | F1 Score (%) | FPR | AUC | Accuracy (%) | FNR (%) |
|---|---|---|---|---|---|---|---|
| Fine Tree | 92.4 | 92.8 | 92.59 | 0.0016 | 0.964 | 92.7 | 7.6 |
| Cubic SVM | 99.6 | 99.6 | 99.6 | 0 | 1 | 99.8 | 0.4 |
| Fine KNN | 99.8 | 99.8 | 99.8 | 0 | 1 | 99.9 | 0.2 |
| Cosine KNN | 98.2 | 98 | 98.1 | 0.004 | 1 | 98.2 | 1.8 |
| Bagged Tree | 98 | 98 | 98 | 0.002 | 1 | 98.1 | 2 |
| Linear SVM | 98.2 | 97.2 | 97.69 | 0.006 | 1 | 97.2 | 1.8 |
| Coarse KNN | 86.4 | 86.6 | 86.5 | 0.034 | 0.964 | 86.4 | 13.6 |
| Classifier | Recall (%) | Precision (%) | F1 Score (%) | FPR | AUC | Accuracy (%) | FNR (%) |
|---|---|---|---|---|---|---|---|
| Fine Tree | 90.8 | 91 | 90.89 | 0.022 | 0.954 | 90.9 | 9.2 |
| Cubic SVM | 99.6 | 99.6 | 99.80 | 0 | 1 | 99.8 | 0.4 |
| Fine KNN | 99.8 | 99.8 | 99.8 | 0 | 1 | 99.9 | 0.2 |
| Cosine KNN | 98.4 | 98 | 97.60 | 0.004 | 1 | 98.2 | 1.6 |
| Bagged Tree | 97.4 | 97.4 | 97.56 | 0.006 | 1 | 97.3 | 2.6 |
| Linear SVM | 96.6 | 96.8 | 99.69 | 0.008 | 1 | 96.7 | 3.4 |
| Quadratic SVM | 99.6 | 99.6 | 99.8 | 0 | 1 | 99.8 | 0.4 |
| Classifier | Recall (%) | Precision (%) | F1 Score (%) | FPR | AUC | Accuracy (%) | FNR (%) |
|---|---|---|---|---|---|---|---|
| Fine Tree | 87.4 | 87.6 | 87.49 | 0.03 | 0.742 | 87.7 | 12.6 |
| Cubic SVM | 99.4 | 99.6 | 99.49 | 0 | 1 | 99.7 | 0.6 |
| Fine KNN | 99.8 | 99.6 | 99.69 | 0 | 0.99 | 99.8 | 0.2 |
| Cosine KNN | 98.6 | 98.4 | 98.49 | 0.004 | 1 | 98.5 | 1.4 |
| Bagged Tree | 97.2 | 97.2 | 97.2 | 0.004 | 1 | 97.3 | 2.8 |
| Linear SVM | 97.6 | 97.4 | 99.49 | 0.006 | 1 | 97.6 | 2.4 |
| Quadratic SVM | 99.6 | 99.6 | 99.6 | 0 | 1 | 99.7 | 0.4 |
| Classifier | Recall (%) | Precision (%) | F1 Score (%) | FPR | AUC | Accuracy (%) | FNR (%) |
|---|---|---|---|---|---|---|---|
| Fine Tree | 90.33 | 90.43 | 90.34 | 0.024 | 0.962 | 90.3 | 9.67 |
| Cosine KNN | 99.26 | 99.26 | 99.26 | 0.002 | 1 | 99.3 | 0.74 |
| Bagged Tree | 98.84 | 98.84 | 98.84 | 0.004 | 1 | 98.8 | 1.16 |
| Linear SVM | 98.62 | 98.64 | 98.63 | 0.004 | 1 | 98.6 | 1.38 |
| Coarse Tree | 75.84 | 79.74 | 77.74 | 0.06 | 0.914 | 75.9 | 24.16 |
| Cubic SVM | 99.8 | 99.8 | 99.8 | 0 | 1 | 99.8 | 0.2 |
| Naïve Bayes | 96.16 | 96.24 | 96.19 | 0.008 | 0.976 | 96.2 | 3.84 |
| Coarse KNN | 90.74 | 91.6 | 91.16 | 0.024 | 0.98 | 90.7 | 9.26 |
| Author/Year | Techniques/Methods | Disease | Dataset | Results |
|---|---|---|---|---|
| [39] | CNN | Ulcer | 17,640 Images | 96.7% |
| [41] | DCNN | Gastric Cancer | 763 Images | 96% |
| [36] | VGG16 and SVM | Ulcer | 6000 Images | 98.4% |
| [37] | Inception V3 and SVM | Bleeding | 2352 Images | 97.71% |
| Proposed Methodology | VGG19, Alexnet, and Cubic SVM | Ulcer, Bleeding, Esophagitis, and Gastritis | 2600 Images | 99.8% |
Publisher’s Note: MDPI stays neutral with regard to jurisdictional claims in published maps and institutional affiliations. |
© 2021 by the authors. Licensee MDPI, Basel, Switzerland. This article is an open access article distributed under the terms and conditions of the Creative Commons Attribution (CC BY) license (https://creativecommons.org/licenses/by/4.0/).
Share and Cite
Ayyaz, M.S.; Lali, M.I.U.; Hussain, M.; Rauf, H.T.; Alouffi, B.; Alyami, H.; Wasti, S. Hybrid Deep Learning Model for Endoscopic Lesion Detection and Classification Using Endoscopy Videos. Diagnostics 2022, 12, 43. https://0-doi-org.brum.beds.ac.uk/10.3390/diagnostics12010043
Ayyaz MS, Lali MIU, Hussain M, Rauf HT, Alouffi B, Alyami H, Wasti S. Hybrid Deep Learning Model for Endoscopic Lesion Detection and Classification Using Endoscopy Videos. Diagnostics. 2022; 12(1):43. https://0-doi-org.brum.beds.ac.uk/10.3390/diagnostics12010043
Chicago/Turabian StyleAyyaz, M Shahbaz, Muhammad Ikram Ullah Lali, Mubbashar Hussain, Hafiz Tayyab Rauf, Bader Alouffi, Hashem Alyami, and Shahbaz Wasti. 2022. "Hybrid Deep Learning Model for Endoscopic Lesion Detection and Classification Using Endoscopy Videos" Diagnostics 12, no. 1: 43. https://0-doi-org.brum.beds.ac.uk/10.3390/diagnostics12010043