2.1. Study Design
After Institutional Review Board approval was obtained (YDU/2020/85-1186), data of all cases under 16 years of age admitted 2019–2020 with diagnosis of the acute abdominal pain were collected. The diagnosis of the patients was confirmed by two researchers through analysis of all records of the patients. All patients were free of tumor, infection, and hematological diseases. As data for the analysis, the examinations were assessed by two expert observers (O.T., K.K.) in terms of imaging time, easy applicability of the examination, duration of the examination, specificity, sensitivity, user dependency, fee, diagnostic precision, request duration, and radiation exposure, and with their joint decision. Their answers were defined as five scale linguistic triangular fuzzy scales. The model made an examination selection ranking according to the AIR score data. This analysis was made for US, non-contrast CT, contrast-enhanced CT, 1.5 T MRI, and 3T MRI. Furthermore, the PROMETHEE and the TOPSIS techniques were applied for this evaluation. The Gaussian preference function was used for the PROMETHEE analysis for each criterion. Linguistic fuzzy scale was applied for the determination of the importance weights of the criteria and selected criteria and Yager index was used for the defuzzification of the defined triangular fuzzy values.
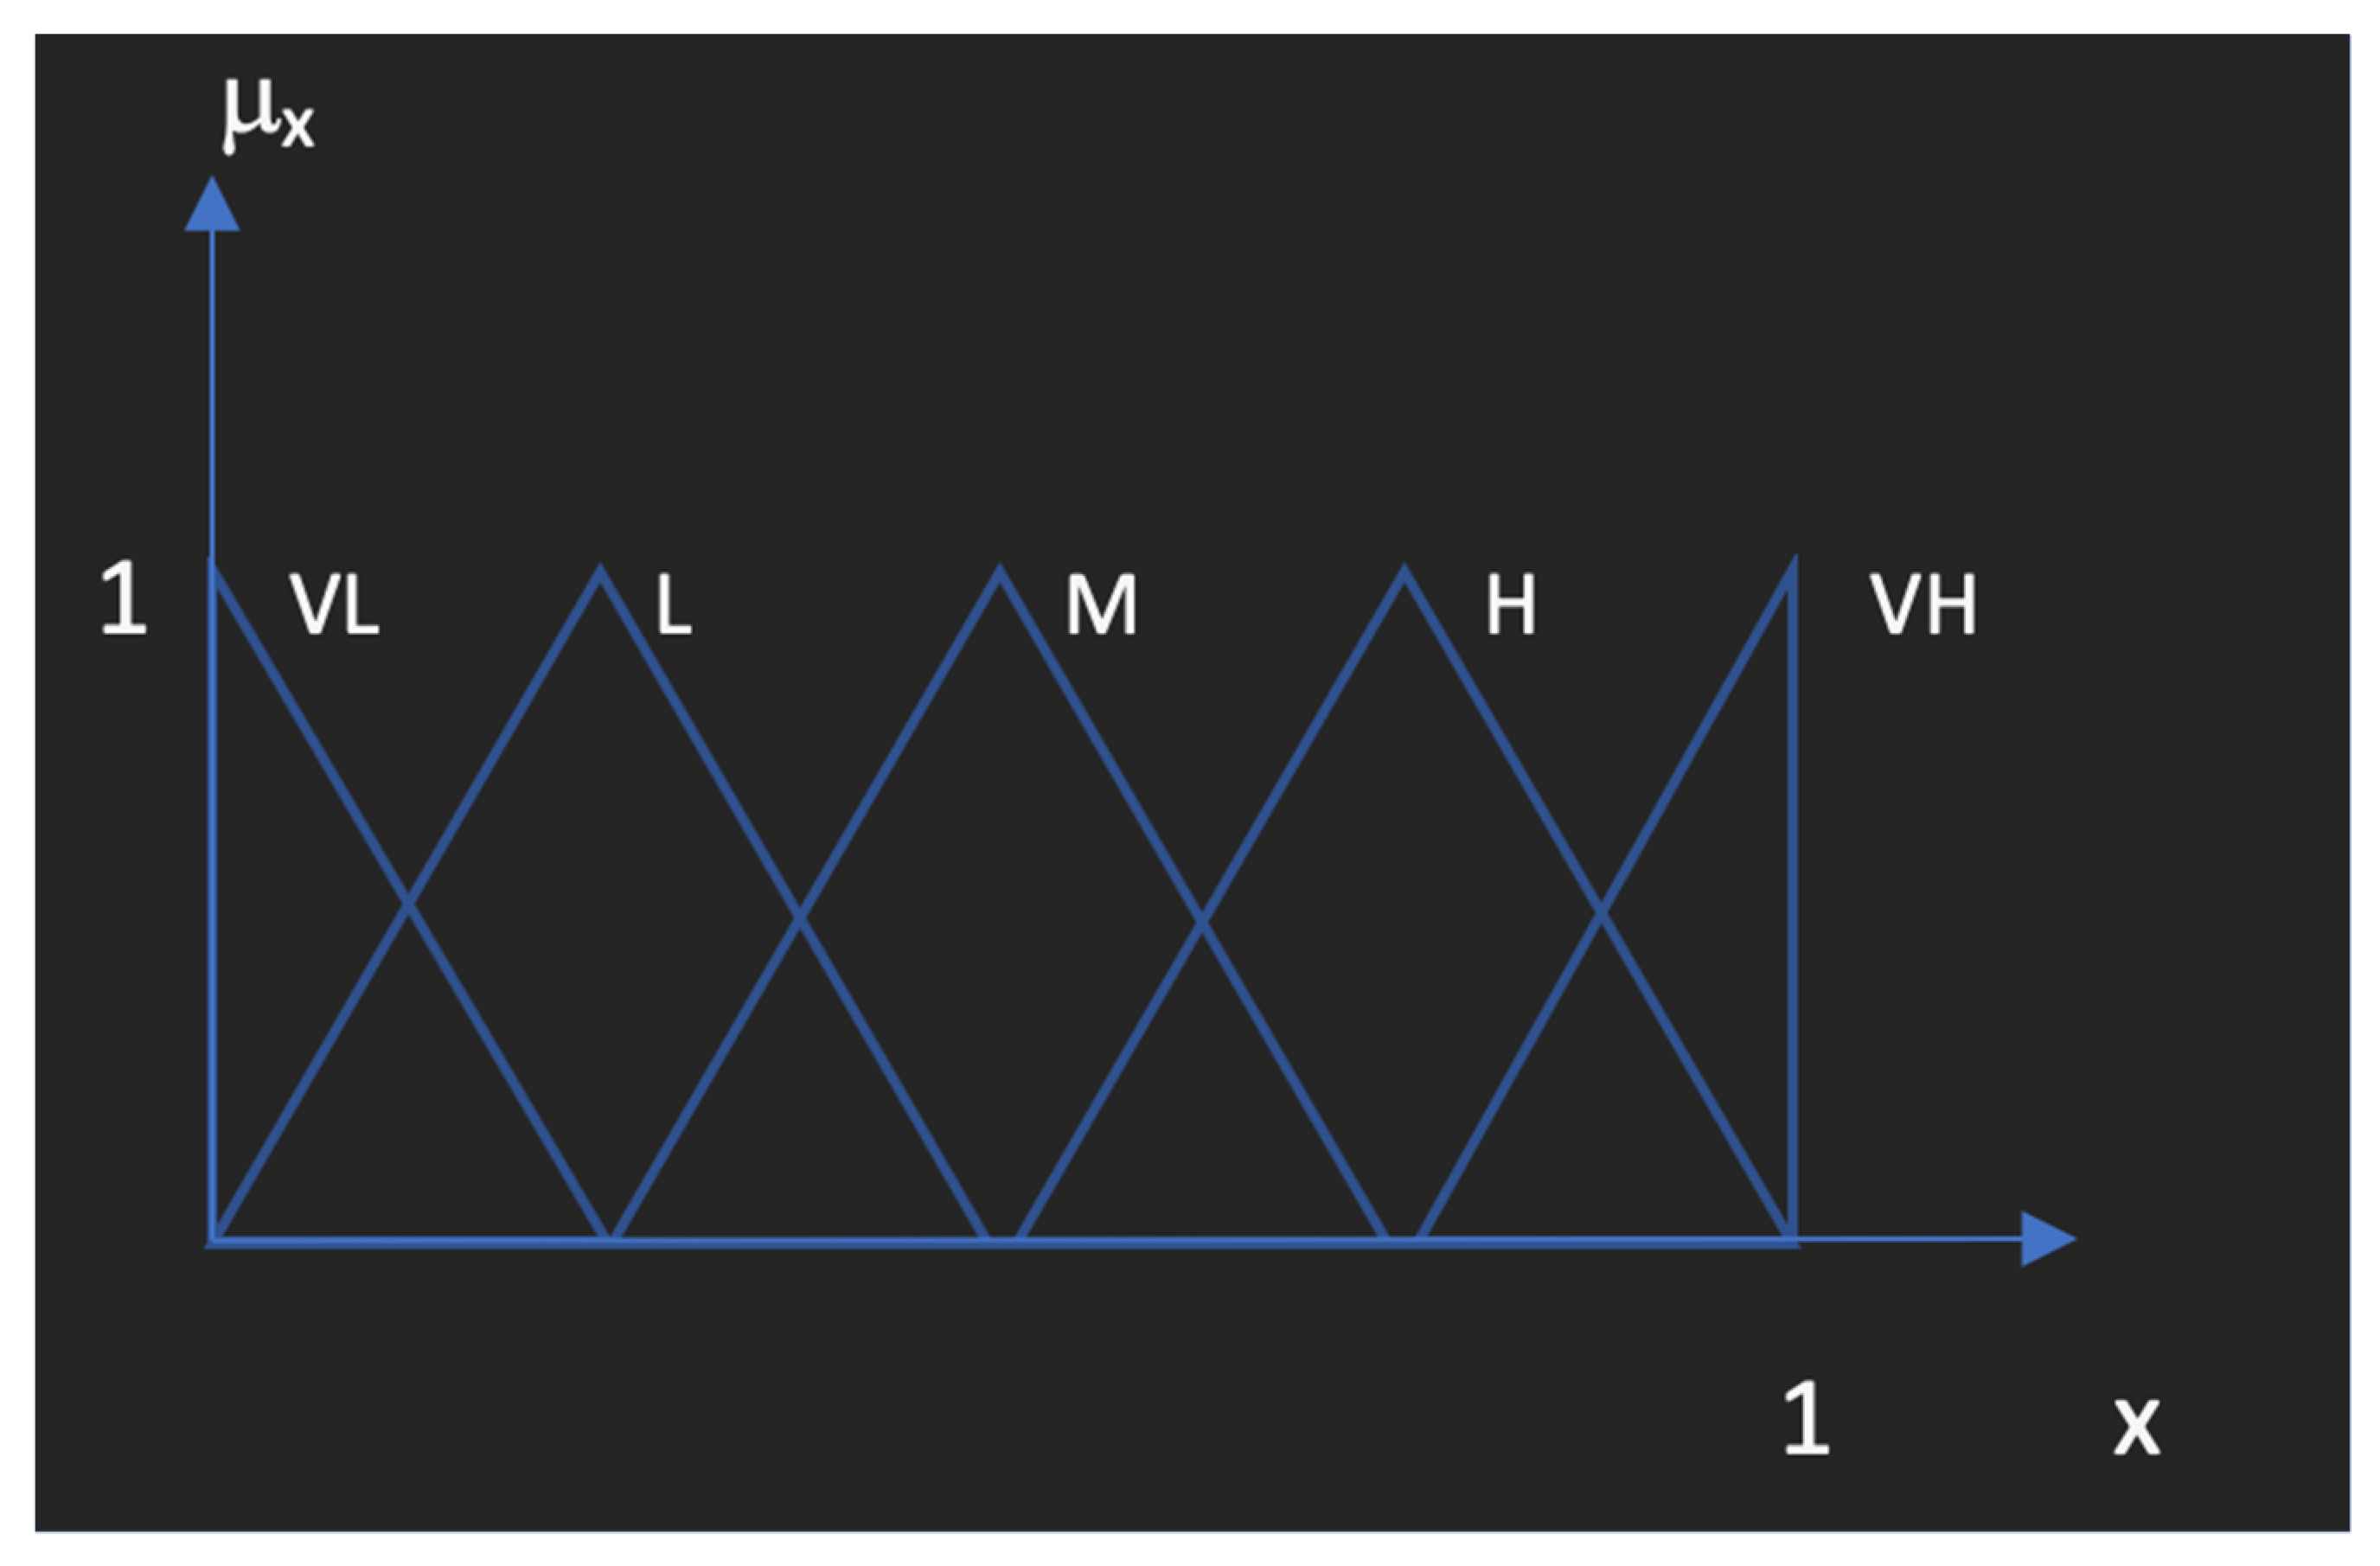
Figure 1 shows the linguistic fuzzy sets and their assigned fuzzy numbers used for the expression of the fuzzy parameters. VH: Very high; H: High; M: Medium; L: Low; and VL: Very low are defined as the linguistic expressions used for determination of the data. Each linguistic expression and the importance given to parameters selected by experts are assigned to triangular fuzzy values as shown in detail at
Table 2 below.
Using the fuzzy scale enables the expert to determine the weights or degrees of importance of the parameters used for the comparison of the medical diagnosis tools for acute appendicitis in pediatric patients. Then, after the defuzzification process, the decision matrix is constructed for use in MCDM approaches. Yager index is a value that provides the defuzzified point for the triangular fuzzy numbers, proposed by Ronald Yager as one of the most important ranking methods for fuzzy sets.
Data: Data included demographics, preoperative clinical findings for AIR score such as vomiting, pain in RLQ, rebound tenderness or muscular defense, body temperature, polymorphonuclear leukocytes rate, white blood cell count, and C-reactive protein concentration. Radiological data were not included in generator operator-independent data. Parental consent was obtained both of surgical approach and publication of the data. Diagnosis and management of appendicitis were determined through clinical, laboratory, radiological, and surgical findings.
Statistical analysis: Statistical analysis was performed with IBM SPSS Statistics 26.0.0 (Chicago, IL, USA). The characteristics of the study sample were analyzed by descriptive statistics, with dichotomous or ordinal data presented as percentage, and continuous data as means with SD. The Kolmogorov–Smirnov test was used to demonstrate normal distribution. One-way ANOVA was used for homogeneity of variables, while Student’s
t test was used. Statistical associations were considered significant if the
p value was <0.05. In our daily life, we face many problems in different fields, the most common ones are the problems related to choosing or evaluating something included in groups of other choices. In some cases, the evaluation of the situations could be complex and needs to consider many factors with different weights or levels of importance for these factors for the evaluation. To solve this problem, multi criteria decision making (MCDM) is used and this principle refers to making decisions in the presence of multiple, usually conflicting, criteria [
21]. Although MCDM problems are very common and popular, MCDM as a discipline has a short history of about 30 years. It developed relatively to computer advancements and development and because of this relation, computers gave us the ability to conduct complex and big MCDM problems which expands the applications of MCDM.
On the other hand, the popularity of computers and mobiles generated an enormous amount of data in several fields which makes MCDM more important and dominant in supporting design makers in different sectors with usable data [
21]. The MCDM problems have three main components which are the decision maker/s (DMs), alternatives, and criteria. In general, the classification of MCDA problems depends on types of these three elements. Decision maker/s (DMs): in problems, we may have one decision maker which is responsible for determining what to do or multiple decision makers such as several people or organizations who are involved in the processes of MCDM. In case of multiple decision making, many different preferences, goals, criteria, and objectives appear so the results might not satisfy every DM [
22]. In this case, obtaining usable outcomes depends mainly on the range of cooperation between the DMs. In case of the presence of multiple DMs with different preferences and priorities, the problem of their presence could be included in MCDM problems to be solved [
23]. Alternatives: these are the things or possibilities that the decision maker/s should choose from. These possibilities could be identified previously or could be created through process. It is important to know that the decision space is the definition of the set of all possible alternatives [
22]. Criteria: the specifications or requirements that each element of decision space should have or possess and depending on these requirements, each element is rated and evaluated by how well it possesses one of the process criteria [
22].
There are many ways to classify the methods of multi criteria decision making. One of these ways is to classify according to decision makers which could be one decision maker or group of decision makers; the methods could also be classified according to the type of data used in the process, such as deterministic data which are accurate and clear data, stochastic which means the data are random and the opposite of deterministic data, and in some cases the data presented as fuzzy information which are not clear or vague. There are some subsidiary classifications such as in case of a deterministic, single decision maker. The classification problem considers the type of information and the number of decision makers [
24]. Multi criteria decision making has many techniques such as Analytic Hierarchy Process (AHP) method, Preference Ranking Organization Method for Enrichment Evaluation (PROMETHEE), Technique for Order of Preference by Similarity to Ideal Solution (TOPSIS), Analytical Network Process (ANP), Compromise ranking method (VIKOR), Elimination Et Choix Traduisant la Realité (ELECTRE) [
25,
26], etc. In this study, two types of analytical methods were used, specifically F-PROMETHEE and F-TOPSIS.
2.2. Fuzzy PROMETHEE (F-PROMETHEE)
This definition or technique contains two main parts, fuzzy and PROMETHEE. With the fuzzy logic process, the vague and linguistic data could be defined and with the PROMETHEE process, the ranking of the alternatives under the fuzzy conditions can be obtained. The PROMETHEE method was created by Brans et al. (1984) in order to present a rational and clear method to rank alternatives [
27,
28]. The first part of the technique is the fuzzy process, which refers to mathematical means used to explain the non-numerical data or uncertain information mathematically. Distinguishing the real value depends on if it is completely true or false. This manner facilitates the utilizing, interpreting, and manipulating the data when there is a lack of certainty or clearance [
29]. The second part is PROMETHEE and this method is used for evaluating and arranging the alternatives with different criteria to get a specific aim. This technique has two parts, PROMETHEE I and II; the first one used for obtaining the partial raking results and the second one used to get the net ranking results between the alternatives [
9]. PROMETHEE is one of the outranking methods, which is well understood and has a lot of applications in many fields. There are mainly six steps of this method as shown below [
30,
31] after the decision matrix, the matrix that contains alternatives and the criterion, is constructed:
Step 1. Determination of the preference function for each criterion .
Step 2. Determination of the importance weights for each criterion ().
Step 3. Calculation of the outranking relation/preference index
for each pair of alternatives with the Equation (1):
stands for the preference index of the alternative compared to alternative by considering each criterion simultaneously and denotes the value of the k-th criterion of i-th alternative.
Step 4. Calculations of the entering/negative outranking flow and leaving/positive outranking flow for each alternative using the Equations (2) and (3), respectively.
where
n denotes the number of alternatives.
The leaving flow indicates how good the alternative is over other alternatives, while the entering flow indicates how much all other alternatives are better or more preferred than alternative and it shows how weak the alternative is.
Step 5. Generating the partial order of the alternatives based on the following statements:
should be preferred to
(
if
is equally preferred to
(
if
is incomparable to
) if
The last statement occurring in this PROMETHEE I process the total ranking can be obtained by applying to PROMETHEE II method.
Step 6. The net ranking results should be determined by using Equation (7)
Total ranking results can be obtained with the following statements.
The higher net flow ( means a better alternative and that demonstrates the aim of PROMETHEE II (10).
2.3. TOPSIS
The TOPSIS method was created as an alternative to the ELECTRE method by Yoon and Hwang 1979 [
11,
32]. This method is based on the principle of when the alternative has the shortest distance to the ideal solution, that indicates that it is the best choice.
In the classical TOPSIS method, in the presence of one decision maker, the assumption is that the ratings and the weights are well represented by numerical data. The assumption differs and is more complex if there are many decision makers, because the preferences and vision differ. There are mainly 5 steps for the TOPSIS process as follows [
12]:
Step 1: Creation of decision matrix
and the importance weights (
) where
Step 2. Calculate the normalized decision matrix; the commonly used normalization data can be calculated by using the Equation (11):
Step 3. Calculate the weighted normalized decision values (
) to obtain the weighted normalized matrix using the Equation (12).
where
Step 4. Determine the positive ideal solution (PIS/
) and negative ideal solution (NIS/
). In this step, two extreme sides (negative and positive) are identified as given in Equations (13) and (14).
where
,
denotes the beneficial criteria and
denotes the non-beneficial criteria.
Step 5. Calculate the distance measures from the positive ideal solution (
) and the negative ideal solution
for each alternative by using the
n dimensional Euclidean metric using the following equations:
Step 6. Rank the alternatives based on the relative closeness to the positive ideal solution (
) in descending order where:


