
Urinary Metabolomic Analysis of Prostate Cancer by UPLC-FTMS and UPLC-Ion Trap MSn
 , and
, and
Abstract
:1. Introduction
2. Materials and Methods
2.1. Sample Collection and Preparation
2.2. Chemicals
2.3. Instrumentation
2.4. Data Analysis
2.5. Normalization and Significance Criteria
2.6. Web Searching
2.7. Statistical Analysis
3. Results
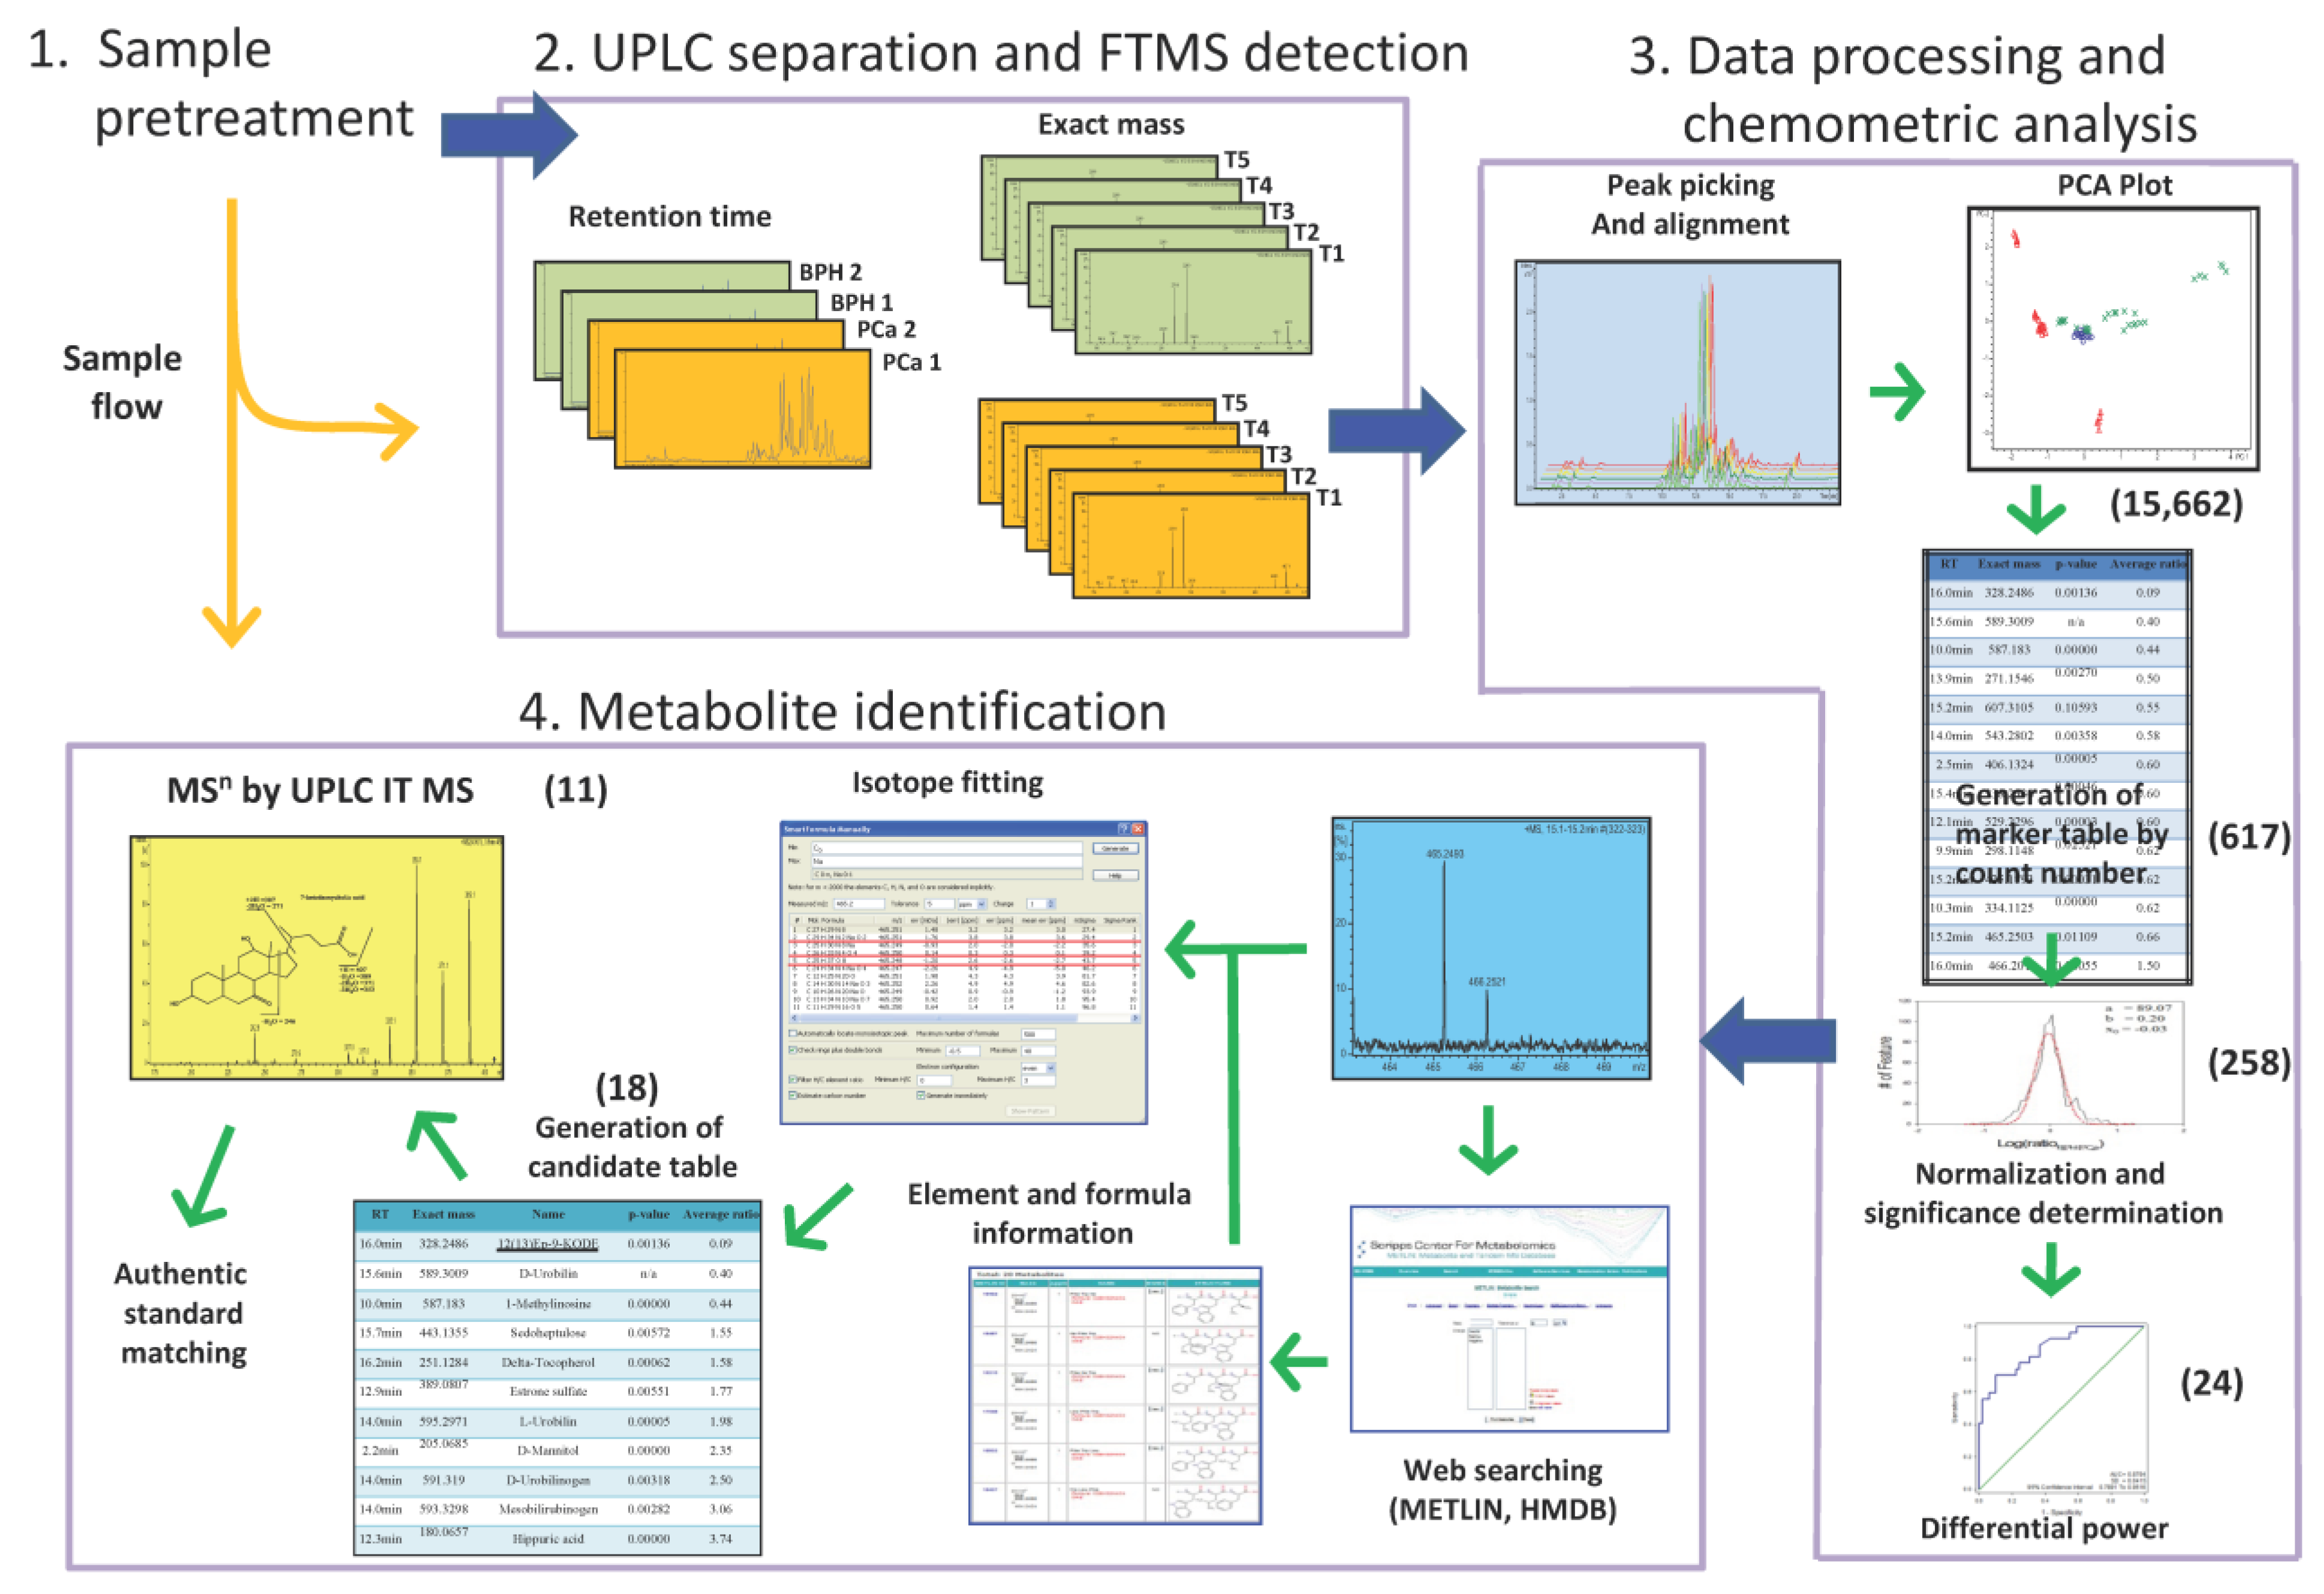
3.1. Workflow for Urinary Metabolomic Analysis by Integration of UPLC-FTMS and UPLC-Ion Trap
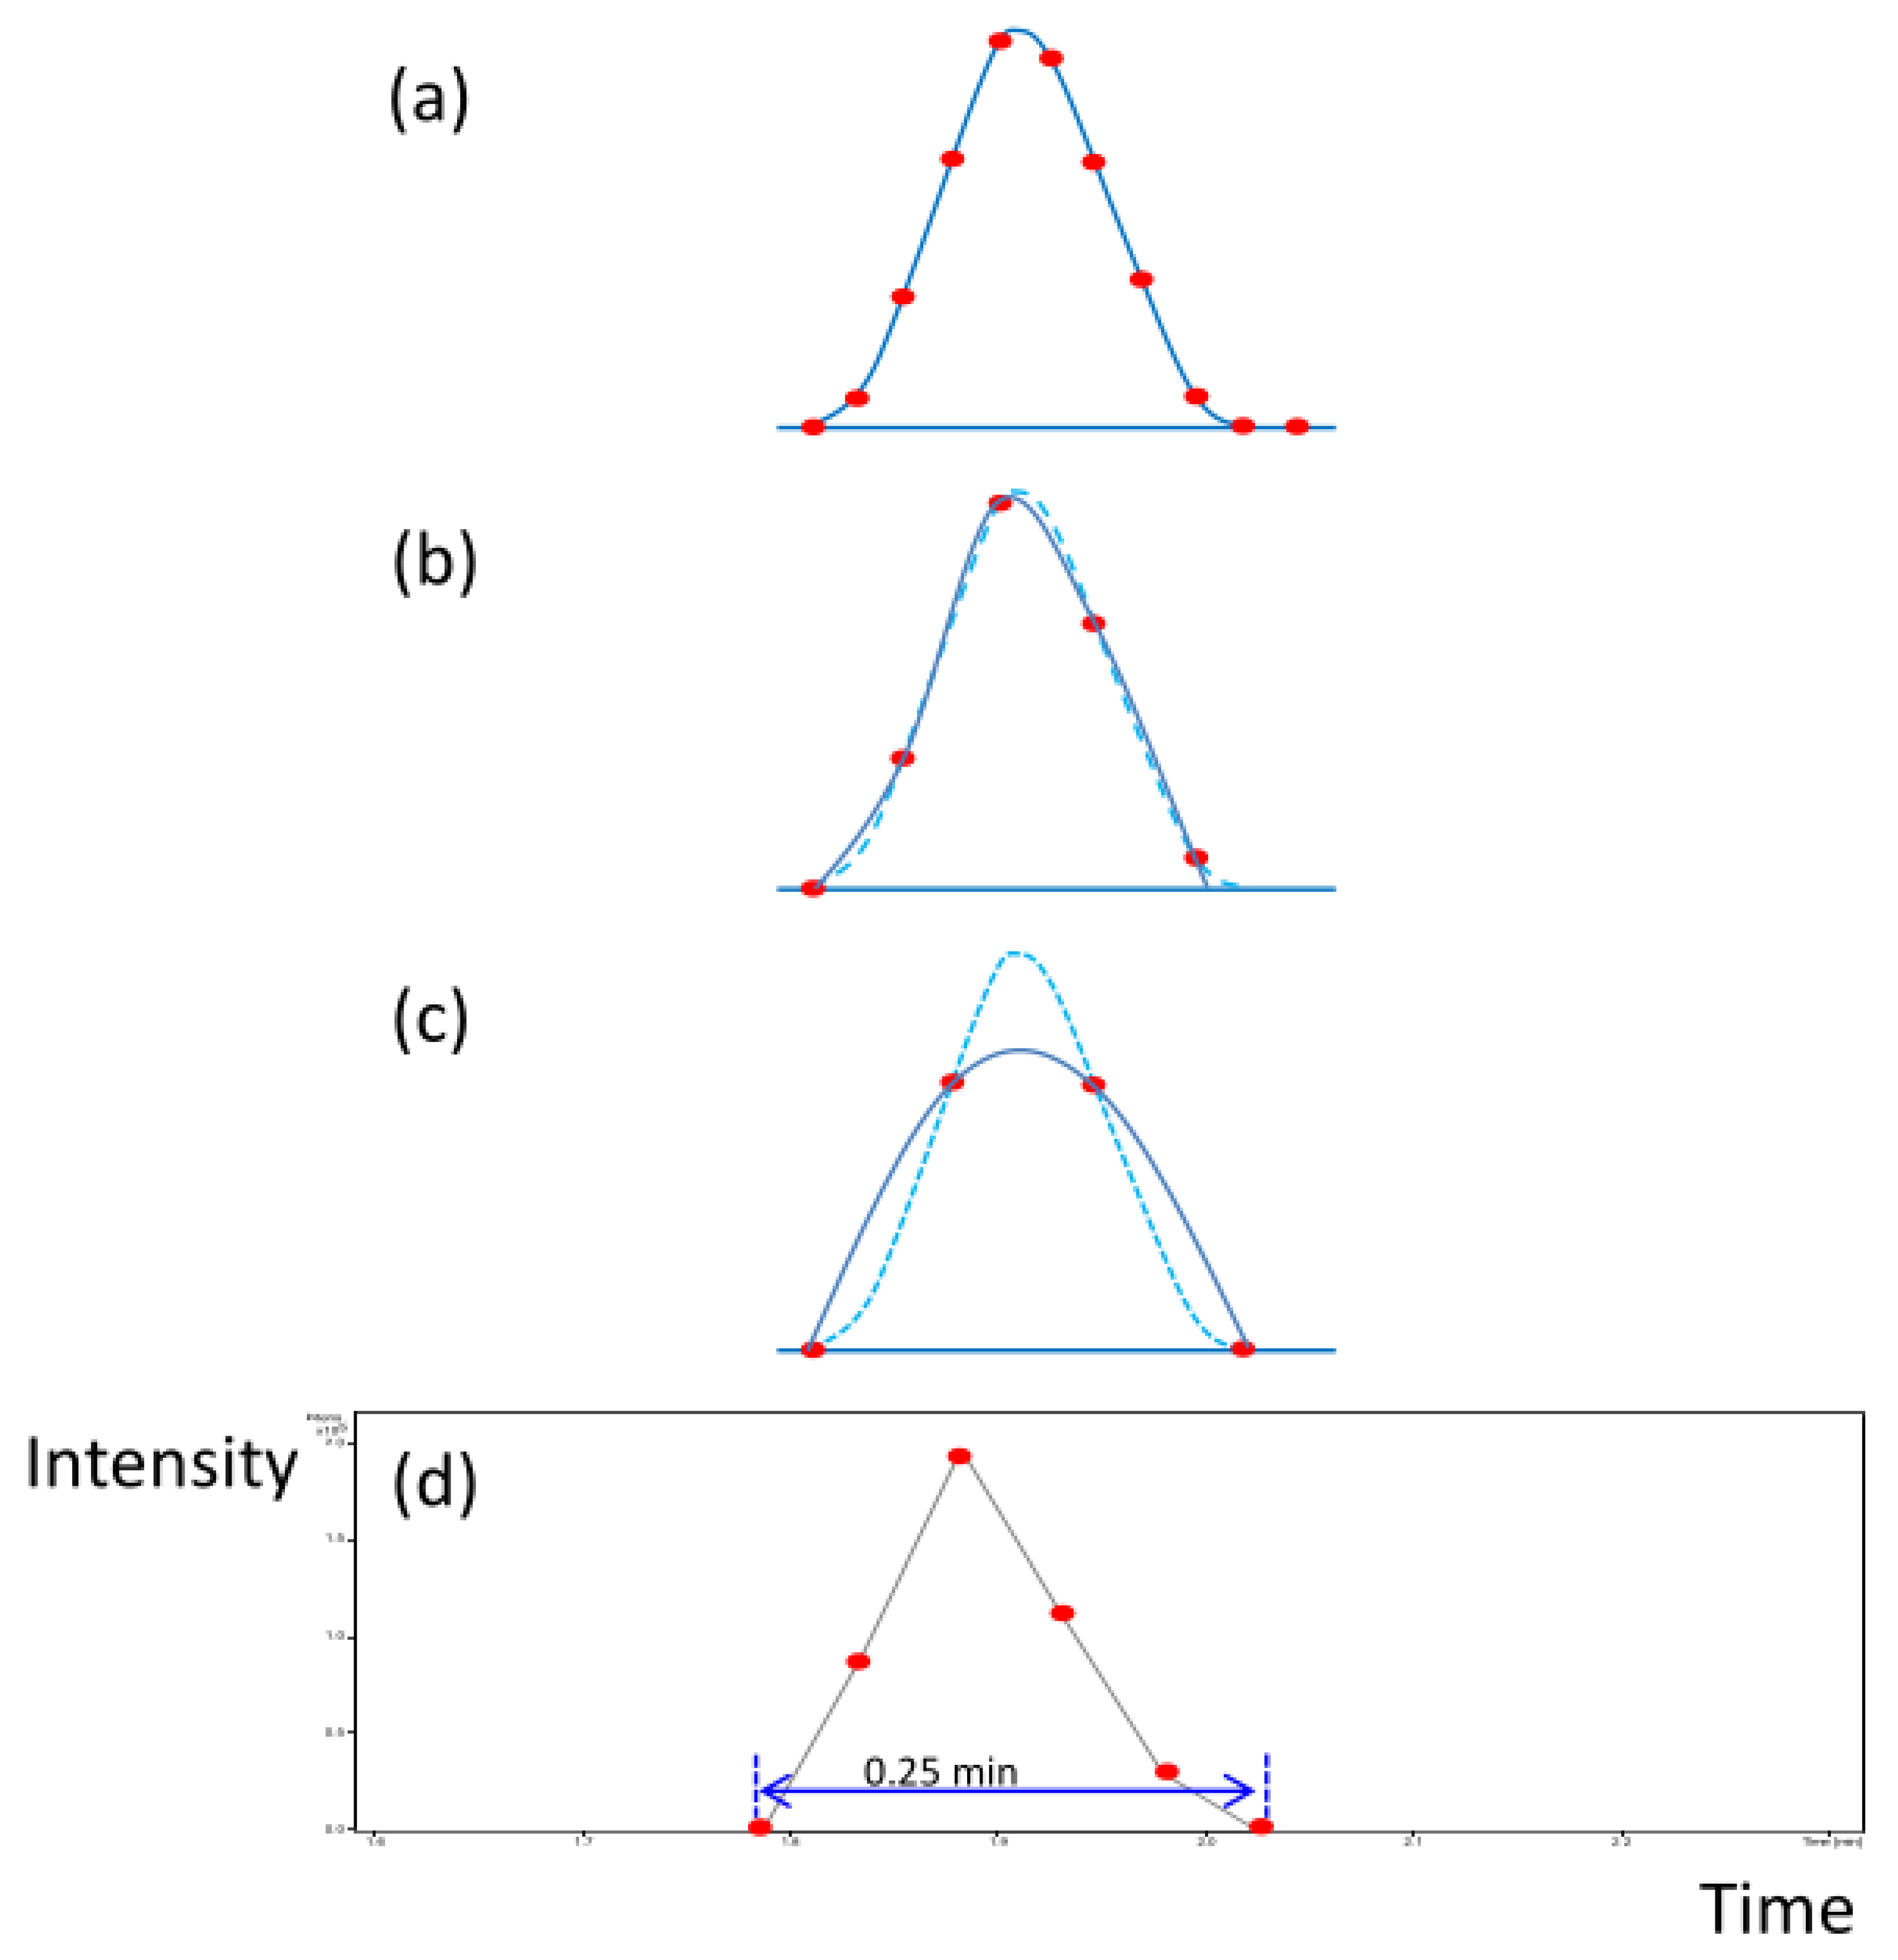
3.2. Optimization of UPLC-FTMS System
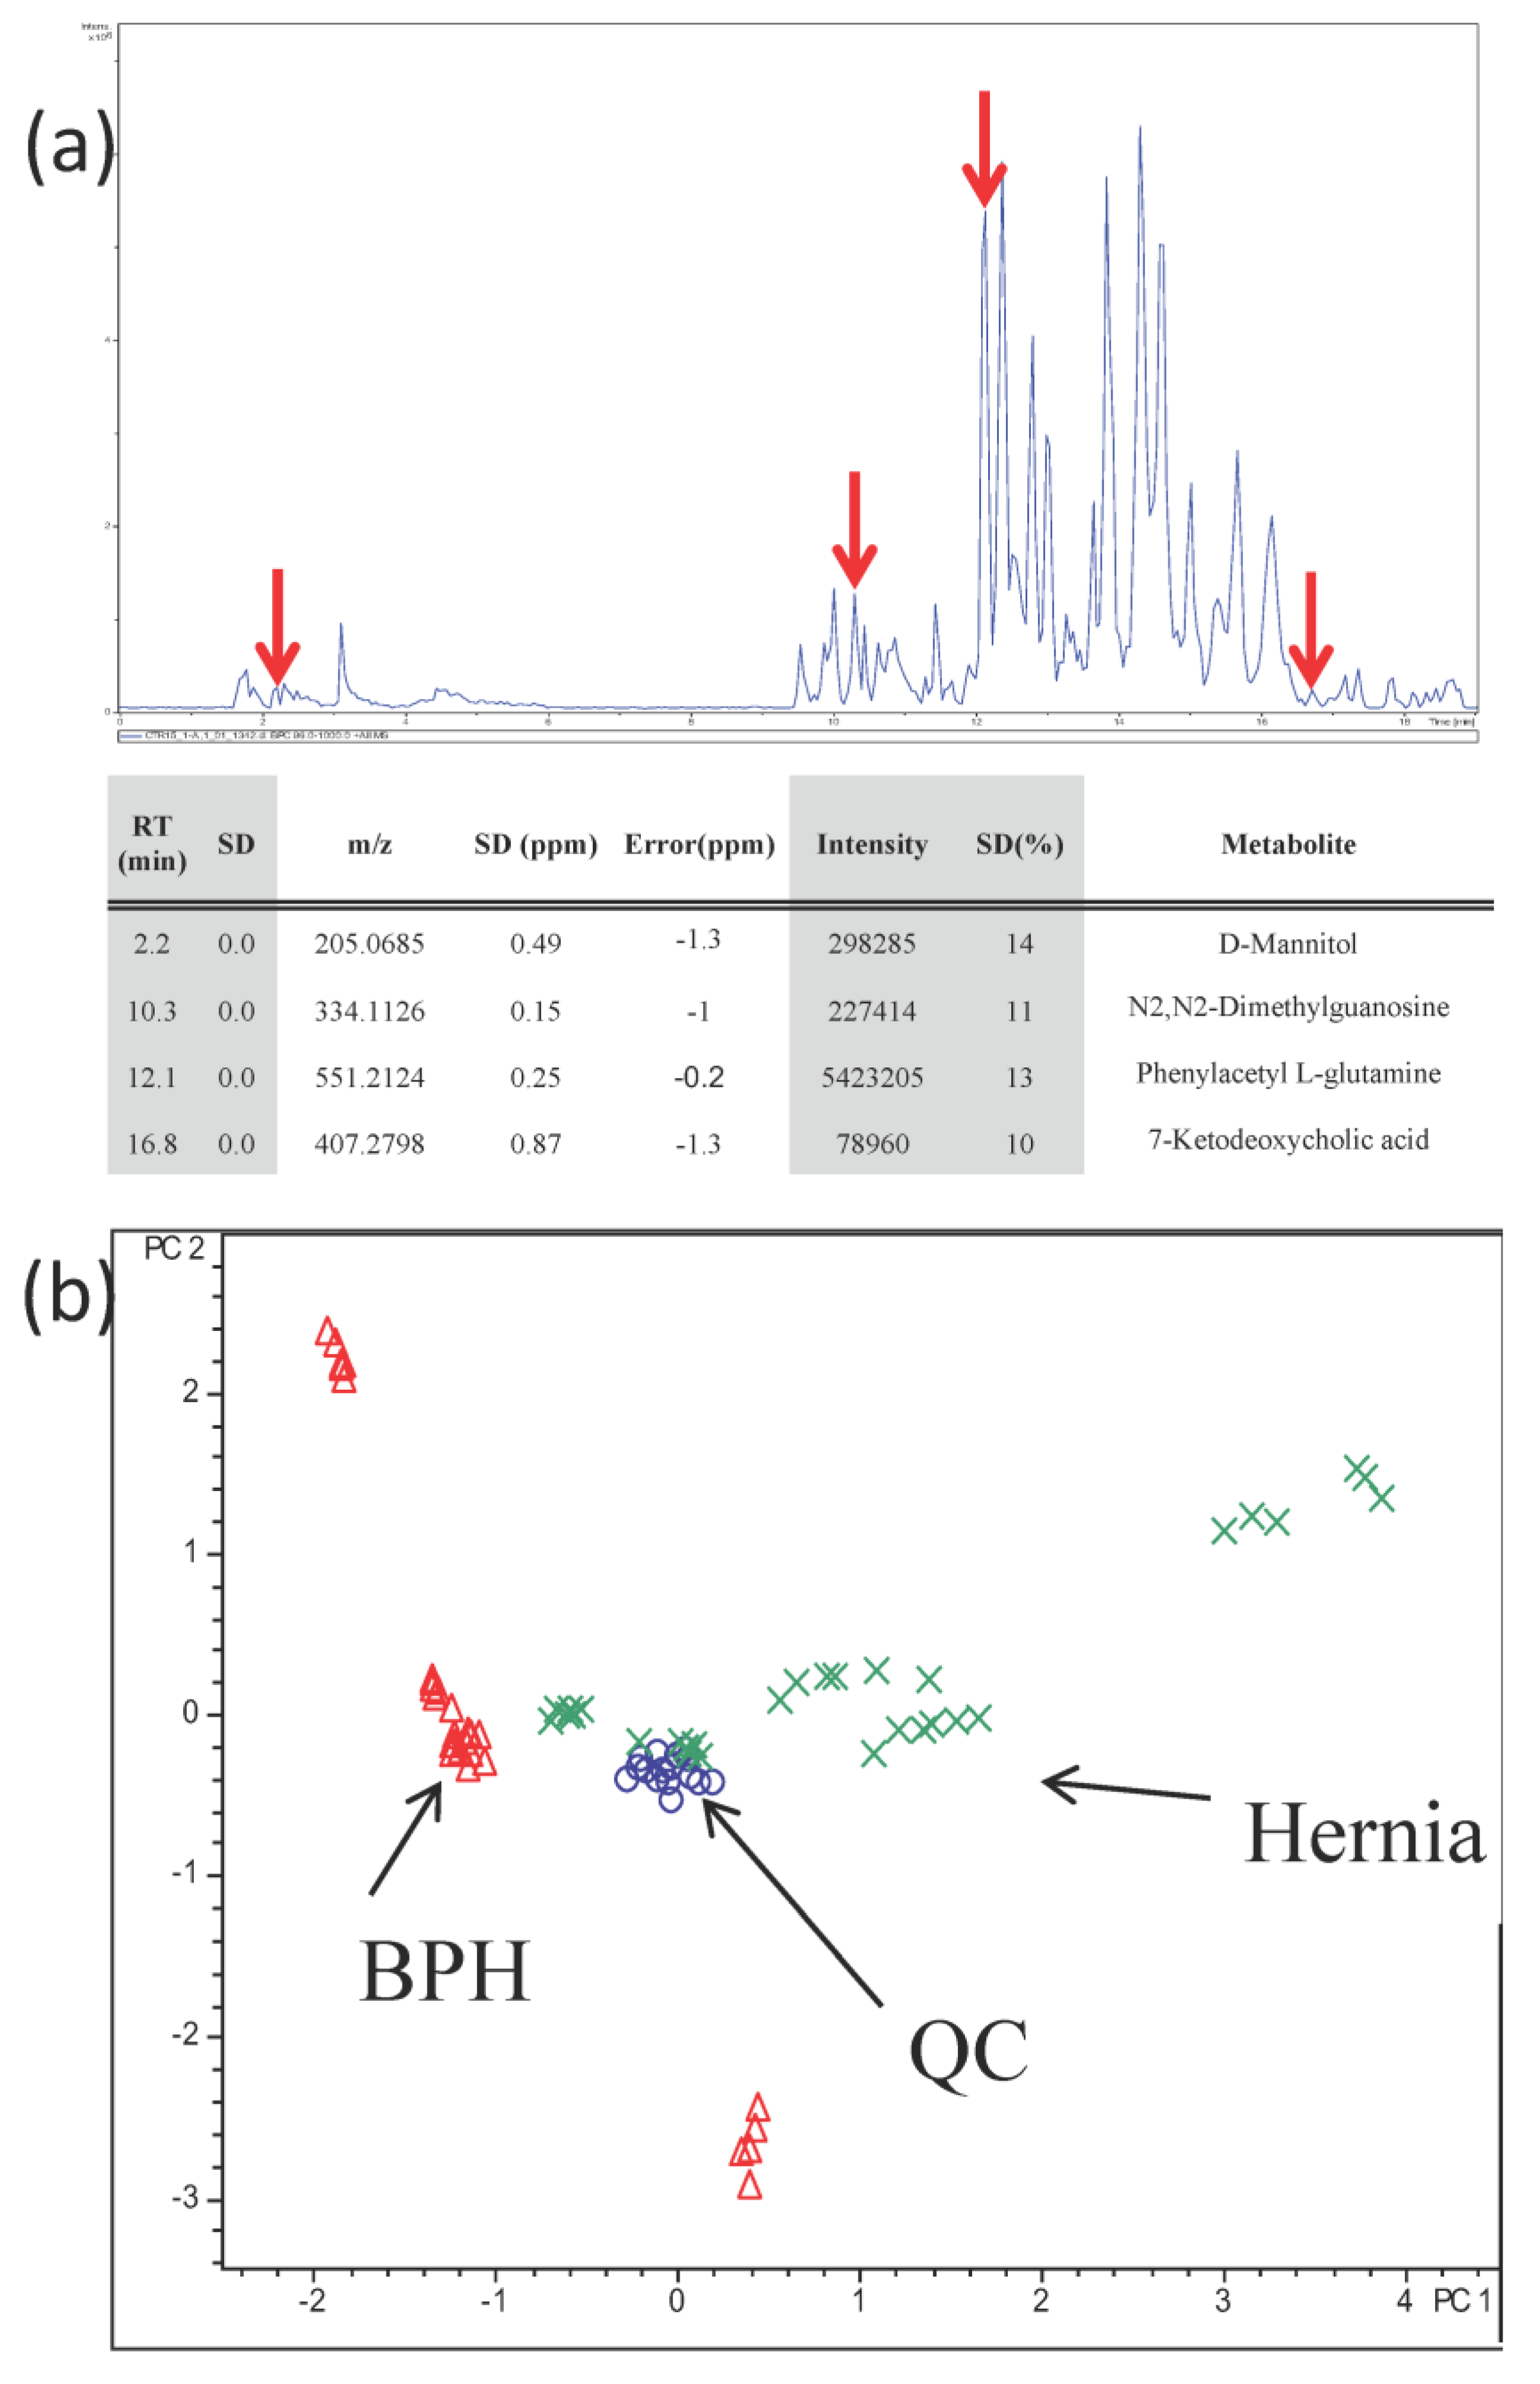
3.3. Analysis of Urine Samples from BPH and Hernia Patients
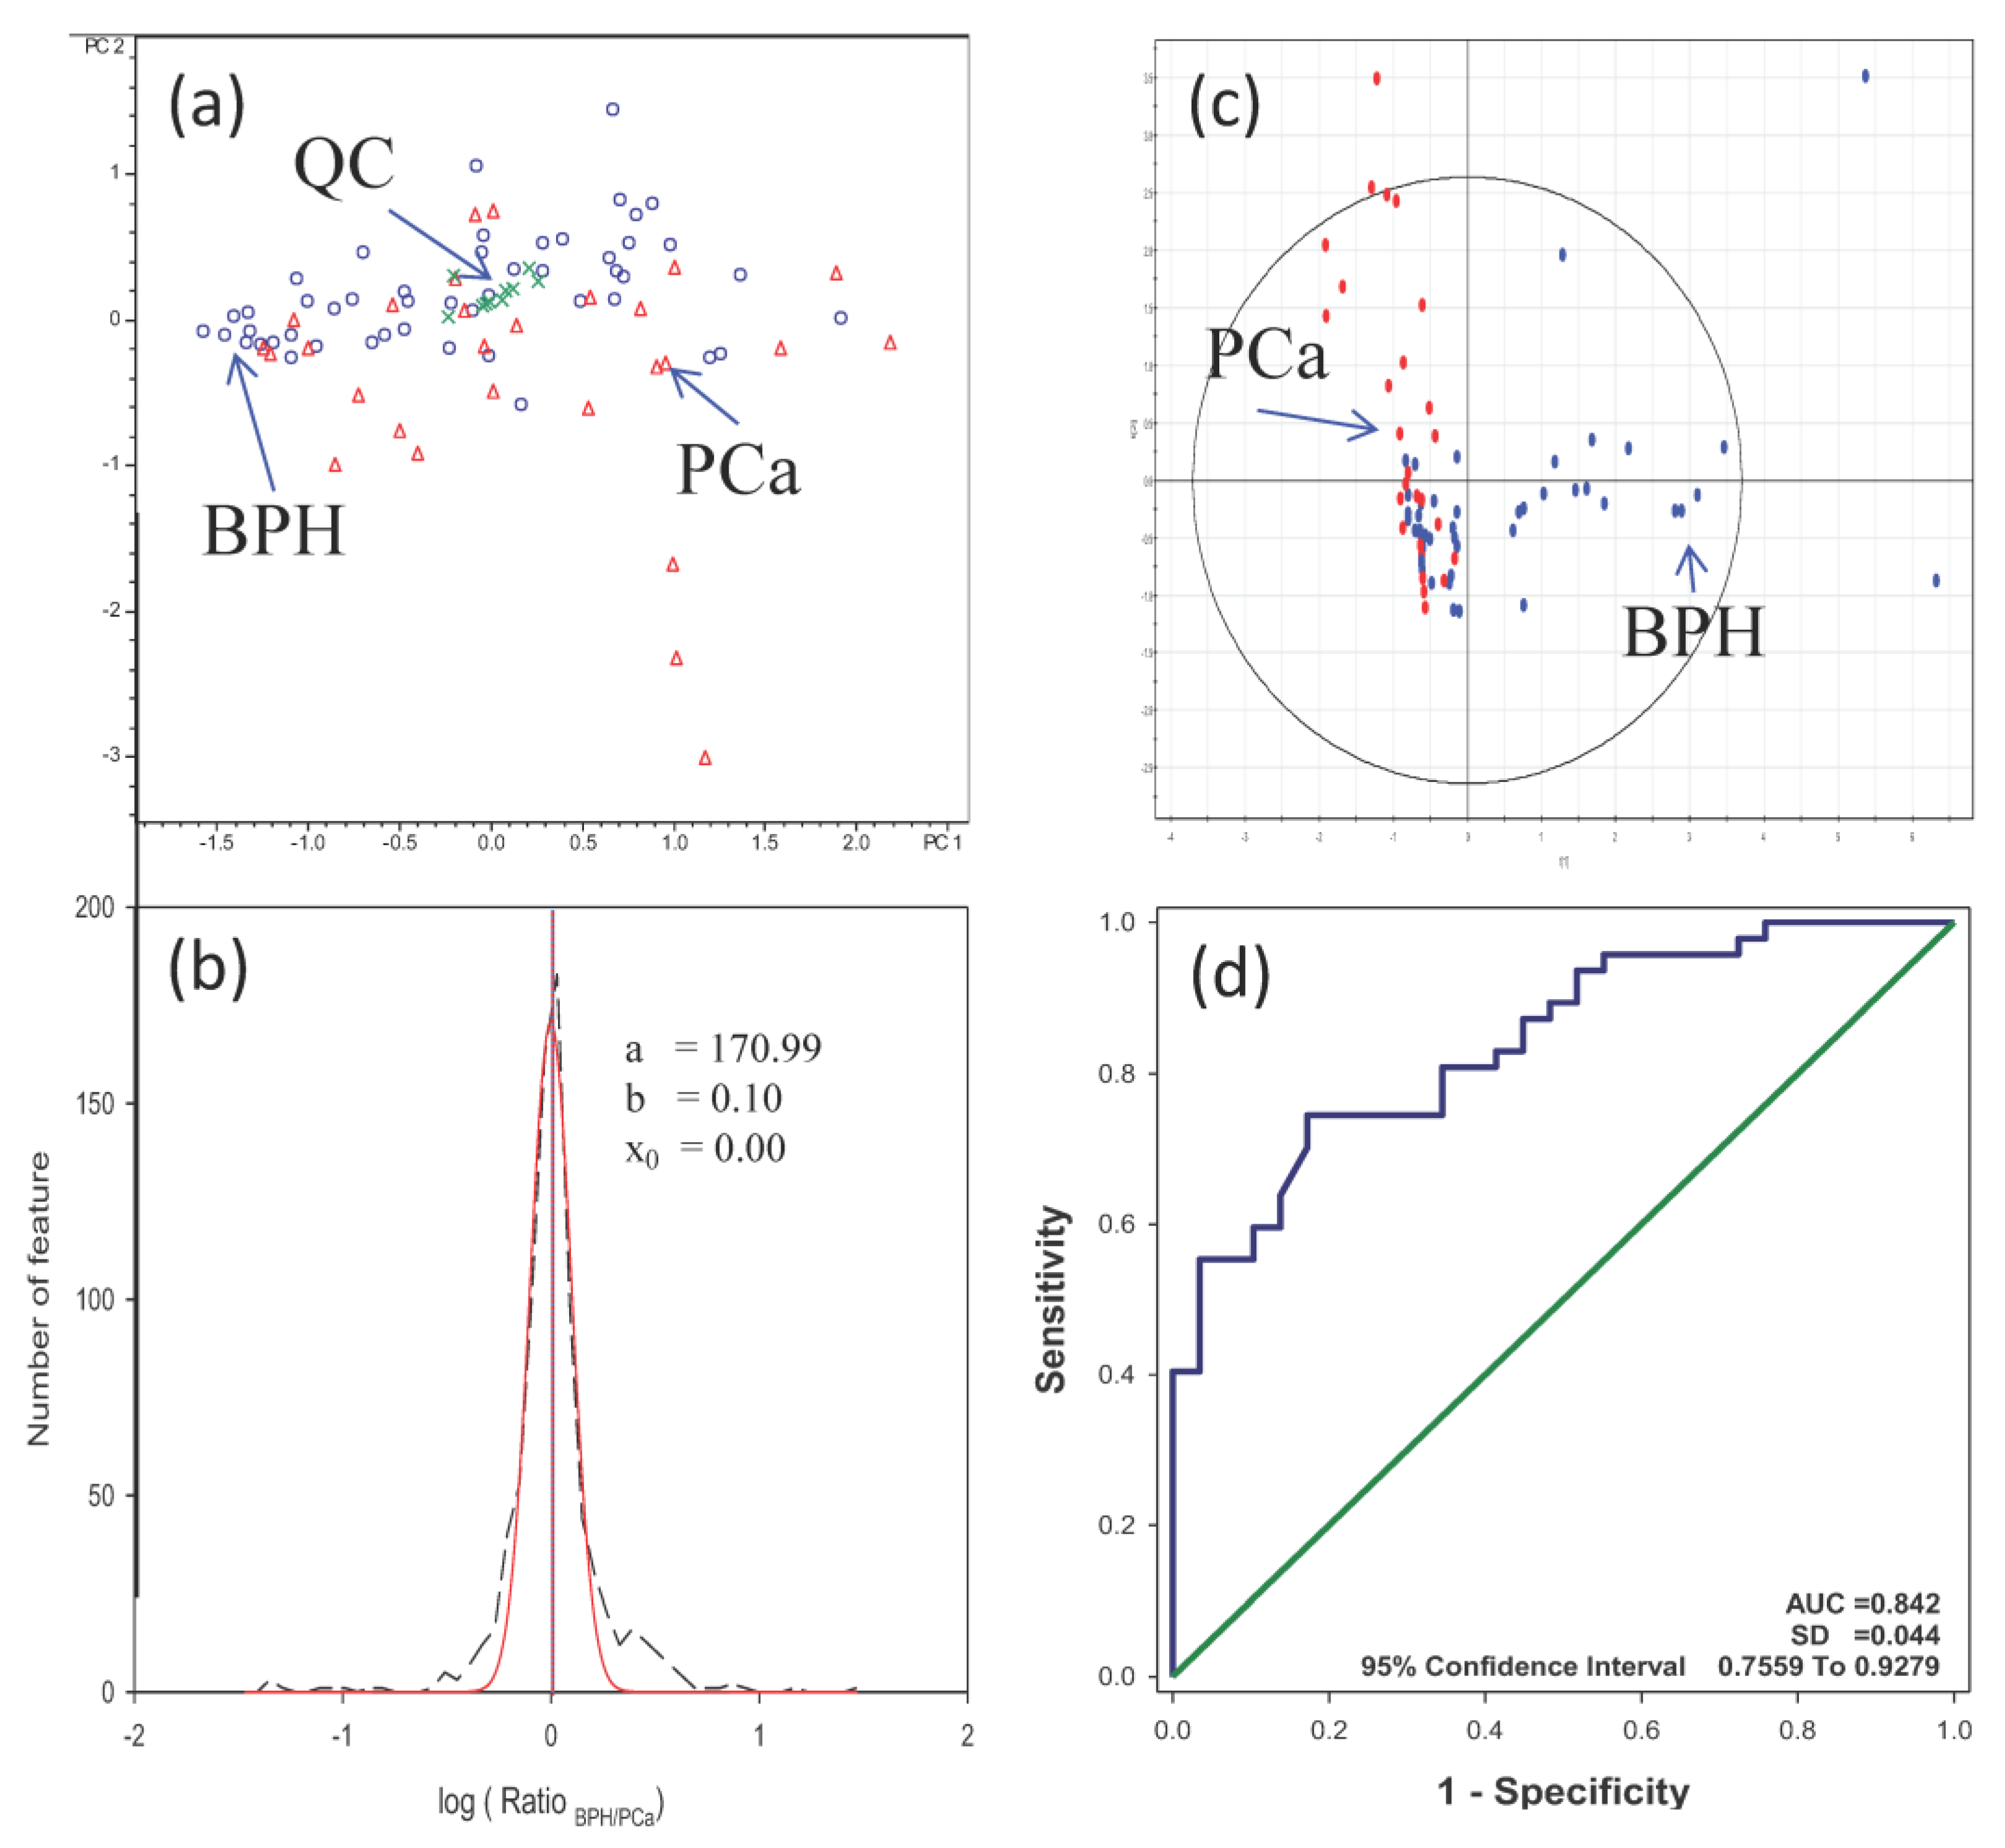
3.4. Analysis of Urine Samples from PCa and BPH Patients
3.5. Clinical Narratives
4. Conclusions
Supplementary Materials
Author Contributions
Funding
Institutional Review Board Statement
Informed Consent Statement
Data Availability Statement
Conflicts of Interest
Abbreviations
| AUC | Area Under Curve |
| BPH | Benign Prostatic Hyperplasia |
| CID | Collision-Induced Dissociation |
| ESI | Electrospray Ionization |
| FTMS | Fourier Transform Mass Spectrometry |
| FWHM | Full Width at Half Maximum |
| Her | Hernia |
| HMDB | The Human Metabolome Database |
| LC-MS | Liquid Chromatography-Mass Spectrometry |
| METLIN | The METLIN Metabolite and Chemical Entity Database (https://metlin.scripps.edu/landing_page.php?pgcontent=mainPage (accessed on 29 May 2023)) |
| MSn | Mass Spectrometry in n (n = 2~3) rounds |
| NMR | Nuclear Magnetic Resonance |
| PCA | Principal Component Analysis |
| PCa | Prostate Cancer |
| QC | Quality Control |
| Q-Tof Quadruple Time-of-flight | |
| ROC curve | Receiver Operating Characteristic curve |
| UPLC | Ultra-Performance Liquid Chromatography |
References
- Sung, H.; Ferlay, J.; Siegel, R.L.; Laversanne, M.; Soerjomataram, I.; Jemal, A.; Bray, F. Global Cancer Statistics 2020: GLOBOCAN Estimates of Incidence and Mortality Worldwide for 36 Cancers in 185 Countries. CA Cancer J. Clin. 2021, 71, 209–249. [Google Scholar] [CrossRef]
- Siegel, R.L.; Miller, K.D.; Fuchs, H.E.; Jemal, A. Cancer statistics, 2022. CA Cancer J. Clin. 2022, 72, 7–33. [Google Scholar] [CrossRef] [PubMed]
- De Nunzio, C.; Aronson, W.; Freedland, S.J.; Giovannucci, E.; Parsons, J.K. The correlation between metabolic syndrome and prostatic diseases. Eur. Urol. 2012, 61, 560–570. [Google Scholar] [CrossRef] [PubMed]
- Takyi, E.E.; Fuller, D.J.; Donaldson, L.J.; Thomas, G.H. Deoxyribonucleic acid and polyamine synthesis in rat ventral prostrate. Effects of age of the intact rat and androgen stimulation of the castrated rat with testosterone, 5 alpha-dihydrotestosterone and 5 alpha-androstane-3 beta, 17 beta-diol. Biochem. J. 1977, 162, 87–97. [Google Scholar] [CrossRef]
- Schick, F.; Bogers, H.; Kurz, S.; Jung, W.I.; Pfeffer, M.; Lutz, O. Localized proton MR spectroscopy of citrate in vitro and of the human prostate in vivo at 1.5 T. Magn. Reson. Med. 1993, 29, 38–43. [Google Scholar] [CrossRef] [PubMed]
- Stenman, U.H.; Leinonen, J.; Zhang, W.M.; Finne, P. Prostate-specific antigen. Semin. Cancer Biol. 1999, 9, 83–93. [Google Scholar] [CrossRef]
- Trock, B.J. Application of metabolomics to prostate cancer. Urol. Oncol. 2011, 29, 572–581. [Google Scholar] [CrossRef] [PubMed] [Green Version]
- Truong, M.; Yang, B.; Jarrard, D.F. Toward the detection of prostate cancer in urine: A critical analysis. J. Urol. 2013, 189, 422–429. [Google Scholar] [CrossRef] [PubMed] [Green Version]
- Sreekumar, A.; Poisson, L.M.; Rajendiran, T.M.; Khan, A.P.; Cao, Q.; Yu, J.; Laxman, B.; Mehra, R.; Lonigro, R.J.; Li, Y.; et al. Metabolomic profiles delineate potential role for sarcosine in prostate cancer progression. Nature 2009, 457, 910–914. [Google Scholar] [CrossRef] [Green Version]
- DeFeo, E.M.; Wu, C.L.; McDougal, W.S.; Cheng, L.L. A decade in prostate cancer: From NMR to metabolomics. Nat. Rev. Urol. 2011, 8, 301–311. [Google Scholar] [CrossRef]
- Huang, Z.; Lin, L.; Gao, Y.; Chen, Y.; Yan, X.; Xing, J.; Hang, W. Bladder cancer determination via two urinary metabolites: A biomarker pattern approach. Mol. Cell. Proteom. 2011, 10, M111.007922. [Google Scholar] [CrossRef] [PubMed] [Green Version]
- Hyndman, M.E.; Mullins, J.K.; Bivalacqua, T.J. Metabolomics and bladder cancer. Urol. Oncol. 2011, 29, 558–561. [Google Scholar] [CrossRef] [PubMed]
- Ganti, S.; Weiss, R.H. Urine metabolomics for kidney cancer detection and biomarker discovery. Urol. Oncol. 2011, 29, 551–557. [Google Scholar] [CrossRef] [PubMed] [Green Version]
- Weiss, R.H.; Kim, K. Metabolomics in the study of kidney diseases. Nat. Rev. Nephrol. 2011, 8, 22–33. [Google Scholar] [CrossRef]
- Serkova, N.J.; Spratlin, J.L.; Eckhardt, S.G. NMR-based metabolomics: Translational application and treatment of cancer. Curr. Opin. Mol. Ther. 2007, 9, 572–585. [Google Scholar]
- Ryan, D.; Robards, K.; Prenzler, P.D.; Kendall, M. Recent and potential developments in the analysis of urine: A review. Anal. Chim. Acta 2011, 684, 8–20. [Google Scholar] [CrossRef]
- Theodoridis, G.A.; Gika, H.G.; Want, E.J.; Wilson, I.D. Liquid chromatography-mass spectrometry based global metabolite profiling: A review. Anal. Chim. Acta 2012, 711, 7–16. [Google Scholar] [CrossRef]
- Xiao, J.F.; Zhou, B.; Ressom, H.W. Metabolite identification and quantitation in LC-MS/MS-based metabolomics. Trends Anal. Chem. 2012, 32, 1–14. [Google Scholar] [CrossRef] [Green Version]
- Halket, J.M.; Waterman, D.; Przyborowska, A.M.; Patel, R.K.; Fraser, P.D.; Bramley, P.M. Chemical derivatization and mass spectral libraries in metabolic profiling by GC/MS and LC/MS/MS. J. Exp. Bot. 2005, 56, 219–243. [Google Scholar] [CrossRef] [Green Version]
- Mazzeo, J.R.; Neue, U.D.; Kele, M.; Plumb, R.S. Advancing LC Performance with Smaller Particles and Higher Pressure. Anal. Chem. 2005, 77, 460–467. [Google Scholar] [CrossRef] [Green Version]
- Wu, N.; Clausen, A.M. Fundamental and practical aspects of ultrahigh pressure liquid chromatography for fast separations. J. Sep. Sci. 2007, 30, 1167–1182. [Google Scholar] [CrossRef]
- Lenz, E.M.; Williams, R.E.; Sidaway, J.; Smith, B.W.; Plumb, R.S.; Johnson, K.A.; Rainville, P.; Shockcor, J.; Stumpf, C.L.; Granger, J.H.; et al. The application of microbore UPLC/oa-TOF-MS and 1H NMR spectroscopy to the metabonomic analysis of rat urine following the intravenous administration of pravastatin. J. Pharm. Biomed. Anal. 2007, 44, 845–852. [Google Scholar] [CrossRef] [PubMed]
- Plumb, R.; Castro-Perez, J.; Granger, J.; Beattie, I.; Joncour, K.; Wright, A. Ultra-performance liquid chromatography coupled to quadrupole-orthogonal time-of-flight mass spectrometry. Rapid Commun. Mass Spectrom. 2004, 18, 2331–2337. [Google Scholar] [CrossRef] [PubMed]
- Kind, T.; Fiehn, O. Advances in structure elucidation of small molecules using mass spectrometry. Bioanal. Rev. 2010, 2, 23–60. [Google Scholar] [CrossRef] [PubMed] [Green Version]
- Juo, C.G.; Chiu, D.T.; Shiao, M.S. Liquid chromatography-mass spectrometry in metabolite profiling. Biofactors 2008, 34, 159–169. [Google Scholar] [CrossRef] [PubMed]
- Sumner, L.W.; Amberg, A.; Barrett, D.; Beale, M.H.; Beger, R.; Daykin, C.A.; Fan, T.W.; Fiehn, O.; Goodacre, R.; Griffin, J.L.; et al. Proposed minimum reporting standards for chemical analysis Chemical Analysis Working Group (CAWG) Metabolomics Standards Initiative (MSI). Metabolomics 2007, 3, 211–221. [Google Scholar] [CrossRef] [PubMed] [Green Version]
- Shao, C.H.; Chen, C.L.; Lin, J.Y.; Chen, C.J.; Fu, S.H.; Chen, Y.T.; Chang, Y.S.; Yu, J.S.; Tsui, K.H.; Juo, C.G.; et al. Metabolite marker discovery for the detection of bladder cancer by comparative metabolomics. Oncotarget 2017, 8, 38802–38810. [Google Scholar] [CrossRef] [Green Version]
- Keller, B.O.; Sui, J.; Young, A.B.; Whittal, R.M. Interferences and contaminants encountered in modern mass spectrometry. Anal. Chim. Acta 2008, 627, 71–81. [Google Scholar] [CrossRef] [PubMed]
- Jonscher, K.R.; Yates, J.R., 3rd. The quadrupole ion trap mass spectrometer--a small solution to a big challenge. Anal. Biochem. 1997, 244, 1–15. [Google Scholar] [CrossRef] [PubMed]
- Juo, C.G.; Chen, C.L.; Lin, S.T.; Fu, S.H.; Chen, Y.T.; Chang, Y.S.; Yu, J.S. Mass accuracy improvement of reversed-phase liquid chromatography/electrospray ionization mass spectrometry based urinary metabolomic analysis by post-run calibration using sodium formate cluster ions. Rapid Commun. Mass Spectrom. 2014, 28, 1813–1820. [Google Scholar] [CrossRef]
- Want, E.J.; Wilson, I.D.; Gika, H.; Theodoridis, G.; Plumb, R.S.; Shockcor, J.; Holmes, E.; Nicholson, J.K. Global metabolic profiling procedures for urine using UPLC-MS. Nat. Protoc. 2010, 5, 1005–1018. [Google Scholar] [CrossRef] [PubMed]
- Smith, C.A.; O’Maille, G.; Want, E.J.; Qin, C.; Trauger, S.A.; Brandon, T.R.; Custodio, D.E.; Abagyan, R.; Siuzdak, G. METLIN: A metabolite mass spectral database. Ther. Drug Monit. 2005, 27, 747–751. [Google Scholar] [CrossRef] [PubMed]
- Wishart, D.S.; Knox, C.; Guo, A.C.; Eisner, R.; Young, N.; Gautam, B.; Hau, D.D.; Psychogios, N.; Dong, E.; Bouatra, S.; et al. HMDB: A knowledgebase for the human metabolome. Nucleic Acids Res. 2009, 37, D603–D610. [Google Scholar] [CrossRef]
- Wishart, D.S.; Tzur, D.; Knox, C.; Eisner, R.; Guo, A.C.; Young, N.; Cheng, D.; Jewell, K.; Arndt, D.; Sawhney, S.; et al. HMDB: The Human Metabolome Database. Nucleic Acids Res. 2007, 35, D521–D526. [Google Scholar] [CrossRef]
- Xie, G.; Plumb, R.; Su, M.; Xu, Z.; Zhao, A.; Qiu, M.; Long, X.; Liu, Z.; Jia, W. Ultra-performance LC/TOF MS analysis of medicinal Panax herbs for metabolomic research. J. Sep. Sci. 2008, 31, 1015–1026. [Google Scholar] [CrossRef] [PubMed]
- Savitzky, A.; Golay, M.J.E. Smoothing and Differentiation of Data by Simplified Least Squares Procedures. Anal. Chem. 1964, 36, 1627–1639. [Google Scholar] [CrossRef]
- Kanaan, Y.; Copeland, R.L. The link between vitamin D and prostate cancer. Nat. Rev. Cancer 2022, 22, 435. [Google Scholar] [CrossRef]
- Slominski, A.T.; Janjetovic, Z.; Fuller, B.E.; Zmijewski, M.A.; Tuckey, R.C.; Nguyen, M.N.; Sweatman, T.; Li, W.; Zjawiony, J.; Miller, D.; et al. Products of vitamin D3 or 7-dehydrocholesterol metabolism by cytochrome P450scc show anti-leukemia effects, having low or absent calcemic activity. PLoS ONE 2010, 5, e9907. [Google Scholar] [CrossRef]


| # | RT (min) | Exact Mass | Adduct Ion | Error (ppm) | Metlin ID | HMDB ID | Name | a Spectrum |
|---|---|---|---|---|---|---|---|---|
| 1 | 15.4 | 315.2365 | [M + H ]+ | 14.9 | x | HMDB13121 | 7-Dehydropregnenolone | 1 |
| 2 | 11.7 | 318.1915 | [M + CAN + H]+ | 3.1 | 66,195 | x | p-Coumaroylagmatine | 2 |
| 3 | 10.7 | 207.1107 185.1286 | [M + CAN + Na] + [M + CAN + H]+ | −1.2 0.9 | 6589 | x | 1-Aminocyclohexanecarboxylic acid | 3 4 |
| 4 | 13.1 | 344.2436 | [M + NH4]+ | −1.6 | 36,202 | x | 2,3-dinor-11b-PGF2α | 5 |
| 5 | 1.9 | 441.2987 | [M + Na]+ | 2.8 | 41,996 41,998 | x x | (24R)-1α,24-dihydroxy-22-oxacholecalciferol (24S)-1α,24-dihydroxy-22-oxacholecalciferol | 6 |
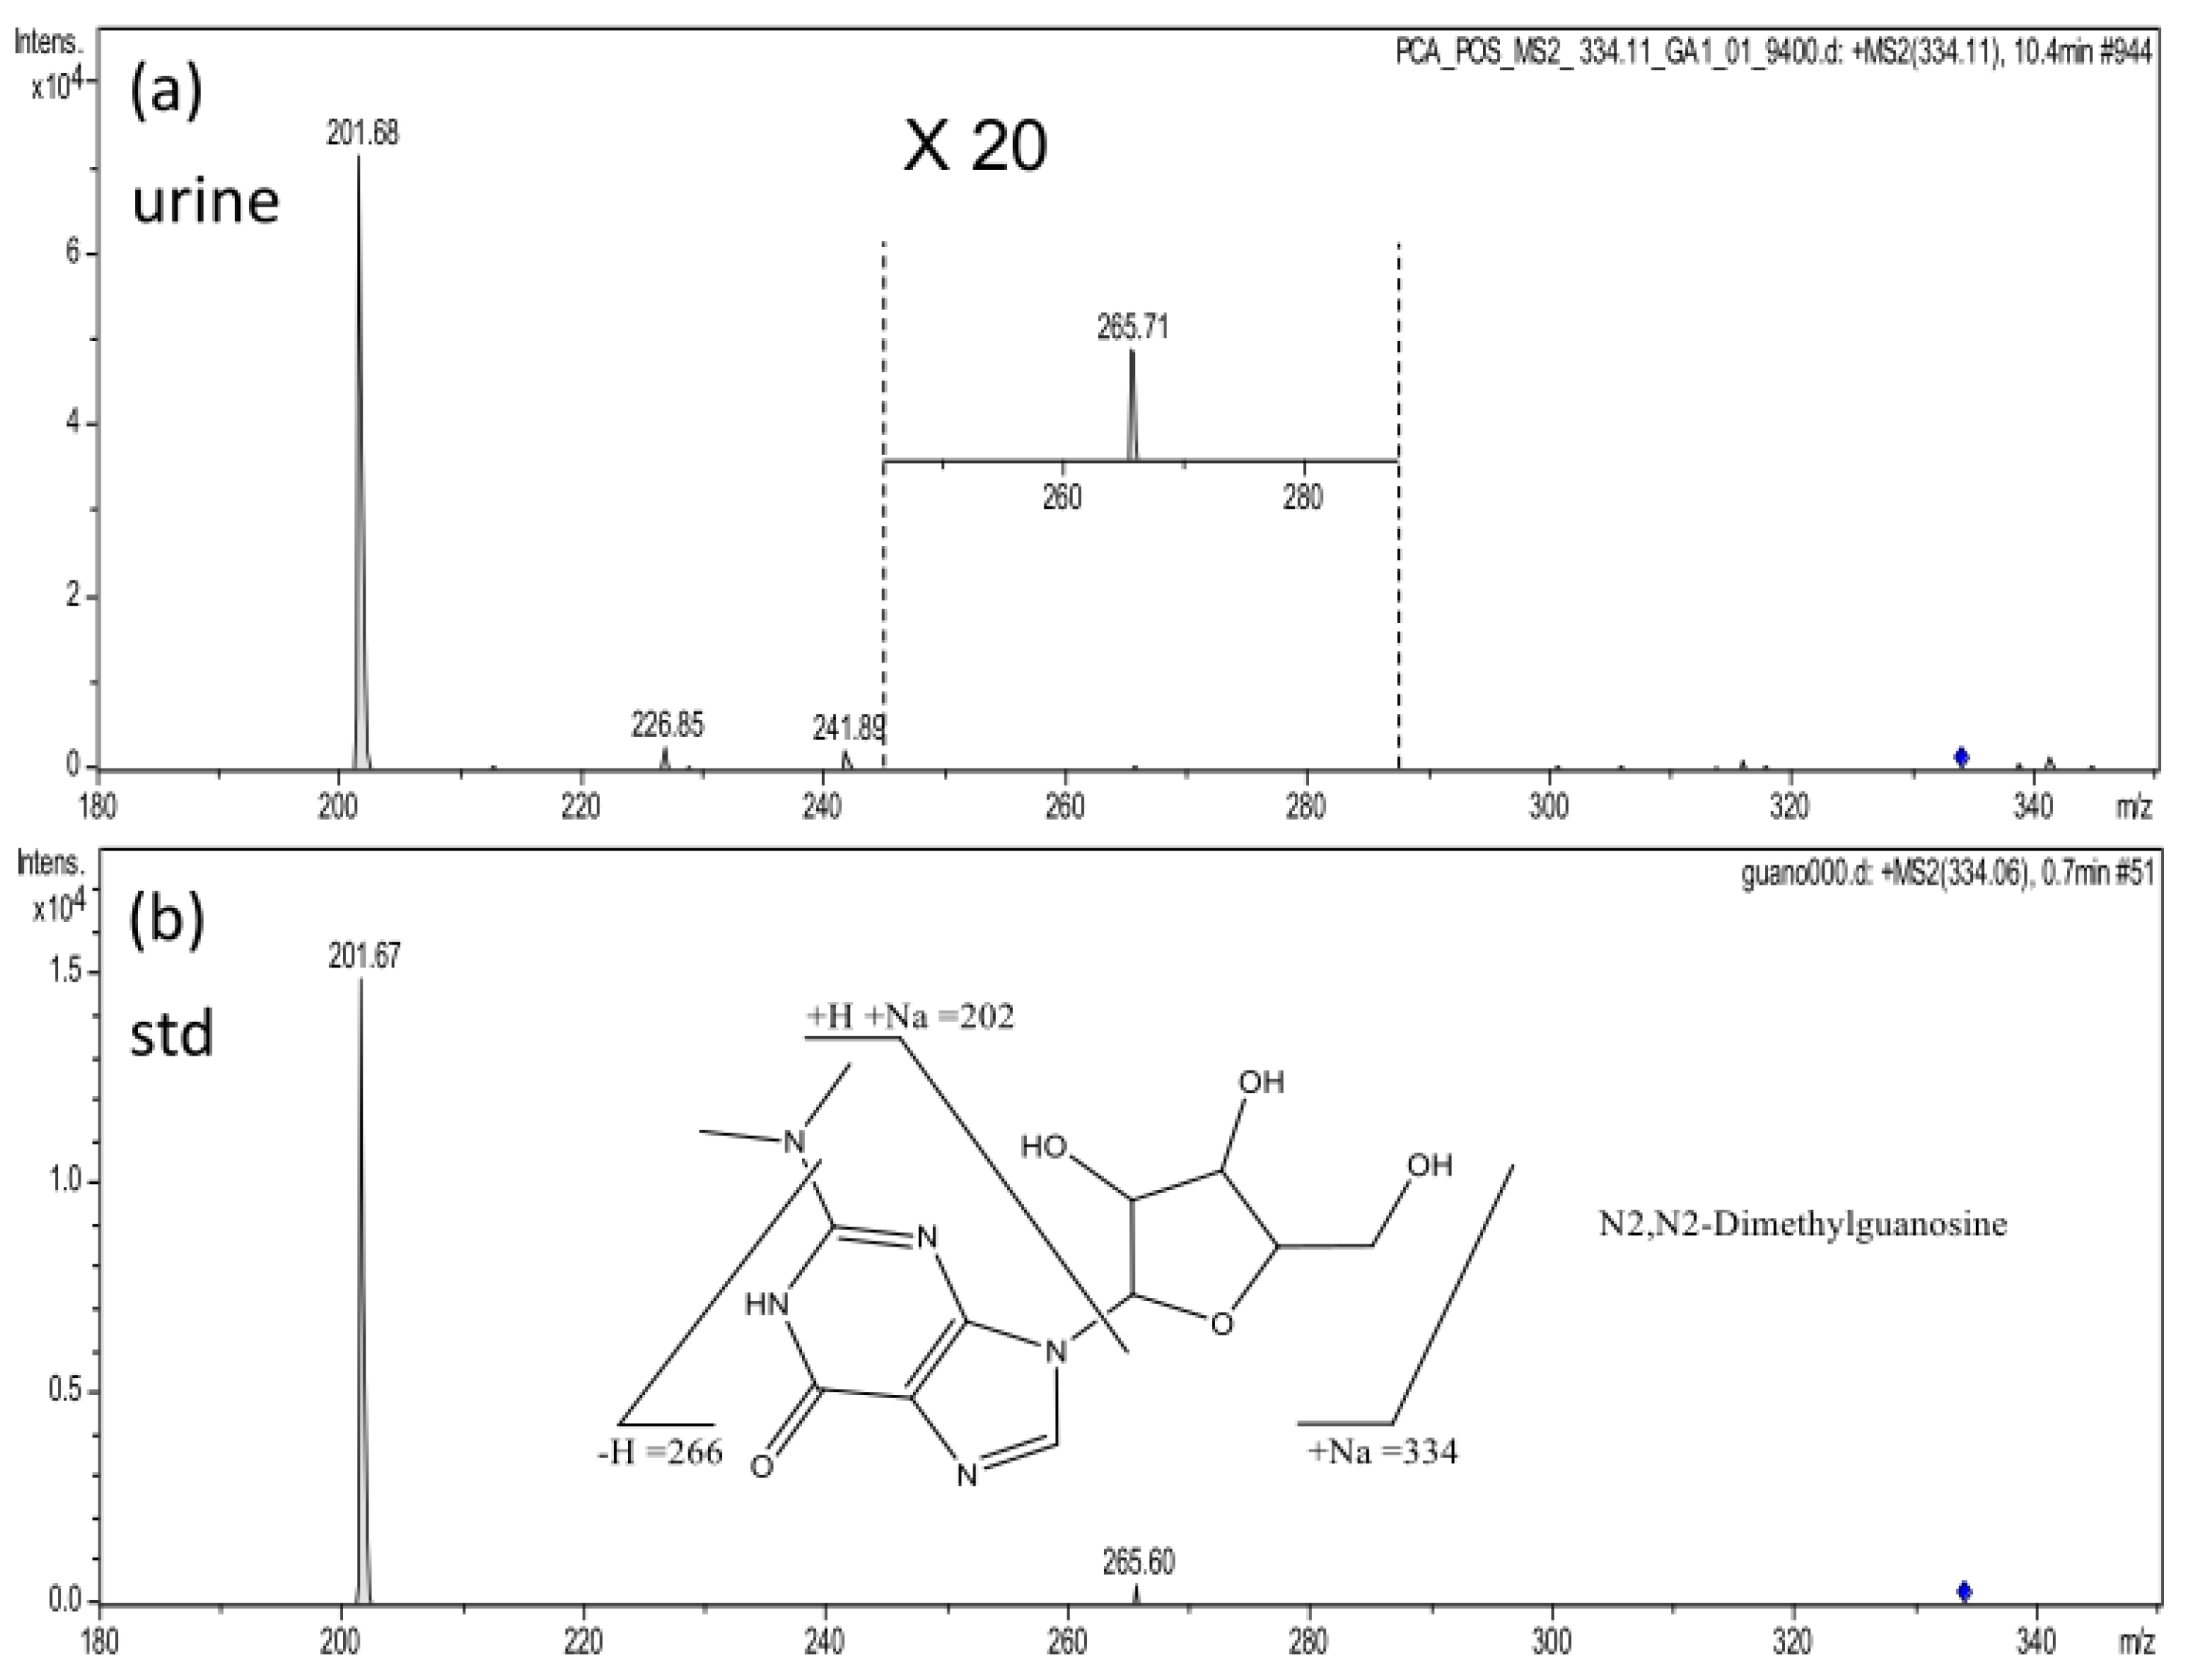
| 6 | 10.4 | 334.1135 | [M + Na]+ | 3.8 | 7086 | HMDB04824 | N2,N2-Dimethylguanosine | 7 |
| 7 | 12.5 | 187.0225 | [M + Na]+ | 0.7 | 44,770 | x | Lumazine | 8 |
| 8 | 14.9 | 679.4108 | [M + 2ACN + H ]+ | 4.8 | 58,221 | HMDB04157 | L-Urobilinogen | 9 |
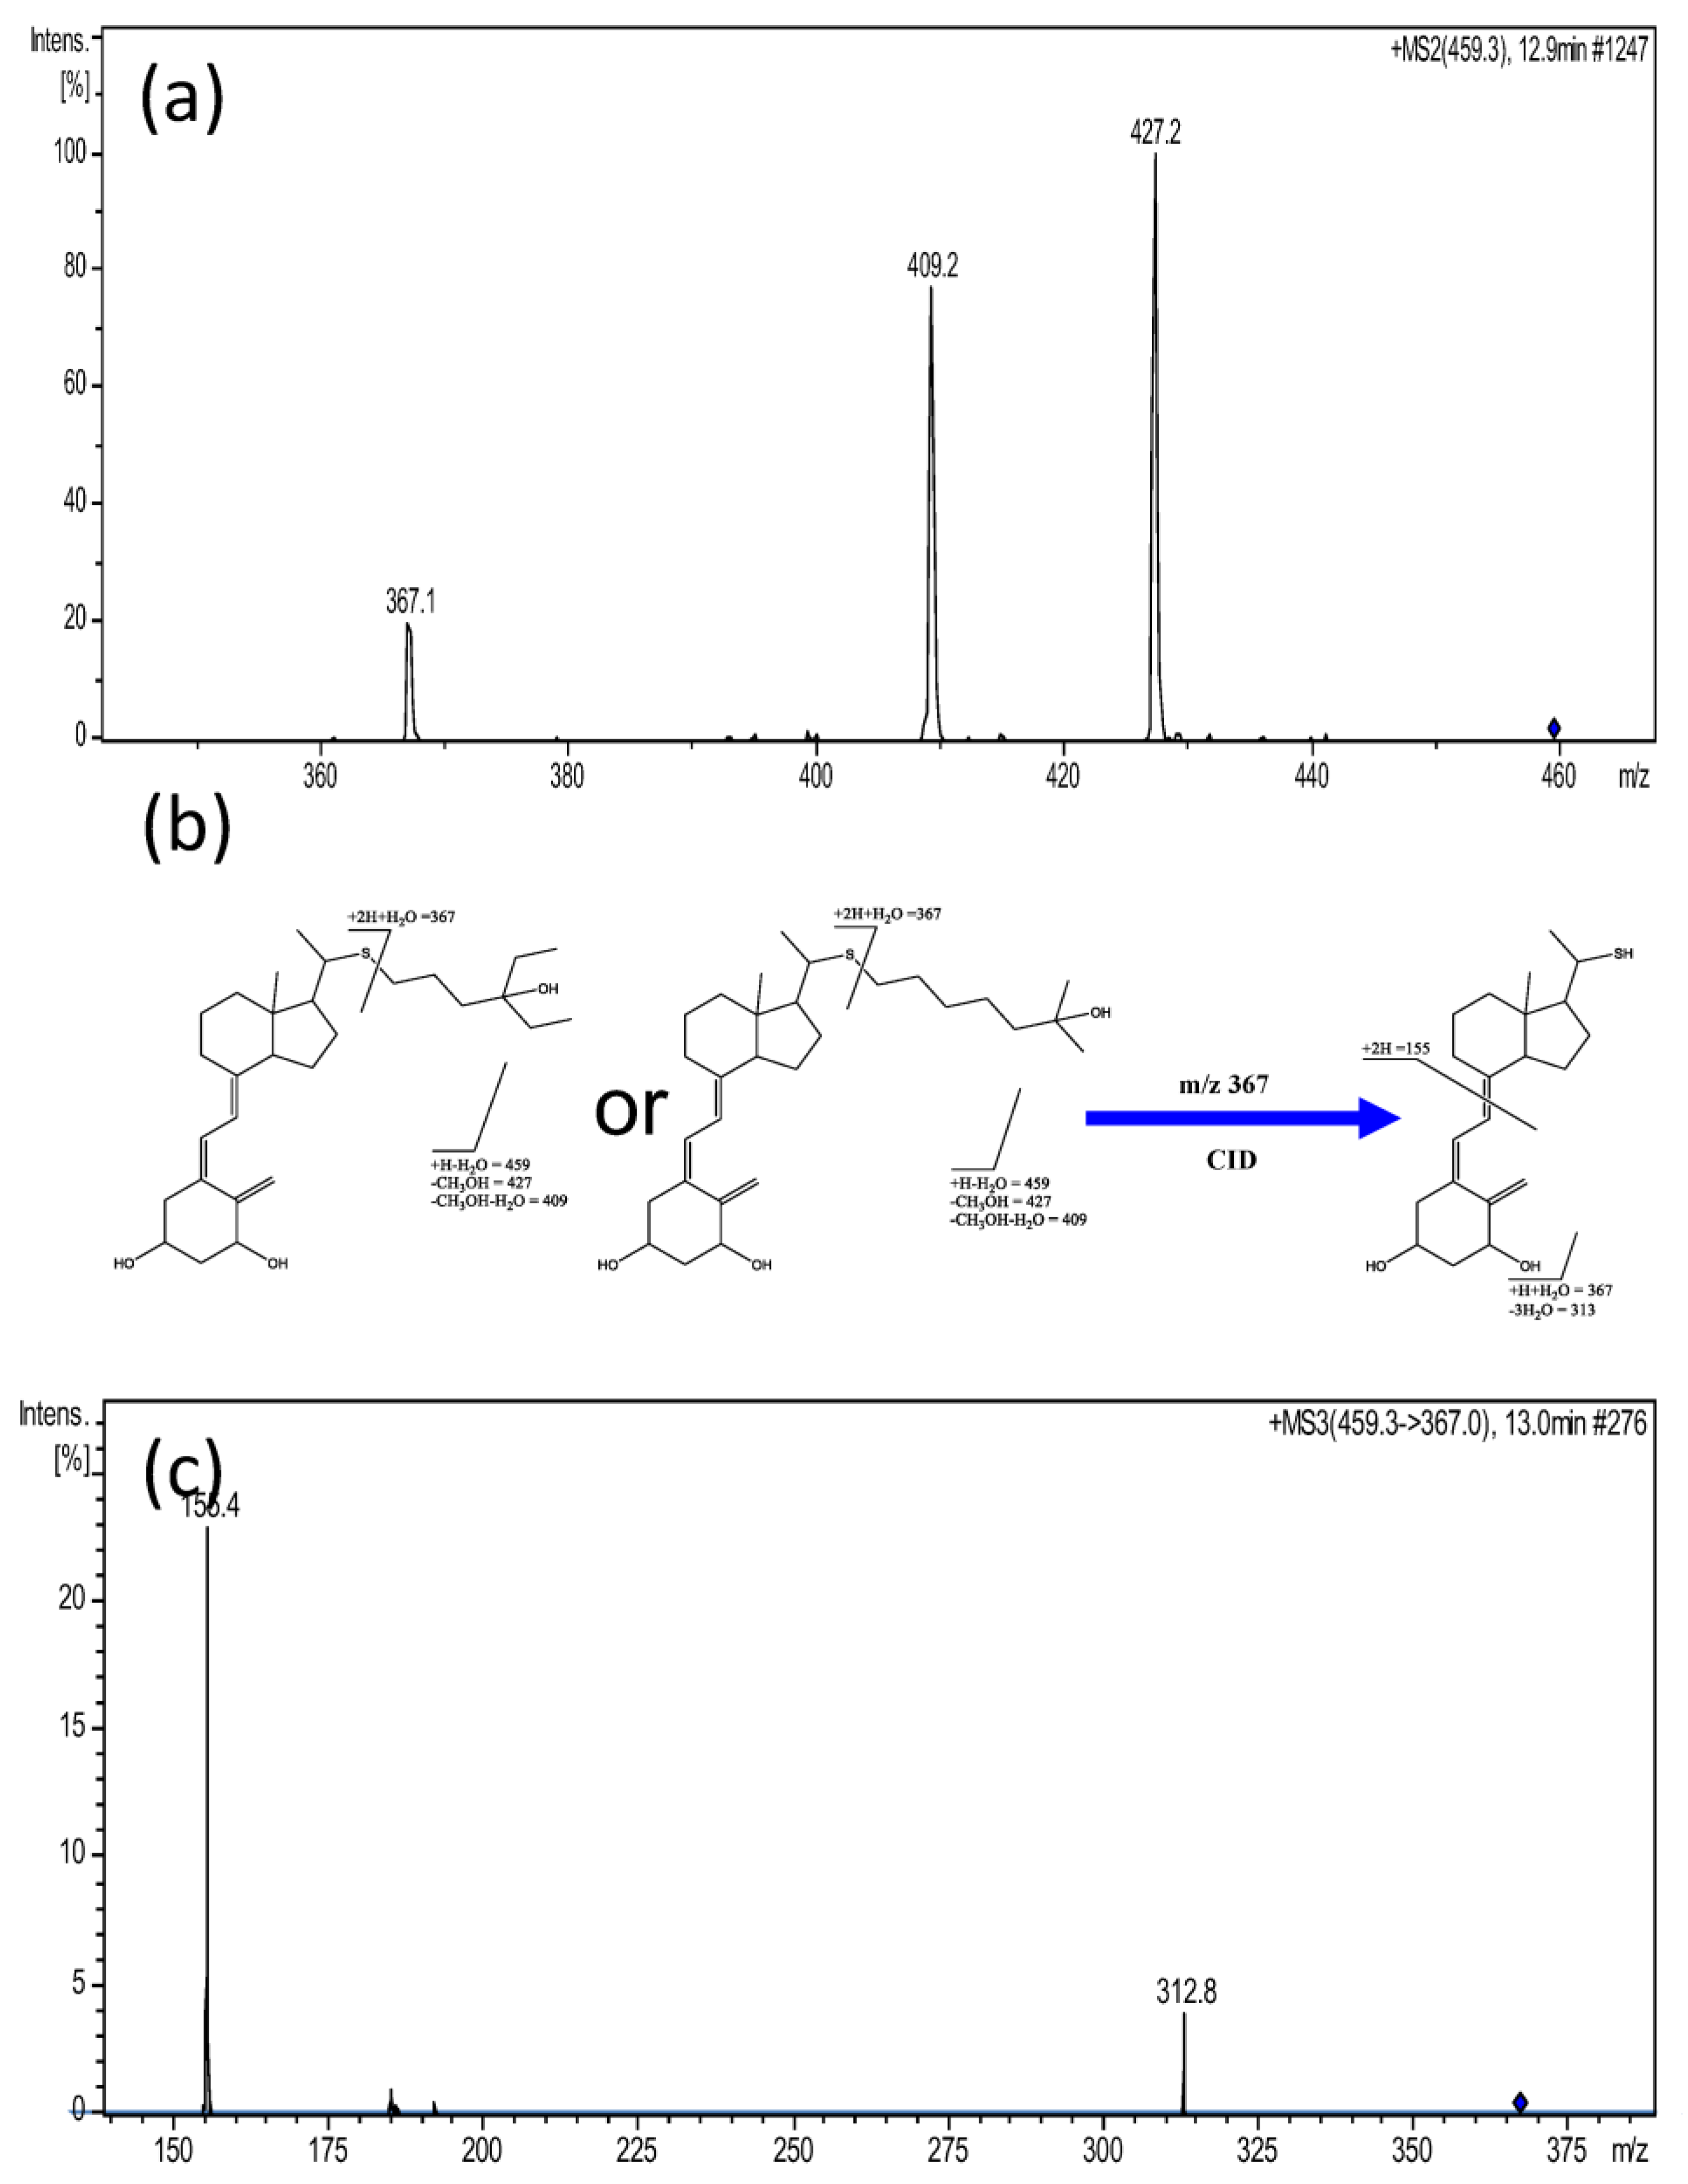
| 9 | 12.7 | 459.3336 | [M + H − H2O]+ | −1.3 | 42,352 42,353 42,354 42,355 | x x x x | 1α,25-dihydroxy-24a-homo-26,27-dimethyl-22-thiacholecalciferol 1α,25-dihydroxy-26,27-dimethyl-24a-homo-22-thia-20-epicholecalciferol 1α,25-dihydroxy-24a,24b,24c-trihomo-22-thiacholecalciferol 1α,25-dihydroxy-24a,24b,24c-trihomo-22-thia-20-epicholecalciferol | 10 |
| 10 | 12.5 | 227.0599 | [M + Na]+ | 16.9 | 23,907 | x | Ala Asp | 11 |
| # | Name | Ratio (BPH/PCa) | p | ROC Curve | ||
|---|---|---|---|---|---|---|
| AUC | SD | 95% CI | ||||
| 1 | 7-Dehydropregnenolone | 0.52 | 0.0207 | 0.685 | 0.067 | 0.5526 To 0.8171 |
| 2 | p-Coumaroylagmatine | 0.62 | 0.0662 | 0.677 | 0.065 | 0.5488 To 0.8042 |
| 3 | 1-Aminocyclohexanecarboxylic acid | 0.66 | 0.00773 | 0.719 | 0.066 | 0.5902 To 0.8482 |
| 4 | 2,3-dinor-11b-PGF2α | 0.74 | 0.12147 | 0.671 | 0.066 | 0.5413 To 0.8011 |
| 5 | (24R)-1α,24-dihydroxy-22-oxacholecalciferol (24S)-1α,24-dihydroxy-22-oxacholecalciferol | 0.76 | 0.00337 | 0.692 | 0.066 | 0.5636 To 0.8212 |
| 6 | N2,N2-Dimethylguanosine | 0.77 | 0.03143 | 0.697 | 0.067 | 0.5657 To 0.8281 |
| 7 | Lumazine | 1.54 | 0.05592 | 0.652 | 0.068 | 0.5186 To 0.7852 |
| 8 | L-Urobilinogen | 2.53 | 0.00006 | 0.716 | 0.057 | 0.6034 To 0.8282 |
| 9 | 1α,25-dihydroxy-24a-homo-26,27-dimethyl-22-thiacholecalciferol 1α,25-dihydroxy-26,27-dimethyl-24a-homo-22-thia-20-epicholecalciferol 1α,25-dihydroxy-24a,24b,24c-trihomo-22-thiacholecalciferol1α,25-dihydroxy-24a,24b,24c-trihomo-22-thia-20-epicholecalciferol | 2.9 | 0.00983 | 0.658 | 0.061 | 0.5373 To 0.7779 |
| 10 | Ala Asp | 3.96 | 0.02371 | 0.697 | 0.059 | 0.5810 To 0.8121 |
Disclaimer/Publisher’s Note: The statements, opinions and data contained in all publications are solely those of the individual author(s) and contributor(s) and not of MDPI and/or the editor(s). MDPI and/or the editor(s) disclaim responsibility for any injury to people or property resulting from any ideas, methods, instructions or products referred to in the content. |
© 2023 by the authors. Licensee MDPI, Basel, Switzerland. This article is an open access article distributed under the terms and conditions of the Creative Commons Attribution (CC BY) license (https://creativecommons.org/licenses/by/4.0/).
Share and Cite
Chen, C.-L.; Chen, Y.-T.; Liao, W.-Y.; Chang, Y.-S.; Yu, J.-S.; Juo, B.-R. Urinary Metabolomic Analysis of Prostate Cancer by UPLC-FTMS and UPLC-Ion Trap MSn. Diagnostics 2023, 13, 2270. https://0-doi-org.brum.beds.ac.uk/10.3390/diagnostics13132270
Chen C-L, Chen Y-T, Liao W-Y, Chang Y-S, Yu J-S, Juo B-R. Urinary Metabolomic Analysis of Prostate Cancer by UPLC-FTMS and UPLC-Ion Trap MSn. Diagnostics. 2023; 13(13):2270. https://0-doi-org.brum.beds.ac.uk/10.3390/diagnostics13132270
Chicago/Turabian StyleChen, Chien-Lun, Yi-Ting Chen, Wen-Yu Liao, Yu-Sun Chang, Jau-Song Yu, and Bao-Rong Juo. 2023. "Urinary Metabolomic Analysis of Prostate Cancer by UPLC-FTMS and UPLC-Ion Trap MSn" Diagnostics 13, no. 13: 2270. https://0-doi-org.brum.beds.ac.uk/10.3390/diagnostics13132270