
RT-LAMP Multicenter Study for SARS-CoV-2 Genome Molecular Detection in Brazilian Swab and Saliva Samples
 , , ,
, , ,
Abstract
:1. Introduction
2. Materials and Methods
2.1. Samples Description
2.1.1. Naso- and Oropharyngeal Swab Samples
2.1.2. Saliva Samples
2.2. Ethical Approval
2.3. Viral RNA Extraction
2.4. SARS-CoV-2 TaqMan RT-qPCR Assay
2.5. Swab and Saliva RT-LAMP Assay
2.6. SARS-CoV-2 Whole-Genome Genotyping from Swab Samples
2.7. Data Analysis
3. Results
3.1. Molecular Assays for Nasopharyngeal Swabs and Saliva Samples
3.2. Comparison between Swab Collection Period and RT-LAMP Results
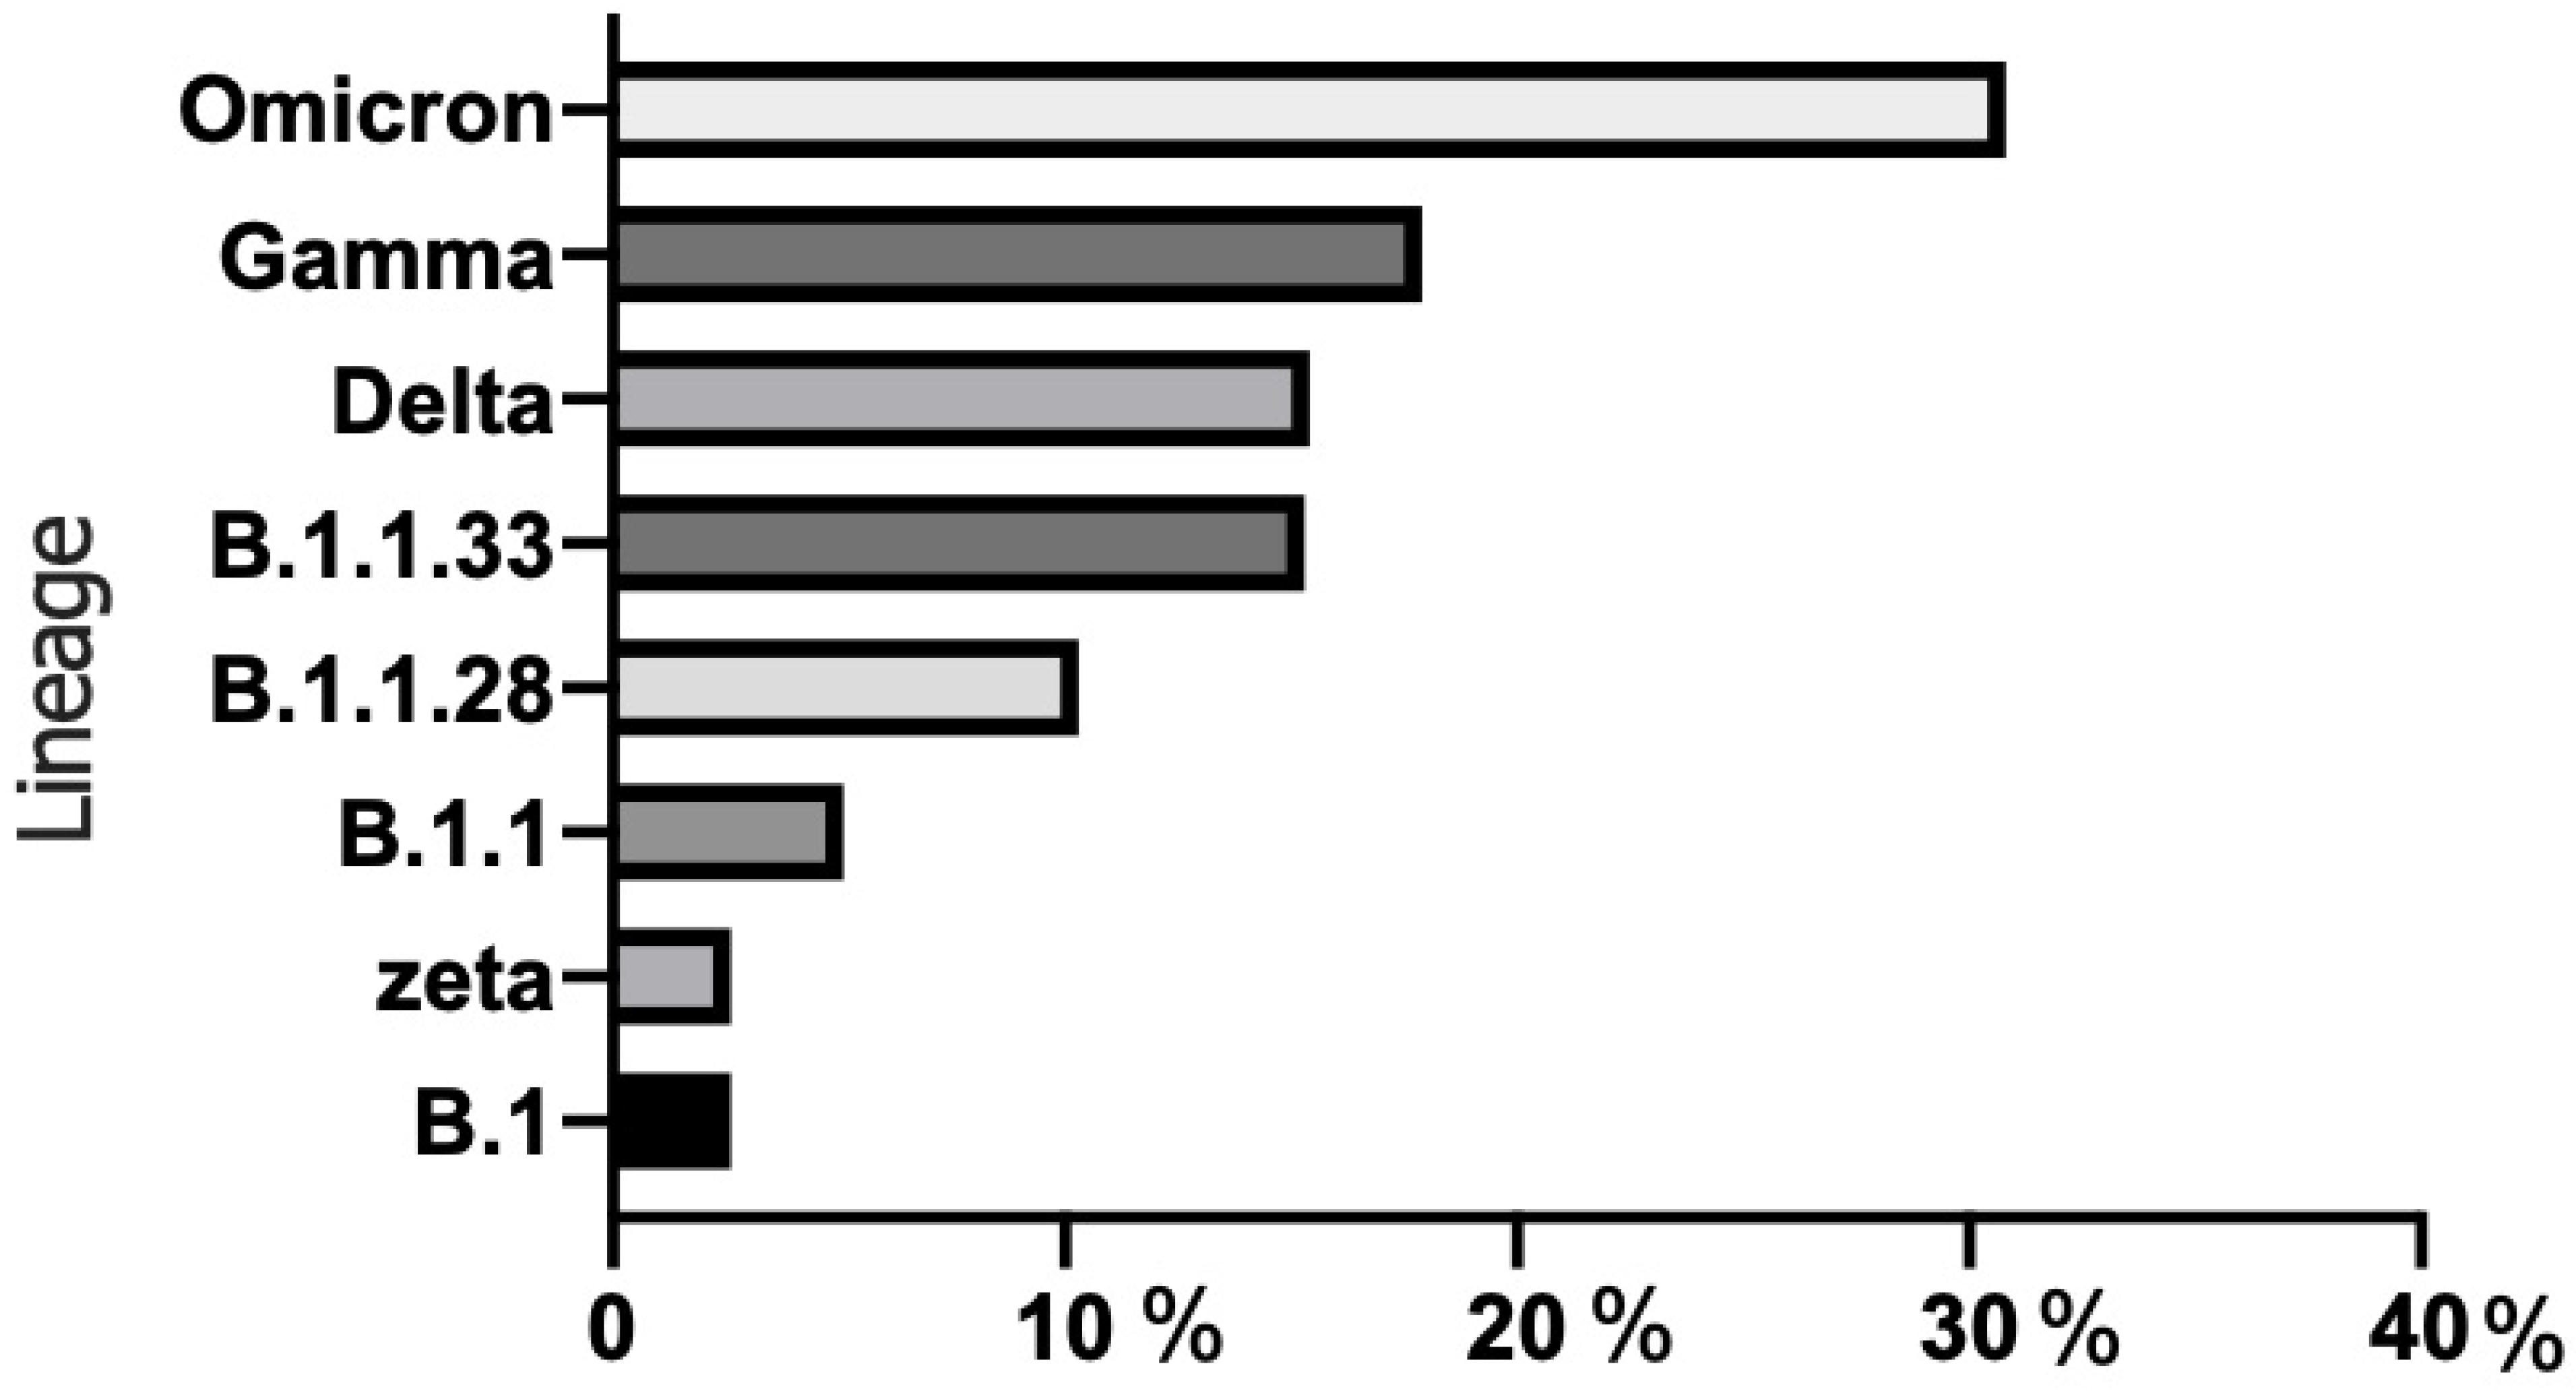
3.3. SARS-CoV-2 Genotyping via MinION
3.4. Data Analysis
4. Discussion
5. Conclusions
Author Contributions
Funding
Institutional Review Board Statement
Informed Consent Statement
Data Availability Statement
Acknowledgments
Conflicts of Interest
References
- Zhu, N.; Zhang, D.; Wang, W.; Li, X.; Yang, B.; Song, J.; Zhao, X.; Huang, B.; Shi, W.; Lu, R.; et al. A Novel Coronavirus from Patients with Pneumonia in China, 2019. N. Engl. J. Med. 2020, 382, 727–733. [Google Scholar] [CrossRef] [PubMed]
- Wang, C.; Horby, P.W.; Hayden, F.G.; Gao, G.F. A novel coronavirus outbreak of global health concern. Lancet 2020, 395, 470–473. [Google Scholar] [CrossRef] [PubMed] [Green Version]
- World Health Organization. Coronavirus (COVID-19) Dashboard. Available online: https://covid19.who.int/ (accessed on 16 September 2022).
- Wang, Y.; Kang, H.; Liu, X.; Tong, Z. Combination of RT-qPCR testing and clinical features for diagnosis of COVID-19 facilitates management of SARS-CoV-2 outbreak. J. Med. Virol. 2020, 92, 538–539. [Google Scholar] [CrossRef] [Green Version]
- Khurshid, Z.; Asiri, F.Y.I.; Al Wadaani, H. Human Saliva: Non-Invasive Fluid for Detecting Novel Coronavirus (2019-nCoV). Int. J. Environ. Res. Public Health 2020, 17, 2225. [Google Scholar] [CrossRef] [PubMed] [Green Version]
- Xu, R.; Cui, B.; Duan, X.; Zhang, P.; Zhou, X.; Yuan, Q. Saliva: Potential diagnostic value and transmission of 2019-nCoV. Int. J. Oral Sci. 2020, 12, 11. [Google Scholar] [CrossRef]
- Thompson, R.N.; Cunniffe, N.J. The probability of detection of SARS-CoV-2 in saliva. Stat. Methods Med. Res. 2020, 29, 1049–1050. [Google Scholar] [CrossRef] [PubMed]
- CDC. Coronavirus Disease 2019 (COVID-19) Testing. 2020. Available online: https://www.cdc.gov/coronavirus/2019-ncov/testing/diagnostic-testing.html. (accessed on 4 August 2022).
- Pilarowski, G.; Lebel, P.; Sunshine, S.; Liu, J.; Crawford, E.; Marquez, C.; Rubio, L.; Chamie, G.; Martinez, J.; Peng, J.; et al. Performance Characteristics of a Rapid Severe Acute Respiratory Syndrome Coronavirus 2 Antigen Detection Assay at a Public Plaza Testing Site in San Francisco. J. Infect. Dis. 2021, 223, 1139–1144. [Google Scholar] [CrossRef]
- Thommes, L.; Burkert, F.R.; Öttl, K.W.; Goldin, D.; Loacker, L.; Lanser, L.; Griesmacher, A.; Theurl, I.; Weiss, G.; Bellmann-Weiler, R. Comparative evaluation of four SARS-CoV-2 antigen tests in hospitalized patients. Int. J. Infect. Dis. 2021, 105, 144–146. [Google Scholar] [CrossRef]
- Brihn, A.; Chang, J.; OYong, K.; Balter, S.; Terashita, D.; Rubin, Z.; Yeganeh, N. Diagnostic Performance of an Antigen Test with RT-PCR for the Detection of SARS-CoV-2 in a Hospital Setting—Los Angeles County, California, June–August 2020. MMWR Morb. Mortal. Wkly. Rep. 2021, 70, 702–706. [Google Scholar] [CrossRef]
- Bullard, J.; Dust, K.; Funk, D.; Strong, J.E.; Alexander, D.; Garnett, L.; Boodman, C.; Bello, A.; Hedley, A.; Schiffman, Z.; et al. Predicting Infectious Severe Acute Respiratory Syndrome Coronavirus 2 From Diagnostic Samples. Clin. Infect. Dis. 2020, 71, 2663–2666. [Google Scholar] [CrossRef]
- Notomi, T.; Okayama, H.; Masubuchi, H.; Yonekawa, T.; Watanabe, K.; Amino, N.; Hase, T. Loop-mediated isothermal amplification of DNA. Nucleic Acids Res. 2000, 28, E63. [Google Scholar] [CrossRef] [PubMed] [Green Version]
- Sahoo, P.R.; Sethy, K.; Mohapatra, S.; Panda, D. Loop mediated isothermal amplification: An innovative gene amplification technique for animal diseases. Vet. World 2016, 9, 465–469. [Google Scholar] [CrossRef] [Green Version]
- Kitagawa, Y.; Orihara, Y.; Kawamura, R.; Imai, K.; Sakai, J.; Tarumoto, N. Evaluation of rapid diagnosis of novel coronavirus disease (COVID-19) using loop-mediated isothermal amplification. J. Clin. Virol. 2020, 129, 104446. [Google Scholar] [CrossRef] [PubMed]
- Janíková, M.; Hodosy, J.; Boor, P.; Klempa, B.; Celec, P. Loop-mediated isothermal amplification for the detection of SARS-CoV-2 in saliva. Microb. Biotechnol. 2021, 14, 307–316. [Google Scholar] [CrossRef] [PubMed]
- Howson, E.L.A.; Kidd, S.P.; Armson, B.; Goring, A.; Sawyer, J.; Cassar, C.; Cross, D.; Lewis, T.; Hockey, J.; Rivers, S.; et al. Preliminary optimisation of a simplified sample preparation method to permit direct detection of SARS-CoV-2 within saliva samples using reverse-transcription loop-mediated isothermal amplification (RT-LAMP). J. Virol. Methods 2021, 289, 114048. [Google Scholar] [CrossRef]
- CDC. Research Use Only 2019-Novel Coronavirus (2019-nCoV) Real-time RT-PCR Primers and Probes. 2020. Available online: https://www.cdc.gov/coronavirus/2019-ncov/lab/rt-pcr-panel-primer-probes (accessed on 21 August 2022).
- Corman, V.M.; Landt, O.; Kaiser, M.; Molenkamp, R.; Meijer, A.; Chu, D.K.; Bleicker, T.; Brünink, S.; Schneider, J.; Schmidt, M.L.; et al. Detection of 2019 novel coronavirus (2019-nCoV) by real-time RT-PCR. Eurosurveillance 2020, 25, 2000045. [Google Scholar] [CrossRef] [Green Version]
- Lamb, L.E.; Bartolone, S.N.; Ward, E.; Chancellor, M.B. Rapid detection of novel coronavirus/Severe Acute Respiratory Syndrome Coronavirus 2 (SARS-CoV-2) by reverse transcription-loop-mediated isothermal amplification. PLoS ONE 2020, 15, e0234682. [Google Scholar] [CrossRef]
- Feng, W.; Newbigging, A.M.; Le, C.; Pang, B.; Peng, H.; Cao, Y.; Wu, J.; Abbas, G.; Song, J.; Wang, D.-B.; et al. Molecular Diagnosis of COVID-19: Challenges and Research Needs. Anal. Chem. 2020, 92, 10196–10209. [Google Scholar] [CrossRef] [PubMed]
- Lalli, M.A.; Langmade, J.S.; Chen, X.; Fronick, C.C.; Sawyer, C.S.; Burcea, L.C.; Wilkinson, M.N.; Fulton, R.S.; Heinz, M.; Buchser, W.J.; et al. Rapid and Extraction-Free Detection of SARS-CoV-2 from Saliva by Colorimetric Reverse-Transcription Loop-Mediated Isothermal Amplification. Clin. Chem. 2021, 67, 415–424. [Google Scholar] [CrossRef]
- Iqbal, B.N.; Arunasalam, S.; Divarathna, M.V.M.; Jabeer, A.; Sirisena, P.; Senaratne, T.; Muthugala, R.; Noordeen, F. Diagnostic utility and validation of a newly developed real time loop mediated isothermal amplification method for the detection of SARS CoV-2 infection. J. Clin. Virol. Plus 2022, 2, 100081. [Google Scholar] [CrossRef]
- Lu, S.; Duplat, D.; Benitez-Bolivar, P.; León, C.; Villota, S.D.; Veloz-Villavicencio, E.; Arévalo, V.; Jaenes, K.; Guo, Y.; Cicek, S.; et al. Multicenter international assessment of a SARS-CoV-2 RT-LAMP test for point of care clinical application. PLoS One 2022, 17, e0268340. [Google Scholar] [CrossRef]
- Haq, F.; Sharif, S.; Khurshid, A.; Ikram, A.; Shabbir, I.; Salman, M.; Ahad, A.; Rana, M.S.; Raja, A.; Badar, N.; et al. Reverse transcriptase loop-mediated isothermal amplification (RT-LAMP)-based diagnosis: A potential alternative to quantitative real-time PCR based detection of the novel SARS-CoV-2 virus. Saudi J. Biol. Sci. 2021, 28, 942–947. [Google Scholar] [CrossRef]
- Kundrod, K.A.; Natoli, M.E.; Chang, M.M.; Smith, C.A.; Paul, S.; Ogoe, D.; Goh, C.; Santhanaraj, A.; Price, A.; Eldin, K.W.; et al. Sample-to-answer, extraction-free, real-time RT-LAMP test for SARS-CoV-2 in nasopharyngeal, nasal, and saliva samples: Implications and use for surveillance testing. PLoS ONE 2022, 17, e0264130. [Google Scholar] [CrossRef]
- Mallett, S.; Allen, A.J.; Graziadio, S.; Taylor, S.A.; Sakai, N.S.; Green, K.; Suklan, J.; Hyde, C.; Shinkins, B.; Zhelev, Z.; et al. At what times during infection is SARS-CoV-2 detectable and no longer detectable using RT-PCR-based tests? A systematic review of individual participant data. BMC Med. 2020, 18, 346. [Google Scholar] [CrossRef]
- Inaba, M.; Higashimoto, Y.; Toyama, Y.; Horiguchi, T.; Hibino, M.; Iwata, M.; Imaizumi, K.; Doi, Y. Diagnostic accuracy of LAMP versus PCR over the course of SARS-CoV-2 infection. Int. J. Infect. Dis. 2021, 107, 195–200. [Google Scholar] [CrossRef]
- Villar, L.M.; Costa, V.D.; Marques, B.C.L.; da Silva, L.L.; Santos, A.C.; Mendonça, A.C.D.F.; Marques, V.A.; Nascimento, G.P.D.; Lewis-Ximenez, L.L.; de Paula, V.S. Usefulness of saliva samples for detecting SARS-CoV-2 RNA among liver disease patients. J. Infect. 2021, 82, e4–e5. [Google Scholar] [CrossRef]
- Muniz, I.A.F.; Santos, M.E.; Rodrigues, R.C.S.; Souza, J.R.; Oliveira, R.A.S.; Castellano, L.R.S.; Bonan, R.P.F. SARS-CoV-2 and Saliva as a Diagnostic Tool: A Real Possibility. Pesqui. Bras. Em Odontopediatria E Clínica Integr. 2020, 20 (Suppl. S1), e0112. [Google Scholar] [CrossRef]
- Sri Santosh, T.; Parmar, R.; Anand, H.; Srikanth, K.; Saritha, M. A Review of Salivary Diagnostics and Its Potential Implication in Detection of COVID-19. Cureus 2020, 12, e7708. [Google Scholar] [CrossRef] [Green Version]
- Li, X.; Geng, M.; Peng, Y.; Meng, L.; Lu, S. Molecular immune pathogenesis and diagnosis of COVID-19. J. Pharm. Anal. 2020, 10, 102–108. [Google Scholar] [CrossRef]
- Han, P.; Ivanovski, S. Saliva-Friend and Foe in the COVID-19 Outbreak. Diagnostics 2020, 10, 290. [Google Scholar] [CrossRef]
- Chen, L.; Zhao, J.; Peng, J.; Li, X.; Deng, X.; Geng, Z.; Shen, Z.; Guo, F.; Zhang, Q.; Jin, Y.; et al. Detection of SARS-CoV-2 in saliva and characterization of oral symptoms in COVID-19 patients. Cell Prolif. 2020, 53, e12923. [Google Scholar] [CrossRef]
- Odeh, N.D.; Babkair, H.; Abu-Hammad, S.; Borzangy, S.; Abu-Hammad, A.; Abu-Hammad, O. COVID-19: Present and Future Challenges for Dental Practice. Int. J. Environ. Res. Public Health 2020, 17, 3151. [Google Scholar] [CrossRef] [PubMed]
- Pfaffe, T.; Cooper-White, J.; Beyerlein, P.; Kostner, K.; Punyadeera, C. Diagnostic potential of saliva: Current state and future applications. Clin. Chem. 2011, 57, 675–687. [Google Scholar] [CrossRef] [PubMed] [Green Version]
- Schoeber, J.P.H.; Schlaghecke, J.M.; Meuwissen, B.M.J.; van Heertum, M.; van den Brule, A.J.C.; Loonen, A.J.M. Comprehensive analytical and clinical evaluation of a RNA extraction-free saliva-based molecular assay for SARS-CoV-2. PLoS ONE 2022, 17, e0268082. [Google Scholar] [CrossRef] [PubMed]
- To, K.K.; Tsang, O.T.; Leung, W.S.; Tam, A.R.; Wu, T.C.; Lung, D.C.; Yip, C.C.-Y.; Cai, J.P.; Chan, J.M.-C.; Chik, T.S.-H.; et al. Temporal profiles of viral load in posterior oropharyngeal saliva samples and serum antibody responses during infection by SARS-CoV-2: An observational cohort study. Lancet Infect. Dis. 2020, 20, 565–574. [Google Scholar] [CrossRef] [Green Version]
- Kobayashi, G.; Brito, L.; Moreira, D.; Suzuki, A.; Hsia, G.; Pimentel, L.; de Paiva, A.; Dias, C.; Lourenço, N.; Oliveira, B.; et al. A Novel Saliva RT-LAMP Workflow for Rapid Identification of COVID-19 Cases and Restraining Viral Spread. Diagnostics 2021, 11, 1400. [Google Scholar] [CrossRef]
- PAHO/WHO. Epidemiological Update: SARS-CoV-2 Variants in the Americas. Available online: https://iris.paho.org/bitstream/handle/10665.2/53234/EpiUpdate26January2021_por.pdf?sequence=1&isAllowed=y (accessed on 8 August 2022).
- Faria, N.R.; Mellan, T.A.; Whittaker, C.; Claro, I.M.; Candido, D.D.S.; Mishra, S.; Crispim, M.A.E.; Sales, F.C.S.; Hawryluk, I.; McCrone, J.T.; et al. Genomics and epidemiology of a novel SARS-CoV-2 lineage in Manaus, Brazil. Science 2021, 372, 815–821. [Google Scholar] [CrossRef]
- Voloch, C.M.; da Silva Francisco, R., Jr.; de Almeida, L.G.P.; Cardoso, C.C.; Brustolini, O.J.; Gerber, A.L.; Guimarães, A.P.D.C.; Vasconcelos, A.T.R.D. Genomic characterization of a novel SARS-CoV-2 lineage from Rio de Janeiro, Brazil. J. Virol. 2021, 95, e00119-21. [Google Scholar] [CrossRef]
- Wolf, J.M.; Kipper, D.; Borges, G.R.; Streck, A.F.; Lunge, V.R. Temporal spread and evolution of SARS-CoV-2 in the second pandemic wave in Brazil. J. Med. Virol. 2022, 94, 926–936. [Google Scholar] [CrossRef]
- WHO. Tracking SARS-CoV-2 variants. Available online: https://www.who.int/en/activities/tracking-SARS-CoV-2-variants/ (accessed on 8 August 2022).
- CDC. Omicron Variant: What You Need to Know. Available online: https://www.cdc.gov/coronavirus/2019-ncov/variants/omicronvariant.html#:~:text=November%2030%2C%202021%3A%20The%20United,%2C%202021%2C%20in%20New%20Jersey (accessed on 8 August 2022).
- Luo, Z.; Ye, C.; Xiao, H.; Yin, J.; Liang, Y.; Ruan, Z.; Luo, D.; Gao, D.; Tan, Q.; Li, Y.; et al. Optimization of loop-mediated isothermal amplification (LAMP) assay for robust visualization in SARS-CoV-2 and emerging variants diagnosis. Chem. Eng. Sci. 2022, 251, 117430. [Google Scholar] [CrossRef]
- Jamwal, V.L.; Kumar, N.; Bhat, R.; Jamwal, P.S.; Singh, K.; Dogra, S.; Kulkarni, A.; Bhadra, B.; Shukla, M.R.; Saran, S.; et al. Optimization and validation of RT-LAMP assay for diagnosis of SARS-CoV2 including the globally dominant Delta variant. Virol. J. 2021, 18, 178. [Google Scholar] [CrossRef] [PubMed]
- Almeida, L.T.; Gonçalves, A.B.; Franco-Luiz, A.P.M.; Silva, T.B.S.; Alves, P.A.; Monte-Neto, R.L.D. Molecular detection of omicron SARS-CoV-2 variant is achieved by RT-LAMP despite genomic mutations. Memórias Inst. Oswaldo Cruz 2022, 117, e220050. [Google Scholar] [CrossRef] [PubMed]


| Panel of Swab Samples | n |
|---|---|
| 1. SARS-CoV-2 RT-qPCR positive swabs | 276 |
| Swab N1 Ct ≤ 30 | 249 |
| North region | |
| Rondônia | 10 |
| Northeast region | |
| Ceará | 52 |
| Piauí | 22 |
| Midwest region | |
| Mato Grosso do Sul | 101 |
| Goiás | 13 |
| Southeast region | |
| Rio de Janeiro | 46 |
| South region | |
| Paraná | 5 |
| Swab N1 Ct >30 | 27 |
| Southeast region | |
| Rio de Janeiro | 18 |
| South region | |
| Paraná | 9 |
| 2. SARS-CoV-2 RT-qPCR negative swabs | 74 |
| North region | |
| Rondônia | 5 |
| Midwest region | |
| Goiás | 19 |
| Southeast region | |
| Rio de Janeiro | 50 |
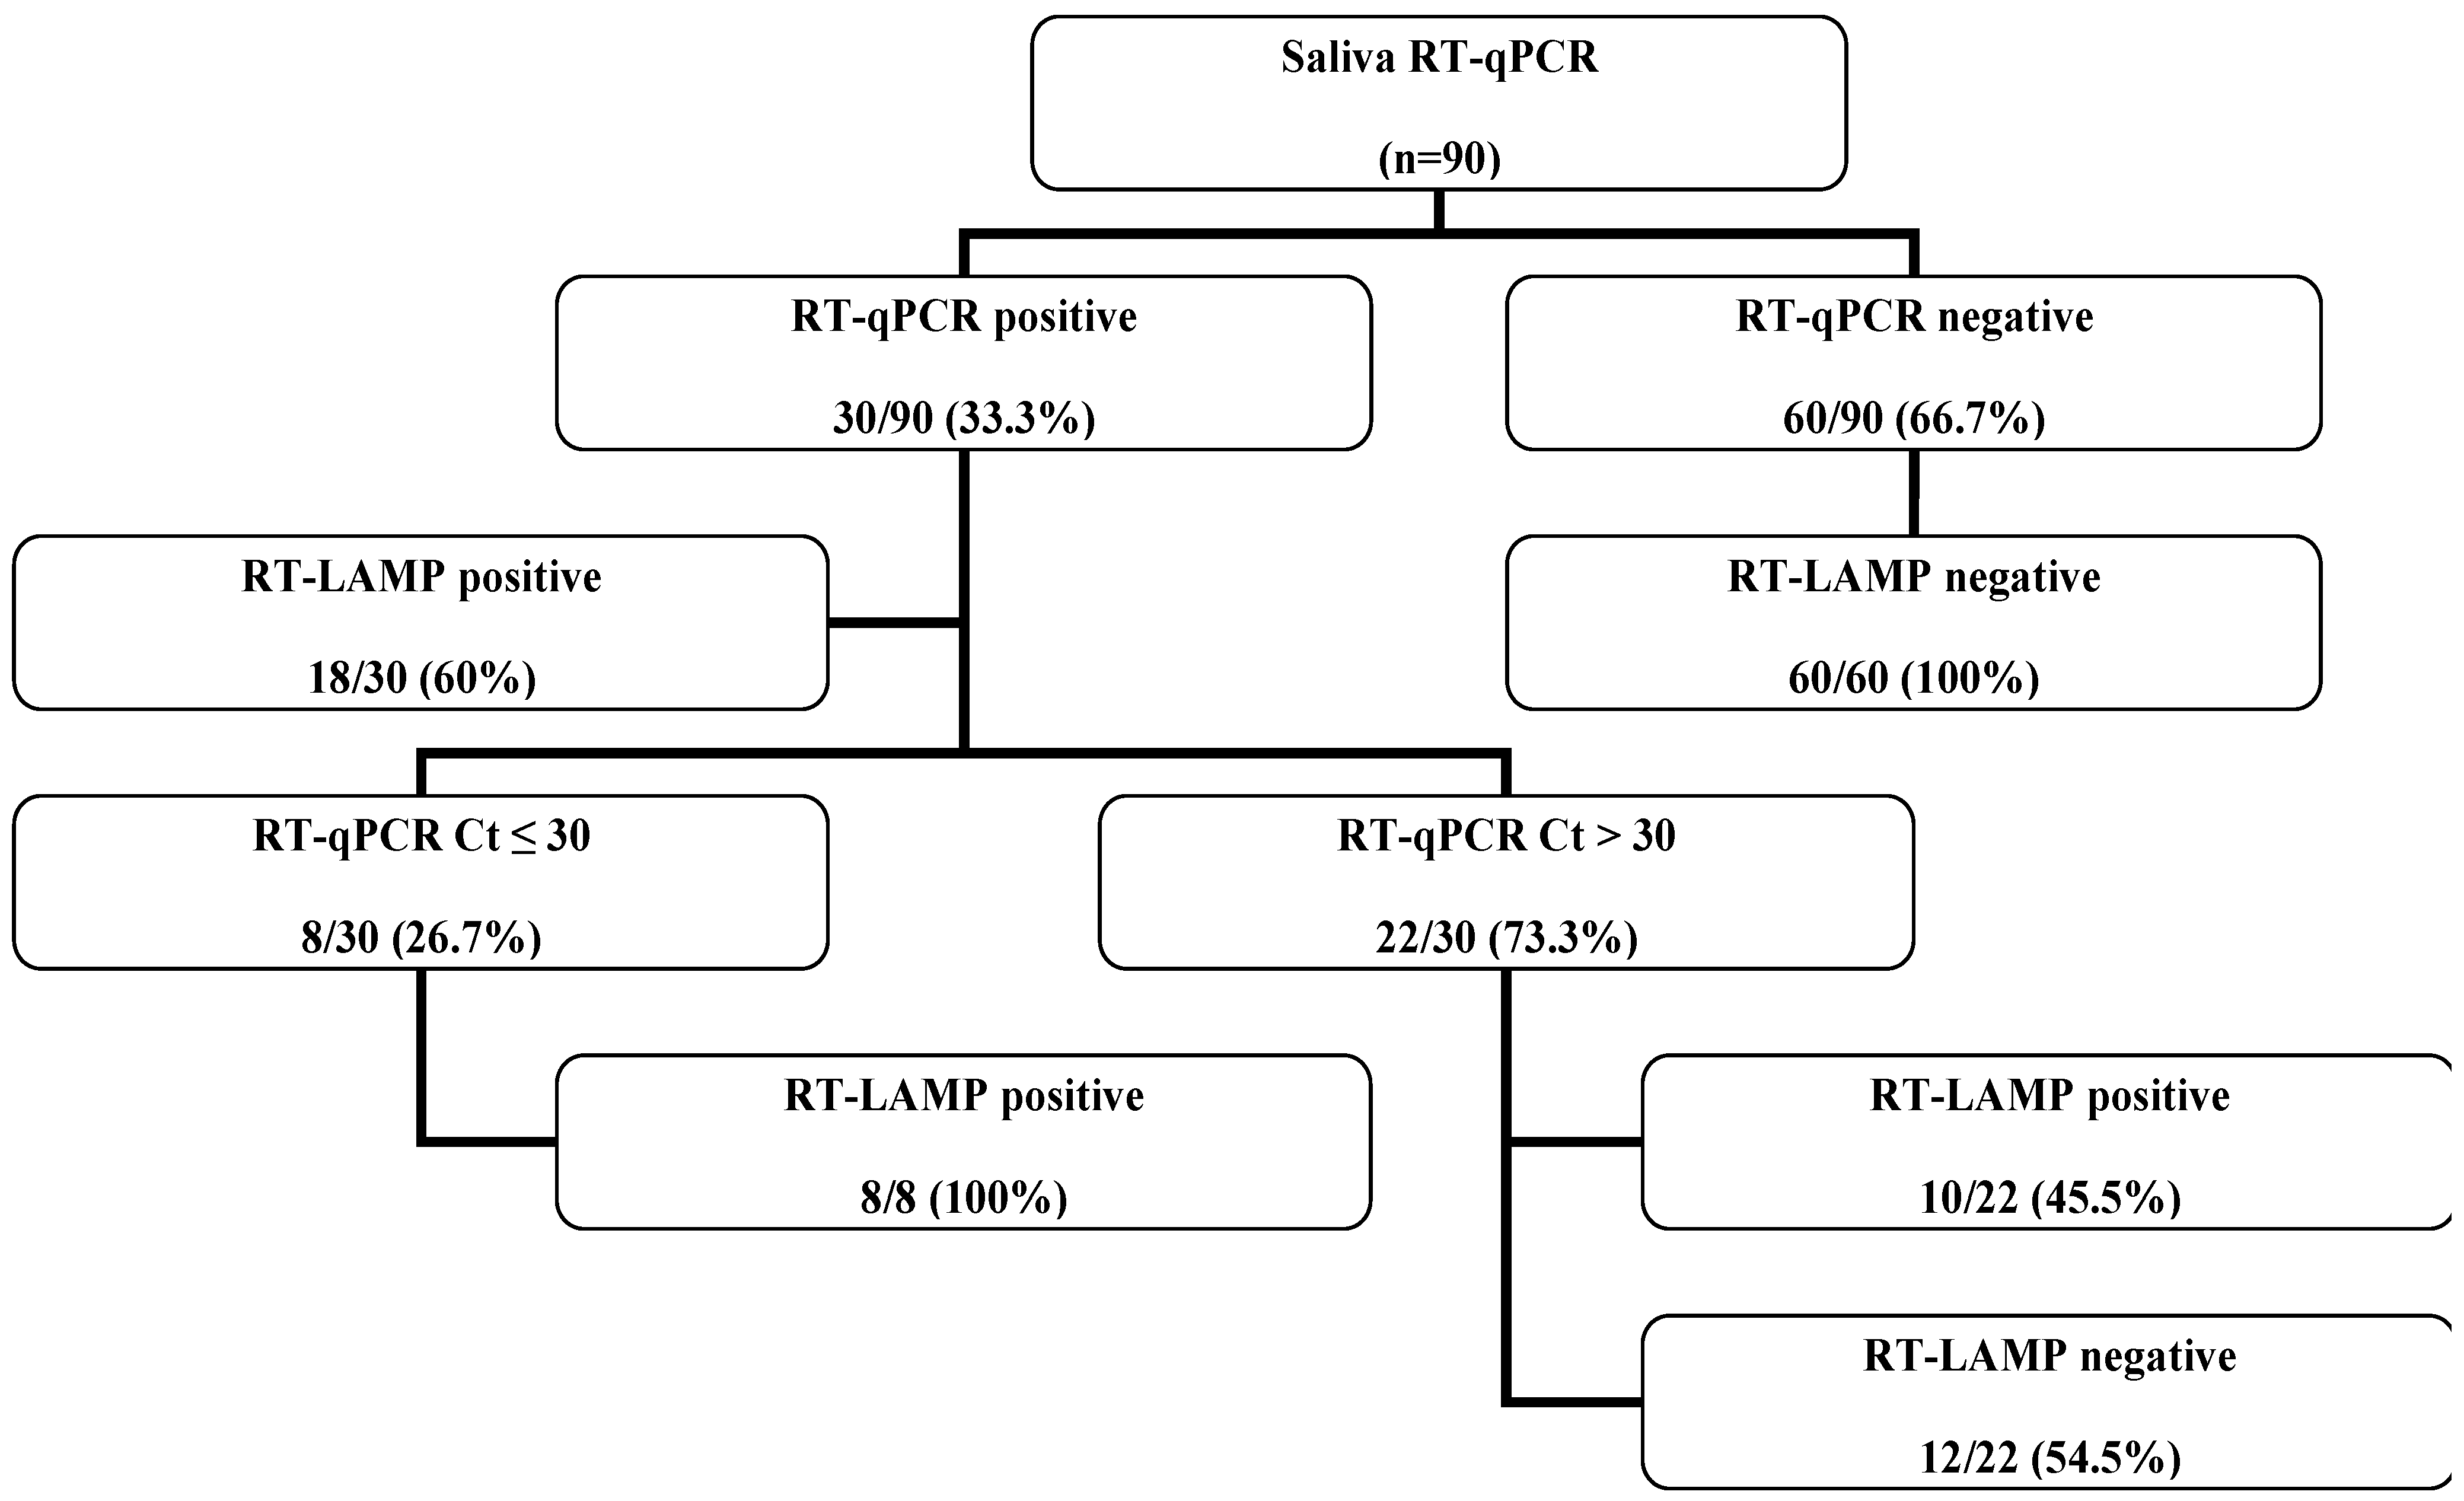
| Panel of Saliva Samples | n |
|---|---|
| 1. SARS-CoV-2 RT-qPCR positive saliva | 30 |
| Swab N1 Ct ≤ 30 | 8 |
| Southeast region | |
| Rio de Janeiro | 5 |
| South region | |
| Paraná | 3 |
| Swab N1 Ct >30 | 22 |
| Southeast region | |
| Rio de Janeiro | 20 |
| South region | |
| Paraná | 2 |
| 2. SARS-CoV-2 RT-qPCR negative saliva | 60 |
| Midwest region | |
| Goiás | 38 |
| Southeast region | |
| Rio de Janeiro | 19 |
| South region | |
| Paraná | 3 |
| Variable Analyzed | Molecular Tests Comparison |
|---|---|
| RT-qPCR vs. RT-LAMP (n = 350) | |
| Sensitivity % (CI 95%) | 77 (72.19–81.35) |
| Specificity % (CI 95%) | 100 (94.09–100) |
| True positive | 249 |
| True negative | 74 |
| False positive | 0 |
| False negative | 27 |
| PPV % (CI 95%) | 100 (98.17–100) |
| NPV % (CI 95%) | 73.3 (63.86–80.97) |
| Accuracy % (CI 95%) | 92.3 (88.97–94.68) |
| Panels of Biological Samples | n | RT-qPCR N1 Ct (Mean ± SD) | Positive RT-LAMP | Sensitivity % (CI 95%) |
|---|---|---|---|---|
| SARS-CoV-2 RT-qPCR positive swabs | 276 | 24 ± 4.9 | 249 | 90.2 (86.10–93.23) |
| Swab N1 Ct ≤ 30 | 249 | 22.8 ± 5.0 | 239 | 96 (92.67–97.90) |
| Rondônia | 10 | 23.2 ± 3.7 | 9 | 90 (57.40–99.99) |
| Ceará | 52 | 22.4 ± 2.8 | 47 | 90.4 (78.96–96.25) |
| Piauí | 22 | 23.8 ± 2.3 | 22 | 100 (82.45–100) |
| Mato Grosso do Sul | 101 | 22.5 ± 3.3 | 101 | 100 (95.6–100) |
| Goiás | 13 | 21.9 ± 3.0 | 12 | 92.3 (64.5–99.99) |
| Rio de Janeiro | 46 | 23.4 ± 3.86 | 44 | 95.7 (84.66–99.61) |
| Paraná | 5 | 25.7 ± 3.43 | 4 | 80 (35.96–97.97) |
| Swab N1 Ct > 30 | 27 | 35.2 ± 2.34 | 10 | 37 (21.47–55.84) |
| Rio de Janeiro | 18 | 35.4 ± 2.43 | 5 | 27.8 (12.17–51.20) |
| Paraná | 9 | 34.7 ± 2.21 | 5 | 55.6 (26.63–81.16) |
| SARS-CoV-2 RT-qPCR positive swabs tested by MinION (Ct ≤ 30) | 39 | 23.2 ± 3.7 | 38 | 97.4 (85.64–99.99) |
| Period (Days) | n | RT-qPCR N1 Ct (Mean ± SD) | Positive RT-LAMP |
|---|---|---|---|
| 1–5 | 72 | 22.4 ± 3.47 | 72 |
| 6–10 | 40 | 23.3 ± 3.99 | 38 |
| >10 | 6 | 29.9 ± 6.19 | 3 |
Disclaimer/Publisher’s Note: The statements, opinions and data contained in all publications are solely those of the individual author(s) and contributor(s) and not of MDPI and/or the editor(s). MDPI and/or the editor(s) disclaim responsibility for any injury to people or property resulting from any ideas, methods, instructions or products referred to in the content. |
© 2023 by the authors. Licensee MDPI, Basel, Switzerland. This article is an open access article distributed under the terms and conditions of the Creative Commons Attribution (CC BY) license (https://creativecommons.org/licenses/by/4.0/).
Share and Cite
da Costa, V.D.; Santos, A.C.; da Silva, L.L.; Wiggers, W.J.; Ivantes, C.A.P.; Lima, D.M.; Colares, J.K.B.; Dallacqua, D.S.V.; Motta-Castro, A.R.C.; Dávila, A.M.R.; et al. RT-LAMP Multicenter Study for SARS-CoV-2 Genome Molecular Detection in Brazilian Swab and Saliva Samples. Diagnostics 2023, 13, 210. https://0-doi-org.brum.beds.ac.uk/10.3390/diagnostics13020210
da Costa VD, Santos AC, da Silva LL, Wiggers WJ, Ivantes CAP, Lima DM, Colares JKB, Dallacqua DSV, Motta-Castro ARC, Dávila AMR, et al. RT-LAMP Multicenter Study for SARS-CoV-2 Genome Molecular Detection in Brazilian Swab and Saliva Samples. Diagnostics. 2023; 13(2):210. https://0-doi-org.brum.beds.ac.uk/10.3390/diagnostics13020210
Chicago/Turabian Styleda Costa, Vanessa Duarte, Alanna Calheiros Santos, Lucas Lima da Silva, Wilian Jean Wiggers, Claudia Alexandra Pontes Ivantes, Danielle Malta Lima, Jeová Keny Baima Colares, Deusilene Souza Vieira Dallacqua, Ana Rita Coimbra Motta-Castro, Alberto Martín Rivera Dávila, and et al. 2023. "RT-LAMP Multicenter Study for SARS-CoV-2 Genome Molecular Detection in Brazilian Swab and Saliva Samples" Diagnostics 13, no. 2: 210. https://0-doi-org.brum.beds.ac.uk/10.3390/diagnostics13020210