Differential Expression Profiles of the Transcriptome and miRNA Interactome in Synovial Fibroblasts of Rheumatoid Arthritis Revealed by Next Generation Sequencing

 and
and
Abstract
:
1. Introduction
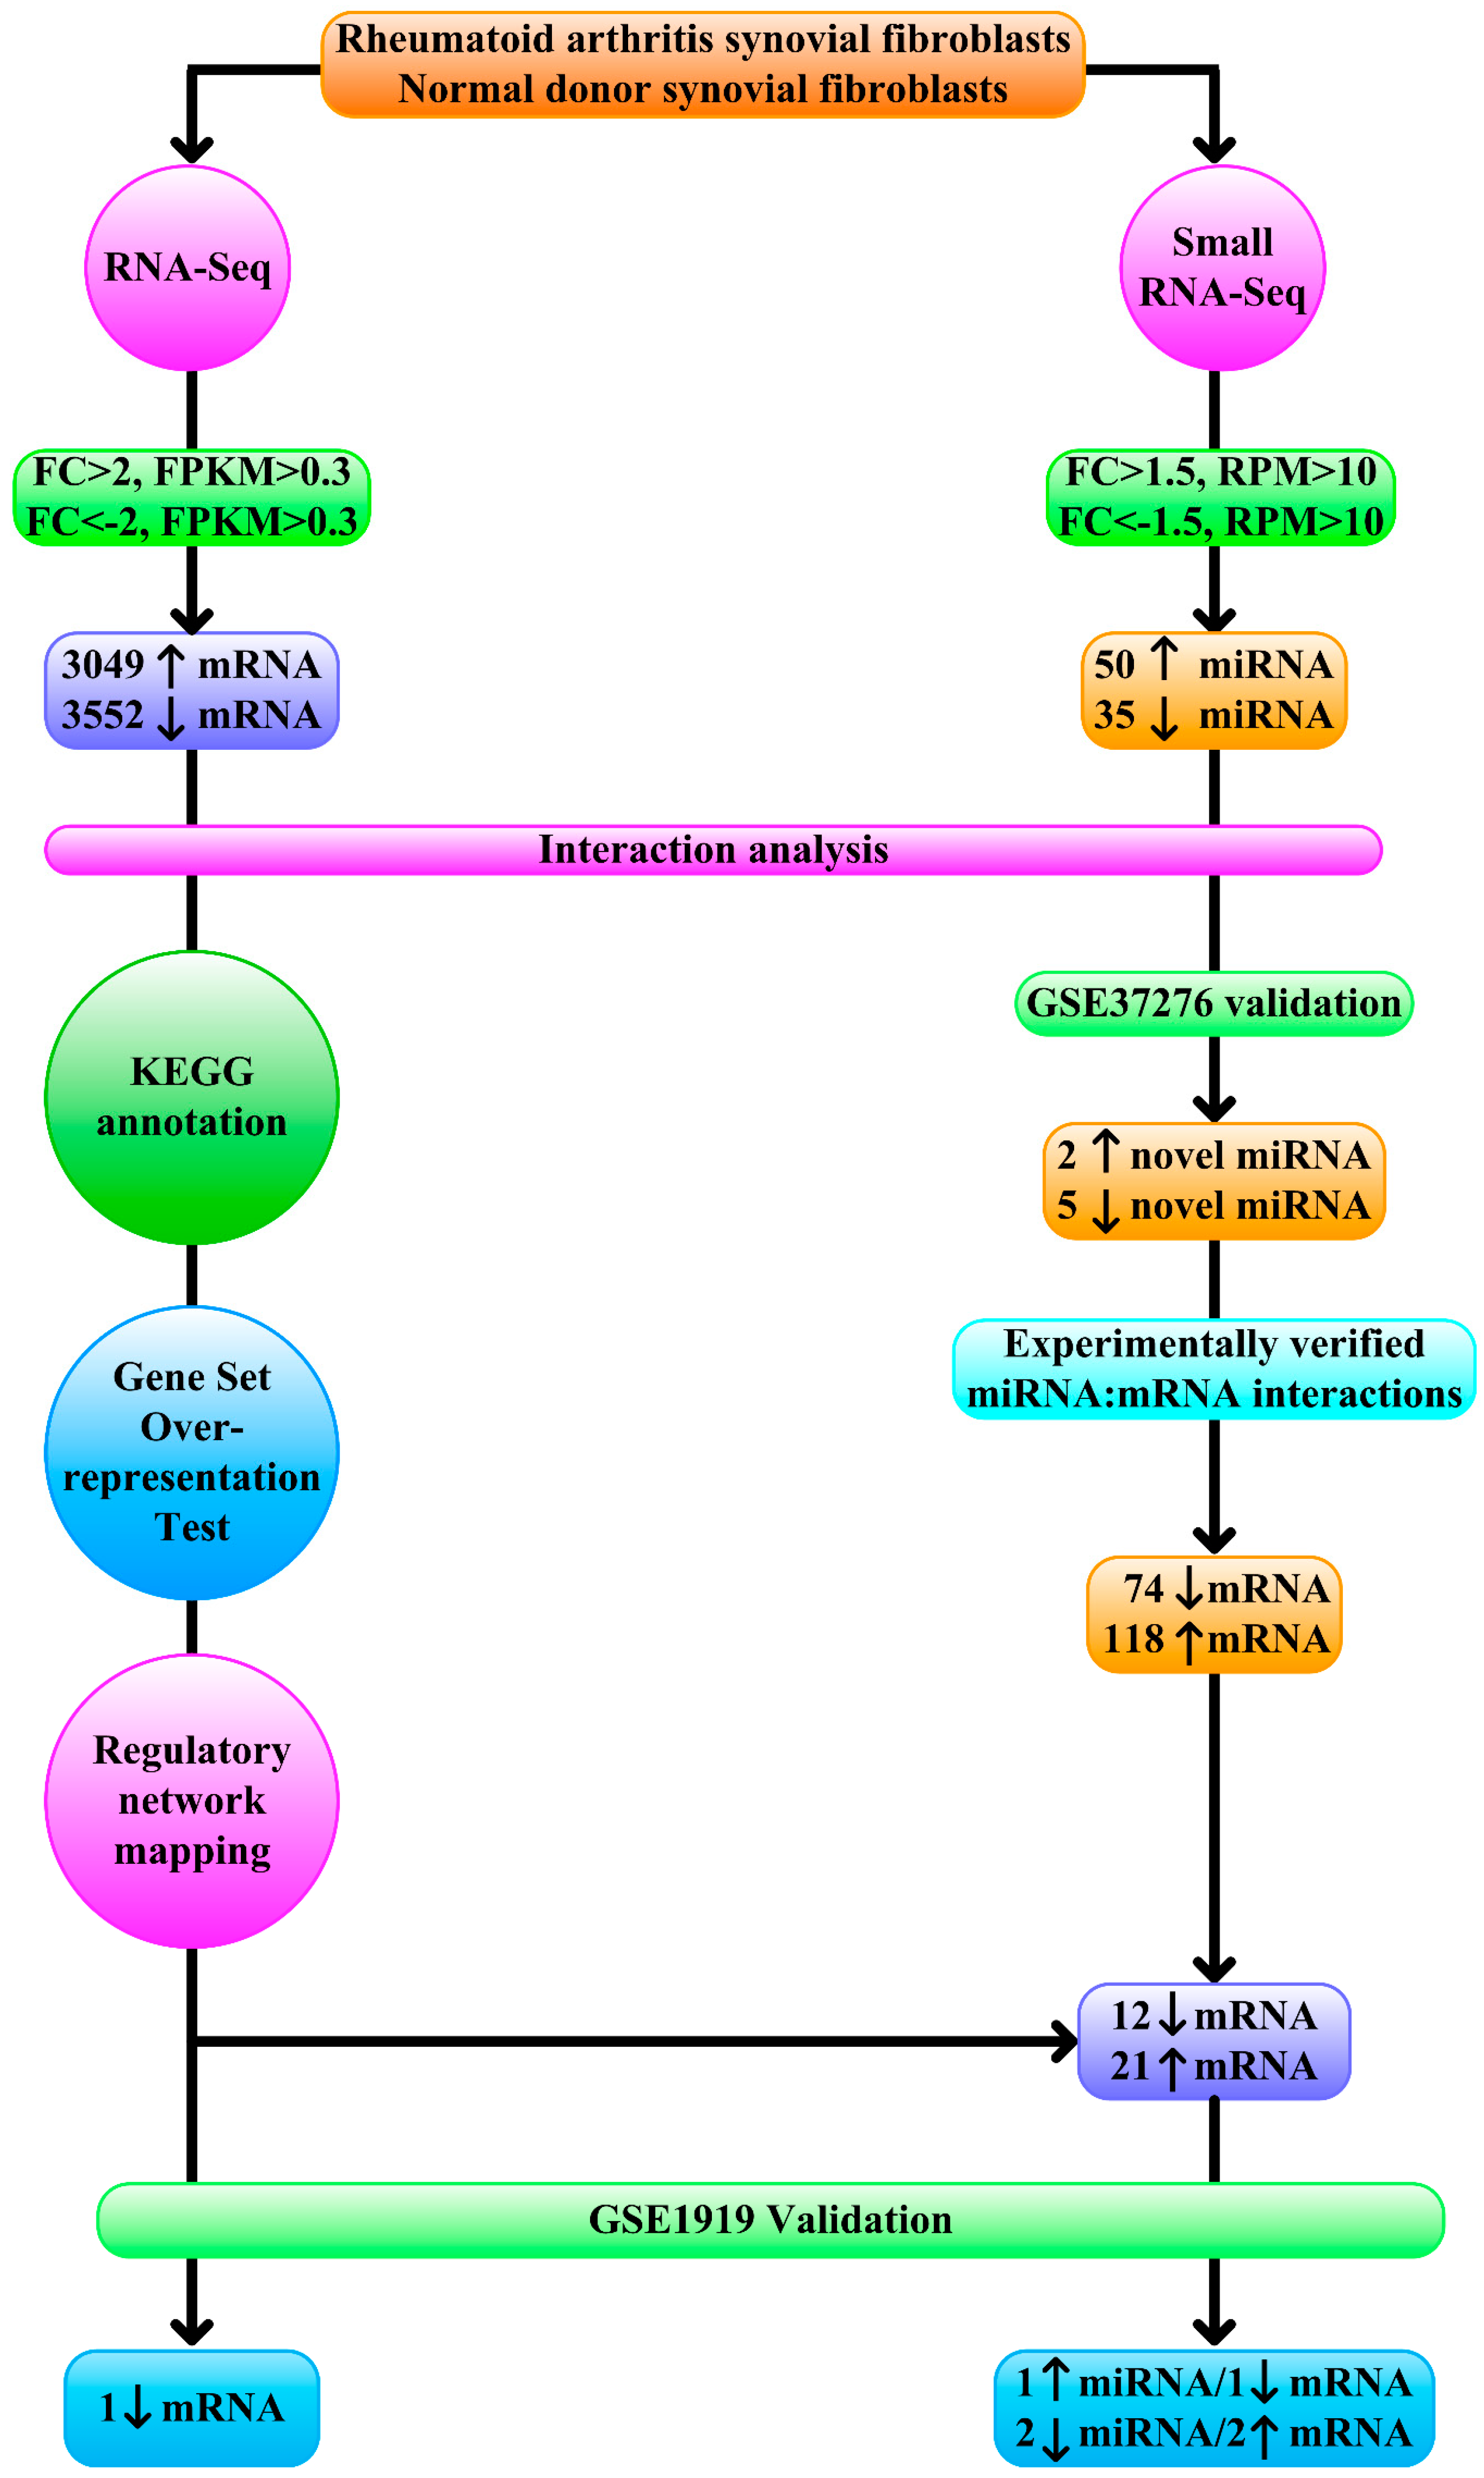
2. Methods
2.1. Synovial Fibroblasts
2.2. RNA Extraction
2.3. RNA-Seq
2.4. Small RNA-Seq
2.5. RNA-Seq Analysis
2.6. Small RNA-Seq Analysis
2.7. Interaction Analysis of Transcription Factors, miRNA, and Target Genes
2.8. Transcript Functional Annotation
2.9. Regulatory Network Mapping
2.10. miRNA Profile Validation
2.11. Experimentally Validated Targets of Validated Differentially Expressed miRNA
2.12. Statistical Analysis
3. Results
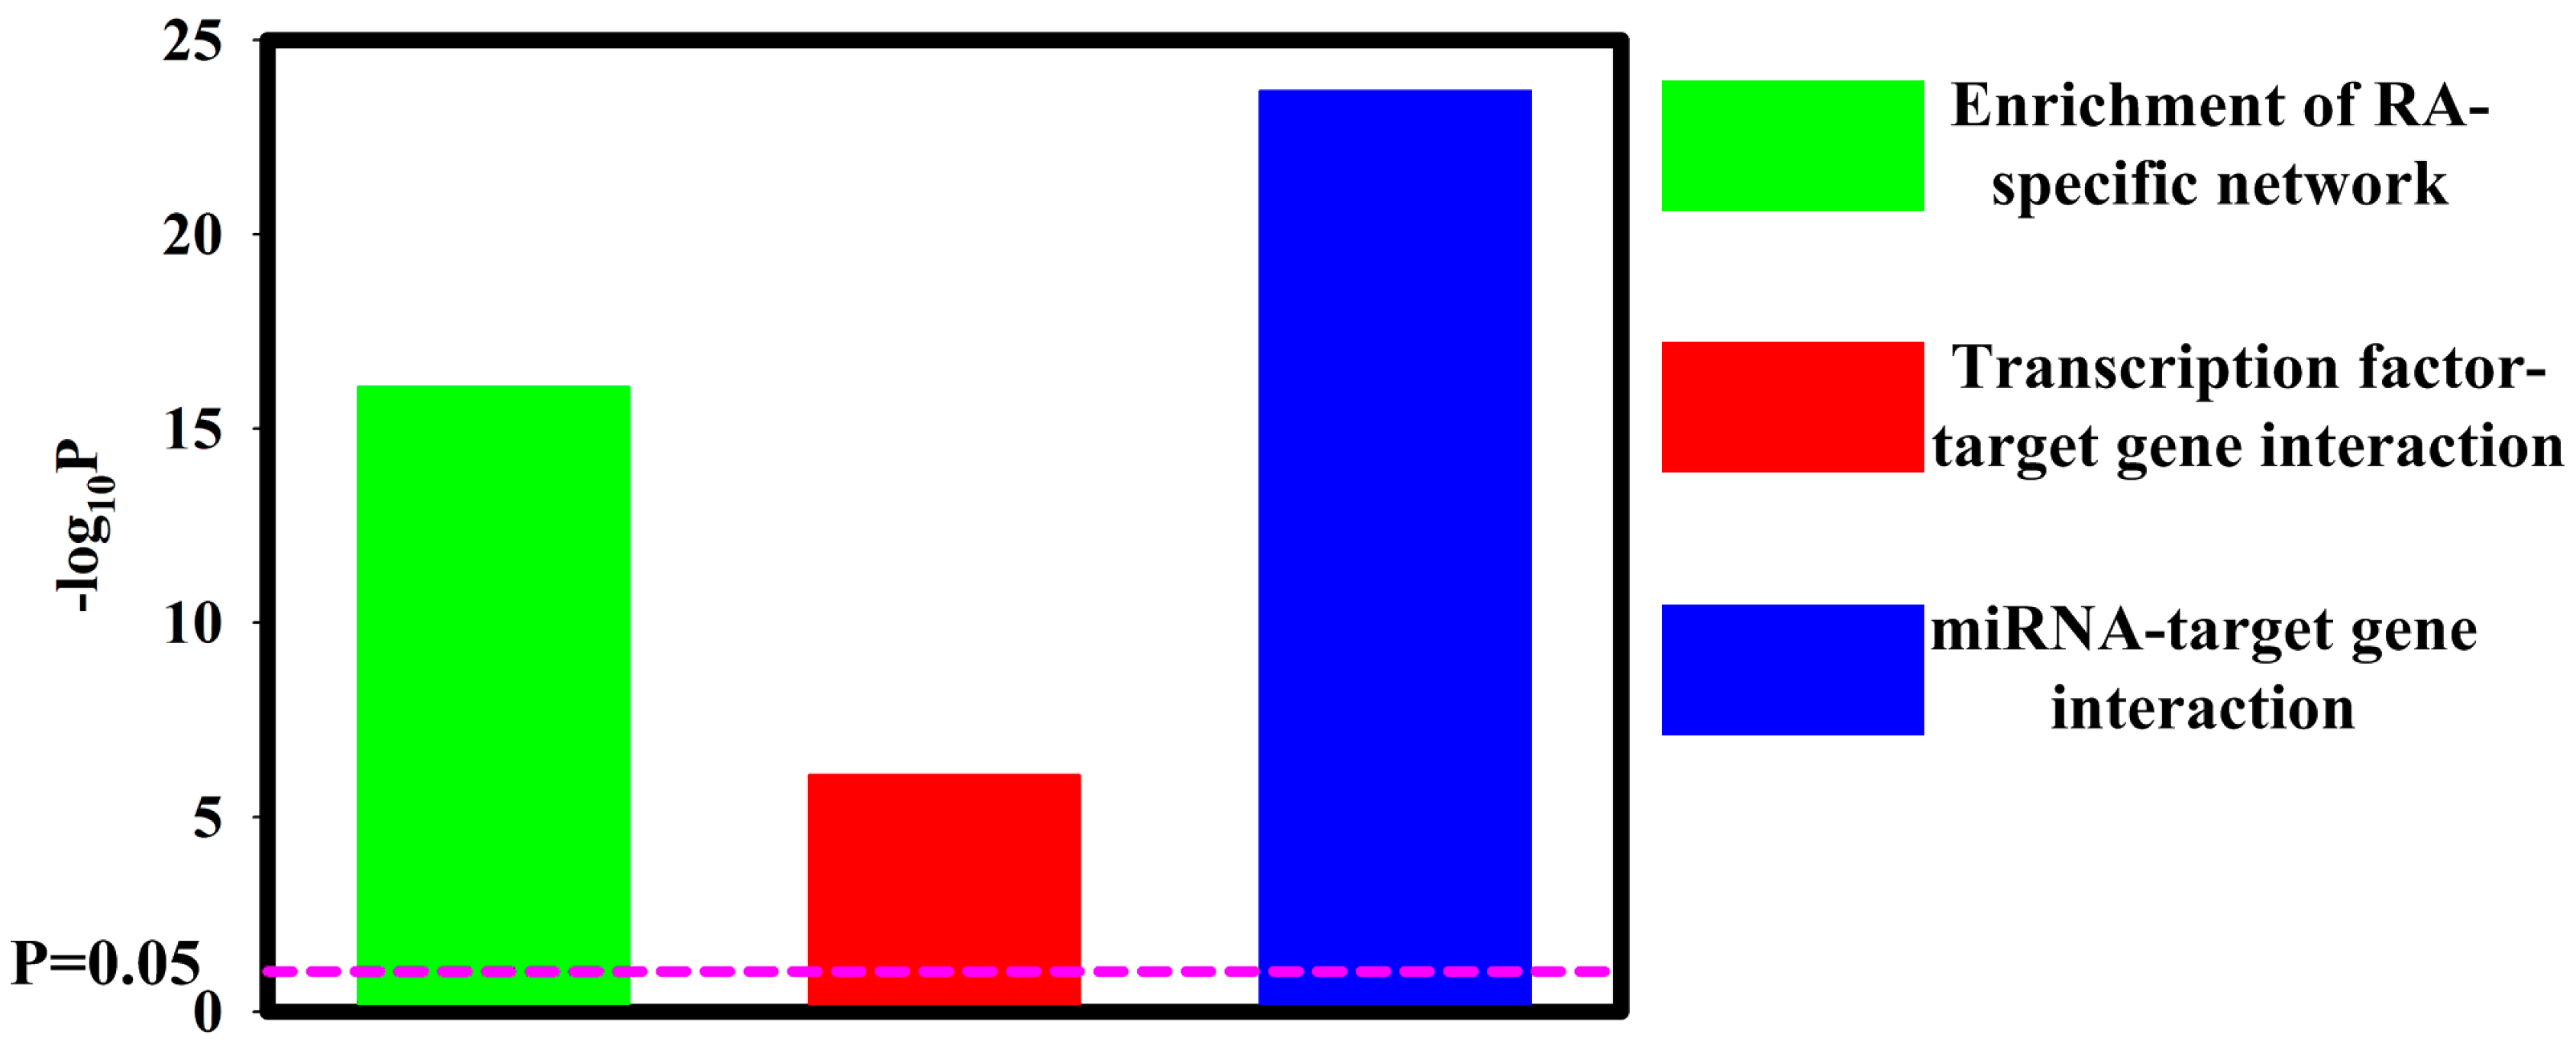
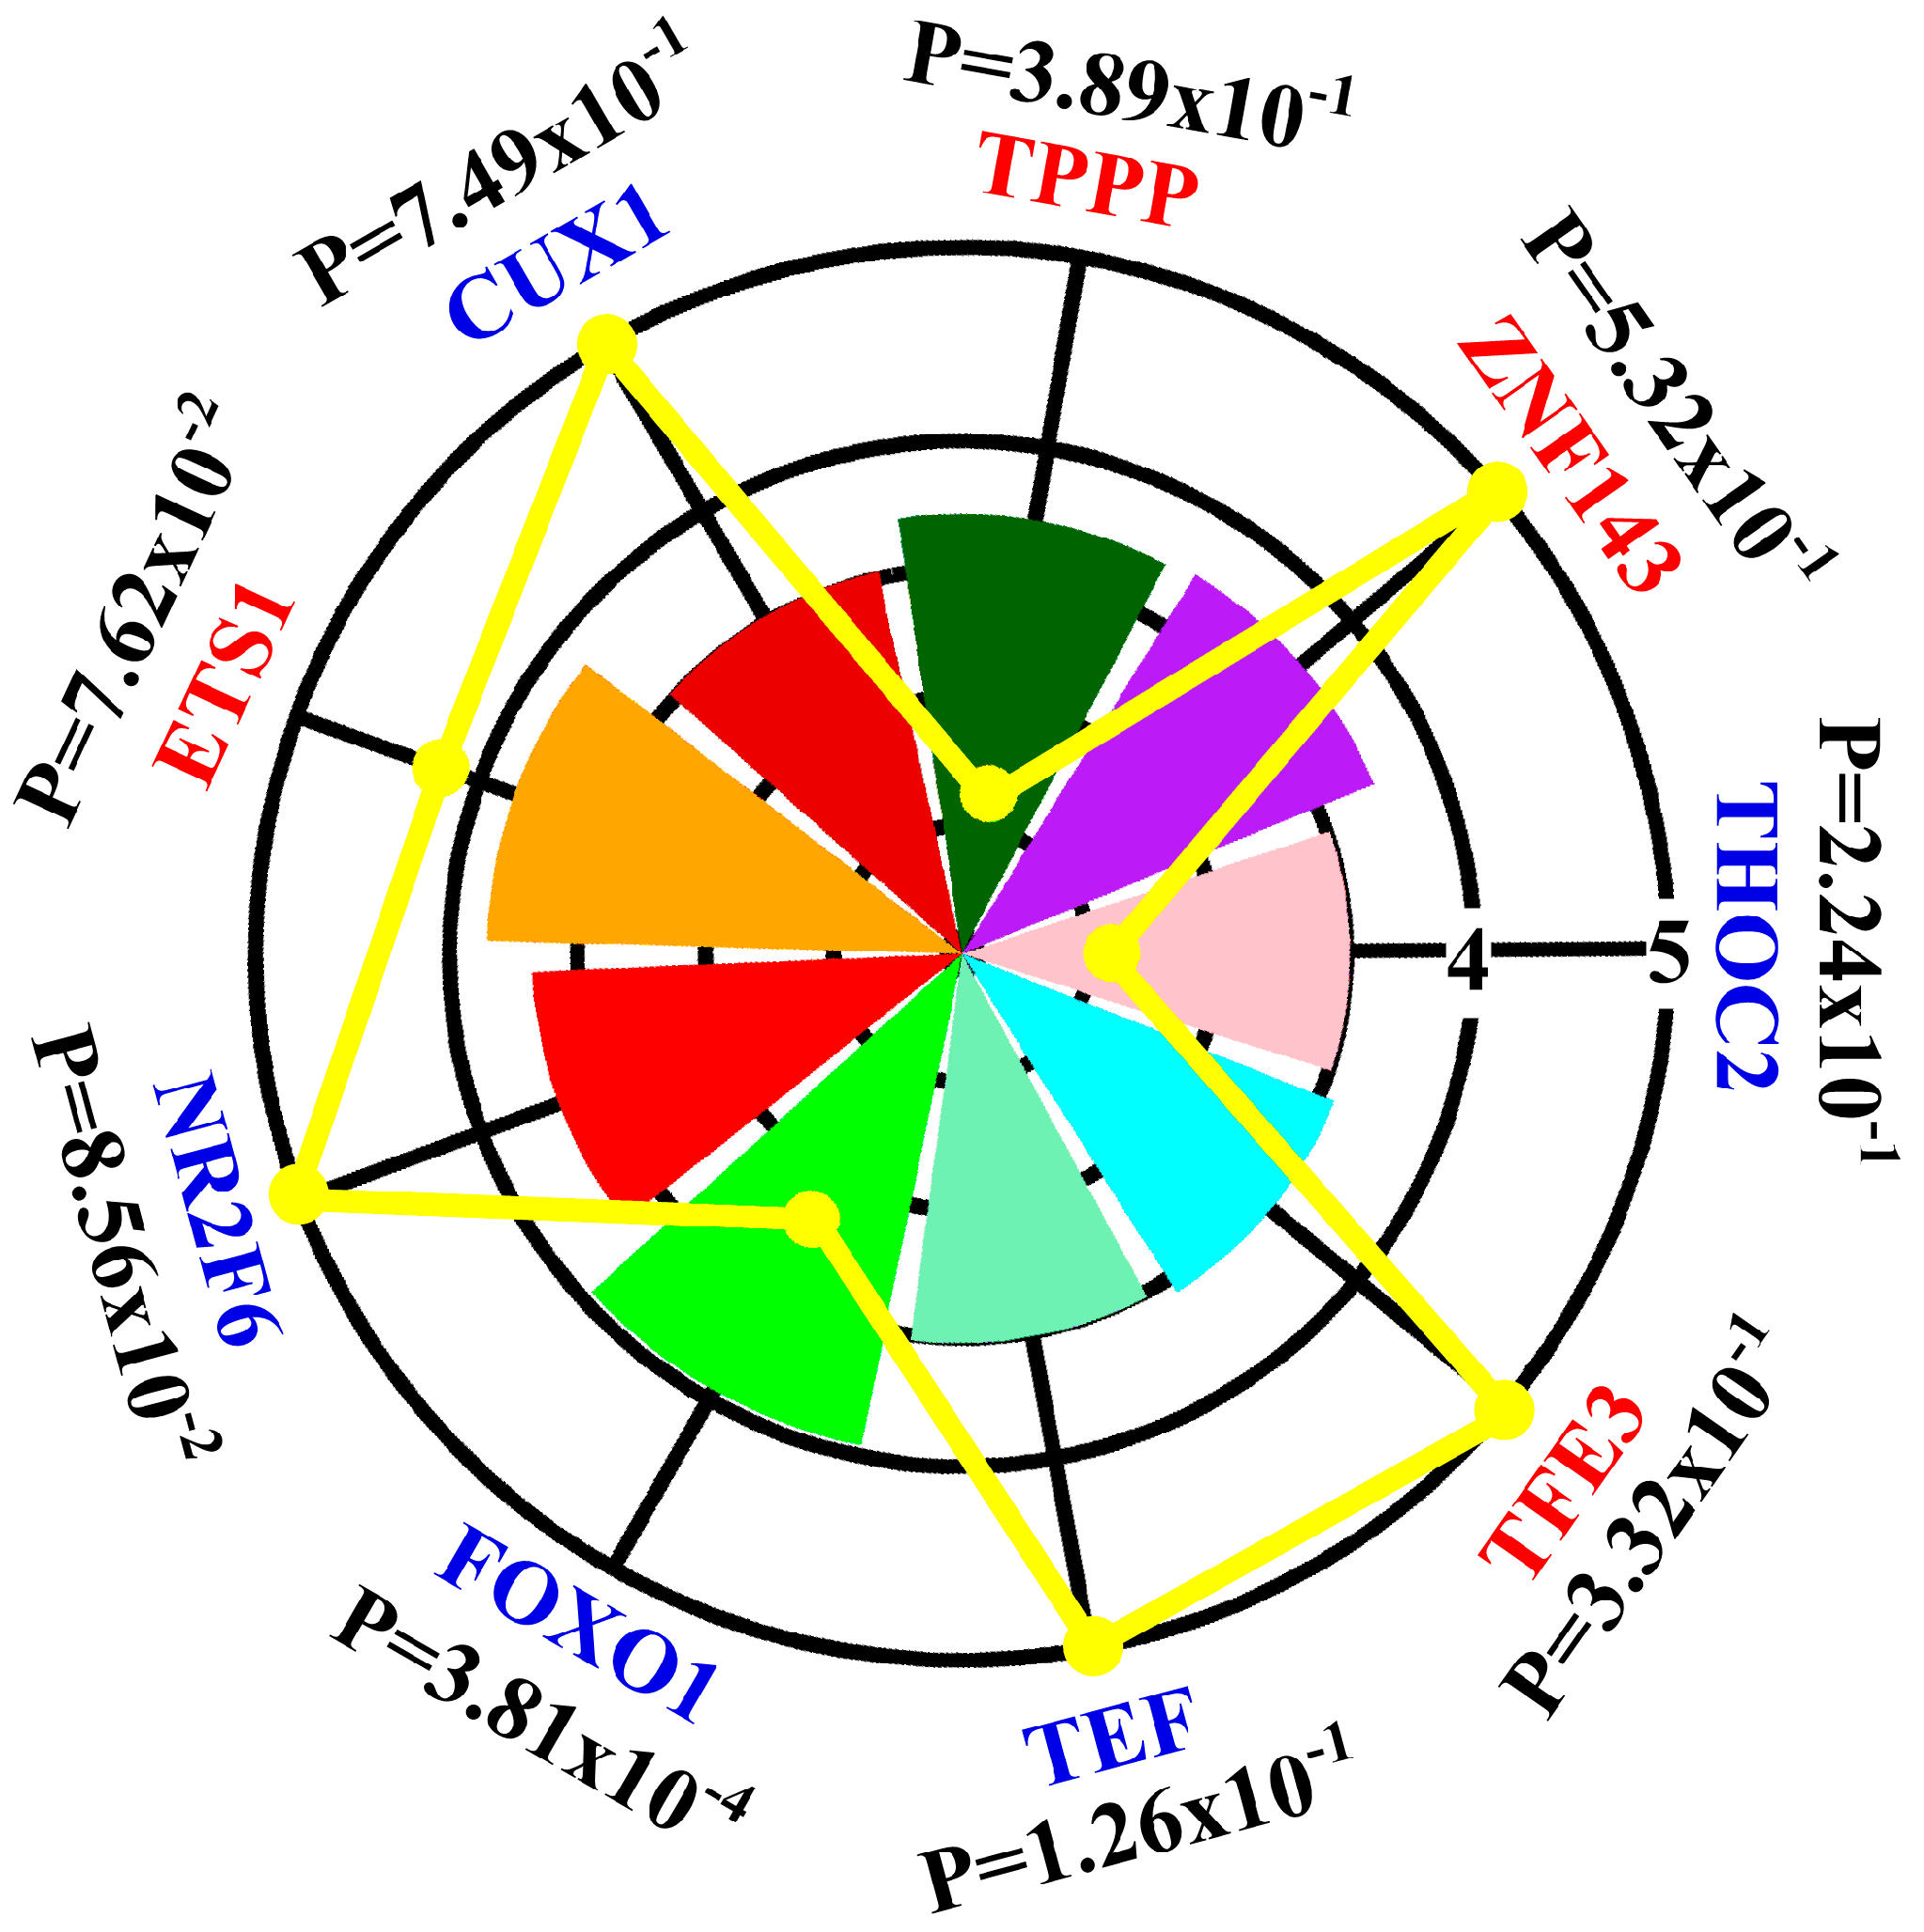
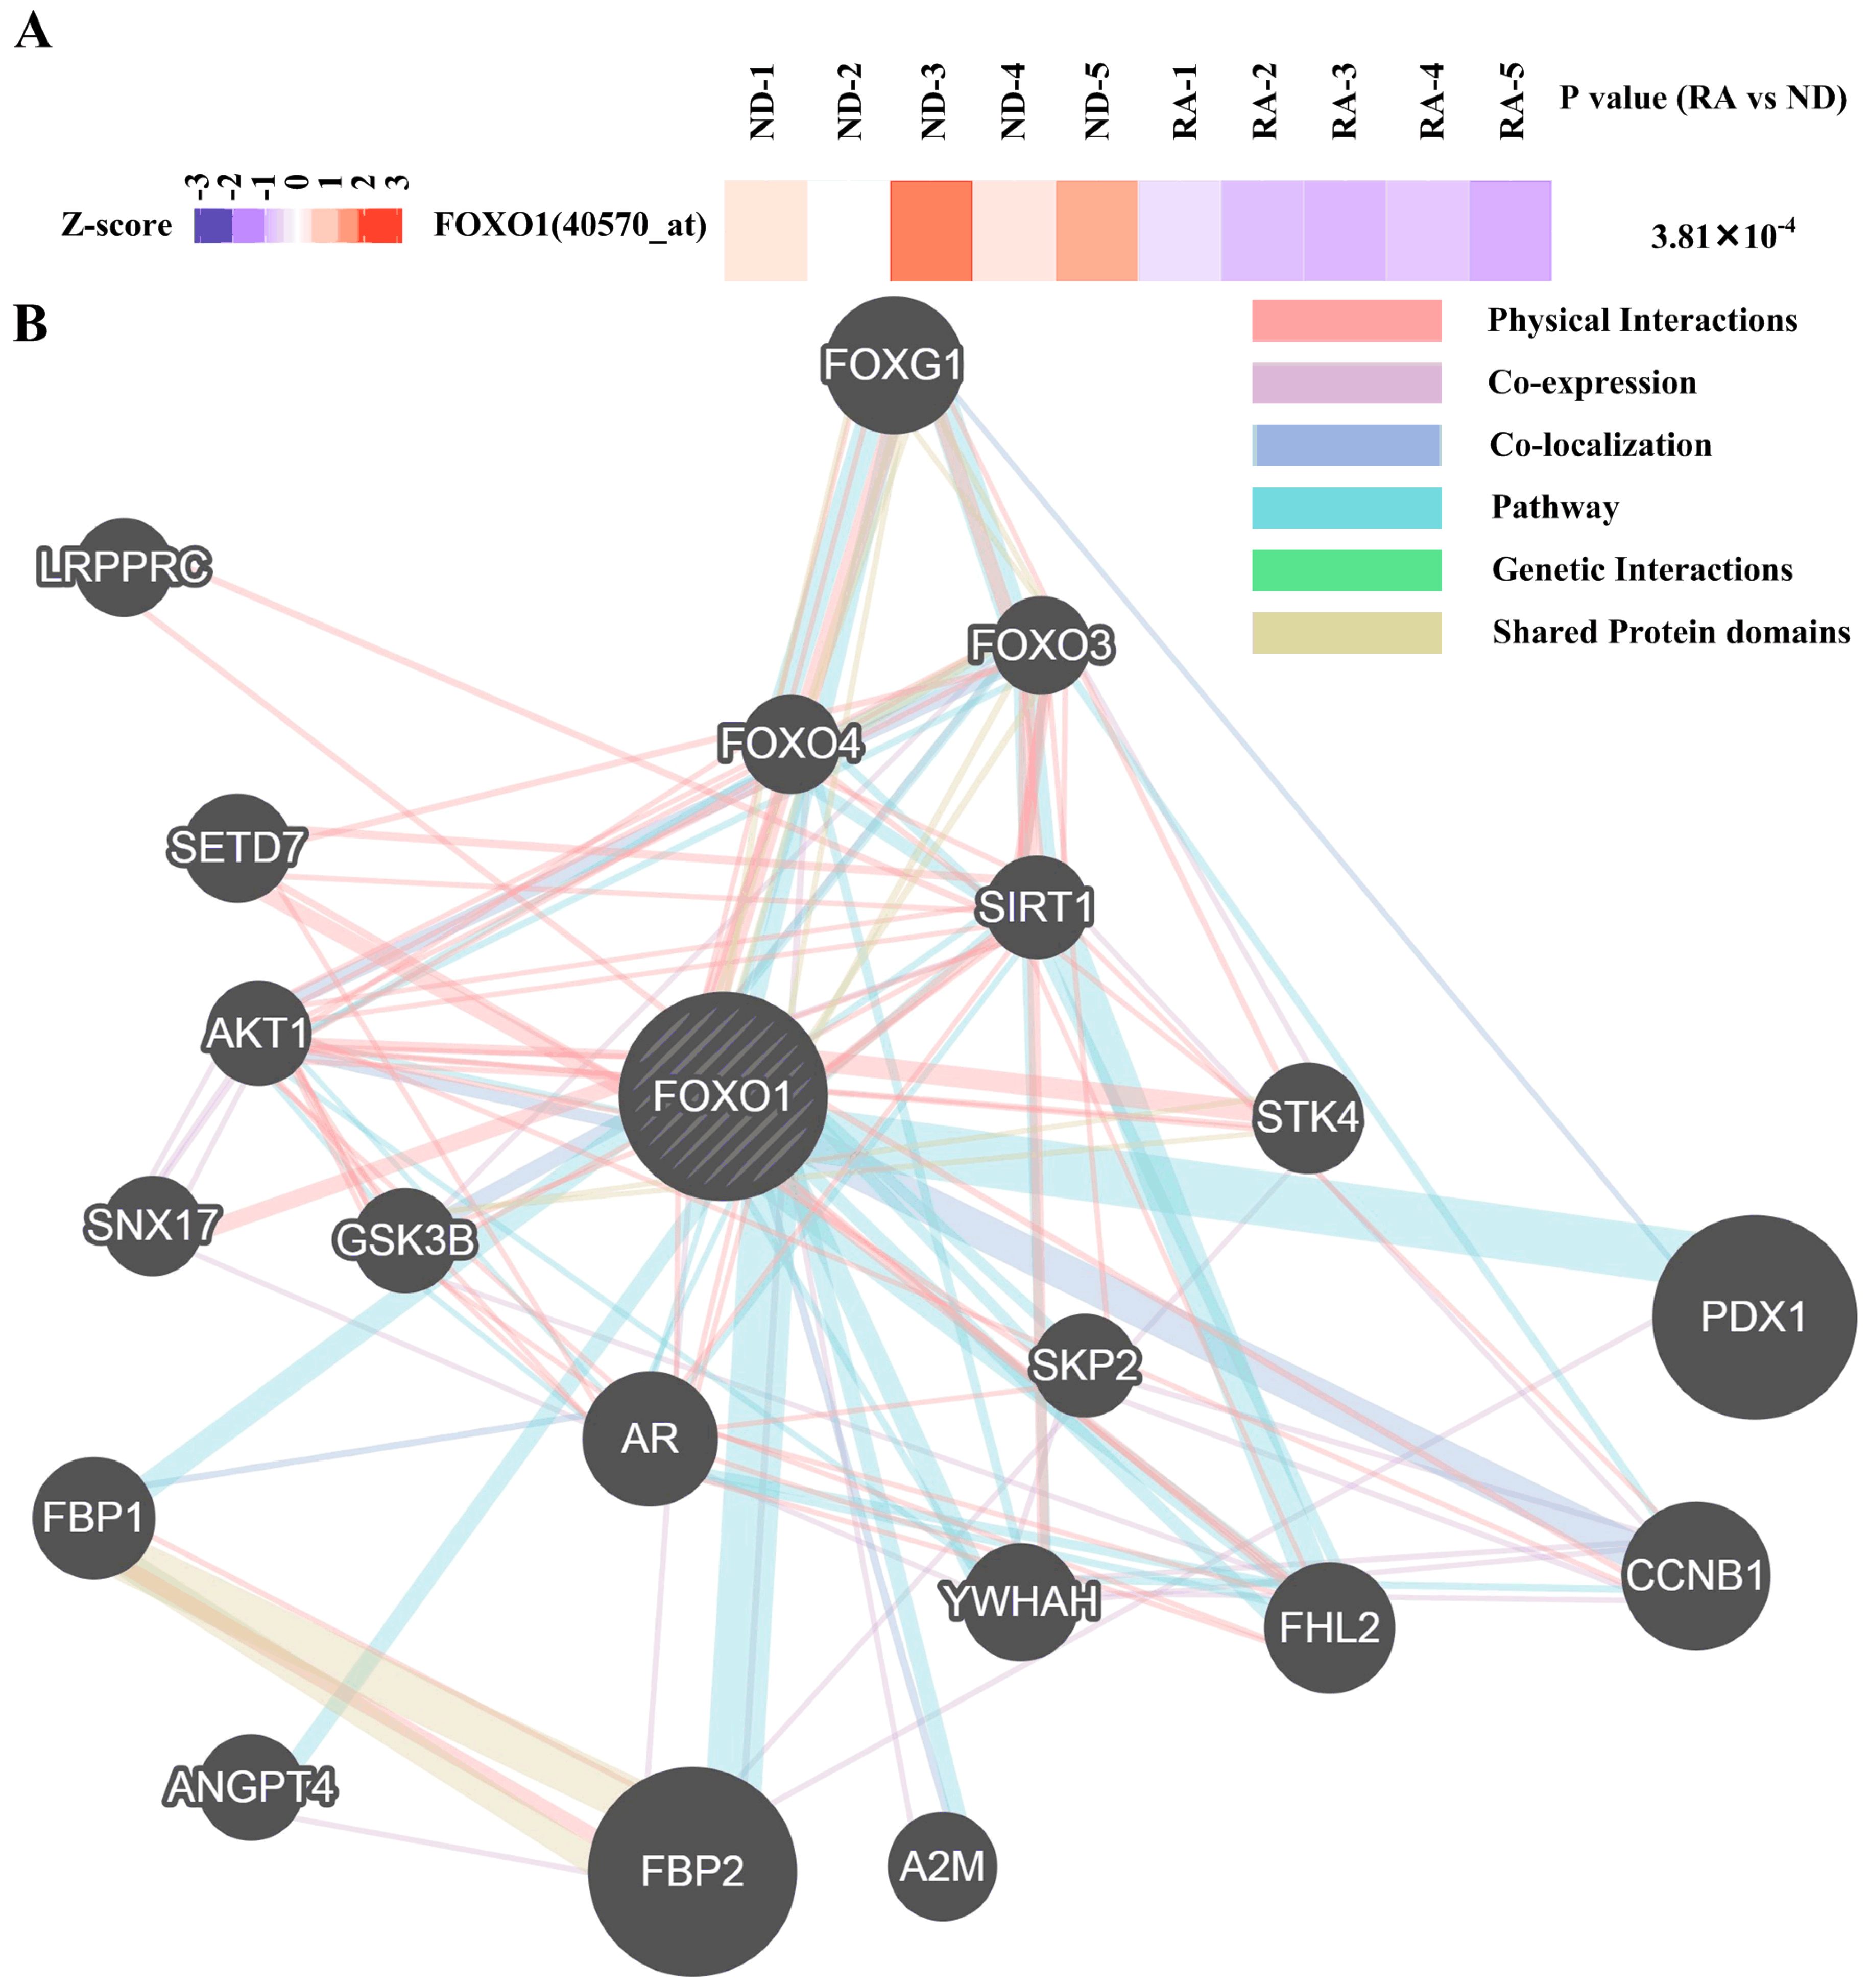
3.1. Contribution of Transcription Factors and miRNA to Differentially Expressed mRNA
3.2. Functional Annotation Differentially Expressed mRNA
3.3. Regulatory Network Mapping
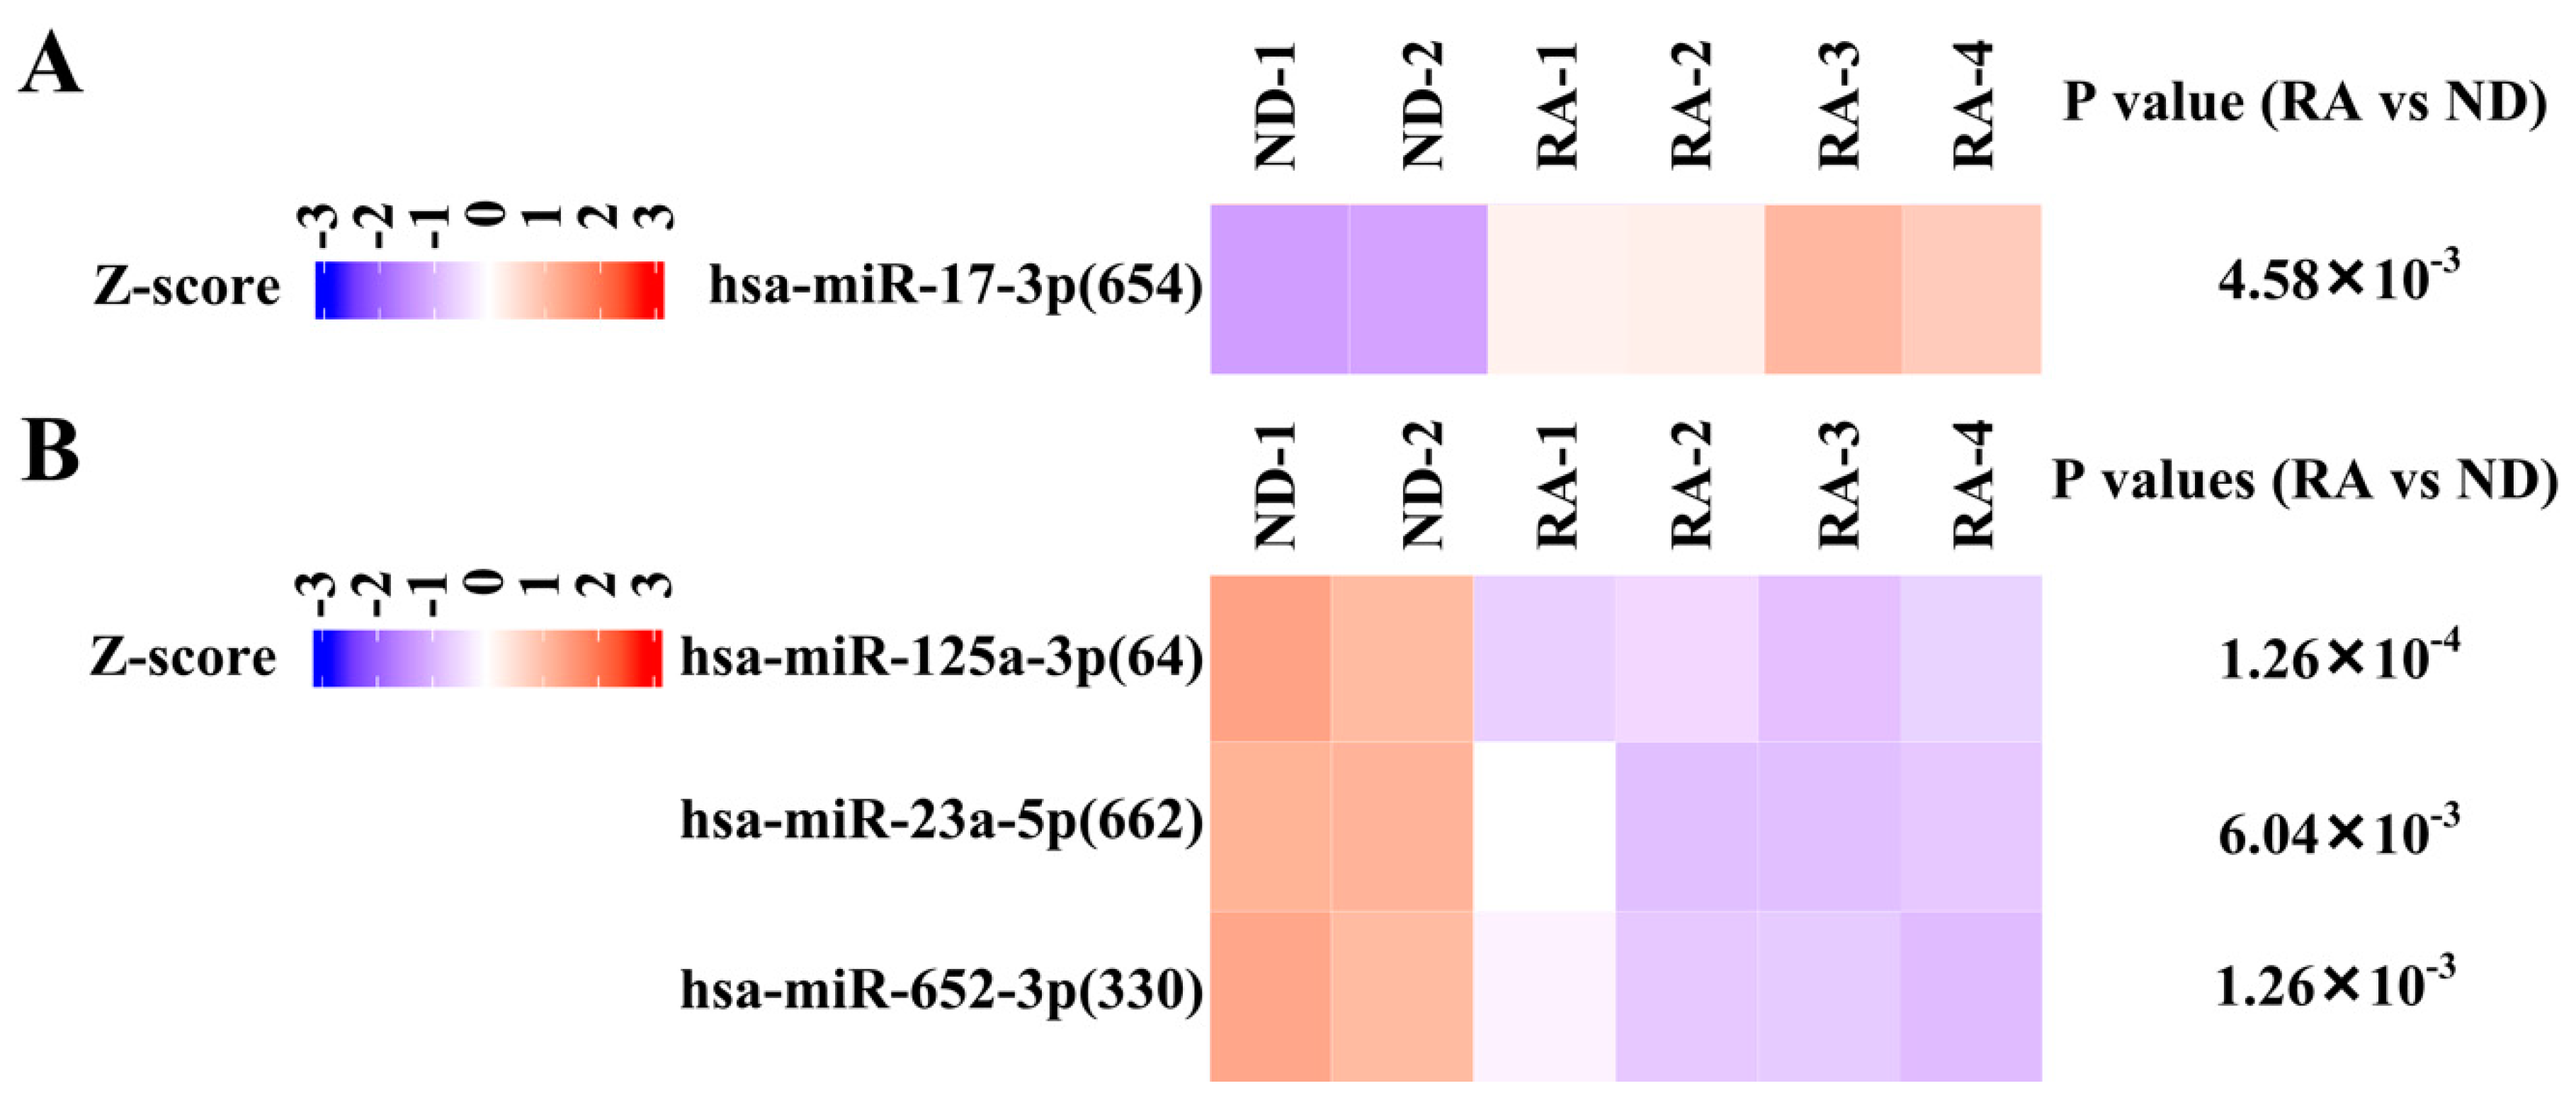
3.4. Validation of Differentially Expressed miRNA
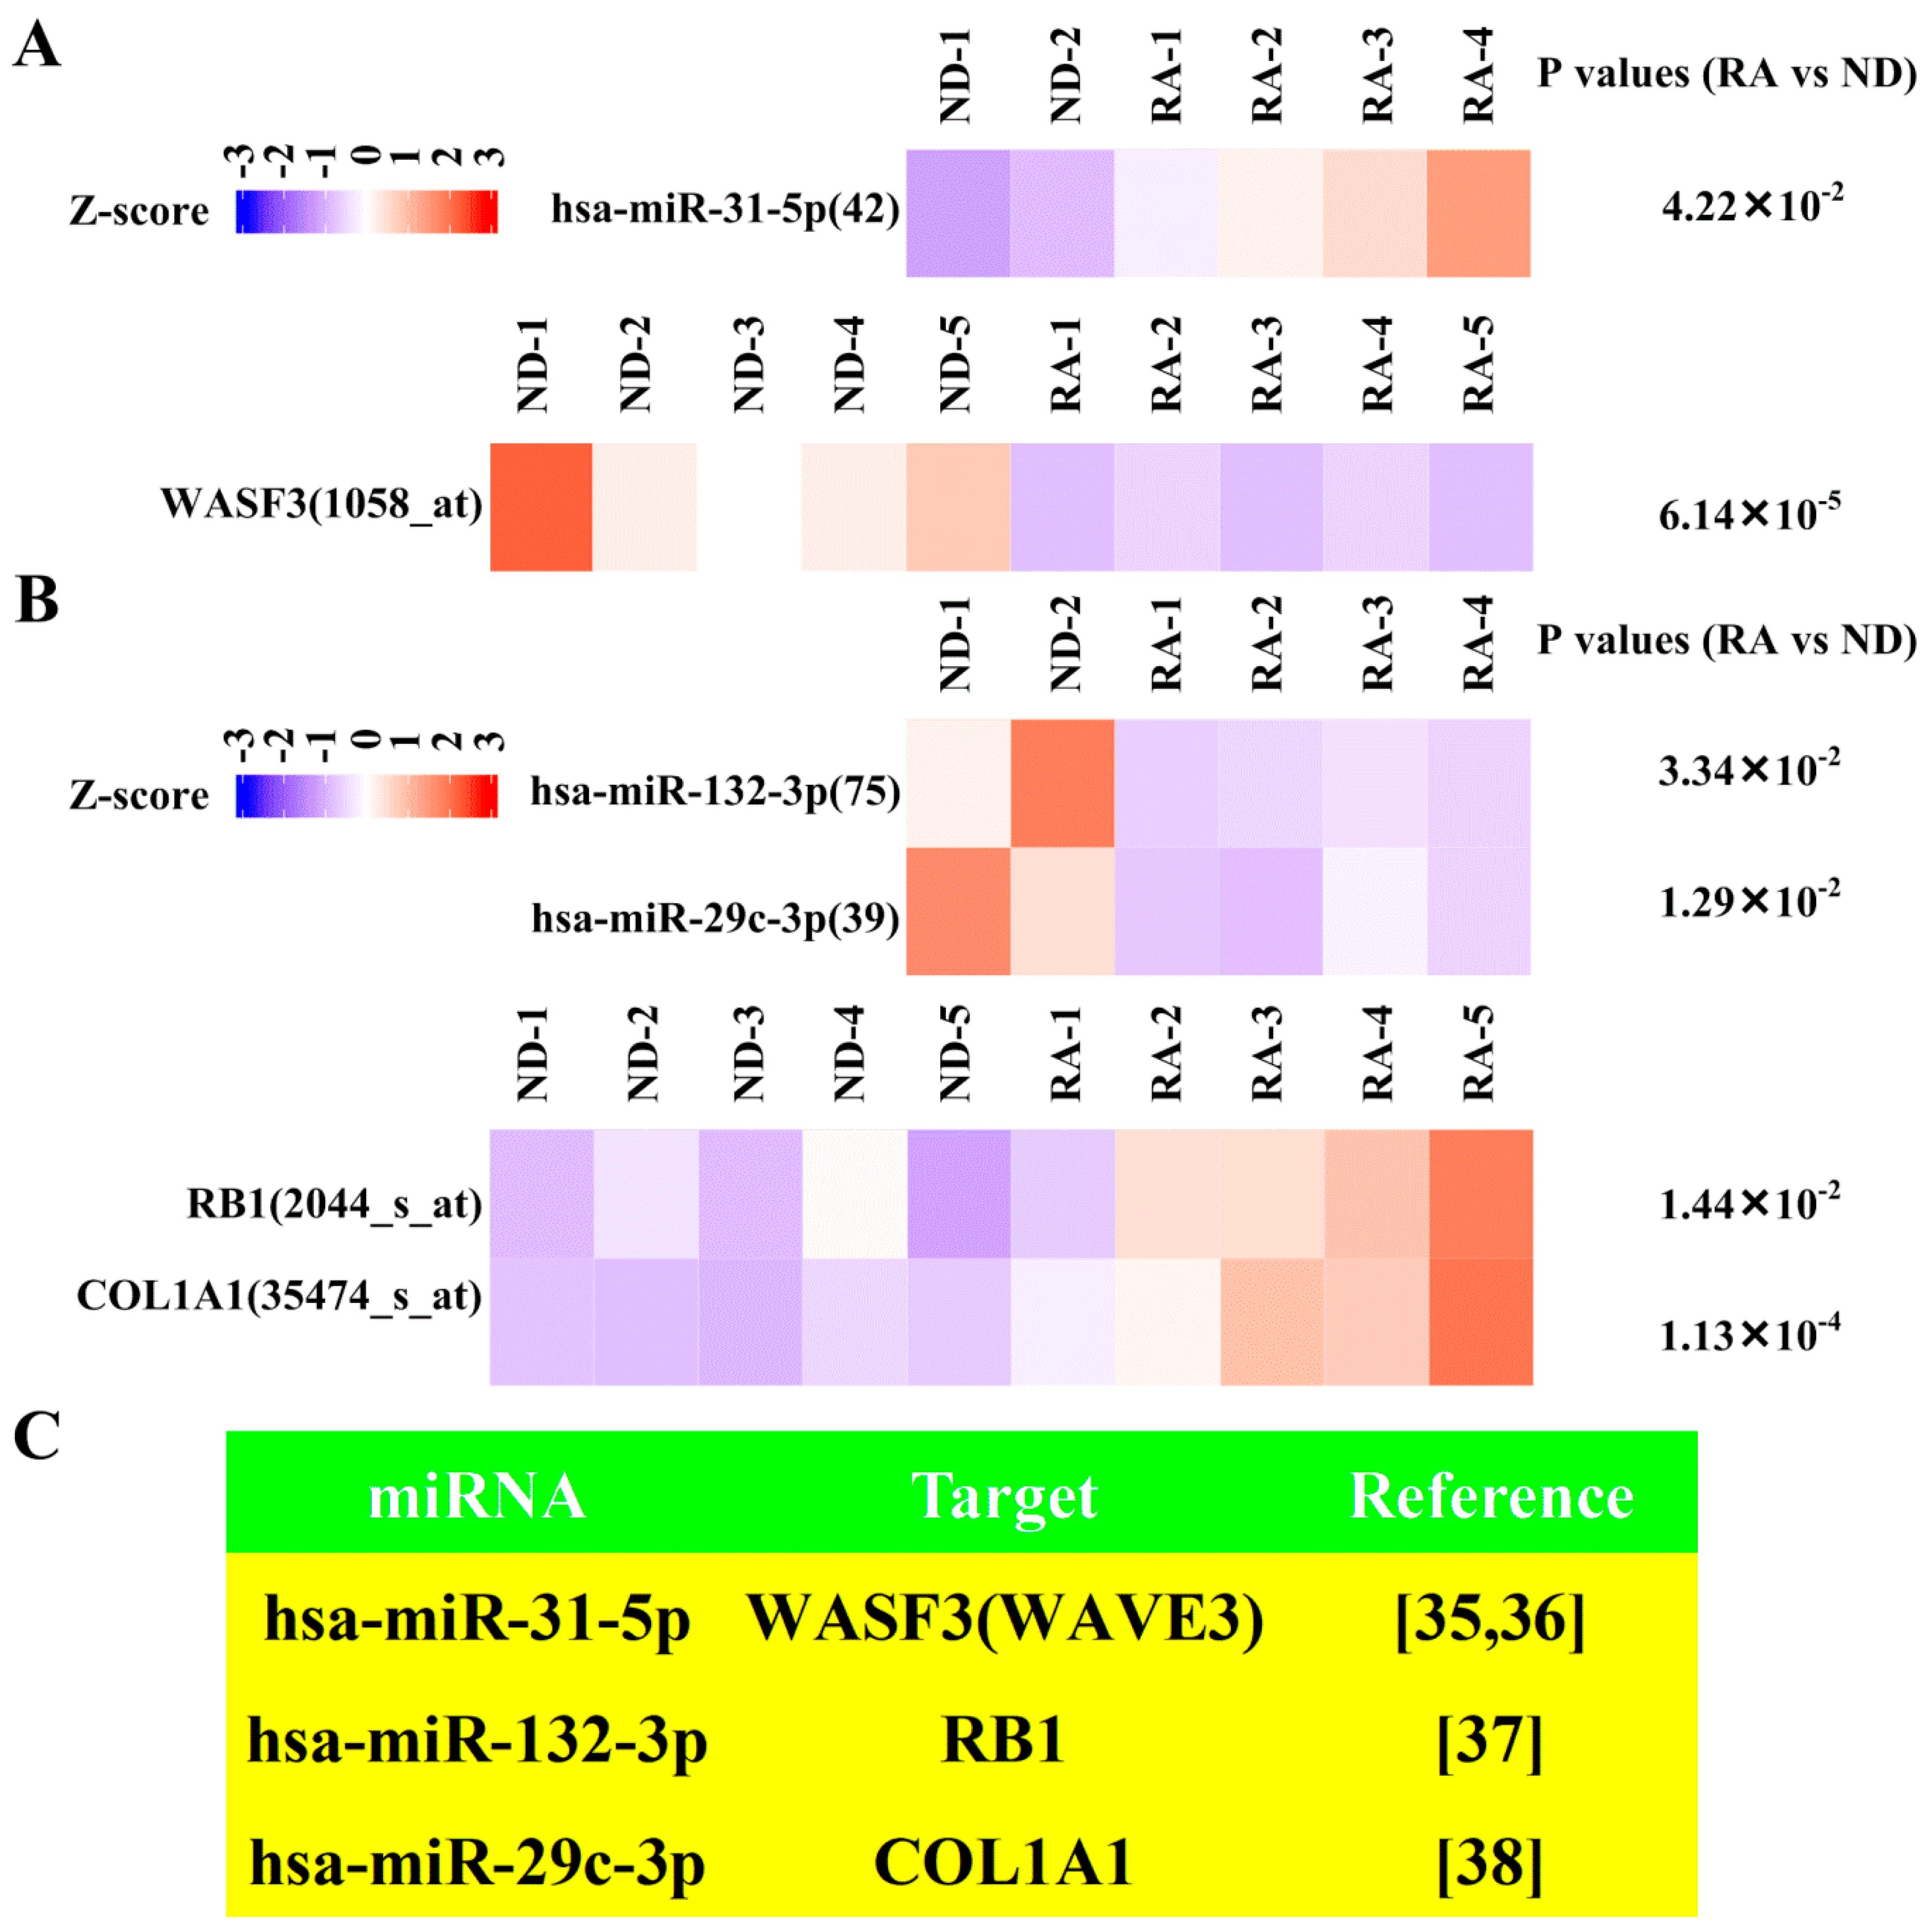
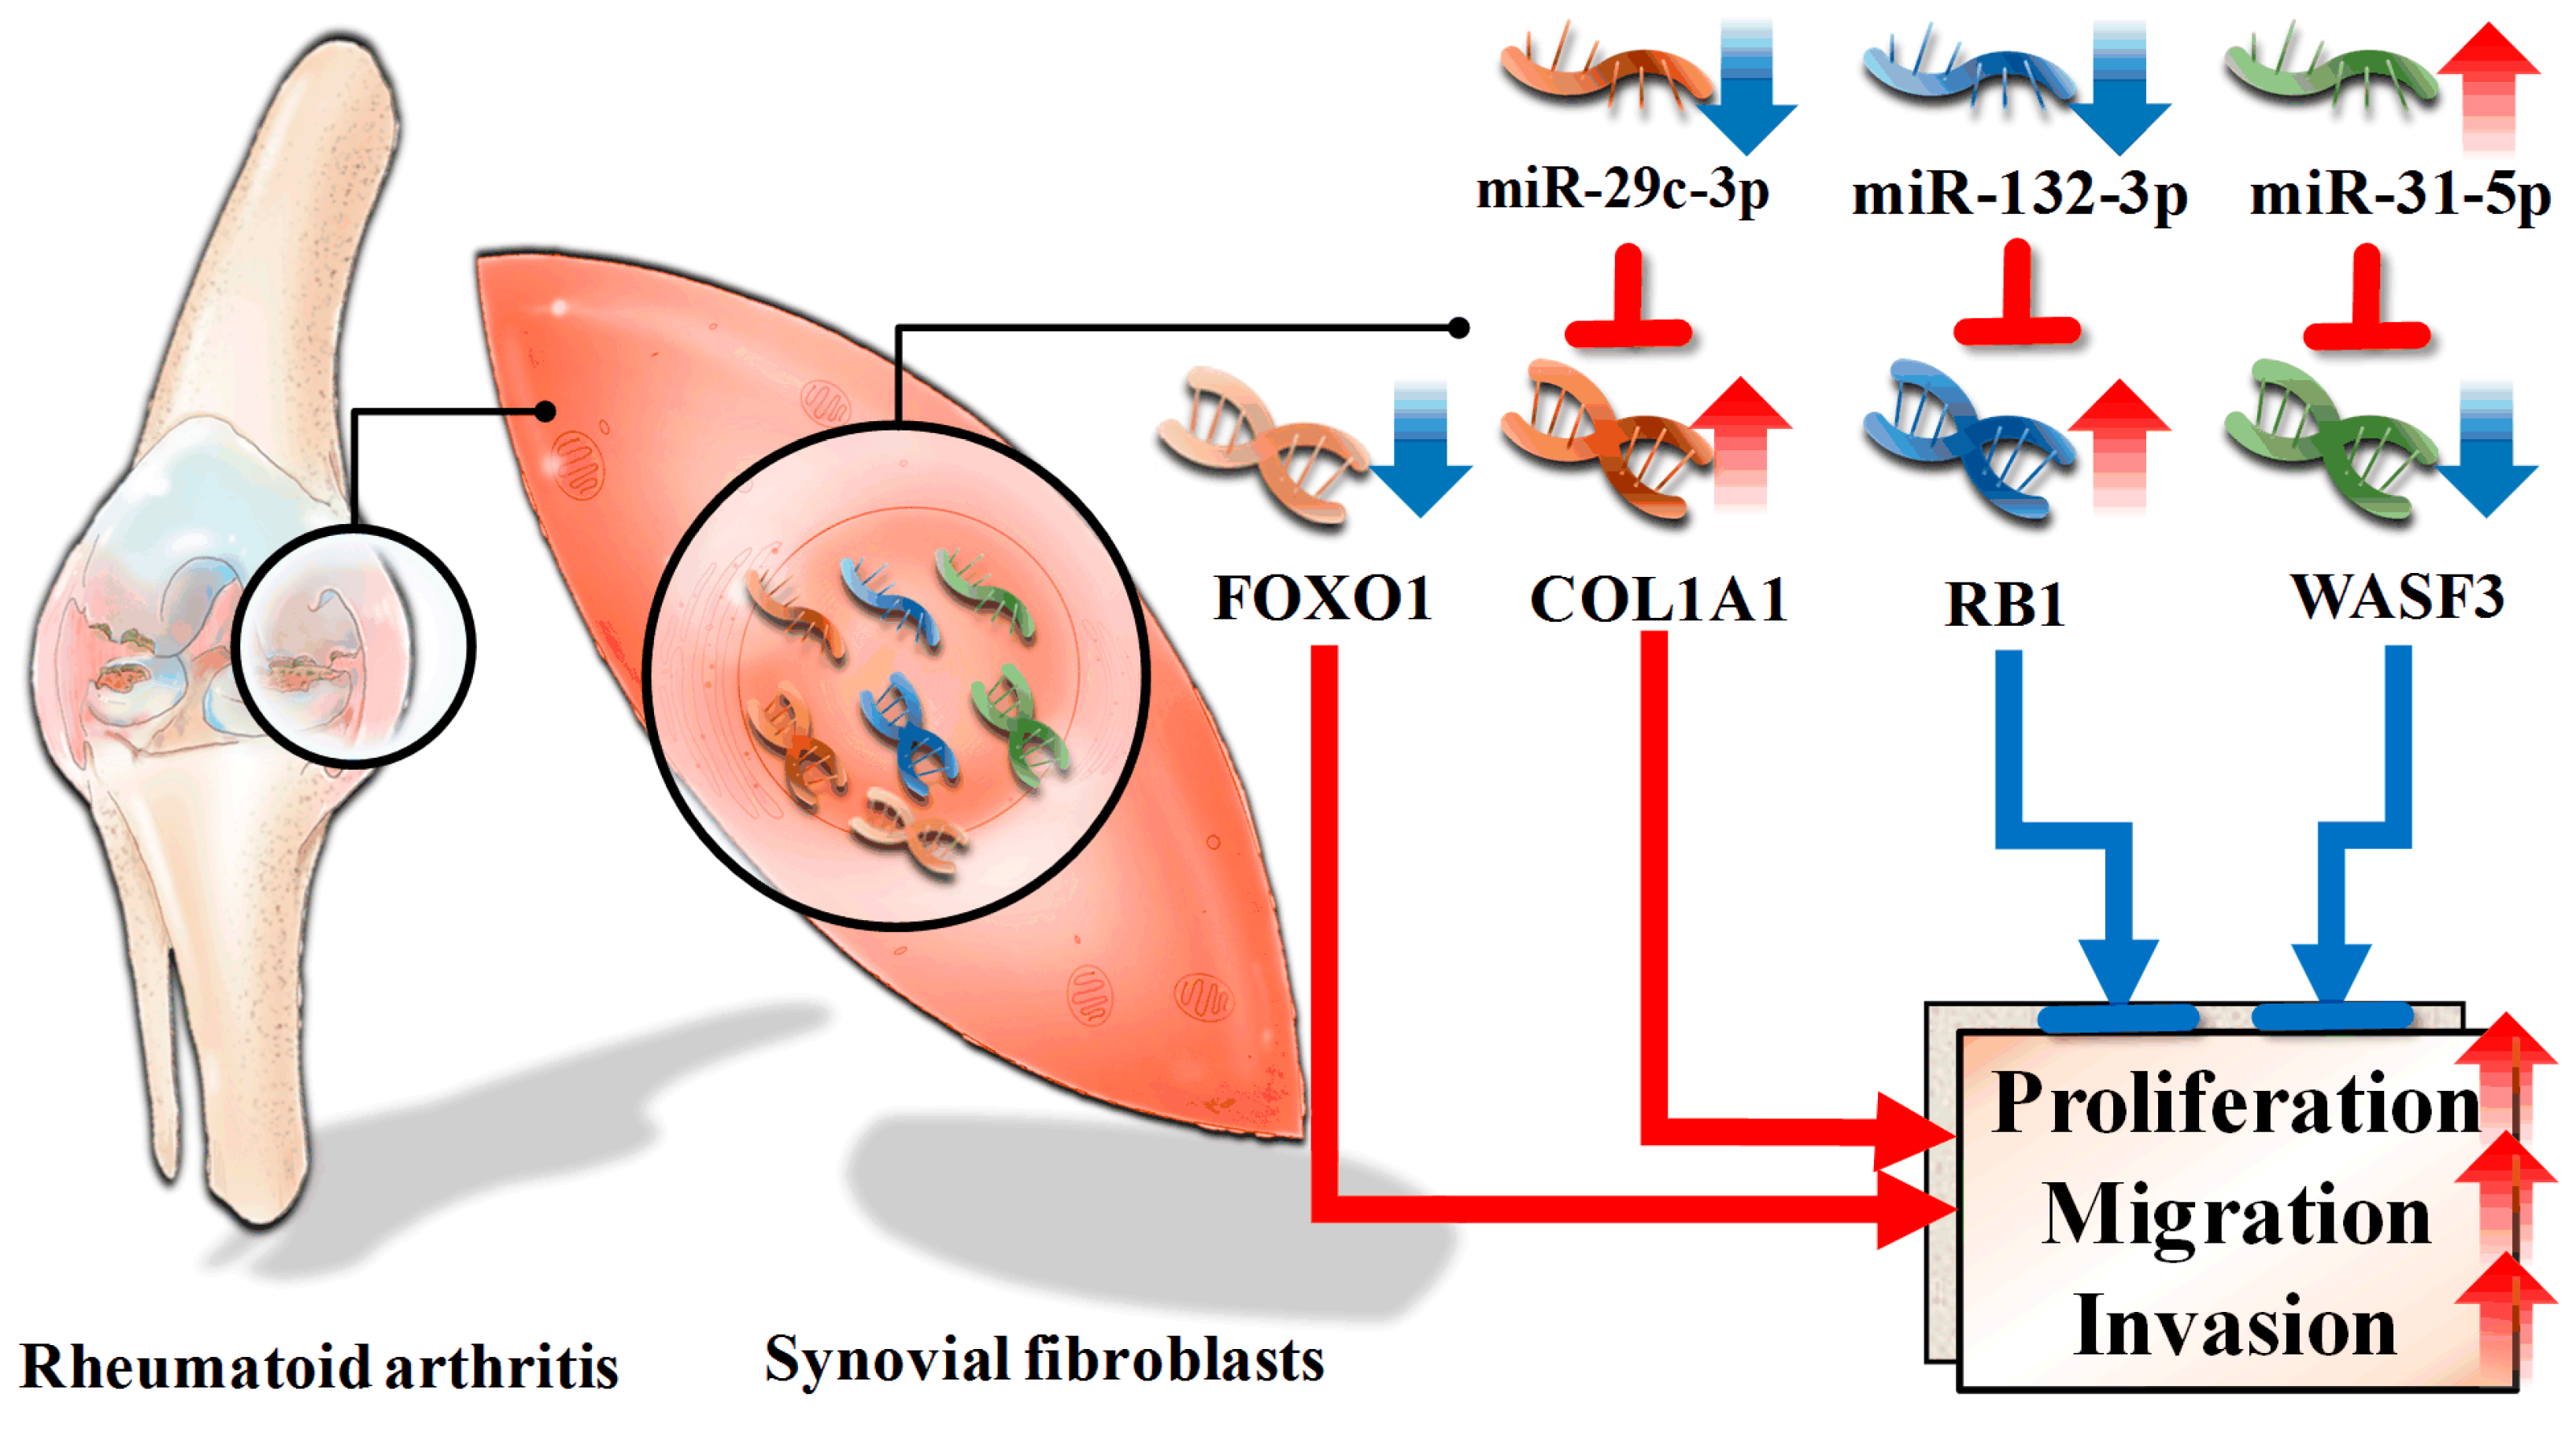
3.5. Dysregulated Targets of Validated Upregulated/Downregulated miRNA
4. Discussion
5. Conclusions
Supplementary Materials
Author Contributions
Funding
Acknowledgments
Conflicts of Interest
References
- Tonin, F.S.; Steimbach, L.M.; Leonart, L.P.; Ferreira, V.L.; Borba, H.H.; Piazza, T.; Araújo, A.G.; Fernandez-Llimos, F.; Pontarolo, R.; Wiens, A. Discontinuation of non-anti-TNF drugs for rheumatoid arthritis in interventional versus observational studies: A systematic review and meta-analysis. Eur. J. Clin. Pharmacol. 2018, 74, 1513–1521. [Google Scholar] [CrossRef] [PubMed]
- Gerlag, D.M.; Safy, M.; Maijer, K.I.; Tang, M.W.; Tas, S.W.; Starmans-Kool, M.J.F.; van Tubergen, A.; Janssen, M.; de Hair, M.; Hansson, M.; et al. Effects of B-cell directed therapy on the preclinical stage of rheumatoid arthritis: The PRAIRI study. Ann. Rheum. Dis. 2019, 78, 179–185. [Google Scholar] [CrossRef] [PubMed]
- Kearsley-Fleet, L.; Davies, R.; De Cock, D.; Watson, K.D.; Lunt, M.; Buch, M.H.; Isaacs, J.D.; Hyrich, K.L.; BSRBR-RA Contributors Group. Biologic refractory disease in rheumatoid arthritis: Results from the British Society for Rheumatology Biologics Register for Rheumatoid Arthritis. Ann. Rheum. Dis. 2018, 77, 1405–1412. [Google Scholar] [CrossRef] [PubMed]
- Feldmann, M.; Maini, R.N. Perspectives from Masters in Rheumatology and Autoimmunity: Can We Get Closer to a Cure for Rheumatoid Arthritis? Arthritis Rheumatol. 2015, 67, 2283–2291. [Google Scholar] [CrossRef] [PubMed]
- Chandrashekara, S.; Shobha, V.; Rao, V.; Desai, A.; Jois, R.; Dharmanand, B.G.; Kumar, S.; Kumar, P.; Dharmapalaiah, C.; Mahendranath, K.M.; et al. Incidence of infection other than tuberculosis in patients with autoimmune rheumatic diseases treated with bDMARDs: A real-time clinical experience from India. Rheumatol. Int. 2019, 39, 497–507. [Google Scholar] [CrossRef] [PubMed]
- Chang, S.K.; Gu, Z.; Brenner, M.B. Fibroblast-like synoviocytes in inflammatory arthritis pathology: The emerging role of cadherin-11. Immunol. Rev. 2010, 233, 256–266. [Google Scholar] [CrossRef] [PubMed]
- Stanford, S.M.; Aleman Muench, G.R.; Bartok, B.; Sacchetti, C.; Kiosses, W.B.; Sharma, J.; Maestre, M.F.; Bottini, M.; Mustelin, T.; Boyle, D.L.; et al. TGFβ responsive tyrosine phosphatase promotes rheumatoid synovial fibroblast invasiveness. Ann. Rheum. Dis. 2016, 75, 295–302. [Google Scholar] [CrossRef] [PubMed]
- Müller-Ladner, U.; Ospelt, C.; Gay, S.; Distler, O.; Pap, T. Cells of the synovium in rheumatoid arthritis. Synovial fibroblasts. Arthritis Res. Ther. 2007, 9, 223. [Google Scholar] [CrossRef]
- Caiello, I.; Minnone, G.; Holzinger, D.; Vogl, T.; Prencipe, G.; Manzo, A.; De Benedetti, F.; Strippoli, R. IL-6 amplifies TLR mediated cytokine and chemokine production: Implications for the pathogenesis of rheumatic inflammatory diseases. PLoS ONE 2014, 9, e107886. [Google Scholar] [CrossRef]
- Borisova, M.A.; Lukina, G.V.; Sigidin, Y.A.; Aronova, E.S.; Luchihina, E.L.; Karateev, D.E.; Glukhova, S.V.; Nasonov, E.L. Efficacy and tolerability of abatacept treatment: Results of 12 months observation. Ter. Arkhiv 2018, 90, 44–49. [Google Scholar] [CrossRef]
- Lai, N.S.; Yu, H.C.; Tung, C.H.; Huang, K.Y.; Huang, H.B.; Lu, M.C. Aberrant expression of interleukin-23-regulated miRNAs in T cells from patients with ankylosing spondylitis. Arthritis Res. Ther. 2018, 20, 259. [Google Scholar] [CrossRef] [PubMed]
- O’Rourke, M.; Trenkmann, M.; Connolly, M.; Fearon, U.; Murphy, C.C. Novel gene targets for miRNA146a and miRNA155 in anterior uveitis. Br. J. Ophthalmol. 2019, 103, 279–285. [Google Scholar] [CrossRef] [PubMed]
- Sato, H.; Muraoka, S.; Kusunoki, N.; Masuoka, S.; Yamada, S.; Ogasawara, H.; Imai, T.; Akasaka, Y.; Tochigi, N.; Takahashi, H.; et al. Resistin upregulates chemokine production by fibroblast-like synoviocytes from patients with rheumatoid arthritis. Arthritis Res. Ther. 2017, 19, 263. [Google Scholar] [CrossRef] [PubMed]
- Loh, C.; Park, S.H.; Lee, A.; Yuan, R.; Ivashkiv, L.B.; Kalliolias, G.D. TNF-induced inflammatory genes escape repression in fibroblast-like synoviocytes: Transcriptomic and epigenomic analysis. Ann. Rheum. Dis. 2019. [Google Scholar] [CrossRef] [PubMed]
- Sirén, J.; Välimäki, N.; Mäkinen, V. Indexing Graphs for Path Queries with Applications in Genome Research. IEEE/ACM Trans. Comput. Biol. Bioinform. 2014, 11, 375–388. [Google Scholar] [CrossRef] [PubMed]
- Trapnell, C.; Williams, B.A.; Pertea, G.; Mortazavi, A.; Kwan, G.; van Baren, M.J.; Salzberg, S.L.; Wold, B.J.; Pachter, L. Transcript assembly and quantification by RNA-Seq reveals unannotated transcripts and isoform switching during cell differentiation. Nat. Biotechnol. 2010, 28, 511–515. [Google Scholar] [CrossRef] [PubMed] [Green Version]
- Hsu, Y.L.; Hung, J.Y.; Lee, Y.L.; Chen, F.W.; Chang, K.F.; Chang, W.A.; Tsai, Y.M.; Chong, I.W.; Kuo, P.L. Identification of novel gene expression signature in lung adenocarcinoma by using next-generation sequencing data and bioinformatics analysis. Oncotarget 2017, 8, 104831–104854. [Google Scholar] [CrossRef] [Green Version]
- Ramsköld, D.; Wang, E.T.; Burge, C.B.; Sandberg, R. An abundance of ubiquitously expressed genes revealed by tissue transcriptome sequence data. PLoS Comput. Biol. 2009, 5, e1000598. [Google Scholar] [CrossRef]
- Jin, W.; Reddy, M.A.; Chen, Z.; Putta, S.; Lanting, L.; Kato, M.; Park, J.T.; Chandra, M.; Wang, C.; Tangirala, R.K.; et al. Small RNA sequencing reveals microRNAs that modulate angiotensin II effects in vascular smooth muscle cells. J. Biol. Chem. 2012, 287, 15672–15683. [Google Scholar] [CrossRef]
- Baras, A.S.; Mitchell, C.J.; Myers, J.R.; Gupta, S.; Weng, L.C.; Ashton, J.M.; Cornish, T.C.; Pandey, A.; Halushka, M.K. miRge—A Multiplexed Method of Processing Small RNA-Seq Data to Determine MicroRNA Entropy. PLoS ONE 2015, 10, e0143066. [Google Scholar] [CrossRef]
- Hamed, M.; Spaniol, C.; Nazarieh, M.; Helms, V. TFmiR: A web server for constructing and analyzing disease-specific transcription factor and miRNA co-regulatory networks. Nucleic Acids Res. 2015, 43, W283–W288. [Google Scholar] [CrossRef] [PubMed]
- Kanehisa, M.; Furumichi, M.; Tanabe, M.; Sato, Y.; Morishima, K. KEGG: New perspectives on genomes, pathways, diseases and drugs. Nucleic Acids Res. 2017, 45, D353–D361. [Google Scholar] [CrossRef] [PubMed]
- Mi, H.; Huang, X.; Muruganujan, A.; Tang, H.; Mills, C.; Kang, D.; Thomas, P.D. PANTHER version 11: Expanded annotation data from Gene Ontology and Reactome pathways, and data analysis tool enhancements. Nucleic Acids Res. 2017, 45, D183–D189. [Google Scholar] [CrossRef] [PubMed]
- Skinkyte-Juskiene, R.; Kogelman, L.J.A.; Kadarmideen, H.N. Transcription Factor Co-expression Networks of Adipose RNA-Seq Data Reveal Regulatory Mechanisms of Obesity. Curr. Genom. 2018, 19, 289–299. [Google Scholar] [CrossRef] [PubMed]
- Ungethuem, U.; Haeupl, T.; Witt, H.; Koczan, D.; Krenn, V.; Huber, H.; von Helversen, T.M.; Drungowski, M.; Seyfert, C.; Zacher, J.; et al. Molecular signatures and new candidates to target the pathogenesis of rheumatoid arthritis. Physiol. Genom. 2010, 42A, 267–282. [Google Scholar] [CrossRef] [PubMed]
- Franz, M.; Rodriguez, H.; Lopes, C.; Zuberi, K.; Montojo, J.; Bader, G.D.; Morris, Q. GeneMANIA update 2018. Nucleic Acids Res. 2018, 46, W60–W64. [Google Scholar] [CrossRef] [Green Version]
- Zhu, S.; Pan, W.; Song, X.; Liu, Y.; Shao, X.; Tang, Y.; Liang, D.; He, D.; Wang, H.; Liu, W.; et al. The microRNA miR-23b suppresses IL-17-associated autoimmune inflammation by targeting TAB2, TAB3 and IKK-α. Nat. Med. 2012, 18, 1077–1086. [Google Scholar] [CrossRef]
- Chou, C.H.; Shrestha, S.; Yang, C.D.; Chang, N.W.; Lin, Y.L.; Liao, K.W.; Huang, W.C.; Sun, T.H.; Tu, S.J.; Lee, W.H.; et al. miRTarBase update 2018: A resource for experimentally validated microRNA-target interactions. Nucleic Acids Res. 2018, 46, D296–D302. [Google Scholar] [CrossRef]
- Barrett, T.; Wilhite, S.E.; Ledoux, P.; Evangelista, C.; Kim, I.F.; Tomashevsky, M.; Marshall, K.A.; Phillippy, K.H.; Sherman, P.M.; Holko, M.; et al. NCBI GEO: Archive for functional genomics data sets--update. Nucleic Acids Res. 2013, 41, D991–D995. [Google Scholar] [CrossRef]
- Phan, L.M.; Yeung, S.C.; Lee, M.H. Cancer metabolic reprogramming: Importance, main features, and potentials for precise targeted anti-cancer therapies. Cancer Biol. Med. 2014, 11, 1–19. [Google Scholar]
- Davis, L.S. A question of transformation: The synovial fibroblast in rheumatoid arthritis. Am. J. Pathol. 2003, 162, 1399–1402. [Google Scholar] [CrossRef]
- Li, X.F.; Sun, Y.Y.; Bao, J.; Chen, X.; Li, Y.H.; Yang, Y.; Zhang, L.; Huang, C.; Wu, B.M.; Meng, X.M.; et al. Functional role of PPAR-γ on the proliferation and migration of fibroblast-like synoviocytes in rheumatoid arthritis. Sci. Rep. 2017, 7, 12671. [Google Scholar] [CrossRef]
- Seemayer, C.A.; Kuchen, S.; Neidhart, M.; Kuenzler, P.; Rihosková, V.; Neumann, E.; Pruschy, M.; Aicher, W.K.; Müller-Ladner, U.; Gay, R.E.; et al. p53 in rheumatoid arthritis synovial fibroblasts at sites of invasion. Ann. Rheum. Dis. 2003, 62, 1139–1144. [Google Scholar] [CrossRef] [Green Version]
- Gang, X.; Xu, H.; Si, L.; Zhu, X.; Yu, T.; Jiang, Z.; Wang, Y. Treatment effect of CDKN1A on rheumatoid arthritis by mediating proliferation and invasion of fibroblast-like synoviocytes cells. Clin. Exp. Immunol. 2018, 194, 220–230. [Google Scholar] [CrossRef] [Green Version]
- Sossey-Alaoui, K.; Downs-Kelly, E.; Das, M.; Izem, L.; Tubbs, R.; Plow, E.F. WAVE3, an actin remodeling protein, is regulated by the metastasis suppressor microRNA, miR-31, during the invasion-metastasis cascade. Int. J. Cancer 2011, 129, 1331–1343. [Google Scholar] [CrossRef]
- Teng, Y.; Ren, M.Q.; Cheney, R.; Sharma, S.; Cowell, J.K. Inactivation of the WASF3 gene in prostate cancer cells leads to suppression of tumorigenicity and metastases. Br. J. Cancer 2010, 103, 1066–1075. [Google Scholar] [CrossRef] [Green Version]
- Park, J.K.; Henry, J.C.; Jiang, J.; Esau, C.; Gusev, Y.; Lerner, M.R.; Postier, R.G.; Brackett, D.J.; Schmittgen, T.D. miR-132 and miR-212 are increased in pancreatic cancer and target the retinoblastoma tumor suppressor. Biochem. Biophys. Res. Commun. 2011, 406, 518–523. [Google Scholar] [CrossRef] [Green Version]
- Sengupta, S.; den Boon, J.A.; Chen, I.H.; Newton, M.A.; Stanhope, S.A.; Cheng, Y.J.; Chen, C.J.; Hildesheim, A.; Sugden, B.; Ahlquist, P. MicroRNA 29c is down-regulated in nasopharyngeal carcinomas, up-regulating mRNAs encoding extracellular matrix proteins. Proc. Natl. Acad. Sci. USA 2008, 105, 5874–5878. [Google Scholar] [CrossRef] [Green Version]
- Huber, L.C.; Distler, O.; Tarner, I.; Gay, R.E.; Gay, S.; Pap, T. Synovial fibroblasts: Key players in rheumatoid arthritis. Rheumatology 2006, 45, 669–675. [Google Scholar] [CrossRef]
- Pap, T.; Müller-Ladner, U.; Gay, R.E.; Gay, S. Fibroblast biology. Role of synovial fibroblasts in the pathogenesis of rheumatoid arthritis. Arthritis Res. 2000, 2, 361–367. [Google Scholar] [CrossRef]
- Di Marco, M.; Ramassone, A.; Pagotto, S.; Anastasiadou, E.; Veronese, A.; Visone, R. MicroRNAs in Autoimmunity and Hematological Malignancies. Int. J. Mol. Sci. 2018, 19, 3139. [Google Scholar] [CrossRef]
- Kristen, A.V.; Ajroud-Driss, S.; Conceição, I.; Gorevic, P.; Kyriakides, T.; Obici, L. Patisiran, an RNAi therapeutic for the treatment of hereditary transthyretin-mediated amyloidosis. Neurodegener. Dis. Manag. 2019, 9, 5–23. [Google Scholar] [CrossRef] [Green Version]
- Wu, J.; Fan, W.; Ma, L.; Geng, X. miR-708-5p promotes fibroblast-like synoviocytes’ cell apoptosis and ameliorates rheumatoid arthritis by the inhibition of Wnt3a/β-catenin pathway. Drug. Des. Devel. Ther. 2018, 12, 3439–3447. [Google Scholar] [CrossRef]
- Shi, M.; Wang, J.; Xiao, Y.; Wang, C.; Qiu, Q.; Lao, M.; Yu, Y.; Li, Z.; Zhang, H.; Ye, Y.; et al. Glycogen Metabolism and Rheumatoid Arthritis: The Role of Glycogen Synthase 1 in Regulation of Synovial Inflammation via Blocking AMP-Activated Protein Kinase Activation. Front. Immunol. 2018, 9, 1714. [Google Scholar] [CrossRef]
- Bustamante, M.F.; Oliveira, P.G.; Garcia-Carbonell, R.; Croft, A.P.; Smith, J.M.; Serrano, R.L.; Sanchez-Lopez, E.; Liu, X.; Kisseleva, T.; Hay, N.; et al. Hexokinase 2 as a novel selective metabolic target for rheumatoid arthritis. Ann. Rheum. Dis. 2018, 77, 1636–1643. [Google Scholar] [CrossRef]
- Wang, H.; Li, T.; Chen, S.; Gu, Y.; Ye, S. Neutrophil Extracellular Trap Mitochondrial DNA and Its Autoantibody in Systemic Lupus Erythematosus and a Proof-of-Concept Trial of Metformin. Arthritis Rheumatol. 2015, 67, 3190–3200. [Google Scholar] [CrossRef] [Green Version]
- Grabiec, A.M.; Angiolilli, C.; Hartkamp, L.M.; van Baarsen, L.G.; Tak, P.P.; Reedquist, K.A. JNK-dependent downregulation of FoxO1 is required to promote the survival of fibroblast-like synoviocytes in rheumatoid arthritis. Ann. Rheum. Dis. 2015, 74, 1763–1771. [Google Scholar] [CrossRef]
- Wang, M.; Yu, W.; Gao, J.; Ma, W.; Frentsch, M.; Thiel, A.; Liu, M.; Rahman, N.; Qin, Z.; Li, X. MicroRNA-487a-3p functions as a new tumor suppressor in prostate cancer by targeting CCND1. J. Cell. Physiol. 2019. [Google Scholar] [CrossRef]
- Fang, H.; Jin, J.; Huang, D.; Yang, F.; Guan, X. PAI-1 induces Src inhibitor resistance via CCL5 in HER2-positive breast cancer cells. Cancer Sci. 2018, 109, 1949–1957. [Google Scholar] [CrossRef] [Green Version]
- Humphries, B.A.; Buschhaus, J.M.; Chen, Y.C.; Haley, H.R.; Qyli, T.; Chiang, B.; Shen, N.; Rajendran, S.; Cutter, A.; Cheng, Y.H.; et al. Plasminogen Activator Inhibitor 1 (PAI1) Promotes Actin Cytoskeleton Reorganization and Glycolytic Metabolism in Triple-Negative Breast Cancer. Mol. Cancer Res. 2019, 17, 1142–1154. [Google Scholar] [CrossRef]
- Guo, H.; Wang, F.; Diao, Y.; Zhang, Z.; Chen, Q.; Qian, C.N.; Keller, E.T.; Zhang, J.; Lu, Y. Knockdown of Notch1 inhibits nasopharyngeal carcinoma cell growth and metastasis via downregulation of CCL2, CXCL16, and uPA. Mol. Carcinog. 2019. [Google Scholar] [CrossRef]
- Yu, Y.; Zhao, L.; Li, R. Medium-chain acyl-CoA dehydrogenase enhances invasion and metastasis ability of breast cancer cells. Nan Fang Yi Ke Da Xue Xue Bao 2019, 39, 650–656. [Google Scholar]
- Xue, W.; Chen, J.; Liu, X.; Gong, W.; Zheng, J.; Guo, X.; Liu, Y.; Liu, L.; Ma, J.; Wang, P.; et al. PVT1 regulates the malignant behaviors of human glioma cells by targeting miR-190a-5p and miR-488-3p. Biochim. Biophys. Acta Mol. Basis Dis. 2018, 1864, 1783–1794. [Google Scholar] [CrossRef]
- Tian, Z.; Cao, S.; Li, C.; Xu, M.; Wei, H.; Yang, H.; Sun, Q.; Ren, Q.; Zhang, L. LncRNA PVT1 regulates growth, migration, and invasion of bladder cancer by miR-31/ CDK1. J. Cell Physiol. 2019, 234, 4799–4811. [Google Scholar] [CrossRef]
- Shi, Y.; Zhao, Y.; Zhang, Y.; AiErken, N.; Shao, N.; Ye, R.; Lin, Y.; Wang, S. TNNT1 facilitates proliferation of breast cancer cells by promoting G1/S phase transition. Life Sci. 2018, 208, 161–166. [Google Scholar] [CrossRef]
- Kuroda, T.; Yasuda, S.; Nakashima, H.; Takada, N.; Matsuyama, S.; Kusakawa, S.; Umezawa, A.; Matsuyama, A.; Kawamata, S.; Sato, Y. Identification of a Gene Encoding Slow Skeletal Muscle Troponin T as a Novel Marker for Immortalization of Retinal Pigment Epithelial Cells. Sci. Rep. 2017, 7, 8163. [Google Scholar] [CrossRef]
- Gu, J.; Liu, X.; Li, J.; He, Y. MicroRNA-144 inhibits cell proliferation, migration and invasion in human hepatocellular carcinoma by targeting CCNB1. Cancer Cell Int. 2019, 19, 15. [Google Scholar] [CrossRef] [Green Version]
- Kojima, Y.; Kondo, Y.; Fujishita, T.; Mishiro-Sato, E.; Kajino-Sakamoto, R.; Taketo, M.M.; Aoki, M. Stromal iodothyronine deiodinase 2 (DIO2) promotes the growth of intestinal tumors in ApcΔ716 mutant mice. Cancer Sci. 2019, 110, 2520–2528. [Google Scholar]
- Steffan, J.J.; Dykes, S.S.; Coleman, D.T.; Adams, L.K.; Rogers, D.; Carroll, J.L.; Williams, B.J.; Cardelli, J.A. Supporting a role for the GTPase Rab7 in prostate cancer progression. PLoS ONE 2014, 9, e87882. [Google Scholar] [CrossRef]
- Teplyuk, N.M.; Galindo, M.; Teplyuk, V.; Pratap, J.; Young, D.W.; Lapointe, D.; Javed, A.; Stein, J.L.; Lian, J.B.; Stein, G.S.; et al. Runx2 regulates G protein-coupled signaling pathways to control growth of osteoblast progenitors. J. Biol. Chem. 2008, 283, 27585–27597. [Google Scholar] [CrossRef]
- Ramer, R.; Bublitz, K.; Freimuth, N.; Merkord, J.; Rohde, H.; Haustein, M.; Borchert, P.; Schmuhl, E.; Linnebacher, M.; Hinz, B. Cannabidiol inhibits lung cancer cell invasion and metastasis via intercellular adhesion molecule-1. FASEB J. 2012, 26, 1535–1548. [Google Scholar] [CrossRef]
- Yang, D.; Zhang, W.; Liang, J.; Ma, K.; Chen, P.; Lu, D.; Hao, W. Single cell whole genome sequencing reveals that NFKB1 mutation affects radiotherapy sensitivity in cervical cancer. Oncotarget 2017, 9, 7332–7340. [Google Scholar] [CrossRef] [Green Version]
- Zhu, G.; Zhou, L.; Liu, H.; Shan, Y.; Zhang, X. MicroRNA-224 Promotes Pancreatic Cancer Cell Proliferation and Migration by Targeting the TXNIP-Mediated HIF1α Pathway. Cell Physiol. Biochem. 2018, 48, 1735–1746. [Google Scholar] [CrossRef]
- Jiao, D.; Huan, Y.; Zheng, J.; Wei, M.; Zheng, G.; Han, D.; Wu, J.; Xi, W.; Wei, F.; Yang, A.G.; et al. UHRF1 promotes renal cell carcinoma progression through epigenetic regulation of TXNIP. Oncogene 2019, 38, 5686–5699. [Google Scholar] [CrossRef]
- Wang, P.; Zhang, Y.; Zhang, J.; Jiang, J.; Jin, F.; Sun, Z. IL-23 concentration-dependently regulates T24 cell proliferation, migration and invasion and is associated with prognosis in patients with bladder cancer. Oncol. Rep. 2018, 40, 3685–3693. [Google Scholar] [CrossRef]
- Sumitomo, M.; Shen, R.; Nanus, D.M. Involvement of neutral endopeptidase in neoplastic progression. Biochim. Biophys. Acta. 2005, 1751, 52–59. [Google Scholar] [CrossRef]
- Li, W.; Jiang, Z.; Xiao, X.; Wang, Z.; Wu, Z.; Ma, Q.; Cao, L. Curcumin inhibits superoxide dismutase-induced epithelial-to-mesenchymal transition via the PI3K/Akt/NF-κB pathway in pancreatic cancer cells. Int. J. Oncol. 2018, 52, 1593–1602. [Google Scholar] [CrossRef]
- Tornovsky-Babeay, S.; Dadon, D.; Ziv, O.; Tzipilevich, E.; Kadosh, T.; Schyr-Ben Haroush, R.; Hija, A.; Stolovich-Rain, M.; Furth-Lavi, J.; Granot, Z.; et al. Type 2 diabetes and congenital hyperinsulinism cause DNA double-strand breaks and p53 activity in β cells. Cell Metab. 2014, 19, 109–121. [Google Scholar] [CrossRef]
- Wu, Y.; Song, T.; Liu, M.; He, Q.; Chen, L.; Liu, Y.; Ni, D.; Liu, J.; Hu, Y.; Gu, Y.; et al. PPARG Negatively Modulates Six2 in Tumor Formation of Clear Cell Renal Cell Carcinoma. DNA Cell Biol. 2019, 38, 700–707. [Google Scholar] [CrossRef]
- Tu, S.; Zhang, X.L.; Wan, H.F.; Xia, Y.Q.; Liu, Z.Q.; Yang, X.H.; Wan, F.S. Effect of taurine on cell proliferation and apoptosis human lung cancer A549 cells. Oncol. Lett. 2018, 15, 5473–5480. [Google Scholar] [CrossRef] [Green Version]
- Xie, H.; Huang, H.; Huang, W.; Xie, Z.; Yang, Y.; Wang, F. LncRNA miR143HG suppresses bladder cancer development through inactivating Wnt/β-catenin pathway by modulating miR-1275/AXIN2 axis. J. Cell. Physiol. 2019, 234, 11156–11164. [Google Scholar] [CrossRef]
- Bi, J.; Liu, H.; Cai, Z.; Dong, W.; Jiang, N.; Yang, M.; Huang, J.; Lin, T. Circ-BPTF promotes bladder cancer progression and recurrence through the miR-31-5p/RAB27A axis. Aging 2018, 10, 1964–1976. [Google Scholar] [CrossRef]
- Hashemi, Z.S.; Moghadam, M.F.; Farokhimanesh, S.; Rajabibazl, M.; Sadroddiny, E. Inhibition of breast cancer metastasis by co-transfection of miR-31/193b-mimics. Iran. J. Basic Med. Sci. 2018, 21, 427–433. [Google Scholar]
- Henry, T.J.; Chng, W.J.; Carpten, J.; Bergsagel, P.L.; Fonseca, R. RB1 Haploinsufficiency Confers a Proliferation Advantage in Myeloma Cell Lines. Blood 2007, 110, 2489. [Google Scholar]
- Nishikawa, R.; Chiyomaru, T.; Enokida, H.; Inoguchi, S.; Ishihara, T.; Matsushita, R.; Goto, Y.; Fukumoto, I.; Nakagawa, M.; Seki, N. Tumour-suppressive microRNA-29s directly regulate LOXL2 expression and inhibit cancer cell migration and invasion in renal cell carcinoma. FEBS Lett. 2015, 589, 2136–2145. [Google Scholar] [CrossRef]
- Zhang, Z.; Fang, C.; Wang, Y.; Zhang, J.; Yu, J.; Zhang, Y.; Wang, X.; Zhong, J. COL1A1: A potential therapeutic target for colorectal cancer expressing wild-type or mutant KRAS. Int. J. Oncol. 2018, 53, 1869–1880. [Google Scholar] [CrossRef] [Green Version]
- Liu, J.; Shen, J.X.; Wu, H.T.; Li, X.L.; Wen, X.F.; Du, C.W.; Zhang, G.J. Collagen 1A1 (COL1A1) promotes metastasis of breast cancer and is a potential therapeutic target. Discov. Med. 2018, 25, 211–223. [Google Scholar]
- Mnjoyan, Z.H.; Dutta, R.; Zhang, D.; Teng, B.B.; Fujise, K. Paradoxical upregulation of tumor suppressor protein p53 in serum-stimulated vascular smooth muscle cells: A novel negative-feedback regulatory mechanism. Circulation 2003, 108, 464–471. [Google Scholar] [CrossRef]
- Chen, L.; Al-Mossawi, M.H.; Ridley, A.; Sekine, T.; Hammitzsch, A.; de Wit, J.; Simone, D.; Shi, H.; Penkava, F.; Kurowska-Stolarska, M.; et al. miR-10b-5p is a novel Th17 regulator present in Th17 cells from ankylosing spondylitis. Ann. Rheum. Dis. 2017, 76, 620–625. [Google Scholar] [CrossRef]
- Haffner, M.C.; Petridou, B.; Peyrat, J.P.; Révillion, F.; Müller-Holzner, E.; Daxenbichler, G.; Marth, C.; Doppler, W. Favorable prognostic value of SOCS2 and IGF-I in breast cancer. BMC Cancer 2007, 7, 136. [Google Scholar] [CrossRef]
- Del Rey, M.J.; Usategui, A.; Izquierdo, E.; Cañete, J.D.; Blanco, F.J.; Criado, G.; Pablos, J.L. Transcriptome analysis reveals specific changes in osteoarthritis synovial fibroblasts. Ann. Rheum. Dis. 2012, 71, 275–280. [Google Scholar] [CrossRef]
- Yin, J.H.; Liu, C.S.; Yu, A.P.; Yao, J.Q.; Shen, Y.J.; Cao, J.P. Pro-Angiogenic Activity of Monocytic-Type Myeloid-Derived Suppressor Cells from Balb/C Mice Infected with Echinococcus Granulosus and the Regulatory Role of miRNAs. Cell. Physiol. Biochem. 2018, 51, 1207–1220. [Google Scholar] [CrossRef]
- Ren, H.; Yu, X.; Shen, G.; Zhang, Z.; Shang, Q.; Zhao, W.; Huang, J.; Yu, P.; Zhan, M.; Lu, Y.; et al. miRNA-seq analysis of human vertebrae provides insight into the mechanism underlying GIOP. Bone 2019, 120, 371–386. [Google Scholar] [CrossRef]


© 2019 by the authors. Licensee MDPI, Basel, Switzerland. This article is an open access article distributed under the terms and conditions of the Creative Commons Attribution (CC BY) license (http://creativecommons.org/licenses/by/4.0/).
Share and Cite
Tseng, C.-C.; Wu, L.-Y.; Tsai, W.-C.; Ou, T.-T.; Wu, C.-C.; Sung, W.-Y.; Kuo, P.-L.; Yen, J.-H. Differential Expression Profiles of the Transcriptome and miRNA Interactome in Synovial Fibroblasts of Rheumatoid Arthritis Revealed by Next Generation Sequencing. Diagnostics 2019, 9, 98. https://0-doi-org.brum.beds.ac.uk/10.3390/diagnostics9030098
Tseng C-C, Wu L-Y, Tsai W-C, Ou T-T, Wu C-C, Sung W-Y, Kuo P-L, Yen J-H. Differential Expression Profiles of the Transcriptome and miRNA Interactome in Synovial Fibroblasts of Rheumatoid Arthritis Revealed by Next Generation Sequencing. Diagnostics. 2019; 9(3):98. https://0-doi-org.brum.beds.ac.uk/10.3390/diagnostics9030098
Chicago/Turabian StyleTseng, Chia-Chun, Ling-Yu Wu, Wen-Chan Tsai, Tsan-Teng Ou, Cheng-Chin Wu, Wan-Yu Sung, Po-Lin Kuo, and Jeng-Hsien Yen. 2019. "Differential Expression Profiles of the Transcriptome and miRNA Interactome in Synovial Fibroblasts of Rheumatoid Arthritis Revealed by Next Generation Sequencing" Diagnostics 9, no. 3: 98. https://0-doi-org.brum.beds.ac.uk/10.3390/diagnostics9030098