Article

Avoiding the Great Filter: Predicting the Timeline for Humanity to Reach Kardashev Type I Civilization

1
Jet Propulsion Laboratory, California Institute of Technology, Pasadena, CA 91109, USA
2
Department of Astronomy, Beijing Normal University, Beijing 100875, China
3
Chevron Energy Technology Company, Houston, TX 77002, USA
4
Vivekananda Mission High School, Panskura 721139, India
5
Faculty of International and Political Studies, Jagiellonian University, Golebia 24, 31-007 Krakow, Poland
6
Damien High School, La Verne, CA 91750, USA
*
Author to whom correspondence should be addressed.
Retired.
Submission received: 20 March 2022 / Revised: 5 May 2022 / Accepted: 7 May 2022 / Published: 12 May 2022

Abstract

:
The level of technological development of any civilization can be gauged in large part by the amount of energy it produces for its use, but also encompasses that civilization’s stewardship of its home world. Following the Kardashev definition, a Type I civilization is able to store and use all the energy available on its planet. In this study, we develop a model based on Carl Sagan’s K formula, and use this model to analyze the consumption and energy supply of the three most important energy sources: fossil fuels (e.g., coal, oil, natural gas, crude, NGL, and feedstocks), nuclear energy, and renewable energy. We also consider environmental limitations suggested by the United Nations Framework Convention on Climate Change, the International Energy Agency, and those specific to our calculations, to predict when humanity will reach the level of a Kardashev Scale Type I civilization. Our findings suggest that the best estimate for our civilization to attain Type I status is within the common calendar year range of 2333 to 2404.

1. Introduction

1.1. The Definition and Classification of Kardashev Scale

As a method to measure and classify the technological advancement of a civilization, Soviet astronomer Nikola Kardashev conceived of the Kardashev Scale in 1964 [1]. In its early formulation, the Kardashev Scale was based on the overall consumption of energy (assumed equal to the total energy supply) of a given civilization. Kardashev defined three distinct types of civilizations.
A Type I civilization is referred to as a “planetary civilization”. Characterized as having a power consumption of 10 16   W (Watts) [1,2], a civilization of Type I has harnessed for its use all major forms of energy available from its home planet (for example human civilization and the Earth). Of course, this also includes the energy received by the home world from its parent star. Planetary energy sources humanity can tap include fossil and bio-derived fuels, nuclear energy, wind, solar, geothermal, and tidal, among others.
A Type II civilization, also referred to as a “stellar civilization”, consumes 10 26   W [2]. To achieve a ten-order-of-magnitude increase in power consumption over Type I civilizations, a Type II civilization must be able to obtain and store all the energy its parent star releases. Of course, a Type II civilization can also take energy from its planetary system as well. To achieve such a colossal degree of energy capture and consumption, immense constructions would all but certainly need to be engineered and built. For example, a Dyson sphere [3,4], Matryoshka Brain [5,6,7], or other forms of planetary system networks, or star lift (also called stellar mining, stellar engineering, or astro-engineering [8,9,10]). The sun’s total energy output, its luminosity, is approximately 4 × 10 26   W [2]. If human civilization can capture more than one fourth of the sun’s overall energy output and use it efficiently, ours will qualify as a Type II civilization. Other more exotic energy sources of Type II civilizations may include extraction from black hole accretion disks, and/or jets [11] or matter-antimatter annihilation. As an approximation to the more familiar, it can be estimated that to obtain 1 × 1026 W, the water mass contained in approximately 14,700 typical backyard swimming pools, typically 20,000 gallons each, would need to be annihilated every second, assuming 100% efficiency in converting mass to captured energy.
A Type III civilization is also called a “galactic civilization”. With an energy consumption of 10 36     W [2], a civilization of Type III can access and control much of the energy the entire galaxy that civilization lives in generates. Considering that the luminosity of the entire Milky Way galaxy is about 4 × 10 37   W [2], a Type III civilization residing in humanity’s home galaxy would command minimally 2.5% of the total possible energy sources, a notion which stretches to the breaking point of even the most highly theoretical means to do so—white holes, supermassive black holes, or some sources human civilization is not able to even conceive yet. Indeed, such a civilization may well be able to manipulate space-time itself, creating wormholes to enable travel to any point in the Universe.

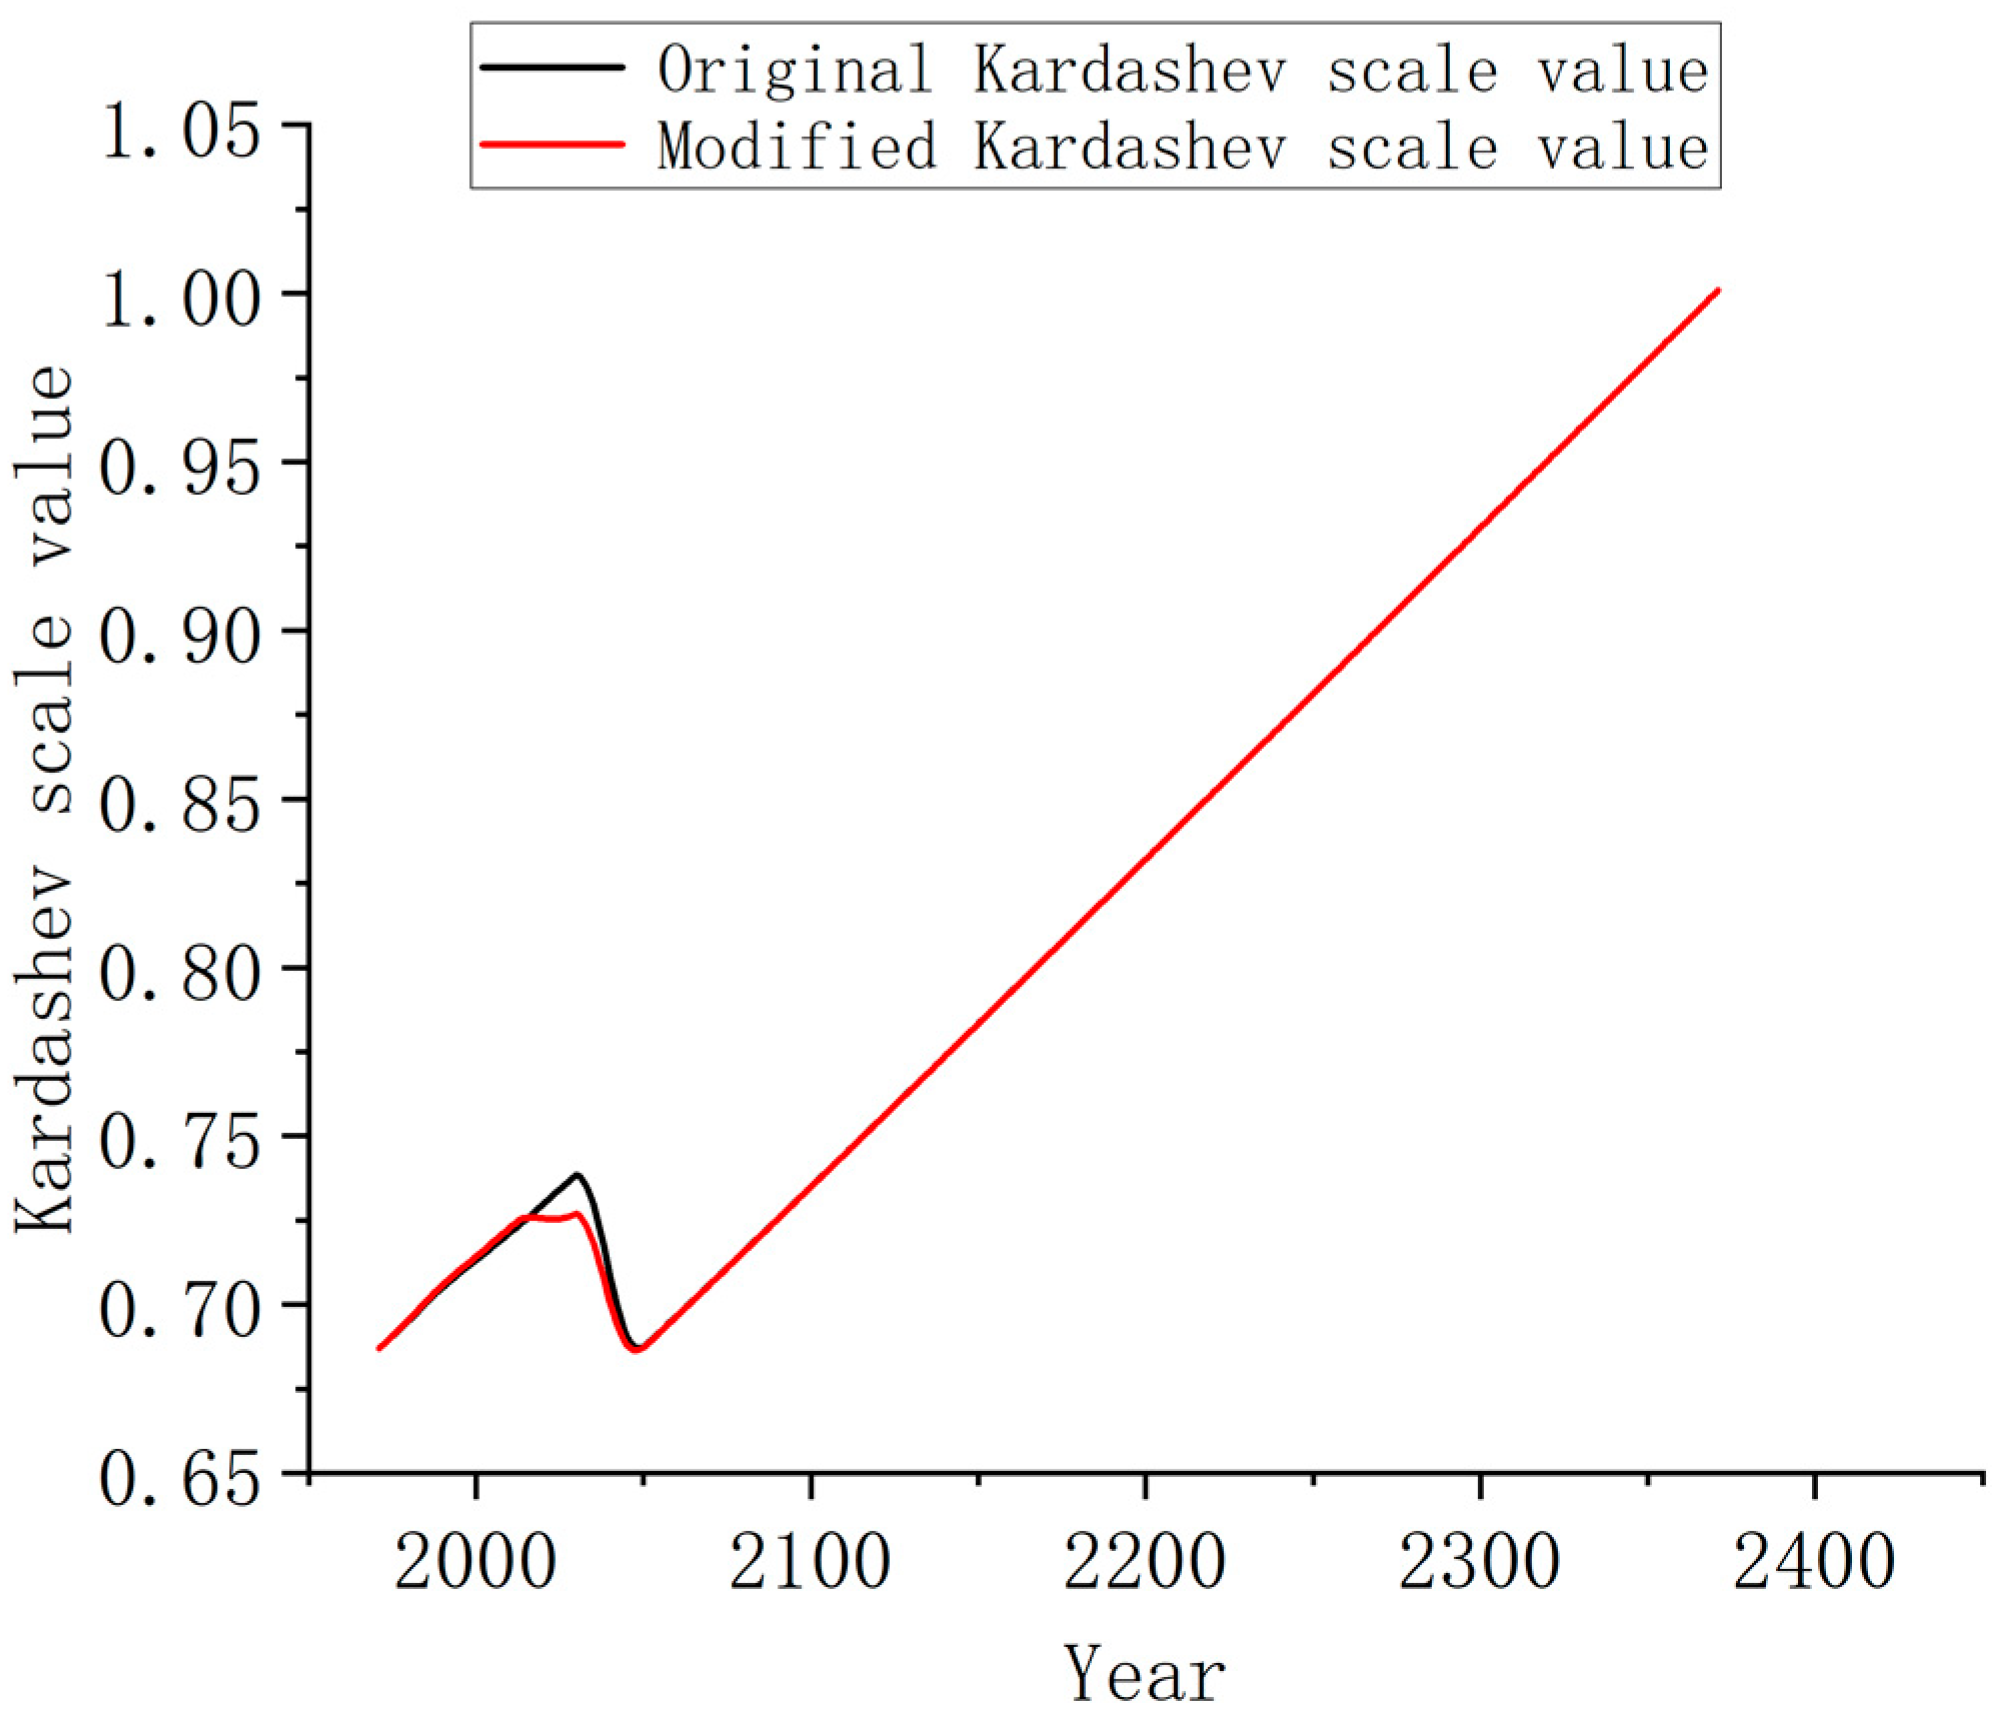
1.2. Carl Sagan’s Formulation of the Continuous Kardashev Scale

To address the quantitative limitations inherent in the discretized original definition of the Kardashev Scale, American astronomer Carl Sagan formulated a definition using the whole energy power P, in watts, in a logarithm calculation which yielded a continuous function expressing the Kardashev Scale, K [12]:
K = l g ( P )     6 10
By using Equation (1), we can calculate the power of Type I, II, and III civilizations easily, as well as extrapolate below Type I to quantify civilizations which command only a very small fraction of their world’s available energy. According to data from the IEA (International Energy Agency), in 2019 the total energy supply of the entire world was 14,567,154 kTOE (kilo ton oil equivalent), or approximately 1.93 × 10 13   W . From this actual human civilization power production estimate and Equation (1), we can calculate the present value of K for human civilization to be 0.729 in 2019.
Of more compelling interest than where precisely humanity presently resides on the Kardashev Scale, is when our species will reach Type I civilization status. Some researchers have attempted to calculate such a timeline. In his article [13], Michio Kaku concluded that if human growth averages at a rate of about 3% per year, we will reach Type I in 100~200 years, Type II possibly in a few thousand years, and Type III in perhaps, 0.1~1 million years. A recent study [14] has calculated the timeline for humanity attaining Type I status to be approximately the year 2347. However, this estimate is the result of a simple exponential growth model for calculating total energy production and consumption as a function of time, relying on a continuous feedback loop and absent detailed considerations of practical limitations. With this reservation in mind, its prediction for when humanity will reach Type I civilization status must be regarded as both overly simplified and optimistic. Accordingly, our modeling will consider the following three main sources of the energy and their associated limitations. These sources include fossil fuels (conventional reservoir oil, coal, peat, oil shale, natural gas, crude oil, NGL, and feedstocks), nuclear, and renewable energy. As well, we will consider the policies and suggestions from the United Nations Framework Convention on Climate Change (UNFCCC), and the IEA’s forecasts for energy consumption in the several decades to come to aid in developing our model for estimating the timeframe for humanity to attain Kardashev Type I status.
Technological development over the past 5000 years of human civilization has led our species to dominance of life on Earth, and placed us on a pathway to achieving a Type I civilization—and perhaps beyond. However, coupled with continuing and profound sociological challenges, our progress also threatens to end or severely set back our civilization. As we face what has been described as the “Great Filter” [15], technology can also hold the key to our long-term survival. Some have proposed the leveraging of rapidly advancing technical capability to establish robust off-world colonies, carrying forward humanity’s legacy into the indefinite future should global disaster befall our home world [16]. Together with such lofty plans, attaining a Type I civilization would logically find humanity having solved many of the most vexing problems, which have beset us since invention of the first primitive written languages that set us upon our current path. Apart from the uncounted millions of earth’s species past and present, technological progress has placed in humanity’s hands the future of our world and every living creature upon it. Clearly, there can be no turning away from further advancement. How we choose to proceed along that arc is of the upmost importance and urgency.

2. Methodology and Calculations
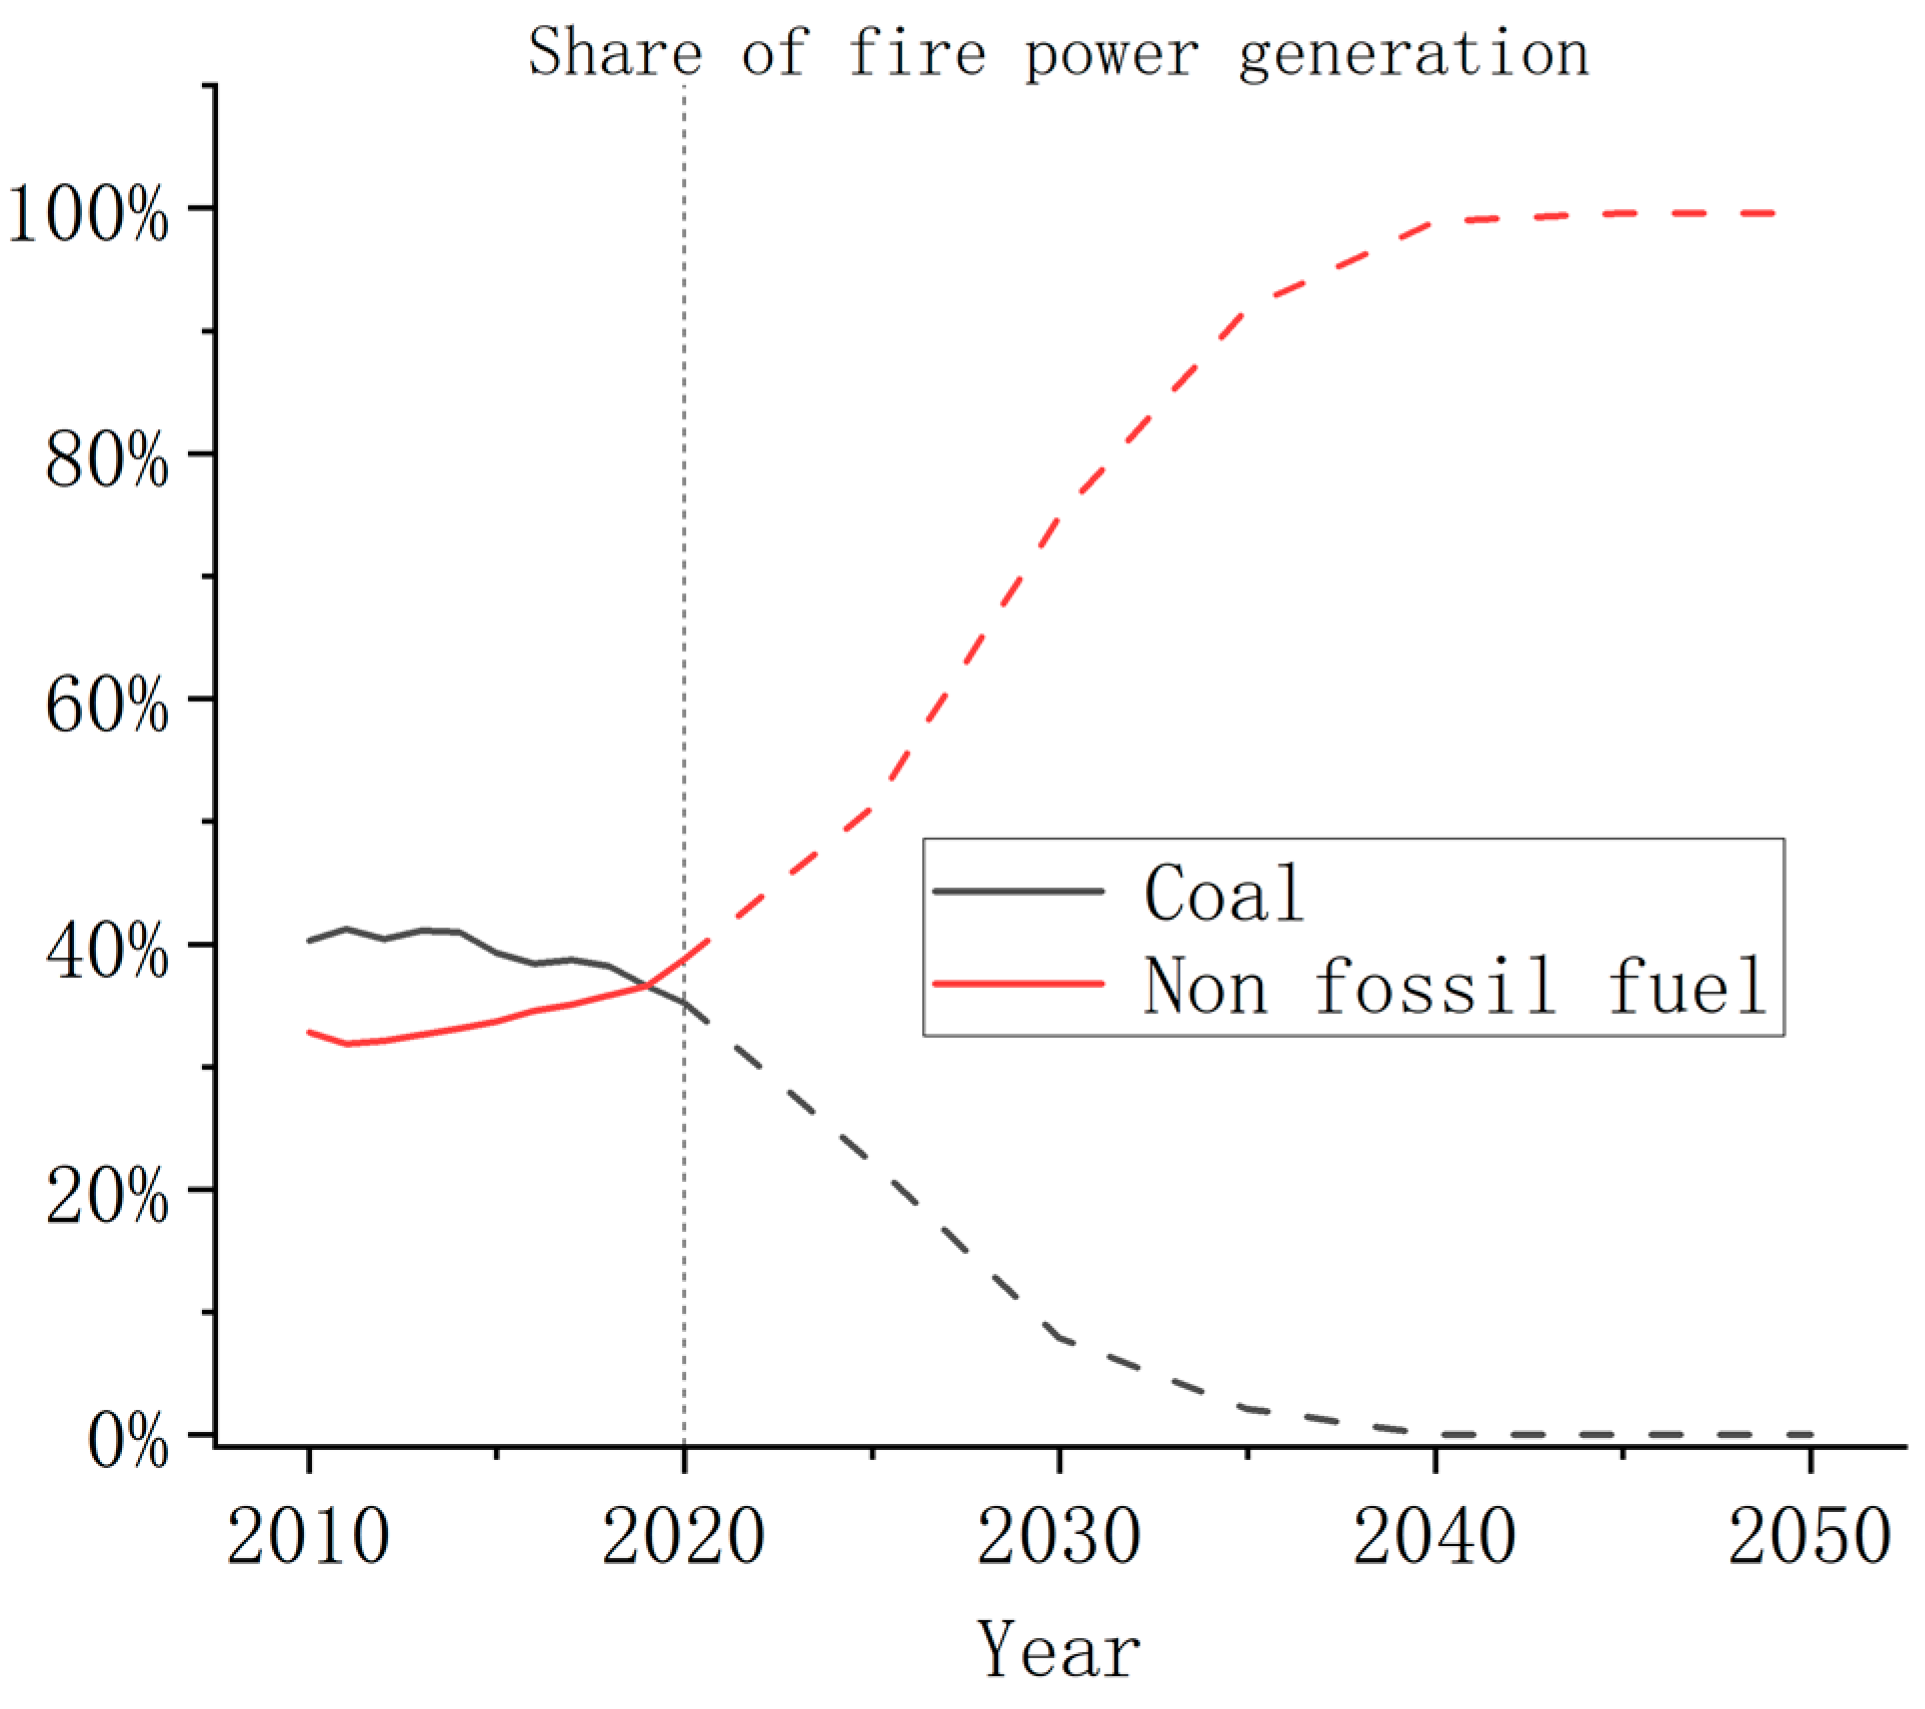
2.1. Fossil Fuels

Fossil fuels, as an essential energy source of our modern society, play an important role in our technological development, such as generating electricity, cooking, manufacturing petrochemical products, and as the main fuel for nearly all modes of transportation. However useful, we must accept that the production and burning of hydrocarbons carries with it highly impactful environmental downsides. Specifically, this takes the form of an increasingly influential greenhouse effect, a result primarily of CO2 emissions to the atmosphere, which is driving up global average temperature. Recognizing this threat, the UNFCCC has recommended that “Aggregate emission pathways consistent with holding the increase in the global average temperature to well below 2 °C above preindustrial levels and pursuing efforts to limit the temperature increase to 1.5 °C above preindustrial levels.” Further, the IEA has suggested that CO2 emissions worldwide must reach net zero by 2050 to achieve this dramatic energy production and usage transition during these next three decades. To reduce CO2 emissions and slow the increase of global temperatures, a number of countries and organizations have stepped forward with (non-binding) commitments. China, as the second largest economy in the world, has stated that their CO2 emissions will reach a peak in 2030 and, declining from then, accomplish carbon neutrality not later than 2060 [17]. Similarly, the European Union (EU) has claimed that “The binding Union 2030 climate target shall be a domestic reduction of net greenhouse gas emissions (emissions after deduction of removals) by at least 55% compared to 1990 levels by 2030.” [18].

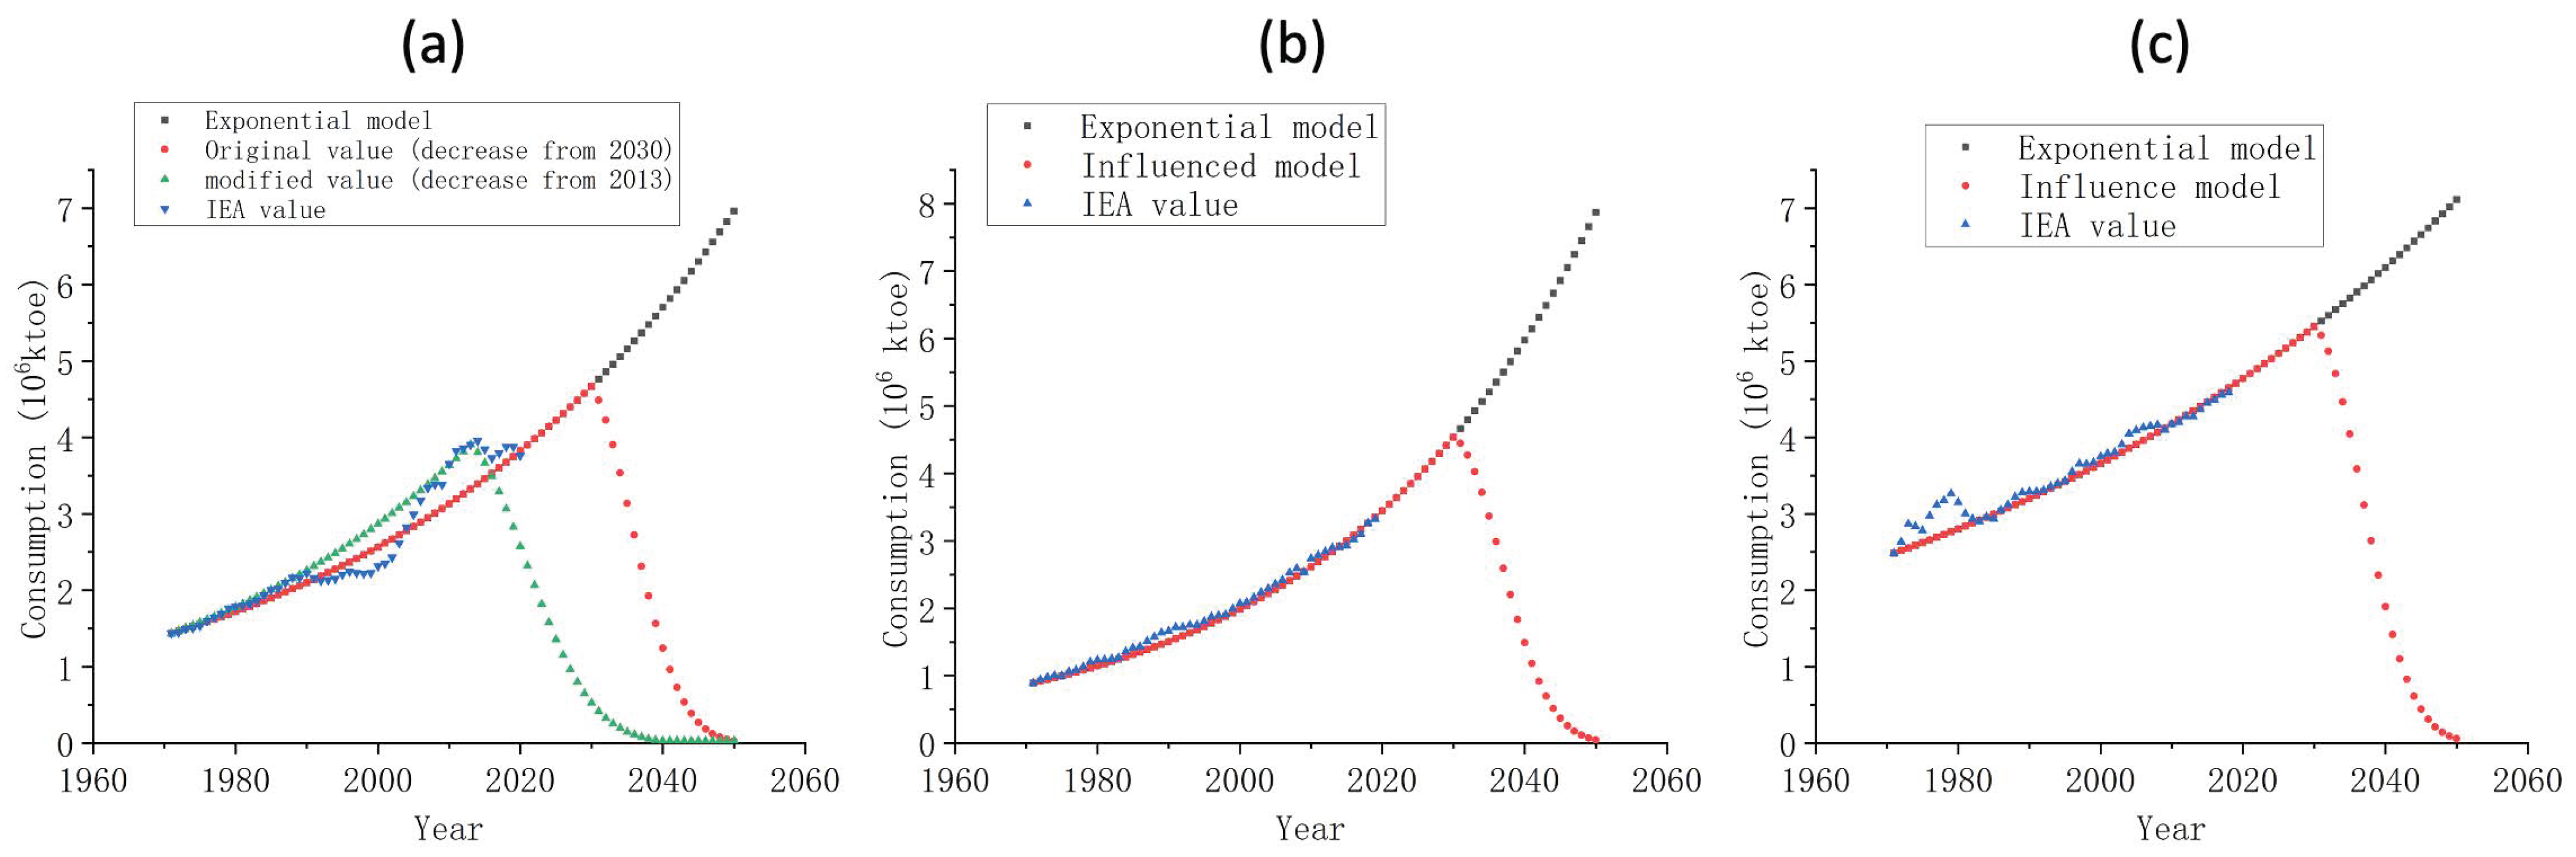
2.1.1. Uninfluenced Model for Fossil Fuels

In this section we will consider data from the IEA on coal, natural gas, crude, NGL (Natural Gas Liquid), and feedstocks usage between 1971 and 2019; we will initially leave aside any influence originating from policies or related suggestions of the UNFCCC and IEA. However, it is important to point out that in the IEA’s definition, “Natural gas includes both ‘associated’ and ‘non-associated’ gas as well as colliery gas (excluding natural gas liquids).” Starting from an assumption of energy consumption following an annually compounded curve, a simple growth model emerges to predict consumption values into the future. Coupled with data from the IEA, we can calculate the annual growth rate t n by Equation (2):
t n = a n + 1 a n a n  
where a n represents energy consumption for the nth year starting from the year of 1971. Using this formulation for t n , we next obtain the average growth rate of consumption t i n c r e a s e by the following Equation (3):
t i n c r e a s e = t ¯ n = 1 n i = 1 n t i  
After that, we can calculate the uninfluenced value of the energy consumption by Equation (4):
  y u n _ i n c ( x ) = a n 0 ( 1 + t i n c r e a s e ) x  
where x is the number of years after 1971.

2.1.2. Influenced Model for Fossil Fuels

By fully factoring in some of the more significant influences from government and organization policies, the consumption of fossil fuels would reach their peak in 2030 and achieve a net zero in 2050. Thus, from now to 2030, the consumption value will obey the classical exponential model discussed in Section 2.1.1. Further, we can restrict the range of the years to between 1971 and 2030 with the following Equation (5):
y i n f l u e n c e ( x ) = a 1971 ( 1 + t i n c r e a s e ) x ,     x   [ 0 ,   59 ]
where the subscript “influence” denotes the influenced portion of the overall increase in energy consumption, “ a 1971 ” is the initial consumption in 1971, and x represents the number of years having elapsed after 1971 ranging to 59, which corresponds to the final year of 2030. By using the exponential growth model, the initial energy consumption value a 1971 and the averaged growth rate of t i n c r e a s e , we can forecast energy consumption in the decades to come.
For the decreasing portion of the curve, which is expected to occur over the years 2030 to 2050, we use a similar form to Equation (4), as described by the classical decay Equation (6), and a modified exponential decay model to replace the classic exponential decay function, yielding Equation (7):
y d e c ( x ) = a 2030 ( 1 t d e c r e a s e ) x
  y d e c ( x ) = i = 0 x a 2030 [ 1 t 0 ( 1 + m i ) ] ,   x [ 0 ,   20 ] ,   x N *  
where a 2030 is the consumption value in 2030, t 0 is the initial decay rate, and m is the rising proportion of the decay rate per year. The modified exponential decay function y d e c ( x )   means that the energy consumption value will decrease with an initial decay rate t 0 , and that decay rate will accelerate by a proportion of m per year. N* is positive integer.
Next, we will determine the relationship between t 0 and m . In Equations (6) and (7), the t d e c r e a s e and t 0 ( 1 + m i ) will influence the consumption y ( x ) with the initial value a 2030 , and this influence will be from 2030 to 2050 as the independent variable x ranges from 0 to 20. In terms of the classical exponential decay model, Equation (6), the influence of every year is the same value of t d e c r e a s e . However, in the modified exponential decay model, Equation (7), the influence varies from year to year, becoming successively larger as the factor m rises. To balance the influence of these two fitting functions and determine the constrained relation between t 0 and m , we then integrate over the 20 years from 2030 to 2050:
0 20 t d e c r e a s e d i = 0 20 t 0 ( 1 + m i ) d i
Simplifying, we get the constrained form between the two parameters:
t d e c r e a s e = t 0 ( 1 + 10 m )  
We then assume the energy consumption in 2050 is equal to 1% of the 2030 value, since some aircraft, most oceangoing surface ships, and some other means of transportation maybe still be utilizing hydrocarbon-based fuel as their main energy source. Hence, we make a relatively conservative assumption—1% (or 2%). Further, we accept as a given that the assumption we have mentioned above will satisfy the carbon dioxide emissions net zero in 2050 requirement. Note that this assumption may be challenged, given that some hydrocarbon fuel production and usage will likely still be needed after 2050. While application of large-scale atmospheric CO2 removal strategies may help to counterbalance continued (relatively low level) emissions, in the absence of such efforts, another way to express this would be to assume that CO2 emissions bottom out at some non-zero level starting in 2050, and continue at that level into the indefinite future. This would require a constant to be added:
a 2030 ( 1 t d e c r e a s e ) 20 = 1 %   a 2030
The 1% assumption yields a t d e c r e a s e of 20.57%. Similarly, by redefining to 2%, t d e c r e a s e declines to 17.77%. By defining the initial decay rate t 0 , we can get the value of m . In our model t 0 is the following:
t 0 = 1 10 t d e c r e a s e  
Using Equation (9), and applying the constraint defined by Equation (11), we determine m = 0.9 . Hence, an example is generated to describe the annual decay rate from 2030 to 2050 with Equations (9)–(11).
As can be seen from Table 1, the decay rate in the first decade is relatively low, but accelerates in the second decade. Clearly, there is a long way to go in making this dramatic energy transition, given that in the first decade fossil fuels will still play an important part in our total energy supply. As well, within this process of transition, some new types of energy will come to encompass an increasing proportion of our total energy supply.
Ideally, humanity will ultimately free itself from dependence on fossil fuels if governments are sufficiently conscious of the potential environmental problems they pose, and alternative energy resources such as nuclear, solar, and wind are developed to the extent where they can replace hydrocarbons. As the transition process comes to its assumed end, consumption of fossil fuels will decrease to a relatively low value, as our society will by then have only minimal need for it. Given that assumption, it then follows that the decay rate will be relatively large in the 2040s. Here, we have defined just a single example from parameters assumed to have relatively reasonable values. Different assumptions, be they conservative, and when used in exponential calculations, will have the potential to yield dramatically different results.
By considering the latest estimation by the IEA [IEA (2021), Coal-Fired Power, IEA, Paris, https://www.iea.org/reports/coal-fired-power] (accessed on 6 May 2022), we plot the share of fire power generation of coal and non-fossil fuels. In Figure 1, the usage of coal in power generation began its decline during 2011 to 2013, and is expected to stabilize at a minimal level by about 2040. In view of this circumstance for coal, we prudently give two scenarios to bracket its projection. The first, represented by the red dots in Figure 2a, is the original influenced model which maintains the decrease occurring from 2030 to 2050. Alternatively, the green dots illustrate the modified influenced model wherein coal usage decreases starting from 2013 and continues to 2040, capturing the IEA’s prediction.
As illustrated in Figure 2a–c, the consumption of the fossil fuels coal, natural gas, crude oil, NGL, and feedstocks, reach their respective peaks in 2030 before rapidly declining to a relatively low value in 2050. Note that throughout the 20-year period of decrease, the decay rate will increase by a fixed proportion of m .

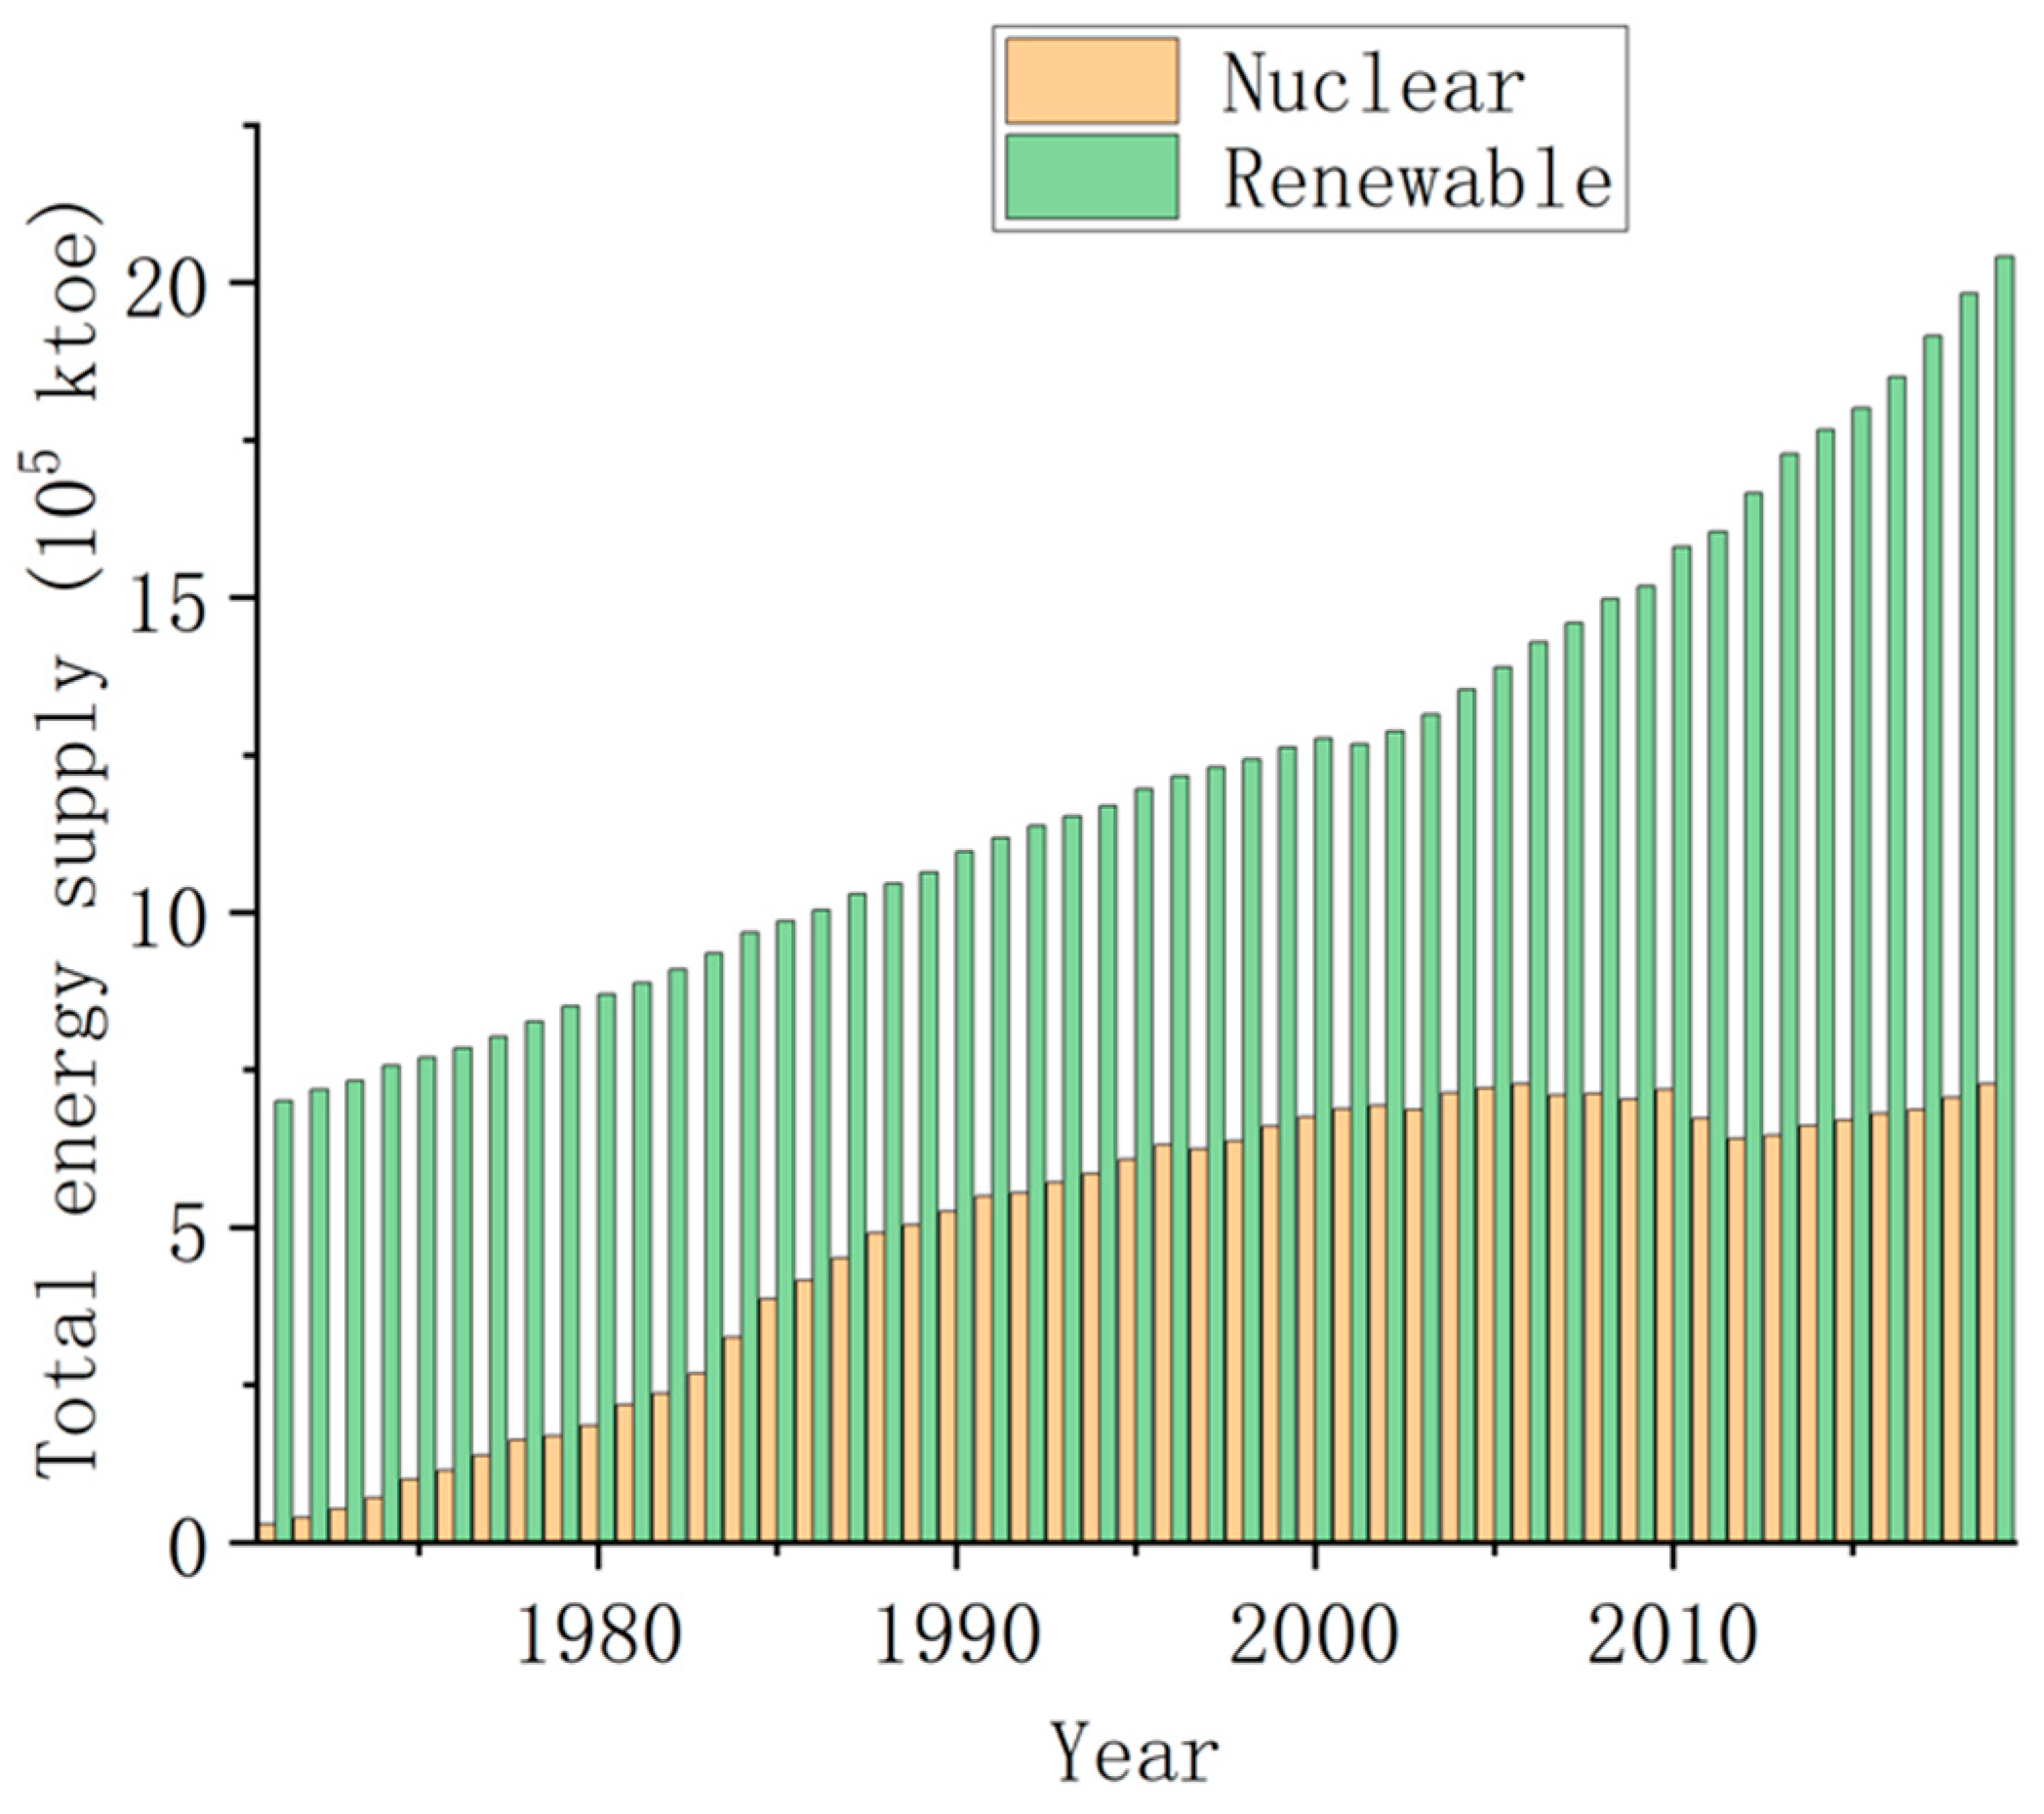
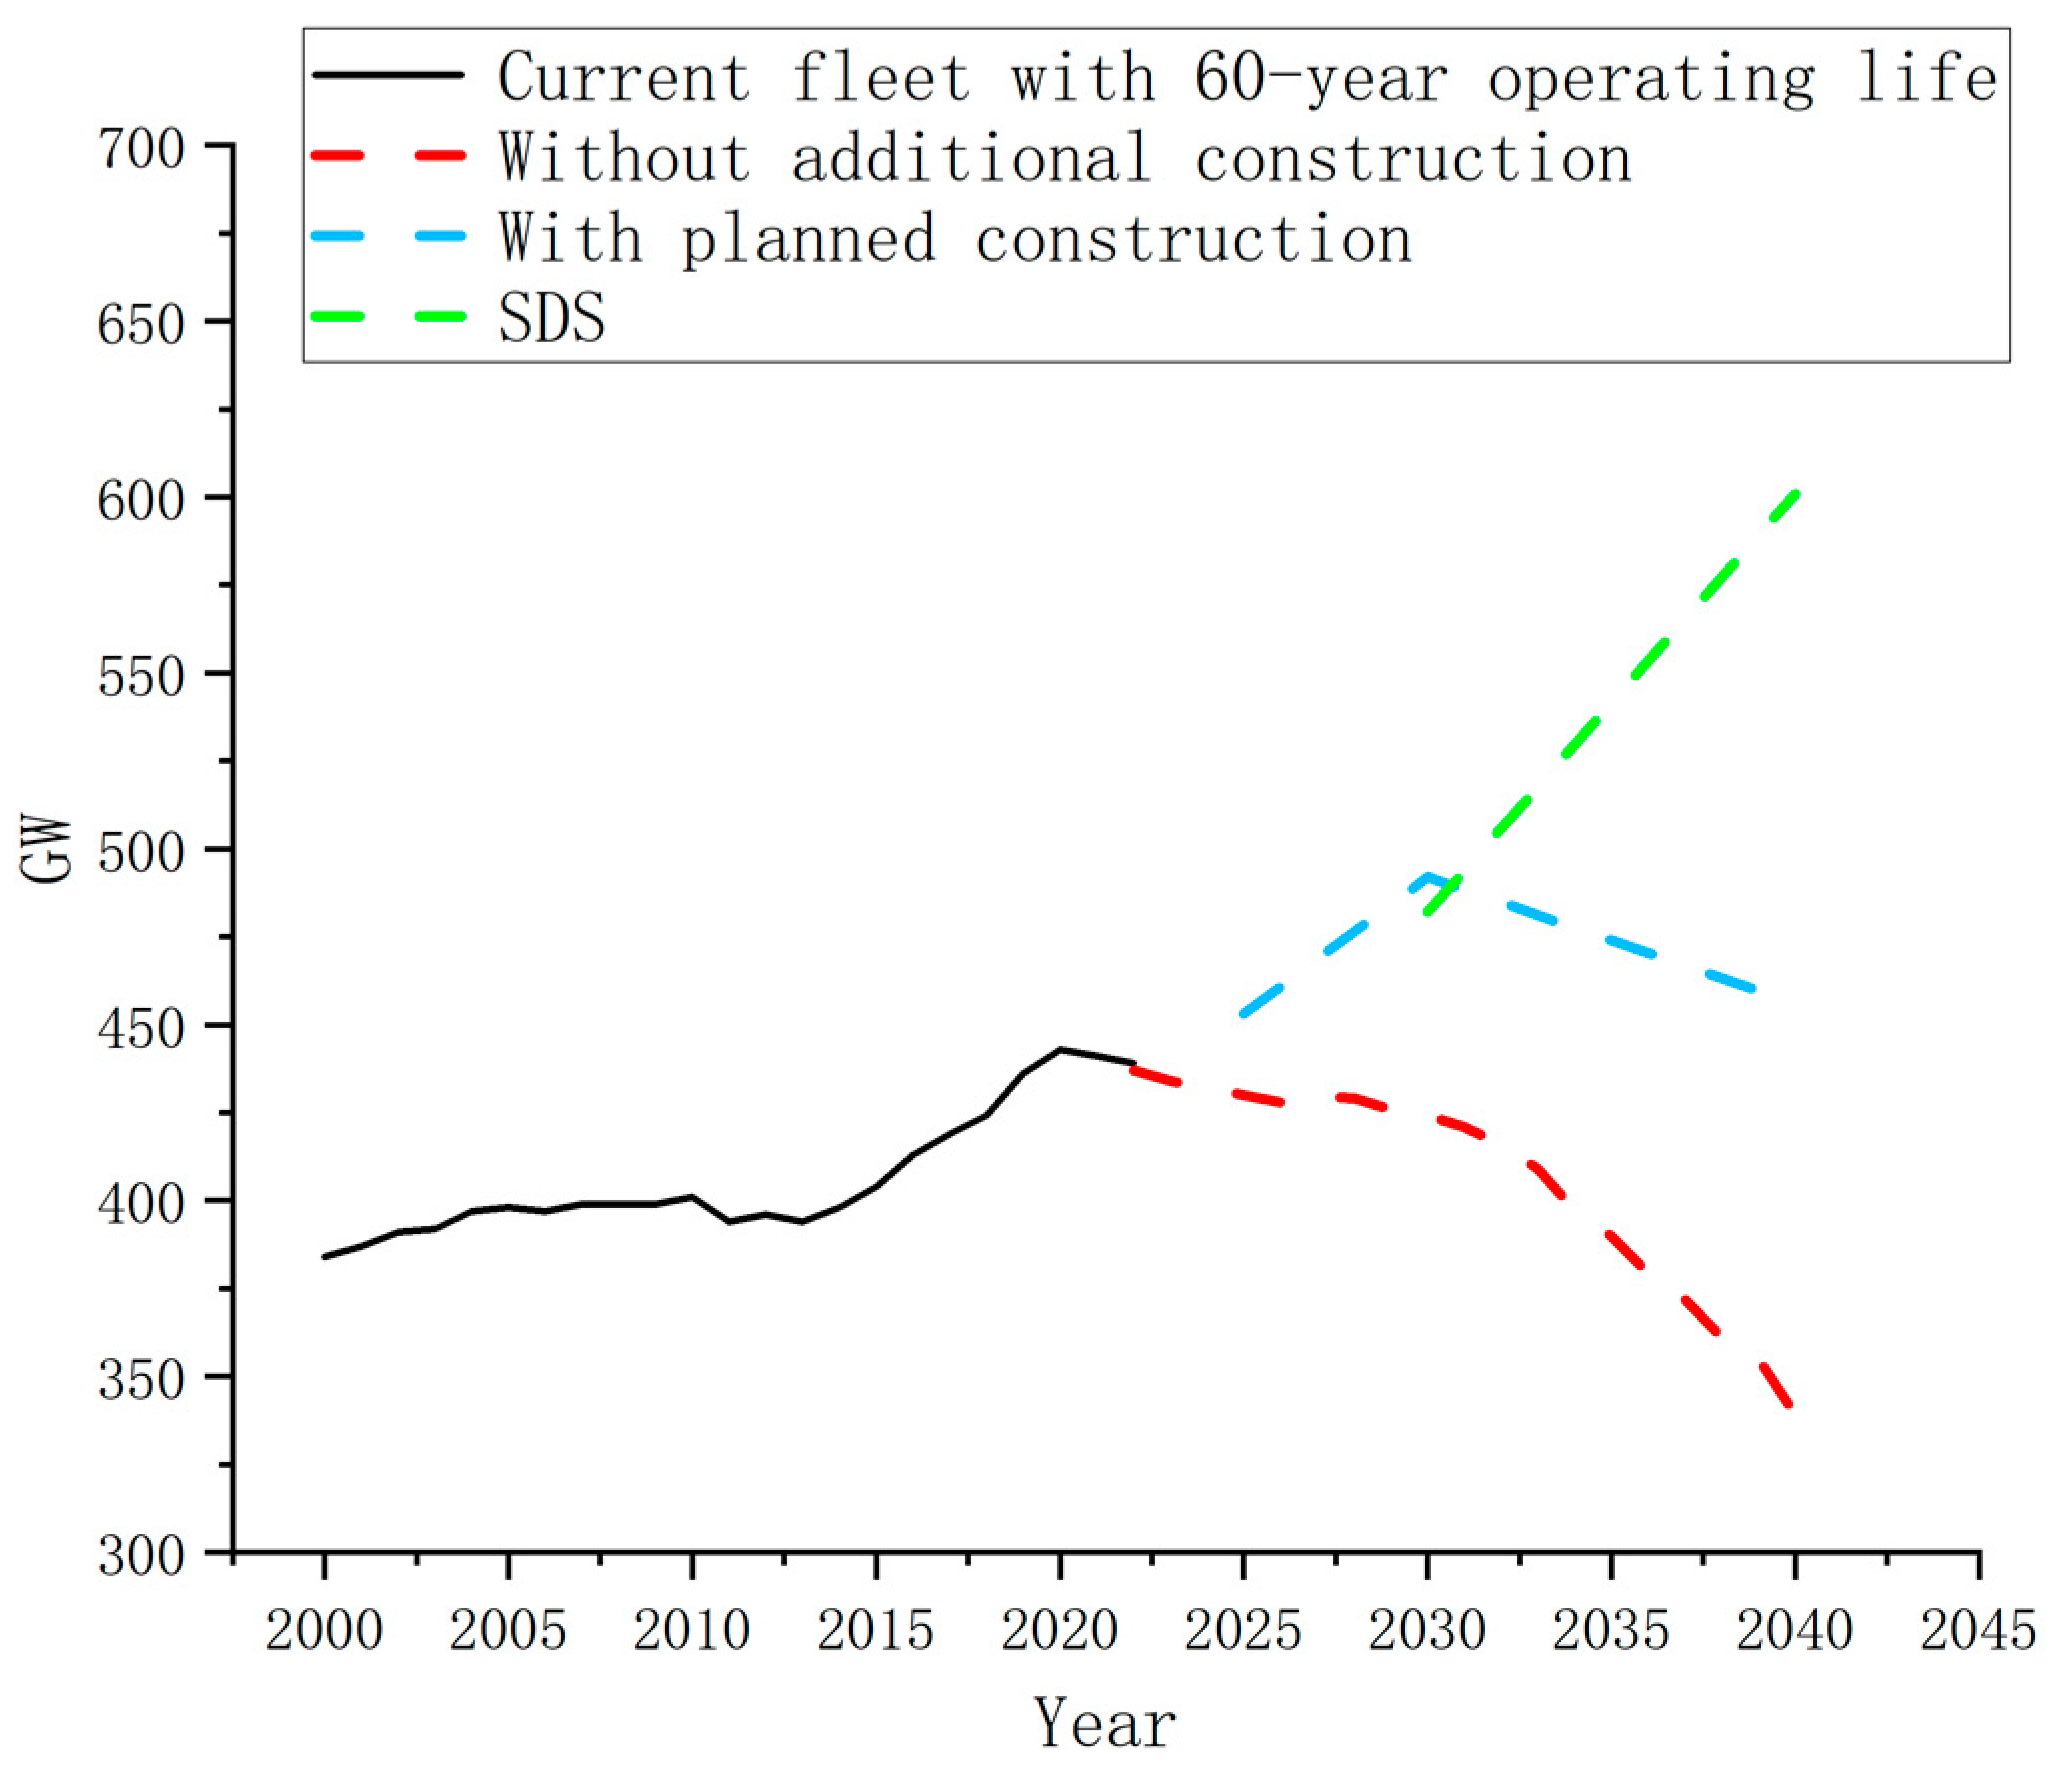
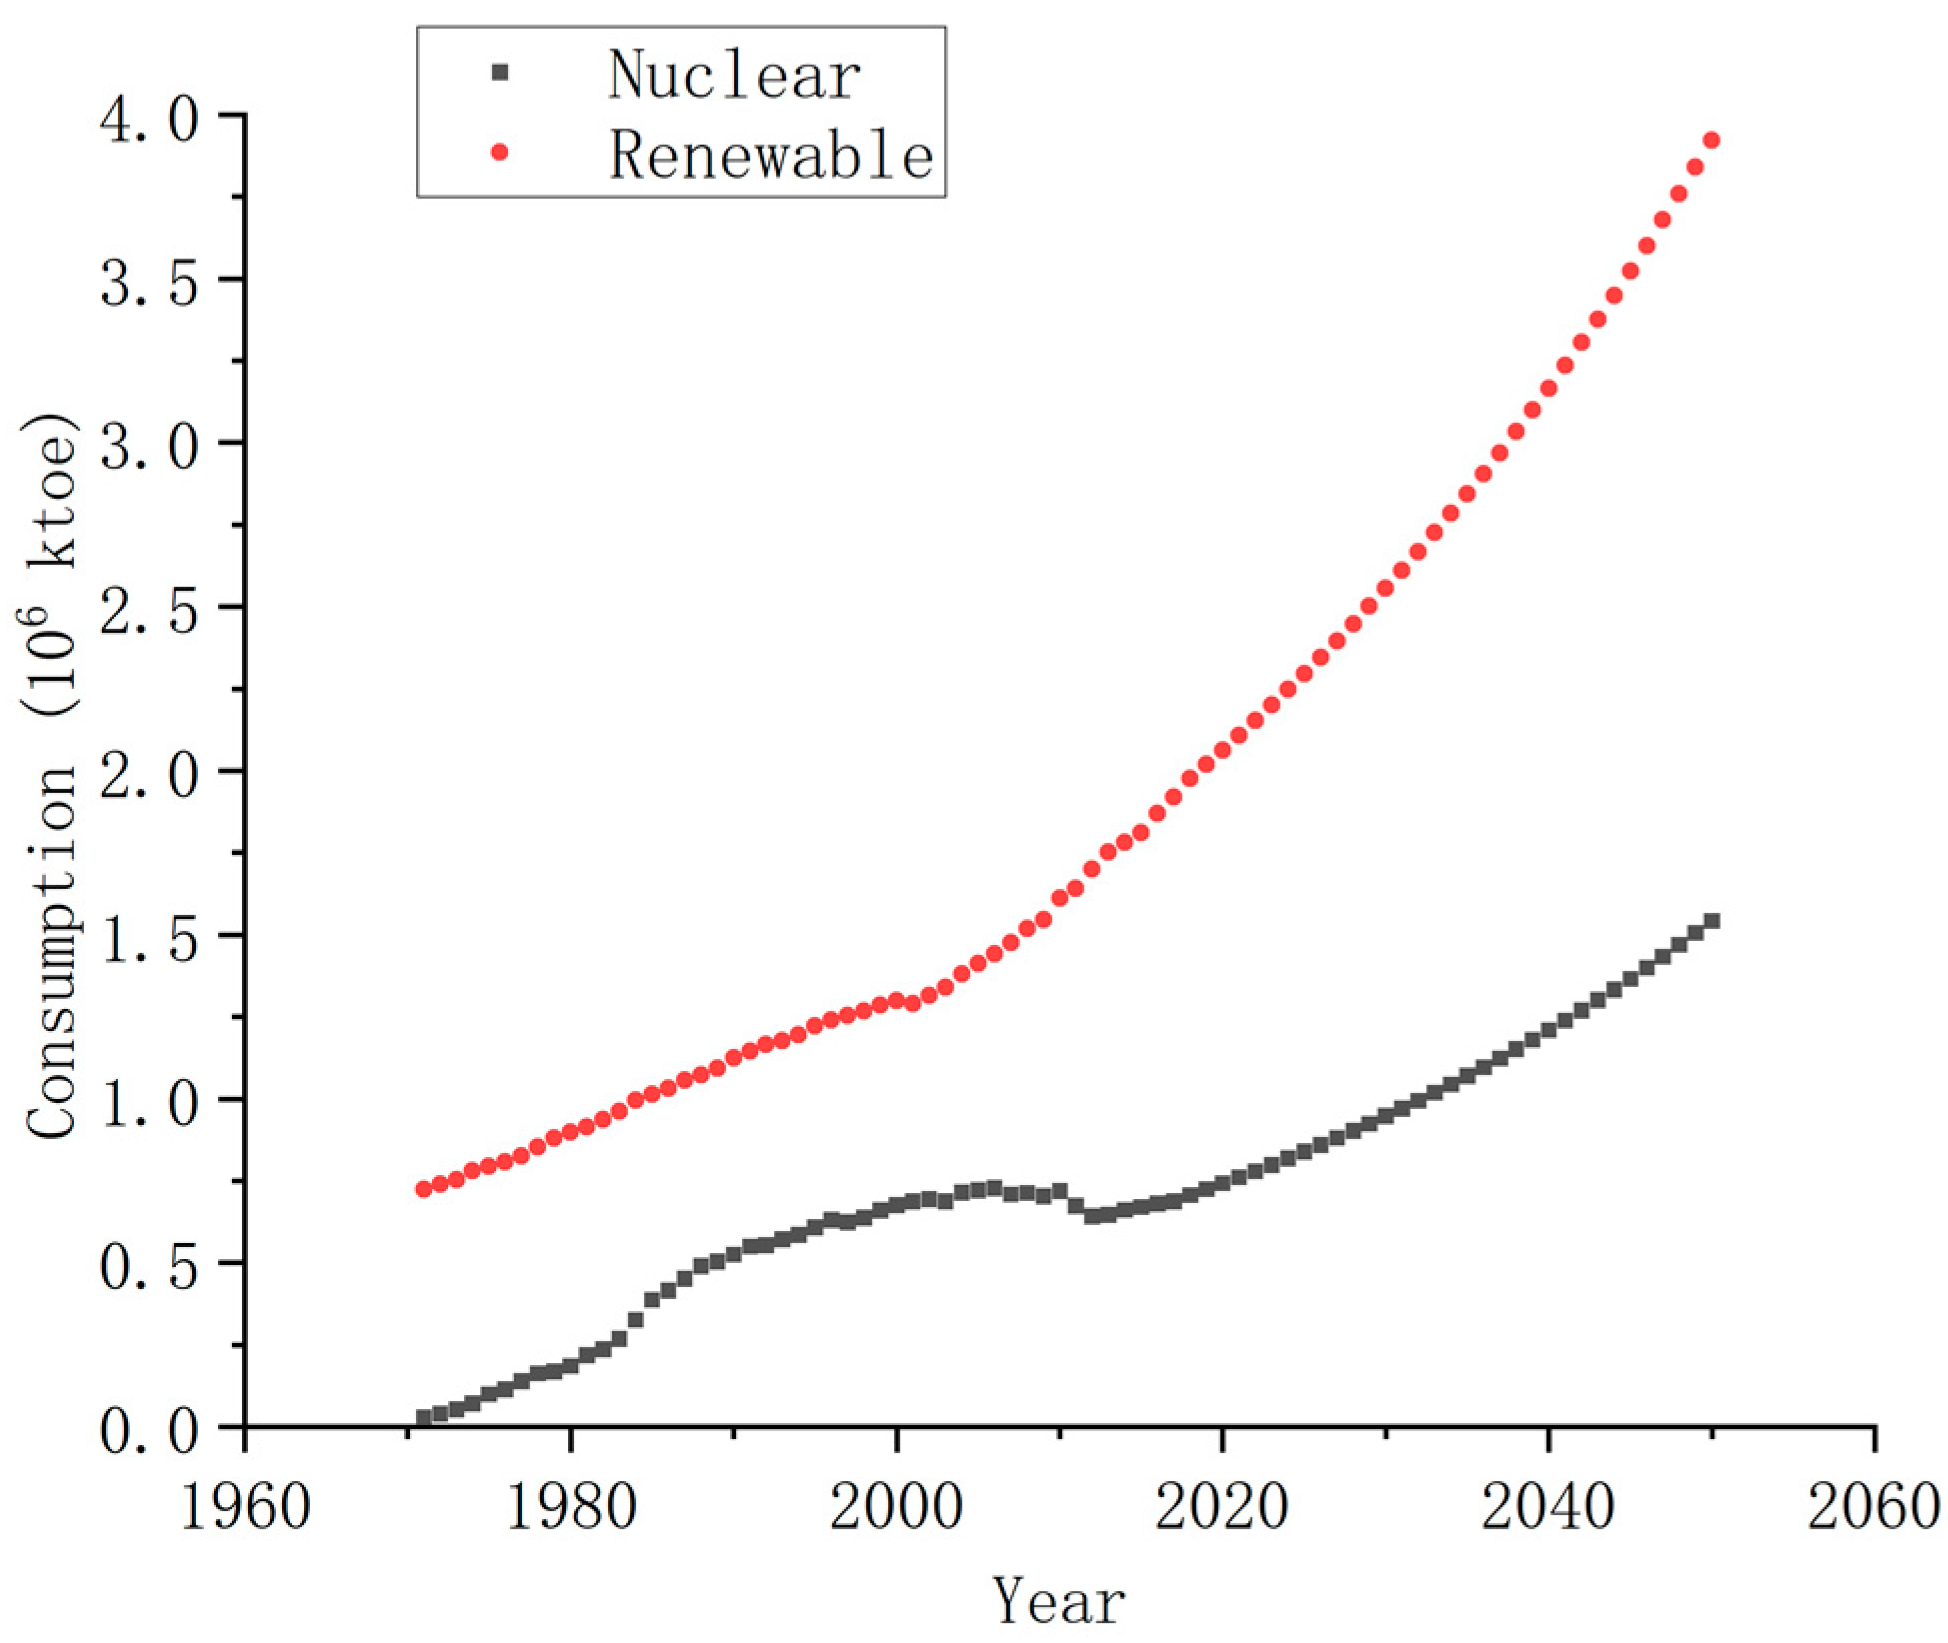
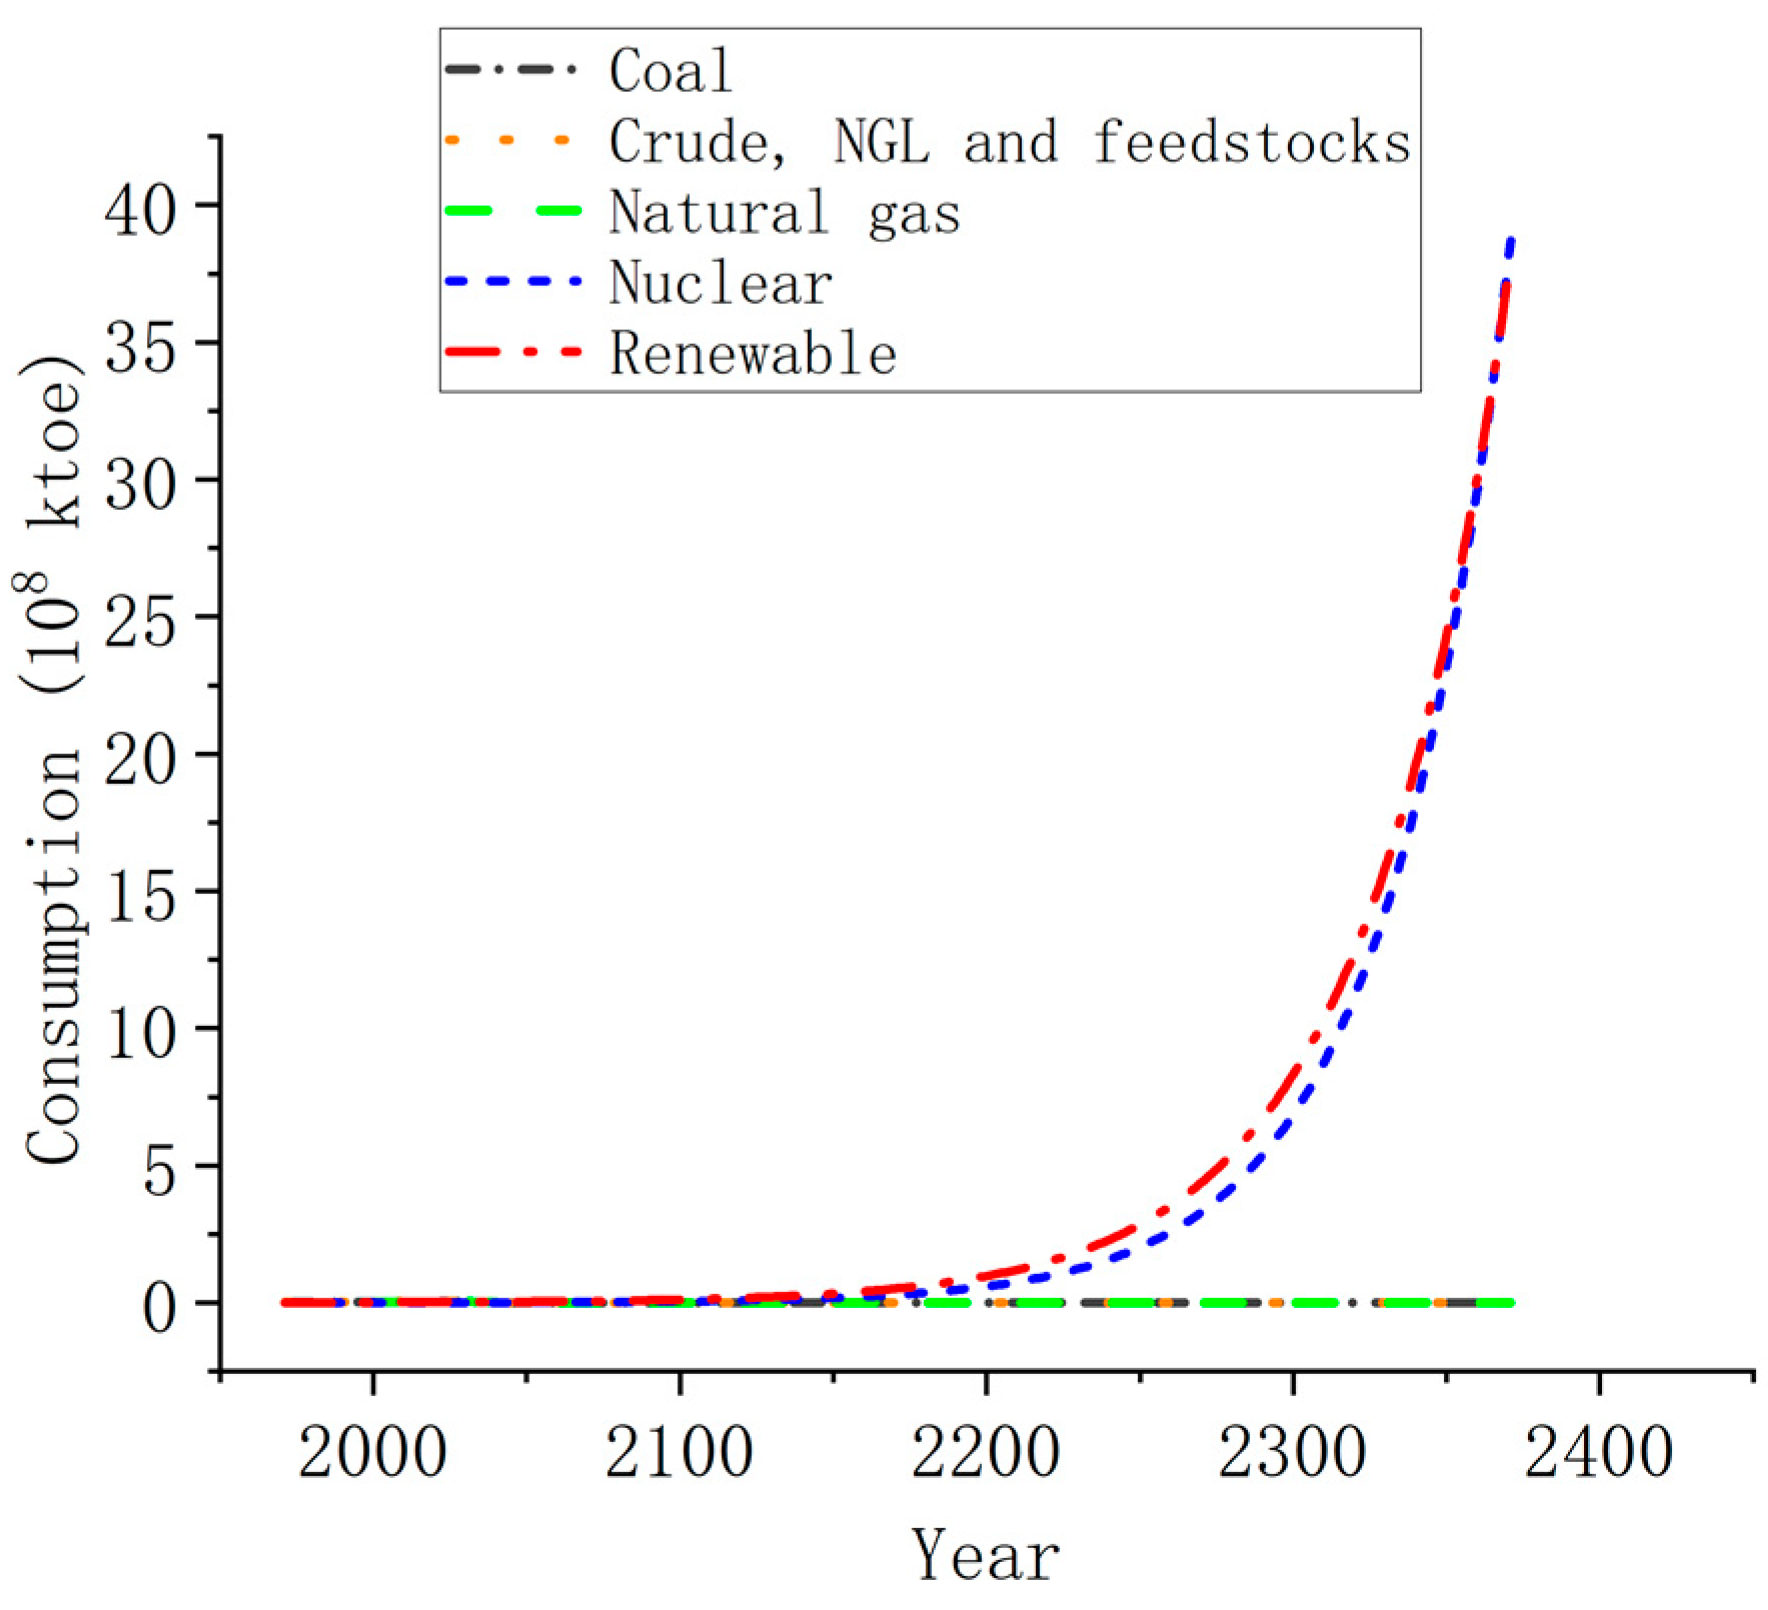
2.2. Nuclear and Renewable Energy

“Nuclear power has historically been one of the largest contributors of carbon-free electricity globally and has significant potential to contribute to power sector decarbonization” (IEA). Nuclear power has helped to avoid an estimated 55 Gtons of additional CO2 emissions over the past 50 years, nearly equal to two years of global energy-related CO2 emissions (IEA). Renewables, including solar, wind, hydroelectric, biofuels, and others are at the center of the transition to a less carbon-intensive and more sustainable energy environment.
“Biofuels are liquid, solid, or gaseous fuels made from renewable biological materials and are one of the more promising forms of energy for the replacement of non-renewable energy sources (fossil fuels)” [19]. Compared with fossil fuels, biofuels are regarded as one important part in reducing CO2 emissions in the future. Although it will increase the content of CO2 in the atmosphere when burned in engines and generators of all types, ultimately the energy and carbon in biofuel comes from solar energy, soil, and the atmosphere by photosynthesis of plants. Thus, to some extent, burning biofuel will not contribute quite as much CO2 emissions when compared to fossil fuel. As well, biofuel produced by different plants can reduce the CO2 emission in a different proportion [20].
In 2019, renewable energy accounted for 23.2% of global power generation [21]. Clearly, these resources will be an important part of the low to no-carbon society of the future. To achieve full energy transition, the IEA suggests that two thirds of all energy production should come from renewable sources including, but not limited to, solar, wind, and geothermal, with the remaining one third covered by nuclear power. According to IEA data, the average growth rate in nuclear is 7.53% from 1971 to 2018. By contrast, growth in renewables is just 2.17%.
Although renewable energy now accounts for a bigger share than nuclear power in the total energy supply picture, to meet the IEA’s suggestion we will need to make more of an effort to develop renewables in the coming decades. By considering the IEA’s recommendations, we can constrain renewable energy to be two times more than that of nuclear energy:
R 2018 ( 1 + t R i n c r e a s e ) 32 = 2 N 2050
where, according to the value from 1971 to 2018, we use the classical exponential model and project the values from 2019 to 2050. R 2018 is the renewable energy supply in 2018, t R i n c r e a s e is the average growth rate of renewable energy during 2019~2050, and N 2050 represents the nuclear energy supply in 2050. However, the weaker growth rate for the 20 years between 1998 and 2017 (inclusive) is likely due to slowing of technological advancements relative to prior time periods and/or economic reasons. Accordingly, we hold that nuclear energy will not reach that high growth rate of 7.53%, but instead keep to a more moderate rate.
In consideration of the relatively smooth growth data of renewable energy (Figure 3), compared with the more fluctuant growth of nuclear (Figure 3), we will regard renewable energy as a standard to estimate the nuclear data accordingly. In Equation (12), N 2050 is the nuclear energy supply in 2050, and is calculated by the exponential growth model as follows:
N 2050 = N 2018 ( 1 + t N i n c r e a s e ) 32
By using Equations (12) and (13), t R i n c r e a s e = 2.17 % , and the values of N 2018 and R 2018 , we can determine t N i n c r e a s e = 3.24 % .
However, according to the estimation from the IEA (Figure 4), under the most ideal conditions for the future development of nuclear, this per the Safety Data Sheet (SDS) condition in Figure 4, the average growth rate is about 2.47%. Thus, 3.24% remains too high even when compared with the IEA’s estimation of the idealized growth rate. Moreover, nuclear energy’s average growth rate from 1998 to 2017 was only 0.550%. Furthering the point, from Figure 4 we can make a reasonable prediction that nuclear energy will not grow nearly as fast as 3.24%. In view of this uncertainty, we prudently choose the IEA’s estimation of 2.47% as our ideal growth model.
In this ideal condition, the total energy supply of nuclear in 2050 is calculated by the following equation:
N 2050 = N 2018 ( 1 + 2.47 % ) 32
According to the above calculations and considering the IEA’s recommendations, we describe in Figure 5 the renewables and nuclear energy outlook within the influenced model and see that to meet the IEA’s suggestion, it is evident we must develop nuclear energy further with more construction while simultaneously maintaining the pace of renewable energy growth.

3. Conclusions

Thus far, we have discussed the five major types of energy sources (coal, natural gas, crude, nuclear and renewables) and analyzed how their usage may change in the near future under the influences and policies raised by the UNFCCC and IEA. Returning to Equation (1), Carl Sagan’s formula for calculating the Kardashev Scale, we project that human civilization can indeed attain a K value of 1.00 with these five energy sources.
In Figure 6 it is seen that by considering the aforementioned international organizations’ suggestions, renewable and nuclear energy will come to take up the largest proportion of total energy supply, while fossil fuels will only play a minimal role. If this outcome holds, humanity may well avoid a future beset with the more severe environmental problems posed by excessive CO2 emissions.
A final revisit of Equation (1), which is informed by the IEA’s and UNFCCC’s suggestions, finds an imperative for a major transition in energy sourcing worldwide, especially during the 2030s. Although the resultant pace up the Kardashev Scale is very low and can even be halted or reversed in the short term, achieving this energy transformation is the optimal path to assuring that we will avoid the environmental pitfalls caused by fossil fuels. In short, we will have met the requirements for planetary stewardship while continuing the overall advancement of our technological civilization. Keeping to this developing philosophy, we estimate attainment of Type I civilization status in the year 2371 (Figure 7).
Until this point, we have left aside the question of uncertainties in our calculations, which may well affect our models’ estimates. According to our analysis, since nuclear and, in-turn, renewable energy resources will come to dominate the energy landscape in the coming decades, estimating the associated errors for both models would lead to a reasonable error estimate for our predicted year of the human race attaining Type I status. Accordingly, we have computed the mean absolute percent error for both models with respect to the historical data put forth by the IEA. After considering the error estimation, we draw the conclusion that attaining Type I status shall be possible in the year range [2333, 2404]. Further, we posit the consideration of declining coal usage starting in 2013 versus 2030 suggests that achieving a given K value will differ only modestly from that of the original model.

4. Discussion and Implications

In our model, which uses the classical exponential growth standard to simulate future energy supplies of nuclear and renewable energy, meeting the relatively ambitious average annual growth rate of 2.47% may present a major international challenge. A more pragmatic projection of the average annual growth rate may well place it substantially lower than 2.47%. More specifically, this method employs an idealized model, especially for nuclear and renewable energy usage into the future, relying on assumedly benevolent influences from the political, social, and financial realms, the uncertainty of which increases sharply with time. Accordingly, our prediction for humanity’s arrival time at a Type I civilization may be biased towards the earlier end of the rational range.
There are several difficult-to-predict reasons for affecting the total energy supply as our civilization advances. For example, technological and/or social barriers may arise that inhibit acceptance and utilization of new energy technology. In such circumstances, it would be advisable to find new methods of calculation to re-balance the proportion between nuclear energy and renewable energy as we progress.
Despite the contribution from nuclear and the rapid growth in renewables, energy-related CO2 emissions hit a record high in 2018 as electricity demand growth outpaced increases in low-carbon derived power. Humanity should, however, strive to achieve a dramatic energy transition during 2020 to 2050, indeed as soon as possible, to solve at least the most pressing of environmental problems which stand in the path of development to a higher order civilization. Extending this notion further, the stability of a civilization at any Kardashev/Sagan level must necessarily be considered in order to complete a holistic analysis. As an example, if a given civilization produces and consumes a sufficient amount of energy to qualify as Type I, yet is actively destroying the very world from which it is deriving those 1016 Watts, its existence as a technical civilization would clearly be in great peril. Sustainment at Type I, let alone any prospect of advancement towards Type II, would be doubtful as the grim prospect of backsliding into a primal state grows. Such threats can arise from the reckless generation and usage of energy leading to environmental, biological, and/or sociopolitical collapse, and must be guarded against ever more robustly as humanity’s technical prowess continues to outrun our capability to manage our increasingly complex society. Indeed, “The real problem of humanity is the following: We have Paleolithic emotions, medieval institutions, and godlike technology” [22]. This sobering insight, made by one of the great pioneers of evolutionary biology, stands as a stark reminder that the human species is still struggling with our troubled evolution in such places as Eastern Europe and the Middle East.
Another major and inevitable concern with the increasing development of nuclear energy are the dangers to all life on Earth posed by such a powerful resource, while trying to successfully avoid the Great Filter. Nuclear energy is, by all means, a promising source of (essentially) clean energy that can meet our growing needs, as it has the highest capacity factor, about 92.5%, in comparison to the other energy sources, including non-renewables. This basically means nuclear power plants are producing maximum power more than 93 percent of the time during the year (U.S. Energy Information Administration, 2020). But the biggest concern in the course of nuclear power generation is in the safe handling and disposing of the byproduct hazardous nuclear wastes that can remain radioactive for hundreds, if not thousands of years. The International Atomic Energy Agency suggests that long term climate change must be taken into account while considering Near Surface Disposal of Low Level and Intermediate Level Wastes, as this may affect their safe storage. But in considering the larger issue of nuclear waste disposal, we must also be aware of the major downside posed by soil degradation due to radioactive contamination. Radiation can affect the environment at any stage of the nuclear fuel cycle. Primarily, the processing of radioactive waste may lead to accidental release of radionuclides. By a review of the inventory of fission products, important in case of accidental releases [23], risks of contamination from key pollutants (e.g., radioisotopes of cesium) prevail at an average of two out of the four stages of the nuclear fuel cycle, with radioisotopes of strontium occurring across all four stages. Although the stable forms of strontium are not considered as toxic to plants, their adverse effects on plant development and growth are very often combined with their negative impact on the uptake of some nutrients, especially calcium [24]. In addition, corrosion products and generation of technologically enhanced naturally occurring radioactive material also act as significant soil contaminants. Analysis of soil properties, particularly those responsible for immobilization of radio-nutrients essential for controlling activity concentration in the biota, suggests that decreases in pH and clay content increase the risk of mobility of radionuclides in the soil. Deforestation and acid rain are the main causes behind removal of the clay content from soil and declines in soil pH. According to the Food and Agricultural Organization of the United Nations, between 2015 and 2020 the rate of deforestation was estimated at 10 million hectares per year, down from 16 million hectares per year in the 1990s. The area of primary forest worldwide has decreased by over 80 million hectares since 1990. If deforestation at this rate continues, we will soon be facing the major risk of oxygen reduction in soil, along with greater risks of radioactive contamination. Additionally, data from Landsat satellites (Earth Observatory, NASA) suggests that global warming has resulted in higher rates of forest fires, extending their impact to some hillsides and mountainsides which historically had incurred only rare incidents of such fires. “Not only is the gas pedal on,says University of Colorado, Boulder, wildlife scientist Jennifer Balch,but the brakes are also off.” [25]. But what is even more concerning is that forest fires facilitate the spread of radionuclides over large distances by way of resuspension, especially in already contaminated areas like Chernobyl.
Thus, in concert with significantly increasing the growth rate of nuclear energy generation, we must also promote and conduct afforestation at a greater pace while adopting improved technology for even more secure disposal of radioactive wastes, all while transitioning to cleaner forms of energy. Between 2002 and 2020, however, forest area in the US did not increase significantly. Furthermore, in developing countries such as India, access to renewable energy is much lower compared to its consumption of fossil fuels. This is mainly attributable to the lack of required technological growth and generally poor economic conditions of the populace, further slowing the transition from non-renewables to cleaner forms of energy.
In summary, for the entire world population to reach the status of a Kardashev Type I civilization, we must develop and enable access to more advanced technology for all responsible nations while making renewable energy accessible to all parts of the world, facilitated by governments and private businesses. Only through the full realization of our mutual needs, and with broad cooperation, will humanity acquire the key to not only avoiding the Great Filter, but continue our ascent to Type I, and beyond.

Author Contributions

Conceptualization, J.H.J.; methodology, J.H.J. and F.F.; software, F.F.; validation, J.H.J., P.E.R., K.A.F., P.D., P.O. and A.Z.; formal analysis, J.H.J. and F.F.; investigation, J.H.J. and F.F.; resources, J.H.J.; data curation, F.F. and P.D.; writing—original draft preparation, F.F., P.E.R. and J.H.J.; writing—review and editing, P.E.R., J.H.J. and K.A.F.; visualization, F.F. and J.H.J.; supervision, J.H.J. and Z.-H.Z.; project administration, J.H.J.; funding acquisition, J.H.J. and Z.-H.Z. All authors have read and agreed to the published version of the manuscript.

Funding

This research received no external funding.

Institutional Review Board Statement

This article has been approved for unlimited release by the Document Review Services at the Jet Propulsion Laboratory (JPL), California Institute of Technology. JPL Record: URS307037; Submitted by author: Jonathan H Jiang on 03/10/2022; Document Type: Journal Article; Title: Avoiding the Great Filter: Predicting the Timeline for Humanity to Reach Kardashev Type I Civilization; The JPL clearance number is CL#CL#22-2291.

Data Availability Statement

The data and software used for this study are accessible via a sandbox at https://civilization-paper.herokuapp.com(accessed on 18 March 2022), where one can also run the code automatically. For additional questions regarding data sharing, please contact the corresponding author at [email protected].

Acknowledgments

This work was supported by the Jet Propulsion Laboratory, California Institute of Technology, under contract with NASA. We also thank the support by the department of Astronomy, Beijing Normal University of China, Vivekananda Mission High School of India, and International and Political Studies, Jagiellonian University of Poland.

Conflicts of Interest

The authors declare no conflict of interest.

References

  1. Kardashev, N.S. Transmission of Information by Extraterrestrial Civilizations. Sov. Astron. 1964, 8, 217. Available online: https://articles.adsabs.harvard.edu/pdf/1964SvA.8.217K (accessed on 6 May 2022).
  2. Lemarchand, G.A. Detectability of Extraterrestrial Technological Activities. SETIQuest 1995, 1, 3–13. Available online: http://www.coseti.org/lemarch1.htm (accessed on 6 May 2022).
  3. Dyson, F.J. Search for Artificial Stellar Sources of Infrared Radiation. Science 1960, 131, 1667–1668. [Google Scholar] [CrossRef] [PubMed]
  4. Tate, K. Dyson Spheres: How Advanced Alien Civilizations Would Conquer the Galaxy. Space.com, 14 January 2014. Available online: https://www.space.com/24276-dyson-spheres-how-advanced-alien-civilizations-would-conquer-the-galaxy-infographic.html(accessed on 6 May 2022).
  5. Bradbury, R. Matrioshka Brains,1999. Available online: https://www.gwern.net/docs/ai/1999-bradbury-matrioshkabrains.pdf (accessed on 6 May 2022).
  6. Dyson, F.J. The Search for Extraterrestrial Technology, in Perspectives in Modern Physics (Essays in Honor of Hans Bethe); Marshak, R.E., Ed.; John Wiley & Sons: New York, NY, USA, 1966. [Google Scholar]
  7. Dvorsky, G. Remembering Robert Bradbury. In Sentient Developments; 2011; Available online: http://www.sentientdevelopments.com/2011/03/remembering-robert-bradbury.html (accessed on 6 May 2022).
  8. Criswell, D.R. Solar System Industrialization: Implications for interstellar migrations. In Interstellar Migration and the Human Experience; Ben, R.F., Eric, M.J., Eds.; University of California Press: Berkeley, CA, USA, 1985; pp. 50–87. [Google Scholar]
  9. Reeves, H. Atoms of Silence: An Exploration of Cosmic Evolution; MIT Press: Cambridge, MA, USA, 1985. [Google Scholar]
  10. Beech, M. Rejuvenating the Sun and Avoiding other Global Catastrophes; Springer: Berlin/Heidelberg, Germany, 2008. [Google Scholar]
  11. Hsiao, T.Y.; Goto, T.; Hashimoto, T.; Santos, D.J.D.; On, A.Y.L.; Kilerci-Eser, E.; Wong, Y.H.V.; Kim, S.J.; Wu, C.K.-W.; Ho, S.C.-C.; et al. A Dyson sphere around a black hole. Mon. Not. R. Astron. Soc. 2021, 506, 2. [Google Scholar] [CrossRef]
  12. Sagan, C. The Cosmic Connection: An Extraterrestrial Perspective; Cambridge University Press: Cambridge, UK, 1973; ISBN 13:978-0440133018. [Google Scholar]
  13. Kaku, M. The Physics of Interstellar Travel: To One Day, Reach the Stars. Available online: https://mkaku.org/home/articles/the-physics-of-interstellar-travel/ (accessed on 18 August 2008).
  14. Namboodiripad, A.; Nimal, C.N. Predicting the Timeline for Earth Achieving Kardashev Scale Type 1 Status. J. Sci. Technol. 2021, 6, 2456–5660. [Google Scholar]
  15. Hanson, R. The Great Filter—Are We Almost Past It? 1998. Available online: http://hanson.gmu.edu/greatfilter.html (accessed on 4 March 2022).
  16. Jiang, J.H.; Rosen, P.E.; Fahy, K.A. Avoiding the “Great Filter”: A Projected Timeframe for Human Expansion Off-World. Galaxies 2021, 9, 53. [Google Scholar] [CrossRef]
  17. Opinions of the CCCP of China and the State Council on Completely, Accurately and Comprehensively Implementing the New Development Concept in Achieving Carbon Neutralization. 22 September 2021. Available online: http://www.gov.cn/zhengce/2021-10/24/content_5644613.htm (accessed on 6 May 2022).
  18. European Climate Law. Official Journal of the European Union, 7 September 2021.
  19. Mansoori, G.A.; Agyarko, L.B.; Estevez, L.A.; Fallahi, B.; Gladyshev, G.; dos Santos, R.G.; Niaki, S.; Perišić, O.; Sillanpää, M.; Tumba, K.; et al. Fuels of the Future for Renewable Energy Sources (Ammonia, Biofuels, Hydrogen). arXiv 2021, arXiv:2102.00439. [Google Scholar]
  20. Wang, M.; Han, J.; Dunn, J.B.; Cai1, H.; Elgowainy, A. Well-to-wheels energy use and greenhouse gas emissions of ethanol from corn, sugarcane and cellulosic biomass for US use. Environ. Res. Lett. 2012, 7, 045905. [Google Scholar] [CrossRef] [Green Version]
  21. IEA. Data and Statistics. Available online: https://www.iea.org/data-and-statistics/data-browser?country=WORLD&fuel=Energy%20transition%20indicators&indicator=ETISharesInPowerGen (accessed on 6 May 2022).
  22. Wilson, E.O. Debate at the Harvard Museum of Natural History; Harvard Museum of Natural History: Cambridge, MA, USA, 2009. [Google Scholar]
  23. Smičiklas, I.; Sljivic-Ivanovic, M. Radioactive Contamination of the Soil: Assessments of Pollutants Mobility with Implication to Remediation Strategies. In Soil Contamination–Current Consequences and Further Solutions; Larramendy, M., Soloneski, S., Eds.; IntechOpen: London, UK, 2016. [Google Scholar] [CrossRef] [Green Version]
  24. Dresler, S.; Wójciak-Kosior, M.; Sowa, I.; Strzemski, M.; Sawicki, J.; Kováčik, J.; Blicharski, T. Effect of Long-Term Strontium Exposure on the Content of Phytoestrogens and Allantoin in Soybean. Int. J. Mol. Sci. 2018, 19, 3864. [Google Scholar] [CrossRef] [PubMed] [Green Version]
  25. Nepstad, S.L. The 2010 Amazon Drought. Science 2011, 331, 554. [Google Scholar]
Figure 1. The estimation of the share of fire power generation (2020–2050).
Galaxies 10 00068 g001
Figure 2. The consumptions of (a) coal, (b) natural gas, and (c) crude oil, NGL, and feedstocks, from 1971 to 2050.
Galaxies 10 00068 g002
Figure 3. The total energy supply of nuclear and renewables from 1971 to 2019.
Galaxies 10 00068 g003
Figure 4. The development of nuclear energy under differing conditions.
Galaxies 10 00068 g004
Figure 5. The supply of nuclear and renewable energy in the influenced model.
Galaxies 10 00068 g005
Figure 6. The energy supply in the influenced model. Note: coal is minimal for 1971–2050 and largely coincides with the natural gas line.
Galaxies 10 00068 g006
Figure 7. The K value in the constrained model.
Galaxies 10 00068 g007
Table 1. Annual decay rate from 2030 to 2050 in our model.
YearDecay RateYearDecay Rate
t02.057%204020.567%
20302.057%204122.418%
20313.908%204224.269%
20325.759%204326.120%
20337.610%204427.971%
20349.461%204529.822%
203511.312%204631.673%
203613.163%204733.525%
203715.014%204835.376%
203816.865%204937.227%
203918.716%205039.078%
Publisher’s Note: MDPI stays neutral with regard to jurisdictional claims in published maps and institutional affiliations.

