From SN 2010da to NGC 300 ULX-1: Ten Years of Observations of an Unusual High Mass X-Ray Binary in NGC 300


1
Department of Physics & Astronomy, California State Polytechnic University, Pomona, 3801 W. Temple Ave, Pomona, CA 91768, USA
2
Max Planck Institute for Extraterrestrial Physics, Giessenbachstraße 1, 85748 Garching, Germany
3
Division of Physics, Mathematics & Astronomy, California Institute of Technology, 1200 E. California Blvd, Pasadena, CA 91125, USA
4
Department of Space Astronomy & Astrophysics, Japan Aerospace Exploration Agency, 3-1-1 Yoshinodai, Chuo-ku, Sagamihara, Kanagawa 252-5210, Japan
*
Author to whom correspondence should be addressed.
Galaxies 2020, 8(1), 17; https://0-doi-org.brum.beds.ac.uk/10.3390/galaxies8010017
Submission received: 2 November 2019
/
Revised: 24 January 2020
/
Accepted: 10 February 2020
/
Published: 18 February 2020
(This article belongs to the Special Issue High-Mass X-ray Binaries and Ultraluminous X-ray Sources Hosting Neutron Stars)
Abstract
:In May 2010, an intermediate luminosity optical transient was discovered in the nearby galaxy NGC 300 by a South African amateur astronomer. In the decade since its discovery, multi-wavelength observations of the misnamed “SN 2010da” have continually reshaped our understanding of this high mass X-ray binary system. In this review, we present an overview of the multi-wavelength observations and attempt to understand the 2010 transient event, and later, the reclassification of this system as NGC 300 ULX-1: a red supergiant + neutron star ultraluminous X-ray source.
1. Initial Discovery
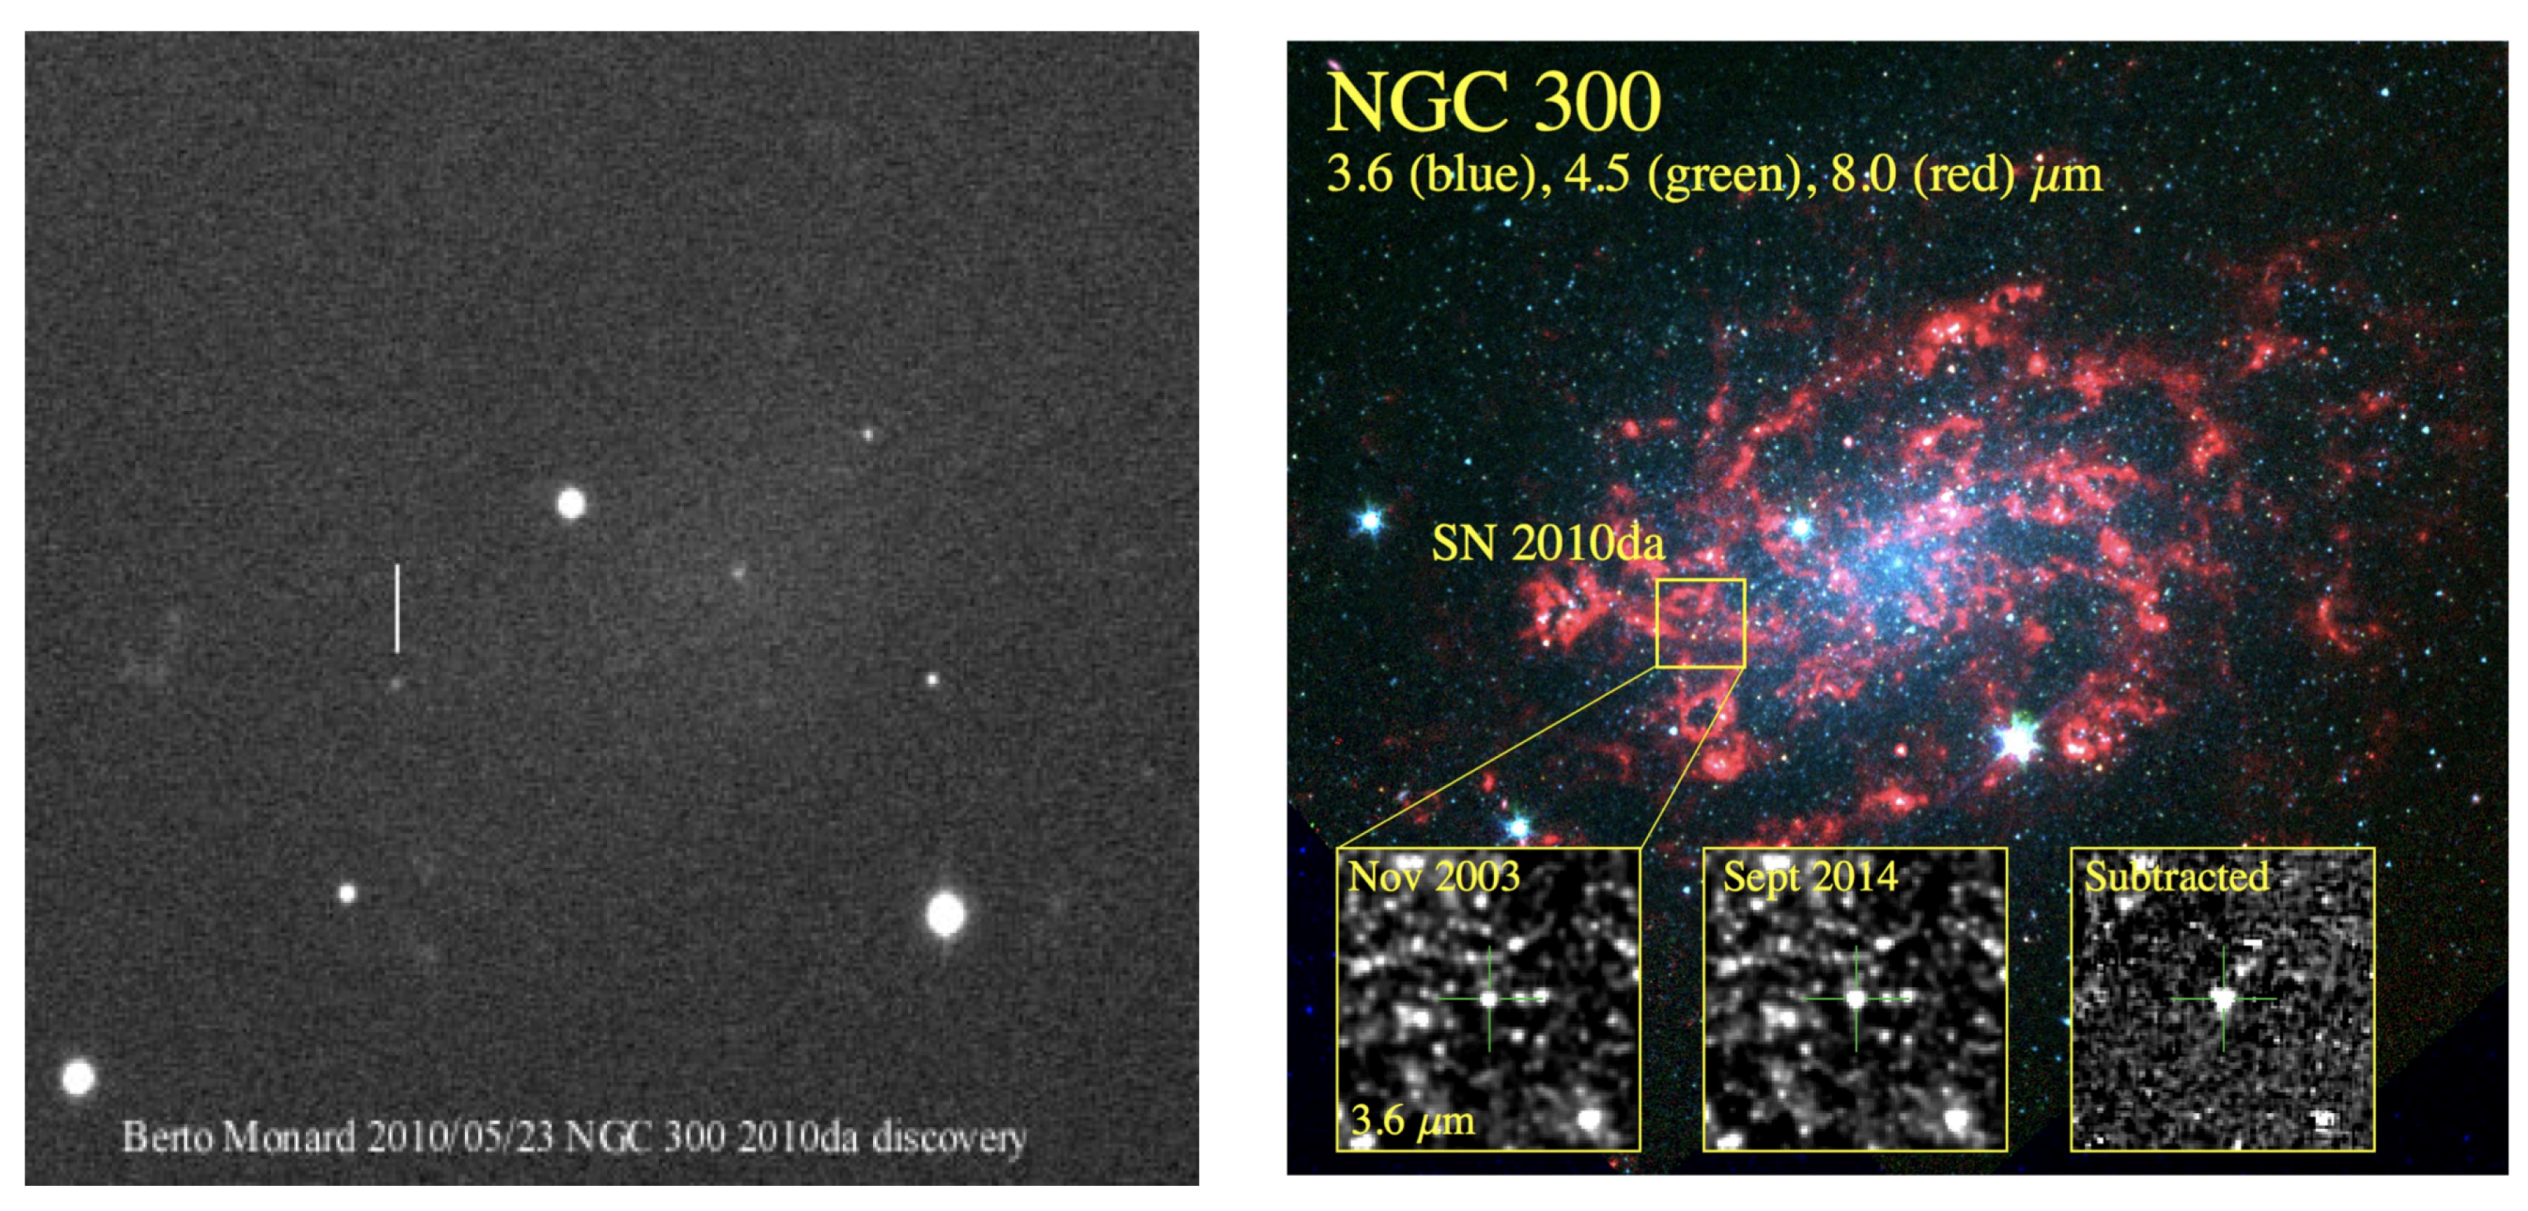
On May 25 2010, the amateur astronomer L.A.G. Monard of Pretoria, South Africa, reported the discovery of an optical transient in the nearby spiral galaxy NGC 300, shown in Figure 1 [1]. The event was given the supernova (SN) designation SN 2010da. The apparent V-band magnitude from the discovery images (16.0 ± 0.2 mag), however, immediately presented a contradiction: at the distance of the host galaxy (2 Mpc [2]), the implied absolute magnitude ( at maximum; [3]) was too low to be consistent with a true SN explosion. Follow-up spectroscopy confirmed that the transient event was not a genuine SN, and instead resembled a luminous blue variable (LBV)-like outburst from a dust-enshrouded, massive star [4,5]. Multi-color imaging of the outburst was obtained with the SMARTS 1.3m telescope at Cerro Tololo ∼2 days after the initial discovery [6] and ∼3 weeks post-outburst [7].
SN 2010da thus joined the heterogeneous group of objects known as “supernova impostors," which are frequently interpreted as massive stars experiencing non-terminal eruptions or outbursts [5,6]. Additional spectroscopy from the SOAR 4.1 m telescope spanning 400–860 nm [5] showed similarity to the SN impostor SN 1997bs [10]. The blue continuum emission of SN 2010da shortly after the outburst was dominated by strong H emission, with a full width at half maximum (FWHM) of ∼1000 km s and no evidence of a P Cygni profile, along with other narrow Balmer lines and a possible detection of weak He II 4686 [5]. These results stood in contrast to those obtained with near-simultaneous GMOS on Gemini-South by Chornock and Berger [4], which observed an H FWHM of ∼660 km s and higher-order Balmer lines with clear P-Cygni profiles. These spectral properties led Chornock and Berger [4] to speculate that the SN 2010da event originated in “an LBV-like outburst of a massive star”.
Although it was immediately acknowledged that the outburst luminosity of SN 2010da was too low to be a true SN, it was also too low to be an LBV eruption; the 2010 outburst of SN 2010da was ∼200 times fainter than the Great Eruption of Car in 1845. To further complicate the interpretation, a bright X-ray point source was detected by the Neil Gehrels Swift Observatory within hours of the optical detection, with an approximate 0.2–10 keV luminosity of erg s [11]. The X-ray emission was initially attributed to stellar processes (the initial choice of X-ray spectral model by Immler et al. [11] was a thermal plasma, the usual choice for erupting stars and SN impostors, and Smith et al. [12] described the high of SN 2010da in the context of shocks during giant stellar eruptions); however, the brightest known stellar X-ray emitters (colliding wind binaries) have luminosities on the order of ∼10 erg s [13] and the highest observed X-ray luminosities from an LBV outburst reached only erg s [14], orders of magnitude lower than what was observed by Swift. A new interpretation was needed to explain the high X-ray emission observed.
Understanding the SN 2010da System Prior to Outburst
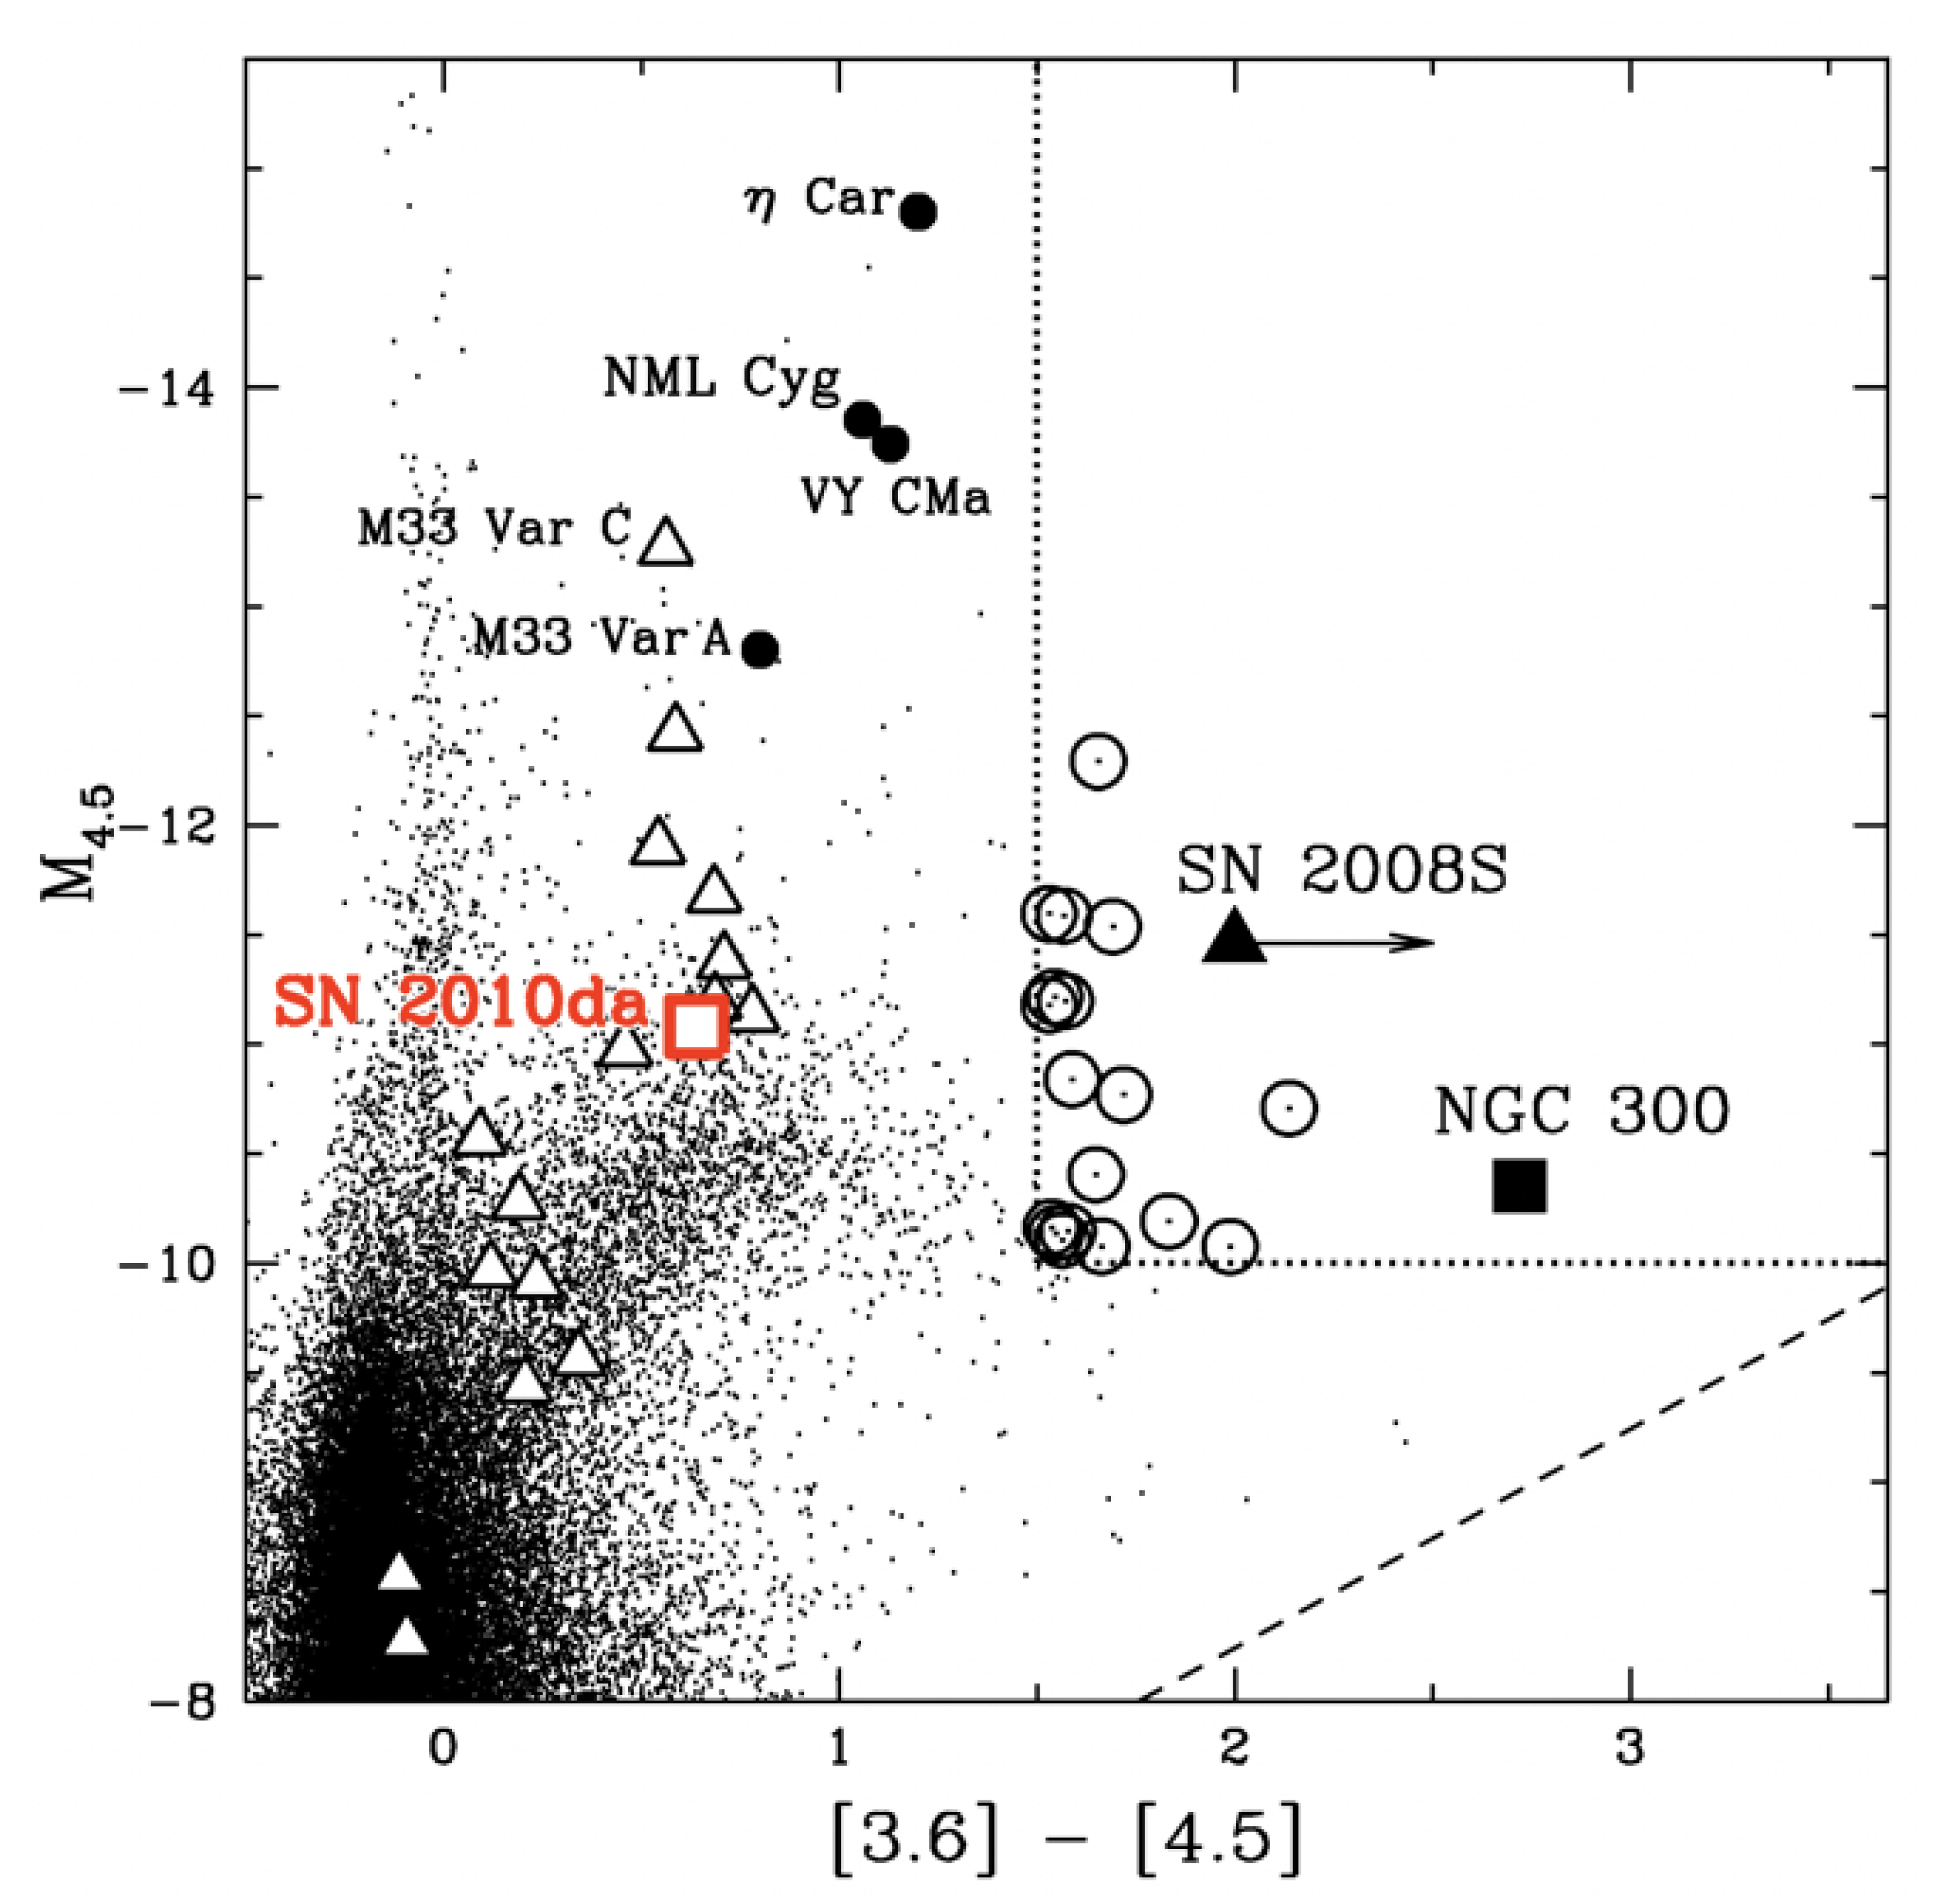
As photometric and spectroscopic follow-up of SN 2010da commenced, several groups searched for the SN 2010da “progenitor” system (e.g., the system prior to the 2010 transient event) in archival observations. Mid-infrared (IR) photometry from archival Spitzer/IRAC imaging data obtained in December 2007 [3,15] revealed that the progenitor of SN 2010da was heavily obscured and shared a similar position in a mid-IR color–magnitude diagram (CMD; see Figure 2) as luminous blue variable (LBV) candidates [15,16,17,18].
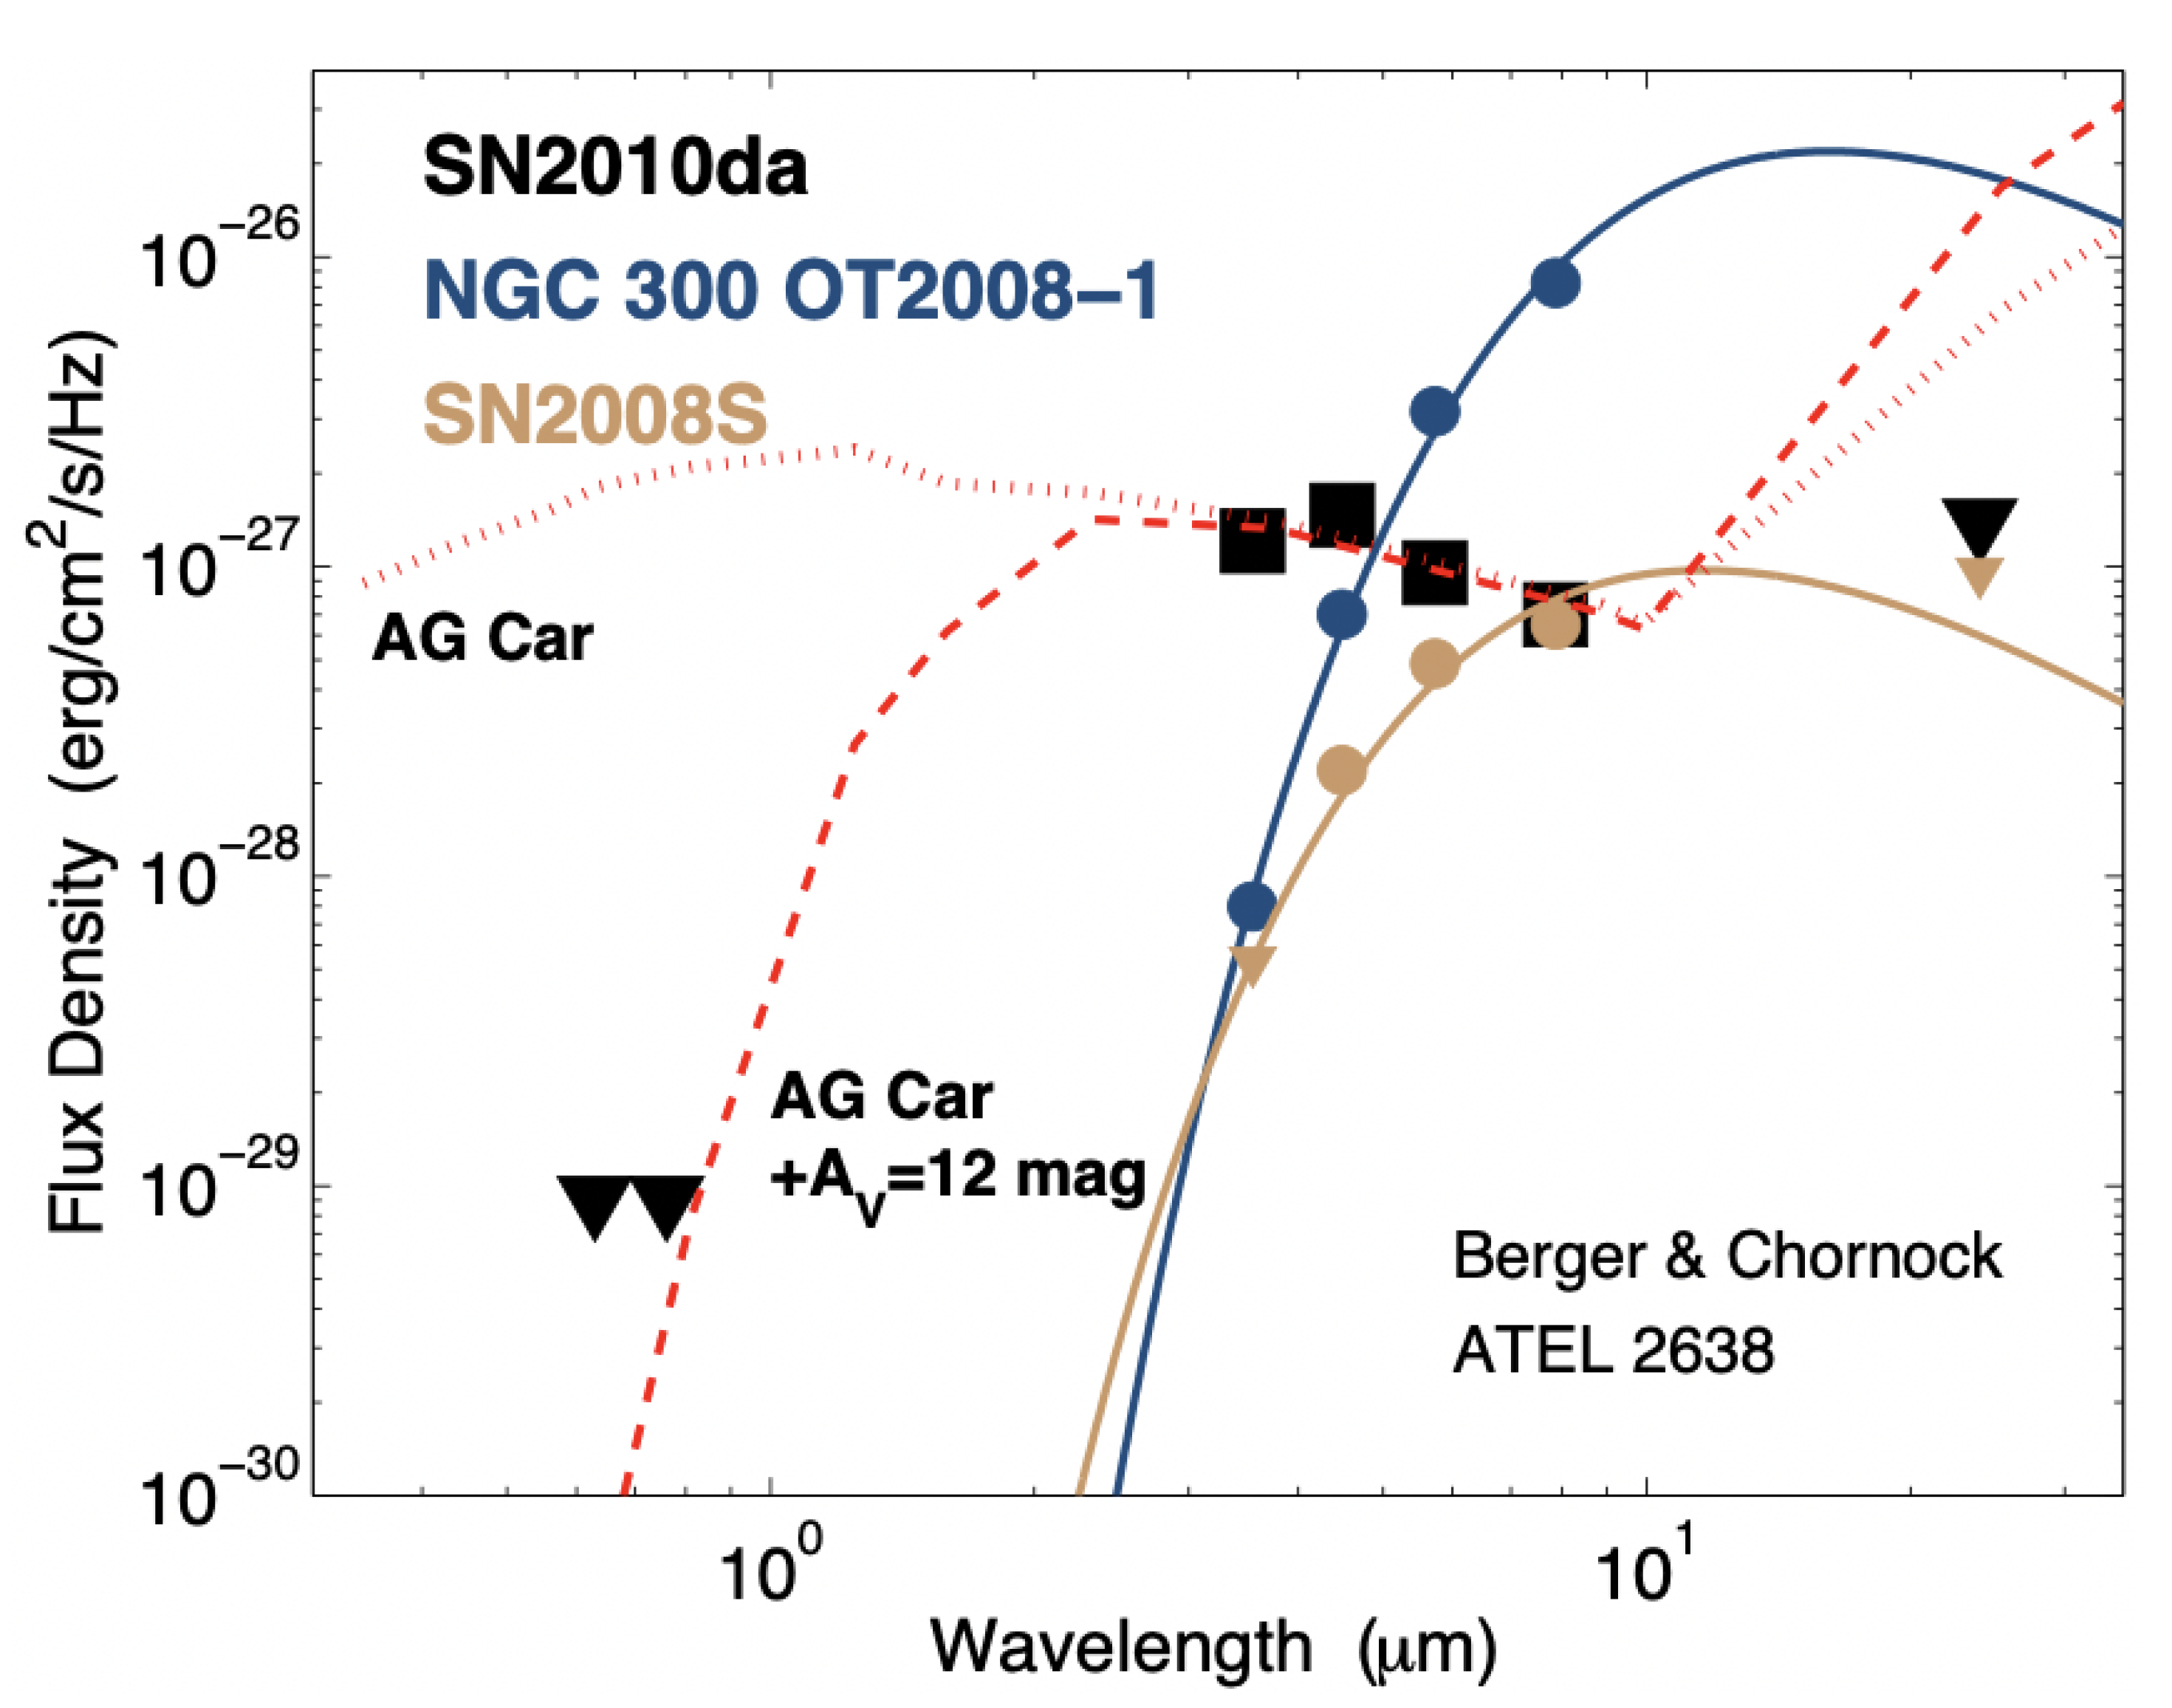
The SN 2010da progenitor was found to have brightened by ∼0.5 mag in the ∼6 months prior to the 2010 outburst, indicating a period of enhanced activity prior to the optical outburst [15]. Although IR observations of the progenitor system showed consistency with known local volume LBVs [3,15], archival optical and 24 m images provided a hint at a discrepancy. Berger and Chornock [19] reported the non-detection of the SN 2010da progenitor in archival Magellan/Megacam images, which were obtained approximately one year earlier to follow up a prior transient in NGC 300 [20,21]. No optical progenitor was detected in either the r or i band to a limiting magnitude of 24 mag. A first look at the progenitor IR spectral energy density (SED, shown in Figure 3) of SN 2010da showed it to be significantly bluer than previously studied optical transients, and the known Galactic LBV AG Car [19]. It was therefore proposed that the SN 2010da progenitor was enshrouded by a thick cocoon of dust ( mag), most of which was destroyed in the subsequent outburst. Although this hypothesis accommodated the optical upper limits, Berger and Chornock [19] noted that the 24 m flux limit was still roughly “an order of magnitude lower than expected based on the SED of AG Car”.
2. SN 2010da as a High Mass X-Ray Binary
Four months after the initial outburst, NGC 300 was observed with the Chandra X-ray Observatory, and SN 2010da was observed with a 0.35–8 keV X-ray luminosity of erg s [22]. In order to reconcile the X-ray observations with the mid-IR and optical studies, Binder et al. [22] suggested that SN 2010da was actually a high-mass X-ray binary (HMXB) in NGC 300, possibly composed of a neutron star (NS, due to the hardness of the X-ray spectrum) and some sort of evolved, massive (“LBV-like”) companion. This observation revealed the first instance of a SN impostor (or intermediate luminosity optical transient) originating in an HMXB.
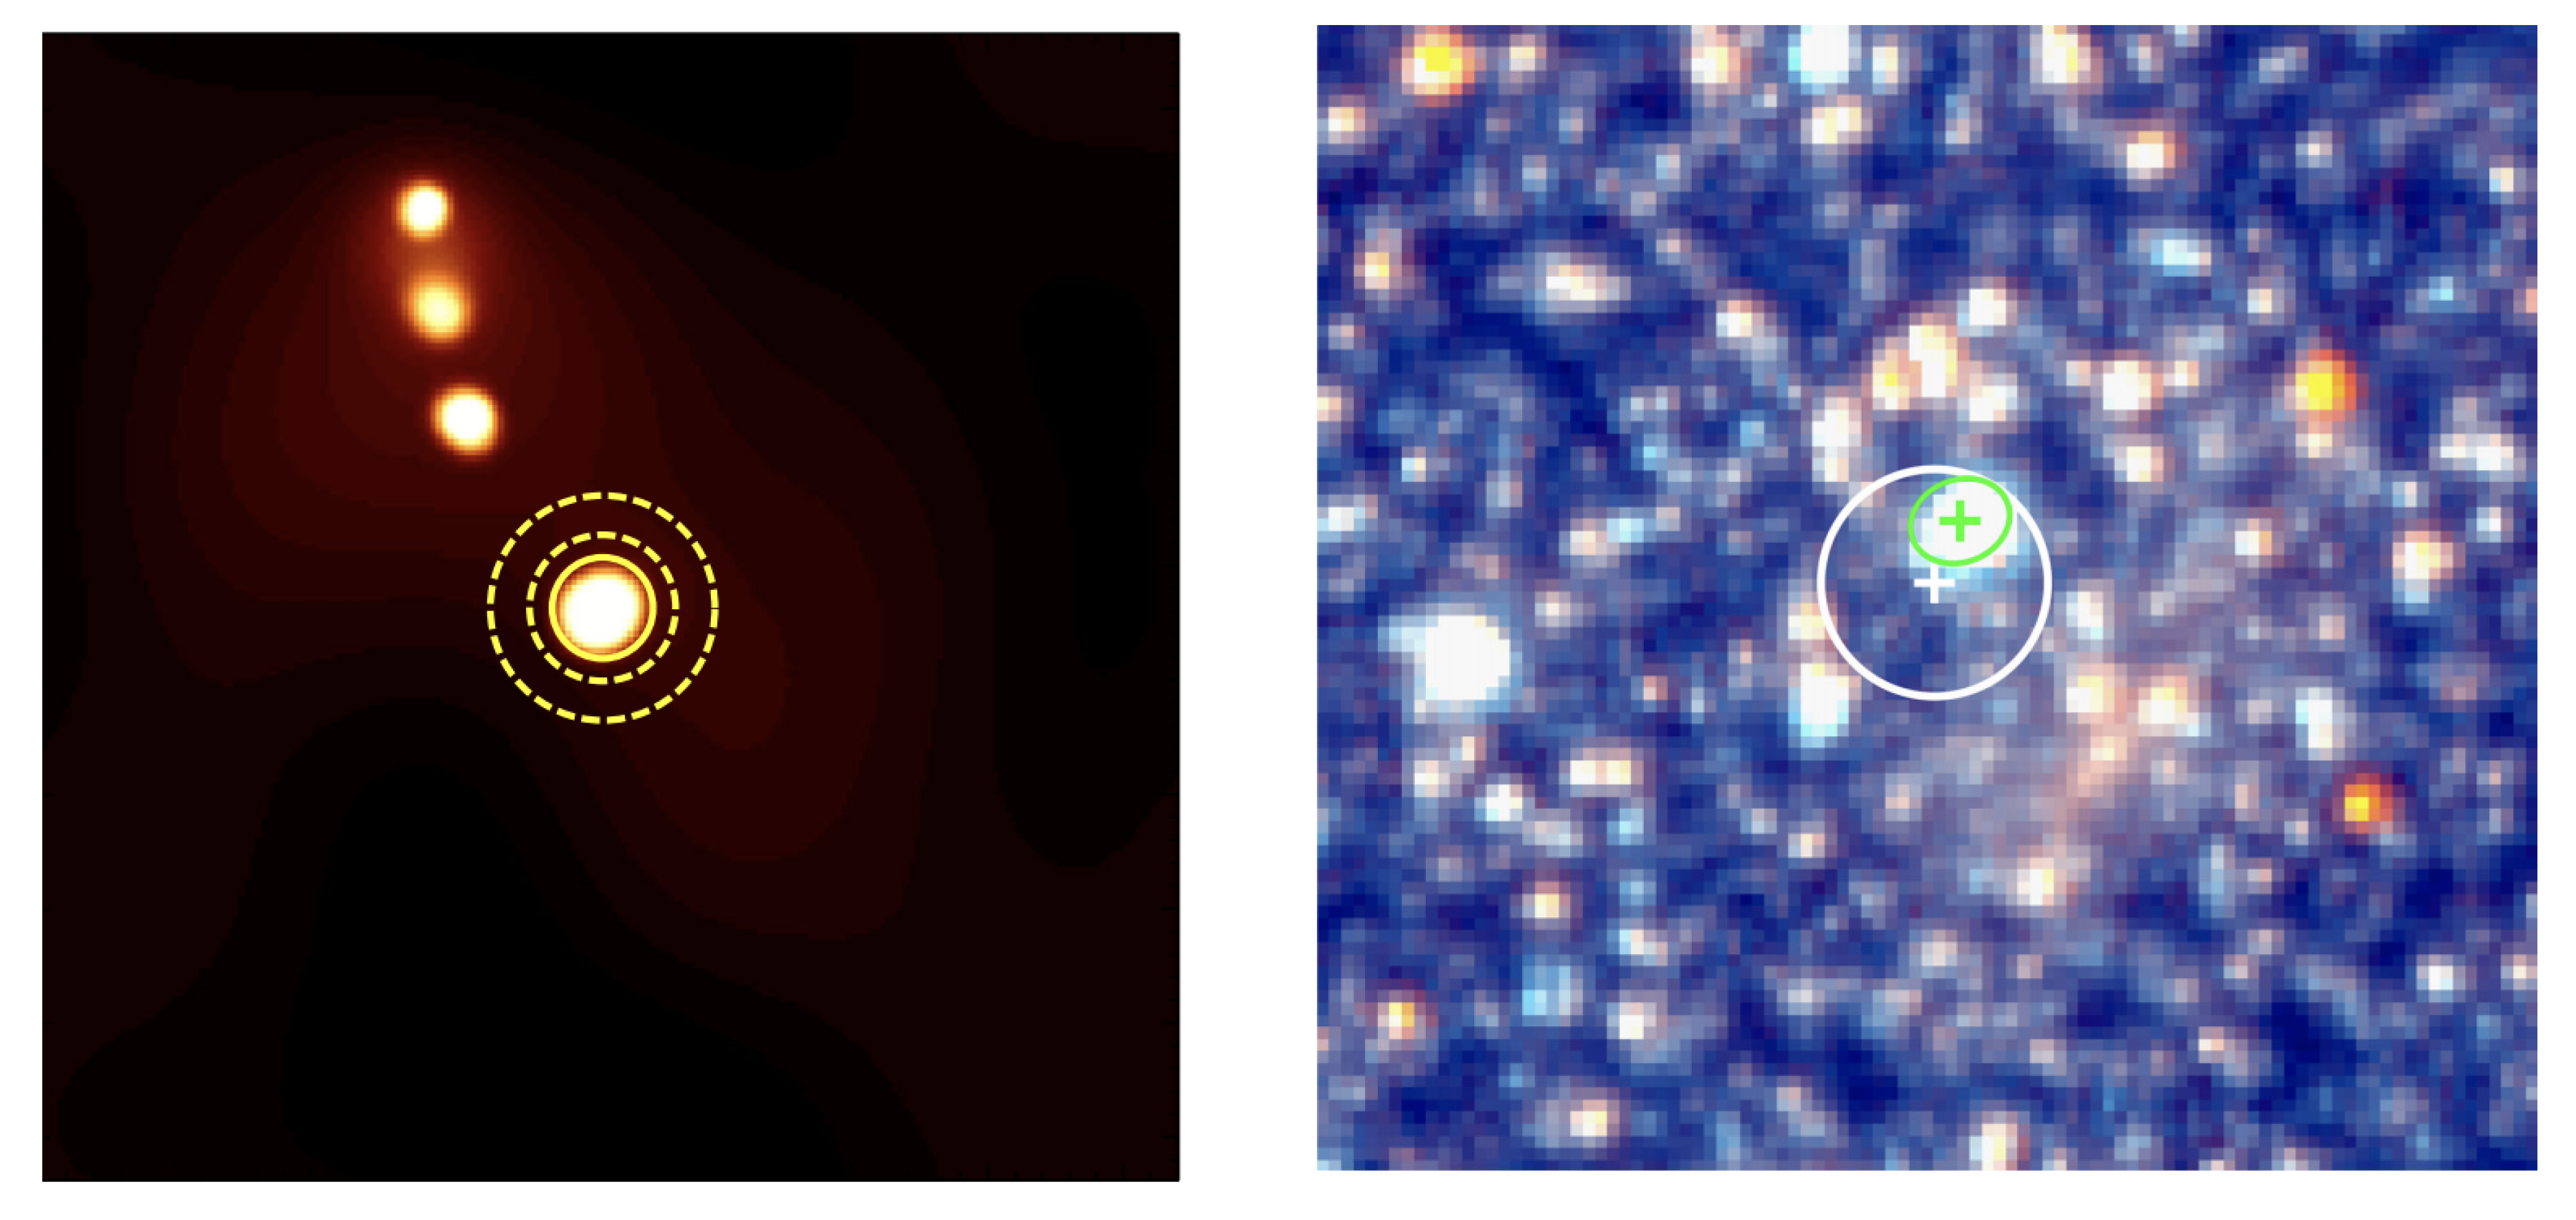
In 2016, a trio of papers investigating the nature of SN 2010da under the HMXB paradigm were published. New Chandra and Hubble Space Telescope imaging obtained in 2014 [23] revealed a variable X-ray source coincident with the spatial position of SN 2010da and a bright, blue optical source consistent with a blue supergiant or LBV-like star (shown in Figure 4); the prevalence of young stars in the vicinity of SN 2010da suggests the system has an age of ≤ 5 Myr from population synthesis modeling. Lau et al. [9] presented detailed IR SED modeling of the SN 2010da progenitor and progeny, which indicated that a large fraction of the dust that initially enshrouded the SN 2010da progenitor was destroyed during the 2010 outburst. The relatively blue color of the 2010 outburst compared to other SN impostors was noted by Bond [6], and low reddening in 2014 ( mag) was also inferred from stellar population synthesis modeling in Binder et al. [23]. Using the radiative tranfer code DUSTY [24], Lau et al. [9] determined the inner radius of dust emission from the SN 2010da system to be ∼20–40 AU at ∼2.5 years post-outburst. The close proximity to the central system (shock speeds of ∼660 km s from the outburst H emission line FWHM [4], would sweep surviving dust out to ∼300 AU assuming the stellar wind/dust interaction models of [25]) suggests that the “post-outburst emission in the mid-IR is primarily associated with newly formed dust from the surviving central system.”
High and medium/low resolution optical spectroscopy with Gemini and multi-wavelength photometry of the pre- and post-outburst SN 2010da system was described in Villar et al. [26]; notably, multi-component emission lines of hydrogen Balmer, Paschen and Ca II revealed a complex circumstellar environment, although the continuum emission was unabsorbed. The presence of He II 4686 and coronal Fe emission lines was also highlighted and first attributed to a compact companion.
It was additionally noted during this time that the X-ray energetics favored a highly eccentric binary orbit (; [9]), consistent with the young age inferred from the spectral population synthesis modeling of young stars in the vicinity of the SN 2010da system [23]. Although mid-IR observations of the progenitor yielded firm photometric detections, no X-ray source was detected in pre-2010 archival XMM-Newton observations down to a limiting luminosity of erg s [22]. This lack of a previous X-ray detection and young apparent age led Binder et al. [23] to hypothesize that the 2010 outburst may have represented the first onset of X-ray production in the system, consistent with simulations of HMXB formation [27].
3. The Ultraluminous X-Ray Source
In 2016, the SN 2010da HMXB system was serendipitously observed for the first time in a ultraluminous (ULX) state during a long and simultaneous XMM-Newton/NuSTAR observation performed between December 16 and 20 [28]. The X-ray flux of the object increased by roughly two orders of magnitude above the 2014 Chandra observations, yielding a 0.3–30 keV unabsorbed luminosity of erg s. Off-nuclear point sources exhibiting such high X-ray luminosities (e.g., exceeding the Eddington limit of an isotropically-emitting 10 black hole) are collectively referred to as ultraluminous X-ray sources, ULXs [29]. The system hence received a new designation: NGC 300 ULX-1.
ULXs were initially thought to be powered by intermediate-mass black holes (100–1000 ). However, it is now known that the majority of these objects are otherwise normal X-ray binaries with stellar-mass compact objects accreting at super-Eddington rates or with non-isotropic emission geometries [29]. Models and simulations of super-Eddington accretion around black holes [30,31,32] predict a geometrically and optically thick accretion disk around the compact object, with an optically thin, evacuated funnel forming along the object’s axis of rotation. Excess radiation pressure is converted into mechanical energy, which launches material away from the compact object in a wide, ultrafast outflow (UFO, with speeds of ). The accretion disks around NSs are more complex due to the presence of strong, persistent magnetic fields, which truncate the inner edge of the accretion disk at much larger radii than for black holes (the magnetospheric radius, , is often used as a proxy for the inner disk radius around a magnetized neutron star; [33,34]). Unlike in their BH counterparts, an accretion column may form in a NS-ULX system, and is thought to be the source of the hard X-ray emission observed from these objects [35,36]. Strong winds from NS-ULXs are therefore indicative of super-Eddington accretion flows beyond [36].
The deep XMM-Newton+NuSTAR observations of NGC 300 ULX-1 yielded numerous insights into the nature of the system, which we discuss in further detail below. Pulsations were found with an average value of 31.6 s, confirming the compact object’s identity as a neutron star (NS), with an incredibly high spin up rate of [28]; see Figure 5. The pulsed fraction was also extremely large, varying from ∼50% at ∼1 keV to ∼75% in the NuSTAR band (∼10–20 keV). Evidence was also found for an ultrafast outflow (UFO) and potential cyclotron resonant scattering feature (CRSF), providing clues to the accretion geometry and interaction with the magnetic field of the NS. At the time of its discovery as a ULX, NGC 300 ULX-1 was only the fourth confirmed NS-ULX.
3.1. Period Evolution
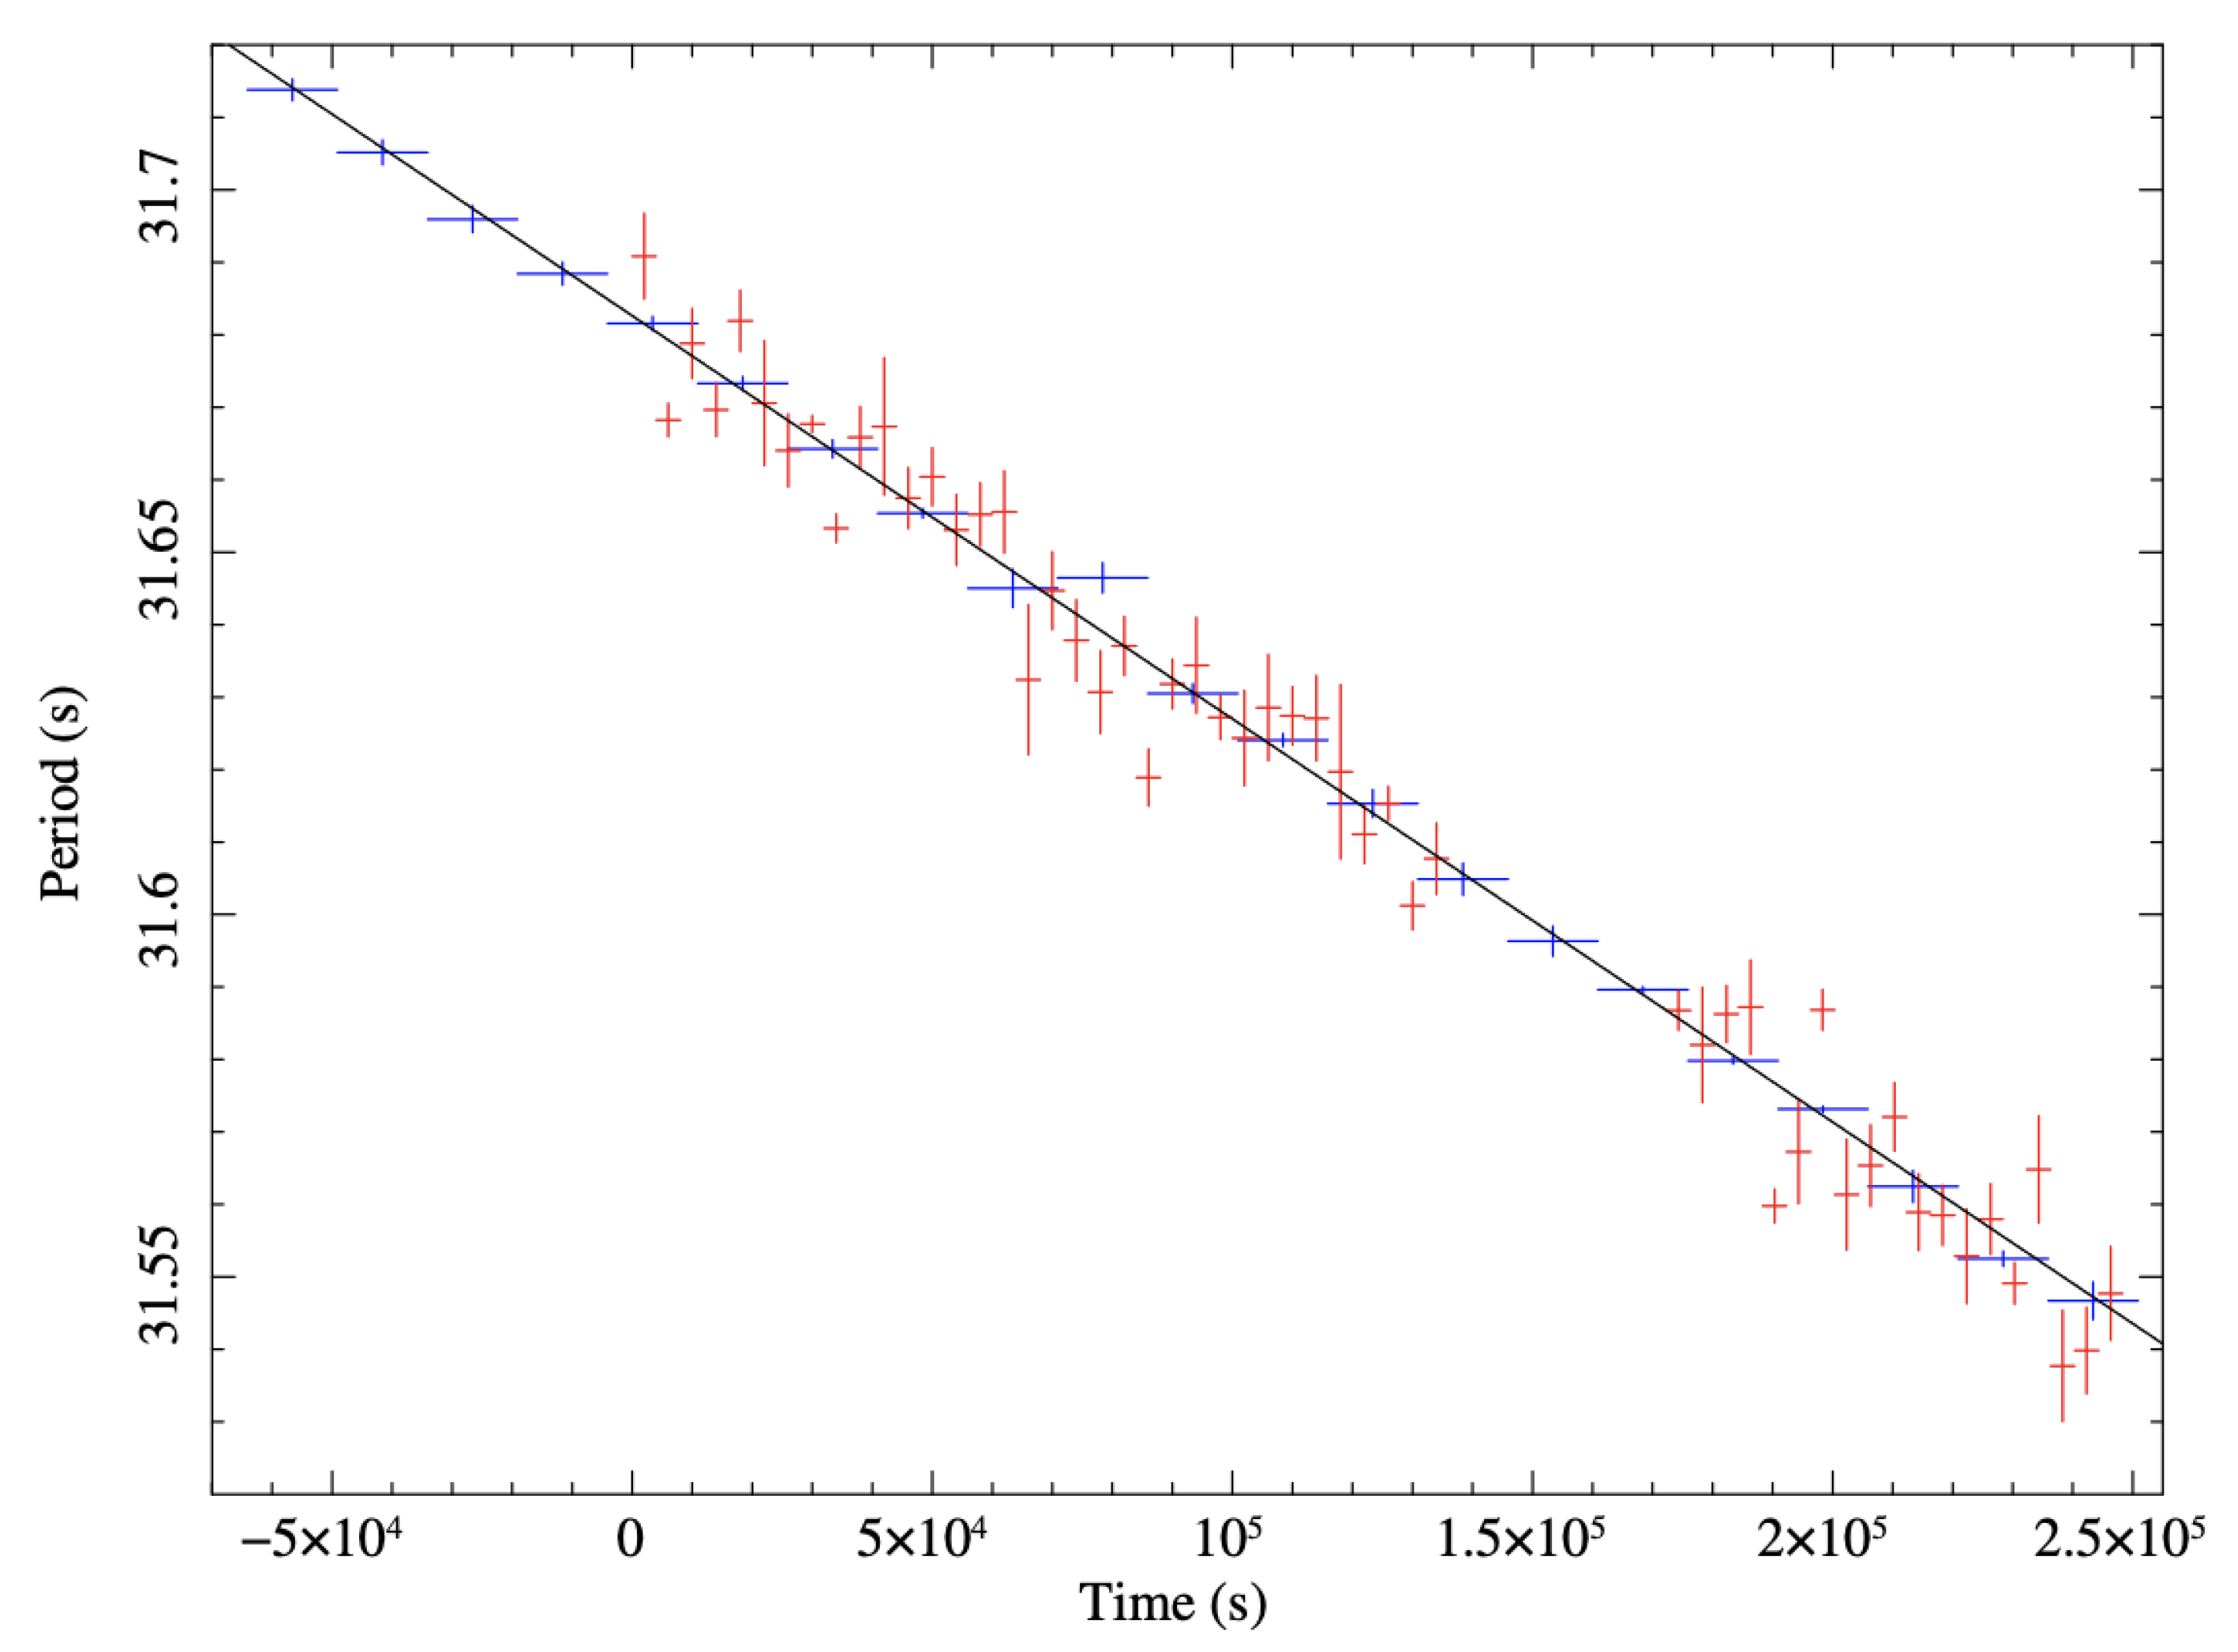
Using archival data, it was shown by Vasilopoulos et al. [37] and Vasilopoulos et al. [33] that the spin period of NGC 300 ULX-1 was as large as 126.3 s in a Chandra observation from 2014 November. Assuming almost steady accretion rate after the initial outburst, the spin-period evolution could only be explained by an accretion disk formed rotating retrograde with respect to the spin of the NS, with the NS spinning down until its rotation was stopped and then starting in the opposite direction [37]. On the other hand, if was two orders of magnitude lower in 2010 than after 2015, then there could be no spin reversal. Although caution must be used in inferring the accretion history of NGC 300 ULX-1 from 2010-2014 due to sparse X-ray observations, the changing scenario appears unlikely, as all available observations of the observed spin evolution and nearly constant X-ray luminosity are consistent with a roughly constant mass accretion rate since the initial 2010 outburst event [33].
A deep analysis of the pulsed period evolution from 2018 February 6 through 2018 October 20 was performed by Ray et al. [38] using NICER data. Three spin-down glitches of magnitudes and Hz (fractional amplitudes and ) were discovered over a span period of 116 d using the coherent timing analysis technique. These glitch amplitudes are larger (and opposite in sign) than any reported radio pulsar glitch. The spin-down nature of these glitches is of particular interest, since many hundreds of radio, X-ray and -ray pulsars have glitches that are spinning up ( > 0, [38] and reference therein). The authors believe that, like in the case of non-accreting pulsars, the glitches are likely resulting from a superfluid in the pulsar’s inner crust and possibly core. An accurate measurement of the pulse period evolution is also generally performed to search for the orbital period of the system. The orbital movement should be revealed through a cyclic variation in the long-term pulse period trend, caused by Doppler shifts. However, to date no evidence of an orbital period has been found for NGC 300 ULX-1 in any existing data set, implying that the system is either almost face-on or that the period is longer than a year.
3.2. The X-Ray Spectrum
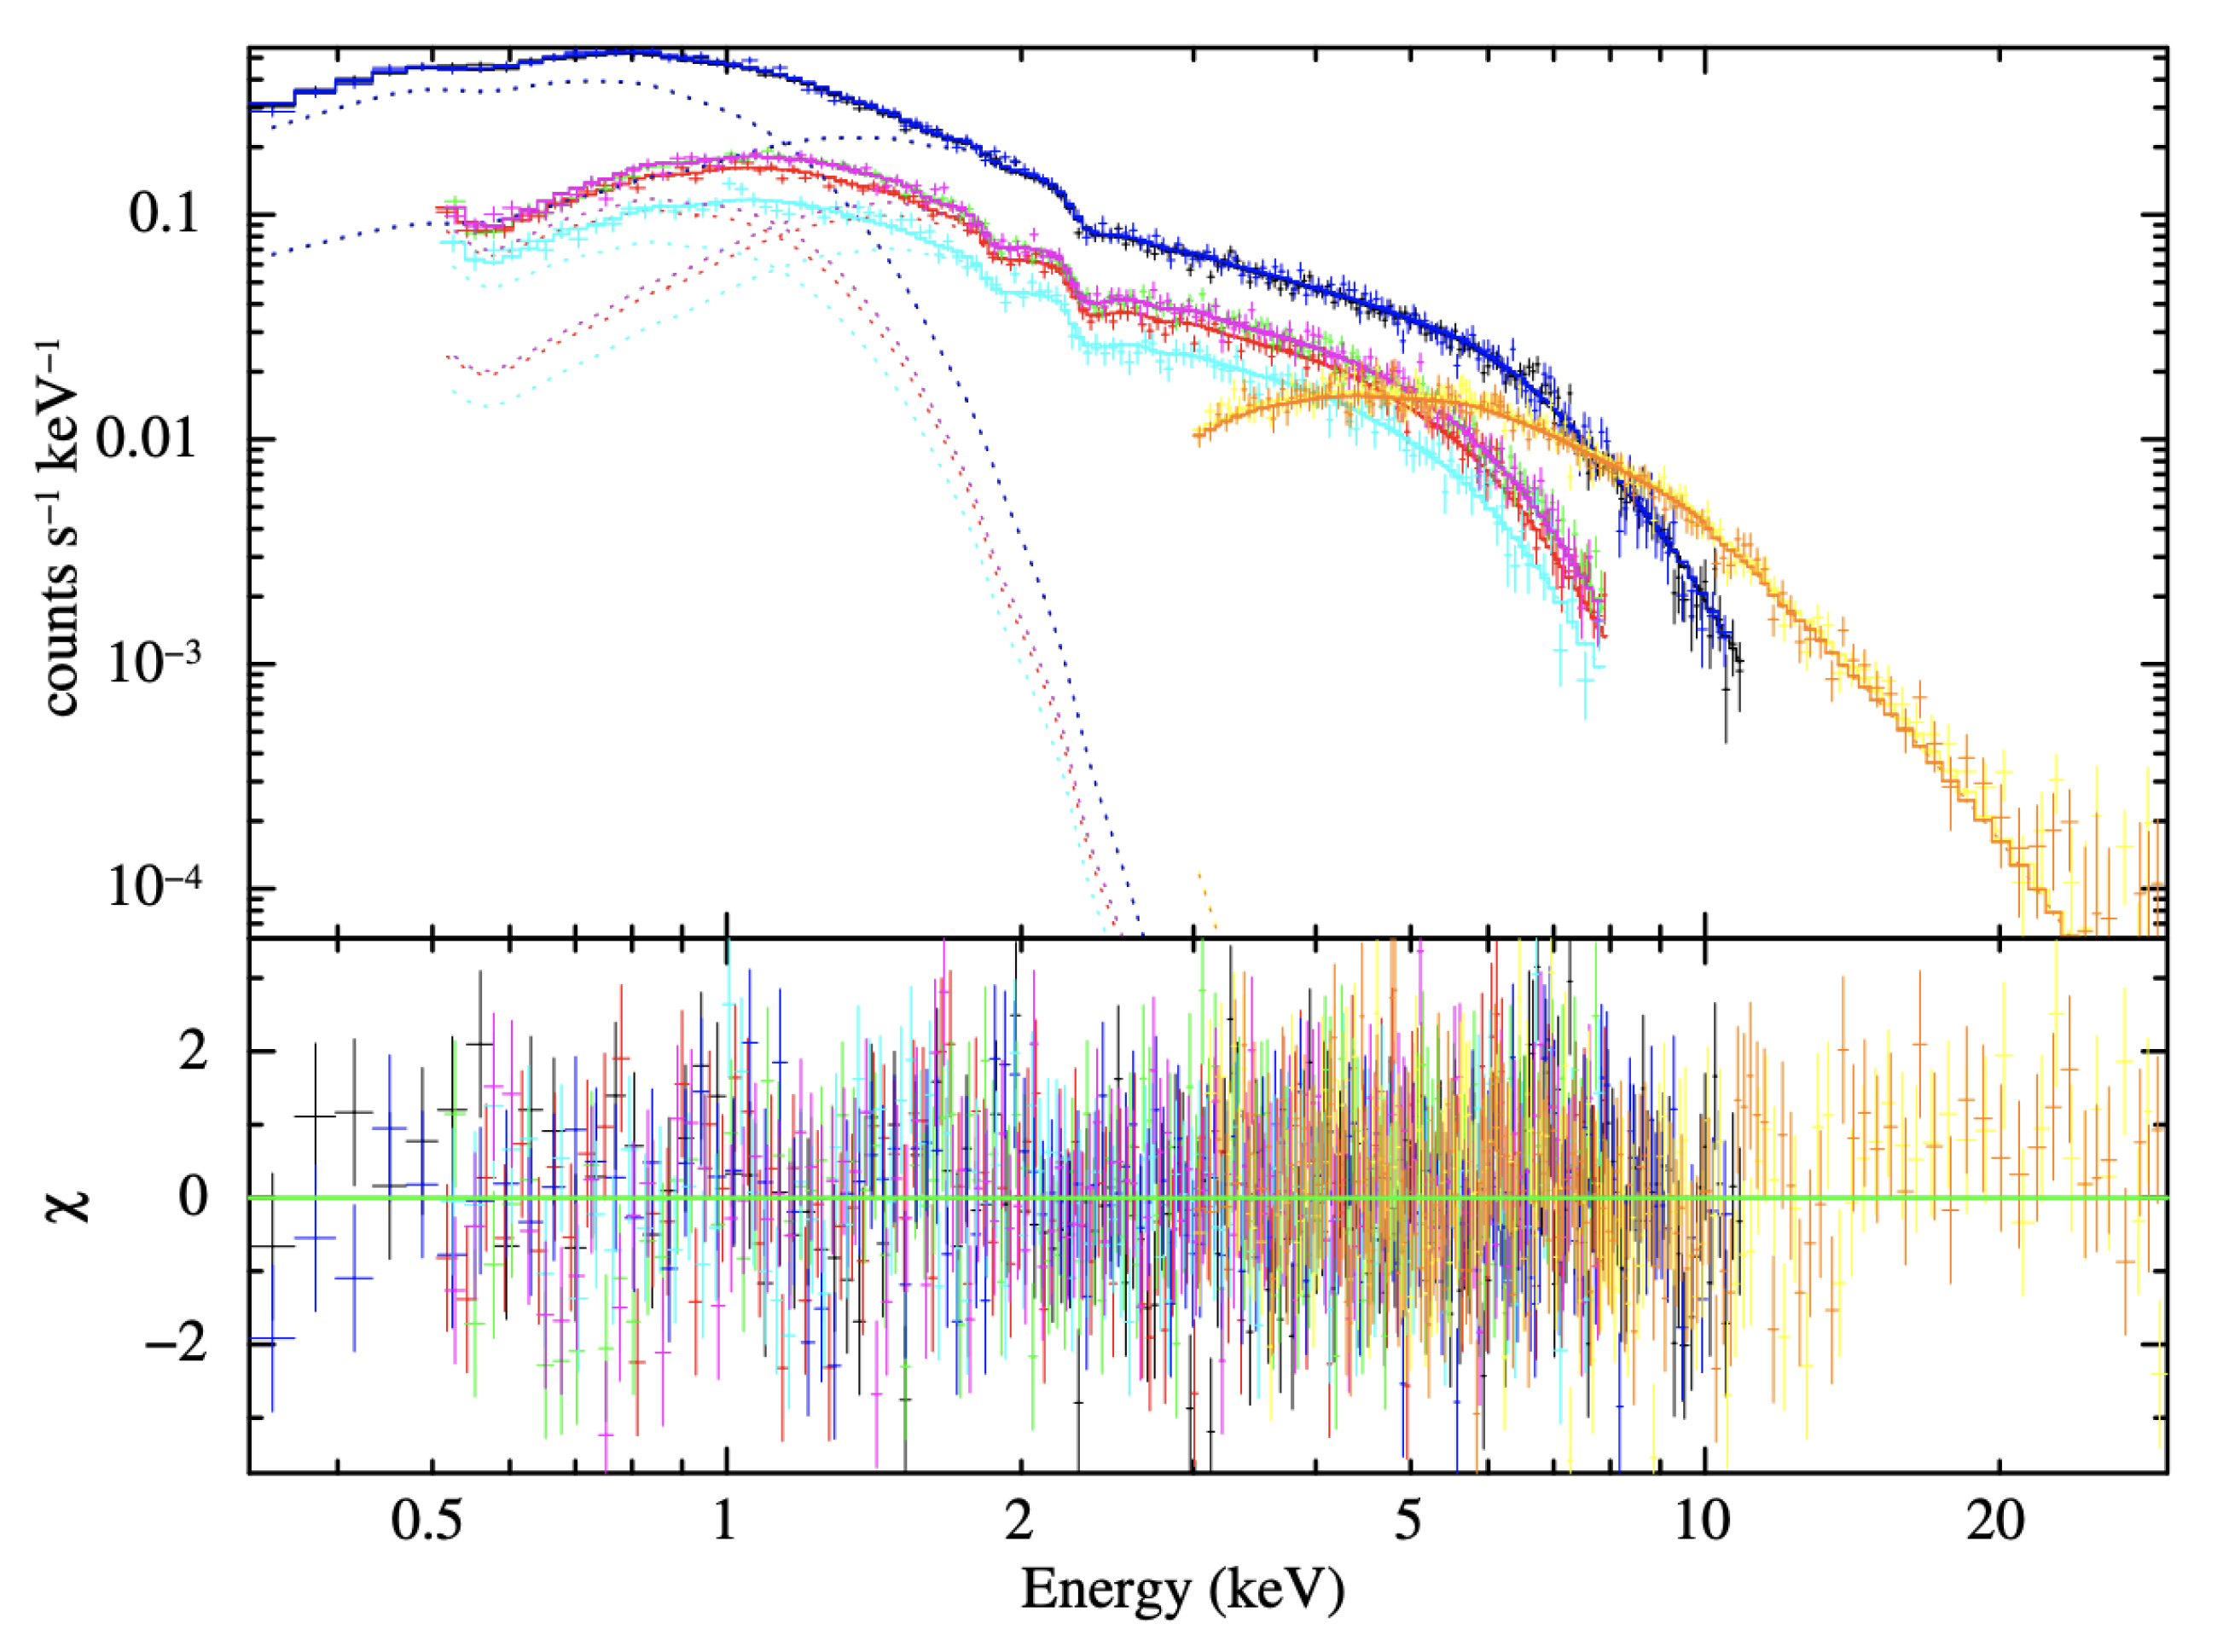
Several detailed spectral models have been tested on both the pulsed and phase-averaged X-ray continuum of NGC 300 ULX-1 using the simultaneous XMM-Newton and NuSTAR observations from 2016 December (see Figure 6). These models attempt to describe two possible models for X-ray emission in the system. In the first model, the pulsating hard component (typically assumed to be a power law with a high-energy “roll-off”) is thought to originate from an accretion column, while a multicolor disk blackbody represents the truncated inner accretion disk. This model was developed to describe observations of several nearby accreting pulsars [39]. Alternatively, the characteristic X-ray “roll-off” can be described with a second hot thermal component ( keV) that originates from an optically thick accretion envelope that engulfs the NS [35]. Pulsations in the hard component are then interpreted as a significant temperature gradient in the spinning accretion envelope as material falls from the magnetospheric radius to the base of the envelope at the top of the accretion column.
In Carpano et al. [28], the authors successfully fit a model composed of two absorption components (one for the interstellar absorption in the light of sight, and one partial-covering absorber in the vicinity of the neutron star), with a disk blackbody model (representing the inner edge of the accretion disk) and a power law component (to account for harder radiation from near the NS) with high energy cut-off. This model could describe the outburst XMM-Newton spectrum from May 2010 as well, with the addition of a Fe-K fluorescence line at 6.4 keV and more significant local absorption than in 2016. This model was used to infer an unabsorbed 0.3–30 keV luminosity of 4.7 erg s and firmly establish this source as a pulsar-ULX.
Kosec et al. [40] used a similar model for the X-ray continuum using both the soft X-ray spectra from the XMM-Newton RGS instrument and in the harder band from the XMM-Newton EPIC (pn, MOS1 and MOS2) instruments, and NuSTAR, combining a hard power law component with a multicolor blackbody; their detailed analysis of fit residuals shows evidence of a UFO at >3 significance from the NS. If confirmed, this would be the first direct evidence of a UFO (with a projected velocity , similar to other ULXs) from a pulsar-ULX, consistent with the theoretical predictions of Mushtukov et al. [41]. The UFO was detected in only one of two XMM-Newton observations; the lack of detection in the other XMM-Newton observation may be explained by the presence of clumps in the absorber or a slight change in viewing angle of the accretion flow.
More detailed and physically-motivated studies of the broadband X-ray continuum were performed by Walton et al. [42] and Koliopanos et al. [43]. In Walton et al. [42], the pulsed spectrum of NGC 300 ULX-1 was constructed by extracting the data from the brightest and faintest quarters of the pulsed cycle and removing the later from the former (“pulse-on”–“pulse-off”; the pulse profile is nearly sinusoidal, [28]). The spectrum was modeled as a power-law with a high-energy cut-off (e.g., assuming the accretion column scenario for the X-ray emission), and a high-energy excess was observed in the fit residuals. The addition of a SIMPL component to the model—comptonization in which a fraction of the photons in an input seed spectrum are scattered into a power-law component—significantly improved the fit [44]. However, the residuals were also explained by the existence of a broad cyclotron resonant scattering feature (CRSF) causing a deficit in the ∼5–20 keV band. CRSFs are due to resonant scattering of X-ray photons with electrons embedded in the magnetic field, and when detected, allow a direct estimation of the magnetic field intensity: , where is the energy of the CRSF absorption line center, is the magnetic field strength (in units of G) and is the gravitational redshift of the line forming region (, since the line must originate at or beyond the surface of the NS). A Gaussian absorption line at 12.8 keV improved the fit significantly with respect to a simple single-component model, and implies the existence of a magnetic field with G close to the surface of the NS. This value is very close to what was measured in Carpano et al. [28] from the spin-up rate, and similar to the magnetic field strengths of Galactic X-ray pulsars [45].
Koliopanos et al. [43] investigated whether the phase-averaged spectrum could be described as a multicolor thermal emission from an optically thick accretion envelope (e.g., the second model described above). Using a Bayesian X-ray analysis, they found that a multicolor accretion envelope model without a Gaussian absorption feature was preferred over the accretion column model. The soft, ∼0.3 keV multicolor disk component in their model implies an inner accretion disk radius of 400–800 km (assuming an inclination angle of 60), and is consistent with a geometrically thin accretion disk truncated at (assuming an equatorial B-field strength of – G). In the accretion column model, both the flux and the slope of the high-energy power-law component are expected to change. This could be due to a change in the inclination angle at which the observer views the column during the “pulse-on” and “pulse-off” phases; during the “pulse-on” phase, the accretion column is closer to face-on, which increases the scattering optical depth and hardens the power-law slope [35,43]. This behavior is not observed in NGC 300 ULX-1, where the fitted “pulse-on” power-law slope is marginally softer than in the “pulse-off” spectrum [43].
The presence of a CRSF and the shape of the X-ray continuum in NGC 300 ULX-1 is therefore still a matter of debate. Further observations by next-generation, hard imaging and spectroscopic telescopes are needed to measure the shape of the NGC 300 ULX-1 spectrum above ∼40 keV, where the two models begin to significantly diverge.
3.3. Beaming
In addition to the deep XMM-Newton and NuSTAR observations, Swift/XRT obtained shorter exposures of NGC 300 ULX-1 beginning in 2016 April. During the summer of 2017, Binder et al. [46] obtained four nights (spread over a ∼6 week period) of Gemini optical spectroscopy that were nearly simultaneous with Swift observations. As was found by Villar et al. [26], strong multi-component emission features were detected (the FWHM of H was found to be ∼300 km s, roughly half that during outburst). The simple continuum model of Carpano et al. [28] was used to estimate the unabsorbed X-ray luminosity in each Swift observation, as the low number of counts and restricted energy range of each observation prohibited more detailed continuum modeling. Variations between the eleven spectra could be modeled as changes in the partial covering fraction in each observation, and were interpreted as optically thick clumps in the outflow moving in and out of the line of sight to the observer. Under this model, in the observed changes in the H line profile (which were also observed at earlier epochs by Villar et al. [26]) could also be explained as changes in the orientation of the outflow.
The simultaneity of the X-ray and optical observations enabled the use of the He II 4686 emission feature (which is sensitive to 54–200 eV photons) as a “photon counter” to determine that geometric beaming did not play a significant role in boosting the observed X-ray luminosity of the system. This observation runs counter to some theoretical predictions which require a high degree of beaming to produce ULX-luminosities [47,48], and some degree of beaming is needed to explain the observed X-ray pulsations. However, the sinusoidal pulse profile observed in NGC 300 ULX-1 (and other ULX pulsars) is inconsistent with a narrow beam (unless the observer is serendipitously observing all ULX pulsars at favorable inclinations [29], and references therein). Using accretion torque theory and the measured spin period evolution of the NS, Vasilopoulos et al. [33] independently concluded that, if outflows were indeed present in the system, “no beaming is needed to explain the spectral and temporal properties” of NGC 300 ULX-1. The He II 4686 emission feature is sensitive only to soft X-rays; e.g., those originating from the accretion disk primarily beyond the magnetospheric radius. In Binder et al. [46], <20% of the total unabsorbed luminosity of NGC 300 ULX-1 was observed below 1 keV. Although the hard (and pulsed) emission from the accretion column or accretion envelope may be beamed, this emission does not significantly contribute to the He II line luminosity. Other ULXs for which the extended He II emission nebulae can be resolved (e.g., Holmberg II X-1, [49]) similarly show that the He II photoionizing emission from the ULX is, at most, only mildly beamed.
4. Subsequent Monitoring and X-Ray Decline
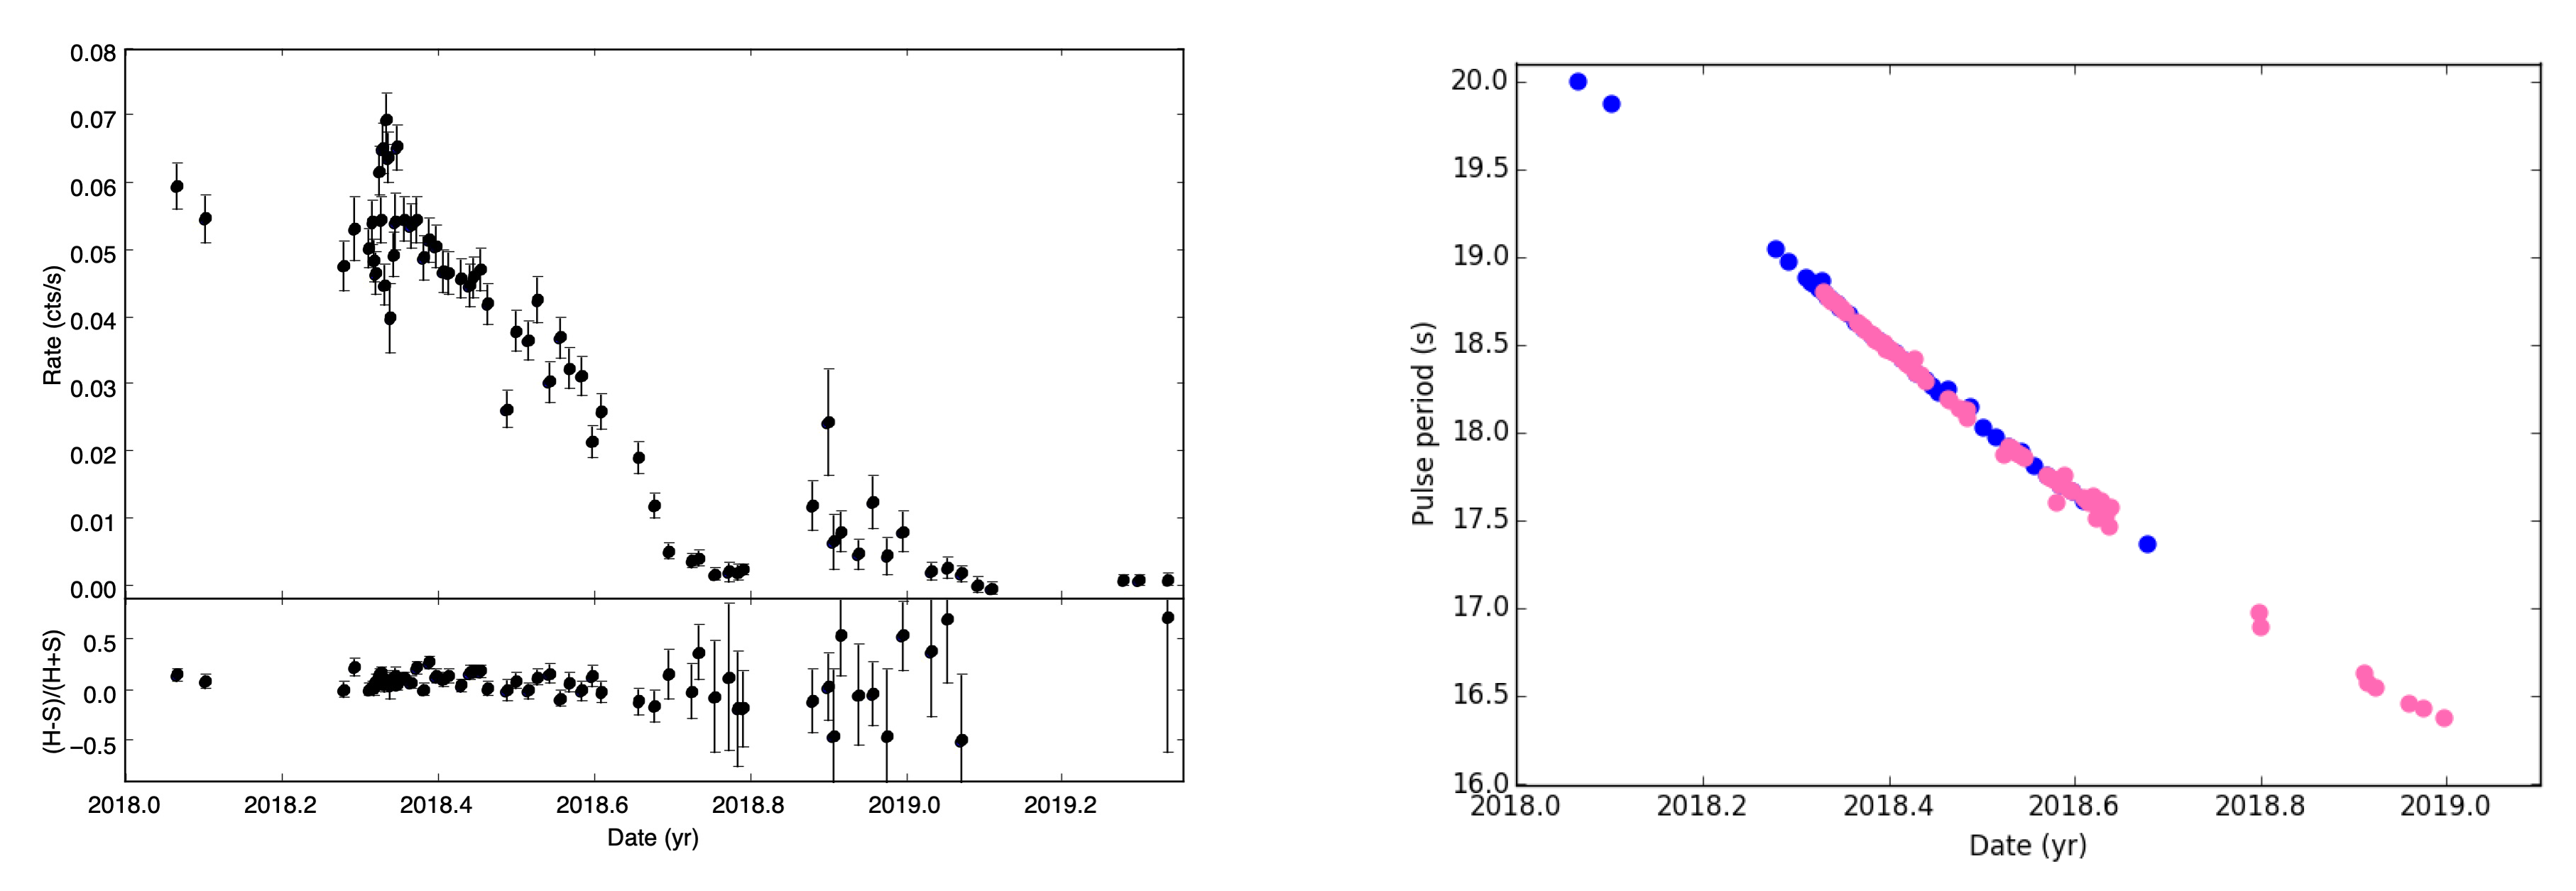
Continual X-ray monitoring with Swift and NICER, with a few deeper Chandra and NuSTAR observations, revealed that the NGC 300 ULX-1 source stayed bright for the first half of 2018 before the flux declined and fell below Swift detectability towards the end of the year [33,50]. The hardness ratios, however, remained nearly constant (albeit with large uncertainties), indicating the X-ray spectrum stayed constant despite the flux drop. The pulse period likewise continued to evolve as expected from earlier observations. The decrease in observed X-ray flux can be explained by an increase in obscuration near the NS, assuming a nearly constant mass accretion rate [33]; see also Figure 7. At the time of writing, the last available X-ray observations of NGC 300 ULX-1 are from May 2019.
While some observations of NGC 300 ULX-1 can be interpreted as signatures of a clumpy outflow (e.g., the UFO detection in one set of XMM-Newton observations but not another or possible changes in partial covering fractions of high-column density material, [40,46]), the significant and prolonged decrease in X-ray flux is speculated to be the result of the Lense-Thirring effect [33,51,52], in which the accretion disk around a compact object precesses. The observed flux change is then explained as changes in the geometrical configuration of the inner portion of the accretion disk and outflow, where an observer will only see the pulsar when the wind-free region of the outflow is pointed directly along the observer’s line of sight (this could also explain changes in the optical line profiles observed by Villar et al. [26] and Binder et al. [46]). This scenario predicts a precession period in the order of a year or longer [33], although the exact precession period depends sensitively on the mass accretion rate at the spherization radius (e.g., where the disk thickness becomes comparable to its radius; [30]). Continued monitoring of NGC 300 ULX-1 for additional flux variations is needed to confirm the Lense-Thirring precession scenario for the system.
5. The Circumstellar Environment and Donor Star
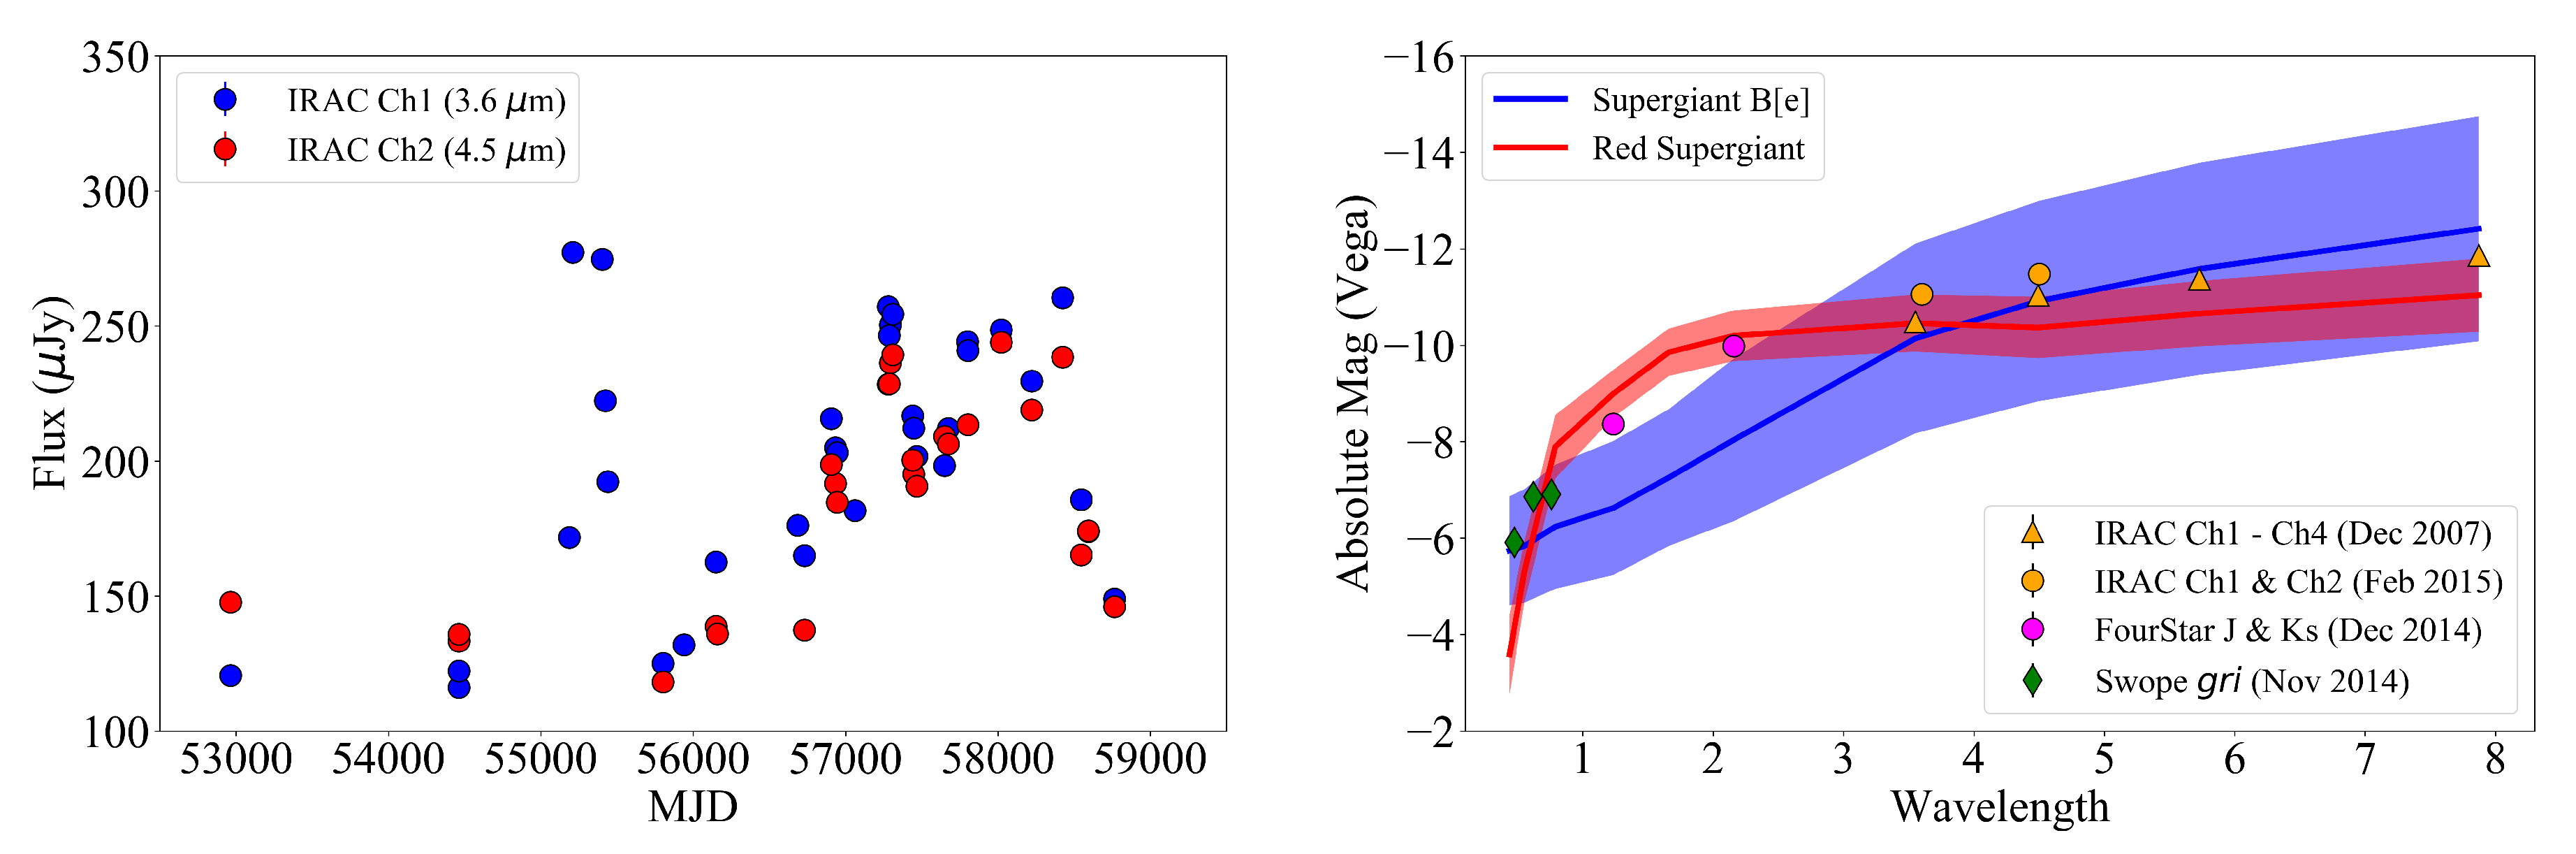
The evolution of the emission from the infrared counterpart of NGC 300 ULX-1 presents an equally unusual mystery as the X-ray light curve. Figure 8 shows the mid-IR light curve obtained by Spitzer/IRAC over 16 years between 2004 and 2019 [9,26,53], where the mid-IR observations since 2014 were largely obtained as a part of the Spitzer Infrared Intensive Transients Survey (SPIRITS; [54]). The mid-IR light curve exhibits three distinct phases: quiescence before the 2010 outburst, the 2010 outburst and post-outburst variability. During the pre-outburst quiescence phase, the 4.5 m emission exceeded the 3.6 m emission, which implied the presence of dense circumstellar dust. In quiescence, the mid-IR 3.6–8.0 m flux measured by Spitzer/IRAC resembled a supergiant B[e] star or a reddened red supergiant (RSG) (Figure 8, [53]).
IRAC 3.6 m observations captured the rise and decline of the 2010 outburst, which was followed by a gradual rise in mid-IR emission with intermittent flux spikes until appearing to fade significantly as of March 3 2019 (MJD 58546). The post-outburst mid-IR flux rose to a factor of ∼2 times higher than the progenitor but has recently faded down to the progenitor flux levels in the most recent observation taken in October 2019. Notably, after the 2010 outburst, NGC 300 ULX-1 exhibited bluer mid-IR colors than the progenitor. In other words, in the post-outburst phase the 3.6 m flux exceeds the 4.5 m flux which suggests a hotter IR dust component relative to the temperatures of circumstellar dust during the quiescent progenitor phase. As shown in Figure 8, the post-outburst optical to mid-IR SED resembles that of an RSG but is also consistent with a supergiant B[e] star. The mid-IR counterpart is slightly redder than a RSG and slightly bluer than a supergiant B[e] star, which implies that the system may host an RSG with enhanced circumstellar dust or it may be exhibiting the “B[e]-phenomenon” with hotter circumstellar dust [56].
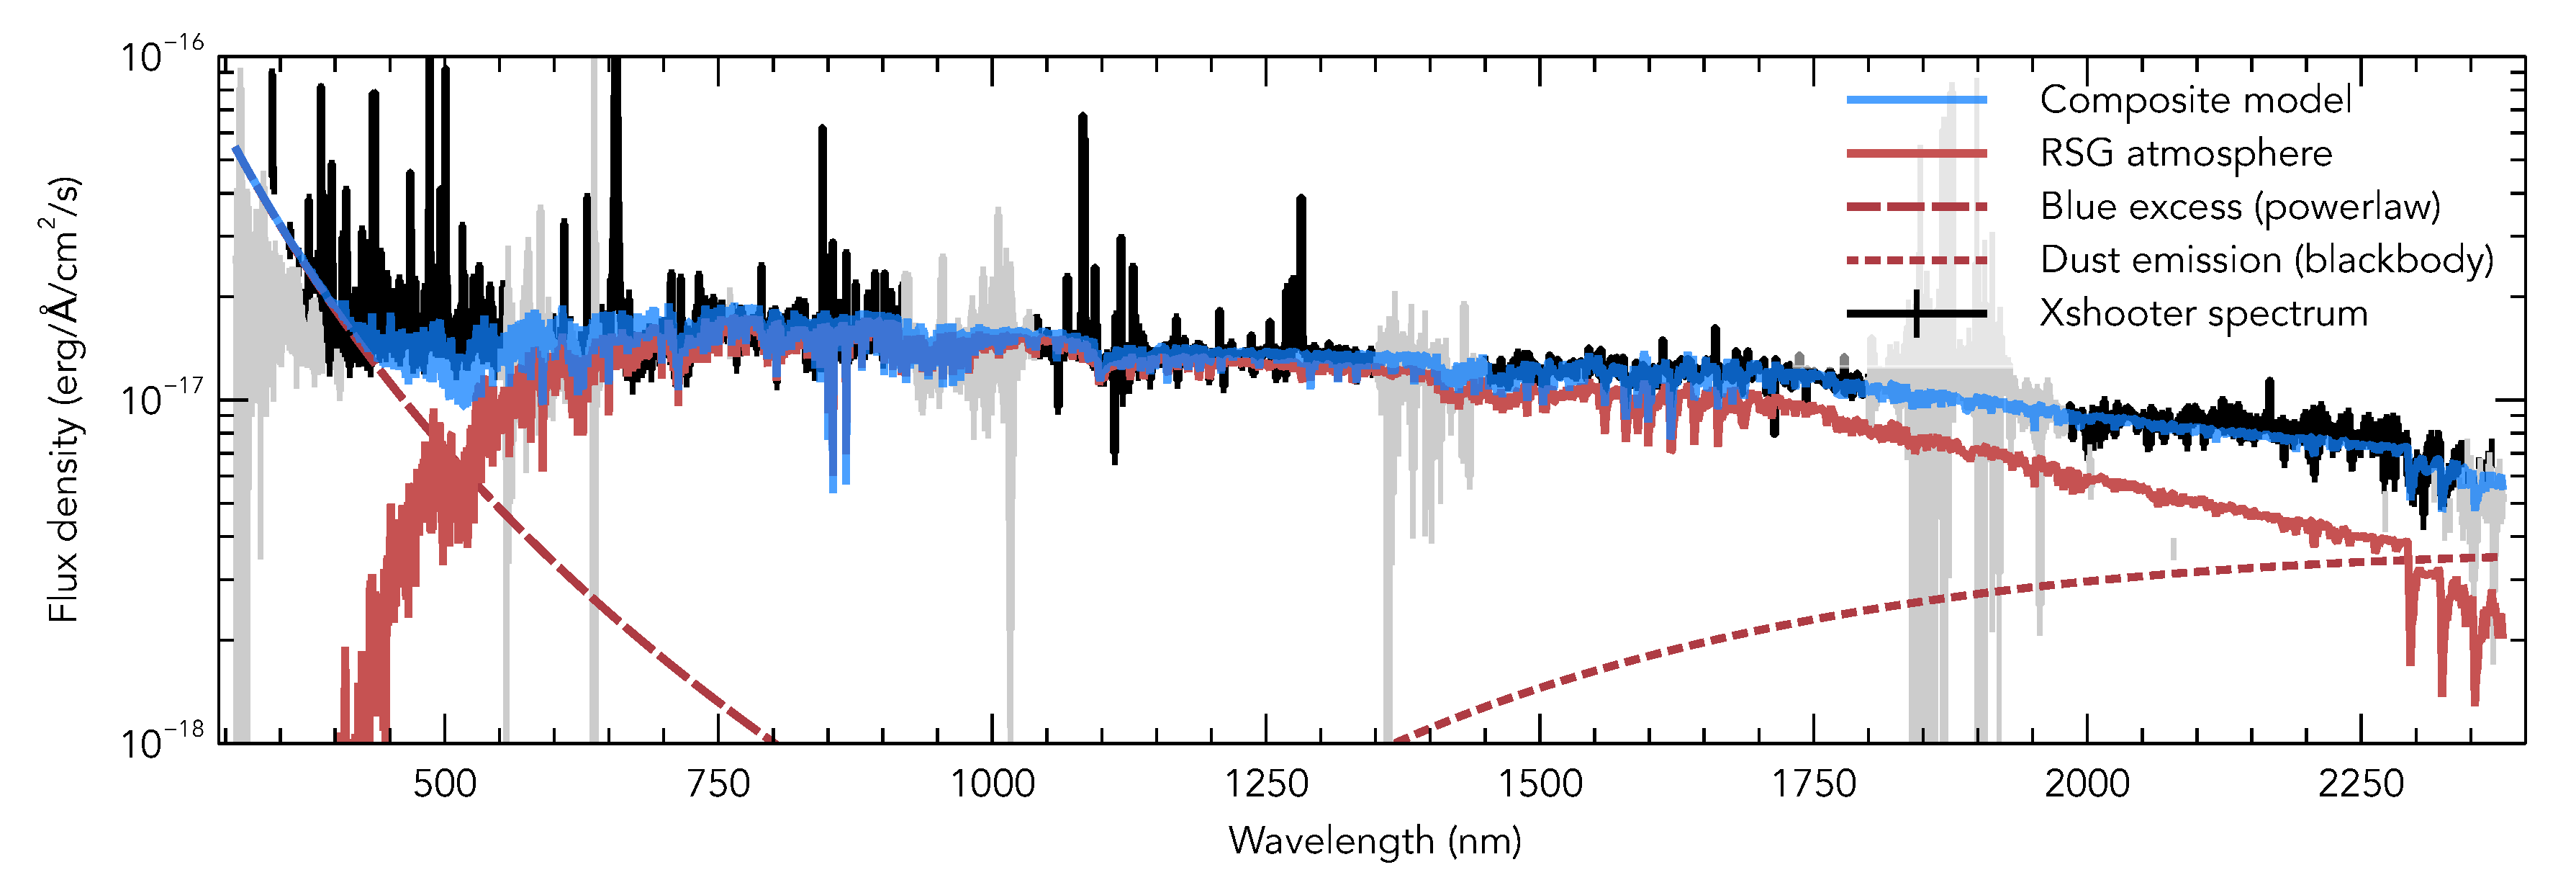
Deep X-shooter spectroscopy covering the wavelength range from 350–2300 nm obtained in October 2018 [57] revealed the presence of a likely red supergiant donor star, with an effective temperature of 3650–3900 K and a bolometric luminosity . This makes the system a potential Thorne-Żytkow object progenitor [58]. Two additional components are necessary to fit the X-shooter spectrum: a blackbody with a temperature K, consistent with the presence of warm dust that was also inferred from Spitzer observations [9], and a blue component that is possibly due to emission from the irradiated accretion disk (see Figure 9). The X-ray-to-optical flux ratio of ULXs generally resembles that of X-ray binaries where the optical emission is dominated by the accretion disk or X-ray heating of the stellar photosphere [29,59]. The high degree of optical variability (in both color and magnitude) further support the hypothesis that this optical light is the result of reprocessing rather than intrinsic emission from the donor star [59]. However, most X-ray binaries for which these X-ray-to-optical flux ratios have been measured contain donor stars with denser photospheres than a RSG [60], and the degree to which X-ray irradiation from an accretion disk will affect the structure of a low-density RSG photosphere remains an open question.
If accretion happens through Roche-lobe overflow, the orbital period of the system is at least 0.8–2.1 years, consistent with the lower limit of one year from X-ray timing [38]. If the orbit is eccentric or the neutron star is accreting from the stellar wind or via the “wind-Roche lobe overflow” mechanism proposed by El Mellah et al. [61], in which a slow-moving wind from the donor star is beamed towards the accretor, the orbital period could be even longer. The complex structure of the Balmer lines in both the X-shooter spectrum [57] and spectra obtained shortly after the 2010 outburst [26] both show evidence of a narrow (full-width at half-maximum of ∼10 km s) component that is consistent with a RSG wind. The He II 4686 emission line was also detected in the X-shooter spectrum and found to be ∼70 times fainter than observed with Gemini by Binder et al. [46]. Since the He II emission feature is sensitive to the total X-ray luminosity, the change in the He II line flux suggests “either an overall increase of obscuring material, possibly due to increased outflow from the accretion disk, or an intrinsic drop in the X-ray luminosity,” and not an apparent change in flux due to Lense-Thirring precession [57]. Additionally, simultaneous X-ray and optical spectroscopic observations are needed to evaluate the degree to which the He II 4686 emission line and X-ray luminosity and spectral shape co-evolve.
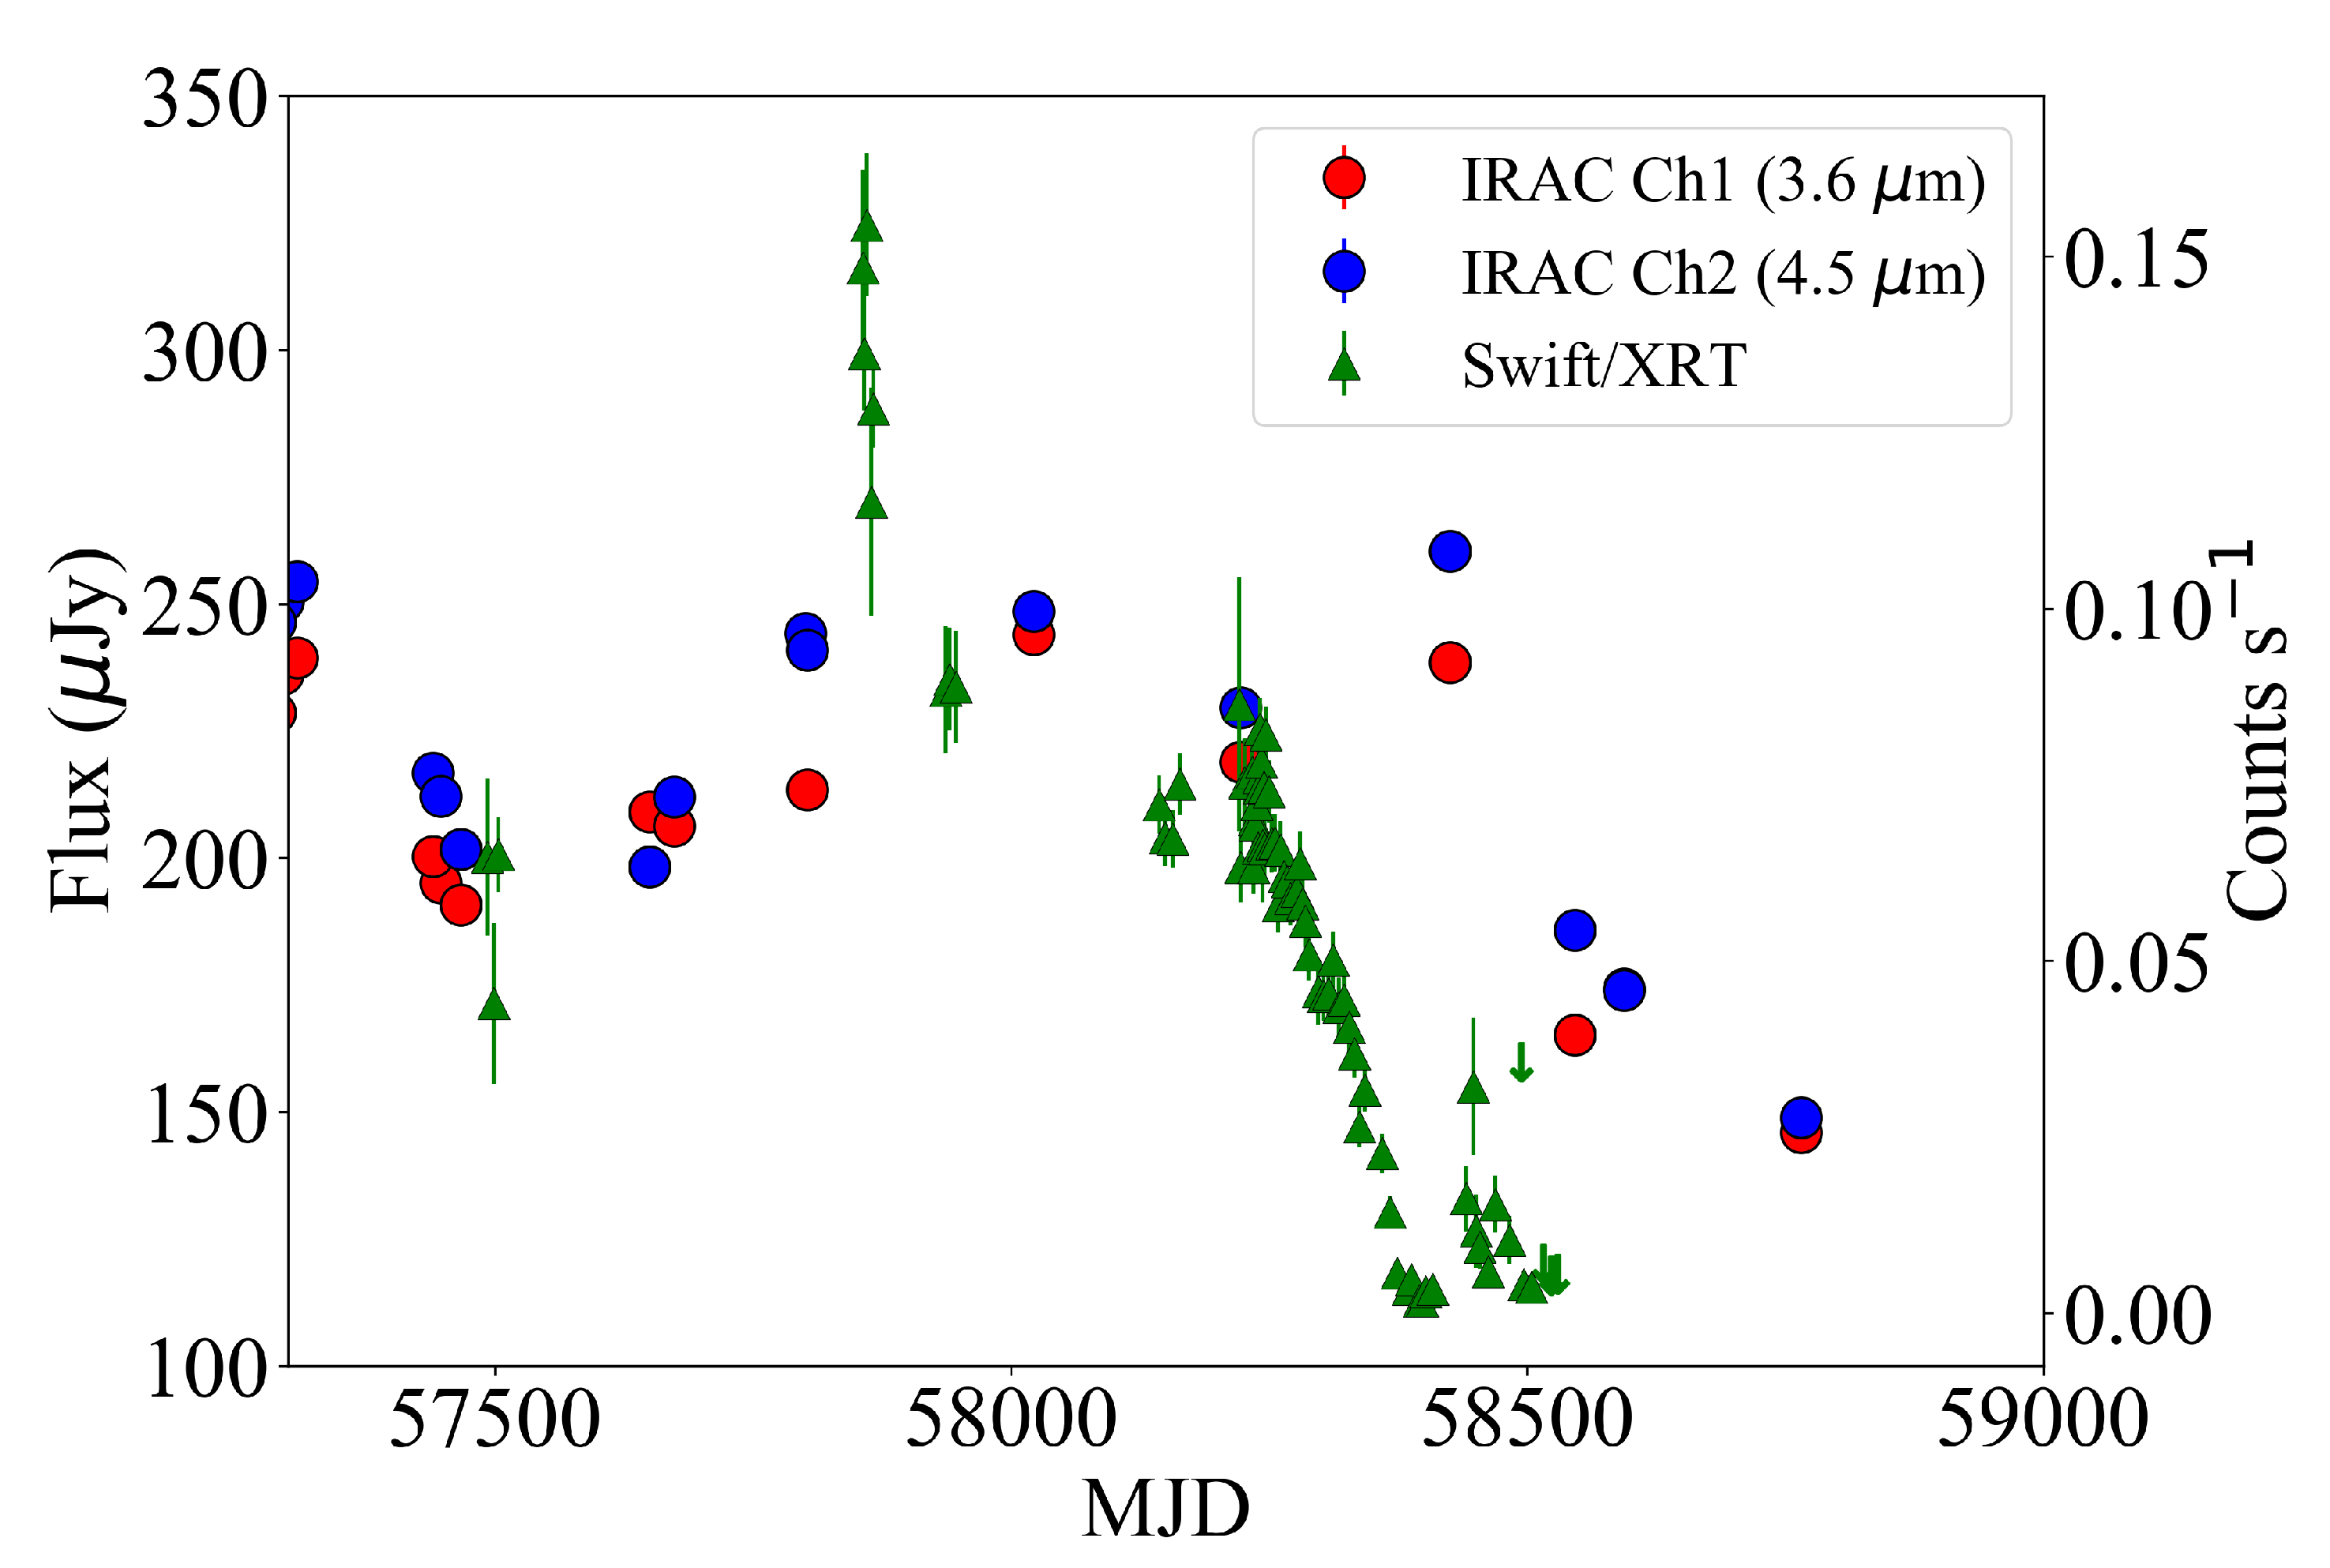
Lau et al. [53] presented the most recent mid-IR and X-ray light curve of NGC 300 ULX-1, which likely corresponds to emission from circumstellar dust and the ULX, respectively. Figure 10 shows that mid-IR and X-ray emission taken by Spitzer and Swift observations taken between 2016 and mid 2018 may be correlated. In addition to the local mid-IR/X-ray peak around April 2017 (MJD ), both the X-ray and mid-IR emissions have decreased significantly within the past two years, which suggests that the X-ray emission could contribute to heating the surrounding circumstellar dust.
6. Open Questions
NGC 300 ULX-1 is, as of the time of this writing, the only ULX associated with an intermediate luminosity optical transient (or “supernova impostor”), and the only such transient event that originated in an X-ray binary. Due to its relatively close proximity (∼2 Mpc), this system offers a unique case study of a ULX containing a supergiant donor star. Despite the numerous insights into accretion mechanisms, neutron star spin evolution and mass loss from massive stars that this system provides, several key questions about NGC 300 ULX-1 (and other ULX pulsars) remain:
- What triggered the 2010 outburst? Was this event related to a common envelope phase. tidal interactions between the accretor and donor or a change in radius of the RSG donor?
- What was the mass loss history of the donor star? At what rate is dust currently reforming in the binary?
- What is the origin of the complex optical emission line profiles, and what can the optical spectra tell us about the orbital parameters of the binary or the geometry of the immediate circumstellar environment?
- Can future outbursts or ULX behavior be predicted? Are the apparent changes in X-ray flux due to Lense-Thirring precession, changes in the ultrafast outflow of the system (e.g., clumpy winds) or an intrinsic change in X-ray luminosity?
Continued photometric and spectroscopic monitoring of the source across multiple wavelength regimes is the key to answering these questions.
Author Contributions
Conceptualization, B.A.B.; writing—original draft preparation, B.A.B., S.C., M.H. and R.L.; writing—review and editing, and visualization, B.A.B. All authors have read and agreed to the published version of the manuscript.
Funding
This research received no external funding.
Acknowledgments
The authors would like to thank the anonymous referees for comments and suggestions that significantly improved this manuscript. The authors would also like to thank Edo Berger and Rubab Khan for granting permission to reproduce figures from The Astronomer’s Telegram postings, and Emily Levesque and Benjamin Williams for comments that improved early versions of this manuscript.
Conflicts of Interest
The authors declare no conflict of interest.
References
- Monard, L.A.G. Supernova 2010da in NGC 300. Cent. Bur. Electron. Telegr. 2010, 2289, 1. [Google Scholar]
- Dalcanton, J.J.; Williams, B.F.; Seth, A.C.; Dolphin, A.; Holtzman, J.; Rosema, K.; Skillman, E.D.; Cole, A.; Girardi, L.; Gogarten, S.M.; et al. The ACS Nearby Galaxy Survey Treasury. Astrophys. J. 2009, 183, 67–108. [Google Scholar] [CrossRef]
- Khan, R.; Stanek, K.Z.; Kochanek, C.S.; Thompson, T.A.; Prieto, J.L. Mid-IR Progenitor of SN 2010da in NGC 300; The Astronomer’s Telegram, 2010; Volume 2632, Available online: http://www.astronomerstelegram.org/?read=2632 (accessed on 18 February 2020).
- Chornock, R.; Berger, E. Spectroscopy of SN 2010da in NGC 300; The Astronomer’s Telegram, 2010; Volume 2637, Available online: http://www.astronomerstelegram.org/?read=2637 (accessed on 18 February 2020).
- Elias-Rosa, N.; Mauerhan, J.C.; van Dyk, S.D. SN 2010da is a SN “impostor”; The Astronomer’s Telegram, 2010; Volume 2636, Available online: http://www.astronomerstelegram.org/?read=2636 (accessed on 18 February 2020).
- Bond, H.E. Optical Photometry of the New Optical Transient SN 2010da in NGC 300; The Astronomer’s Telegram, 2010; Volume 2640, Available online: http://www.astronomerstelegram.org/?read=2640 (accessed on 18 February 2020).
- Prieto, J.L.; Bond, H.E.; Kochanek, C.S.; Khan, R.; Stanek, K.Z.; Thompson, T.A. Optical and Near-IR Follow-up of SN 2010da: Evidence for Warm Dust; The Astronomer’s Telegram, 2010; Volume 2660, Available online: http://www.astronomerstelegram.org/?read=2660 (accessed on 18 February 2020).
- Gal-Yam, A.; Mazzali, P.A.; Manulis, I.; Bishop, D. Supernova Discoveries 2010-2011: Statistics and Trends. Publi. Astrono. Soc. Pac. 2013, 125, 749. [Google Scholar] [CrossRef] [Green Version]
- Lau, R.M.; Kasliwal, M.M.; Bond, H.E.; Smith, N.; Fox, O.D.; Carlon, R.; Cody, A.M.; Contreras, C.; Dykhoff, D.; Gehrz, R.; et al. Rising from the Ashes: Mid-infrared Re-brightening of the Impostor SN 2010da in NGC 300. Astrophys. J. 2016, 830, 142. [Google Scholar] [CrossRef] [Green Version]
- Van Dyk, S.D.; Peng, C.Y.; King, J.Y.; Filippenko, A.V.; Treffers, R.R.; Li, W.; Richmond, M.W. SN 1997bs in M66: Another Extragalactic η Carinae Analog? Publ. Astron. Soc. Pac. 2000, 112, 1532–1541. [Google Scholar] [CrossRef]
- Immler, S.; Brown, P.; Russell, B.R. Swift XRT Detection of Supernova 2010da in X-Rays; The Astronomer’s Telegram, 2010; Volume 2639, Available online: http://www.astronomerstelegram.org/?read=2639 (accessed on 18 February 2020).
- Smith, N.; Li, W.; Silverman, J.M.; Ganeshalingam, M.; Filippenko, A.V. Luminous blue variable eruptions and related transients: Diversity of progenitors and outburst properties. Mon. Not. R. Astron. Soc. 2011, 415, 773–810. [Google Scholar] [CrossRef] [Green Version]
- Guerrero, M.A.; Chu, Y.H. An X-Ray Survey of Wolf-Rayet Stars in the Magellanic Clouds. I. The Chandra ACIS Data Set. Astrophys. J. 2008, 177, 216–237. [Google Scholar] [CrossRef] [Green Version]
- Nazé, Y.; Rauw, G.; Hutsemékers, D. The first X-ray survey of Galactic luminous blue variables. Astron. Astrophys. 2012, 538, A47. [Google Scholar] [CrossRef] [Green Version]
- Laskar, T.; Berger, E.; Chornock, R. Significant Brightening of the Progenitor of SN2010da at 3.6 Micron 6 Months Prior to the Eruption; The Astronomer’s Telegram, 2010; Volume 2648, Available online: http://www.astronomerstelegram.org/?read=2648 (accessed on 18 February 2020).
- Massey, P.; McNeill, R.T.; Olsen, K.A.G.; Hodge, P.W.; Blaha, C.; Jacoby, G.H.; Smith, R.C.; Strong, S.B. A Survey of Local Group Galaxies Currently Forming Stars. III. A Search for Luminous Blue Variables and Other Hα Emission-Line Stars. Astron. J. 2007, 134, 2474–2503. [Google Scholar] [CrossRef] [Green Version]
- Khan, R.; Stanek, K.Z.; Prieto, J.L.; Kochanek, C.S.; Thompson, T.A.; Beacom, J.F. Census of Self-obscured Massive Stars in Nearby Galaxies with Spitzer: Implications for Understanding the Progenitors of SN 2008S-like Transients. Astrophys. J. 2010, 715, 1094–1108. [Google Scholar] [CrossRef] [Green Version]
- Thompson, T.A.; Prieto, J.L.; Stanek, K.Z.; Kistler, M.D.; Beacom, J.F.; Kochanek, C.S. A New Class of Luminous Transients and a First Census of their Massive Stellar Progenitors. Astrophys. J. 2009, 705, 1364–1384. [Google Scholar] [CrossRef]
- Berger, E.; Chornock, R. Deep Optical Limits for the Progenitor of SN2010da and Its Broad-Band SED; The Astronomer’s Telegram, 2010; Volume 2638, Available online: http://www.astronomerstelegram.org/?read=2638 (accessed on 18 February 2020).
- Berger, E.; Soderberg, A.M.; Chevalier, R.A.; Fransson, C.; Foley, R.J.; Leonard, D.C.; Debes, J.H.; Diamond-Stanic, A.M.; Dupree, A.K.; Ivans, I.I.; et al. An Intermediate Luminosity Transient in NGC 300: The Eruption of a Dust-Enshrouded Massive Star. Astrophys. J. 2009, 699, 1850–1865. [Google Scholar] [CrossRef]
- Bond, H.E.; Bedin, L.R.; Bonanos, A.Z.; Humphreys, R.M.; Monard, L.A.G.B.; Prieto, J.L.; Walter, F.M. The 2008 Luminous Optical Transient in the Nearby Galaxy NGC 300. Astrophys. J. 2009, 695, L154–L158. [Google Scholar] [CrossRef] [Green Version]
- Binder, B.; Williams, B.F.; Kong, A.K.H.; Gaetz, T.J.; Plucinsky, P.P.; Dalcanton, J.J.; Weisz, D.R. Chandra Detection of SN 2010da Four Months After Outburst: Evidence for a High-mass X-Ray Binary in NGC 300. Astrophys. J. 2011, 739, L51. [Google Scholar] [CrossRef] [Green Version]
- Binder, B.; Williams, B.F.; Kong, A.K.H.; Gaetz, T.J.; Plucinsky, P.P.; Skillman, E.D.; Dolphin, A. Recurring X-ray outbursts in the supernova impostor SN 2010da in NGC 300. Mon. Not. R. Astron. Soc. 2016, 457, 1636–1643. [Google Scholar] [CrossRef] [Green Version]
- Ivezic, Z.; Elitzur, M. Self-similarity and scaling behaviour of infrared emission from radiatively heated dust-I. Theory. Mon. Not. R. Astron. Soc. 1997, 287, 799–811. [Google Scholar] [CrossRef] [Green Version]
- Kochanek, C.S. The Astrophysical Implications of Dust Formation during the Eruptions of Hot, Massive Stars. Astrophys. J. 2011, 743, 73. [Google Scholar] [CrossRef] [Green Version]
- Villar, V.A.; Berger, E.; Chornock, R.; Margutti, R.; Laskar, T.; Brown, P.J.; Blanchard, P.K.; Czekala, I.; Lunnan, R.; Reynolds, M.T. The Intermediate Luminosity Optical Transient SN 2010da: The Progenitor, Eruption, and Aftermath of a Peculiar Supergiant High-mass X-Ray Binary. Astrophys. J. 2016, 830, 11. [Google Scholar] [CrossRef] [Green Version]
- Linden, T.; Kalogera, V.; Sepinsky, J.F.; Prestwich, A.; Zezas, A.; Gallagher, J.S. The Effect of Starburst Metallicity on Bright X-ray Binary Formation Pathways. Astrophys. J. 2010, 725, 1984–1994. [Google Scholar] [CrossRef] [Green Version]
- Carpano, S.; Haberl, F.; Maitra, C.; Vasilopoulos, G. Discovery of pulsations from NGC 300 ULX1 and its fast period evolution. Mon. Not. R. Astron. Soc. 2018, 476, L45–L49. [Google Scholar] [CrossRef] [Green Version]
- Kaaret, P.; Feng, H.; Roberts, T.P. Ultraluminous X-Ray Sources. Annu. Rev. 2017, 55, 303–341. [Google Scholar] [CrossRef] [Green Version]
- Shakura, N.I.; Sunyaev, R.A. Reprint of 1973A&A....24..337S. Black holes in binary systems. Observational appearance. Astron. Astrophys. 1973, 500, 33–51. [Google Scholar]
- Poutanen, J.; Lipunova, G.; Fabrika, S.; Butkevich, A.G.; Abolmasov, P. Supercritically accreting stellar mass black holes as ultraluminous X-ray sources. Mon. Not. R. Astron. Soc. 2007, 377, 1187–1194. [Google Scholar] [CrossRef]
- Narayan, R.; Sa̧dowski, A.; Soria, R. Spectra of black hole accretion models of ultraluminous X-ray sources. Mon. Not. R. Astron. Soc. 2017, 469, 2997–3014. [Google Scholar] [CrossRef] [Green Version]
- Vasilopoulos, G.; Petropoulou, M.; Koliopanos, F.; Ray, P.S.; Bailyn, C.D.; Haberl, F.; Gendreau, K. NGC 300 ULX1: Spin evolution, super-Eddington accretion and outflows. arXiv 2019, arXiv:1905.03740. [Google Scholar] [CrossRef]
- Christodoulou, D.M.; Laycock, S.G.T.; Kazanas, D. Not an oxymoron: Some X-ray binary pulsars with enormous spin-up rates reveal weak magnetic fields. Mon. Not. R. Astron. Soc. 2018, 478, 3506–3512. [Google Scholar] [CrossRef] [Green Version]
- Mushtukov, A.A.; Suleimanov, V.F.; Tsygankov, S.S.; Ingram, A. Optically thick envelopes around ULXs powered by accreating neutron stars. Mon. Not. R. Astron. Soc. 2017, 467, 1202–1208. [Google Scholar] [CrossRef]
- Walton, D.J.; Fürst, F.; Heida, M.; Harrison, F.A.; Barret, D.; Stern, D.; Bachetti, M.; Brightman, M.; Fabian, A.C.; Middleton, M.J. Evidence for Pulsar-like Emission Components in the Broadband ULX Sample. Astrophys. J. 2018, 856, 128. [Google Scholar] [CrossRef] [Green Version]
- Vasilopoulos, G.; Haberl, F.; Carpano, S.; Maitra, C. NGC 300 ULX1: A test case for accretion torque theory. Astron. Astrophys. 2018, 620, L12. [Google Scholar] [CrossRef]
- Ray, P.S.; Guillot, S.; Ho, W.C.G.; Kerr, M.; Enoto, T.; Gendreau, K.C.; Arzoumanian, Z.; Altamirano, D.; Bogdanov, S.; Campion, R.; et al. Anti-glitches in the Ultraluminous Accreting Pulsar NGC 300 ULX-1 Observed with NICER. Astrophys. J. 2019, 879, 130. [Google Scholar] [CrossRef] [Green Version]
- Becker, P.A.; Wolff, M.T. Thermal and Bulk Comptonization in Accretion-powered X-Ray Pulsars. Astrophys. J. 2007, 654, 435–457. [Google Scholar] [CrossRef]
- Kosec, P.; Pinto, C.; Walton, D.J.; Fabian, A.C.; Bachetti, M.; Brightman, M.; Fürst, F.; Grefenstette, B.W. Evidence for a variable Ultrafast Outflow in the newly discovered Ultraluminous Pulsar NGC 300 ULX-1. Mon. Not. R. Astron. Soc. 2018, 479, 3978–3986. [Google Scholar] [CrossRef]
- Mushtukov, A.A.; Ingram, A.; Middleton, M.; Nagirner, D.I.; van der Klis, M. Timing properties of ULX pulsars: Optically thick envelopes and outflows. Mon. Not. R. Astron. Soc. 2019, 484, 687–697. [Google Scholar] [CrossRef] [Green Version]
- Walton, D.J.; Bachetti, M.; Fürst, F.; Barret, D.; Brightman, M.; Fabian, A.C.; Grefenstette, B.W.; Harrison, F.A.; Heida, M.; Kennea, J.; et al. A Potential Cyclotron Resonant Scattering Feature in the Ultraluminous X-Ray Source Pulsar NGC 300 ULX1 Seen by NuSTAR and XMM-Newton. Astrophys. J. 2018, 857, L3. [Google Scholar] [CrossRef] [Green Version]
- Koliopanos, F.; Vasilopoulos, G.; Buchner, J.; Maitra, C.; Haberl, F. Investigating ULX accretion flows and cyclotron resonance in NGC 300 ULX1. Astron. Astrophys. 2019, 621, A118. [Google Scholar] [CrossRef]
- Steiner, J.F.; Narayan, R.; McClintock, J.E.; Ebisawa, K. A Simple Comptonization Model. Publ. Astron. Soc. Pac. 2009, 121, 1279. [Google Scholar] [CrossRef] [Green Version]
- Caballero, I.; Wilms, J. X-ray pulsars: A review. Mem. Soc. Astron. Ital. 2012, 83, 230. [Google Scholar]
- Binder, B.; Levesque, E.M.; Dorn-Wallenstein, T. No Strong Geometric Beaming in the Ultraluminous Neutron Star Binary NGC 300 ULX-1 (SN 2010da) from Swift and Gemini. Astrophys. J. 2018, 863, 141. [Google Scholar] [CrossRef] [Green Version]
- King, A.; Lasota, J.P. No magnetars in ULXs. Mon. Not. R. Astron. Soc. 2019, 485, 3588–3594. [Google Scholar] [CrossRef]
- King, A.R. Masses, beaming and Eddington ratios in ultraluminous X-ray sources. Mon. Not. R. Astron. Soc. 2009, 393, L41–L44. [Google Scholar] [CrossRef] [Green Version]
- Kaaret, P.; Ward, M.J.; Zezas, A. High-resolution imaging of the HeII λ4686 emission line nebula associated with the ultraluminous X-ray source in Holmberg II. Mon. Not. R. Astron. Soc. 2004, 351, L83–L88. [Google Scholar] [CrossRef] [Green Version]
- Maitra, C.; Carpano, S.; Haberl, F.; Vasilopoulos, G. NGC 300 ULX1: A new ULX pulsar in NGC 300. arXiv 2018, arXiv:1811.04807,. [Google Scholar] [CrossRef] [Green Version]
- Bardeen, J.M.; Petterson, J.A. The Lense-Thirring Effect and Accretion Disks around Kerr Black Holes. Astrophys. J. 1975, 195, L65. [Google Scholar] [CrossRef]
- Truemper, J.; Kahabka, P.; Oegelman, H.; Pietsch, W.; Voges, W. EXOSAT Observations of the 35 Day Cycle of Hercules X-1: Evidence for Neutron Star Precession. Astrophys. J. 1986, 300, L63. [Google Scholar] [CrossRef]
- Lau, R.M.; Heida, M.; Walton, D.J.; Kasliwal, M.M.; Adams, S.M.; Cody, A.M.; De, K.; Gehrz, R.D.; Fürst, F.; Jencson, J.E.; et al. Uncovering Red and Dusty Ultraluminous X-Ray Sources with Spitzer. Astrophys. J. 2019, 878, 71. [Google Scholar] [CrossRef] [Green Version]
- Kasliwal, M.M.; Bally, J.; Masci, F.; Cody, A.M.; Bond, H.E.; Jencson, J.E.; Tinyanont, S.; Cao, Y.; Contreras, C.; Dykhoff, D.A.; et al. SPIRITS: Uncovering Unusual Infrared Transients with Spitzer. Astrophys. J. 2017, 839, 88. [Google Scholar] [CrossRef] [Green Version]
- Bonanos, A.Z.; Massa, D.L.; Sewilo, M.; Lennon, D.J.; Panagia, N.; Smith, L.J.; Meixner, M.; Babler, B.L.; Bracker, S.; Meade, M.R.; et al. Spitzer SAGE Infrared Photometry of Massive Stars in the Large Magellanic Cloud. Astron. J. 2009, 138, 1003–1021. [Google Scholar] [CrossRef] [Green Version]
- Lamers, H.J.G.L.M.; Zickgraf, F.J.; de Winter, D.; Houziaux, L.; Zorec, J. An improved classification of B[e]-type stars. Astron. Astrophys. 1998, 340, 117–128. [Google Scholar]
- Heida, M.; Lau, R.M.; Davies, B.; Brightman, M.; Fürst, F.; Grefenstette, B.W.; Kennea, J.A.; Tramper, F.; Walton, D.J.; Harrison, F.A. Discovery of a Red Supergiant Donor Star in SN2010da/NGC 300 ULX-1. Astron. J. Lett. 2019, 883, 34. [Google Scholar] [CrossRef] [Green Version]
- Wang, J. Neutron star high-mass binaries as the origin of SGR/AXP. Astronomische Nachrichten 2016, 337, 254. [Google Scholar] [CrossRef]
- Tao, L.; Feng, H.; Grisé, F.; Kaaret, P. Compact Optical Counterparts of Ultraluminous X-Ray Sources. Astrophys. J. 2011, 737, 81. [Google Scholar] [CrossRef] [Green Version]
- Levesque, E.M. Astrophysics of Red Supergiants; Iop Publishing Ltd: Bristol, UK, 2017. [Google Scholar] [CrossRef]
- El Mellah, I.; Sundqvist, J.O.; Keppens, R. Wind Roche lobe overflow in high-mass X-ray binaries. A possible mass-transfer mechanism for ultraluminous X-ray sources. Astron. Astrophys. 2019, 622, L3. [Google Scholar] [CrossRef] [Green Version]
Figure 1.
(Left): The initial discovery image [8] of SN 2010da by L.A.G. Monard [1]. (Right): An RGB-rendered IR composite image of NGC 300, with insets showing the 3.6 m image of the progenitor (∼6.5 years pre-outburst), ∼4.5 years post-outburst, and the difference subtracted image. Reproduced with permission from Lau et al. [9] (their Figure 1).

Figure 2.
The mid-IR color–magnitude diagram (CMD) showing the SN 2010da progenitor (red square) and local luminous blue variables (LBVs) and LBV candidates (filled circles and triangles, respectively). Open circles and filled triangles show the CMD locations of LBV-like supernova (SN) “impostors.” Reproduced with permission from Khan et al. [3].

Figure 3.
The IR spectral energy density (SED) of SN 2010da progenitor (black squares show measurements, black downward facing triangles show upper limits). The SEDs of two other optical progenitors, NGC 300 OT2008-1 and SN 2008S, are shown (in blue and brown, respectively) for comparison. The dotted red line shows the SED of the known LBV AG Car; the addition of 12 mag extinction is required for this SED to fit the observed fluxes of SN 2010da (dashed red line). Reproduced with permission from Berger and Chornock [19].

Figure 4.
Left: Adapted from Figure 1 in Binder et al. [23], showing the Chandra image of SN 2010da. The yellow circle indicates the location of the X-ray source coincident with SN 2010da (the three fainter sources to the upper-left are unrelated). Right: Figure 2 from Binder et al. [23] showing the Hubble/Advanced Camera for Surveys (ACS) image of the same region. The white cross and circle indicate the location of the X-ray source; the green cross and circle show the location of the likely massive donor star.

Figure 5.
Figure 1 from Carpano et al. [28], showing the period evolution during the deep XMM-Newton/NuSTAR observations.
Figure 5.
Figure 1 from Carpano et al. [28], showing the period evolution during the deep XMM-Newton/NuSTAR observations.

Figure 6.
The XMM-Newton and NuSTAR spectra of NGC 300 ULX-1 (top panel of Figure 3 in Carpano et al. [28]). XMM-Newton/EPIC pn spectra are shown in black and blue, while the MOS spectra are shown in red, green, magenta and cyan. NuSTAR FPMA and FPMB spectra are shown in yellow and orange, respectively.

Figure 7.
Left: Swift/XRT long term light curve from 2018 January to 2019 May. The corresponding hardness ratios (S: 0.2–1.5 keV, H: 1.5–10 keV) are shown in the bottom panel. Right: Evolution of the pulse period from NICER (pink) and Swift (blue) data covering the period from January 2018 to January 2019, when pulsations could be detected.

Figure 8.
(Left) Spitzer/IRAC mid-IR light curve of SN 2010da/NGC 300 ULX-1 from 2004–2019. The red and blue points correspond to photometry measured at 3.6 m and 4.5 m, respectively. Only 3.6 m observations were serendipitously obtained near the 2010 outburst. (Right) Spectral energy distribution (SED) of SN 2010da/NGC 300 ULX-1 during pre-outburst (December 2007) and post-outburst phases (late 2014/early 2015) overlaid on SED templates of 122 RSG and 11 sgB[e] stars in the Large Magellanic Cloud, cataloged by Bonanos et al. [55]. Solid lines correspond to the median VIJHKs and Spitzer/IRAC magnitudes of the SED template stars, and the surrounding shaded regions indicate the 1 spread in the magnitudes of the distribution. The wavelength on the x-axis is shown in units of m. Both figures are reproduced and modified from Lau et al. [53].

Figure 9.
Deep Xshooter spectroscopy of NGC 300 ULX-1 in October 2018 (black). The composite model (blue) requires a RSG atmosphere (red), excess dust emission (red short-dashed line) and a power-law blue excess (red long-dashed line) attributed to an irradiated accretion disk. Reproduced with permission from Heida et al. [57].

Figure 10.
Mid-IR and X-ray light curve of SN 2010da/NGC 300 ULX-1 taken between MJD 57300 and MJD 58770 by Spitzer/IRAC and Swift/XRT, respectively. This figure is modified from Lau et al. [53].
Figure 10.
Mid-IR and X-ray light curve of SN 2010da/NGC 300 ULX-1 taken between MJD 57300 and MJD 58770 by Spitzer/IRAC and Swift/XRT, respectively. This figure is modified from Lau et al. [53].

© 2020 by the authors. Licensee MDPI, Basel, Switzerland. This article is an open access article distributed under the terms and conditions of the Creative Commons Attribution (CC BY) license (http://creativecommons.org/licenses/by/4.0/).
Share and Cite
MDPI and ACS Style
Binder, B.A.; Carpano, S.; Heida, M.; Lau, R. From SN 2010da to NGC 300 ULX-1: Ten Years of Observations of an Unusual High Mass X-Ray Binary in NGC 300. Galaxies 2020, 8, 17. https://0-doi-org.brum.beds.ac.uk/10.3390/galaxies8010017
AMA Style
Binder BA, Carpano S, Heida M, Lau R. From SN 2010da to NGC 300 ULX-1: Ten Years of Observations of an Unusual High Mass X-Ray Binary in NGC 300. Galaxies. 2020; 8(1):17. https://0-doi-org.brum.beds.ac.uk/10.3390/galaxies8010017
Chicago/Turabian StyleBinder, Breanna A., Stefania Carpano, Marianne Heida, and Ryan Lau. 2020. "From SN 2010da to NGC 300 ULX-1: Ten Years of Observations of an Unusual High Mass X-Ray Binary in NGC 300" Galaxies 8, no. 1: 17. https://0-doi-org.brum.beds.ac.uk/10.3390/galaxies8010017
Note that from the first issue of 2016, this journal uses article numbers instead of page numbers. See further details here.