Article

How Are Red and Blue Quasars Different? The Radio Properties

by
Victoria A. Fawcett
1,*,†,
David M. Alexander
1,†,
David J. Rosario
1,2,† and
Lizelke Klindt
1,†
1
Center for Extragalactic Astronomy, Department of Physics, Durham University, Durham DH1 3LE, UK
2
School of Mathematics, Statistics and Physics, Newcastle University, Newcastle upon Tyne NE1 7RU, UK
*
Author to whom correspondence should be addressed.
These authors contributed equally to this work.
Submission received: 6 October 2021 / Revised: 15 November 2021 / Accepted: 16 November 2021 / Published: 19 November 2021

Abstract

:
A non-negligible fraction of quasars are red at optical wavelengths, indicating (in the majority of cases) that the accretion disc is obscured by a column of dust which extinguishes the shorter-wavelength blue emission. In this paper, we summarize recent work by our group, where we find fundamental differences in the radio properties of SDSS optically-selected red quasars. We also present new analyses, using a consistent color-selected quasar parent sample matched to four radio surveys (FIRST, VLA Stripe 82, VLA COSMOS 3 GHz, and LoTSS DR1) across a frequency range 144 MHz–3 GHz and four orders of magnitude in radio flux. We show that red quasars have enhanced small-scale radio emission (∼kpc) that peaks around the radio-quiet threshold (defined as the ratio of 1.4 GHz luminosity to 6 μ m luminosity) across the four radio samples. Exploring the potential mechanisms behind this enhancement, we rule out star-formation and propose either small-scale synchrotron jets, frustrated jets, or dusty winds interacting with the interstellar medium; the latter two scenarios would provide a more direct connection between opacity (dust; gas) and the production of the radio emission. In our future study, using new multi-band uGMRT data, we aim to robustly distinguish between these scenarios.

1. Introduction

Quasi-stellar objects (QSOs), also known as quasars, are the most powerful class of Active Galactic Nuclei (AGN). Their extremely high bolometric luminosities (up to 10 47 48 erg s 1 ) are now known to be caused by accretion onto a supermassive black hole (SMBH; masses of 10 8 10 9 M ) near the Eddington limit, which places them as some of the most luminous objects in the Universe. Due to the unobscured view of the SMBH accretion disc, which peaks in the ultra-violet (UV), the majority of Type 1 QSOs have very blue optical colors. However, there is a small but significant subset with redder optical-infrared colors (referred to as “red QSOs”).
Although red QSOs have been well studied in the literature, there are still conflicting views on how red and blue QSOs are related [1,2,3,4,5,6,7,8,9,10,11,12]. Some studies suggest they are intrinsically the same objects, with a red QSO simply representing a blue QSO observed at a higher inclination to the putative dusty torus, while other studies suggest an evolutionary scenario whereby a red QSO is a short-lived phase in QSO evolution. We have recently found that Sloan Digital Sky Survey (SDSS) red QSOs show ∼2–3 times higher radio-detection fraction compared to typical blue QSOs, which cannot be explained via a simple orientation model [8,9,10,11]. This radio-detection enhancement is driven by red QSOs with compact radio morphologies (<5″; <43 kpc at z = 1.5) and luminosities placing them around the radio-loud/radio-quiet threshold [8]. We confirmed these initial results with deeper and higher resolution data from the Very Large Array (VLA) Stripe 82, VLA COSMOS 3 GHz, and LOFAR surveys [9,10]. Pushing to lower values of radio-loudness, we found that the radio enhancement decreases to unity at extreme radio-quiet values. Analyzing a sample of radio-compact red and blue QSOs with 0.″2 resolution e-MERLIN data, we found that the radio enhancement occurs on nuclear–galactic scales [11]. Overall, these results are inconsistent with red QSO being blue QSOs observed at a higher inclination angle, whereby the line of sight intersects with the top of the torus. If this were the case, we would expect the opposite result; i.e., enhanced radio emission in blue QSOs due to Doppler boosting arising from a more face-on orientation of the radio jet. Therefore, there must be factors other than orientation causing this enhancement, e.g., an enhancement in small-scale jets or winds causing radio-emitting shocks in the interstellar medium (ISM), enhanced star-formation (SF), or differences in the accretion properties.
In this paper, we undertake, for the first time, self-consistent analyses using four different radio datasets with the same QSO parent quasar sample, to ensure there are no differences in the construction of our samples that could be driving the radio results 1. In Section 2, we discuss the radio data and our self-consistent selection of the QSO color-selected samples used in this study. In Section 3.1, we use these data to explore the radio enhancement in red QSOs across four orders of magnitude in radio flux over radio frequencies spanning 144 MHz–3 GHz, and, in Section 3.2, we compare the radio morphological sizes of red and blue QSOs. In Section 4, we discuss the potential origin of the radio emission. Throughout our work, we adopt a flat Λ-cosmology with H0 = 70 kms−1Mpc−1, ΩM = 0.3, and ΩΛ = 0.7.

2. Materials and Methods
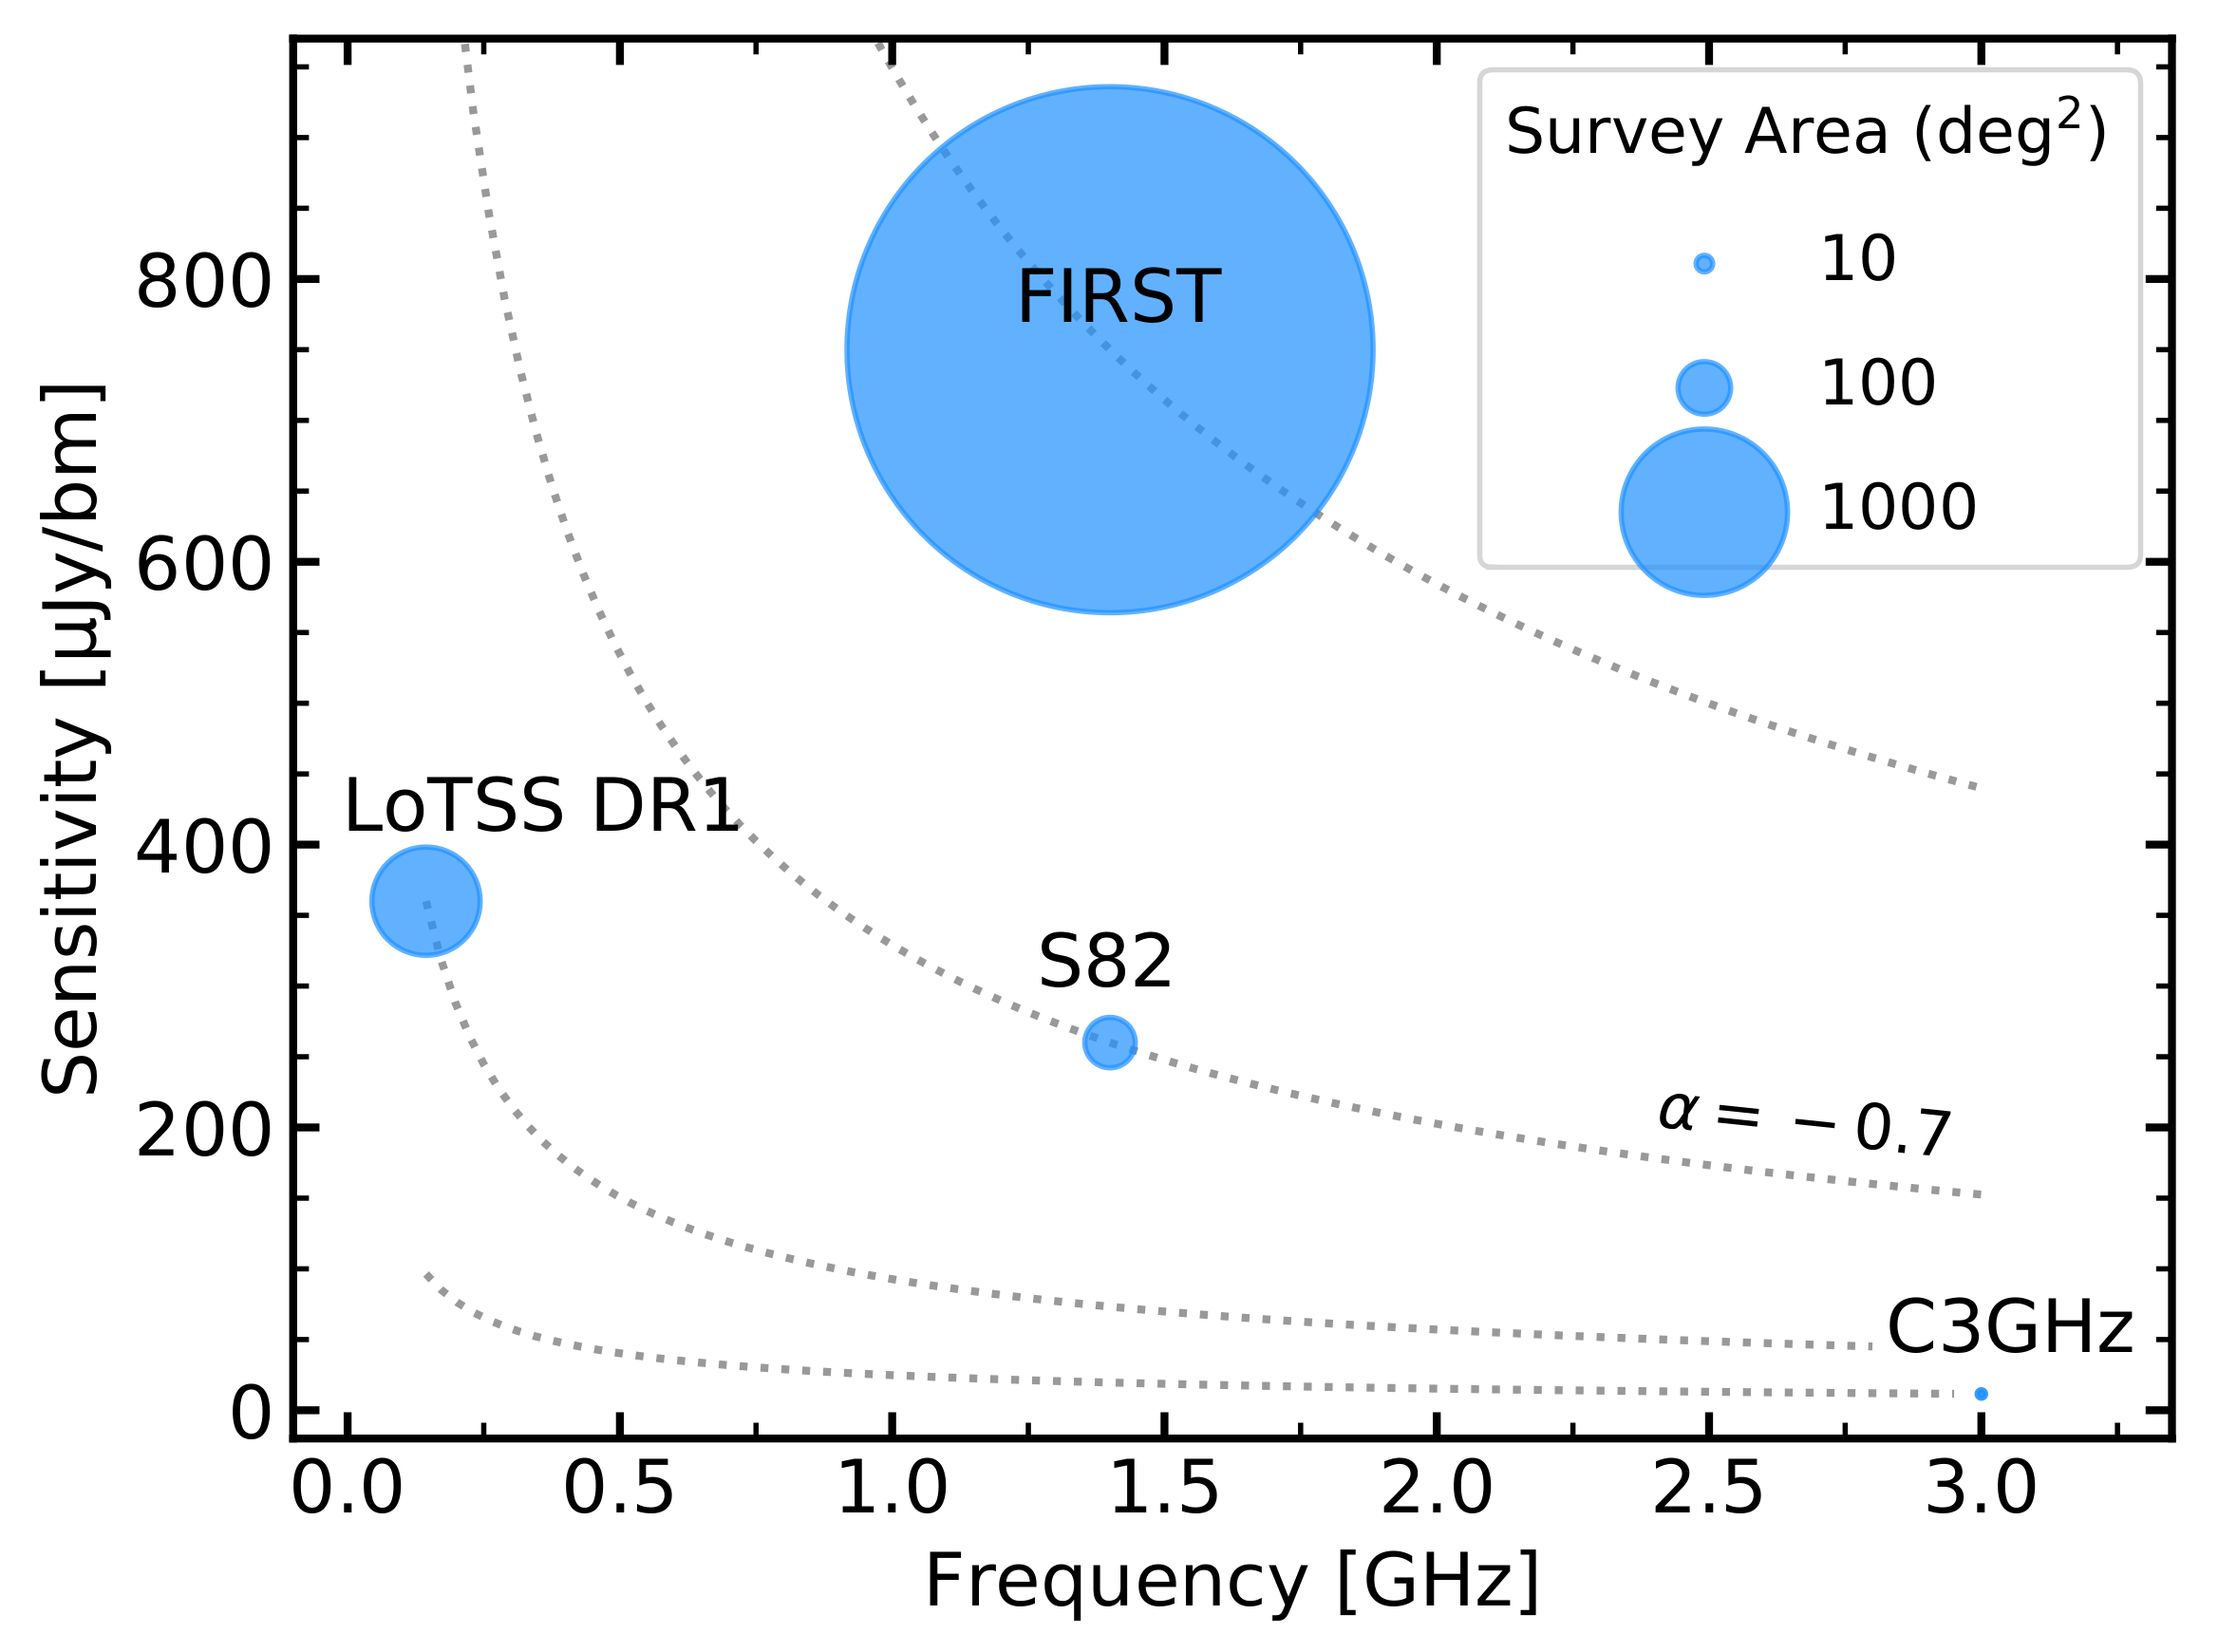
In the following sections, we briefly discuss the radio data used in this paper (Section 2.1), the optical data used to construct our QSO parent sample (Section 2.2), and our final color-selected and radio-detected samples (Section 2.3).

2.1. Radio Data

An illustration of the sensitivity, frequency and sky coverage for each radio survey used in this paper is shown in Figure 1. This highlights how some radio surveys cover a large fraction of the sky, but are lacking in sensitivity (e.g., FIRST), whereas others are extremely sensitive, but only cover a very small area of the sky (e.g., C3GHz).

2.1.1. VLA FIRST

The Faint Images of the Radio Sky (FIRST) radio survey covers 9055 deg2 of the North Galactic Cap and Equatorial Strip in the SDSS region. FIRST has a 5″ resolution at 1.4 GHz taken primarily in the VLA B-configuration. The catalogue contains 946,000 sources with a typical sensitivity of 0.15 mJy/bm; 30% of the FIRST sources have optical counterparts in the SDSS [13].

2.1.2. VLA Stripe 82 (S82)

The VLA Stripe 82 (S82; [14]) survey spans ∼92 deg2 at 1.4 GHz, centered on the equatorial SDSS Stripe 82 field (RA = 20 h to 4 h, Dec = −1.26° to 1.26° [15]). S82 has a 1.″8 spatial resolution taken primarily in the A-configuration. At its median sensitivity of 52 μJy/bm, it is roughly three times deeper than FIRST.
In the published S82 catalogue, peak flux densities (Fpeak) are derived by fitting an elliptical Gaussian model to the source. Matching to the FIRST catalogue recovers over 97% of the FIRST-detected QSOs in this region [14].

2.1.3. VLA-COSMOS 3 GHz (C3GHz)

The VLA-COSMOS 3 GHz (C3GHz) survey spans 2.6 deg2 at 3 GHz, centered on the COSMOS field (RA = 10:00:28.6, Dec = +02:12:21.0). C3GHz has a 0.″75 spatial resolution taken in the A+C configuration [16]. At its median sensitivity of ∼2.3 μJy/bm, C3GHz is equivalently ∼13 times deeper than the S82 and ∼38 times deeper than FIRST at 1.4 GHz, assuming a spectral index of α = −0.7 ( S ν ν α ). In the published catalogue, Fpeak is measured by fitting a two-dimensional parabola around the brightest pixel. On the basis of a Monte Carlo method, the source completeness is 55% up to 20 μJy, which rises to 94% above 40 μJy [16].
The COSMOS field has also been observed at 1.4 GHz over 2 deg2 in an earlier VLA radio survey [17]. This survey has a resolution of 1.″5 × 1.″4 and a sensitivity of ∼10.5 μJy/bm (∼5 times deeper than S82). To calculate the L1.4GHz, the 1.4 GHz flux from this survey is used, when available, and otherwise scaled from the 3 GHz flux using a spectral index of α = − 0.7.

2.1.4. LoTSS DR1

The LOFAR Two-meter Sky Survey (LoTSS) is a 120–168 MHz survey of northern sky at a resolution of 6″ [18]. The first full-resolution data release (DR1 [19]) covers 424 deg2 in the HETDEX spring field (RA = 10 h 45 m to 15 h 30 m, Dec = 45° to 47°). At it’s median sensitivity of 71 μJy/bm, LoTSS is equivalently ∼3.5 times deeper than S82 and ∼10 times deeper than FIRST at 1.4 GHz, assuming a spectral index of α = −0.7. To calculate the L1.4GHz, the 144 MHz fluxes are scaled to 1.4 GHz using a spectral index of α = −0.7.

2.2. Optical Data: The SDSS DR14 Quasar Catalogue

The SDSS DR14 Quasar Catalogue contains 526,356 spectroscopically-selected QSOs across a 9376 deg2 region, out to redshifts around z = 7 [20]. The catalogue includes previous spectroscopically-confirmed QSOs from the SDSS-I and II Legacy surveys [21] with QSOs targeted by the Baryon Oscillation Spectroscopic Survey (BOSS [22]) in SDSS-III [23] and the extended Baryon Oscillation Spectroscopic Survey (eBOSS [24]) in SDSS-IV.
In this paper, the SDSS five-band optical photometry (u*g*r*i*z*) is also utilized, corrected by the associated band-dependent Galactic extinction estimates. The quasar catalogue provides spectroscopic redshifts based on different estimators [20]; in this work, we use the most robust of these estimates (listed as Z in the catalogue).

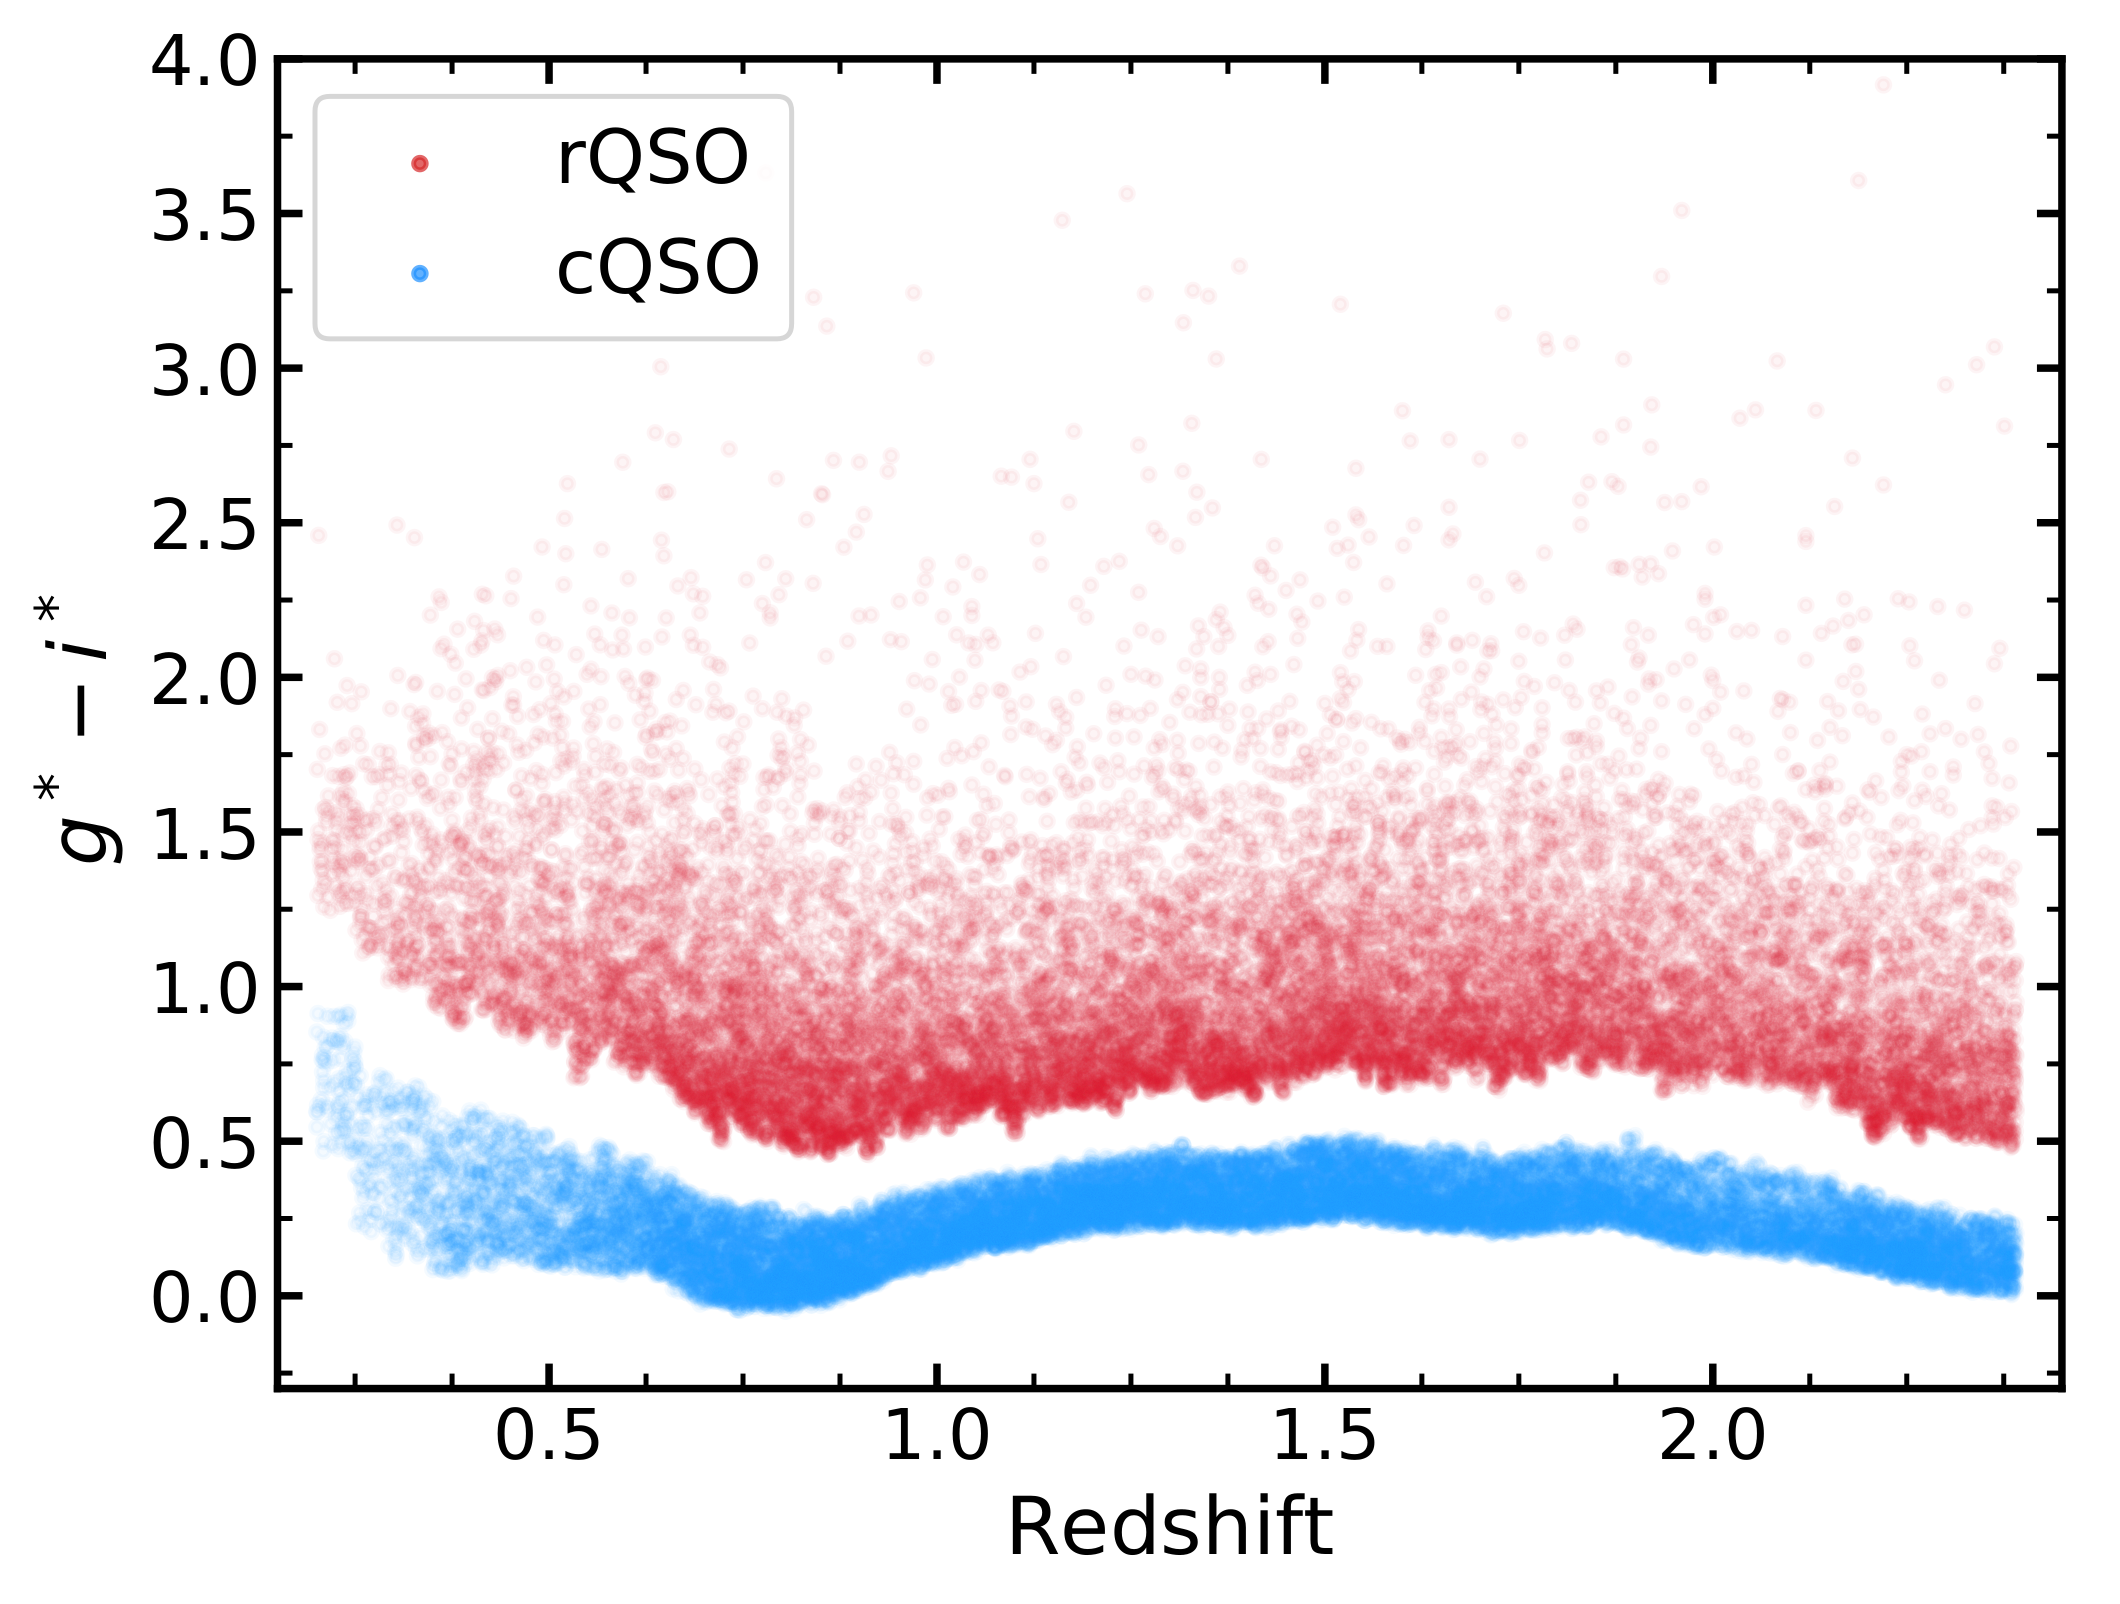
2.3. Color-Selected and Radio-Detected Samples

To define our sample of color-selected QSOs we used the g* (4770 Å) and i* (7625 Å) band extinction-corrected photometry in the DR14 catalogue and followed a similar approach to our previous studies [8,9,10]. First, we restricted to a redshift range of 0.2 < z < 2.4 to ensure our color selection is not affected by the Lyman break. In order to control for the impact of redshift on the g*i* color selections, we sorted the QSOs by redshift and constructed g*i* distributions in contiguous bins of 1000 sources. Our red and control QSOs (hereafter, rQSOs and cQSOs) were then selected above the top 90th percentile and within the middle 50th percentile of the observed SDSS g*i* distribution, respectively; therefore, the cQSOs represent typical QSOs in terms of their color. For our study, here, the color-selected QSO sample was then restricted to the various radio survey regions, using non-zero local root mean square (RMS) values either provided through a radio mosaic or an online matching server.
Due to the loss of flux at UV-optical wavelengths, dust-reddened optically-selected rQSOs will be biased towards higher luminosities compared to blue QSOs at similar redshifts. Therefore, in order to ensure that our results are not due to differences in the intrinsic luminosity distributions of rQSOs and cQSOs, we also matched the samples in both redshift and luminosity: for this, we use the rest-frame 6 μm luminosity (L6μm) since this provides an extinction-insensitive measure of the intrinsic luminosity (e.g., References [25,26,27,28]). To calculate L6μm, we identified mid-infrared (MIR) counterparts from the the Wide-Field Infrared Survey Explorer (WISE [29]), an all-sky survey which provides photometry in four bands (3.4, 4.6, 12 and 22 μm). We used the NASA/IPAC query engine to match the SDSS DR14 QSOs to the All-Sky WISE Source Catalogue (ALL-WISE), adopting a 2.″7 search radius, which ensures a 95.5% positional certainty [30], and required a detection with a signal-to-noise ratio (SNR) of greater than 2 in the WISEW1, W2, and W3 bands in order to derive an accurate estimate of their L6μm. For the final color-selected samples, we match in L6μm and redshift, using a tolerance of 0.2 and 0.05 dex, respectively 2, following a similar approach to our original work (Section 2.3.2. in Reference [8]). The g*i* color versus redshift distribution for our L6μmz matched rQSO and cQSO parent samples are shown in Figure 2. The g*i* distribution shows that, despite encompassing 50% of the parent QSO population, the cQSOs cover a narrow region of color space, compared to the broad swathe of color space encompassed by the top 10% rQSOs.
The resulting number of color-selected and radio-detected rQSOs and cQSOs for each of the four radio surveys explored in this work are displayed in Table 1; the radio-detection fraction and enhancement 3 in the rQSOs compared to the cQSOs are also shown. To quantify how many of the rQSOs and cQSOs in our sample are ‘radio-quiet’, we adopted the same “radio-loudness” parameter ( R ) as that first used in Reference [8], defined as the dimensionless quantity:
R = log 10 L 1.4 GHz L 6 μ m .
We also used the same radio-loud/radio-quiet threshold of R = 4.2 , equivalent to a mechanical-to-radiative power ratio of Pmech,sync/Prad,L6μm ≈ 0.001, which is broadly consistent with the classical radio-quiet/radio-loud threshold (often defined using a 5 GHz-to-2500 Å flux ratio), but is less susceptible to obscuration from dust (see Reference [8] for full details).

3. Results

In this section, we use the same color-selected parent QSO sample, matched in both redshift and 6 μm luminosity, in order to apply self-consistent analyses of the radio properties of rQSOs, using radio data from four different radio surveys, spanning radio frequencies of 0.144–3 GHz and equivalent 1.4 GHz radio fluxes of ∼0.01–1000 mJy.

3.1. Radio Enhancement in rQSOs

Figure 3 displays the L6μm versus L1.4GHz distributions for the four radio-detected samples used in our analyses. The differences in the distributions of the data is related to the depth and areal coverage of the radio surveys. The C3GHz has the most sensitive radio data, probing down to very low R values, but covers a small area and consequently few luminous radio-sources are detected. By comparison, the other surveys cover large areas and detect QSOs across a broad range of the R plane, providing good coverage overall particularly from the sensitive LoTSS survey. Figure 4 displays the cumulative radio-detection fraction of our four samples as a function of the 1.4 GHz radio flux. Across four orders of magnitude in 1.4 GHz flux, the rQSOs have a factor 2–3 higher radio-detection fraction in all four radio samples.
Splitting the radio-detected samples into contiguous R bins, we calculated the enhancement in the radio-detection fraction of the full color-selected sample for the rQSOs. This is calculated as the ratio of the radio-detection fraction of the rQSOs to the radio-detection fraction of the cQSOs in each sample (see our previous studies for more details [8,9,10]). Figure 5 displays the radio enhancement for the FIRST- (shaded orange), combined S82+C3GHz- (shaded blue), and LoTSS- (shaded magenta)-detected samples. All three of these samples peak around R 4.5 with a factor ∼3–6 excess in the radio enhancement for rQSOs, decreasing to around unity towards the extreme radio-loud and radio-quiet values; we will explore this decrease in Section 4.1. The spread in the shaded regions represent the error bars, showing both the peak and decrease in radio-detection enhancement is statistically significant for all the samples. Expanding on the work from Reference [8], who find an enhancement in the FIRST-detection fraction of SDSS DR7 rQSOs around the radio-quiet/radio-loud threshold, we confirm this result at a much higher significance with our DR14 sample. We also push to lower R values where we find a decrease in radio-detection enhancement, consistent with what has been seen previously with deeper radio samples [9,10], but now, for the first time, with the shallower FIRST data.

3.2. Radio Morphology

The majority of the radio-detected rQSOs that contribute to the radio-excess shown in Figure 5 have compact morphologies at the resolution of FIRST (5″; ∼43 kpc at z = 1.5 [8]). However, these size constraints are just upper limits, and higher-resolution radio data has shown that the rQSOs are typically compact over galaxy scales (e.g., <16 kpc on the basis of 1.″8 resolution data in the S82 field [9]).
Most recently, we have obtained 0.″2 e-MERLIN radio data for 19 and 20 FIRST radio-compact rQSOs and cQSOs, finding that the majority remain unresolved (suggesting <2 kpc scales) but also revealing a statistically significant enhancement in the fraction of rQSOs that are resolved over the ∼2–10 kpc scales of the host galaxy [11]. A comparison of the radio image of two rQSOs at FIRST 5″ resolution and e-MERLIN 0.″2 resolution is shown in the left of Figure 6: in the lower example, there is clear extended emission at e-MERLIN resolutions, while the upper example remains unresolved. Figure 7 displays the L1.4GHz versus projected size of the e-MERLIN rQSOs and cQSOs; resolved sources are shown as circles, and unresolved sources are shown as upper limits. The resolved and unresolved source displayed in the thumbnails of Figure 6 are outlined in black. This demonstrates that radio data sensitive to smaller spatial scales (e.g., VLBA observations at ∼0.″01) is required to directly measure the resolved sizes for the majority of the sources that contribute to the radio excess (see Section 4.2 for a more detailed discussion).

4. Discussion

In this paper, we have reviewed our recent research that identified fundamental differences in the radio properties between rQSOs and cQSOs. We also undertook a series of new analyses using the same color-selected parent QSO sample, which we then matched to four different radio surveys at various depths and frequencies. This allowed us to perform self-consistent analyses based on the same QSO sample across the different radio datasets. We confirmed our previous radio results, finding an enhancement in the radio-detection fraction of rQSOs compared to cQSOs that arises in radio compact systems around the radio-quiet threshold [8,9,10,11]. This small-scale enhanced radio emission found in red QSOs could be driven by SF, AGN processes, or differences in the accretion properties. In a recent study (Fawcett et al. (submitted)), we used broad-wavelength Very Large Telescope (VLT) X-shooter [32] spectra to explore the accretion properties of rQSOs and cQSOs, finding no significant differences between the rQSOs and cQSOs. Consequently, it appears unlikely that the radio differences between the rQSOs and cQSOs in our SDSS studies are driven by differences in the accretion properties. Therefore, in the following sections, we restrict our discussion to SF and AGN processes as drivers of the enhanced radio emission in rQSOs.

4.1. Origin of the Radio Emission: Star-Formation

It has been shown in previous studies that SF dominates the radio emission in the majority of classically radio-quiet quasars, although many can still be AGN/jet-powered [33,34,35]. In our previous study, we analyzed the spectral energy distributions (SEDs) for a sample of rQSOs and cQSOs and found no differences in the average star-formation rate properties [12]; this will be robustly tested in our future ALMA study. Therefore, it is not obvious that SF should be driving the differences we see in the radio properties of red and blue QSOs. In order to further test this, in an earlier study, we utilized the rest-frame (8–1000 μm) far-infrared (FIR) data available in the COSMOS field to provide constraints on SF [9]. We defined the origin of the radio emission as dominated by SF if the measured radio luminosity was within a factor of 3 of the radio-FIR relationship for star-forming galaxies, and AGN-dominated otherwise. Using these definitions, we then split the lower radio-loudness bins covered by our C3GHz sample into sources with radio emission either dominated by SF or AGN (black and green stars, respectively; see Figure 5). From Figure 5, it is clear that, at R < 5 , SF-dominated sources have a radio enhancement consistent with unity (albeit low source statistics), expected if there are no differences in the SF properties of rQSOs and cQSOs. We also found the AGN-dominated sources, although very uncertain, are consistent with being enhanced at all values of R , suggesting that the decrease in the radio enhancement of rQSOs at R < 5 is due to the increased contribution of SF to the radio emission. Therefore, the radio enhancement in rQSOs is likely driven by AGN mechanisms.

4.2. Origin of the Radio Emission: AGN

From the e-MERLIN observations of the FIRST radio-compact QSOs, we found a statistically significant excess in the fraction of rQSOs with kpc-scale extended emission when compared to the cQSOs. However, the majority of both the rQSO and cQSO sources remained unresolved on <2 kpc scales. The mechanism driving this compact radio emission could be wind-driven shocks, small-scale synchrotron jets, or larger jets with synchrotron self-absorption. A potential signature of the latter scenario is a turnover in the radio SED due to self-absorbed synchrotron radiation from a frustrated jet, similar to Compact Steep Spectrum (CSS) and Gigahertz-Peaked Spectrum (GPS) sources, which have well-defined peaks around 100 MHz and 1 GHz, respectively [36], or a flat spectrum due to a self-absorbed core [37]. Our future work analyzing 4-band 150 MHz–1.4 GHz upgraded Giant Meter Radio Telescope (uGMRT) data of our e-MERLIN sample (PI: V. Fawcett), in addition to the VLA Sky Survey (VLASS [38]) 3 GHz data, will be crucial for constructing sensitive 0.144–3 GHz radio SEDs to test the main mechanism driving the radio emission. We already have some insight into what we might expect to find with the uGMRT data from our previous study, where we constrained the radio spectral slopes of rQSOs and cQSOs that were compact in LoTSS at two frequencies: 144 MHz and 1.4 GHz from LoTSS DR1 and FIRST, respectively [10]. From this analysis, we found a broad range in spectral indices that peaked around α ∼ −0.7, consistent with synchrotron emission by normal jets or winds, but found no significant differences between the rQSOs and cQSOs. The right plot of Figure 6 displays the radio fluxes from the 150 MHz TIFR GMRT Sky Survey (TGSS; [39]), or an upper limit for the undetected unresolved source, FIRST, and VLASS for the two sources shown in the left thumbnails. The dashed and dotted blue lines indicate the expected fluxes for a spectral slope of α = − 0.5, − 0.7, and − 0.9, and the grey shaded regions are the radio frequencies covered by our uGMRT data, where we could see a spectral turnover in the radio SEDs of our rQSOs and cQSOs.
In addition to providing an insight into the emission mechanism, the turnover frequency of a peak in the radio SED also varies inversely with the linear size of the radio emission for GPS/CSS-like sources, providing sub-kpc constraints on the scale of the radio emission without the need for high resolution imaging [40]. In Figure 6, the vertical lines show the frequency turnovers expected for GPS/CSS-like sources of 0.03, 0.1, 0.5, and 2 kpc extents, demonstrating that, with our uGMRT data, we will directly constrain the number of rQSOs and cQSOs that have frustrated jets on ∼0.1–2 kpc scales. If the turnover frequency occurs at <150 MHz, then, this would imply synchrotron self-absorption by a frustrated jet on scales >2 kpc, resolvable for the majority of our sources with e-MERLIN (e.g., the bottom panel of Figure 6). Therefore, we will be able to rule out this scenario for the unresolved e-MERLIN sources that display no spectral turnover in their radio SEDs.
For the sources that show no evidence in their radio SED for synchrotron self-absorption, the radio emission could be driven by either small-scale synchrotron jets or wind-driven shocks. If the enhanced radio emission is due to small-scale synchrotron jets, then, it is not immediately clear why there would be a close connection between the radio emission and optical color. Exploring the origin of the red colors, in Fawcett et al. (submitted), we use VLT/X-shooter spectra to explore the cause of the red colors and find that the reddening in rQSOs is fully consistent with moderate amounts of dust (AV ∼ 0.1–1 mags), as also inferred in our recent work [12]. To further demonstrate this result, Figure 8 displays DR14 SDSS rQSO (red) and cQSO (blue) median composites, in the redshift range 1.0 < z < 1.6 and luminosity range 45.3 < log L6μm < 47.0 erg s−1. A dust-reddened cQSO composite (AV ∼ 0.5 mags) is shown by the dotted black line, which describes the shape of the red composite remarkably well. A direct connection between the presence of dust and radio emission could be through shocks, whereby a dusty wind from the nucleus interacts with the ISM. We have previously found evidence for larger FWHMs in the broader wing component of the [O iii]λ5007 in rQSOs compared to cQSOs at z < 0.8; evidence for stronger winds within the rQSO population [12]. In Alexander et al. (in prep), we also find a link between rQSOs and Low-ionization Broad Absorption Line QSOs (LoBALs; BALQSOs that display additional absorption in low-ionization species, such as Mg ii and Al iii, and are known to host powerful outflows, e.g., Reference [41]); LoBALs tend to have redder optical colors on average and have enhanced radio emission (also identified in other studies, e.g., Reference [42]). Therefore, although we cannot rule out small-scale synchrotron jets, wind-driven shocks interacting with the ISM can more directly associate the excess radio with the presence of dust and is consistent with our previous results.

5. Conclusions

We have undertaken new, self-consistent analyses using the same DR14 QSO parent sample, exploring the radio properties of a sample of 0.2 < z < 2.4 red and typical QSOs. We confirm previous results but for the first time utilizing four different radio datasets at various frequencies and depths: FIRST, S82, C3GHz, and LoTSS DR1. Overall, we find:
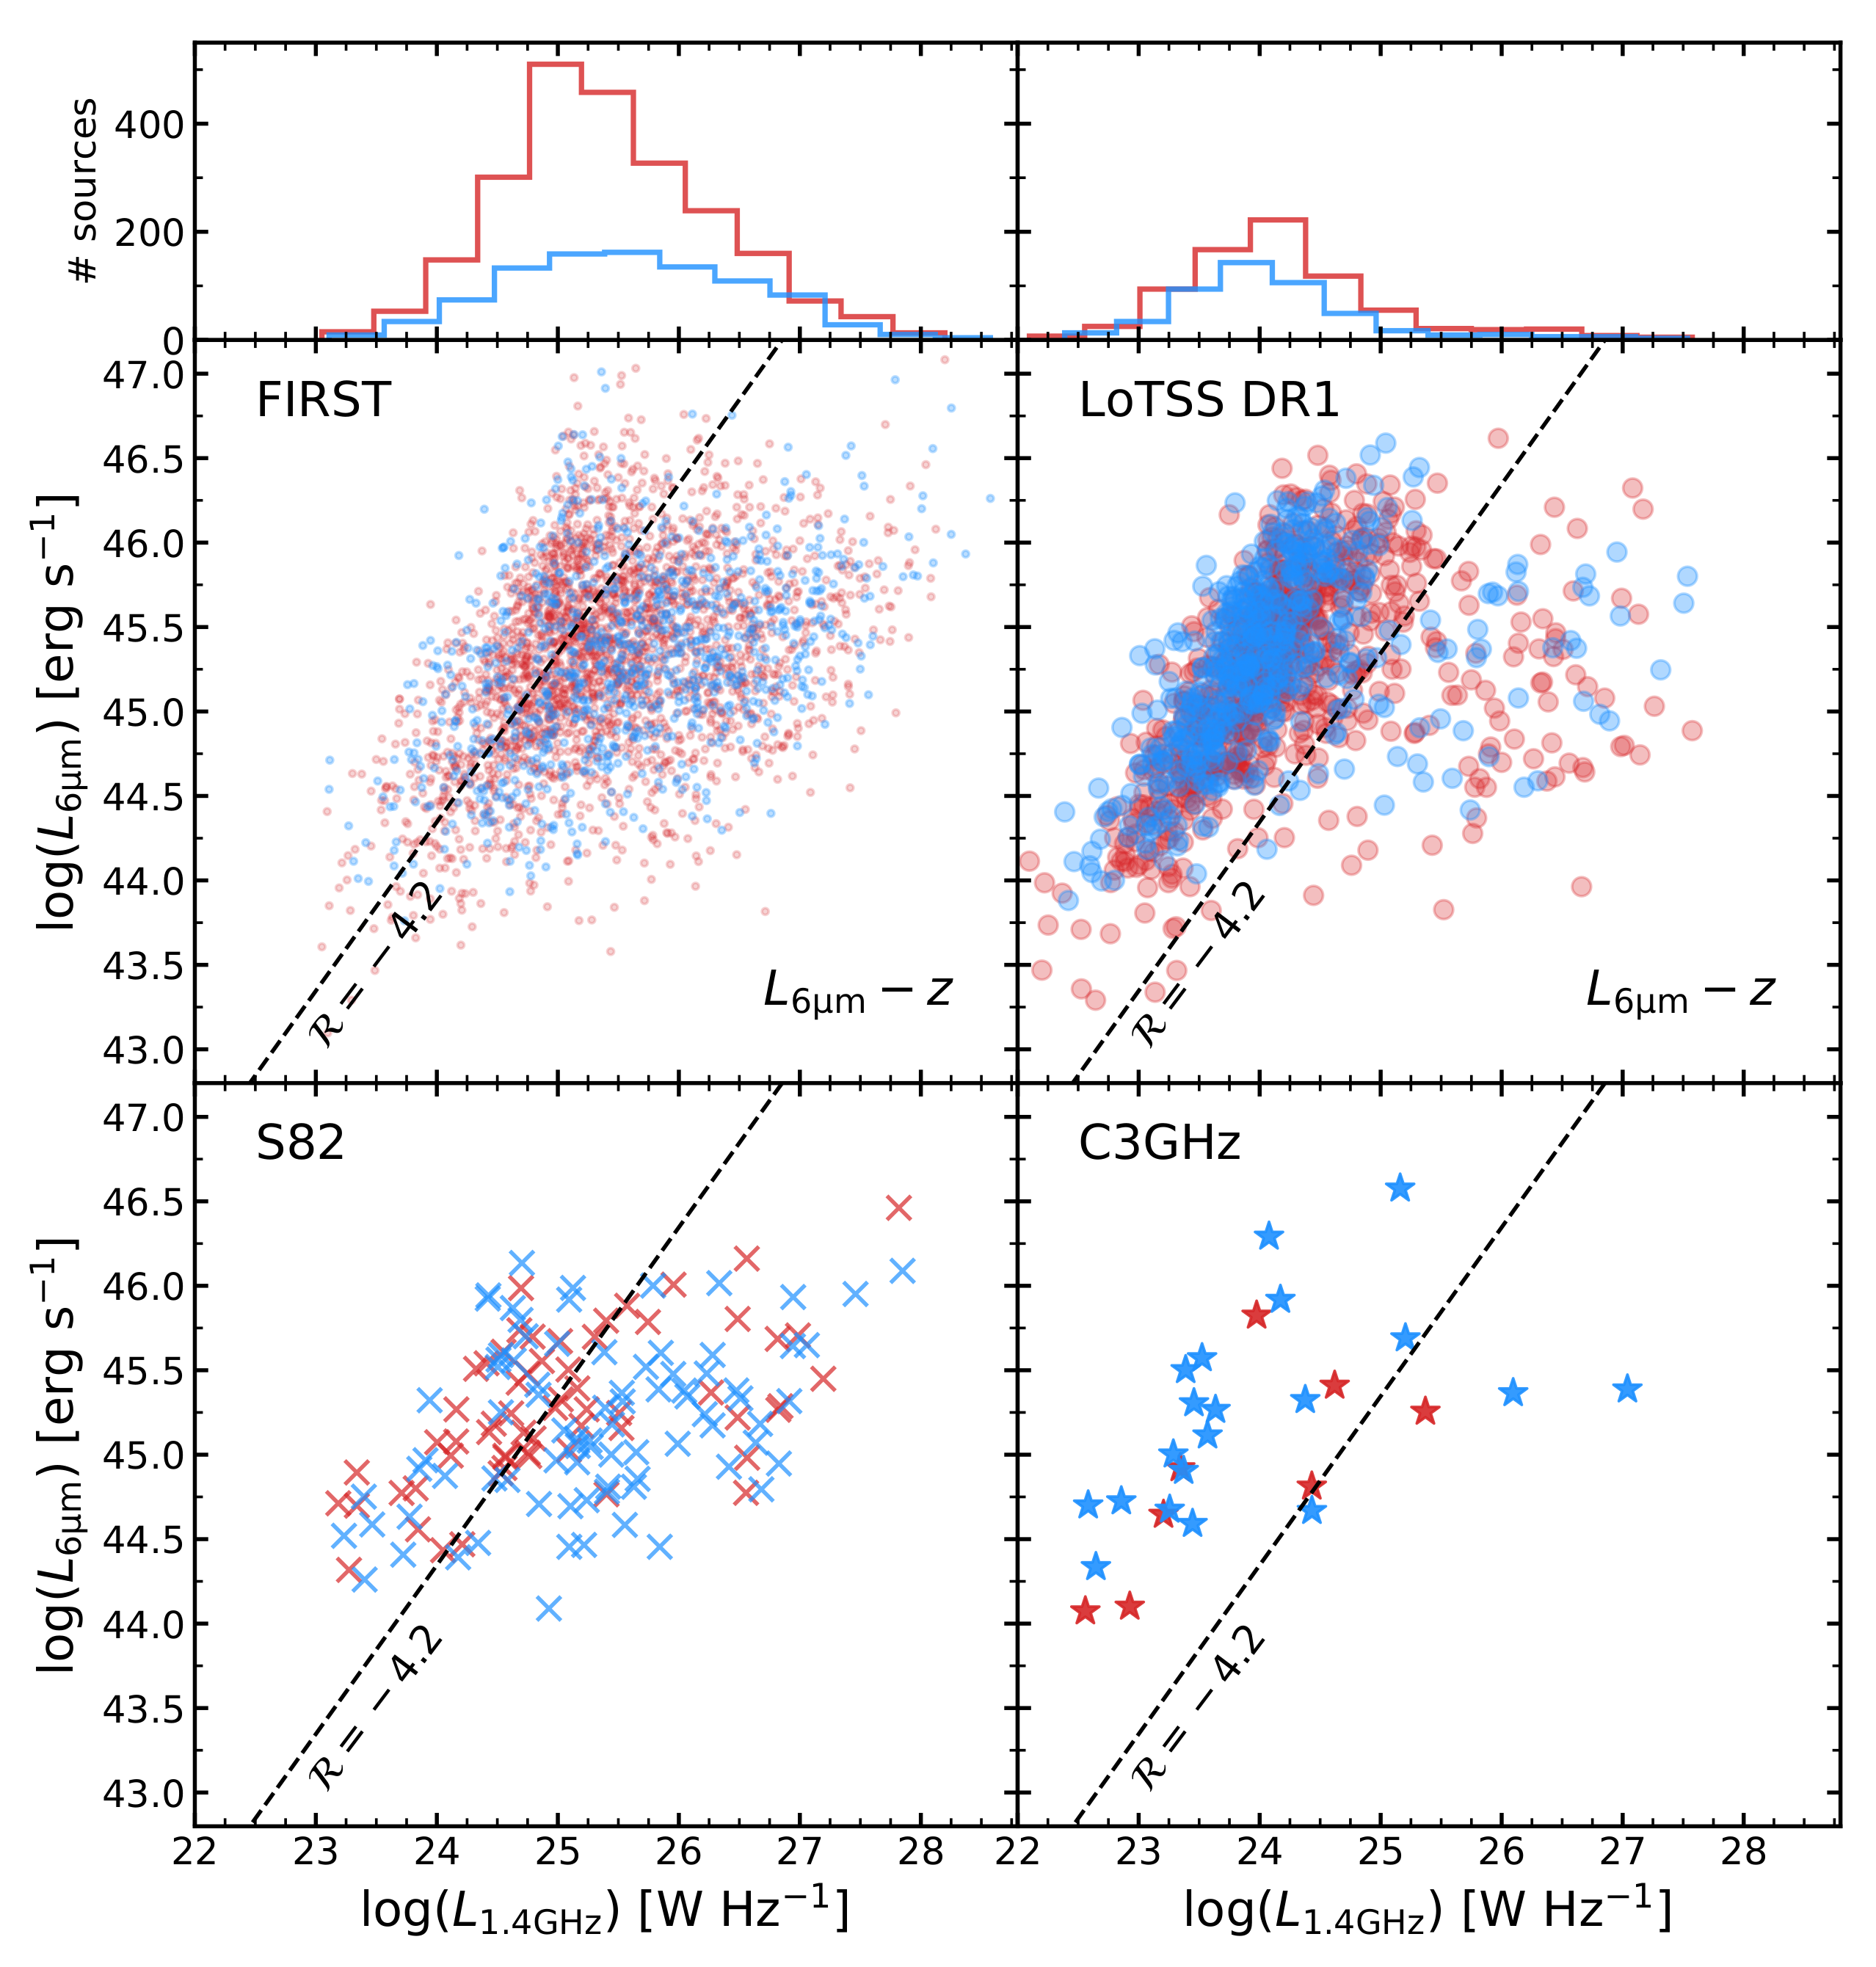
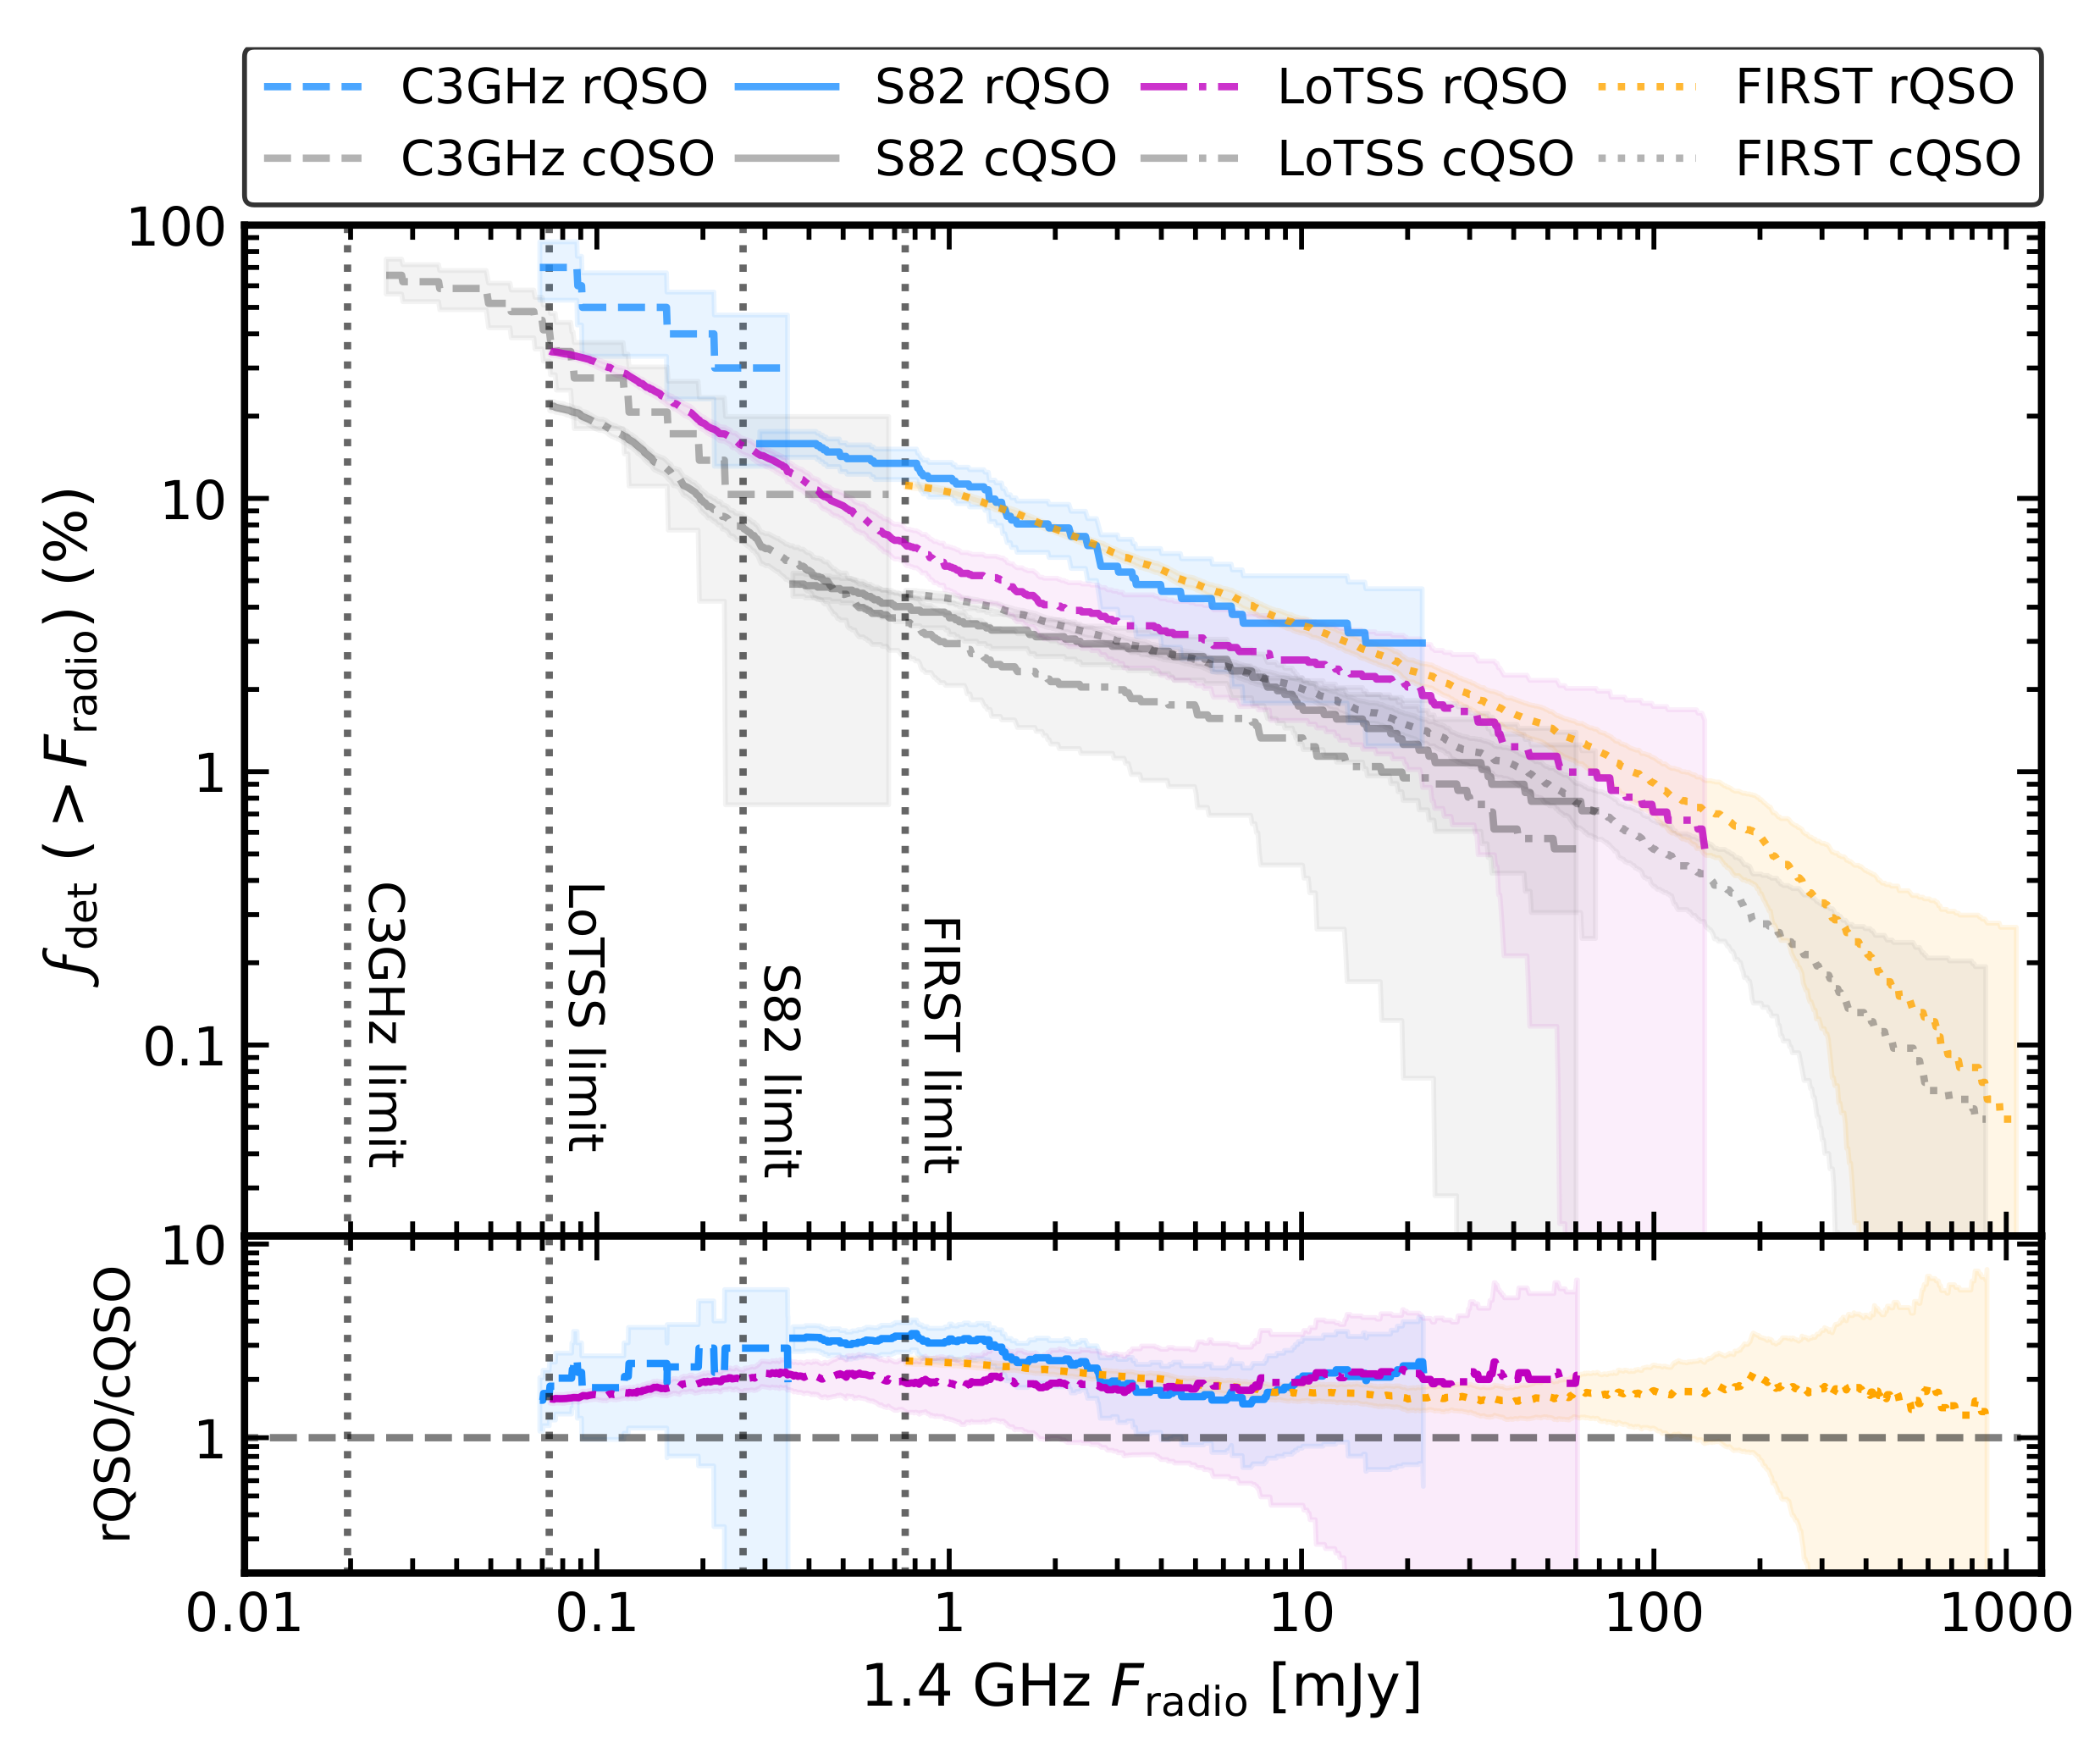
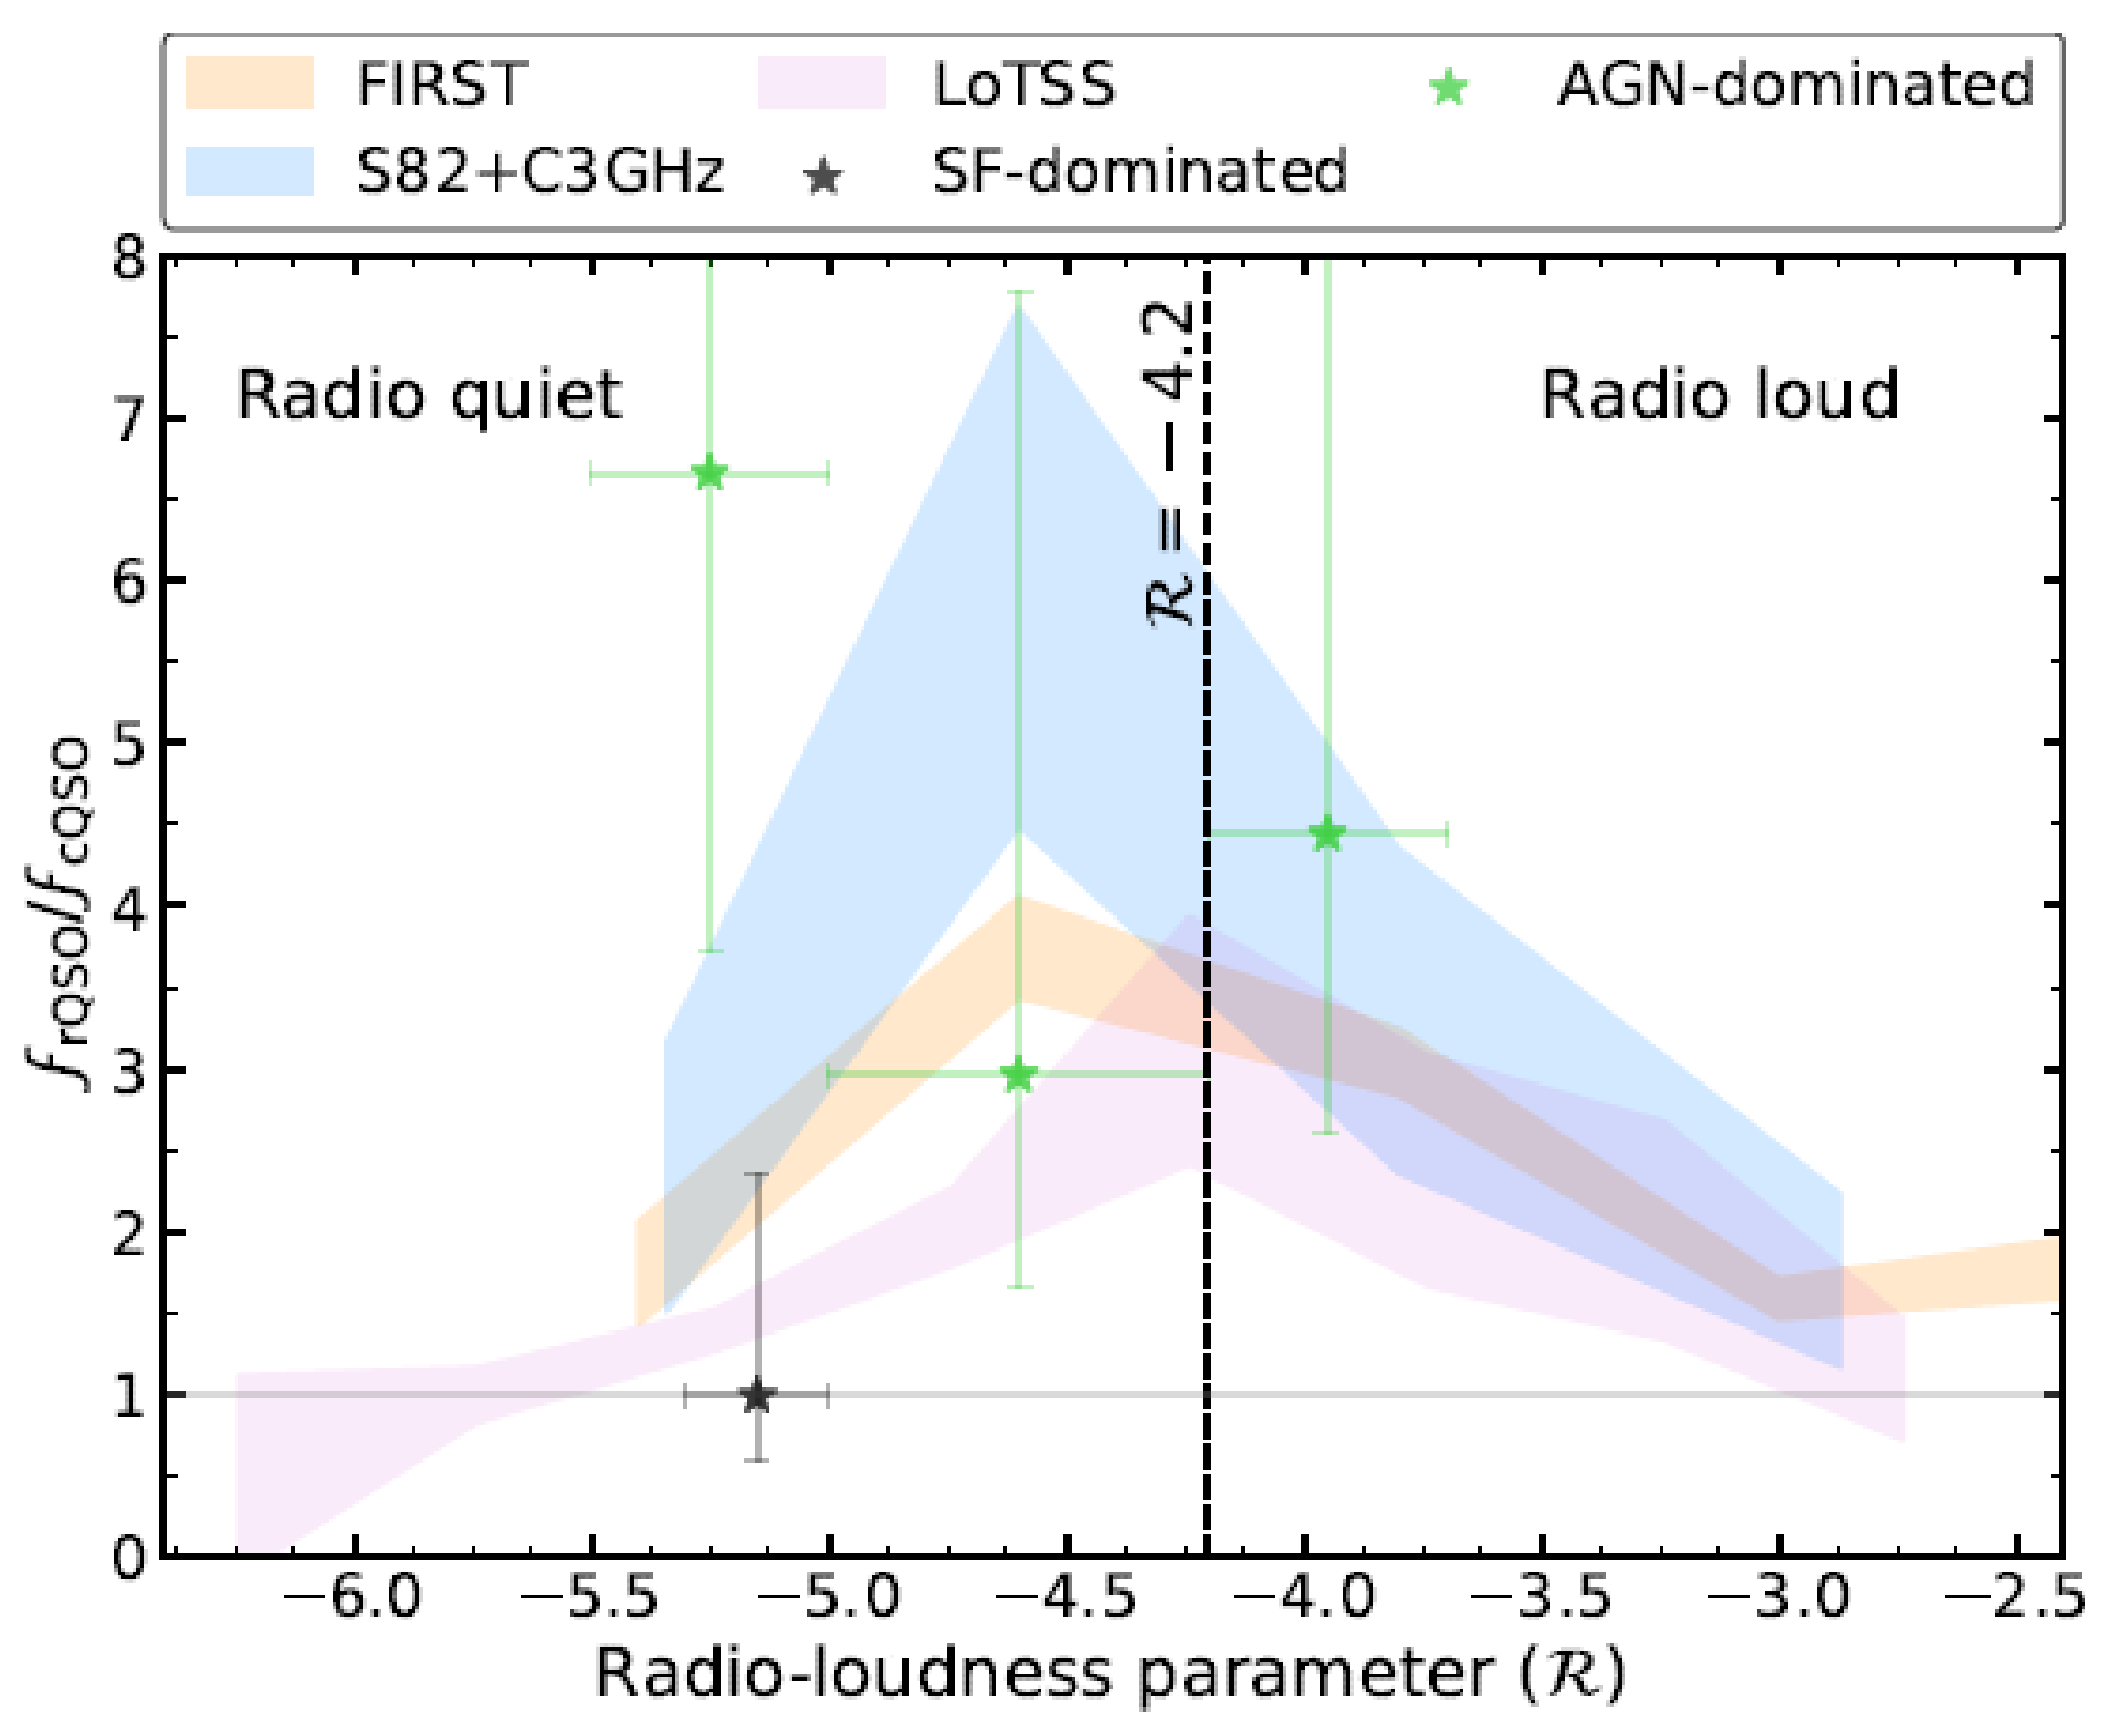
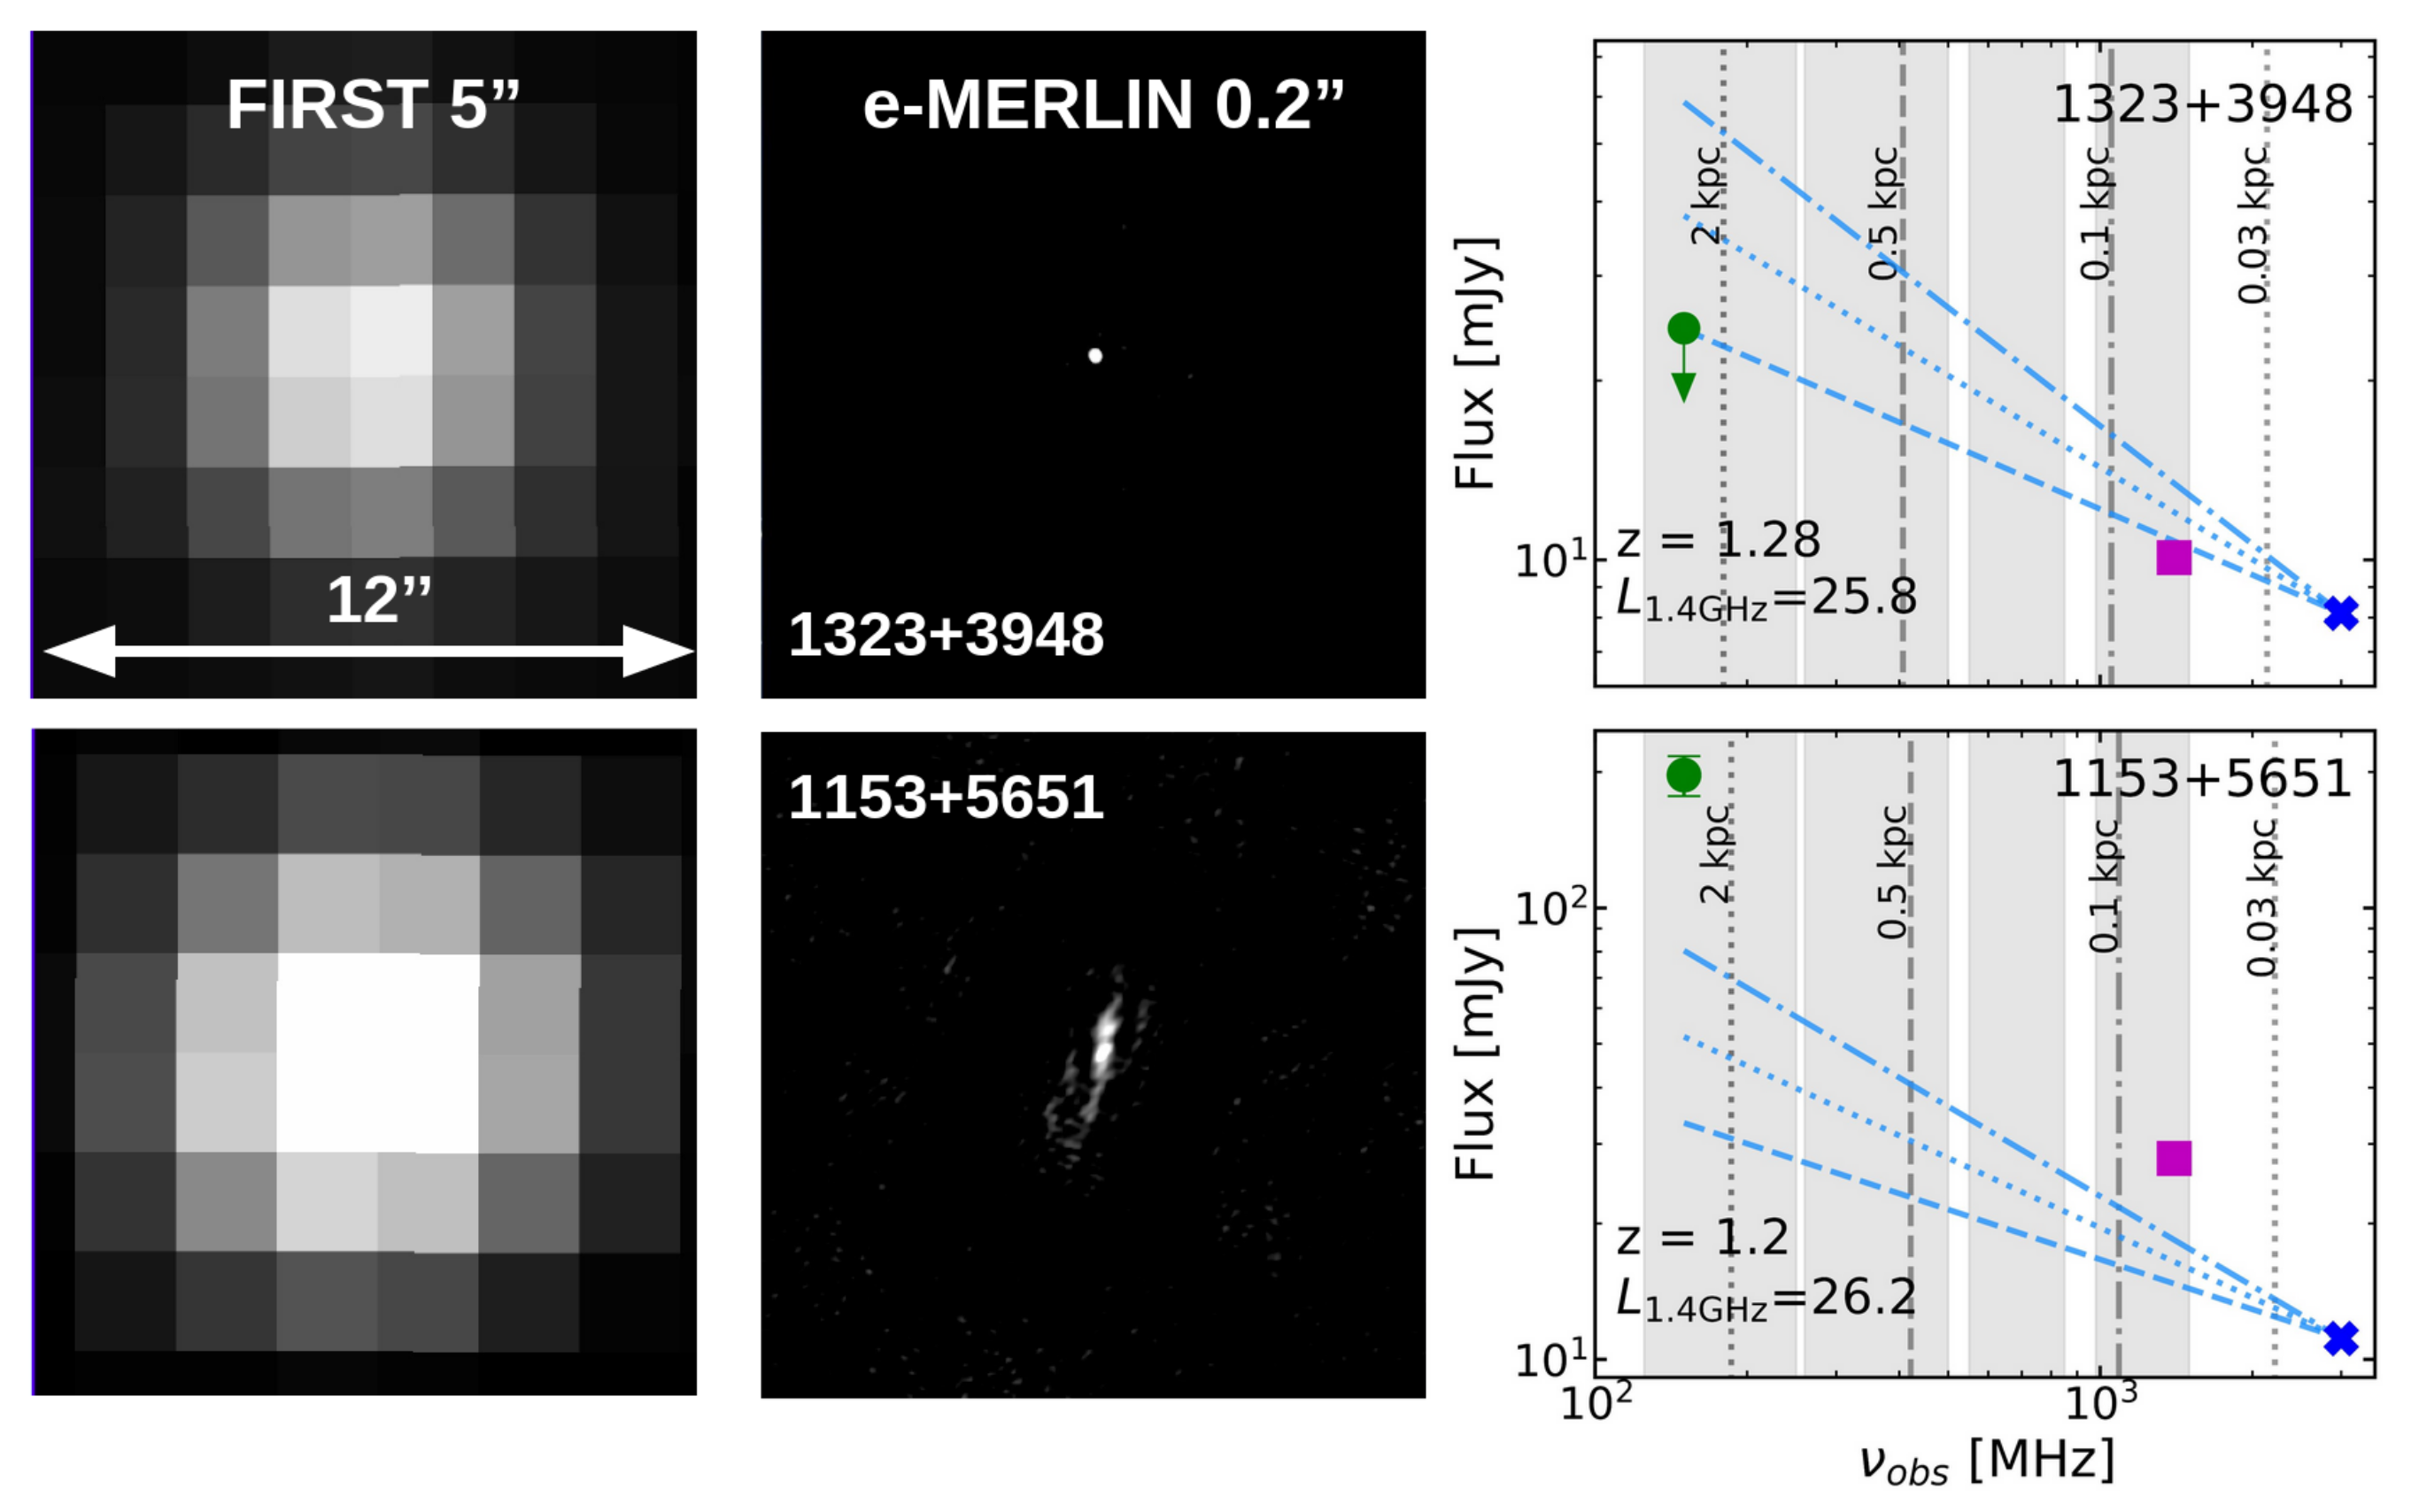
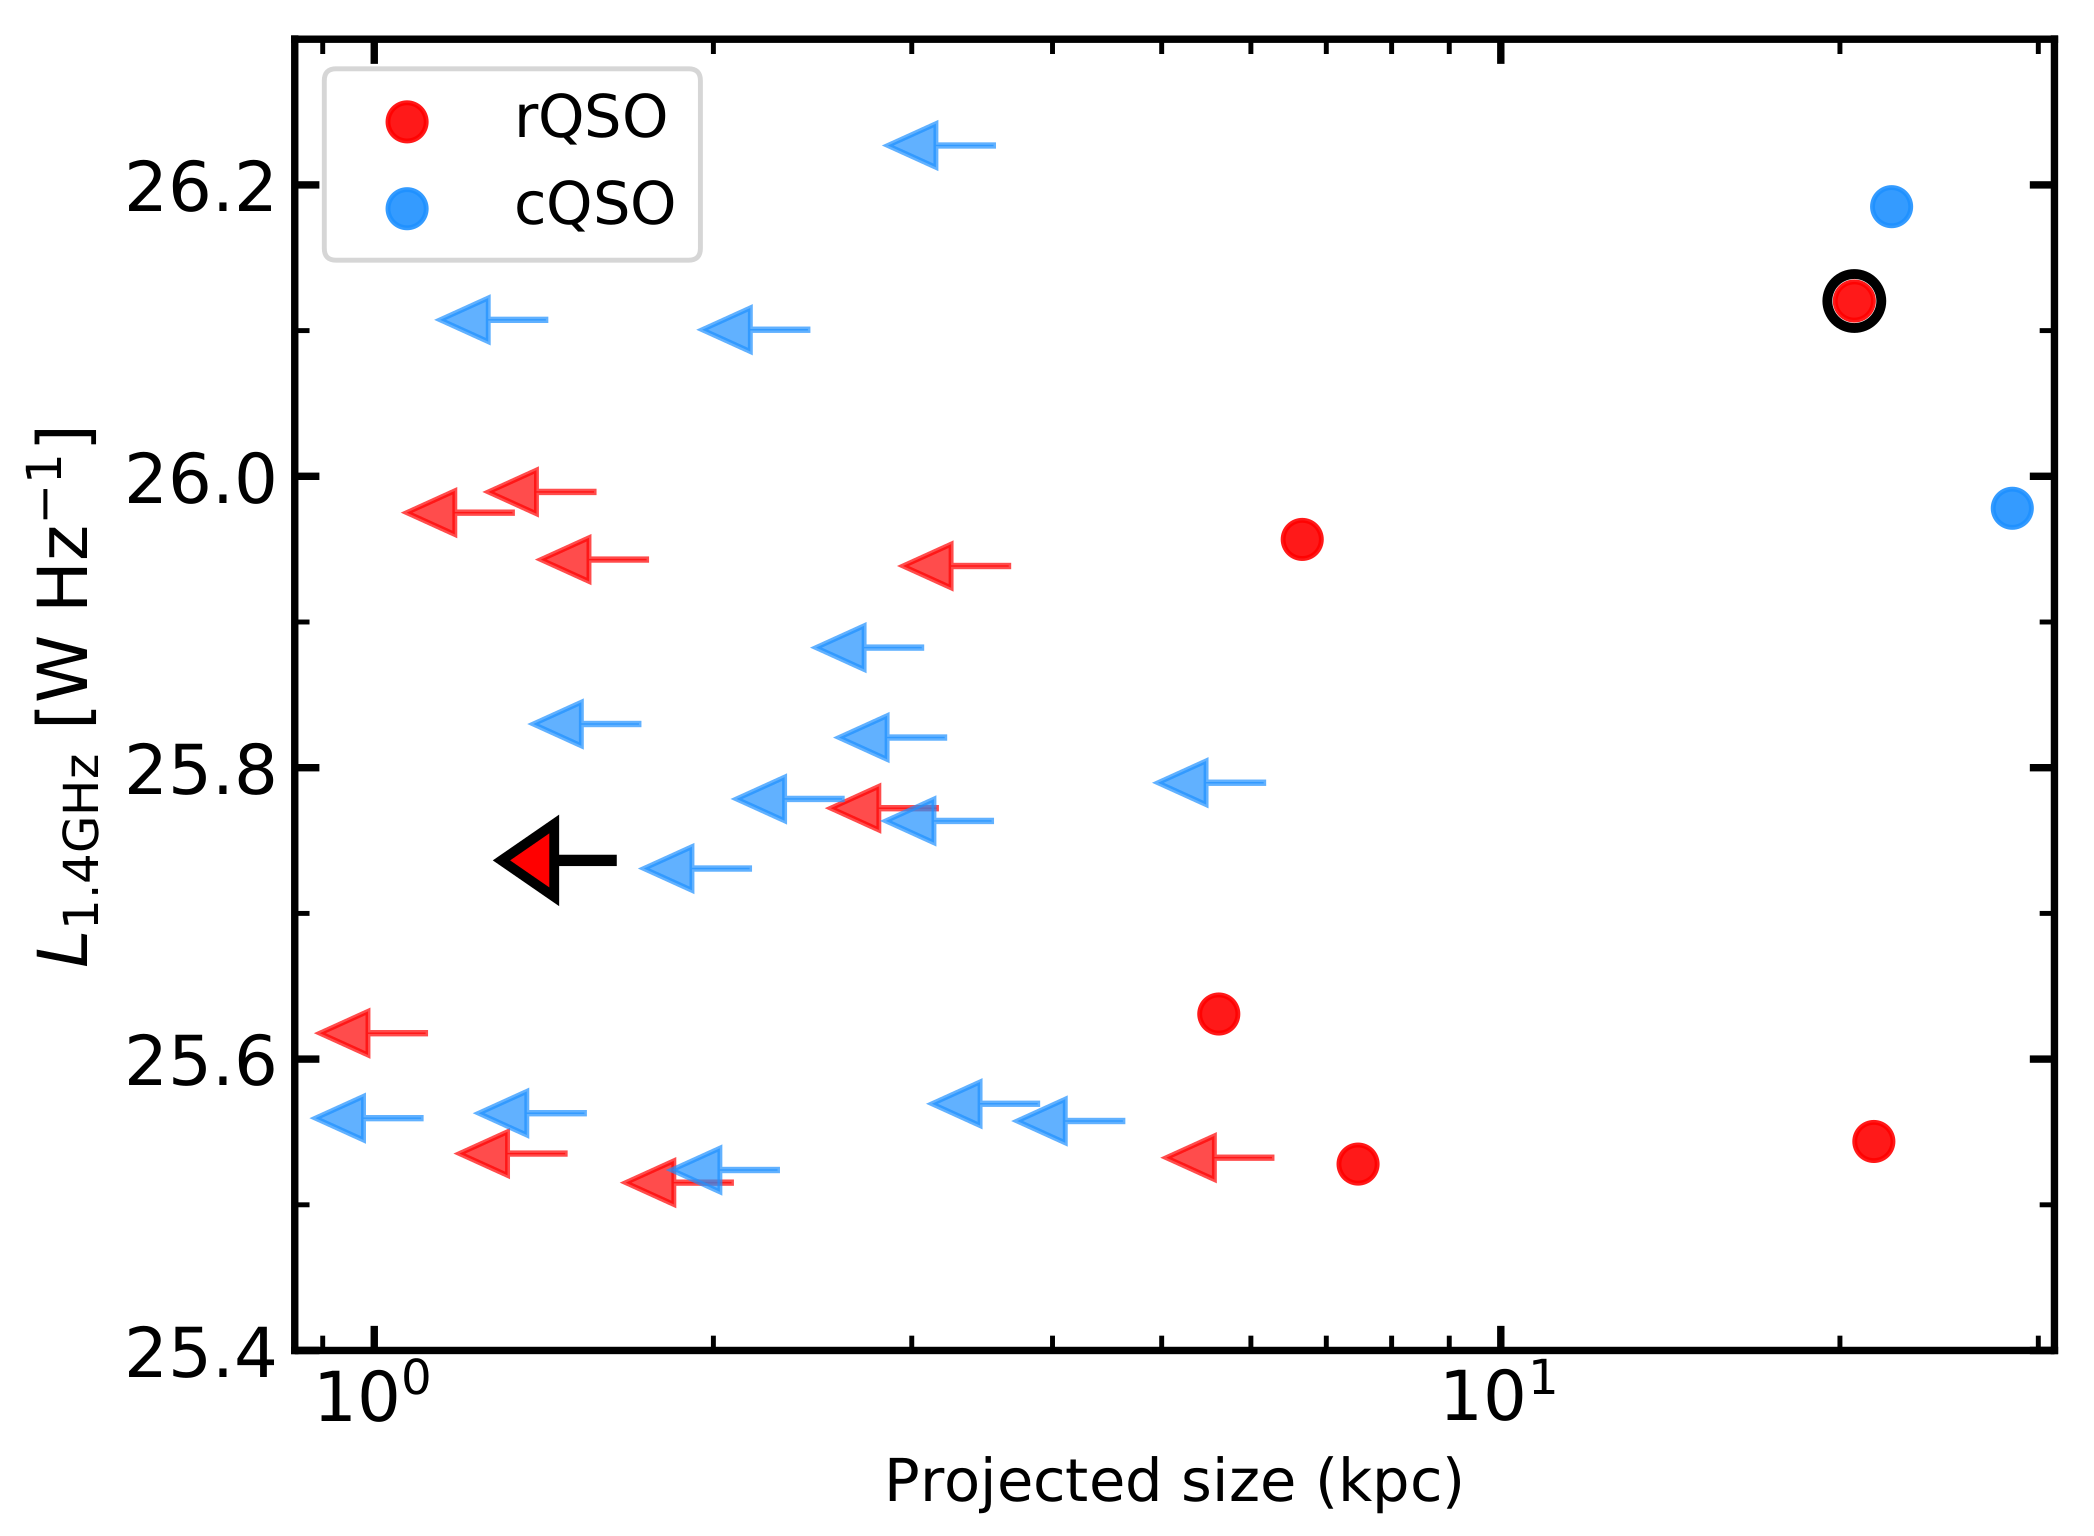
  • Red QSOs have enhanced compact 0.144–3 GHz radio emission that peaks around the radio-quiet threshold (see Figure 4, Figure 5, Figure 6 and Figure 7): We find an enhancement in the radio-detection fraction of red QSOs across a 1.4 GHz radio flux range of 0.1–1000 mJy. Exploring the radio-loudness parameter, we show that the radio enhancement in all four samples, covering radio frequencies of 0.144–3 GHz, peaks around the radio-quiet threshold and decreases towards both the extreme radio-loud and radio-quiet ends. We confirm the results from our previous work exploring the FIRST properties of SDSS DR7 red QSOs, but now at a higher significance using a 10 times larger sample. We also push to lower radio-quiet values than previously explored, confirming the decrease in radio-detection enhancement found with the deeper radio data. We confirm that the majority of radio-compact red QSOs have radio emission on <2 kpc scales [11] and show that our future uGMRT study could provide sub-kpc constraints on the scale of the radio emission.
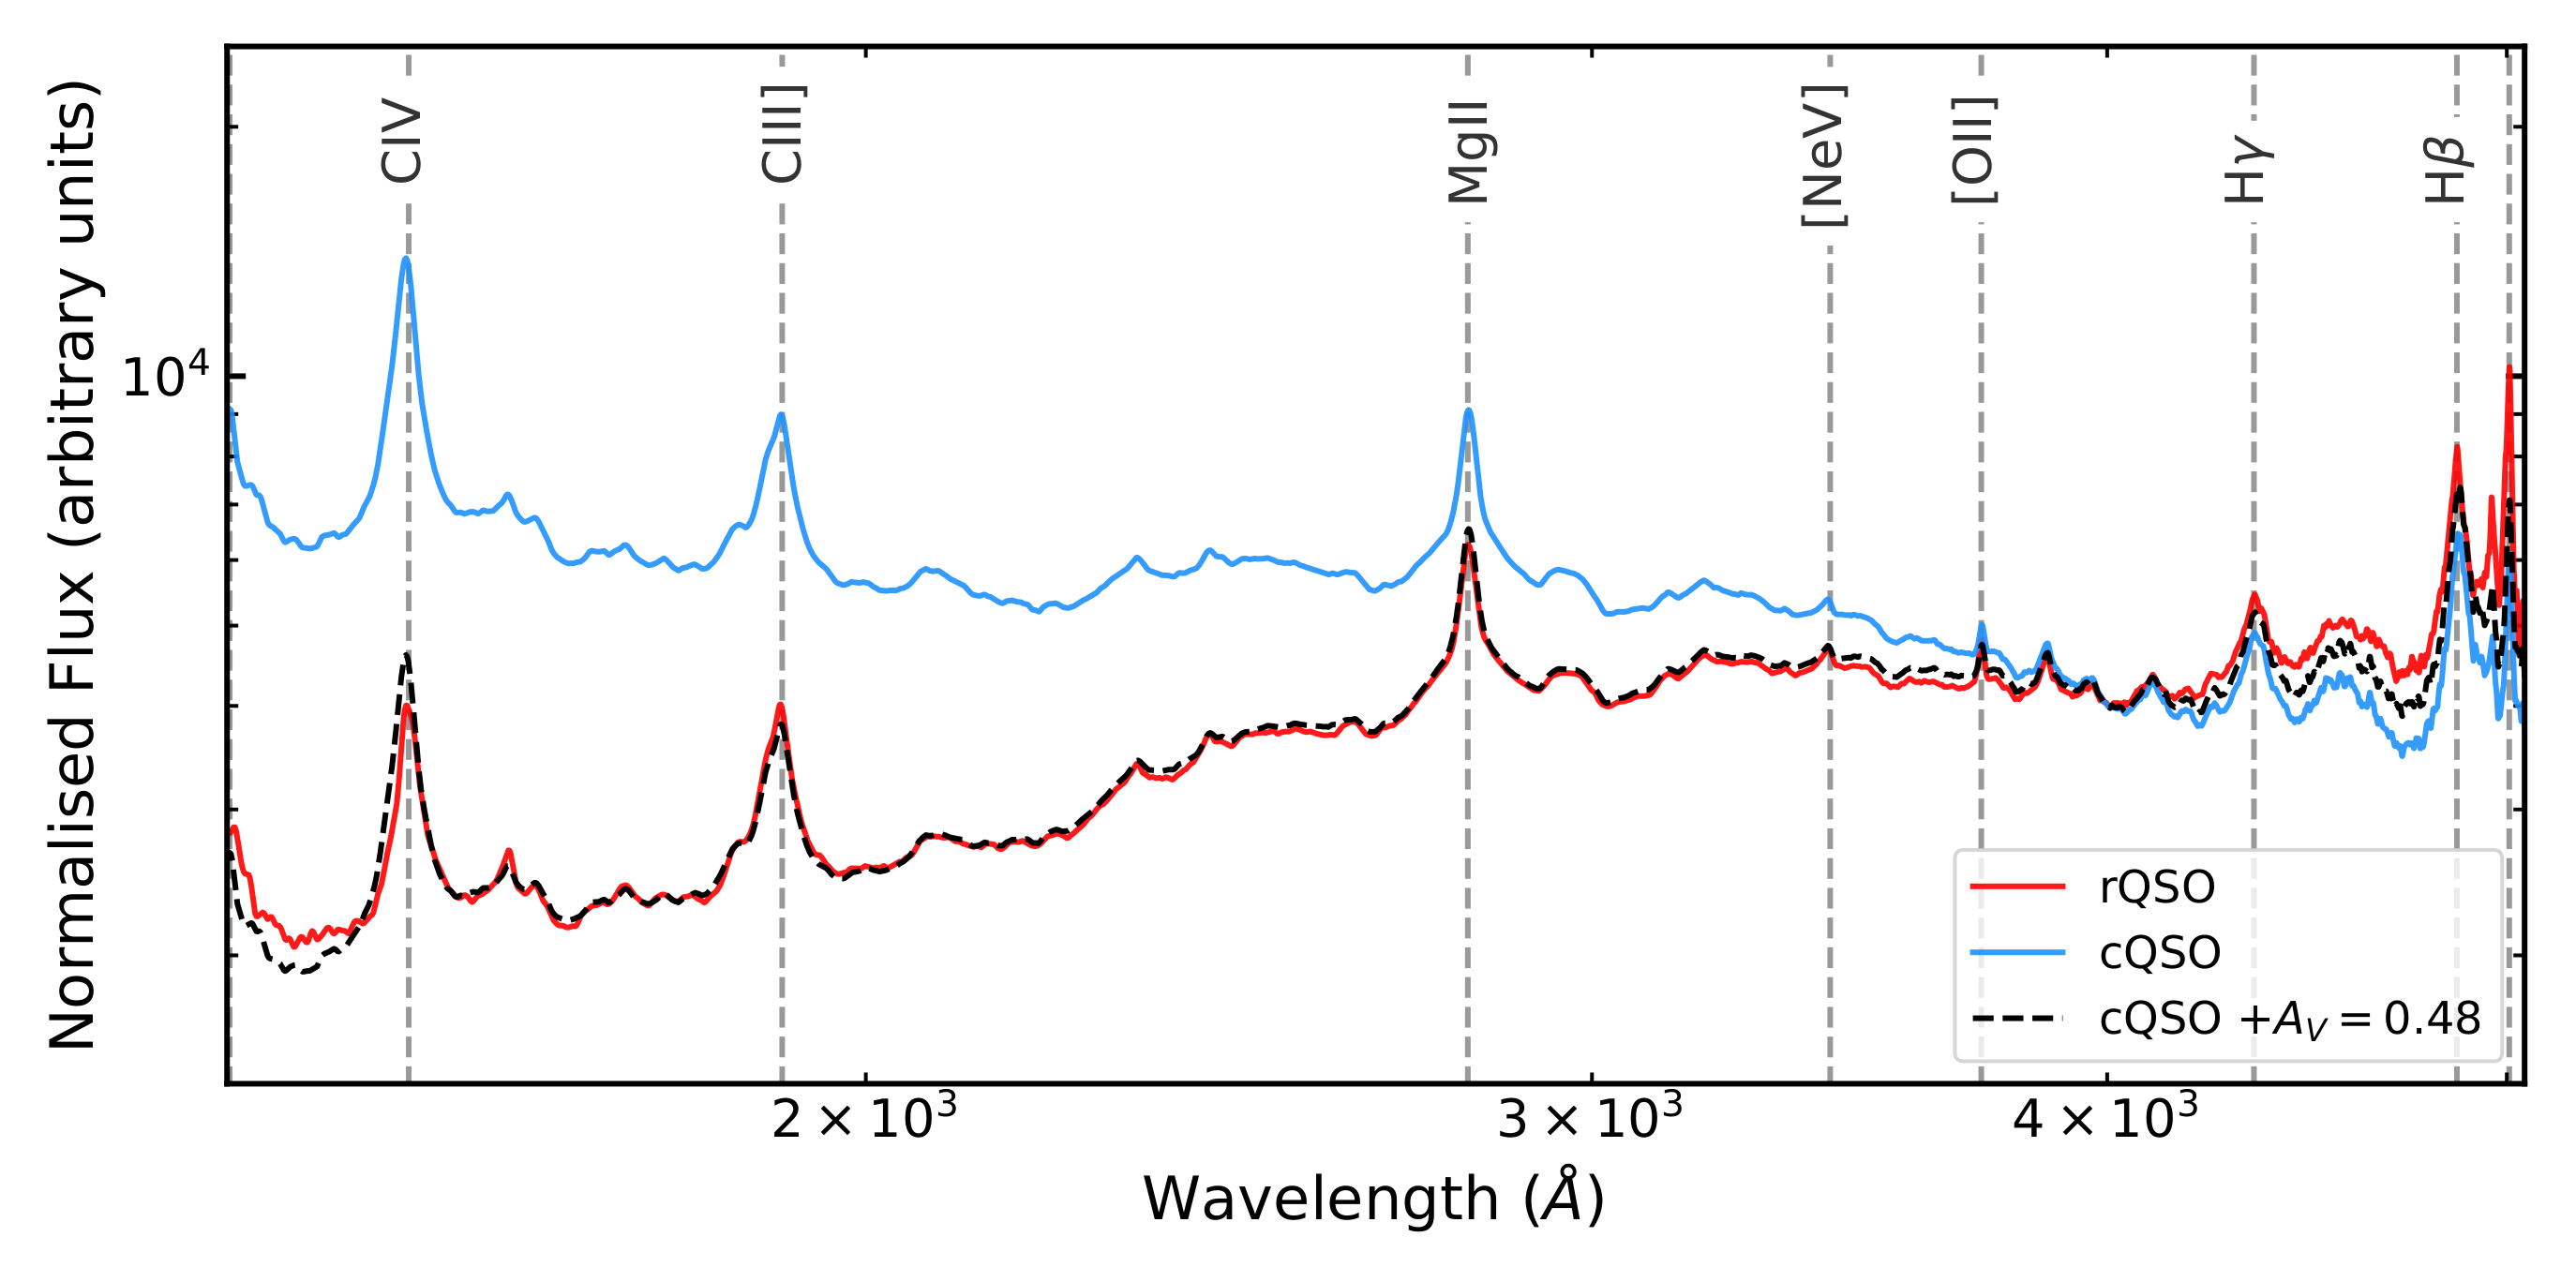
  • The enhanced radio emission in red QSOs is likely due to dusty winds or frustrated jets (see Section 4 and Figure 6 and Figure 8): Comparing a red QSO SDSS composite to a moderately dust-reddened blue composite, we show that dust is the likely cause of the red colors. This result is also confirmed in our upcoming X-shooter study where we also do not find any significant differences in the accretion properties between red and blue QSOs (Fawcett et al. (submitted)). In a previous study, we used the FIR data in the COSMOS field to show that the enhanced radio emission in red QSOs is likely driven by AGN processes (see Figure 5), consistent with Reference [12]. A self-consistent scenario that explains these results, in addition to the radio enhancement, is that red QSOs reside in a more dust and gas rich environment, in which the radio emission is due to wind-driven shocks or frustrated jets interacting with the ISM/circumnuclear environment.
Understanding the connection between red QSOs and the compact radio emission promises to provide a key insight on the relationship between red and blue QSOs: are red QSOs a transition stage between obscured and unobscured QSOs, or is the relationship more complex? We have found enhanced nuclear–galaxy scale radio emission in red QSOs compared to typical blue QSOs that could be driven by either frustrated jets, winds, or small-scale synchrotron jets. Due to the link with opacity/dust, emerging evidence from our studies suggests that the most plausible scenario is either dusty winds or frustrated jets interacting with the ISM/circumnuclear environment. With our future uGMRT+VLASS study, we aim to robustly distinguish between these two scenarios through the construction of sensitive 0.15–3 GHz radio SEDs.

Author Contributions

V.A.F., D.M.A., D.J.R. and L.K. contributed equally to this manuscript subject to the following sections: data curation, V.A.F.; original draft preparation, V.A.F.; supervision, D.M.A. and D.J.R.; project administration, D.M.A. and D.J.R. All authors have read and agreed to the published version of the manuscript.

Funding

We acknowledge a quota studentship through grant code ST/S505365/1 funded by the Science and Technology Facility Council (VAF), the Faculty of Science Durham Doctoral Scholarship (LK), the Science and Technology Facilities Council (DMA, DJR, through grant codes ST/P000541/1 and ST/T000244/1). Funding for the Sloan Digital Sky Survey has been provided by the Alfred P. Sloan Foundation, the U.S. Department of Energy Office of Science, and the Participating Institutions. SDSS-IV acknowledges support and resources from the Center for High-Performance Computing at the University of Utah.

Institutional Review Board Statement

Not applicable.

Informed Consent Statement

Not applicable.

Data Availability Statement

Publicly available datasets were analyzed in this study. This data can be found here: DR14 Quasar Catalog: https://www.sdss.org/dr14/algorithms/qso_catalog/ (accessed on 18 November 2021); ALLWISE Catalog: https://irsa.ipac.caltech.edu/cgi-bin/Gator/nph-dd (accessed on 18 November 2021); FIRST Catalog: http://sundog.stsci.edu/first/catalogs.html (accessed on 18 November 2021); VLA Stripe 82 Catalog: http://www.physics.drexel.edu/~gtr/vla/stripe82 (accessed on 18 November 2021); VLA COSMOS 1.4 & 3 GHz Catalogs: https://cosmos.astro.caltech.edu/page/radio (accessed on 18 November 2021); LoTSS DR1 Catalog: https://lofar-surveys.org/releases.html (accessed on 18 November 2021); VLASS Catalog: https://cirada.ca/catalogues (accessed on 18 November 2021); TGSS Catalog: http://tgssadr.strw.leidenuniv.nl/doku.php (accessed on 18 November 2021); The e-MERLIN data presented in this study are available on request from the corresponding author.

Acknowledgments

SDSS-IV, the primary data set used in this analysis, is managed by the Astrophysical Research Consortium for the Participating Institutions of the SDSS Collaboration including the Brazilian Participation Group, the Carnegie Institution for Science, Carnegie Mellon University, the Chilean Participation Group, the French Participation Group, Harvard-Smithsonian Center for Astrophysics, Instituto de Astrofísica de Canarias, The Johns Hopkins University, Kavli Institute for the Physics and Mathematics of the Universe (IPMU)/University of Tokyo, the Korean Participation Group, Lawrence Berkeley National Laboratory, Leibniz Institut für Astrophysik Potsdam (AIP), Max-Planck-Institut für Astronomie (MPIA Heidelberg), Max-Planck-Institut für Astrophysik (MPA Garching), Max-Planck-Institut für Extraterrestrische Physik (MPE), National Astronomical Observatories of China, New Mexico State University, New York University, University of Notre Dame, Observatário Nacional/MCTI, The Ohio State University, Pennsylvania State University, Shanghai Astronomical Observatory, United Kingdom Participation Group, Universidad Nacional Autónoma de México, University of Arizona, University of Colorado Boulder, University of Oxford, University of Portsmouth, University of Utah, University of Virginia, University of Washington, University of Wisconsin, Vanderbilt University, and Yale University. This publication makes use of data products from the Wide-field Infrared Survey Explorer, which is a joint project of the University of California, Los Angeles, and the Jet Propulsion Laboratory/California Institute of Technology, funded by the National Aeronautics and Space Administration. The National Radio Astronomy Observatory is a facility of the National Science Foundation operated under cooperative agreement by Associated Universities, Inc.

Conflicts of Interest

The authors declare no conflict of interest. The funders had no role in the design of the study; in the collection, analyses, or interpretation of data; in the writing of the manuscript, or in the decision to publish the results.

Abbreviations

The following abbreviations are used in this manuscript:
AGNActive Galactic Nuclei
BALQSOBroad Absorption Line Quasar
COSMOSThe Cosmic Evolution Survey
cQSOControl Quasar
CSSCompact Steep Spectrum
C3GHzCOSMOS 3 GHz
e-MERLINExtended Multi-Element Radio-Linked Interferometer Network
FIRFar-Infrared
FIRSTFaint Images of the Radio Sky at Twenty-cm
GPSGigahertz-Peaked Spectrum
LoBALLow-ionization Broad Absorption Line quasar
LOFARLOw Frequency ARray
LoTSSThe LOFAR Two-meter Sky Survey
MIRMid-Infrared
QSOQuasi-stellar object
rQSORed Quasar
RMSRoot Mean Square
SDSSSloan Digital Sky Survey
SEDSpectral Energy Distribution
SFStar-formation
S82Stripe 82
TGSSTIFR GMRT Sky Survey
uGMRTUpgraded Giant Meterwave Radio Telescope
VLAVery Large Array
VLASSVLA Sky Survey
VLTVery Large Telescope
WISEWide-Field Infrared Survey Explorer

Notes

1
Our previous studies had small differences in the selection of the QSO samples: e.g., different SDSS data releases and different sized control samples.
2
Due to a lack of sources, we are unable to match in luminosity for the S82 or C3GHz samples.
3
Defined as the radio-detection fraction of the rQSOs, divided by the radio-detection fraction of the cQSOs.

References

  1. Richards, G.T.; Hall, P.B.; Vand en Berk, D.E.; Strauss, M.A.; Schneider, D.P.; Weinstein, M.A.; Reichard, T.A.; York, D.G.; Knapp, G.R.; Fan, X.; et al. Red and Reddened Quasars in the Sloan Digital Sky Survey. Astron. J. 2003, 126, 1131–1147. [Google Scholar] [CrossRef] [Green Version]
  2. Glikman, E.; Helfand, D.J.; White, R.L.; Becker, R.H.; Gregg, M.D.; Lacy, M. The FIRST-2MASS Red Quasar Survey. Astron. J. 2007, 667, 673–703. [Google Scholar] [CrossRef] [Green Version]
  3. Georgakakis, A.; Clements, D.L.; Bendo, G.; Rowan-Robinson, M.; Nandra, K.; Brotherton, M.S. Are red 2MASS QSOs young? Mon. Not. R. Astron. Soc. 2009, 394, 533–546. [Google Scholar] [CrossRef] [Green Version]
  4. Urrutia, T.; Becker, R.H.; White, R.L.; Glikman, E.; Lacy, M.; Hodge, J.; Gregg, M.D. The First-2mass Red Quasar Survey. II. An Anomalously High Fraction Of Lobals In Searches For Dust-Reddened Quasars. Astron. J. 2009, 698, 1095–1109. [Google Scholar] [CrossRef]
  5. Banerji, M.; McMahon, R.G.; Hewett, P.C.; Alaghband-Zadeh, S.; Gonzalez-Solares, E.; Venemans, B.P.; Hawthorn, M.J. Heavily reddened quasars at z∼2 in the UKIDSS Large Area Survey: A transitional phase in AGN evolution. Mon. Not. R. Astron. Soc. 2012, 427, 2275–2291. [Google Scholar] [CrossRef] [Green Version]
  6. Glikman, E.; Urrutia, T.; Lacy, M.; Djorgovski, S.G.; Mahabal, A.; Myers, A.D.; Ross, N.P.; Petitjean, P.; Ge, J.; Schneider, D.P.; et al. FIRST-2MASS Red Quasars: Transitional Objects Emerging from the Dust. Astron. J. 2012, 757, 51. [Google Scholar] [CrossRef] [Green Version]
  7. Kim, D.; Im, M. What makes red quasars red? Observational evidence for dust extinction from line ratio analysis. Astron. Astrophys. 2018, 610, A31. [Google Scholar] [CrossRef] [Green Version]
  8. Klindt, L.; Alexander, D.M.; Rosario, D.J.; Lusso, E.; Fotopoulou, S. Fundamental differences in the radio properties of red and blue quasars: Evolution strongly favoured over orientation. Mon. Not. R. Astron. Soc. 2019, 488, 3109–3128. [Google Scholar] [CrossRef]
  9. Fawcett, V.A.; Alexander, D.M.; Rosario, D.J.; Klindt, L.; Fotopoulou, S.; Lusso, E.; Morabito, L.K.; Calistro Rivera, G. Fundamental differences in the radio properties of red and blue quasars: Enhanced compact AGN emission in red quasars. Mon. Not. R. Astron. Soc. 2020, 494, 4802–4818. [Google Scholar] [CrossRef] [Green Version]
  10. Rosario, D.J.; Fawcett, V.A.; Klindt, L.; Alexander, D.M.; Morabito, L.K.; Fotopoulou, S.; Lusso, E.; Calistro Rivera, G. Fundamental differences in the radio properties of red and blue quasars: Insight from the LOFAR Two-metre Sky Survey (LoTSS). Mon. Not. R. Astron. Soc. 2020, 494, 3061–3079. [Google Scholar] [CrossRef] [Green Version]
  11. Rosario, D.J.; Alexander, D.M.; Moldon, J.; Klindt, L.; Thomson, A.P.; Morabito, L.; Fawcett, V.A.; Harrison, C.M. Fundamental differences in the radio properties of red and blue quasars: Kiloparsec-scale structures revealed by e-MERLIN. Mon. Not. R. Astron. Soc. 2021, 505, 5283–5300. [Google Scholar] [CrossRef]
  12. Calistro Rivera, G.; Alexander, D.M.; Rosario, D.J.; Harrison, C.M.; Stalevski, M.; Rakshit, S.; Fawcett, V.A.; Morabito, L.K.; Klindt, L.; Best, P.N.; et al. The multiwavelength properties of red QSOs: Evidence for dusty winds as the origin of QSO reddening. Astron. Astrophys. 2021, 649, A102. [Google Scholar] [CrossRef]
  13. Becker, R.H.; White, R.L.; Helfand, D.J. The FIRST Survey: Faint Images of the Radio Sky at Twenty Centimeters. Astrophys. J. 1995, 450, 559. [Google Scholar] [CrossRef]
  14. Hodge, J.A.; Becker, R.H.; White, R.L.; Richards, G.T.; Zeimann, G.R. High-resolution Very Large Array Imaging of Sloan Digital Sky Survey Stripe 82 at 1.4 GHz. Astron. J. 2011, 142, 3. [Google Scholar] [CrossRef]
  15. Jiang, L.; Fan, X.; Bian, F.; McGreer, I.D.; Strauss, M.A.; Annis, J.; Buck, Z.; Green, R.; Hodge, J.A.; Myers, A.D.; et al. The Sloan Digital Sky Survey Stripe 82 Imaging Data: Depth-optimized Co-adds over 300 deg2 in Five Filters. Astrophys. J. Suppl. Ser. 2014, 213, 12. [Google Scholar] [CrossRef] [Green Version]
  16. Smolčić, V.; Novak, M.; Bondi, M.; Ciliegi, P.; Mooley, K.P.; Schinnerer, E.; Zamorani, G.; Navarrete, F.; Bourke, S.; Karim, A.; et al. The VLA-COSMOS 3 GHz Large Project: Continuum data and source catalog release. Astron. Astrophys. 2017, 602, A1. [Google Scholar] [CrossRef] [Green Version]
  17. Schinnerer, E.; Smolčić, V.; Carilli, C.L.; Bondi, M.; Ciliegi, P.; Jahnke, K.; Scoville, N.Z.; Aussel, H.; Bertoldi, F.; Blain, A.W.; et al. The VLA-COSMOS Survey. II. Source Catalog of the Large Project. Astrophys. J. Suppl. Ser. 2007, 172, 46–69. [Google Scholar] [CrossRef] [Green Version]
  18. Shimwell, T.W.; Röttgering, H.J.A.; Best, P.N.; Williams, W.L.; Dijkema, T.J.; de Gasperin, F.; Hardcastle, M.J.; Heald, G.H.; Hoang, D.N.; Horneffer, A.; et al. The LOFAR Two-metre Sky Survey—I. Survey description and preliminary data release. Astron. Astrophys. 2017, 598, A104. [Google Scholar] [CrossRef]
  19. Shimwell, T.W.; Tasse, C.; Hardcastle, M.J.; Mechev, A.P.; Williams, W.L.; Best, P.N.; Röttgering, H.J.A.; Callingham, J.R.; Dijkema, T.J.; de Gasperin, F.; et al. The LOFAR Two-metre Sky Survey. II. First data release. Astron. Astrophys. 2019, 622, A1. [Google Scholar] [CrossRef]
  20. Pâris, I.; Petitjean, P.; Aubourg, É.; Myers, A.D.; Streblyanska, A.; Lyke, B.W.; Anderson, S.F.; Armengaud, É.; Bautista, J.; Blanton, M.R.; et al. The Sloan Digital Sky Survey Quasar Catalog: Fourteenth data release. Astron. Astrophys. 2018, 613, A51. [Google Scholar] [CrossRef] [Green Version]
  21. York, D.G.; Adelman, J.; Anderson, J.E., Jr.; Anderson, S.F.; Annis, J.; Bahcall, N.A.; Bakken, J.A.; Barkhouser, R.; Bastian, S.; Berman, E. The Sloan Digital Sky Survey: Technical Summary. Astron. J. 2000, 120, 1579–1587. [Google Scholar] [CrossRef]
  22. Dawson, K.S.; Schlegel, D.J.; Ahn, C.P.; Anderson, S.F.; Aubourg, É.; Bailey, S.; Barkhouser, R.H.; Bautista, J.E.; Beifiori, A.; Berlind, A.A.; et al. The Baryon Oscillation Spectroscopic Survey of SDSS-III. Astron. J. 2013, 145, 10. [Google Scholar] [CrossRef] [Green Version]
  23. Eisenstein, D.J.; Weinberg, D.H.; Agol, E.; Aihara, H.; Allende Prieto, C.; Anderson, S.F.; Arns, J.A.; Aubourg, É.; Bailey, S.; Balbinot, E.; et al. SDSS-III: Massive Spectroscopic Surveys of the Distant Universe, the Milky Way, and Extra-Solar Planetary Systems. Astron. J. 2011, 142, 72. [Google Scholar] [CrossRef]
  24. Dawson, K.S.; Kneib, J.P.; Percival, W.J.; Alam, S.; Albareti, F.D.; Anderson, S.F.; Armengaud, E.; Aubourg, É.; Bailey, S.; Bautista, J.E.; et al. The SDSS-IV Extended Baryon Oscillation Spectroscopic Survey: Overview and Early Data. Astron. J. 2016, 151, 44. [Google Scholar] [CrossRef]
  25. Stern, D.; Eisenhardt, P.; Gorjian, V.; Kochanek, C.S.; Caldwell, N.; Eisenstein, D.; Brodwin, M.; Brown, M.J.I.; Cool, R.; Dey, A.; et al. Mid-Infrared Selection of Active Galaxies. Astron. J. 2005, 631, 163–168. [Google Scholar] [CrossRef] [Green Version]
  26. Lacy, M.; Canalizo, G.; Rawlings, S.; Sajina, A.; Storrie-Lombardi, L.; Armus, L.; Marleau, F.R.; Muzzin, A. Mid-infrared selection of Quasar-2s in Spitzer’s First Look Survey. Mem. Soc. Astron. Italy 2005, 76, 154. [Google Scholar]
  27. Stern, D.; Assef, R.J.; Benford, D.J.; Blain, A.; Cutri, R.; Dey, A.; Eisenhardt, P.; Griffith, R.L.; Jarrett, T.H.; Lake, S.; et al. Mid-infrared Selection of Active Galactic Nuclei with the Wide-Field Infrared Survey Explorer. I. Characterizing WISE-selected Active Galactic Nuclei in COSMOS. Astron. J. 2012, 753, 30. [Google Scholar] [CrossRef] [Green Version]
  28. Assef, R.J.; Stern, D.; Kochanek, C.S.; Blain, A.W.; Brodwin, M.; Brown, M.J.I.; Donoso, E.; Eisenhardt, P.R.M.; Jannuzi, B.T.; Jarrett, T.H.; et al. Mid-infrared Selection of Active Galactic Nuclei with the Wide-field Infrared Survey Explorer. II. Properties of WISE-selected Active Galactic Nuclei in the NDWFS Boötes Field. Astron. J. 2013, 772, 26. [Google Scholar] [CrossRef] [Green Version]
  29. Wright, E.L.; Eisenhardt, P.R.M.; Mainzer, A.K.; Ressler, M.E.; Cutri, R.M.; Jarrett, T.; Kirkpatrick, J.D.; Padgett, D.; McMillan, R.S.; Skrutskie, M.; et al. The Wide-field Infrared Survey Explorer (WISE): Mission Description and Initial On-orbit Performance. Astron. J. 2010, 140, 1868–1881. [Google Scholar] [CrossRef]
  30. Lake, S.E.; Wright, E.L.; Petty, S.; Assef, R.J.; Jarrett, T.H.; Stanford, S.A.; Stern, D.; Tsai, C.W. Optical Spectroscopic Survey of High-Latitude WISE-Selected Sources. Astron. J. 2011, 143, 7. [Google Scholar] [CrossRef] [Green Version]
  31. Cameron, E. On the Estimation of Confidence Intervals for Binomial Population Proportions in Astronomy: The Simplicity and Superiority of the Bayesian Approach. Publ. Astron. Soc. Aust. 2011, 28, 128–139. [Google Scholar] [CrossRef] [Green Version]
  32. Vernet, J.; Dekker, H.; D’Odorico, S.; Kaper, L.; Kjaergaard, P.; Hammer, F.; Randich, S.; Zerbi, F.; Groot, P.J.; Hjorth, J.; et al. X-shooter, the new wide band intermediate resolution spectrograph at the ESO Very Large Telescope. Astron. Astrophys. 2011, 536, A105. [Google Scholar] [CrossRef]
  33. Condon, J.J.; Kellermann, K.I.; Kimball, A.E.; Ivezić, Ž.; Perley, R.A. Active Galactic Nucleus and Starburst Radio Emission from Optically Selected Quasi-stellar Objects. Astron. J. 2013, 768, 37. [Google Scholar] [CrossRef] [Green Version]
  34. Herrera Ruiz, N.; Middelberg, E.; Norris, R.P.; Maini, A. Unveiling the origin of the radio emission in radio-quiet quasars. Astron. Astrophys. 2016, 589, L2. [Google Scholar] [CrossRef] [Green Version]
  35. Macfarlane, C.; Best, P.N.; Sabater, J.; Gürkan, G.; Jarvis, M.J.; Röttgering, H.J.A.; Baldi, R.D.; Calistro Rivera, G.; Duncan, K.J.; Morabito, L.K.; et al. The radio loudness of SDSS quasars from the LOFAR Two-metre Sky Survey: Ubiquitous jet activity and constraints on star formation. Mon. Not. R. Astron. Soc. 2021, 506, 5888–5907. [Google Scholar] [CrossRef]
  36. O’Dea, C.P.; Baum, S.A.; Stanghellini, C. What Are the Gigahertz Peaked-Spectrum Radio Sources? Astron. J. 1991, 380, 66. [Google Scholar] [CrossRef]
  37. Cotton, W.D.; Wittels, J.J.; Shapiro, I.I.; Marcaide, J.; Owen, F.N.; Spangler, S.R.; Rius, A.; Angulo, C.; Clark, T.A.; Knight, C.A. The very flat radio spectrum of 0735 plus 178—A cosmic conspiracy. Astron. J. 1980, 238, L123–L128. [Google Scholar] [CrossRef]
  38. Gordon, Y.A.; Boyce, M.M.; O’Dea, C.P.; Rudnick, L.; Andernach, H.; Vantyghem, A.N.; Baum, S.A.; Bui, J.P.; Dionyssiou, M. A Catalog of Very Large Array Sky Survey Epoch 1 Quick Look Components, Sources, and Host Identifications. Res. Notes AAS 2020, 4, 175. [Google Scholar] [CrossRef]
  39. Intema, H.T.; Jagannathan, P.; Mooley, K.P.; Frail, D.A. The GMRT 150 MHz all-sky radio survey. First alternative data release TGSS ADR1. Astron. Astrophys. 2017, 598, A78. [Google Scholar] [CrossRef] [Green Version]
  40. Orienti, M.; Dallacasa, D. Physical properties of young radio sources: VLBA observations of high-frequency peaking radio sources. Mon. Not. R. Astron. Soc. 2013, 438, 463–475. [Google Scholar] [CrossRef] [Green Version]
  41. Trump, J.R.; Hall, P.B.; Reichard, T.A.; Richards, G.T.; Schneider, D.P.; Vanden Berk, D.E.; Knapp, G.R.; Anderson, S.F.; Fan, X.; Brinkman, J.; et al. A Catalog of Broad Absorption Line Quasars from the Sloan Digital Sky Survey Third Data Release. Astrophys. J. Suppl. Ser. 2006, 165, 1–18. [Google Scholar] [CrossRef] [Green Version]
  42. Morabito, L.K.; Matthews, J.H.; Best, P.N.; Gürkan, G.; Jarvis, M.J.; Prandoni, I.; Duncan, K.J.; Hardcastle, M.J.; Kunert-Bajraszewska, M.; Mechev, A.P.; et al. The origin of radio emission in broad absorption line quasars: Results from the LOFAR Two-metre Sky Survey. Astron. Astrophys. 2019, 622, A15. [Google Scholar] [CrossRef]
Figure 1. The 5 σ sensitivity versus radio frequency for the four radio surveys considered in this paper. The survey area is indicated by the size of the marker. The dotted grey lines indicate the equivalent radio sensitivities of each of the four surveys at different frequencies for compact radio sources with an α = −0.7: for an equivalent 1.4 GHz luminosity, the S82, LoTSS DR1, and C3GHz survey sensitivities are ∼3, 10, and 38 times deeper than that of FIRST, respectively.
Galaxies 09 00107 g001
Figure 2. g*i* versus redshift for our parent, luminosity-redshift matched rQSO (red) and cQSO (blue) samples, which comprise the optically reddest 10% and the middle 50% of the g*i* distribution within each redshift bin.
Galaxies 09 00107 g002
Figure 3. L 6 μ m versus L 1.4 GHz of the radio-detected FIRST (dots), LoTSS (circles), S82 (crosses), and C3GHz (stars), rQSOs (red), and cQSOs (blue). Our division between radio-loud and radio-quiet sources ( R = 4.2 ) is displayed as a dashed line. To calculate the equivalent 1.4 GHz luminosity for the LoTSS and C3GHz samples, we assume a spectral index of α = −0.7 (see Figure 1). The histograms display the 1.4 GHz distributions for the FIRST and LoTSS samples: there is a higher number of radio-detected rQSOs compared to cQSOs. Due to the small survey area, we do not match in L 6 μ m for the S82 and C3GHz samples.
Galaxies 09 00107 g003
Figure 4. Cumulative radio-detection fraction as a function of 1.4 GHz flux for the four rQSO and cQSO radio-detected samples. The bottom panel displays the factor 2–3 times radio enhancement of the rQSOs; across 4 orders of magnitude a larger fraction of rQSOs are radio detected than compared to cQSOs. The shaded error region was calculated using the method described in Reference [31] and corresponds to 1 σ binomial uncertainties.
Galaxies 09 00107 g004
Figure 5. Radio-detection enhancement as a function of radio-loudness for the FIRST (orange), LoTSS (magenta), and combined S82 and C3GHz (blue) samples. Our defined radio-quiet threshold ( R = 4.2 ) is displayed as a dashed vertical line. The combined S82 and C3GHz data points are taken from Reference [9] and the LoTSS data points are taken from Reference [11]. The FIRST data points are calculated using our new self-consistent sample from this study. The shaded error region was calculated using the method described in Reference [31] and corresponds to 1 σ binomial uncertainties: in all four samples, the peak and decrease in the radio-detection enhancement is statistically significant. The radio enhancement of the C3GHz rQSOs with radio emission dominated by SF is shown as a black star, and those with radio emission dominated by AGN processes are shown as green stars.
Galaxies 09 00107 g005
Figure 6. This figure shows 12 × 12 thumbnails of two rQSOs unresolved at FIRST 5 resolution (left), observed in the e-MERLIN 0 . 2 data (middle) from Reference [11]; the top source remains unresolved at the e-MERLIN resolution but the bottom source shows ∼kpc-scale extended radio emission. (Right) radio flux versus frequency for the two sources displayed in the thumbnails, using 150 MHz data from TGSS (green circle), 1.4 GHz data from FIRST (magenta square), and 3 GHz data from VLASS (blue cross); a 7 σ upper limit of 24.5 μ Jy is used for the TGSS-undetected source (top). The grey shaded regions demonstrate the four radio bands over which we have recently obtained uGMRT data for all of our e-MERLIN observed sources, allowing us to construct sensitive radio SEDs (PI: V. Fawcett). The dashed and dotted blue lines indicate the expected fluxes for a spectral slope of α = −0.5, −0.7, and −0.9, demonstrating the variety in radio spectral slopes within the FIRST-compact sources. The vertical lines show the frequencies expected for GPS/CSS-like sources of 0.03, 0.1, 0.5, and 2 kpc extents. This demonstrates that, for the unresolved e-MERLIN source, with the uGMRT data, we will be able to constrain the radio sizes to <2 kpc scales if it is a GPS/CSS-like source, below the resolution of the e-MERLIN data.
Galaxies 09 00107 g006
Figure 7. L 1.4 GHz versus projected size of the radio emission for the e-MERLIN rQSOs and cQSOs from Reference [11]. The resolved sources are displayed as circles and the unresolved sources are shown as upper limits. The two rQSOs displayed in Figure 6 are outlined in black: source 1153+5651 is resolved, and 1323+3948 is unresolved.
Galaxies 09 00107 g007
Figure 8. SDSS DR14 composites for our rQSO (red) and cQSO (blue) samples, in a redshift range 1.0 < z < 1.6 and luminosity range 45.3 < log L 6 μ m < 47.0 erg s−1. The dotted black line shows the cQSO composite with a dust extinction of AV = 0.48 mags that is remarkably similar to the rQSO composite. This amount of dust extinction is consistent with that found from fitting the individual VLT/X-shooter spectra of a sample of rQSOs and cQSOs at z ∼ 1.5 (Fawcett et al. (submitted)) and in our SED analysis of SDSS rQSOs and cQSOs [12]. The major emission lines are indicated by a dashed vertical grey line.
Galaxies 09 00107 g008
Table 1. The columns from left to right display the: (1) radio frequency of each dataset, (2) radio survey area, (3) number of rQSOs and cQSOs in the parent samples within each radio survey region, (4) the number of radio-detected rQSOs and cQSOs (the radio-detection fractions for each color-selected sample is displayed in the brackets), and (5) the radio enhancement of rQSOs over cQSOs; the radio enhancement for the rQSOs is >1 in each sample. It should be noted that the samples S82 and C3GHz in italics are not matched in L 6 μ m due to lack of sources.
ν AreaColor-SelectedRadio-DetectedRadio
Sample[GHz][deg2]rQSOscQSOsrQSOscQSOsEnhance.
FIRST1.410,00020,54620,5462339 (11.4%)940 (4.6%)2.5
S821.492372166861 (16.4%)82 (4.9%)3.3
C3GHz32.610298 (80.0%)20 (69.0%)1.2
LoTSS0.14442421072107761 (36.1%)490 (23.3%)1.6
Publisher’s Note: MDPI stays neutral with regard to jurisdictional claims in published maps and institutional affiliations.

