Article

The Photometric and Spectroscopic Properties of Remnant and Restarted Radio Galaxies in the Lockman Hole Field

1
Kapteyn Astronomical Institute, University of Groningen, P.O. Box 800, 9700 AV Groningen, The Netherlands
2
ASTRON, Netherlands Institute for Radio Astronomy, Oude Hoogeveensedijk 4, 7991 PD Dwingeloo, The Netherlands
3
Faculty of Physics, Ludwig-Maximilians-Universität, Scheinerstr. 1, 81679 Munich, Germany
4
Dipartimento di Fisica e Astronomia, Università di Bologna, Via P. Gobetti 93/2, I-40129 Bologna, Italy
5
INAF—Istituto di Radio Astronomia, Via P. Gobetti 101, I-40129 Bologna, Italy
*
Author to whom correspondence should be addressed.
Submission received: 29 October 2021 / Revised: 8 December 2021 / Accepted: 14 December 2021 / Published: 17 December 2021

Abstract

:
Radio galaxies are known to undergo phases of activity, where the stage after the jets have switched off is referred to as the remnant phase. This state can be followed by a restarted phase when the activity reignites. Remnant and restarted radio sources are important for testing models of the evolution of radio active galactic nuclei (AGN) and for understanding the impact the recurrent jet activity has on their host galaxies. Although we now have statistical samples of radio sources in various stages of their life cycle, how this intermittent radio activity is reflected in the optical properties in this sample has not yet been addressed, and is overall a much less studied aspect in the literature. In this work, we use the Wide-field Infrared Survey Explorer and the Sloan Digital Sky Survey (SDSS) photometry, and SDSS spectra to study these properties in a sample of the remnant, candidate restarted, and active radio galaxies selected using the LOw Frequency ARray at 150 MHz in the Lockman Hole extragalactic field. Within the range of radio luminosities and stellar masses studied in this work, we find no difference between the properties of the host galaxy and of the optical emission lines for objects in different phases of their radio life cycle. The vast majority of our radio sources (either remnant, candidate restarted, or comparison sample) are associated with radiatively inefficient optical AGN and red galaxies dominated by old stellar populations. Thus, the radio and emission-line AGN activity appears to be independent and regulated by different mechanisms. This suggests that, at least for the radio luminosities of our sample, the life cycle of the radio may depend on intrinsic reasons, such as the stability of the accretion disc, more than variation in the accretion rate and fuelling of the central black hole.

1. Introduction

The energy released by an active black hole (BH) can have a significant effect on the evolution of its host galaxy ([1] and references therein). As they evolve during their life, radio galaxies are observed to go through different phases, which is often referred to as the ‘life cycle’ of a radio source (see [2,3] for extensive reviews). Jetted active galactic nuclei (AGN) start from a young phase [4,5,6,7,8] and move to an evolved active phase. The active phase can be followed by a remnant phase, when the jet activity stops or substantially decreases (e.g., [9,10,11,12,13,14,15,16]). After this remnant phase, a restarted phase can occur, where the activity reignites after the central engine has gone through a period of quiescence or low activity (e.g., [15,17,18,19]). Therefore, radio AGN activity can provide a mechanism to regulate accretion or cooling of the surrounding gas, and possibly the star formation rate (SFR) and the growth of the super massive black hole (SMBH; [20]).
The LOw Frequency ARray (LOFAR) allowed us to gather, for the first time, statistically interesting samples of remnant and restarted radio sources, as described in Section 2. One such study is presented by [19], who selected radio galaxies in the Lockman Hole extragalactic field (LH, [21]) and divided them into active, candidate remnant, and candidate restarted radio sources, complementing the selection of remnant candidates done by [13], which were recently refined by [16]. Additionally, in the LH extragalactic region, Ref. [15] selected remnant and restarted radio sources using a different criterion, namely resolved spectral index maps, complementing the three studies mentioned above. Although we now have statistical samples of radio sources in various stages of their life cycle, how this intermittent radio activity is reflected in the optical properties in this sample has not yet been addressed, and is overall a much less studied aspect in the literature.
To date, there have been only a few studies aimed at understanding the optical properties of remnant and restarted radio host galaxies, and they are not strictly based on systematically selected samples. The properties of the host galaxies, such as infrared (IR) colours, redshifts, and stellar masses, have been explored by [16,18,19] without finding significant differences.
Even less information is available about the spectroscopic properties of radio galaxies in these elusive phases. One of the few studies was presented by [22], who state that since the nuclear activity in remnant radio galaxies is currently switched off or strongly reduced with respect to its active level, a drop in the ionising photon luminosity would result in recombination and cooling of the narrow-line region (NLR), leading to a relatively low level of [O iii] emission and a decrease in the [O iii]/H β ratio, while the extended radio emission remains essentially unchanged. Remnant radio galaxies from the 3CR sample presented by [22] with z < 0.3 show a low [O iii] luminosity with respect to their total radio luminosity.
Regardless of their evolutionary classification, extensive literature is available on the study of the optical spectra and the emission lines in radio galaxies (e.g., [23,24,25,26,27,28]). Radio galaxies can be spectroscopically classified as either low-excitation radio galaxies (LERGs) or high-excitation radio galaxies (HERGs). LERGs generally accrete at a rate below 1% Eddington, and are therefore considered weakly accreting AGN, believed to be fuelled by radiatively inefficient accretion mechanisms. They are predominantly hosted by red, elliptical galaxies. HERGs typically have accretion rates between 1% and 10% of their Eddington rate, and are therefore considered strongly accreting AGN, believed to be fuelled by radiatively efficient accretion processes. HERGs tend to have bluer, more star-forming hosts (e.g., [29,30]). Both of these classes are found at all radio luminosities, with LERGs dominating at low radio luminosities, and HERGs taking over at L 1.4 GHz 10 26 W Hz 1 . Therefore, this classification can as well be associated with Fanaroff–Riley type I (FRI; [31]) and type II (FRII) radio galaxies, with some exceptions. For a detailed discussion of LERGs and HERGs, see the review by [32].
Furthermore, a correlation between the emission line (e.g., [O ii] or [O iii]) luminosity of the host galaxy and the radio luminosity of the central source has been found for active radio sources. Examples of such correlations have been presented by, for example, Refs. [24,25]. Willott et al. [24] have used narrow emission-line data from the 7C Redshift Survey and 3CRR sample to investigate correlations between the narrow-line luminosities and the radio properties of radio galaxies and steep-spectrum quasars. The latter authors present [O ii] emission-line luminosity as a function of (rest frame) 151 MHz radio luminosity with log 10 ( L 151 / W Hz 1 sr 1 ) ranging between 23–29. This work can be used for comparison with the sample studied here, as it spans a similar radio luminosity range (from 22 to 27 W Hz 1 ) measured at the same frequency.
Wills et al. [25] present spectroscopic observations of a complete sub-sample of 13 low-luminosity radio galaxies selected from the 2-Jy sample of [33,34]. The redshift of these galaxies ranges from 0.01 to 0.06. They compare the emission line and continuum properties of FRI hosts with those of other classes of radio sources, including measuring the ultraviolet (UV) excess and comparing the luminosities of the emission lines. As in the study of [23], they find that the correlation between line luminosities and radio luminosities flattens out for low-radio-luminosity ( log 10 ( L 408 MHz /W Hz 1 ) < 24) sources, where the contribution to the overall radio emission is in comparable amounts due to the AGN and star formation. The sources studied by [25] span a similar range of radio luminosities at 4800 MHz as data for our LH remnant sub-sample at 6000 MHz, enabling comparison between the two datasets.
Moreover, the intensity ratios of two pairs of relatively strong emission lines can be used to construct optical diagnostics diagrams. Based on the position of the source in these diagrams, it is possible to classify it. One of the goals of the study presented by [28] was to look at how the different ranges of the radio spectral index are positioned in the optical diagnostic diagrams. Considering the radio flux density measurements at 10450 MHz and 4850 MHz, they find with respect to the radio loudness and ionisation ratio [O iii]/H β that: (i) sources with a steep radio index ( α > 0.7; where α is defined as S ν ν α ) have a high ionisation ratio and high radio loudness; (ii) sources with a flat radio index (0.4 < α < 0.7) have a lower ionisation ratio and intermediate radio loudness; and (iii) sources with an inverted radio index ( α < 0.4) have a low ionisation ratio and low radio loudness.
Now, with the samples of remnant, candidate restarted, and active radio sources that we have selected, we aim to further expand our understanding of the impact of the AGN life cycle on its host galaxy. Through their radio properties, Sloan Digital Sky Survey (SDSS; [35]) and WISE photometry, and SDSS spectra, we address how these different types of radio sources fit into the correlations observed for active radio sources. We explore whether there is a difference related to their evolution or whether, for example, the radio luminosity defines where the source is located in parameter space regardless of its classification as a remnant or restarted source.
Using the SDSS spectra, we also aim to compare the emission line and continuum properties of the optical galaxies hosting remnant, restarted, and active radio sources. A difference in the spectroscopic properties between these three phases would mean that the cycle of radio emission is also linked to the optical nuclear activity and the optical or IR properties of the host galaxy. If no difference is observed, we could conclude that the optical and radio active nucleus evolve independently or on different time scales so that we do not see any correlations. Indeed, the statistical results from [36] suggest that the occurrence of optical and radio AGN (detected in massive galaxies with radio luminosity at 1400 MHz in the range from 10 23 to 10 25 W Hz 1 ) follow different trends with the properties of the host galaxy, thus indicating that these phenomena are independent and triggered by different physical mechanisms.
The paper is structured as follows. In Section 2, we describe the samples studied in this work and the criteria used to select them. Optical and IR data used in the analysis are described in Section 3. In Section 4, we describe the radio properties and photometric properties of the galaxies hosting remnant, candidate restarted, and the active comparison sample in the LH field. The results obtained from optical spectroscopic data are given in Section 5 and Section 6. We discuss the results in Section 7. Finally, in Section 8, we present the conclusions and future prospects. The cosmology adopted throughout the paper assumes a flat universe with the following parameters: H 0 = 70 km s 1 Mpc 1 , Ω Λ = 0.7, Ω M = 0.3.

2. The Sample

Our study explores the photometric and spectroscopic properties of radio galaxies in the LH extragalactic field presented by [19]. The latter authors selected 158 radio galaxies with angular sizes greater than 60 in the LOFAR image at 150 MHz with 6 resolution [37]. The follow-up work on the original sample resulted in the rejection of two sources, due to the radio emission tracing the star-forming disk of the low redshift (z = 0.02815 ± 0.00002) edge-on galaxy UGC 5768 in the first case, and because the two radio lobes, both with angular sizes smaller than 60 , were proven to be associated with two different host galaxies in the second case. Finally, we added two more sources in the LH to this sample (selected by [13]), which are outside of the area covered by the LH catalogue used to select the original sample. Therefore, the total number of radio sources studied here is 158 (see also [15,16,19]).
In the full sample of 158 radio galaxies in the LH, 15 are classified as remnant radio sources based on morphological and/or spectral criteria. Out of these 15 remnant radio sources, 13 come from the studies by [13,16]. Brienza et al. [13] selected a sample of 23 remnant candidates with angular sizes > 60 from the LOFAR image of the LH field at 150 MHz with 18 resolution published by Mahony et al. [38]. Follow-up study with LOFAR 6 image at 150 MHz [37] and Very Large Array (VLA) images of the core and extended radio emission at 6000 MHz refined this sample to 13 confirmed remnant radio galaxies [16], confirming the original criteria for selecting remnants as proposed by [13]. The remaining two remnant radio sources were selected from the resolved spectral index maps constructed using the LOFAR 150 MHz and Westerbork Synthesis Radio Telescope (WSRT) APERture Tile In Focus (Apertif) 1400 MHz data [15].
Furthermore, out of 158 radio galaxies in the LH region, 21 are restarted candidates. Twenty of them were selected as described in [19] using morphological and spectral criteria in the frequency range from 150 MHz to 1400 MHz. The remaining restarted candidate was selected from the resolved spectral index maps by [15].
Finally, 122 radio galaxies not selected as remnants or restarted candidates provide a comparison sample used in the analysis. An overview of the radio properties of the remnant and candidate restarted radio sources studied in this paper is given in Table 1. In the second column of the table, we note the selection criteria used to identify the phase of each source. If the source was selected by [15], we note it with ‘RM+21’ in superscript. Otherwise, restarted candidates have been selected by [19], while the remnant candidates were originally selected by [13] and further refined by [16]. A deeper discussion of the selection criteria used is presented in the studies mentioned throughout this section. The optical properties discussed below are presented in Table A1, and the detailed optical identification for both remnant radio sources and restarted candidates is described in [16].

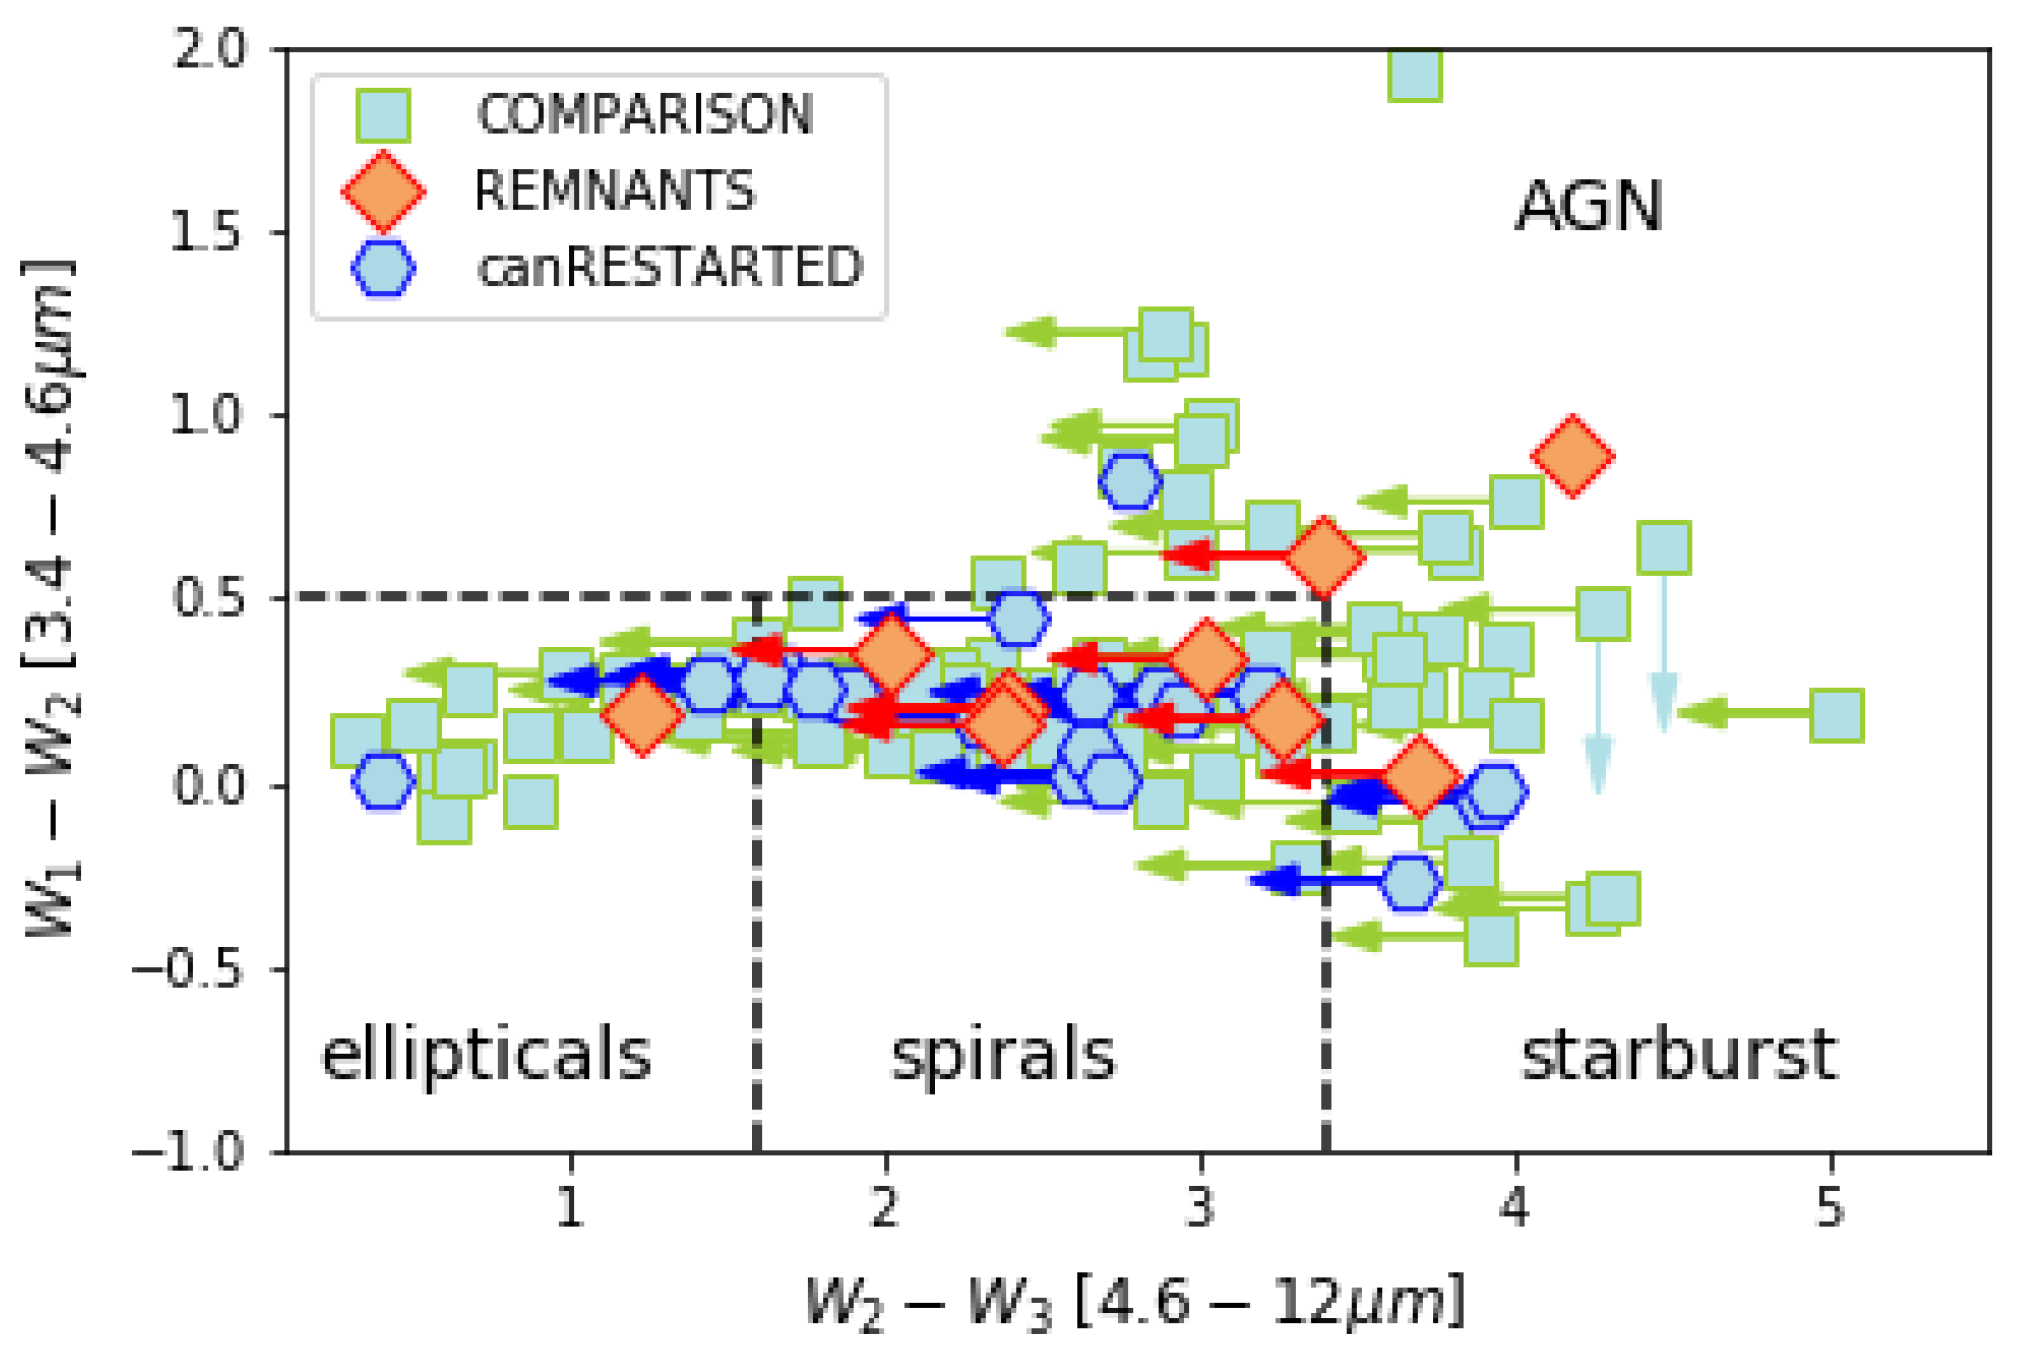
3. Optical and Infrared Data

The optical photometric and spectroscopic data used in this analysis come from the SDSS. The IR data are from the Wide-Field Infrared Survey Explorer source catalogue (AllWISE; [39]). Optical counterparts of the radio sources in our sample are presented in [15,16,19]. In the latter two papers, we also cross-match to IR images. These three studies resulted in 113 out of 158 sources in our sample having SDSS optical photometric information available1, while 122 out of 158 have IR counterparts2. In [19], we analysed the distributions in redshift, size, stellar masses, and IR colours, and found no indication of a correlation between the phase within the duty cycle with the host galaxy properties. Here, we expand the analysis presented in [19] by exploring the optical colours of the host galaxies, as well as the spectroscopic classification and the role of gas using AllWISE colours. Results from these analyses are presented in Section 4 and further discussed in Section 7.
We also use the SDSS spectra to examine the continuum and emission lines for 3 out of 15 remnant radio sources, 9 out of 21 restarted candidates, and 49 out of 122 comparison sample sources. The resolution of the SDSS spectra is 1500 at 3800 Å and 2500 at 9000 Å. We describe the results of the continuum and emission-line analyses in Section 5 and Section 6, and discuss them further in Section 7.

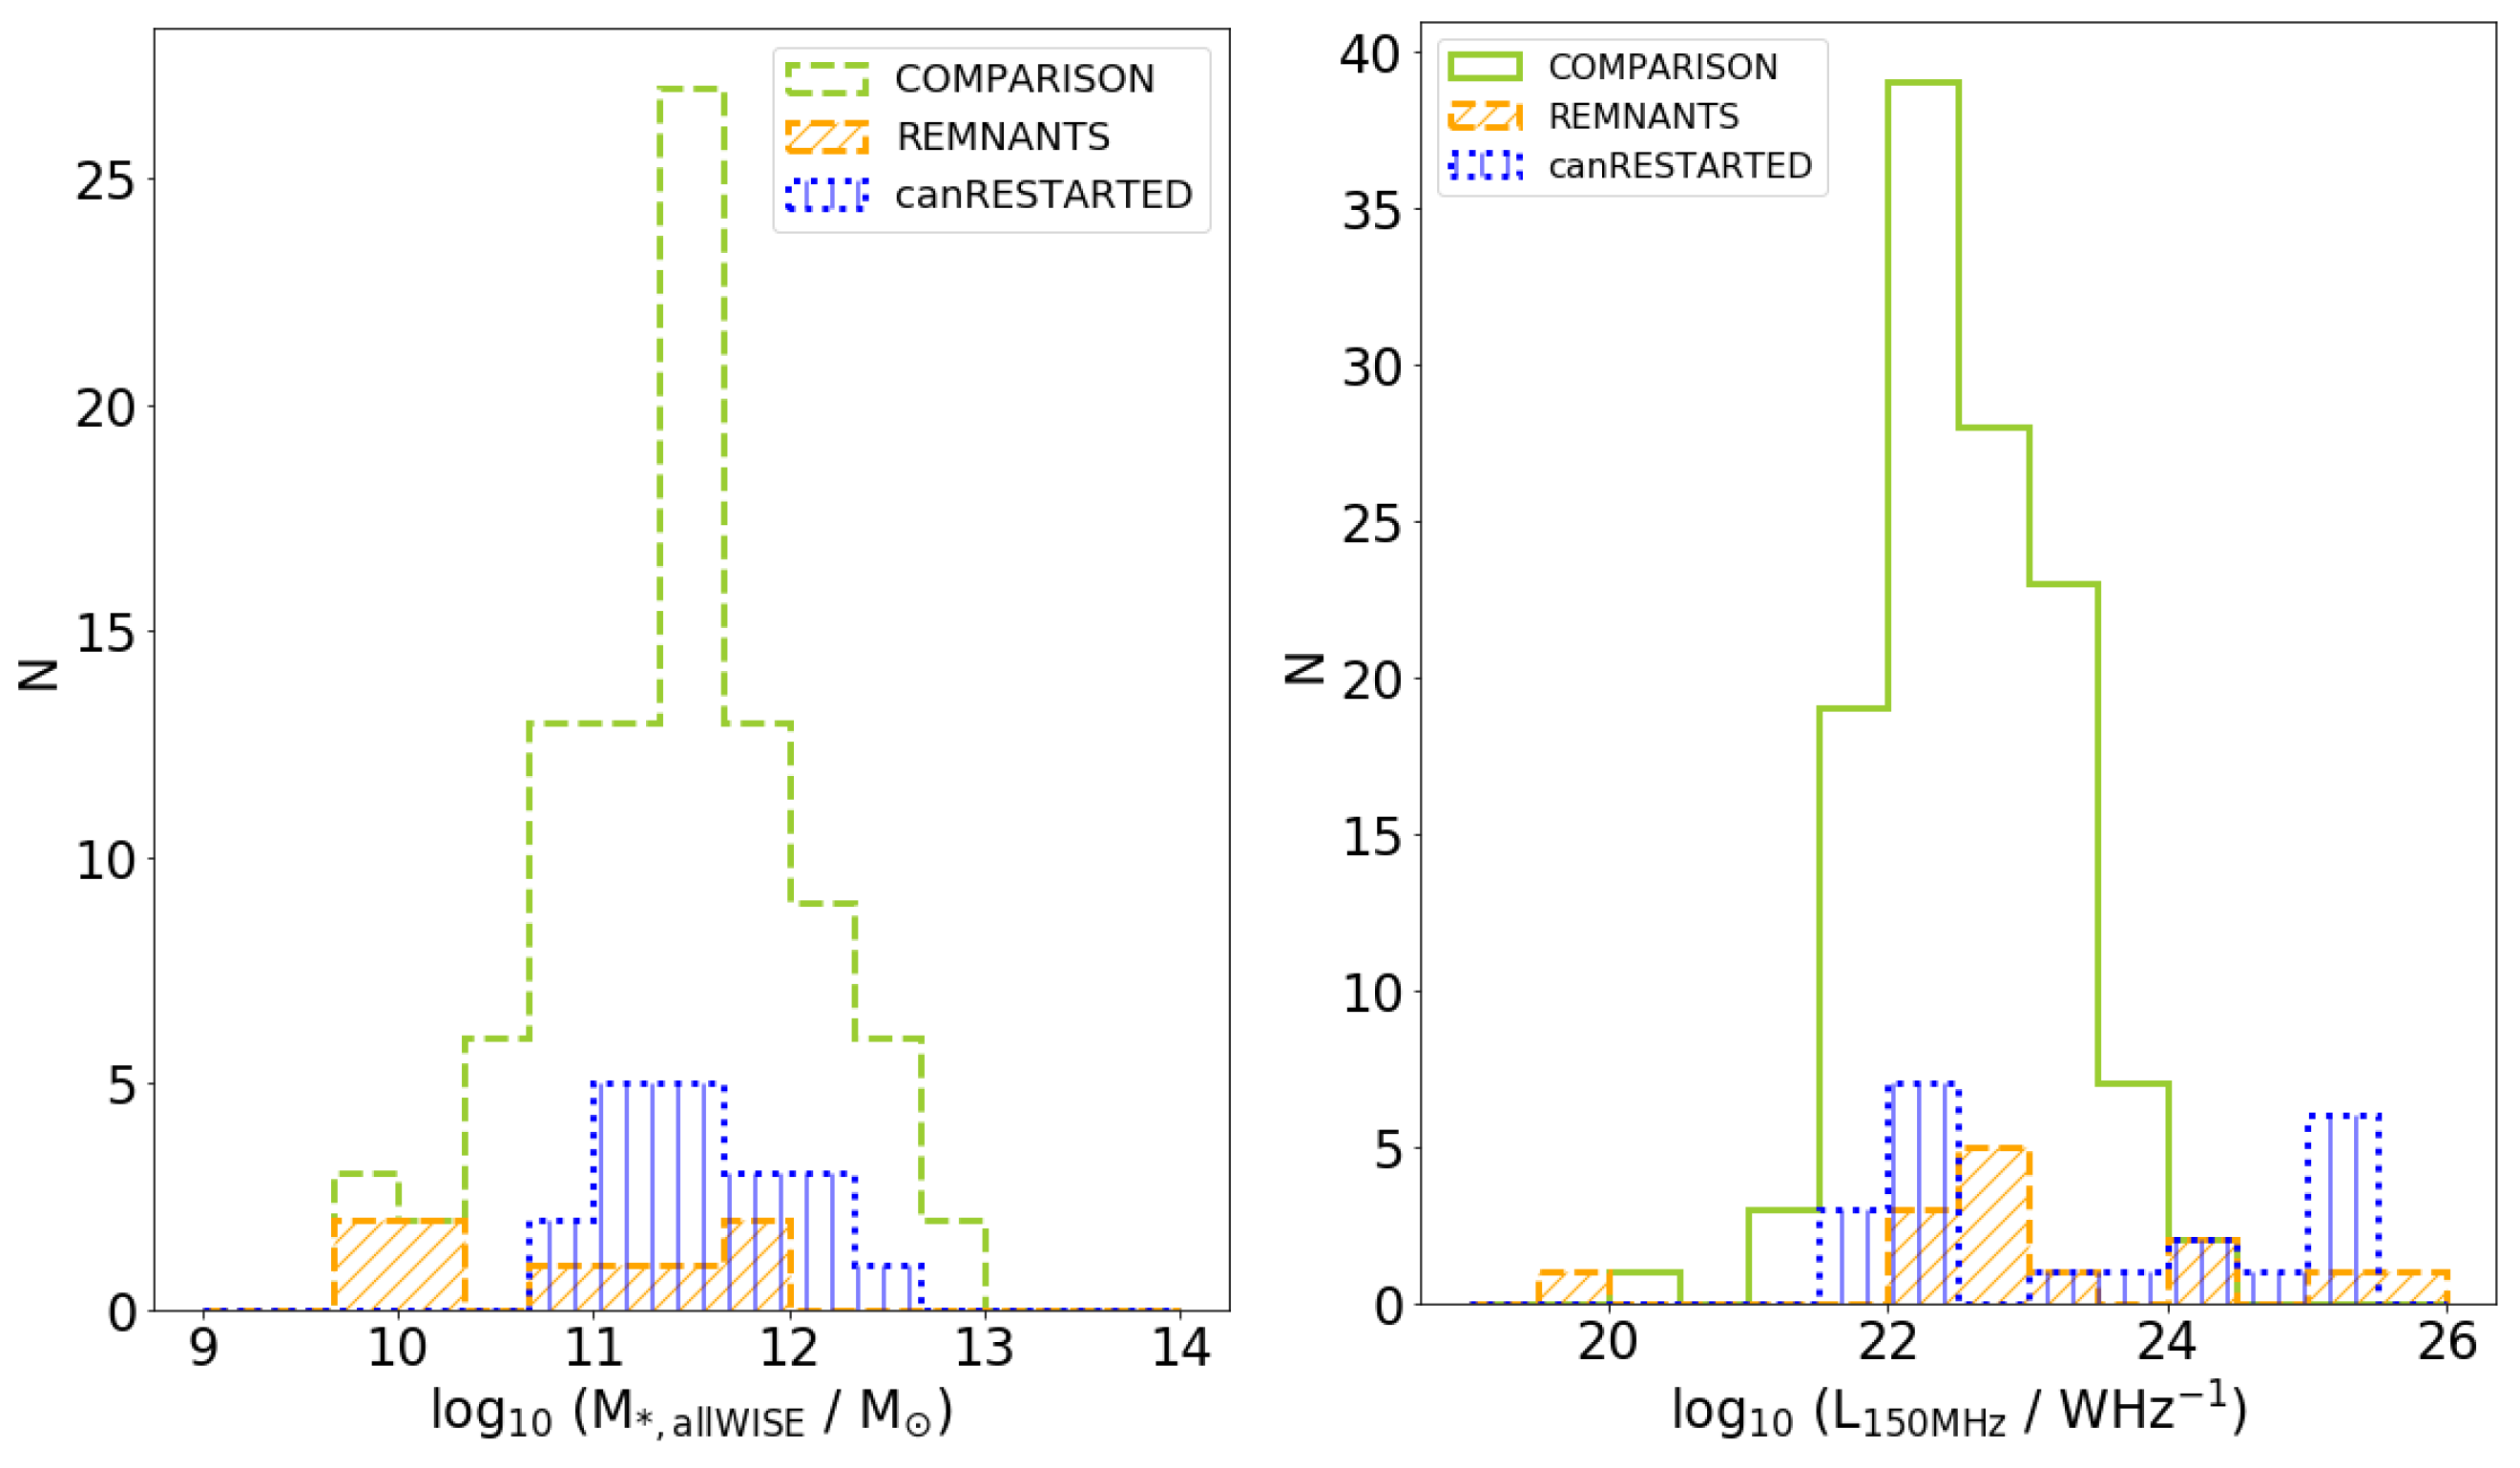
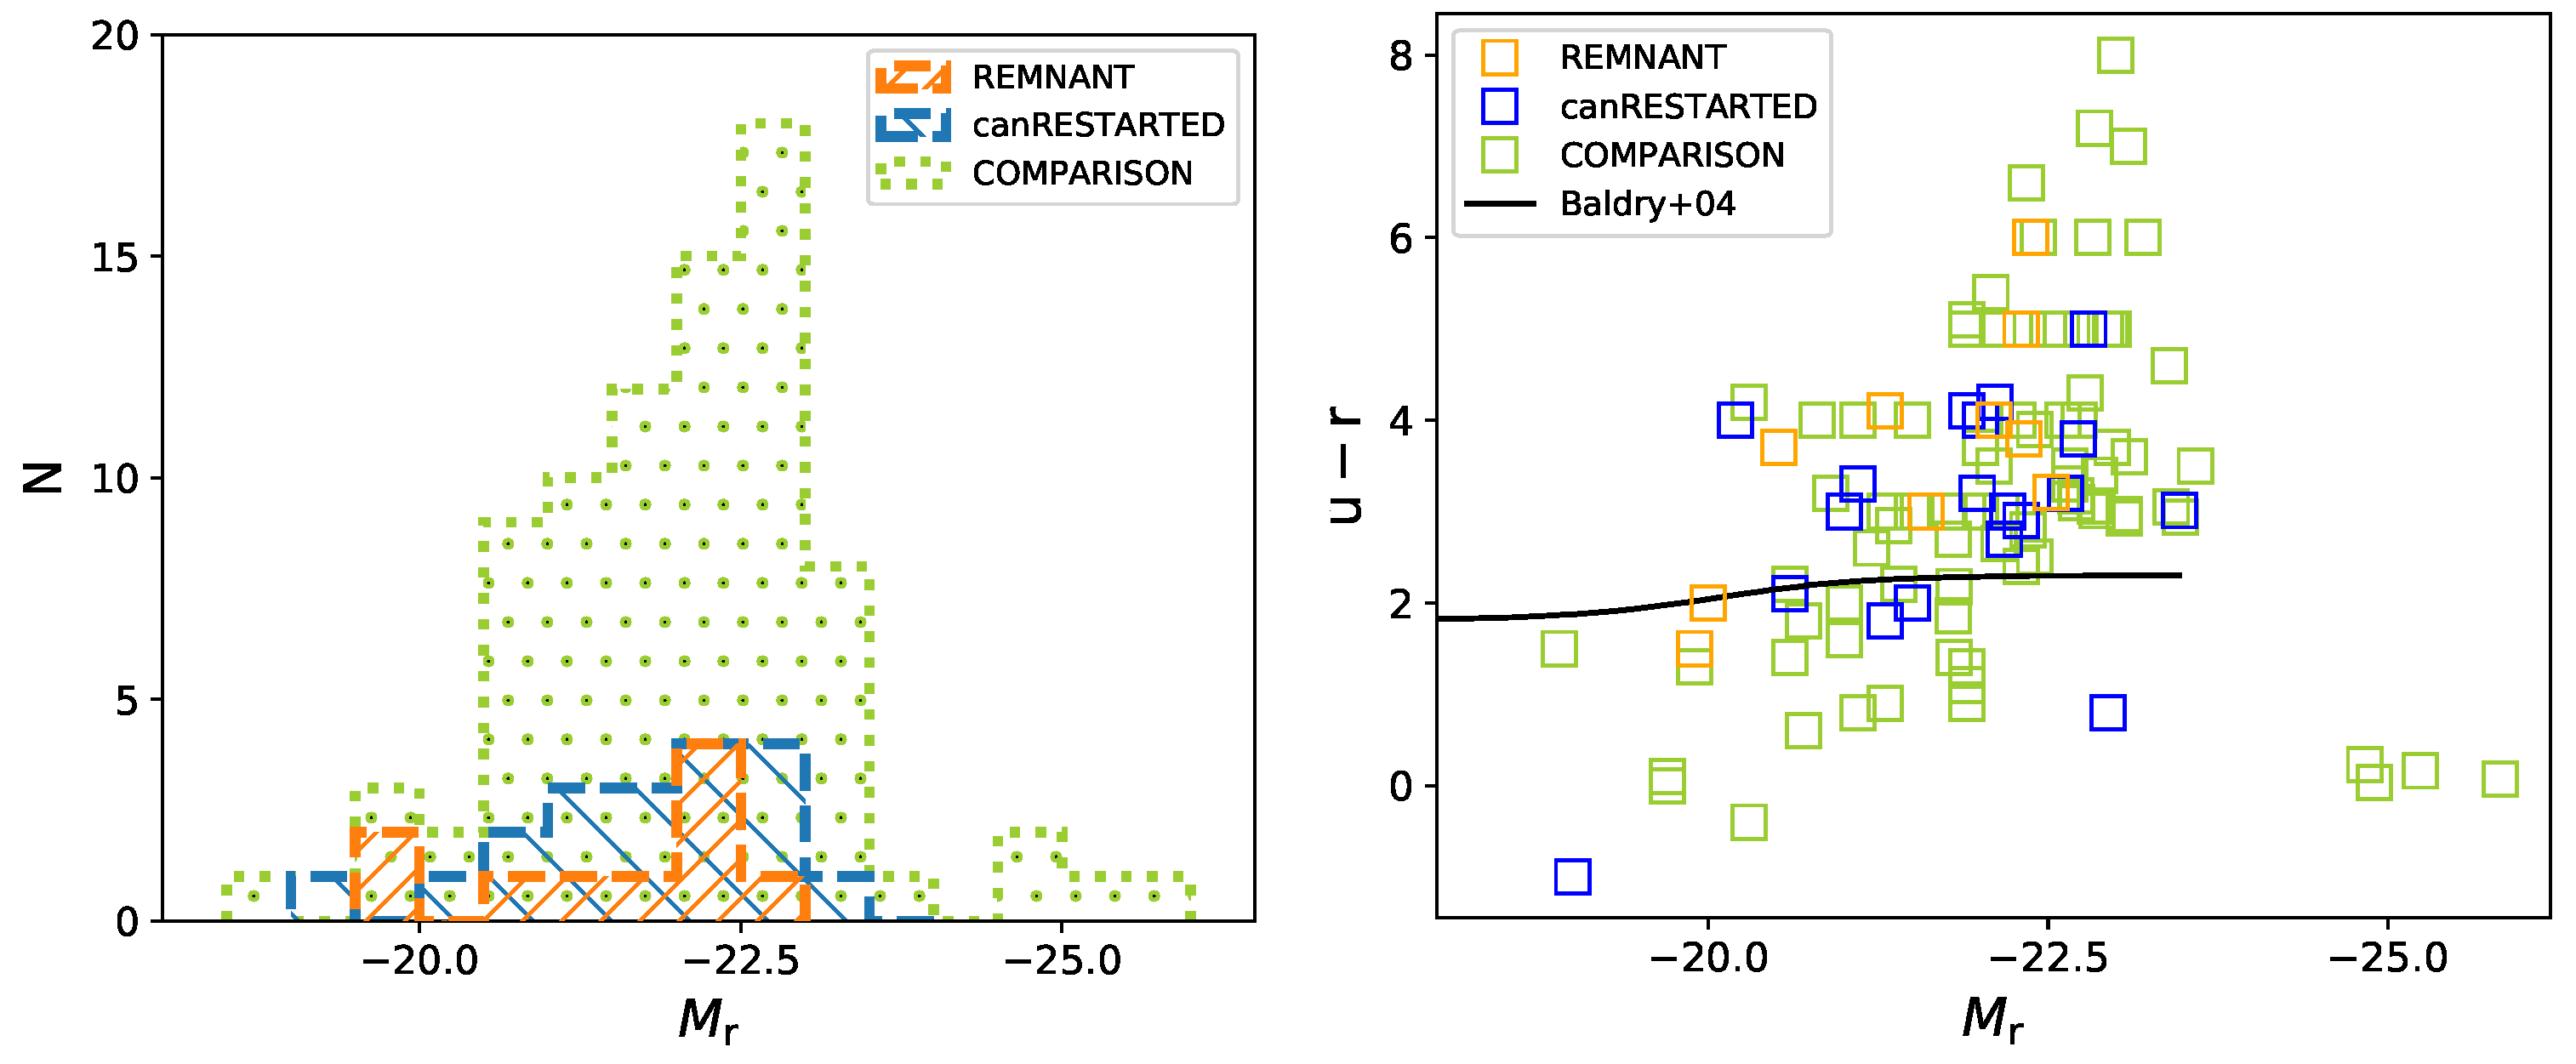
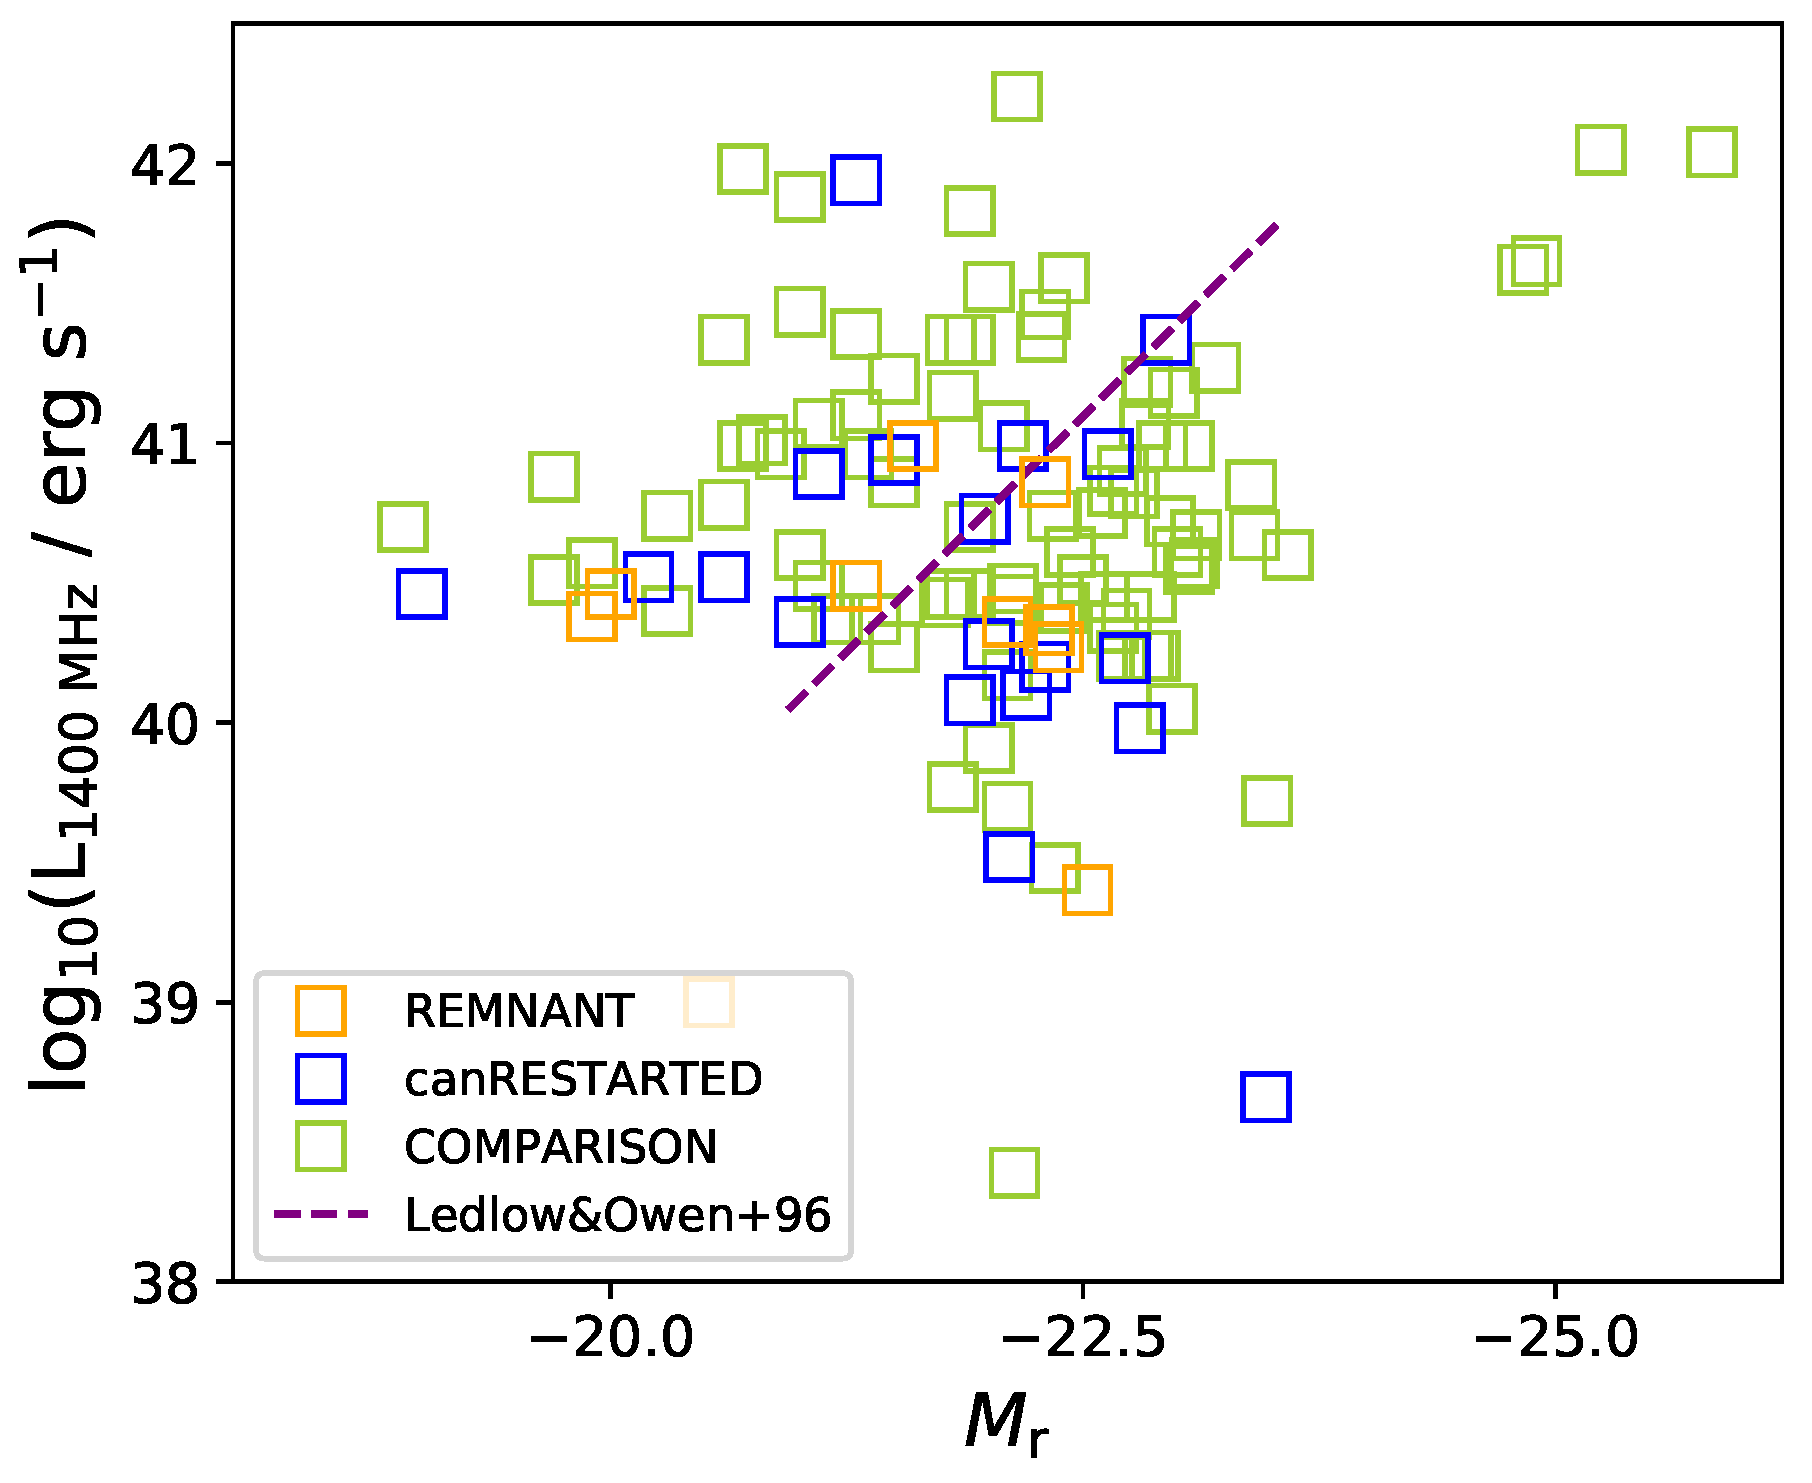
4. Photometric Properties of the Hosts with Respect to Their Radio Properties

The first step in the analysis of our sample is to look at the photometric properties of the host galaxies. In addition to what is already presented in [19], here, we investigate the absolute r band magnitudes and optical colours, as well as the role of gas and dust, and optical and radio-related classification through the interpretation of the WISE colour–colour plot.
In [19], based on the radio and optical properties of our sample, we conclude that there is no statistical difference in the host galaxies of our three samples of candidate remnant radio galaxies, candidate restarted radio galaxies, and the active comparison sample. Here, we reproduce the stellar mass and radio luminosity distributions of the revised samples in Figure 1. The sources in our sample have stellar masses in the range of 10 9 and 10 12 M , consistent with massive elliptical galaxies. The high mass (M > 10 12 M ) tail of the distribution is likely the result of the IR emission being contaminated by AGN-heated dust and therefore stellar masses are overestimated. In the right panel of Figure 1, the majority of the radio sources in our sample (∼88%) have radio luminosities at 150 MHz ranging from log 10 ( L 150 MHz / W Hz 1 ) = 21.5 to log 10 ( L 150 MHz / W Hz 1 ) = 25.0.
To further examine the properties of the host galaxies, here, we look at their optical and IR colours in more detail. The sources in our sample lie in the massive end of the red sequence. From the left panel of Figure 2, all three sub-samples have similar ranges of absolute r band magnitudes (listed in Table A1). Seventeen of 113 sources have u r < 2.0 considering the errors, which would classify them as blue following the approach from [40]. Among these 17 sources with u r < 2.0 are two restarted candidates (J103841+563544 and J105436+590901) and 15 radio sources from the active comparison sample. For seven of the 17 hosts with u r < 2.0, the photometry is flagged as unreliable, and only seven of them have spectra available. Therefore, we will consider 17 sources as an upper limit to the number of blue radio galaxies. We conclude that the majority (>85%) of the hosts in each sub-sample of 113 radio sources with SDSS photometric information are red early-type galaxies (ETGs), based on the photometric u r colour, and separation of the red sequence and blue cloud presented by [40], as indicated by the black solid line in the right panel of Figure 2.
The WISE colour–colour plot can be used to classify the host galaxies in numerous ways. It can be used to analyse their dust content (e.g., [30,41,42,43,44]) or the spectral properties [45], to compare the host galaxy properties of different classes of radio sources [18], to discriminate between star-forming galaxies and radio-loud (jetted) AGN [46], and to diagnose accretion modes in radio-loud AGN [29]. We describe some of the WISE diagnostics in this section and discuss the results further in Section 7.
As seen in Figure 3, sources from the active comparison sample with detections in the three shortest-wavelength WISE bands, W1, W2, and W3, occupy the whole parameter space. The majority of the sources with IR counterparts in the active sub-sample (68%) only have an upper limit in W3 and, therefore, their position in the horizontal direction may be further to the left, as indicated by the green arrows in Figure 3. There are even more remnant radio sources (78%) and restarted candidates (84%) undetected in W3. For the latter two sub-samples, due to the low number of sources detected in each phase, we cannot draw conclusions on their position along the x-axis in Figure 3. In the figure, the leftmost box, delimited by black dashed lines, represents the part of the parameter space where dust-poor galaxies lie. If the position of our galaxies in the WISE colour–colour plot is related to the gas content, as suggested by, for example, [44], the sources in the leftmost box might connect the recurrent activity being triggered by gas. However, further observations would be needed to explore this statement. From other studies of remnant radio galaxies, such as [10,11], where remnant radio galaxies are found in galaxy clusters, these sources are all in the dust-poor region of the WISE colour–colour plot. Unlike the sample of [10,11], the majority of the sources studied here are not found to reside in a dense environment (see [16,19] and Table A1).
Furthermore, the use of a WISE colour–colour diagram to classify sources similar to ours was presented by [45], providing an excellent comparison sample for our objects, since it is radio-selected and spanning similar redshifts as our sources. Prescott et al. [45] separate the radio-loud AGN population into HERGs and LERGs, using the optical spectra provided by the SDSS. After this separation, they plot their sources on the WISE colour–colour diagram and define the space in this plot occupied by LERGs (W1 − W2 < 0.5 and 0.2 < W2 − W3 < 4.5) and HERGs (−0.2 < W1 − W2 < 1.55 and 1.32 < W2 − W3 < 4.26). According to their classification, the majority of our remnant and candidate restarted radio sources, as shown in Figure 3, seem to span over the LERG distribution of sources. However, we do note that one restarted candidate and two remnant radio sources reside in the region occupied by HERGs. The comparison sample spans the whole plot, which would correspond to a mixture of LERGs and HERGs. We comment on this further in Section 7.
In addition to the host galaxy classification, we also want to look at the radio morphology classification, specifically the FRI and FRII dichotomy. According to [47] (see Figure 7 in their paper), the leftmost box in the WISE colour–colour plot is mainly occupied by FRI radio sources, which are predominantly LERGs, while the FRIIs can be both HERGs and LERGs (e.g., [48]). However, the FRI and FRII radio sources studied by [47] show a large degree of overlap in the WISE colour–colour plot and, therefore, no clear distinction between two groups is seen. This is in contrast with [49], who concluded that FRIs and FRIIs populate well-separated regions in a plane defined by the host optical luminosity vs. their radio luminosity. However, their finding was based on flux-limited samples, with different redshift distributions and environments for FRIs and FRIIs. These selection effects have led to some uncertainty as to whether this relation can be used to interpret the full population of radio galaxies. FRI radio sources populate the region below the line defined by [49], shown in Figure 4. According to this figure, sources in our sample are a mix of FRI and FRII radio sources, with no significant difference found between sub-samples. However, it is important to note that the classification of remnant and restarted radio sources is more complicated than for active radio sources, as already discussed in [16,19]. We discuss this in Section 7.
The three sub-samples of active, remnant, and candidate restarted radio sources do not show differences in their absolute r band magnitudes, u r colour, their radio luminosities, and stellar masses. We cannot comment on their differences in WISE colours due to the low number of W3 detections. However, we can conclude that the majority of the sources in each sub-sample are dominated by LERGs, with only a few HERGs. We discuss this further based on the optical spectra in Section 6. Considering the relation from [49], our sources are a mix of both FRI and FRII radio sources.

5. Continuum Properties: 4000 Å Break

Another way to probe the conditions within the host galaxy is by looking at its optical spectrum. Optical spectra can tell us about the stellar populations (continuum) and the state of the gas (emission lines). As described in Section 3, we have collected SDSS spectra for 61 sources. Visual inspection of the spectra revealed that one source, J104021+564842, is an M-type star, and therefore a misidentification. As there is no other possible optical identification for this extended radio source, we exclude it from the further analysis. Therefore, the number of sources with optical identification, in our sample of 158 radio sources, is reduced to 112, and the number of sources with available SDSS spectra is reduced to 60. In this and the following section, we explore the spectroscopic properties of the hosts of radio-selected sources in our sample.
Measuring the strength of the 4000 Å continuum break (D4000; [50]) in galaxies is a way to detect the presence of a blue component that originates from either AGN or a young stellar population. In the latter case, the age of the stellar populations can be derived through the fitting of the optical continuum, with larger breaks in the spectra of galaxies containing evolved stellar populations. For example, the continuum emission of ETGs is characterised by a factor of ∼2 decrease in the flux below 4000 Å, indicating a population of old stars.
For the calculation of D4000, we adopted the approach from [25]. This approach uses a modified version of the bins compared to [50] in order to avoid emission-line contamination. The bins are 100 Å wide and centred on 4200 Å and 3800 Å (D4000 = S ( 4150 4250 Å)/ S ( 3750 3850 Å), where S is the median flux value in a given wavelength range). Errors on the flux are calculated as the standard deviation (std. dev.) of the flux in the same wavelength range and propagated to the value of the D4000.
In Table A2, we show the D4000 values for the sources in our samples of remnant, candidate restarted, and active radio sources. Of the 60 radio galaxies for which we have optical spectra, it is not possible to measure D4000 for two of the host galaxies at the highest redshift of the sources in our sample (J103953+583213 at z = 1.9328 ± 0.0005 and J104418+562007 at z = 1.6828 ± 0.0002). Of the remaining 58 sources, only three have D4000 significantly less, considering the errors, than 2.0 (J104418+603701, J105451+553736, and J105931+565529; see Table A2, and their SDSS spectra in Figure A1). The weak D4000 in these three sources indicates the presence of an additional blue component. In the case of J104418+603701 and J105451+553736, this component is dominated by the AGN in the host galaxies. SDSS classifies these two sources as broad-line quasi-stellar objects (QSOs). For the source J105931+565529, we attribute the blue excess to the contribution from a young/intermediate stellar population component. The exact age of this population will require detailed modelling of the spectrum. We comment on the three sources with weak D4000 in Section 7. Unfortunately, for some of the sources (∼18%), the error in the D4000 value is too high due to low signal-to-noise ratio spectra to draw firm conclusions from this diagnostic.

6. Emission Line Properties
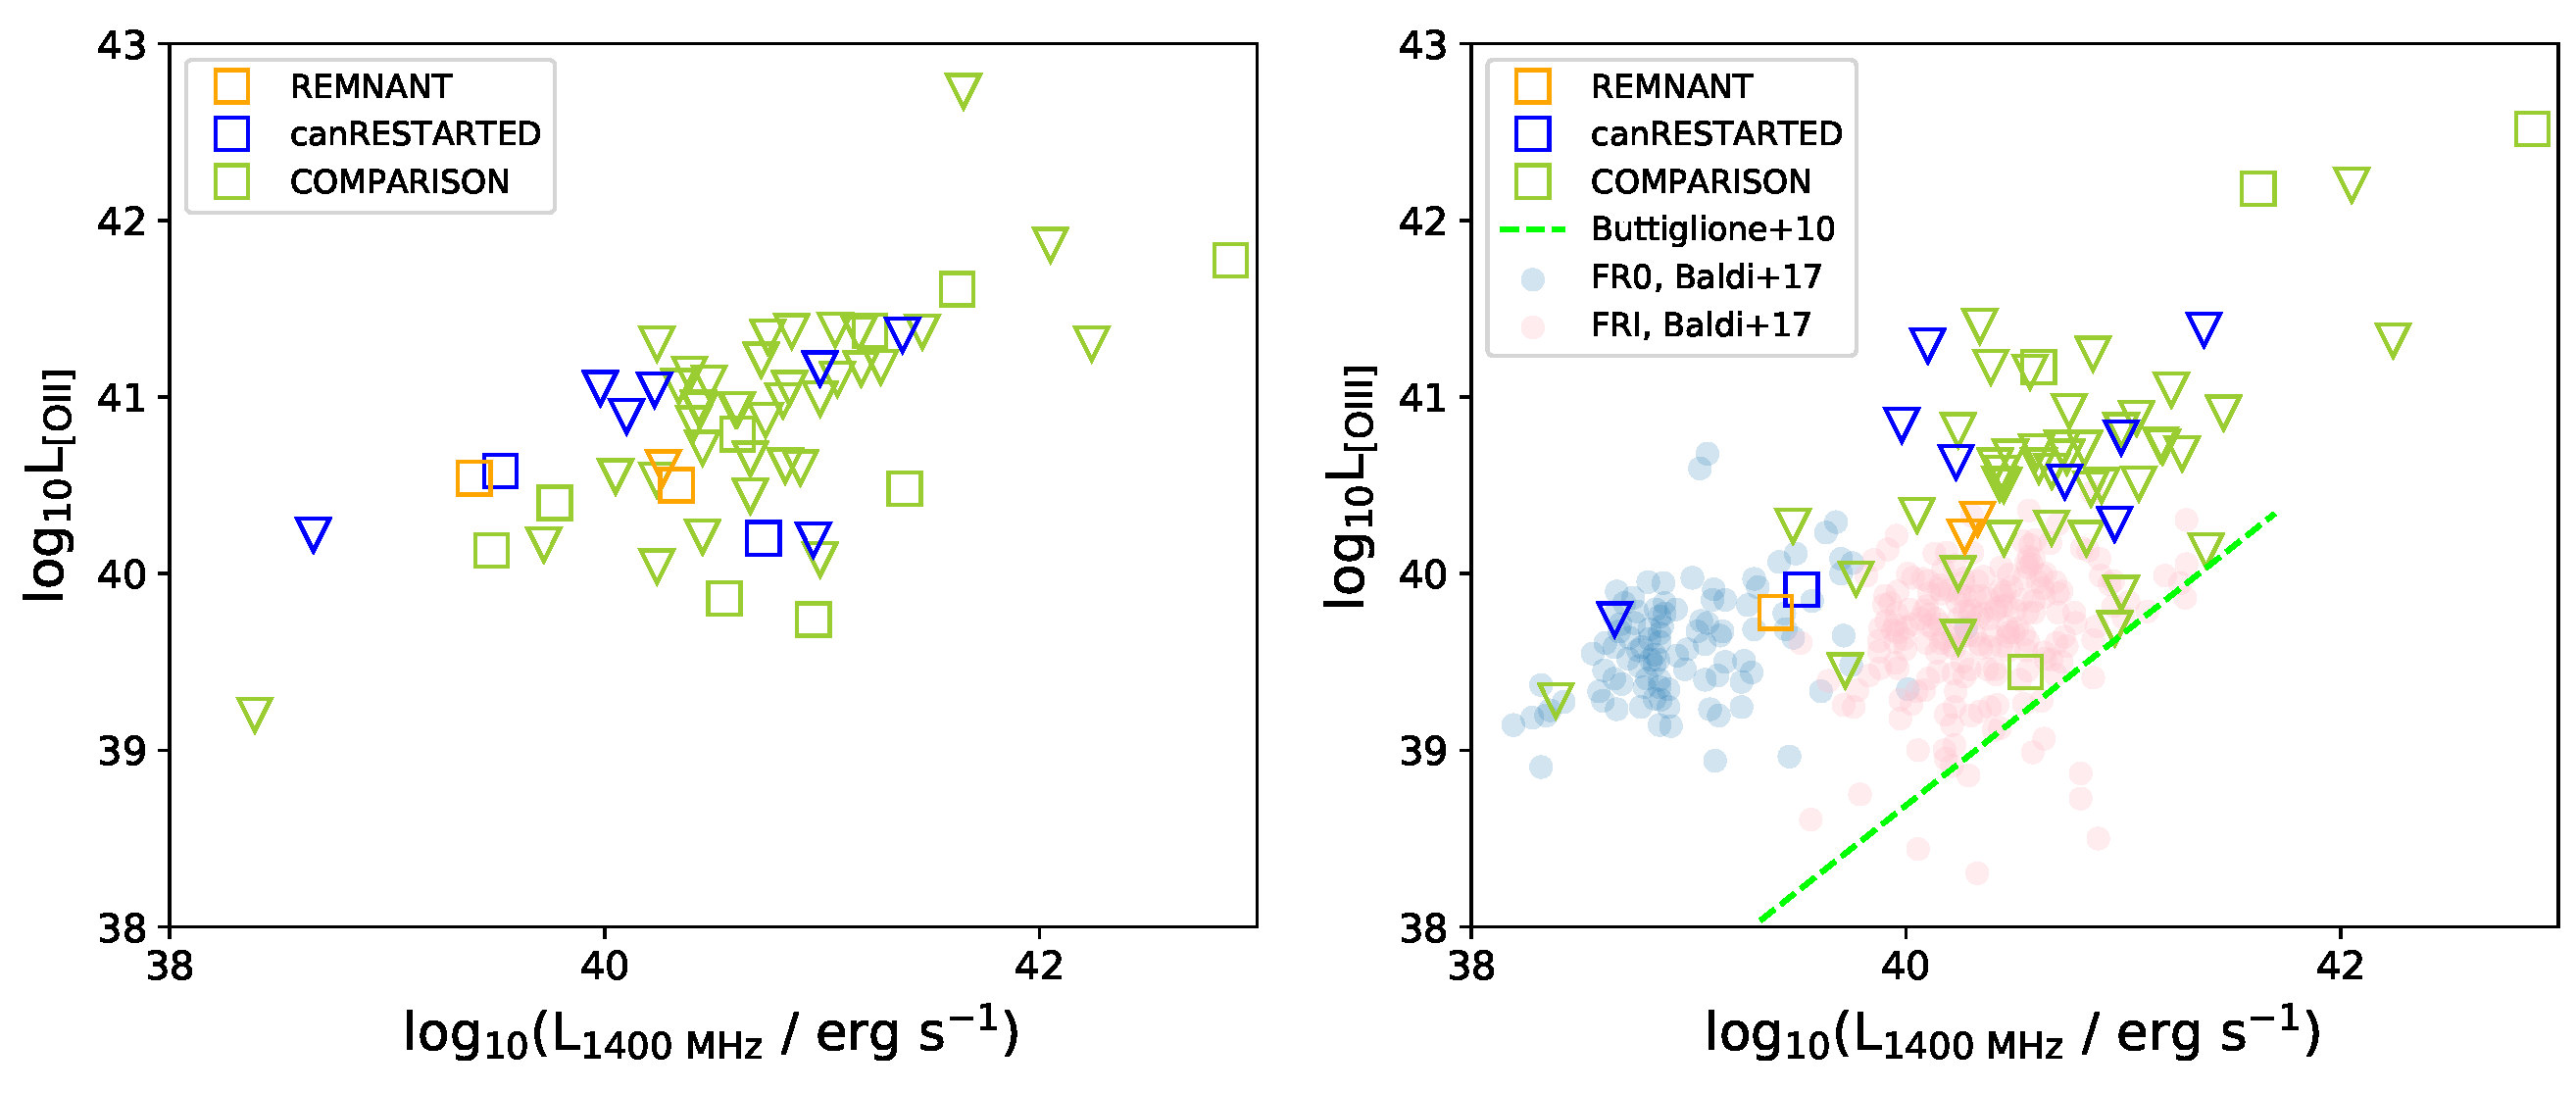
As mentioned above, we have SDSS spectra for 60 sources, of which three are remnant and nine are candidate restarted radio galaxies. In a minority of the available spectra (<28%), we detect emission lines. Broad emission lines appear in the optical spectra of five galaxies, which are classified as broadline QSOs by SDSS. Among them is one restarted candidate (J105436+590901) showing a prominent and broad magnesium emission line ( σ = 2063 km s 1 , based on the SDSS measurement). The remaining four sources with broad emission lines belong to the active comparison sample (J103953+583213, J104418+562007, J104418+603701, and J105451+553736). As in the case of D4000, for two of the objects (J103953+583213 and J104418+562007), the relatively high redshift means that the [O iii] lines fall outside the observed band. Source J103953+583213 is at a redshift too high to be able to measure also the [O ii] line, while source J104418+562007 shows a weak [O ii] emission line. However, both of these high-redshift sources show broad emission lines (e.g., Mg or C iv). The remaining two sources with broad emission lines, J104418+603701 and J105451+553736, are at a redshift of ∼1, and have broad detections of Mg emission-line ( σ = 2856 km s 1 and σ = 2450 km s 1 , respectively, based on the SDSS measurement).
Apart from these five galaxies with broad emission lines, the rest of the galaxies in our sample show weak emission lines (see Figure A2 for some examples). The emission lines detected are typically [O ii] doublet (∼21%) and [O iii] (∼10%), followed by a detection of Mg (∼8%) and H α (up to ∼8%). Only up to 7% of sources with SDSS spectra show detection of the H β emission line. However, the above-mentioned detections do not always appear in the spectrum of the same source. More importantly, none of the sources in our sample have all the detections needed to construct the Baldwin–Phillips–Terlevich (BPT; [51]) diagnostic diagrams (see Figure A2).
As a consequence, we limit our analysis to deriving the luminosities of the most common emission lines detected in our sample, [O ii] and [O iii], and a comparison with the correlations of these lines with the radio luminosities, found in the literature. The [O ii] 3726–3729Å emission line doublet is often used to estimate SFRs within the host galaxies of AGN, as it is known to be strongly excited by star formation, but is only weakly excited in the broad and narrow line regions of AGN. The luminosity of the [O iii] 5008Å emission line is a tracer of the strength of activity in the nucleus.
We measure the flux densities of the emission lines using a Monte Carlo Markov Chain (MCMC) approach and the emcee python module [52], where we fit the [O ii] doublet with two Gaussians, centred at 3727.09 and 3729.88 Å, and the [O iii] 5008 Å line with one Gaussian. If the line is not detected, we construct a Gaussian with a height of 3 σ . The value of σ is calculated as the std. dev. of the flux variations in the interval of ∼1000 km s 1 , where there is no emission or absorption present, close to the line of interest. The widths of the fitted Gaussians ( σ GW ), flux densities, and respective luminosities of [O ii] and [O iii] lines are presented in Table A2. If the line was not detected, we set the width of each Gaussian to be σ GW = 200 km s 1 . This allowed us to determine flux density upper limit values. We describe the role of the studied lines and our findings in the following subsections.

6.1. [O ii] Line

The [O ii] doublet is a prominent feature in the spectra of galaxies in the blue part of the spectrum, and it is one of the main lines used for tracing the internal kinematics of the ionised gas. However, [O ii] is weakly excited in the AGN broad and narrow-line regions, strongly excited by star formation, but can also be produced by shocks and AGN extended emission line regions. Shocks are common in radio host galaxies, originating from the jets interacting with the gas [53].
We see [O ii] lines in 13 objects, among which two are classified as remnants (J105402+550554 and J110806+583144), two as restarted candidates (J103815+601111 and J104204+573449), and the remaining nine belong to the active comparison sample (J102731+585524, J103258+564453, J103856+575247, J104208+592018, J104320+585621, J105325+561402, J105451+553736, J105703+584720, and J105931+565529). Their SDSS spectra can be seen in Figure A2. Flux density values (or upper limits), calculated as described above, and luminosities of the [O ii] lines of the remnant, candidate restarted, and active comparison sample are given in Table A2. The comparison of line emission and radio luminosity is presented in Figure 5 (left panel) and discussed in Section 7.

6.2. [O iii] Line

The [O iii] emission-line luminosity is a robust proxy of the radiative power of the AGN and of the accretion rate [55]. We detect [O iii] emission lines in six objects—one remnant radio source (J110806+583144), one restarted candidate (J103815+601111), and four galaxies from the active comparison sub-sample (J102731+585524, J103258+564453, J105451+553736, and J105703+584720). Their SDSS spectra are shown in Figure A2.
Flux density values and luminosities of the [O iii] line of the sources in the remnant, candidate restarted, and active comparison sub-samples are given in Table A2. The comparison of line emission and radio luminosity is shown in Figure 5 (right panel) and discussed in Section 7.

7. Discussion

In this work, we focus on the jet-mode AGN, associated with the presence of radio jets of relativistic plasma that deposit kinetic energy into the surrounding medium (e.g., [56]). Jet-mode AGN are known to go through phases of activity and quiescence, and our aim is to understand whether these different phases observed at radio wavelengths can also be traced to optical wavelengths. In the following subsections, we discuss our findings related to the analysis of the optical colours and the optical spectra of our remnant, candidate restarted, and comparison active radio sources. In the last subsection, we aim at connecting all the properties studied here.

7.1. D4000 and Colour Separation

From the D4000 parameter presented in Section 5, we found that three comparison active sources out of the 60 galaxies in our sample with available SDSS spectra have a value indicating a possible additional blue component (D4000 < 2.0, considering the errors propagated from the flux measurements). For two of them, the low D4000 value is due to the AGN activity, as mentioned in Section 5. The remaining object with D4000 < 2.0 is a star-forming galaxy, where a low D4000 value indicates a young stellar population.
Furthermore, based on the optical colours, 17 of the 112 sources in our sample with photometric information3 have u r < 2.0. Among them, two are restarted candidates, and the rest belong to the active sample (see Section 5). However, optical ( u g r i z ) colours can differ significantly depending on the redshift of the host galaxy, making this means of classification less reliable, unless spectroscopic observations are available (only for seven of the 17 sources with u r < 2.0).
Thus, based on both the D4000 value and the photometric properties of the host galaxies presented in Section 4 and Section 5, the majority of the sources in our sample appear to be massive and passive ETGs dominated by an old stellar population. We find that there is no significant difference detected between remnant, candidate restarted, and active radio sources in either D4000 values or optical colours.

7.2. Emission Lines

The comparison of line emission and radio luminosity presented in Figure 5 indicates that remnant (orange), candidate restarted (blue), and active comparison (green) samples cover similar ranges in the luminosity of the optical emission lines [O ii] and [O iii] (L[O ii], L[O iii]), and radio luminosities. Overall, remnant, candidate restarted, and active comparison samples do not show any difference in [O ii] or [O iii] line luminosities and, therefore, in their host galaxies. They are all massive ETGs with little ionised gas (typically LERG spectra) and little UV radiation (except for a handful of SDSS-classified QSOs seen mostly in the active comparison sample).
Because only a fraction of sources have optical spectra, we have also used the WISE colour–colour plot to obtain an indication about the LERG/HERG classification of the remaining sources, following the work of [45] discussed in Section 4. First, we discuss the sources with available optical spectra. Out of the 13 galaxies with [O ii] and/or [O iii] emission lines detected, seven (J102731+585524, J103258+564453, J103856+575247, J105325+561402, J105451+553736, J105703+584720, and J105931+565529) have IR detection in all three WISE bands, while five have detections in W1 and W2, and the remaining one is not detected in IR (J105402+550554). The seven galaxies with IR detection in all three WISE bands are a part of the active comparison sub-sample and have W1 − W2 in the range from −0.05 to 1.17 and W2 − W3 in the range from 0.88 to 3.97. According to their IR colours, two can be classified as LERGs (J103258+564453 and J103856+575247) and one as HERG (J105451+553736), while the remaining four reside in the region where LERGs and HERGs overlap. One of these seven galaxies is classified as star-forming (J105931+565529) and one is a broad-line QSO (J105451+553736).
For the remaining six sources with [O ii] and/or [O iii] detected emission lines, we cannot comment on the position in the WISE colour–colour diagram. According to [45]’s classification of the sources in the WISE colour–colour plot, the majority of our sources, regardless of the availability of their spectra or the radio life cycle phase they are in, seem to span over the LERG distribution of sources, with only a handful of HERGs.
Thus, based on the WISE colours, we can expect that also the sources for which an optical spectrum is not available will be mostly dominated by weak emission-line objects.
Another interesting property of 13 galaxies with [O ii] and/or [O iii] emission lines detected is that the majority (>70%) have D4000 > 2.0 and u r > 2.8, all indicative of the red host galaxy. Although it was not possible to build a BPT diagram with the data available for our sources, the fact that these sources are both red, and exhibit emission lines, points to a greater probability of the detected lines originating from an AGN rather than star formation.

7.3. Morphology of the Radio Sources

Although [47] show that the luminosity division between the FRI and FRII radio sources might not be as strict as previously thought, with a large degree of overlap between the two classes (also shown by [57]), this radio classification, namely FRI and FRII dichotomy, is historically linked to the properties of optical host galaxies. FRIs are predominantly LERGs, while FRIIs are a mix of HERGs and LERGs. Based on the analysis of the spectra, IR colours, and visual inspection of the radio morphology, the sources in our sample show both FRI and FRII characteristics. Classification of remnant radio sources is challenging as it is biased by the selection criteria, where we expect the core to be non-detected or exhibiting dimmed radio activity. In our previous work, we concluded that the progenitors of remnants are powerful FRI radio sources [16]. Restarted candidates are as well mostly classified as FRI radio sources (14 out of 21), which might be biased by the selection criteria, which aimed to select sources with a bright inner region. The higher occurrence of FRIs in both remnant and restarted samples might indicate that the sources with shorter jet activation cycles tend to be FRIs.
As mentioned in Section 1, LERGs dominate at low luminosities, while HERGs take over at log 10 ( L 1400 MHz / W Hz 1 ) ∼26. The sources in our sample with known redshift span in the luminosity range from 22.25 to 26.74 at 1400 MHz, with only a minority of the galaxies (∼23%) having radio luminosity above 25, including five broad-line QSOs. From this, we would expect, as indeed is the case, that the majority of our sources would be classified as LERGs. Our available SDSS optical spectra and the WISE separation according to [45] support the classification of the majority of our sources as LERGs.

7.4. Optical Properties and Life Cycle of Radio Sources

The main result from our analysis is that we do not see any significant differences in the optical properties of the host galaxies of the three sub-samples studied in this work. From the analysis of their optical, IR, and radio properties, the majority of our sources appear to belong to the group of radiatively inefficient AGN with low accretion rates. The exceptions include five objects classified as QSOs based on their photometric and spectroscopic properties, and one star-forming galaxy. Radiatively inefficient AGN are thought to accrete gas from the surrounding hot intracluster medium or from the hot gaseous atmosphere associated with the host galaxy (e.g., [58]). The geometrically thin accretion disk is either absent, or is truncated in the inner regions, and is replaced by a geometrically thick structure in which the inflow time is much shorter than the radiative cooling time. These are called advection-dominated or radiatively inefficient accretion flows (ADAFs/RIAFs; [59]). A characteristic property of these flows is that they are capable of launching two-sided jets. As found for the majority of our targets, jet-mode AGN generally reside in massive ETGs, characterised by old stellar populations with little star formation. If they do show narrow, low-ionisation emission lines, they are weak. They have moderate radio luminosities and can exhibit preferentially FRI, but also FRII radio morphologies.
We have compared the luminosities (or limits) of the emission lines in our objects with samples available in the literature. In the right panel of Figure 5, we see that the three sub-samples share the same range of L[O iii] and radio luminosity of FRIs presented by [26], and FRIs of the 3C sample indicated with a green dashed line, from [54]. Furthermore, some of our objects are reaching lower radio luminosities, where the correlation between the emission line and radio luminosity flattens out, as is indeed the case for the less powerful sources in our sample [23]. Therefore, we assume a similarity between FRIs and our samples of remnant, candidate restarted, and active radio sources in terms of AGN bolometric power and accretion rate.
Our results suggest that while the radio properties of our objects show a cycle of activity, with the remnants not even being radio-active or having reduced nuclear activity, the optical properties do not appear to follow this cycle—at least not on the same time scales.
Given the similarities with other samples studied (see Figure 5), the optical lines in our objects are likely originated by radiatively inefficient, advection-dominated accretion, typical of galaxies relatively poor in gas. The similarities in the three sub-samples of radio sources (remnant, candidate restarted, and active comparison) indicate that they depend mostly on the properties of the host galaxies. Furthermore, the properties of the host galaxies are indeed also found to be similar for the three sub-samples. This may indicate that there is no large variation in the accretion rate on the time scales of the radio source life cycle. Thus, this may suggest that, instead, the cycle of radio emission depends on other, intrinsic reasons, such as radiation pressure instability within an accretion disk, as proposed by [60], instead of variation in the fuelling of the SMBH. External reasons such as galaxy interactions and mergers can also be considered as a trigger of the radio activity. This is the case for the powerful radio galaxies presented by [61]. This scenario would perhaps indicate that there is no major difference in the origin, ‘triggering’, and time scale of the activity in all three sub-samples of radio sources. However, most of our sources do not show disturbed optical or radio morphologies, or strong emission lines that might indicate a recent merger. They also mostly reside outside of known galaxy clusters, in which mergers are more likely to take place. Interestingly, the only radio galaxy with weak D4000 due to a young stellar population component does reside in Abell 1132. Although its morphology does not seem disturbed, a merger cannot be ruled out as a possible origin of the increased optical activity.
Best et al. [36] discuss the independence of radio and optical AGN activity based on the SDSS data. They conclude that for galaxies with stellar masses between 10 11 and 10 11.5 M , the emission-line luminosity is independent of radio luminosity. In this work, we confirm that there does not seem to be a connection between the phase in the evolution in which the radio source is and the optical properties in a wider range of stellar masses presented by [36].

8. Summary and Conclusions

The optical properties of statistical samples of remnant and restarted radio sources is not a well-studied topic in the literature. However, it is an important one. In this work, we studied a sample of 158 radio galaxies in the LH region, divided into sub-samples of remnant, candidate restarted, and active comparison radio sources. Using SDSS and WISE data, our aim was, for the first time, to compare the optical properties of sources in a different stage of their radio life with the goal of better understanding the most elusive phases, remnant and restarted, and possibly the triggering mechanisms behind the recurrent radio activity.
The majority of our radio galaxies have red optical colours (>77%, see Section 4) and show strong D4000 (see Section 5). We see few to no emission lines, as there are essentially no young stars and no gas (see Section 6).
Within the range of radio luminosities and stellar masses studied in this work, radio and emission-line AGN activity are independent of each other, supporting the conclusion presented by [36]. Therefore, the cycle of radio emission likely depends on other, intrinsic reasons, such as radiation pressure instability within an accretion disk, as proposed by [60] (see Section 7).
The conclusions from this paper are based on a small sample of radio sources in the remnant and restarted phase of the life cycle of radio galaxies, and therefore need confirmation based on larger statistical samples of radio sources in each phase of their radio life cycle with deeper optical spectra. Newly available radio surveys allow for a selection of larger samples that will test these conclusions and allow for a further step in the connection between the optical and radio properties, the time scales involved, and possibly feedback itself. Furthermore, the availability of the complementary optical spectra is crucial to further our understanding of these topics and present more detailed analysis, including the estimation of the stellar ages and measurements of weak emission lines or tighter upper limits. The planned spectroscopic survey WEAVE-LOFAR [62] is an example of a promising project that will allow us to substantially increase the samples in the near future.

Author Contributions

Conceptualisation and formal analysis, N.J., R.M. and N.M.; writing—original draft preparation, N.J.; writing—review and editing, N.J., R.M., N.M. and M.B. All authors have read and agreed to the published version of the manuscript.

Funding

This research received no external funding.

Institutional Review Board Statement

Not applicable.

Informed Consent Statement

Not applicable.

Data Availability Statement

LOFAR 150 MHz image of the LH has been released in combination with the paper of [37]. SDSS data are available at http://skyserver.sdss.org, (accessed on 20 August 2021).

Acknowledgments

The authors would like to thank the anonymous reviewers for their constructive comments, which helped to improve the quality of this paper. N.J. would like to thank Simon Gazagnes for the constructive discussions throughout the analysis of the SDSS data. ASTRON, the Netherlands Institute for Radio Astronomy, is an institute of the Dutch Science Organisation (De Nederlandse Organisatie voor Wetenschappelijk Onderzoek, NWO). LOFAR, the Low Frequency Array designed and constructed by ASTRON, has facilities in several countries, which are owned by various parties (each with their own funding sources), and which are collectively operated by the International LOFAR Telescope (ILT) foundation under a joint scientific policy.

Conflicts of Interest

The authors declare no conflict of interest.

Abbreviations

The following abbreviations are used in this manuscript:
AGNactive galactic nucleus
ApertifAPERture Tile In Focus
BHblack hole
BPTBaldwin–Phillips–Terlevich
D40004000 Å continuum break
ETGearly-type galaxy
HERGhigh-excitation radio galaxy
IRinfrared
LERGlow-excitation radio galaxy
LHLockman Hole
LOFARLOw Frequency ARray
MCMCMonte Carlo Markov Chain
NLRnarrow-line region
NVSSthe National Radio Astronomy Observatory Very Large Array Sky Survey
QSOquasi-stellar object
SDSSSloan Digital Sky Survey
SFRstar formation rate
SMBHsuper massive black hole
std. devstandard deviation
UVultraviolet
VLAVery Large Array
WISEWide-Field Infrared Survey Explorer
WSRTWesterbork Synthesis Radio Telescope

Appendix A. Tables

Here, we present the table summarising the host galaxy properties for all of the sources in our sample (Table A1) and the table presenting the emission lines and D4000 break values for the 61 sources in our sample with optical spectra available (Table A2).
Table A1. Host galaxy properties of remnant and candidate restarted radio sources. Col. 1 lists names of the remnant and candidate restarted radio sources, where boldface indicates sources for which we have SDSS spectra available; Col. 2 lists the redshift of each source, where ‘p’ indicates SDSS photometric and ‘s’ SDSS spectroscopic redshift; Col. 3. is absolute magnitude in the r band; Col. 4 lists u r colour for each source with available SDSS photometry; Col. 5 discriminates whether a source is a part of a cluster (1) or not (0).
Source NameRedshift M r u r Cluster Flag
15 REMNANTS
J102842+5751220.4 ± 0.1  p −19.9 ± 0.71.5 ± 0.70
J102905+5857210.53 ± 0.03  p −21.3 ± 0.24.1 ± 0.90
J103132+591549---0
J104516+563148---0
J104618+581421 R M + 21 ---0
J104646+564744---0
J104732+5550070.57 ± 0.04  p −21.6 ± 0.23 ± 10
J105230+5636020.25 ± 0.03  p −22.3 ± 0.35 ± 10
J105402+5505540.38248 ± 0.00006  s −23.0600 ± 0.00052.97 ± 0.011
J105554+563532---0
J105723+565938 R M + 21 ---0
J105729+5911280.47 ± 0.02  p −22.1 ± 0.14 ± 20
J110108+5603300.4 ± 0.1  p −20.0 ± 0.72 ± 10
J110255+5857400.3390 ± 0.0001  s −22.37 ± 0.026 ± 21
J110806+5831440.15431 ± 0.00003  s −22.5233 ± 0.00053.21 ± 0.071
21 RESTARTED CANDIDATES
J103416+5905230.47 ± 0.06  p −20.6 ± 0.32.1 ± 0.71
J102955+5846210.39 ± 0.05  p −20.2 ± 0.34 ± 10
J103508+5839400.4708 ± 0.0001  s −22.20 ± 0.033.0 ± 0.50
J103621+5643230.55 ± 0.05  p −21.3 ± 0.31.8 ± 0.60
J103815+6011110.19676 ± 0.00005  s −22.11 ± 0.014.2 ± 0.40
J103841+5635440.57 ± 0.07  p −19 ± 11 ± 10
J103845+5944140.38 ± 0.03  p −22.0 ± 0.24 ± 10
J104113+5807550.30894 ± 0.00006  s −22.72 ± 0.013.8 ± 0.30
J104204+5734490.4807 ± 0.0001  s −21.98 ± 0.043.2 ± 0.80
J104252+5535360.5224 ± 0.0003  s −22.18 ± 0.052.7 ± 0.80
J104424+6029170.22 ± 0.02  p −21.9 ± 0.24.1 ± 0.41
J104809+5730100.31742 ± 0.00007  s −22.80 ± 0.015 ± 10
J104834+5600050.80 ± 0.04  p −21.5 ± 0.22 ± 10
J104842+585326 R M + 21 ---0
J104912+5750140.07256 ± 0.00002  s −23.4679 ± 0.00063.01 ± 0.021
J105057+5623490.62 ± 0.07  p −21.0 ± 0.33 ± 20
J105340+560950---0
J105418+5952200.79 ± 0.0388  p −21.1 ± 0.33.3 ± 0.90
J105436+5909010.8862 ± 0.0003  s −22.94 ± 0.040.77 ± 0.150
J105524+5616160.31 ± 0.03  p −22.3 ± 0.22.9 ± 0.30
J110021+6016300.19857 ± 0.00003  s −22.63 ± 0.013.2 ± 0.11
Table A2. Emission lines and D4000 values. L [ O II ] = S [ O II ] × 4 × 3.14 × D L 2 . FWHM [km/s] = (300,000 × ((2.354 × σ [Å])/ λ )). Upper limits of the line fluxes are estimated using 3 σ c o n t i n u u m as height of the Gaussian. [ O II ] emission line fluxes are measured with 2 Gaussians, and [O iii] emission line fluxes are measured with 1 Gaussian. D4000 is a 4000 Å continuum brake calculated as S ( 4150 4250 Å)/ S ( 3750 3850 Å).
[O ii][O iii]
Source Name σ GW S [ O II ] log 10 ( S [ O II ] ) log 10 ( L [ O II ] H 0 = 70 ) σ GW S [ O III ] log 10 ( S [ O III ] ) log 10 ( L [ O III ] H 0 = 70 ) D4000
km/s × 10 17 erg s 1 cm 2 L/ erg s 1 km/s × 10 17 erg s 1 cm 2 L/ erg s 1 Value
3 REMNANTS
J105402+5505541306.15−16.2140.50200<4.00<−16.40<40.311.9 ± 0.6
J110255+585740200<10.37<−15.98<40.60200<4.25<−16.37<40.212 ± 2
J110806+58314417953.16−15.2740.541369.38−16.0339.781.9 ± 0.6
9 RESTARTED CANDIDATES
J103508+583940200<9.34<−16.03<40.89200<23.74<−15.62<41.292 ± 2
J103815+60111140234.25−15.4740.5866.7.38−16.1339.912.0 ± 0.9
J104113+580755200<35.25<−15.45<41.04200<13.91<−15.86<40.631.8 ± 0.7
J104204+5734491061.83−16.7440.20200<3.81<−16.42<40.522 ± 3
J104252+553536200<13.64<−15.87<41.16200<5.54<−16.26<40.772 ± 1
J104809+573010200<33.88<−15.47<41.05200<20.86<−15.68<40.842 ± 2
J104912+575014200<129.68<−14.89<40.22200<42.82<−15.37<39.741.8 ± 0.4
J105436+590901200<5.73<−16.24<41.35200<6.22<−16.21<41.381 ± 1
J110021+601630200<13.62<−15.87<40.19200<16.86<−15.77<40.281.9 ± 0.5
49 COMPARISON
J102731+5855241327.57−16.1240.7921818.22−15.7441.171.8 ± 0.8
J102934+582622200<8.21<−16.09<40.71200<5.06<−16.30<40.502 ± 1
J103155+580659200<50.31<−15.30<40.04200<20.23<−15.69<39.641.9 ± 0.4
J103258+564453138153.56−14.8139.8616058.18−15.2439.441.8 ± 0.4
J103316+580611200<14.86<−15.83<41.06200<32.22<−15.49<41.402 ± 3
J103423+600519200<28.65<−15.54<40.65200<24.56<−15.61<40.581.9 ± 0.5
J103512+573128200<9.00<−16.05<40.94200<3.34<−16.48<40.512 ± 1
J103541+590707200<17.22<−15.76<41.16200<6.17<−16.21<40.722 ± 1
J103611+571327200<8.56<−16.07<41.37200<6.39<−16.19<41.241.3 ± 0.7
J103621+583712200<95.88<−15.02<39.20200<115.35<−14.94<39.281.9 ± 0.4
J103646+590858200<19.59<−15.71<41.21200<16.56<−15.78<41.142 ± 1
J103856+5752478521.11−15.6839.74200<18.81<−15.73<39.691.7 ± 0.6
J103953+583213---------
J104021+564842M−star200<34.11<−15.47<33.82200<8.09<−16.09<33.191 ± 2
J104026+551950200<14.75<−15.83<41.37200<5.13<−16.29<40.912 ± 2
J104113+564831200<42.21<−15.37<40.61200<16.31<−15.78<40.201.8 ± 0.5
J104130+575942200<34.19<−15.47<41.04200<9.27<−16.03<40.481.9 ± 0.8
J104208+59201833423.57−15.6341.38200<10.91<−15.96<41.041.5 ± 0.7
J104225+593615200<8.66<−16.06<40.93200<3.74<−16.43<40.571.7 ± 0.9
J104232+592725200<18.09<−15.74<40.99200<11.98<−15.92<40.812 ± 1
J104320+5856211497.11−16.1540.48200<3.19<−16.50<40.131.7 ± 0.4
J104352+581327200<41.53<−15.38<41.34200<15.47<−15.81<40.922 ± 2
J104418+562007200<28.45<−15.55<42.73-----
J104418+603701200<12.10 < 15.92<41.86200<26.99<−15.57<42.200.74 ± 0.06
J104457+592533200<23.47<−15.63<41.10200<5.98<−16.22<40.512 ± 1
J104514+562049200<33.11<−15.48<40.60200<26.11<−15.58<40.501.9 ± 0.7
J104552+562708200<15.51<−15.81<41.13200<17.01<−15.77<41.172 ± 6
J104630+582745200<45.36<−15.34<40.21200<44.95<−15.35<40.201.9 ± 0.4
J104659+563644200<10.95<−15.96<41.08200<4.15<−16.38<40.661.6 ± 0.6
J104907+551314200<65.93<−15.18<40.44200<44.01<−15.36<40.261.9 ± 0.5
J105013+594029200<20.31<−15.69<41.21200<6.36<−16.20<40.712 ± 2
J105110+564147200<20.12<−15.70<40.93200<9.65<−16.02<40.612 ± 1
J105114+555137200<48.35<−15.32<40.85200<27.79<−15.56<40.611.9 ± 0.7
J105132+571115200<29.25<−15.53<40.98200<15.53<−15.81<40.712 ± 1
J105147+552309200<90.12<−15.05<40.08200<57.34<−15.24<39.892.0 ± 0.4
J105237+573103200<8.90<−16.05<41.30200<9.35<−16.03<41.322 ± 1
J105249+563153200<29.74<−15.53<41.17200<9.64<−16.02<40.683 ± 2
J105252+553839200<9.27<−16.03<40.87200<5.77<−16.24<40.662 ± 1
J105322+561852200<103.06<14.99<40.16200<19.92<−15.70<39.451.8 ± 0.4
J105325+56140211113.49−15.8740.13200<18.62<−15.73<40.271.6 ± 0.5
J105451+5537362999.52−16.0241.6116135.52−15.4542.180.72 ± 0.09
J105702+564503200<69.09<−15.16<40.53200<20.17<−15.70<40.001.8 ± 0.4
J105703+58472021017.9015.7541.7720199.76−15.0042.521 ± 2
J105747+574511200<12.72<−15.90<41.36200<2.97<−16.53<40.732 ± 2
J105831+600839200<32.62<−15.49<40.55200<19.32<−15.71<40.331.9 ± 0.5
J105859+590841200<14.01<−15.85<41.38200<4.38<−16.36<40.882 ± 1
J105931+5655298656.77−15.2540.40200<20.88<−15.68<39.971.4 ± 0.3
J110125+573720200<49.91<−15.30<40.93200<28.55<−15.54<40.691.8 ± 0.5
J110753+590537200<32.90<−15.48<41.30200<10.69<−15.97<40.812 ± 1

Appendix B. SDSS Spectra

In Figure A1, we show the SDSS spectra of the three sources with D4000 < 2. In Figure A2, we show the SDSS spectra of 13 sources with detections of [O ii] and/or [O iii] lines.
Figure A1. SDSS spectra of three galaxies indicating an additional blue component, also confirmed by the D4000 value. From upper left to bottom: J104418+603701, J105451+553736, and J105931+565529.
Galaxies 09 00122 g0a1
Figure A2. SDSS spectra of 13 galaxies with [O ii] and/or [O iii] emission lines detected. From upper left to bottom right: remnant radio sources J105402+550554 and J110806+583144; restarted candidates J103815+601111 and J104204+573449; galaxies from the active comparison sample: J102731+585524, J103258+564453, J103856+575247, J104208+592018, J104320+585621, J105325+561402, J105451+553736, J105703+584720, and J105931+565529.
Galaxies 09 00122 g0a2aGalaxies 09 00122 g0a2b

Notes

1
We note that for one of these 113 sources, J103719+595120, we lack redshift information, but have information on its SDSS optical colours.
2
We note that some of the sources are not detected in all WISE bands.
3
We excluded an M-type star as a misidentification in Section 4.

References

  1. Harrison, C.M.; Costa, T.; Tadhunter, C.N.; Flütsch, A.; Kakkad, D.; Perna, M.; Vietri, G. AGN outflows and feedback twenty years on. Nat. Astron. 2018, 2, 198–205. [Google Scholar] [CrossRef] [Green Version]
  2. Kapinska, A.D.; Hardcastle, M.; Jackson, C.; An, T.; Baan, W.; Jarvis, M. Unravelling lifecycles and physics of radio-loud AGN in the SKA Era. Advancing Astrophysics with the Square Kilometre Array (AASKA14). arXiv 2015, arXiv:astro-ph.GA/1412.5884. [Google Scholar]
  3. Morganti, R. Archaeology of active galaxies across the electromagnetic spectrum. Nat. Astron. 2017, 1, 596–605. [Google Scholar] [CrossRef] [Green Version]
  4. O’Dea, C.P. The Compact Steep-Spectrum and Gigahertz Peaked-Spectrum Radio Sources. Publ. Astron. Soc. Pac. 1998, 110, 493–532. [Google Scholar] [CrossRef]
  5. Dallacasa, D.; Stanghellini, C.; Centonza, M.; Fanti, R. High frequency peakers. I. The bright sample. Astron. Astrophys. 2000, 363, 887–900. [Google Scholar]
  6. An, T.; Baan, W.A. The Dynamic Evolution of Young Extragalactic Radio Sources. Astrophys. J. 2012, 760, 77. [Google Scholar] [CrossRef] [Green Version]
  7. Orienti, M. Radio properties of Compact Steep Spectrum and GHz-Peaked Spectrum radio sources. Astron. Nachrichten 2016, 337, 9. [Google Scholar] [CrossRef] [Green Version]
  8. O’Dea, C.P.; Saikia, D.J. Compact steep-spectrum and peaked-spectrum radio sources. Astron. Astrophys. Rev. 2021, 29, 3. [Google Scholar] [CrossRef]
  9. Komissarov, S.S.; Gubanov, A.G. Relic radio galaxies: Evolution of synchrotron spectrum. Astron. Astrophys. 1994, 285, 27–43. [Google Scholar]
  10. Parma, P.; Murgia, M.; de Ruiter, H.R.; Fanti, R.; Mack, K.H.; Govoni, F. In search of dying radio sources in the local universe. Astron. Astrophys. 2007, 470, 875–888. [Google Scholar] [CrossRef] [Green Version]
  11. Murgia, M.; Parma, P.; Mack, K.H.; de Ruiter, H.R.; Fanti, R.; Govoni, F.; Tarchi, A.; Giacintucci, S.; Markevitch, M. Dying radio galaxies in clusters. Astron. Astrophys. 2011, 526, A148. [Google Scholar] [CrossRef] [Green Version]
  12. Shulevski, A.; Morganti, R.; Barthel, P.D.; Harwood, J.J.; Brunetti, G.; van Weeren, R.J.; Röttgering, H.J.A.; White, G.J.; Horellou, C.; Kunert-Bajraszewska, M.; et al. AGN duty cycle estimates for the ultra-steep spectrum radio relic VLSS J1431.8+1331. Astron. Astrophys. 2015, 583, A89. [Google Scholar] [CrossRef] [Green Version]
  13. Brienza, M.; Godfrey, L.; Morganti, R.; Prandoni, I.; Harwood, J.; Mahony, E.K.; Hardcastle, M.J.; Murgia, M.; Röttgering, H.J.A.; Shimwell, T.W.; et al. Search and modelling of remnant radio galaxies in the LOFAR Lockman Hole field. Astron. Astrophys. 2017, 606, A98. [Google Scholar] [CrossRef] [Green Version]
  14. Mahatma, V.H.; Hardcastle, M.J.; Williams, W.L.; Brienza, M.; Brüggen, M.; Croston, J.H.; Gurkan, G.; Harwood, J.J.; Kunert-Bajraszewska, M.; Morganti, R.; et al. Remnant radio-loud AGN in the Herschel-ATLAS field. Mon. Not. R. Astron. Soc. 2018, 475, 4557–4578. [Google Scholar] [CrossRef] [Green Version]
  15. Morganti, R.; Oosterloo, T.A.; Brienza, M.; Jurlin, N.; Prandoni, I.; Orrù, E.; Shabala, S.S.; Adams, E.A.K.; Adebahr, B.; Best, P.N.; et al. The best of both worlds: Combining LOFAR and Apertif to derive resolved radio spectral index images. Astron. Astrophys. 2021, 648, A9. [Google Scholar] [CrossRef]
  16. Jurlin, N.; Brienza, M.; Morganti, R.; Wadadekar, Y.; Ishwara-Chandra, C.H.; Maddox, N.; Mahatma, V. Multi-frequency characterisation of remnant radio galaxies in the Lockman Hole field. arXiv 2021, arXiv:2106.13161. [Google Scholar] [CrossRef]
  17. Saripalli, L.; Subrahmanyan, R.; Thorat, K.; Ekers, R.D.; Hunstead, R.W.; Johnston, H.M.; Sadler, E.M. ATLBS Extended Source Sample: The Evolution in Radio Source Morphology with Flux Density. Astrophys. J. Suppl. Ser. 2012, 199, 27. [Google Scholar] [CrossRef] [Green Version]
  18. Mahatma, V.H.; Hardcastle, M.J.; Williams, W.L.; Best, P.N.; Croston, J.H.; Duncan, K.; Mingo, B.; Morganti, R.; Brienza, M.; Cochrane, R.K.; et al. LoTSS DR1: Double-double radio galaxies in the HETDEX field. Astron. Astrophys. 2019, 622, A13. [Google Scholar] [CrossRef]
  19. Jurlin, N.; Morganti, R.; Brienza, M.; Mandal, S.; Maddox, N.; Duncan, K.J.; Shabala, S.S.; Hardcastle, M.J.; Prandoni, I.; Röttgering, H.J.A.; et al. The life cycle of radio galaxies in the LOFAR Lockman Hole field. Astron. Astrophys. 2020, 638, A34. [Google Scholar] [CrossRef] [Green Version]
  20. Heckman, T.M.; Best, P.N. The Coevolution of Galaxies and Supermassive Black Holes: Insights from Surveys of the Contemporary Universe. Annu. Rev. Astron. Astrophys. 2014, 52, 589–660. [Google Scholar] [CrossRef] [Green Version]
  21. Lockman, F.J.; Jahoda, K.; McCammon, D. The Structure of Galactic H i in Directions of Low Total Column Density. Astrophys. J. 1986, 302, 432. [Google Scholar] [CrossRef]
  22. Capetti, A.; Robinson, A.; Baldi, R.D.; Buttiglione, S.; Axon, D.J.; Celotti, A.; Chiaberge, M. Exploring the spectroscopic properties of relic radiogalaxies. Astron. Astrophys. 2013, 551, A55. [Google Scholar] [CrossRef] [Green Version]
  23. Zirbel, E.L.; Baum, S.A. On the FR I/FR II Dichotomy in Powerful Radio Sources: Analysis of Their Emission-Line and Radio Luminosities. Astrophys. J. 1995, 448, 521. [Google Scholar] [CrossRef]
  24. Willott, C.J.; Rawlings, S.; Blundell, K.M.; Lacy, M. The emission line-radio correlation for radio sources using the 7C Redshift Survey. Mon. Not. R. Astron. Soc. 1999, 309, 1017–1033. [Google Scholar] [CrossRef] [Green Version]
  25. Wills, K.A.; Morganti, R.; Tadhunter, C.N.; Robinson, T.G.; Villar-Martin, M. Emission lines and optical continuum in low-luminosity radio galaxies. Mon. Not. R. Astron. Soc. 2004, 347, 771–786. [Google Scholar] [CrossRef] [Green Version]
  26. Baldi, R.D.; Capetti, A.; Massaro, F. FR0CAT: A FIRST catalog of FR 0 radio galaxies. Astron. Astrophys. 2018, 609, A1. [Google Scholar] [CrossRef] [Green Version]
  27. Ganci, V.; Marziani, P.; D’Onofrio, M.; del Olmo, A.; Bon, E.; Bon, N.; Negrete, C.A. Radio loudness along the quasar main sequence. Astron. Astrophys. 2019, 630, A110. [Google Scholar] [CrossRef]
  28. Zajaček, M.; Busch, G.; Valencia, S.M.; Eckart, A.; Britzen, S.; Fuhrmann, L.; Schneeloch, J.; Fazeli, N.; Harrington, K.C.; Zensus, J.A. Radio spectral index distribution of SDSS-FIRST sources across optical diagnostic diagrams. Astron. Astrophys. 2019, 630, A83. [Google Scholar] [CrossRef] [Green Version]
  29. Gürkan, G.; Hardcastle, M.J.; Jarvis, M.J. The Wide-field Infrared Survey Explorer properties of complete samples of radio-loud active galactic nucleus. Mon. Not. R. Astron. Soc. 2014, 438, 1149–1161. [Google Scholar] [CrossRef] [Green Version]
  30. Mingo, B.; Watson, M.G.; Rosen, S.R.; Hardcastle, M.J.; Ruiz, A.; Blain, A.; Carrera, F.J.; Mateos, S.; Pineau, F.X.; Stewart, G.C. The MIXR sample: AGN activity versus star formation across the cross-correlation of WISE, 3XMM, and FIRST/NVSS. Mon. Not. R. Astron. Soc. 2016, 462, 2631–2667. [Google Scholar] [CrossRef] [Green Version]
  31. Fanaroff, B.L.; Riley, J.M. The morphology of extragalactic radio sources of high and low luminosity. Mon. Not. R. Astron. Soc. 1974, 167, 31P–36P. [Google Scholar] [CrossRef] [Green Version]
  32. Tadhunter, C. Radio AGN in the local universe: Unification, triggering and evolution. Astron. Astrophys. Rev. 2016, 24, 10. [Google Scholar] [CrossRef] [Green Version]
  33. Tadhunter, C.N.; Morganti, R.; di Serego Alighieri, S.; Fosbury, R.A.E.; Danziger, I.J. Optical spectroscopy of a complete sample of southern 2-Jy radio sources. Mon. Not. R. Astron. Soc. 1993, 263, 999–1022. [Google Scholar] [CrossRef] [Green Version]
  34. Tadhunter, C.N.; Morganti, R.; Robinson, A.; Dickson, R.; Villar-Martin, M.; Fosbury, R.A.E. The nature of the optical-radio correlations for powerful radio galaxies. Mon. Not. R. Astron. Soc. 1998, 298, 1035–1047. [Google Scholar] [CrossRef]
  35. Alam, S.; Albareti, F.D.; Prieto, C.A.; Anders, F.; Anderson, S.F.; Anderton, T.; Andrews, B.H.; Armengaud, E.; Aubourg, E.; Bailey, S.; et al. The eleventh and twelfth data releases of the sloan digital sky survey: Final data from sdss-iii. Astrophys. J. Suppl. Ser. 2015, 219, 12. [Google Scholar] [CrossRef] [Green Version]
  36. Best, P.N.; Kauffmann, G.; Heckman, T.M.; Brinchmann, J.; Charlot, S.; Ivezić, Ž.; White, S.D.M. The host galaxies of radio-loud active galactic nuclei: Mass dependences, gas cooling and active galactic nuclei feedback. Mon. Not. R. Astron. Soc. 2005, 362, 25–40. [Google Scholar] [CrossRef] [Green Version]
  37. Tasse, C.; Shimwell, T.; Hardcastle, M.J.; O’Sullivan, S.P.; van Weeren, R.; Best, P.N.; Bester, L.; Hugo, B.; Smirnov, O.; Sabater, J.; et al. The LOFAR Two-meter Sky Survey: Deep Fields Data Release 1. I. Direction-dependent calibration and imaging. Astron. Astrophys. 2021, 648, A1. [Google Scholar] [CrossRef]
  38. Mahony, E.K.; Morganti, R.; Prandoni, I.; van Bemmel, I.M.; Shimwell, T.W.; Brienza, M.; Best, P.N.; Brüggen, M.; Calistro Rivera, G.; de Gasperin, F.; et al. The Lockman Hole project: LOFAR observations and spectral index properties of low-frequency radio sources. Mon. Not. R. Astron. Soc. 2016, 463, 2997–3020. [Google Scholar] [CrossRef]
  39. Cutri, R.E.; Wright, E.L.; Conrow, T.; Fowler, J.W.; Eisenhardt, P.R.M.; Grillmair, C.; Kirkpatrick, J.D.; Masci, F.; McCallon, H.L.; Wheelock, S.L.; et al. VizieR Online Data Catalog: AllWISE Data Release (Cutri+ 2013). VizieR Online Data Cat. 2014, 2328, cdsarc. Available online: https://cdsarc.cds.unistra.fr/viz-bin/cat/II/328 (accessed on 15 December 2021).
  40. Baldry, I.K.; Glazebrook, K.; Brinkmann, J.; Ivezić, Ž.; Lupton, R.H.; Nichol, R.C.; Szalay, A.S. Quantifying the Bimodal Color-Magnitude Distribution of Galaxies. Astrophys. J. 2004, 600, 681–694. [Google Scholar] [CrossRef] [Green Version]
  41. Wright, E.L.; Eisenhardt, P.R.M.; Mainzer, A.K.; Ressler, M.E.; Cutri, R.M.; Jarrett, T.; Kirkpatrick, J.D.; Padgett, D.; McMillan, R.S.; Skrutskie, M.; et al. The Wide-field Infrared Survey Explorer (WISE): Mission Description and Initial On-orbit Performance. Astron. J. 2010, 140, 1868–1881. [Google Scholar] [CrossRef]
  42. Stern, D.; Assef, R.J.; Benford, D.J.; Blain, A.; Cutri, R.; Dey, A.; Eisenhardt, P.; Griffith, R.L.; Jarrett, T.H.; Lake, S.; et al. Mid-infrared Selection of Active Galactic Nuclei with the Wide-Field Infrared Survey Explorer. I. Characterizing WISE-selected Active Galactic Nuclei in COSMOS. Astrophys. J. 2012, 753, 30. [Google Scholar] [CrossRef] [Green Version]
  43. Jarrett, T.H.; Masci, F.; Tsai, C.W.; Petty, S.; Cluver, M.E.; Assef, R.J.; Benford, D.; Blain, A.; Bridge, C.; Donoso, E.; et al. Extending the Nearby Galaxy Heritage with WISE: First Results from the WISE Enhanced Resolution Galaxy Atlas. Astron. J. 2013, 145, 6. [Google Scholar] [CrossRef]
  44. Maccagni, F.M.; Morganti, R.; Oosterloo, T.A.; Geréb, K.; Maddox, N. Kinematics and physical conditions of H I in nearby radio sources. The last survey of the old Westerbork Synthesis Radio Telescope. Astron. Astrophys. 2017, 604, A43. [Google Scholar] [CrossRef]
  45. Prescott, M.; Whittam, I.H.; Jarvis, M.J.; McAlpine, K.; Richter, L.L.; Fine, S.; Mauch, T.; Heywood, I.; Vaccari, M. The Stripe 82 1-2 GHz Very Large Array Snapshot Survey: Multiwavelength counterparts. Mon. Not. R. Astron. Soc. 2018, 480, 707–721. [Google Scholar] [CrossRef] [Green Version]
  46. Hardcastle, M.J.; Williams, W.L.; Best, P.N.; Croston, J.H.; Duncan, K.J.; Röttgering, H.J.A.; Sabater, J.; Shimwell, T.W.; Tasse, C.; Callingham, J.R.; et al. Radio-loud AGN in the first LoTSS data release. The lifetimes and environmental impact of jet-driven sources. Astron. Astrophys. 2019, 622, A12. [Google Scholar] [CrossRef] [Green Version]
  47. Mingo, B.; Croston, J.H.; Hardcastle, M.J.; Best, P.N.; Duncan, K.J.; Morganti, R.; Rottgering, H.J.A.; Sabater, J.; Shimwell, T.W.; Williams, W.L.; et al. Revisiting the Fanaroff-Riley dichotomy and radio-galaxy morphology with the LOFAR Two-Metre Sky Survey (LoTSS). Mon. Not. R. Astron. Soc. 2019, 488, 2701–2721. [Google Scholar] [CrossRef] [Green Version]
  48. Best, P.N.; Heckman, T.M. On the fundamental dichotomy in the local radio-AGN population: Accretion, evolution and host galaxy properties. Mon. Not. R. Astron. Soc. 2012, 421, 1569–1582. [Google Scholar] [CrossRef] [Green Version]
  49. Ledlow, M.J.; Owen, F.N. 20 CM VLA Survey of Abell Clusters of Galaxies. VI. Radio/Optical Luminosity Functions. Astron. J. 1996, 112, 9. [Google Scholar] [CrossRef]
  50. Bruzual, A.G. Spectral evolution of galaxies. I. Early-type systems. Astrophys. J. 1983, 273, 105–127. [Google Scholar] [CrossRef]
  51. Baldwin, J.A.; Phillips, M.M.; Terlevich, R. Classification parameters for the emission-line spectra of extragalactic objects. Publ. Astron. Soc. Pac. 1981, 93, 5–19. [Google Scholar] [CrossRef]
  52. Foreman-Mackey, D.; Hogg, D.W.; Lang, D.; Goodman, J. emcee: The MCMC Hammer. Publ. Astron. Soc. Pac. 2013, 125, 306–312. [Google Scholar] [CrossRef] [Green Version]
  53. Maddox, N. [O II] as a proxy for star formation in AGN host galaxies: Beware of extended emission line regions. Mon. Not. R. Astron. Soc. 2018, 480, 5203–5210. [Google Scholar] [CrossRef]
  54. Buttiglione, S.; Capetti, A.; Celotti, A.; Axon, D.J.; Chiaberge, M.; Macchetto, F.D.; Sparks, W.B. An optical spectroscopic survey of the 3CR sample of radio galaxies with z < 0.3. II. Spectroscopic classes and accretion modes in radio-loud AGN. Astron. Astrophys. 2010, 509, A6. [Google Scholar] [CrossRef] [Green Version]
  55. Kauffmann, G.; Heckman, T.M.; Tremonti, C.; Brinchmann, J.; Charlot, S.; White, S.D.M.; Ridgway, S.E.; Brinkmann, J.; Fukugita, M.; Hall, P.B.; et al. The host galaxies of active galactic nuclei. Mon. Not. R. Astron. Soc. 2003, 346, 1055–1077. [Google Scholar] [CrossRef] [Green Version]
  56. Raouf, M.; Shabala, S.S.; Croton, D.J.; Khosroshahi, H.G.; Bernyk, M. The many lives of active galactic nuclei-II: The formation and evolution of radio jets and their impact on galaxy evolution. Mon. Not. R. Astron. Soc. 2017, 471, 658–670. [Google Scholar] [CrossRef] [Green Version]
  57. Capetti, A.; Massaro, F.; Baldi, R.D. FRIICAT: A FIRST catalog of FR II radio galaxies. Astron. Astrophys. 2017, 601, A81. [Google Scholar] [CrossRef] [Green Version]
  58. Hardcastle, M.J.; Evans, D.A.; Croston, J.H. Hot and cold gas accretion and feedback in radio-loud active galaxies. Mon. Not. R. Astron. Soc. 2007, 376, 1849–1856. [Google Scholar] [CrossRef] [Green Version]
  59. Narayan, R.; Yi, I. Advection-dominated Accretion: Underfed Black Holes and Neutron Stars. Astrophys. J. 1995, 452, 710. [Google Scholar] [CrossRef]
  60. Czerny, B.; Siemiginowska, A.; Janiuk, A.; Nikiel-Wroczyński, B.; Stawarz, L. Accretion Disk Model of Short-Timescale Intermittent Activity in Young Radio Sources. Astrophys. J. 2009, 698, 840–851. [Google Scholar] [CrossRef]
  61. Ramos Almeida, C.; Bessiere, P.S.; Tadhunter, C.N.; Inskip, K.J.; Morganti, R.; Dicken, D.; González-Serrano, J.I.; Holt, J. The environments of luminous radio galaxies and type-2 quasars. Mon. Not. R. Astron. Soc. 2013, 436, 997–1016. [Google Scholar] [CrossRef]
  62. Smith, D.J.B.; Best, P.N.; Duncan, K.J.; Hatch, N.A.; Jarvis, M.J.; Röttgering, H.J.A.; Simpson, C.J.; Stott, J.P.; Cochrane, R.K.; Coppin, K.E.; et al. The WEAVE-LOFAR Survey. In SF2A-2016: Proceedings of the Annual Meeting of the French Society of Astronomy and Astrophysics, Lyon, France, 14–17 June 2016; Reylé, C., Richard, J., Cambrésy, L., Deleuil, M., Pécontal, E., Tresse, L., Vauglin, I., Eds.; Centre de Recherche Astrophysique de Lyon: Lyon, France, 2016; pp. 271–28022016201620271152021. Available online: http://sf2a.eu/proceedings/2016/2016sf2a.conf..0271D.pdf (accessed on 15 December 2021).
Figure 1. Distribution of stellar masses (left) and distribution of radio luminosities at 150 MHz (right) of the sources in the Lockman Hole (LH); adapted from [19].
Galaxies 09 00122 g001
Figure 2. Left: Distributions of the absolute r band magnitude, M r , for remnant (orange), candidate restarted (blue), and active radio sources (green). Right: M r vs. u r colour of the remnant (orange), candidate restarted (blue), and active sources (green). The black solid line separates the blue cloud from the red sequence, following the [40] definition.
Galaxies 09 00122 g002
Figure 3. The Wide-Field Infrared Survey Explorer (WISE) colour–colour diagram for the sample of remnant radio sources (orange diamonds), candidate restarted radio sources (blue hexagon), and sample of active galaxies (green squares). This figure is an adapted version from [19] and follows the classification from [30].
Galaxies 09 00122 g003
Figure 4. M r vs. radio luminosities measured from the National Radio Astronomy Observatory VLA Sky Survey (NVSS) images at 1400 MHz, where the purple dashed line indicates the separation between FRI and FRII sources, which has since been brought into question (see text for more details).
Galaxies 09 00122 g004
Figure 5. [O ii] (left) and [O iii] (right) emission line luminosity vs. radio luminosity of the sources measured from the SDSS spectra and NVSS images at 1400 MHz, respectively. The green dashed line from [54] shows the correlation derived from the lower range of radio luminosities (typically FRI radio galaxies) of the 3C sample. Detections are marked with squares, while upper limit values (non-detections of the [O ii] and [O iii] emission lines) are indicated with triangles.
Galaxies 09 00122 g005
Table 1. Radio properties of remnant and candidate restarted radio sources. Col. 1 lists names of the remnant and candidate restarted radio sources, where boldface indicates sources for which we have the Sloan Digital Sky Survey (SDSS) spectra available; Col. 2 lists the criteria used to select each radio source as presented in [16] for remnants, Ref. [19] for candidate restarted, and [15] for both remnant and restarted radio sources (indicated with ‘RM+21’ in superscript): ‘NC’ = no core detection at 6000 MHz, ‘USS’ = ultra-steep spectrum ( α > 1.2), ‘CP’ = core prominence lower than expected for an active radio source of a certain total radio luminosity, or larger than 0.1, for remnant radio sources and restarted candidates, respectively, ‘V’ = visual inspection, ‘DDRG’ = double-double radio galaxies, ‘SSC’ = steep spectrum cores ( α > 0.7); Col. 3 lists projected linear sizes of the radio sources measured inside 3 σ l o c a l contours in the LOw Frequency ARray (LOFAR) 18 image; in Col. 4 are radio luminosities as measured from images at 1400 MHz. Mark ‘-’ denotes missing values, due to no SDSS redshift information available for a given radio source.
SourceSelectionRadio Emission log 10 ( L total )
NameCriterionSize [kpc]1400 MHz
15 REMNANTS
J102842+575122NC, USS, CP601 ± 14224.23
J102905+585721NC, USS, CP517 ± 1524.34
J103132+591549USS--
J104516+563148CP--
J104618+581421USS R M + 21 --
J104646+564744NC, CP--
J104732+555007USS1385 ± 4524.84
J105230+563602CP786 ± 6624.72
J105402+550554USS530.92 ± 0.0524.18
J105554+563532USS--
J105723+565938USS R M + 21 --
J105729+591128NC, CP428 ± 1024.22
J110108+560330NC, USS, CP586 ± 12424.31
J110255+585740NC, USS, CP524.0 ± 0.124.13
J110806+583144NC, CP214.40 ± 0.0323.25
21 RESTARTED CANDIDATES
J102955+584621V394 ± 3124.37
J103416+590523CP490 ± 4024.38
J103508+583940CP401.80 ± 0.0623.95
J103621+564323V; DDRG1030 ± 4025.79
J103815+601111SSC423.89 ± 0.0823.37
J103841+563544CP670 ± 4024.31
J103845+594414SSC383 ± 1824.14
J104113+580755CP1022.8 ± 0.124.09
J104204+573449CP514.07 ± 0.0624.58
J104252+553536V; DDRG824.2 ± 0.224.84
J104424+602917CP378 ± 2923.93
J104809+573010V828.0 ± 0.123.83
J104834+560005CP450 ± 824.80
J104842+585326USS R M + 21 --
J104912+575014CP147.24 ± 0.0422.51
J105057+562349SSC441 ± 2224.21
J105340+560950CP, SSC--
J105418+595220SSC972 ± 1724.74
J105436+590901CP1046.9 ± 0.125.22
J105524+561616CP419 ± 2624.05
J110021+601630V608.03 ± 0.0724.81
Publisher’s Note: MDPI stays neutral with regard to jurisdictional claims in published maps and institutional affiliations.

