Elastohydrodynamic Lubrication of Compliant Circular Contacts near Glass-Transition Temperature


Faculty of Mechanical Engineering, Brno University of Technology, Technicka 2896/2, 616 69 Brno, Czech Republic
*
Author to whom correspondence should be addressed.
Lubricants 2022, 10(7), 155; https://0-doi-org.brum.beds.ac.uk/10.3390/lubricants10070155
Submission received: 14 March 2022
/
Revised: 28 April 2022
/
Accepted: 9 May 2022
/
Published: 13 July 2022
(This article belongs to the Special Issue Multiscale Tribology of Solid Lubricants)
Abstract
:Lubrication of polymer materials nowadays represents a subject of interest in many engineering applications, such as bearings or gears, to utilize them in the areas where conventional metal materials have so far dominated. However, material properties of polymers are strongly dependent on temperature that delimits a lubrication process and leads to manifestations of viscoelastic behavior of polymers. An understanding of mechanisms, which are responsible for formation of film thickness near the glass-transition temperature, is necessary to prevent initialization of failure modes and to increase the durability of polymer engineering components. Optical chromatic interferometry was applied to investigate development of film thickness and changes in contact geometry of compliant circular contacts operated in the elastohydrodynamic lubrication regime (EHL). Film thickness was compared with soft EHL prediction models, differences in contact geometry were assessed and their contribution to film thickness development were evaluated. Qualitatively good agreement of experimental results of central film thickness and soft EHL predictions was observed; however, minimum film thickness shows significant discrepancies. Outcomes and findings confirm the operation of the compliant circular contact in Isoviscous-elastic regime of EHL and the main influence of temperature and load to thermomechanical response of amorphous polymer PMMA.
1. Introduction
The last several decades have witnessed a fundamental evolution of plastic materials in many applications and the former materials, such as steel, non-ferrous metals, glass, paper, or wood, were consecutively replaced mostly by plastics. The main development of plastics started after WW2 due to research performed in defense-industry sector in worldwide scale. One of the main efforts was to expand the use of thermoplastics—polymers in engineering applications, especially in military and automotive sector where, at that time, metals dominated.
In the last 30 years, many new engineering polymers with improved material properties were developed [1]; thus, the process of replacement of metal machine engineering components, e.g., gears, bearings, or cams, was accelerated. Polymer gears can work under lubricated conditions [2,3] and dry conditions [4,5] without presence of liquid or grease lubricant. For polymer gears, there is a current effort to expand their use in high performance transmitting mechanisms for torque transfer that was not possible in the past. This was related to their weak mechanical and tribological properties [6,7,8] and manufacturing accuracy in comparison with steel gears. Due to this, the presence of lubricant is especially important, and its effect can influence the durability of polymer gears.
At present, the advantages of polymer gears include low weight, low costs, resistance to wear, resistance to chemicals and oils, and the ability to damp vibrations and impacts. On the other hand, the main disadvantages of polymer gears are low mechanical properties which are strongly dependent on temperature, load, and frequency of loading in comparison with their steel equivalents, as was demonstrated in studies [9,10,11,12]. Another disadvantage may be a certain ecological burden on the environment, but the society-wide benefits of polymer gears are indisputable.
A low level of mechanical properties, especially of Young’s modulus E, allows significant deformations of non-conformal contact surfaces. Increase of temperature and load W leads to the enlargement of the area of contact A. Deformation of contact surfaces can lead up to plastic deformation connected with the creep of the polymer material [6,7].
Failure modes represent a condition in which a machine component is unable to safely perform its function. For polymer gears, two failure modes are typical; the first one is plastic deformation of teeth due to overloading. The second one is plastic deformation of teeth as a result of melting wear, typically after the temperature reaches or exceeds the glass-transition temperature Tg of polymer [10,11]. In dependence on operation conditions, these phenomena can occur together. In accordance with this, it is necessary to ensure operation conditions in full-film lubrication, which helps to dissipate heat from the contact region resulting from contact pressure and shear stress between surfaces; thus, it reduces friction and a probability of initialization of failure modes [6,7].
In the case where the film thickness of the lubricant ensures a full separation of contact surfaces, and the main role is played by hydrodynamics of the liquid, elastic deformation of contact surfaces, and the change in dynamic viscosity η with contact pressure, the lubrication regime is described as elastohydrodynamic lubrication—EHL [13,14,15]. This regime is suitable especially for operation of steel machine components such as gears and cams [16]. In relation to low mechanical properties of polymers, the lubrication regime is specifically called the Isoviscous-elastic regime of EHL or also “soft” EHL, as was stated by Johnson [13].
The Isoviscous-elastic (I-E) regime occurs between non-conformal surfaces where the contact pressure is sufficient to induce the elastic deformation of contact, but not to induce a considerable change in the dynamic viscosity η of lubricant [13,16,17,18,19,20]. This is different from the Piezoviscous-elastic regime (P-E) of EHL, where this change is significant [21,22,23]. Distribution of elastohydrodynamic contact pressure include the center region as well as the inlet, and outlet regions where pressure deviates from the Hertzian elliptical profile with maximum pressure p0 [16,22]. Based on the results in [15,18], the transition region between these regimes also represents the operation area of polymers lubricated by mineral oils [13]; however, the relevant knowledge in the theoretical [13,21] and experimental field is still missing.
In the field of soft EHL lubrication, many articles focused on numerical solution [13,15,16,17,18,19,20,22,24,25] of central hc and minimum hm film thickness as well as on elastohydrodynamic contact pressure distribution, often compared with Hertzian theory [16,22,26], have been published. Hamrock and Dowson [19], and, later, Hooke [20], compiled primary equations for prediction of film thickness in soft EHL contacts. The most important parameters have been identified and described by the power exponents of dimensionless parameters , , and [19,27]. Other prediction models based on numerical solution [15,21] and experimental approaches [26,28] were developed as well. The experimental approach most commonly includes two optical detection methods as was demonstrated by Myant et al. [29] where a laser induced fluorescence method (LIF) was applied. The other method is the optical chromatic interferometry that was also successfully implemented for detection of film thickness in soft contacts by Marx et al. [28].
A necessary condition for the use of both methods is the application of at least one transparent material (e.g., optical glass) that allows for the light to enter the area of contact and thus a detection of film thickness of lubricant. The method of optical chromatic interferometry [30] is more precise than the fluorescence method [29,31] and optical monochromatic interferometry [32,33], but it is limited by a measurable range of thicknesses (approx. up to 800 nm) and necessity of high reflectivity of surface as was demonstrated by Hartl et al. [30]. This can be ensured by applying coatings onto the surface of polymer that provide the desired properties. Otherwise, it is possible to use the method of fluorescence or optical monochromatic interferometry where the limit for detection of film thickness is up to several micrometers.
The application of optical methods is limited by material properties of polymers. Light transmittance, and optical smoothness of surface are essential requirements. This is not the case of polymers, such as PA 66, POM, or PEEK, commonly used to design gears [2,10]. The internal structure of these polymers is semi-crystalline or even crystalline that transmits only part of the light or no light, respectively [34]. On the other hand, amorphous polymers dispose of excellent light transmittance; nevertheless, many of them are significantly different in respect to mechanical properties in comparison with semicrystalline polymers [34]. However, materials such as PC and PMMA represent a group of amorphous polymers [35,36,37,38] which dispose of a high light transmittance and simultaneously provide similar mechanical properties as above-listed engineering polymers for design of gears [2,10].
What is common to all mentioned polymers is their low heat resistance which restricts their operation range. Glass-transition temperature Tg is usually given as the temperature interval beyond which the phenomena of melting wear are initiated due to rearrangement of atoms in the internal polymer structure as result of viscoelastic or plastic deformation of polymer material [2,10,11]. Interval of glass-transition temperature for PMMA was stated by Ali et al. [38] as Tg ∈ (110, 120 °C), and by Mathiesen [39] as Tg ∈ (105, 110 °C). However, the question remains how the lubricated contact can change in size near the Tg and how this can influence the entire lubrication process.
The main aim of this paper is to obtain new knowledge in the field of lubrication of soft EHL circular contacts near the glass-transition temperature Tg where the experiments will be performed. Engineering polymers commonly used for the design of gears will be substituted by the amorphous polymer PMMA in respect to the purposes of experiments. The present paper is focused on development of central and minimum film thickness during the lubrication process and on monitoring the changes of contact geometry using optical chromatic interferometry and a rotary tribometer in the ball-on-disc configuration.
2. Materials and Methods
2.1. Material of Experimental Specimens
The main requirements for the polymer material were light transmittance over 90% and similar mechanical properties, especially of Young’s modulus E compared to PA 66, POM, or PEEK semi-crystalline polymers [2,10]. Both requirements are fulfilled by amorphous polymer PMMA. We used a specimen of 12 mm thick PMMA of disc-shape with semi-transparent thin chromium layer vapor-deposited on the bottom side and the antireflexive layer on the top side of the disc which allows for optical chromatic interferometry. A more detailed description is given in subchapter 2.4. A counterpart is a bearing steel ball 100Cr6 (AISI 52100) of 25.4 mm (1′ inch) in diameter and its material characteristics are described at ambient temperature (24 °C) in Table 1, similarly to the first specimen. With regard to [38,39], the value of Tg is considered as 105 °C.
2.2. Lubricant Properties
The lubricant used during experiments was FVA3 [40,41]—reference mineral oil corresponding to the viscous index ISO VG 100 (SAE 30). The viscous index of FVA3 corresponds to lubricants commonly used for, e.g., heavily loaded gearboxes, air compressors and hydraulic systems, etc. FVA3 lubricant was supplied by Gear Research center (FZG) in Germany, and its properties are described in Table 2 according to [41]. The term of FVA3 as “reference” lubricant is connected to its longtime use within Research Association for Drive Technology—Forschungsvereinigung Antriebstechnik in Germany.
2.3. Experimental Apparatus
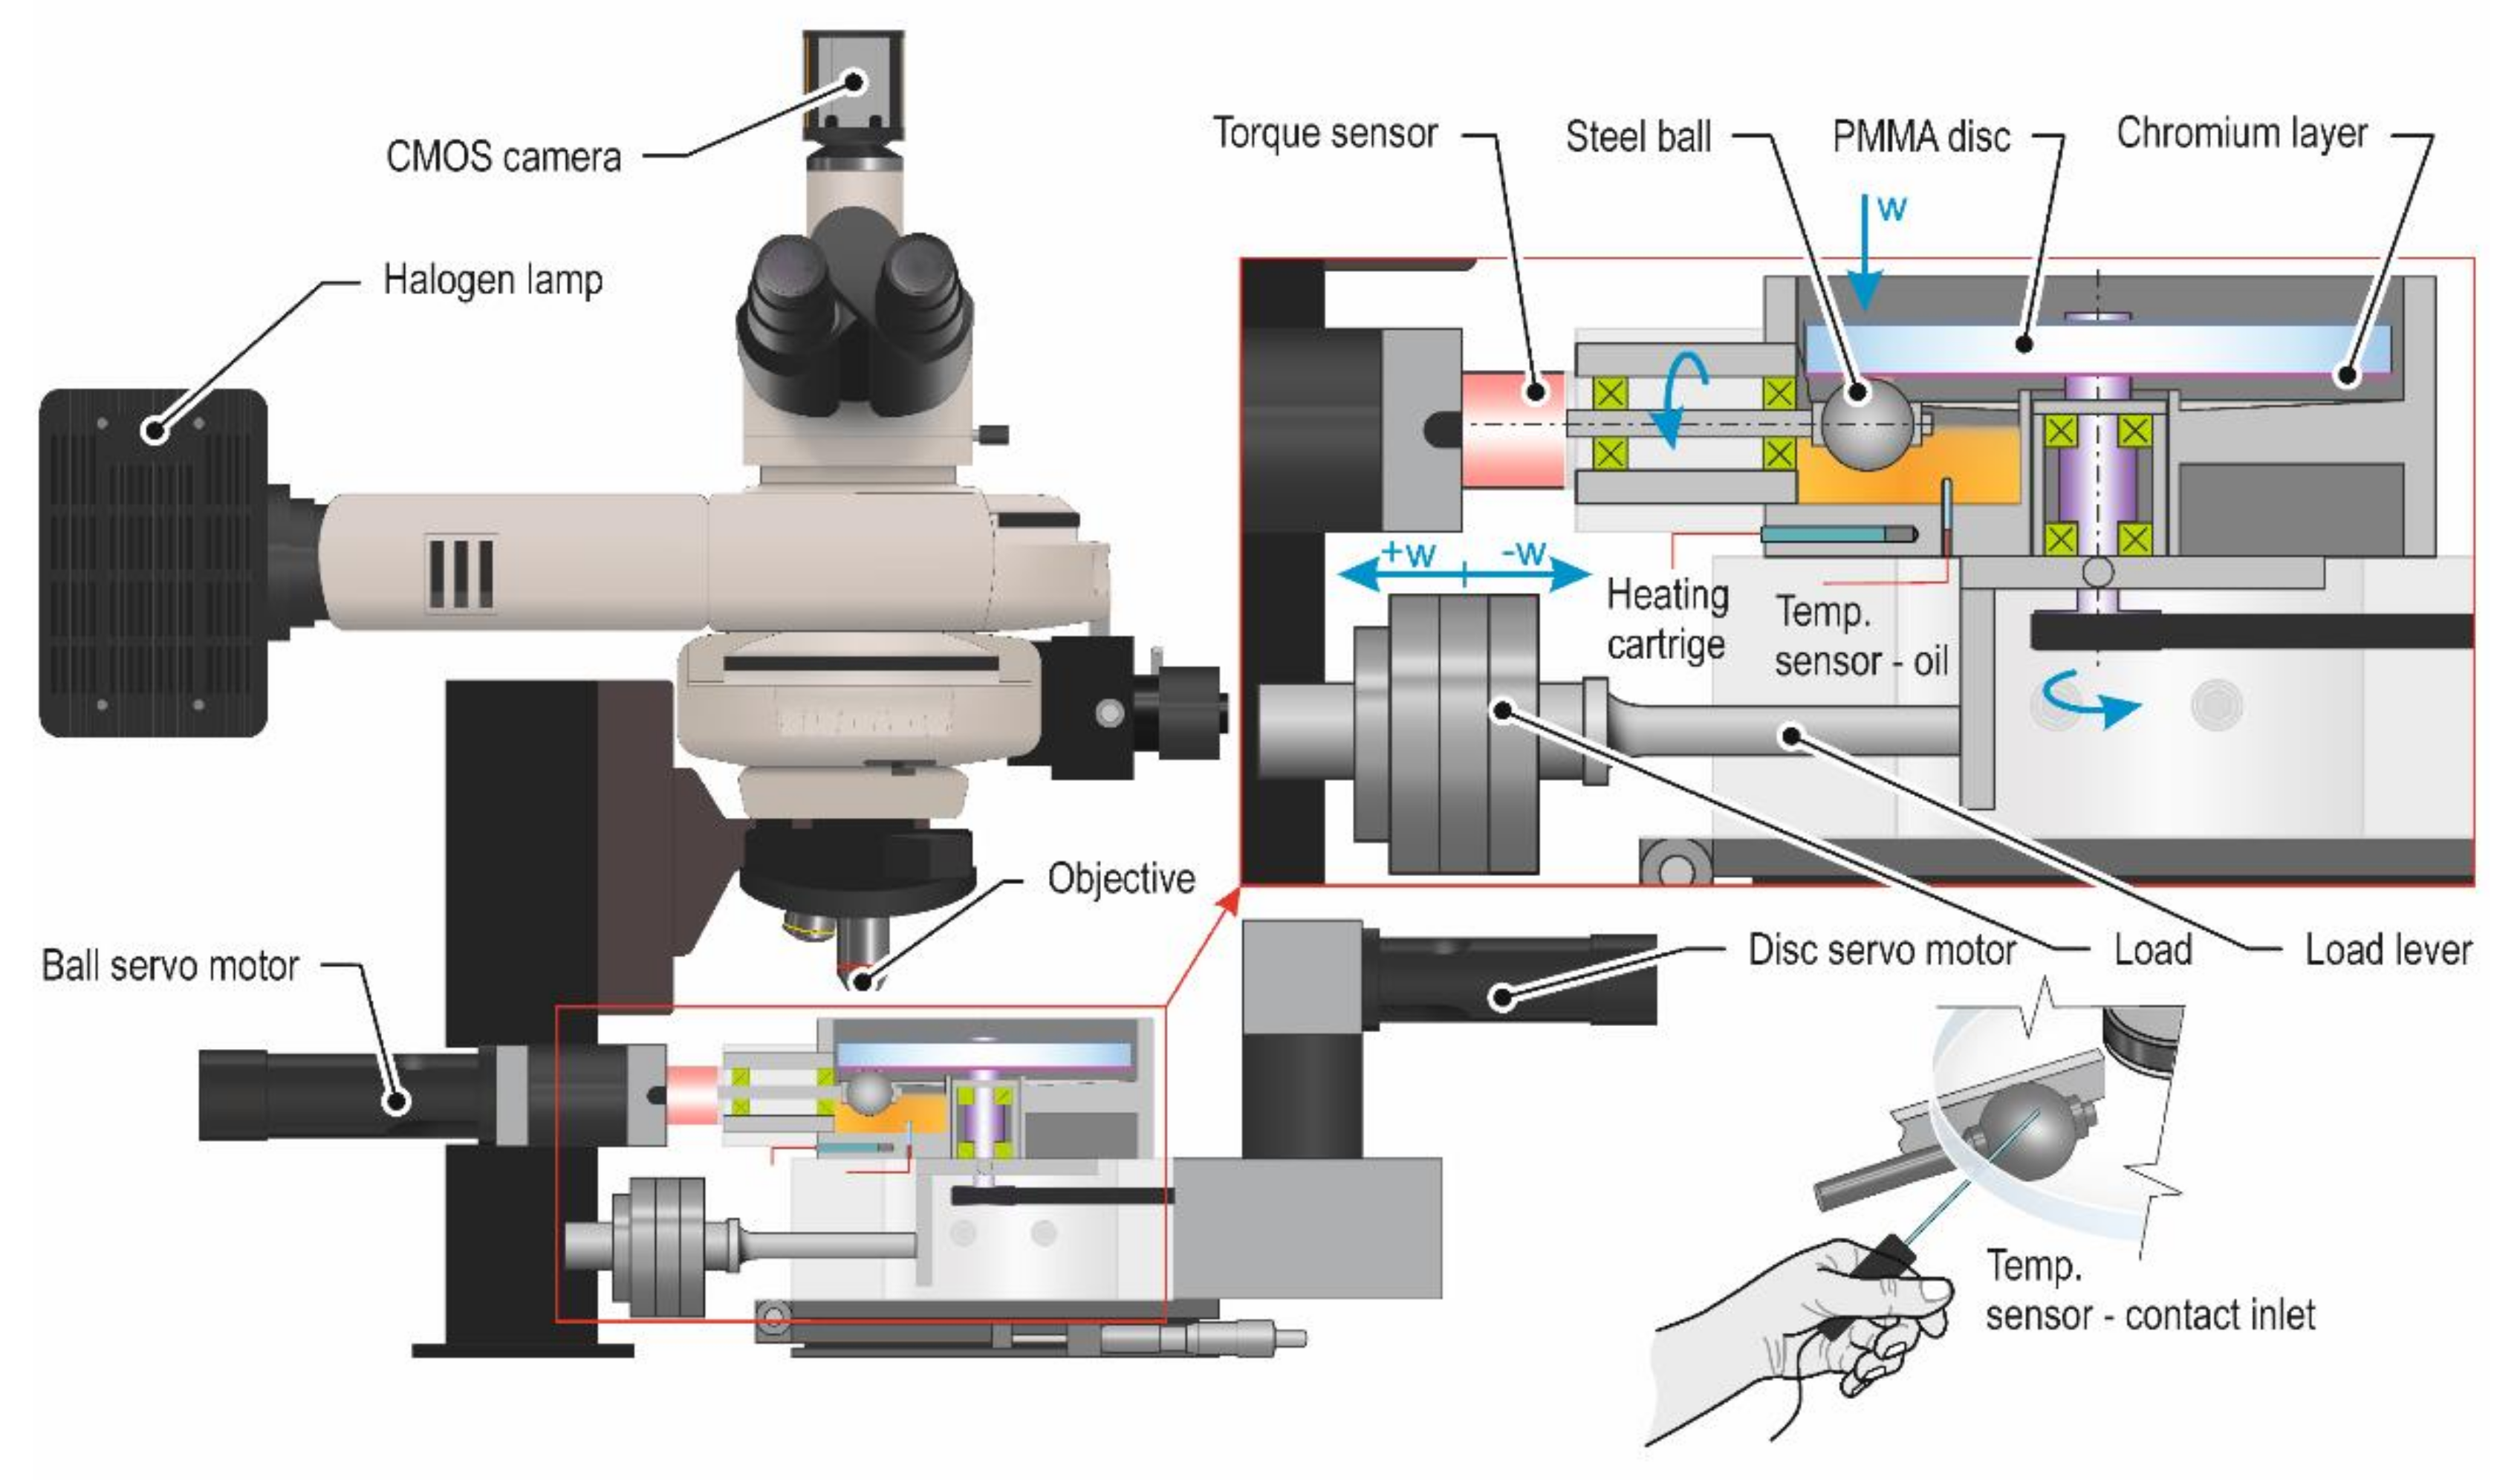
Experiments were conducted on a rotary optical tribometer in ball-on-disc configuration, see Figure 1, which is the main part of EHL rig (Brno University of Technology, Czech Republic). Both specimens (steel ball and PMMA disc) are fixed to shafts and powered by a pair of servomotors controlled by frequency converters. The steel ball is placed in the oil reservoir equipped with heating cells and lubricant is distributed into contact by rolling movement of the steel ball. Temperature is monitored by several thermocouples placed inside the oil reservoir (oil temperature), and one of them is manually positioned near the contact where lubricant enters the contact (inlet temperature T), as Figure 1 shows. The PMMA disc is forced down to the steel ball in normal direction, while both specimens can rotate independently, and their shafts are perpendicular to each other.
The contact is loaded through a polymer disc, which, together with the moveable load, is placed on a double reversible load lever, see Figure 1. The rotary optical tribometer is equipped with CMOS camera (Point Grey BFLY-PGE-23S6C) which captures the contact region in high pixel resolution, and with a powerful Nikon halogen lamp to provide a light source. Due to the expected higher elastic deformation of soft EHL contacts opposite to the hard EHL contacts, the Nikon CF Plan 5×/0.13 objective with high depth of field was chosen. Temperature is controlled by PLC unit of EHL rig that allows to record and regulate heating process.
2.4. Experimental Conditions and Methods
Before the experiments, both specimens were properly cleaned by isopropyl alcohol. Additionally, the surface of the steel ball was polished by pastes to decrease the RMS roughness Rq and increase its reflectivity. After the cleaning process, the 3D optical profilometer (Bruker) was used for surface texture analysis, see results in Table 1. Nevertheless, in the case of the PMMA disc, it is an optically smooth surface. The specimens were placed to the tribometer and fixed, and the oil reservoir was filled with 50 mL of FVA3 lubricant, as illustrated in Figure 1.
In respect to glass-transition temperature Tg of PMMA (Table 1.), film thickness was measured in the temperature interval from 90 °C to 110 °C, where a disruption of polymer internal structure and acceleration of flow of individual atoms are expected. Consequently, viscoelastic, or plastic deformation occurs, and this can bring about unexpected phenomena in the lubrication process influencing film thickness. The range of entrainment speed U, load W, and other experimental conditions are given in Table 3.
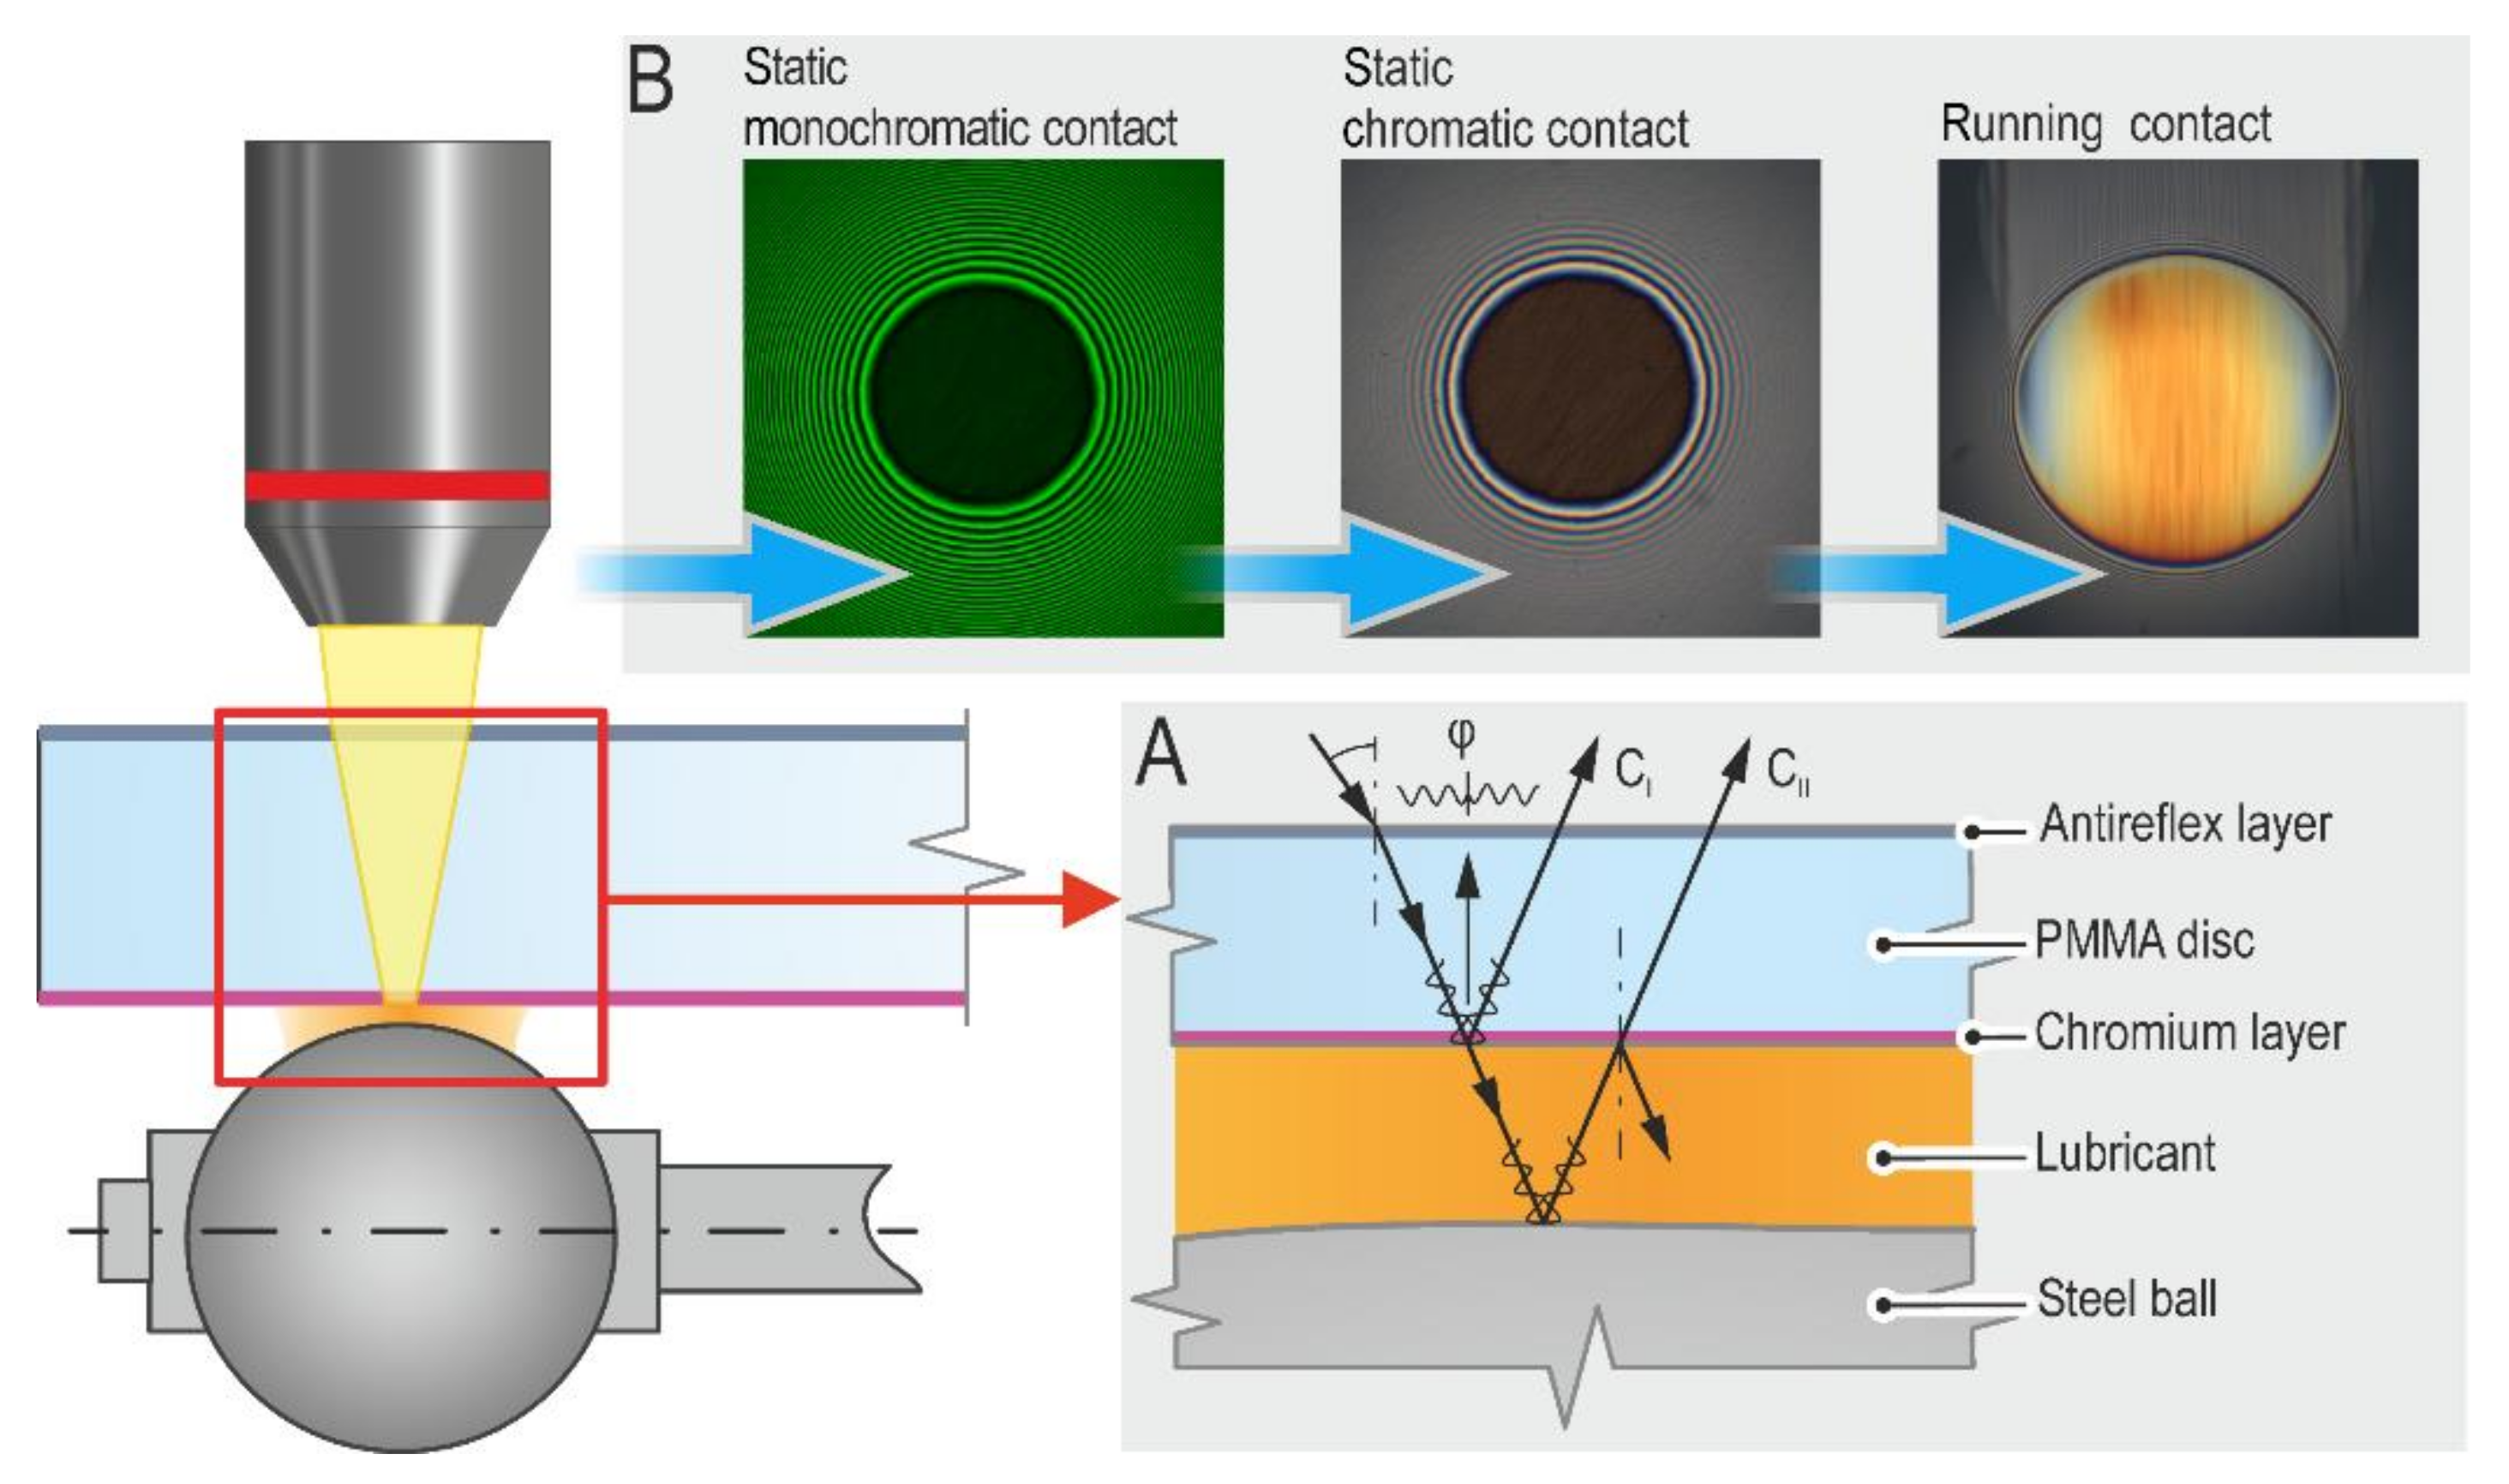
The optical chromatic interferometry [30] in connection with the EHL rig performs as a powerful tool for measurement and evaluation of film thickness. Therefore, the bottom side of transparent PMMA disc was coated with semi-transparent chromium layer which ensures improved interference. The chromium layer divides light from the light source into several beams. The first of beam, CI, is reflected by the chromium layer onto the disc surface while the second beam, CII, passes through the chromium layer over the lubricant and is reflected from the surface of steel ball. Each of these beams travels a different distance while their phases are mutually shifted resulting in phase shift φ. The different distance is calculated based on the interference of light. Both beams interfere with each other and indicate the magnitude of lubricant film thickness. This is schematically illustrated in detail A in Figure 2.
Evaluation of film thickness is based on CIELAB color-film thickness calibration between monochromatic and chromatic interferograms deposed on each other via Newton’s fringes. Film thickness is measured, calibrated, and evaluated in software Achiles (ver.4.0.117, Radek Poliscuk, Brno University of Technology, Brno, Czechia), and this is illustrated in detail B in Figure 2. A more detailed description of optical chromatic interferometry method could be found in [30].
3. Results
3.1. Static Contacts—Change of Contact Geometry
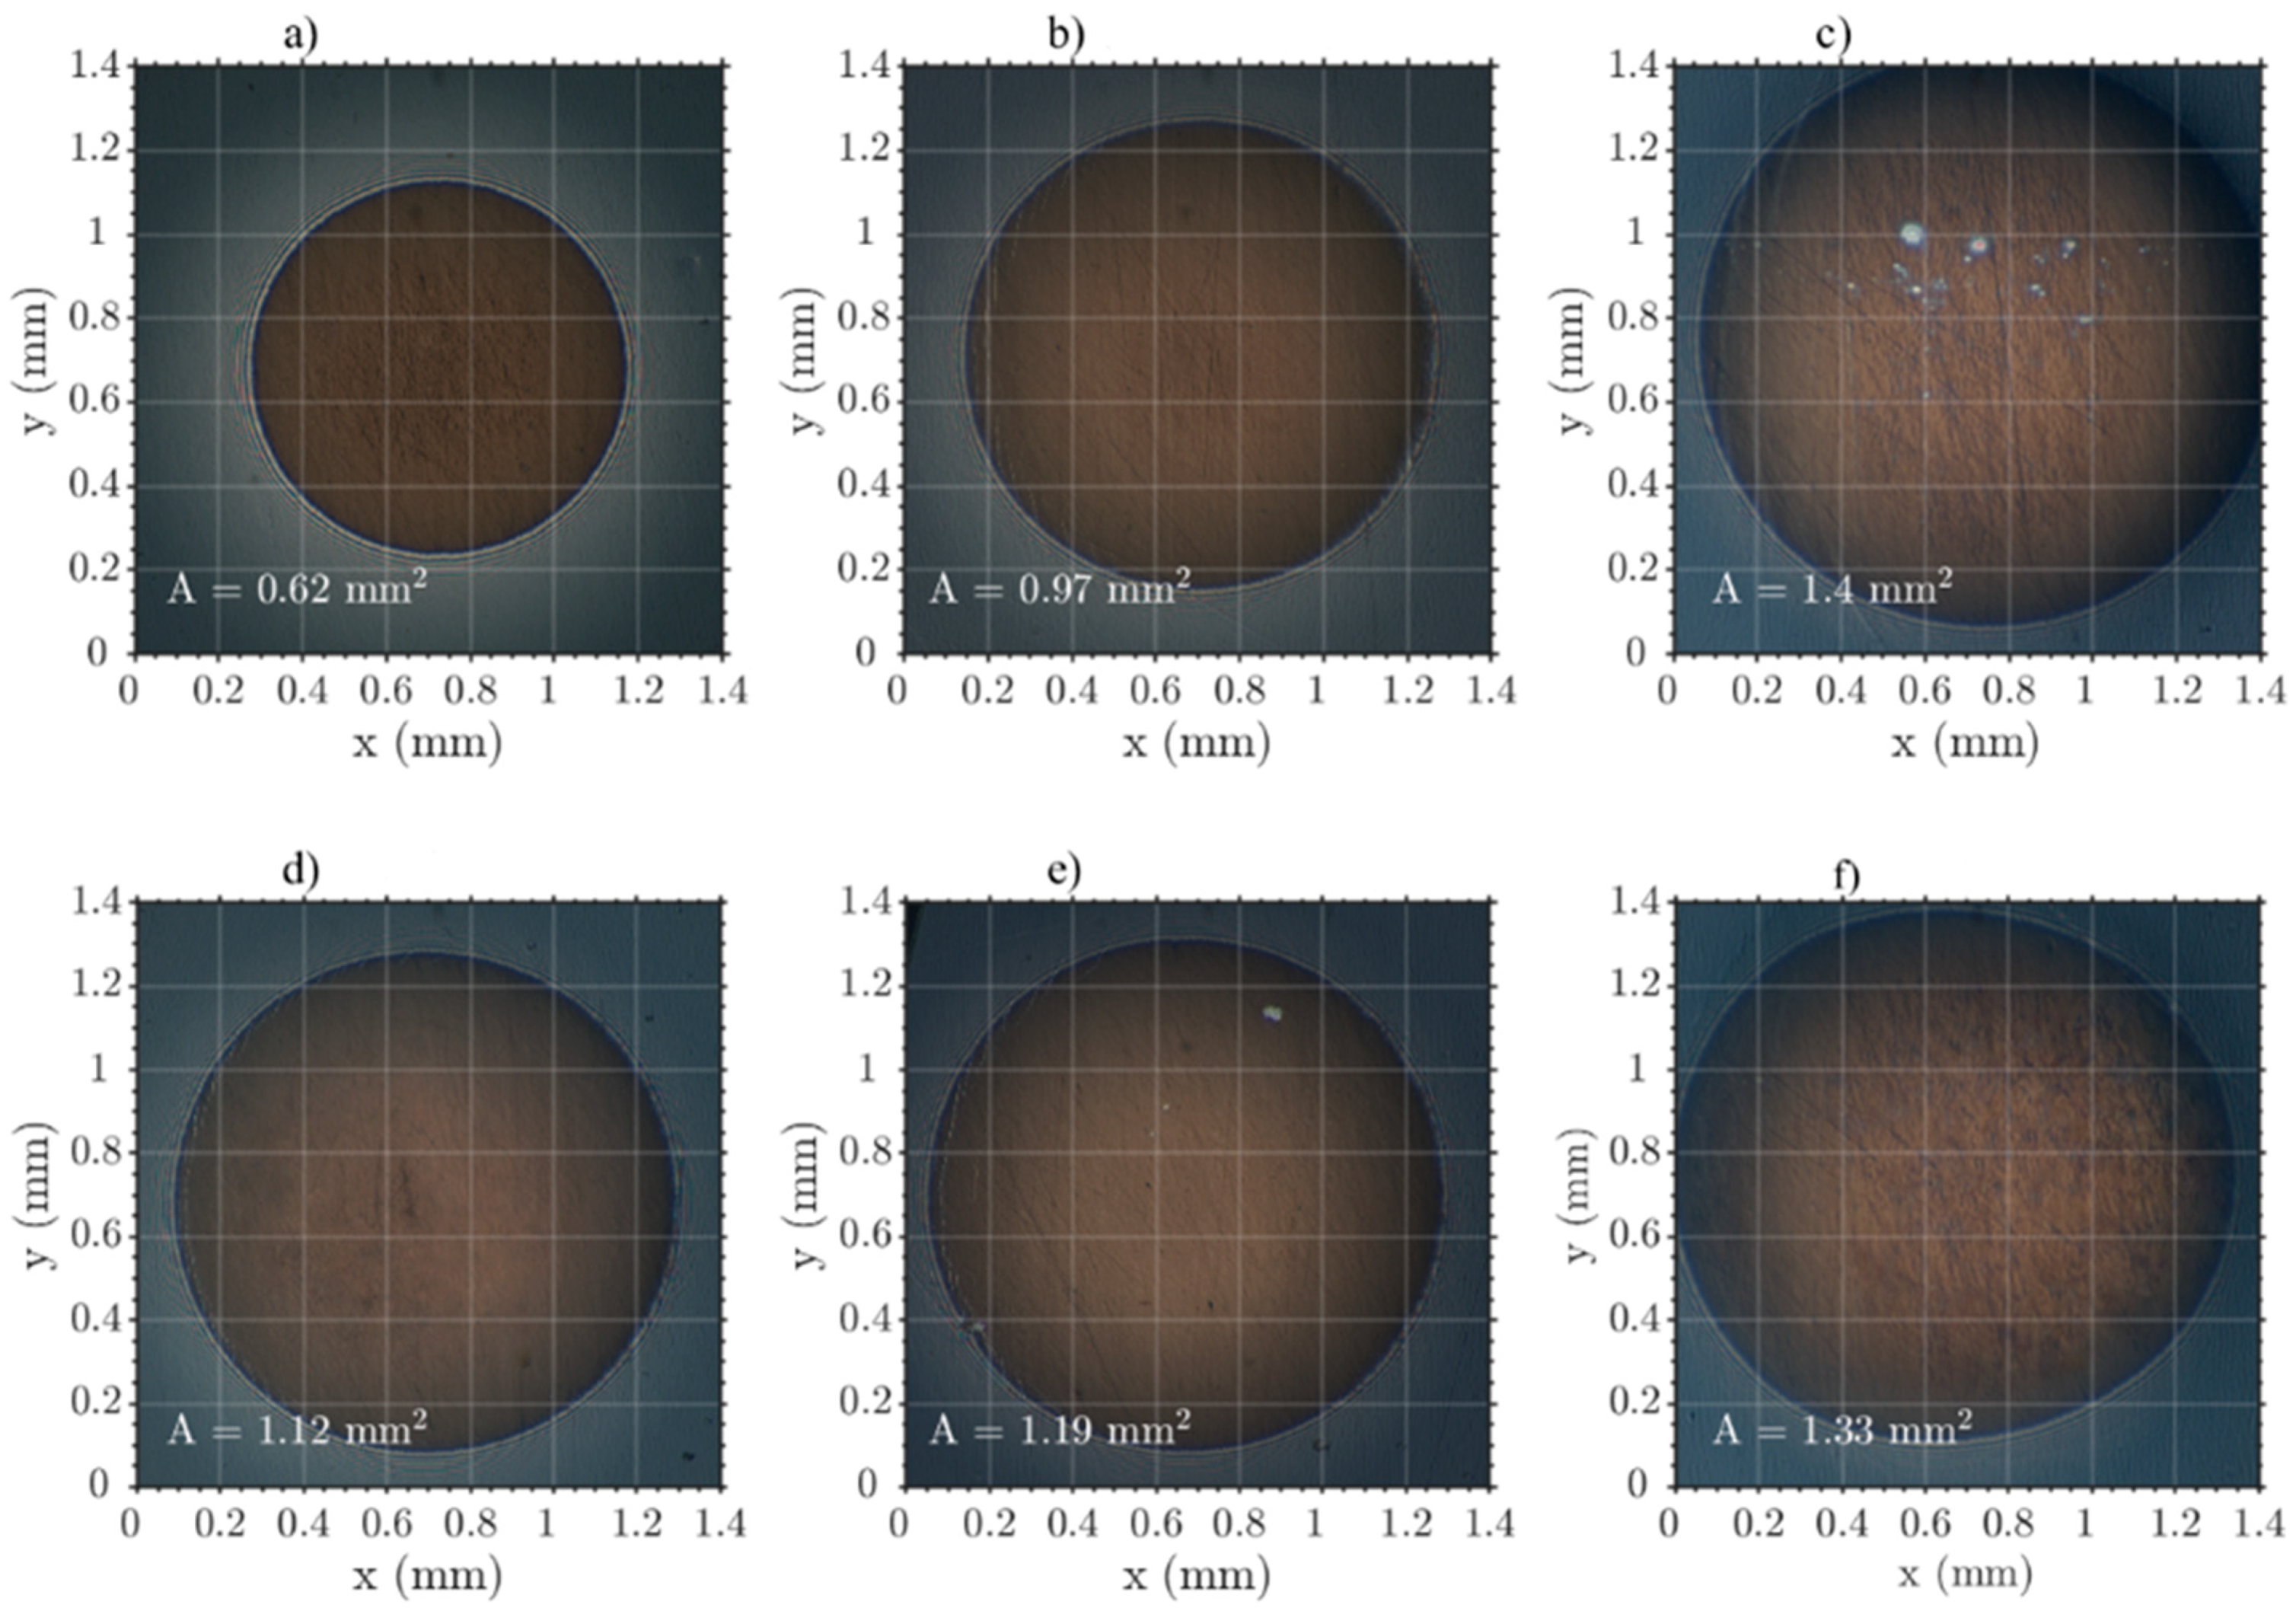
Film thickness measurement was preceded by acquisition interferograms of contact in steady state condition (static contacts) at different inlet temperatures T and loads W. Figure 3 demonstrates a different increase of contact size as a result of rising inlet temperature in dependence on load. However, for load W = 20 N, this increase is more noticeable than for W = 50 N, whereas, for the latter, an additional deformation occurs of originally circular contact after the temperature reached 110 °C (and thus exceeds Tg, Table 1), see Figure 3f. Ellipticity k of static contacts is predominantly close to the circular contact (k = 1) and belongs to the interval where k ∈ (1.01, 1.06).
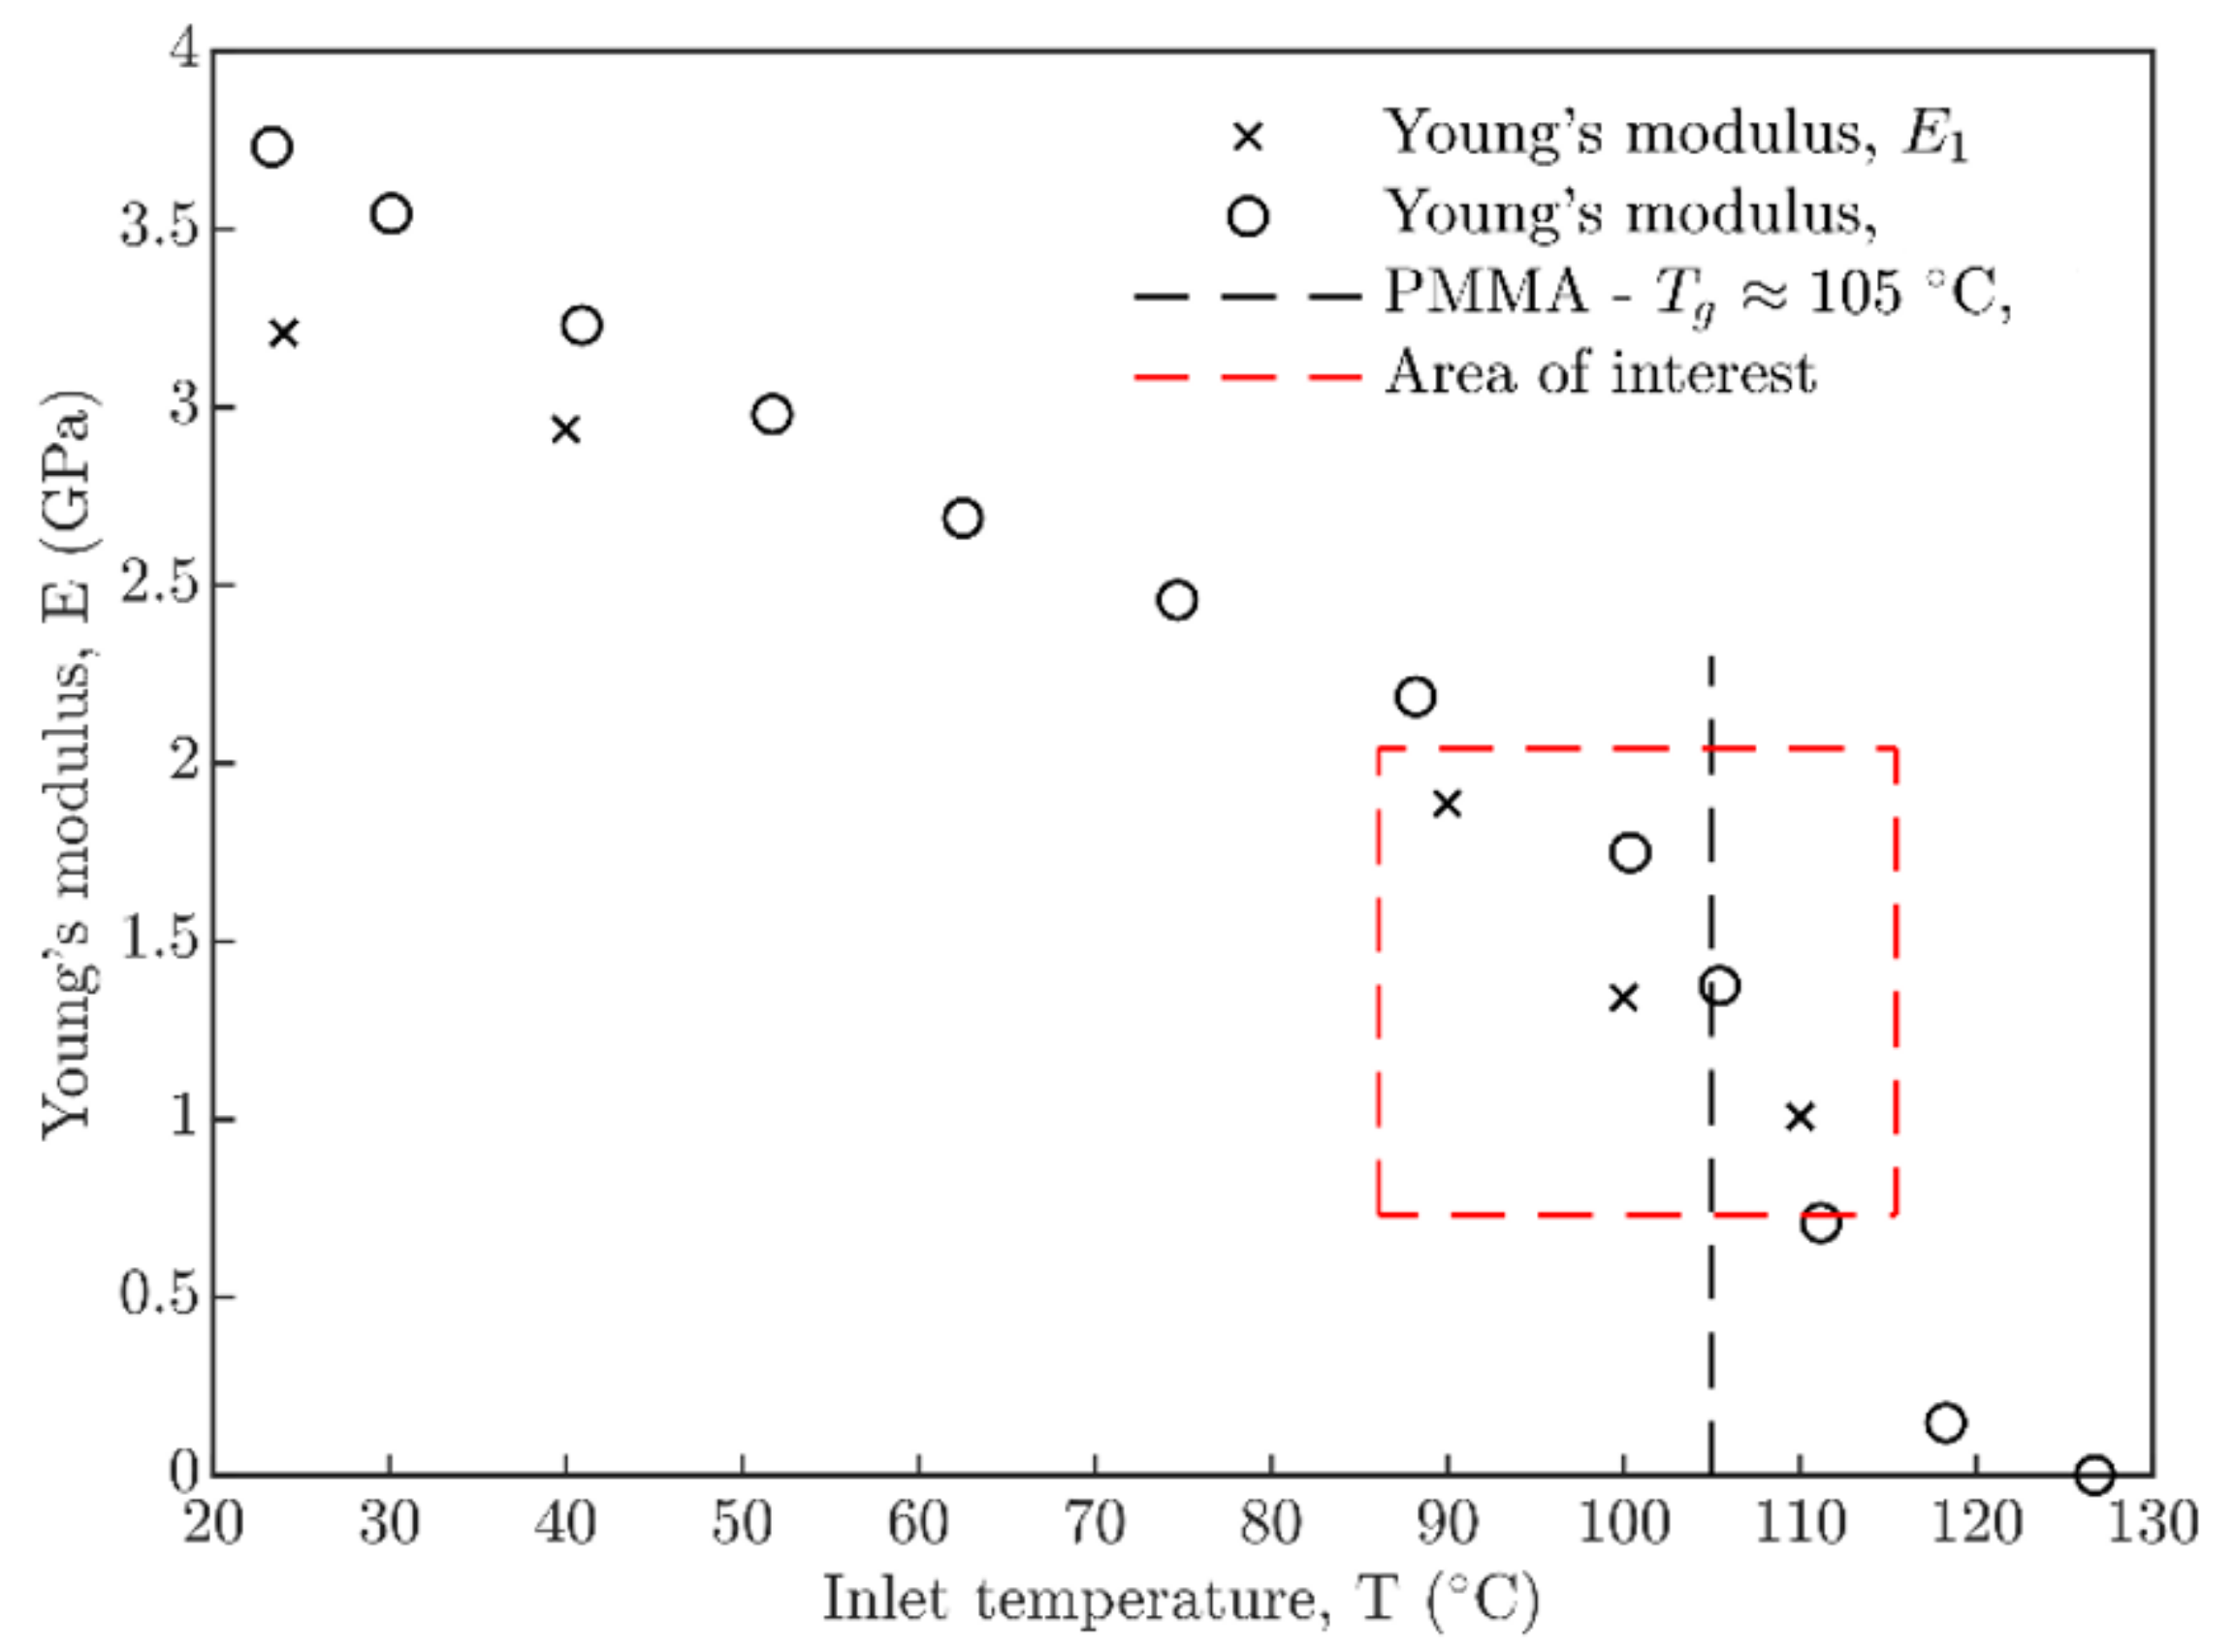
Interferograms of static contacts were post-processed, and dimensions of contact were identified and averaged for both loads. Young’s modulus E1 of PMMA, based on semi-contact radius a (see Nomenclature) and reduced Young’s modulus E′, was evaluated, see Figure 4. Development of Young’s modulus E1 of PMMA shows a gradual decrease in the whole temperature range, especially close to the frequently stated glass-transition temperature of PMMA (black dash-line, Tg ≈ 105 °C, [39]). The red rectangle in Figure 4 represents the area of interest from 90 °C to 110 °C where static contacts were evaluated and compared with the results of Boubimba et al. [42] from the DMA experiment for PMMA. On the one hand, the results from DMA experiments [42] demonstrate a similar development, but, on the other hand, they differ in values 18% on average. Obtained values of E1 from Figure 4 were used in the next step to evaluate film thickness prediction models [19,20,28].
3.2. Film Thickness of Lubricant
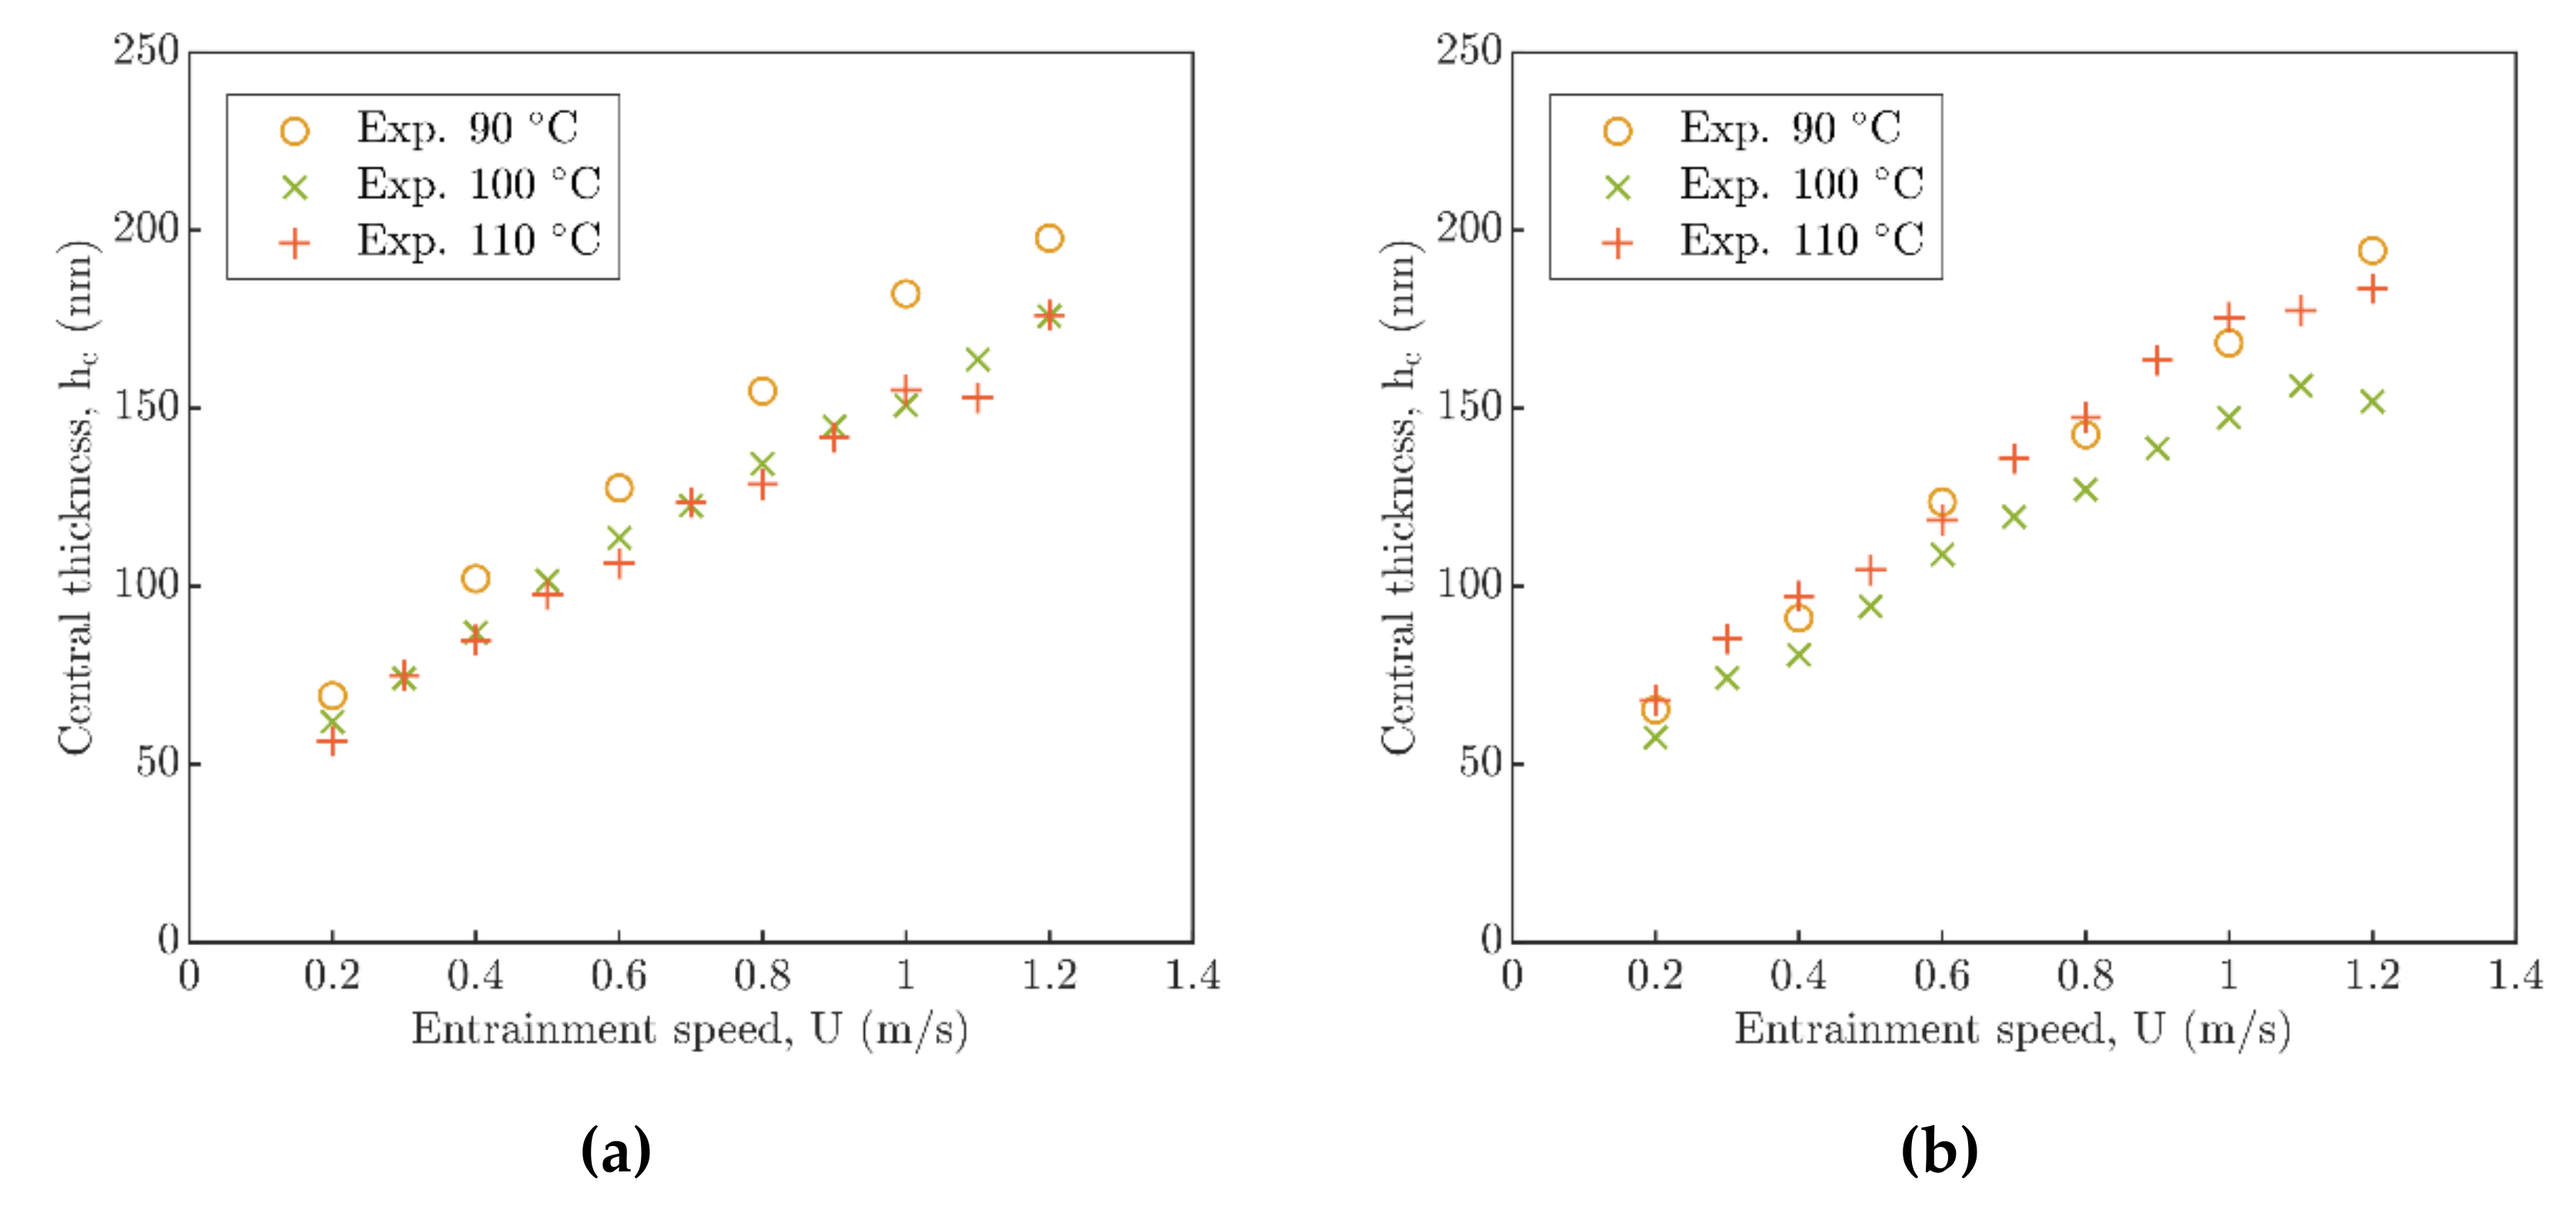
After acquisition of static contacts, central film thickness hc was measured at different loads (20 N and 50 N), inlet temperatures (90 °C, 100 °C and 110 °C), and entrainment speeds (0.2–1.2 m/s), see the results in Figure 5. These results demonstrated that load W participates in development of the central film thickness hc only marginally, up to the glass-transition temperature Tg, and, with the increasing load, the central film thickness decreases, see Figure 5a. Influence of load is more significant above the Tg, where, at 110 °C, a different development of the central film thickness between W = 20 N and W = 50 N was observed. An increase of load W causes the unexpected increase of central film thickness hc in respect to the EHL theory, which is highest at 110 °C, see Figure 5b.
The effect of temperature turned out to be more substantial in the case of contact geometry changes than for major changes in central film thickness development. Nevertheless, the results showed a similar profile of central film thickness hc with increasing temperature (especially for W = 50 N), where central thickness differences were observed only up to 50 nm. In respect to this, the phenomenon of the central film thickness hc increase with temperature and the load above glass-transition temperature Tg was observed. This can implicate a minor influence of lubricant viscosity η and a major influence of Young’s modulus E on formation of central film thickness hc. Moreover, for entrainment speed U, approximately 1.0–1.2 m/s, only slight changes were observed in film thickness evolution in this speed range, see Figure 5b.
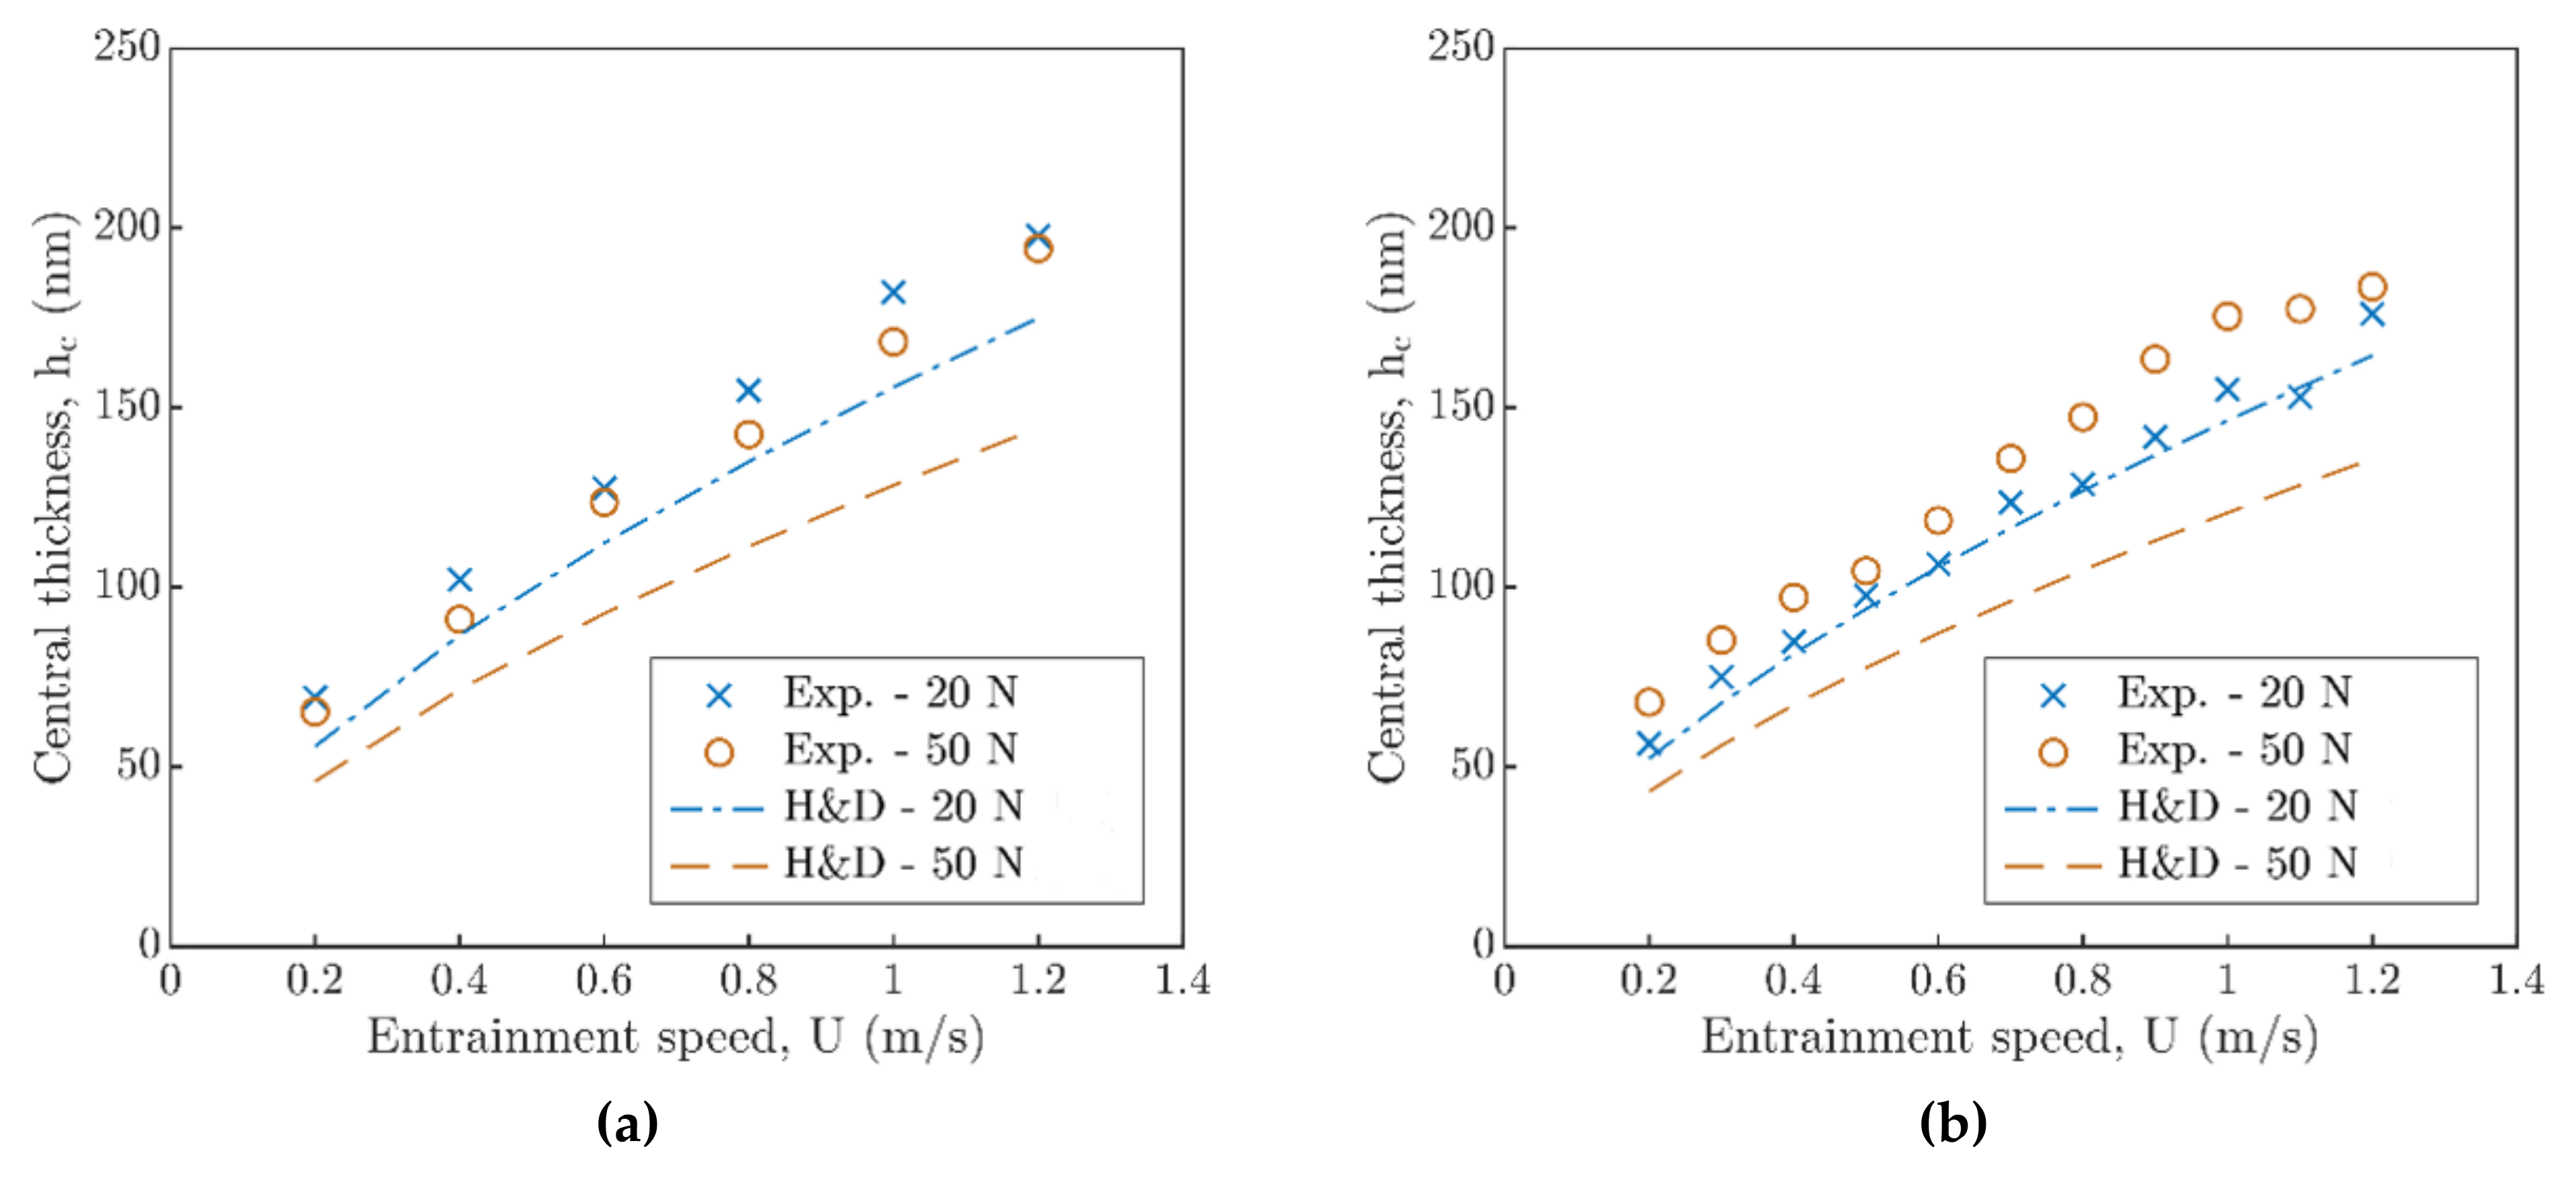
In the next step, experimental data were compared with Hamrock and Dowson (H&D) [19] prediction model, see Figure 6a for 90 °C and Figure 6b for 110 °C, where a different agreement was obtained in respect to the applied load and inlet temperature. Figure 6a demonstrates similar development of central film thickness hc almost independent of the applied load W where only a minor difference occurs. In the case of W = 20 N, experimental data differs from the prediction model by about 15% in average, while for W = 50 N, the difference is double that of W = 20 N, and the deviation from prediction increases with entrainment speed.
Dependence of central film thickness hc on the entrainment speed U is described by the power exponent of dimensionless speed which is equal to 0.64 in H&D [19] prediction. However, the experimental results for W = 20 N and W = 50 N showed only the values of 0.59 and 0.61, respectively, which corresponds with higher central film thickness, see Figure 6a. Simultaneously, film thickness deviation points to the influence of lubricant dynamic viscosity η in this region.
The results obtained above the glass-transition temperature Tg in Figure 6b showed a very good agreement between the experimental data and H&D [19] prediction model where the difference is less than 5% on average for W = 20 N. Opposite to this, for W = 50 N, fluctuation of central film thickness hc with entrainment speed U was observed, and, similarly as in Figure 6a, experimental data do not correspond with the prediction model and differ even more, see Figure 6b. The deviation is linked with the deflection of power exponent of dimensionless entrainment speed where, for W = 20 N, the results showed the value of 0.61, while for W = 50 N, it was only 0.58. This again confirms the dependence of the central film thickness hc on temperature and load; after the Tg is exceeded, the significance of the load W is strongly enhanced.
3.3. Running Contact—Change of Contact Geometry
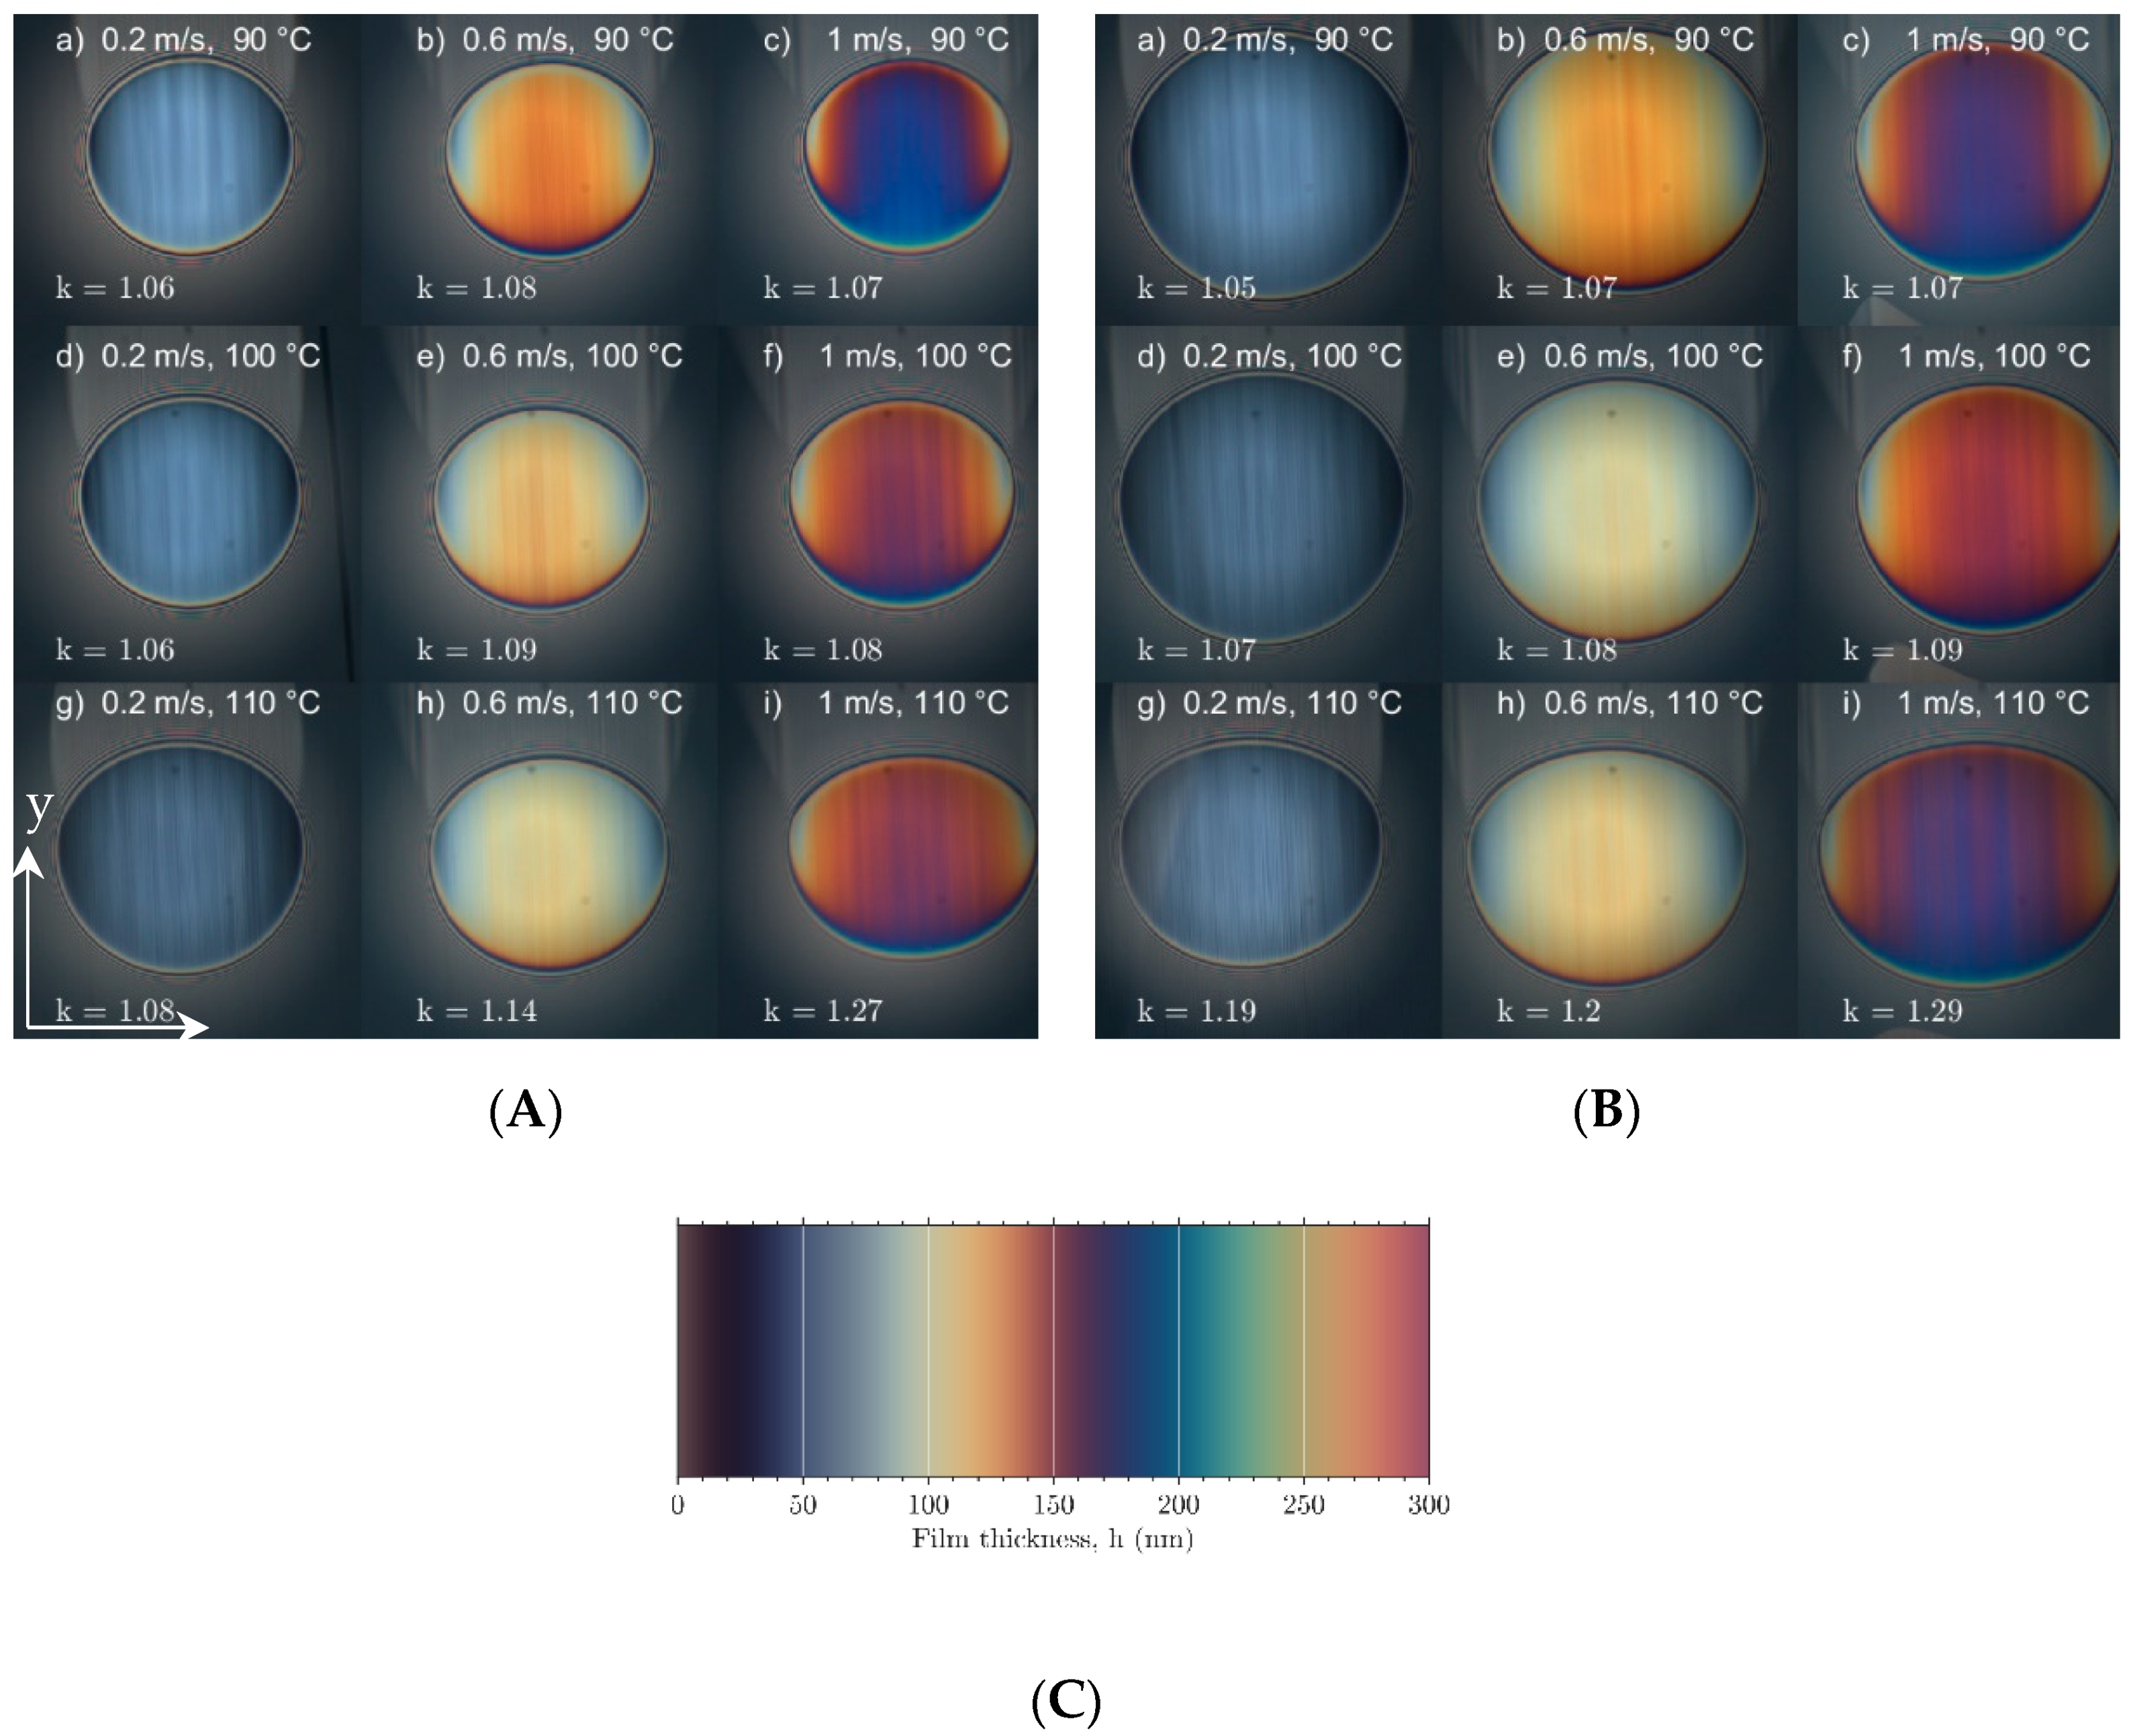
In the last step, interferograms of running contacts were post-processed, the variations of contact geometry were evaluated in respect to the applied load W and inlet temperature T, and the most important influences were identified and summarized. Evolution of contact geometry is illustrated by interferograms of running contacts in Figure 7A for load W = 20 N, and in Figure 7B for load W = 50 N, respectively. Each figure represents the influence of inlet temperature T (in vertical direction), entrainment speed U (in horizontal direction), and load W separates Figure 7 where some of mentioned effects conflict with each other. Figure 7C represents an assignment of film thickness to the color spectrum.
From Figure 7A, it is evident how the contact is deformed, and, at the same time, it is enlarged in respect to the increasing inlet temperature (vertical direction). Ellipticity of initially circular contact (k = 1) gradually increases with inlet temperature T. This was observed as shortening of contact in the direction of entrainment speed U (y-axis) and, simultaneously, the contact extension in perpendicular direction to the entrainment speed (x-axis). Results showed that the entrainment speed contributes to the increase of k only at 110 °C, while, at lower temperatures, ellipticity was almost constant. This change is most noticeable in the last row of Figure 7A, where, apart from the temperature, an increase of entrainment speed U causes gradual deformation from the initially circular to wide elliptical contact.
At higher loads (W = 50 N), see Figure 7B, results were partially different. It is interesting that, below Tg, the behavior of contact was very similar to previous results, but after the inlet temperature exceeded Tg, the contact was reduced in both axes and the ellipticity of contact rapidly increased up to k = 1.3. Below Tg, an increase of entrainment speed U led to a reduction of contact size in both axes; however, above Tg, the increase of entrainment speed caused the enlargement of contact size, see Figure 7B.
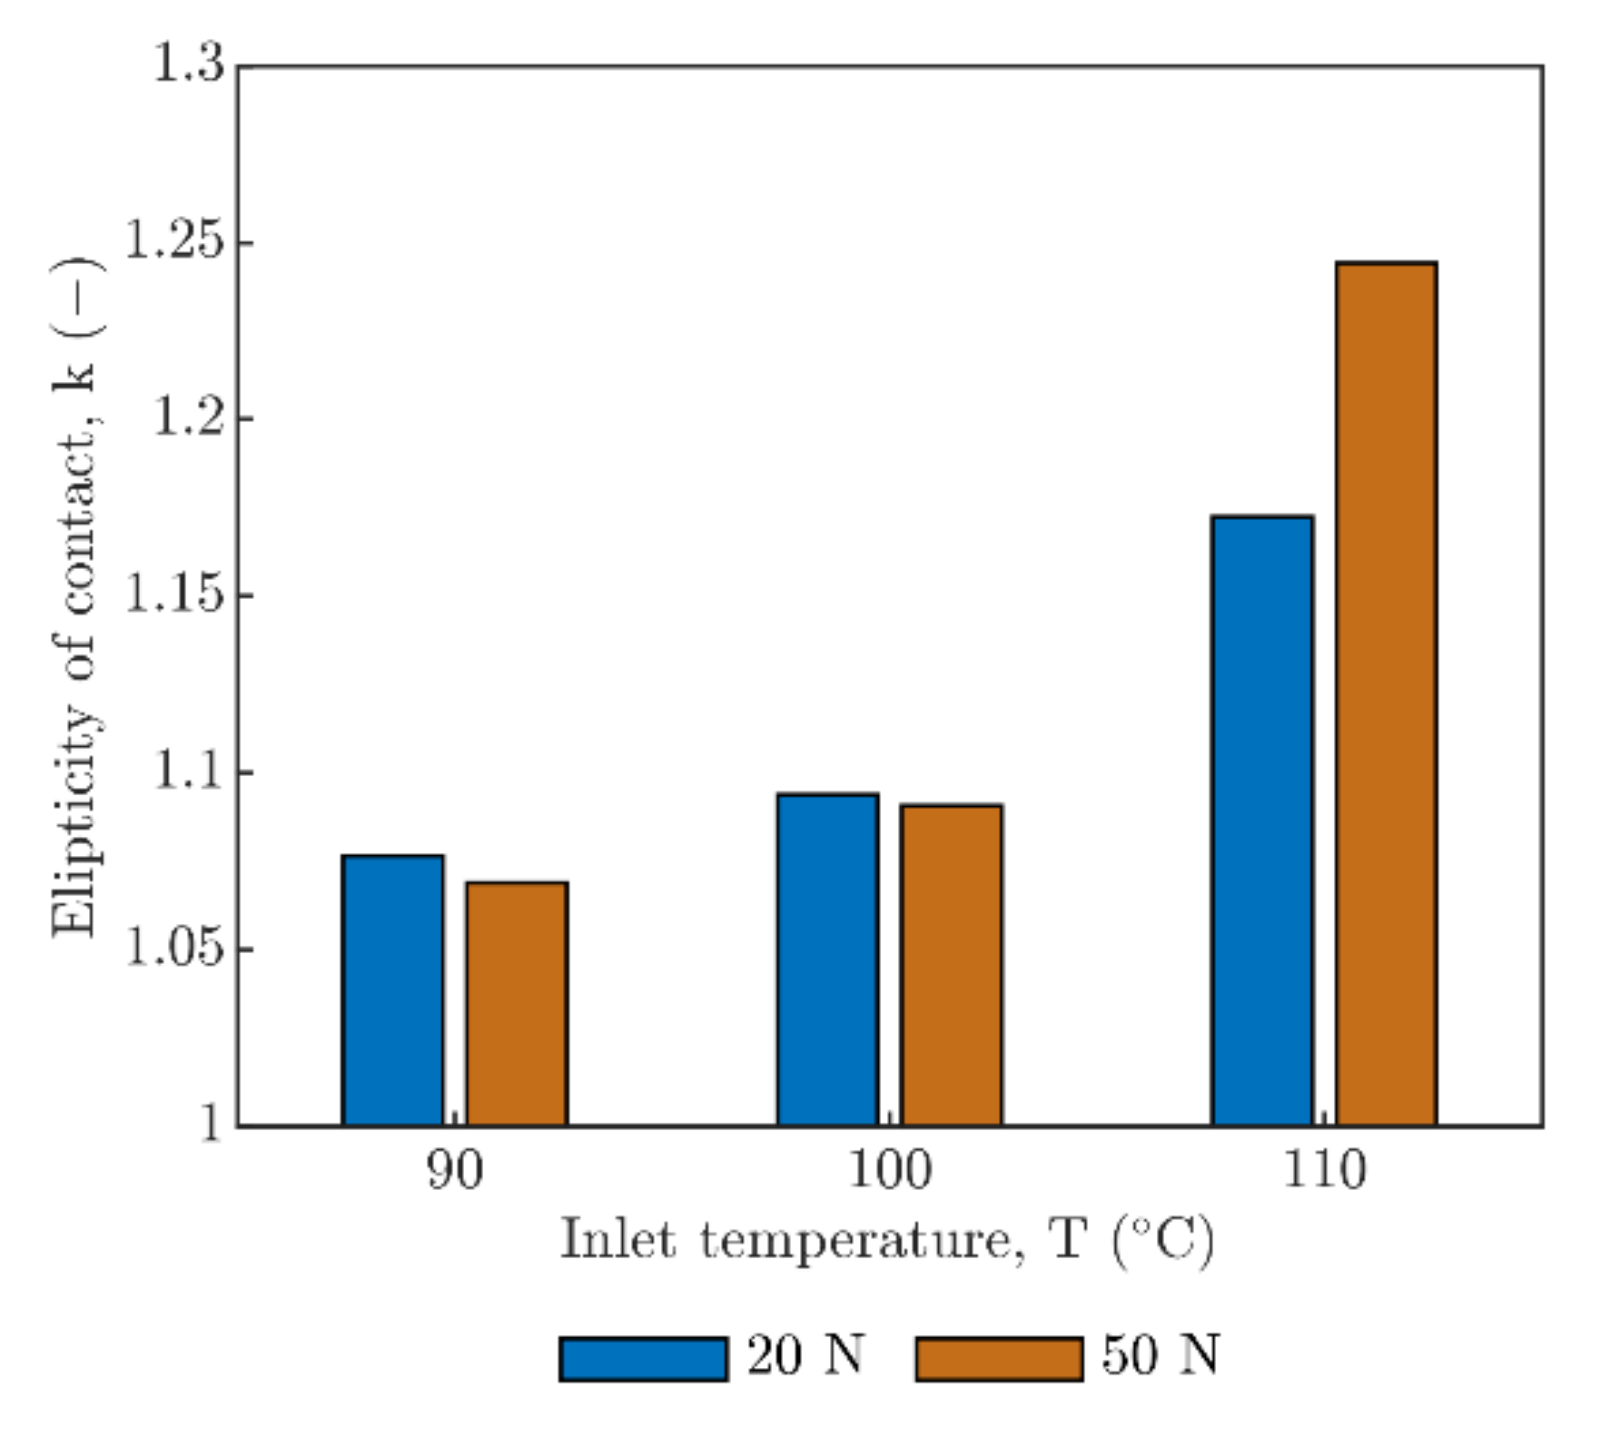
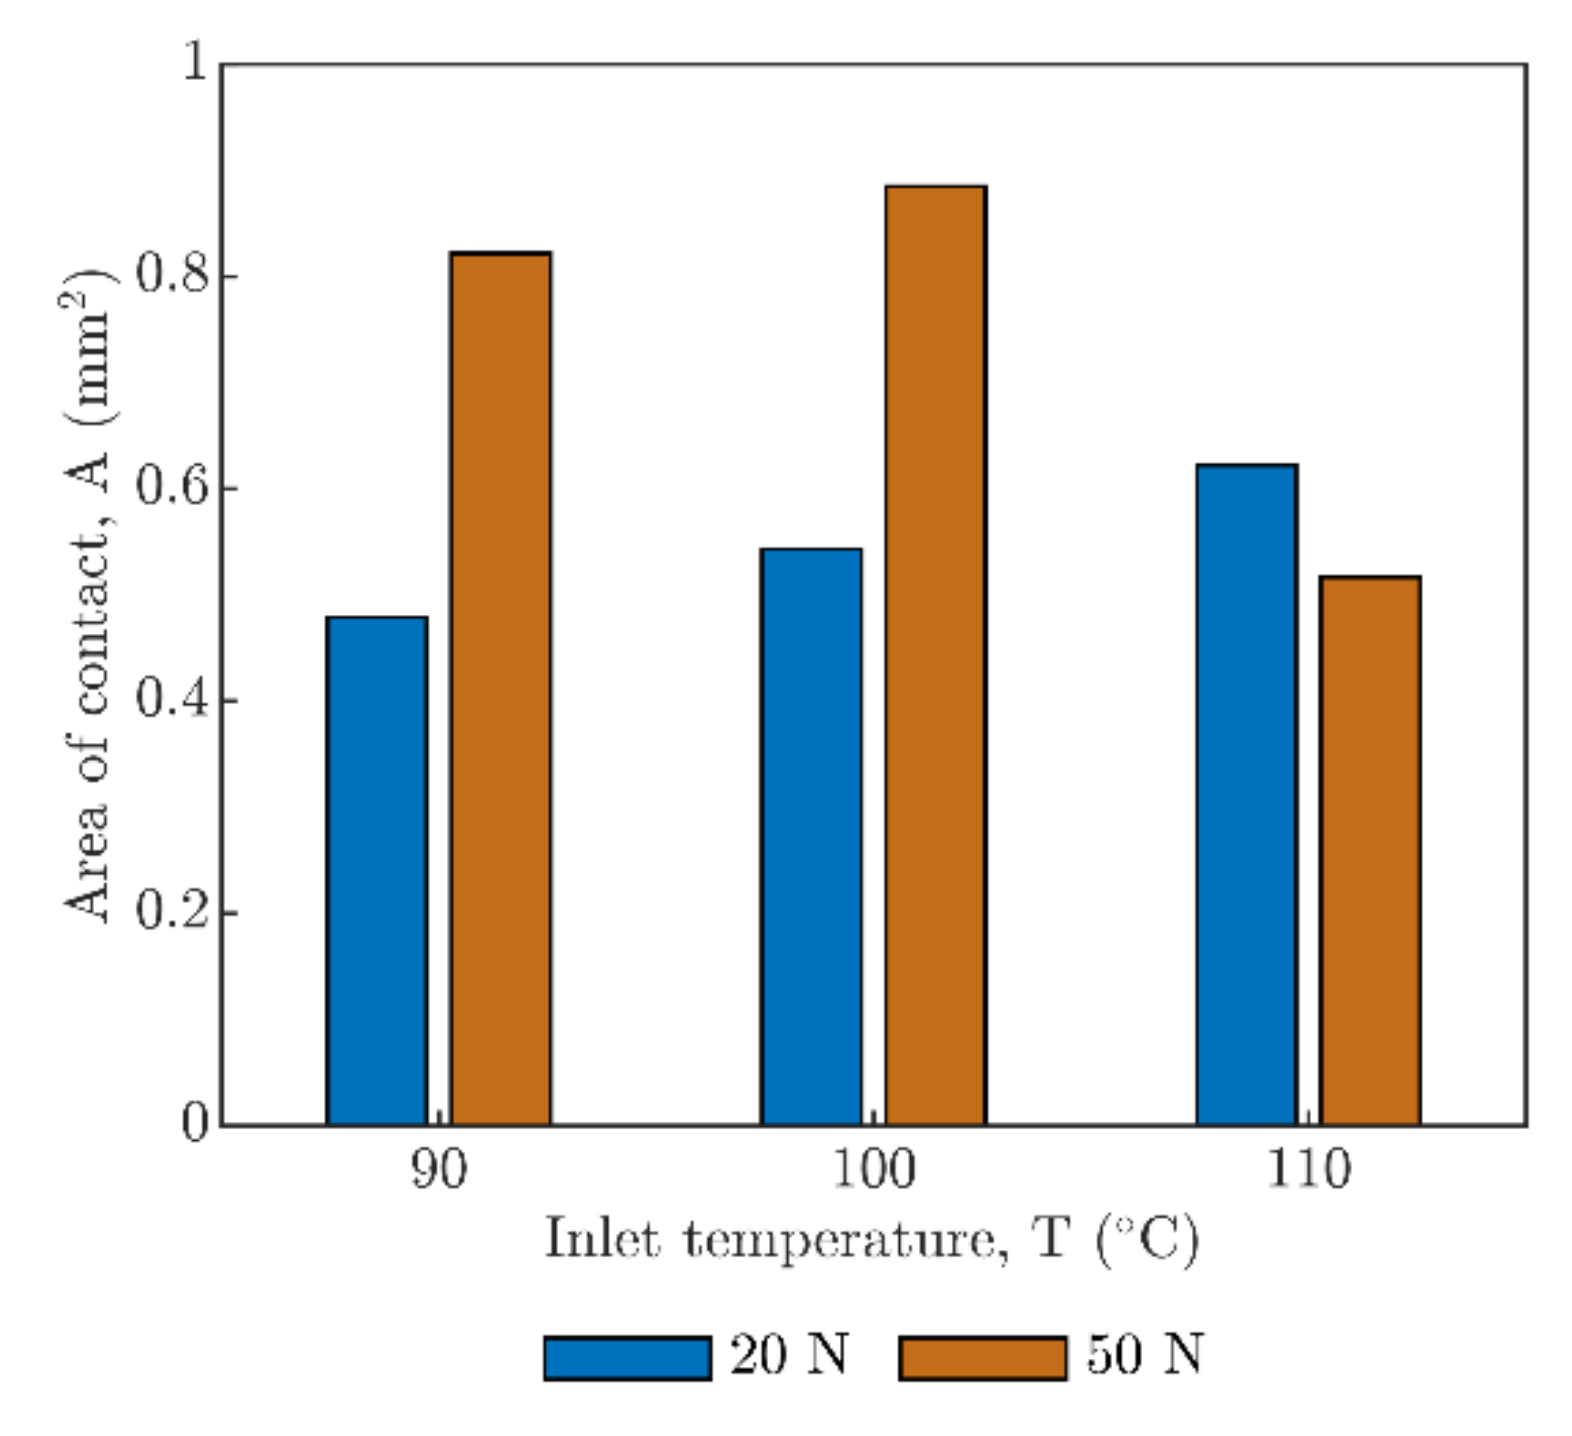
The results summarized in Figure 8 and Figure 9 represent mean values of ellipticity of contact k and the size of area of contact A at different temperatures and loads calculated from the whole range of entrainment speeds. The results in Figure 8 once again confirm the overall rising trend where there is an increase in ellipticity due to dominant influence of temperature, especially below Tg and mostly regardless of entrainment speed and the load. This is in contrast with the area of contact A, where load dependence is evident. After the inlet temperature T exceeds Tg, the influence of load is also visible. For higher load 50 N, the ellipticity increases in contrast to the contact area which is reduced (see Figure 9), probably as a consequence of viscoelastic deformation of PMMA. This was different for lower load 20 N where both the contact area A and the ellipticity k increased with the inlet temperature.
4. Discussion
Separation of contact surfaces by film thickness is especially important in the case of soft contacts where the lubricant prevents not only a direct interaction of surface asperities and, thus, the reduction of friction, but it also dissipates heat from the contact region. This helps to avoid the change of mechanical properties of polymer and, simultaneously, ensures the operation of the contact in fully flooded condition in soft EHL regime where load of contact is carried by lubrication film that elastically deforms contact surfaces. Nevertheless, lubrication of polymers is influenced by viscoelastic deformation of soft material as result of operating conditions that are not fully implemented in the classical EHL theory.
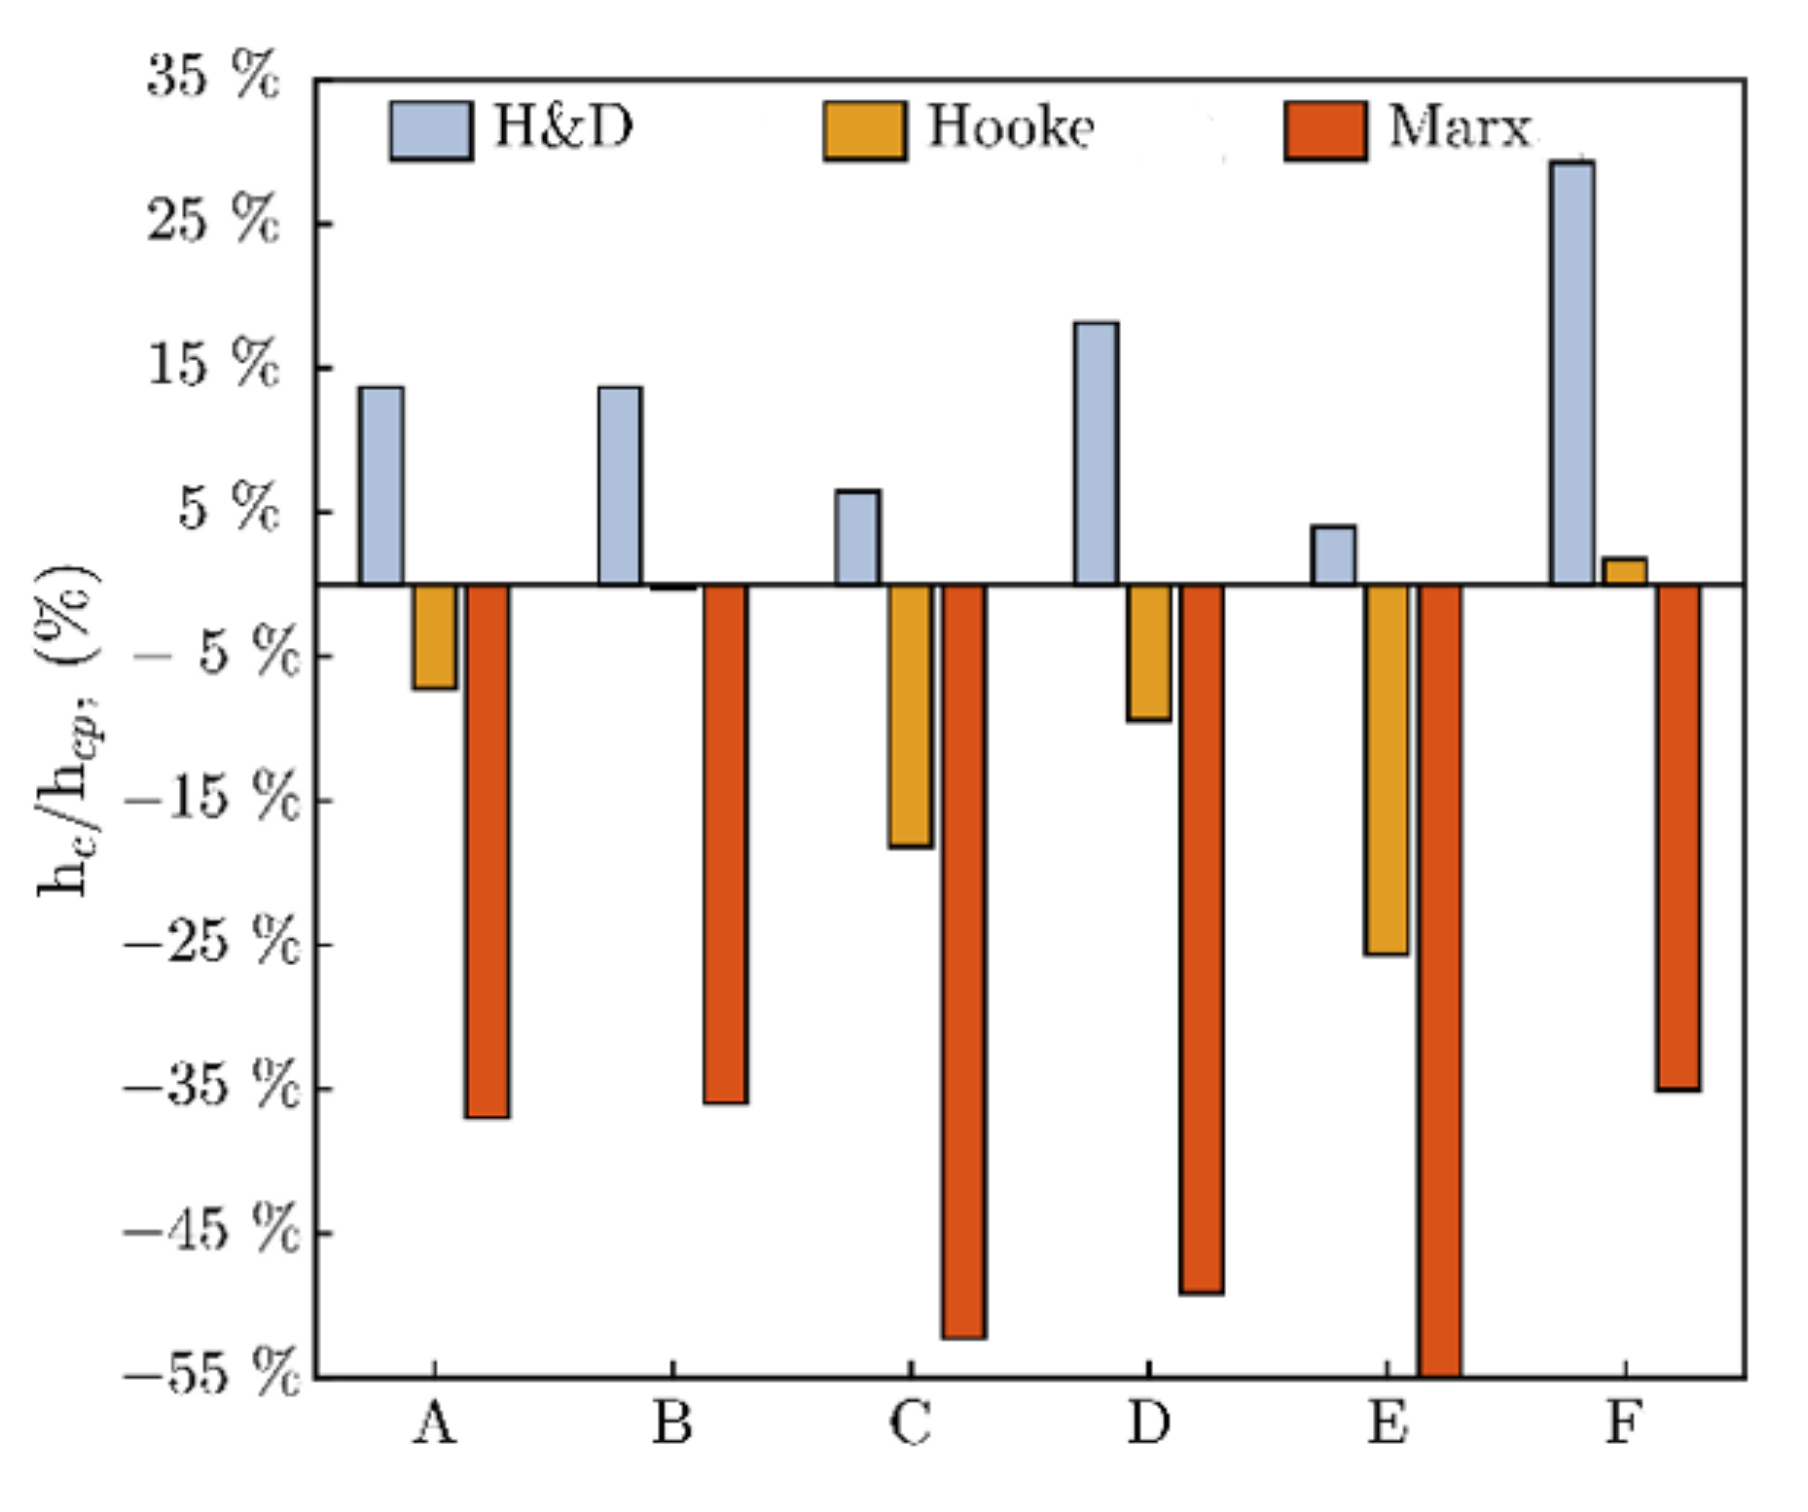
Film thickness data were evaluated and compared with several soft EHL prediction models [19,20,28] for circular contacts (k = 1), as demonstrated in Figure 10 by ratio hc/hcp. Furthermore, these deviations are exactly stated in Table A1 (Appendix A) for individual experiments (A–F). Good agreement was observed for the Hamrock and Dowson (H&D) model [19], especially below the glass-transition temperature Tg, where the mean deviation from experimental central film thickness hc does not exceed 15%; however, above Tg, it is completely different and deviation reaches up to 25%. A similar deviation, but showing negative values (where the prediction was higher than the experiment), was observed in Hooke’s prediction model [20]. Unfortunately, a significant deviation of central film thickness from the Marx’s model [28] was recorded, see Figure 10.
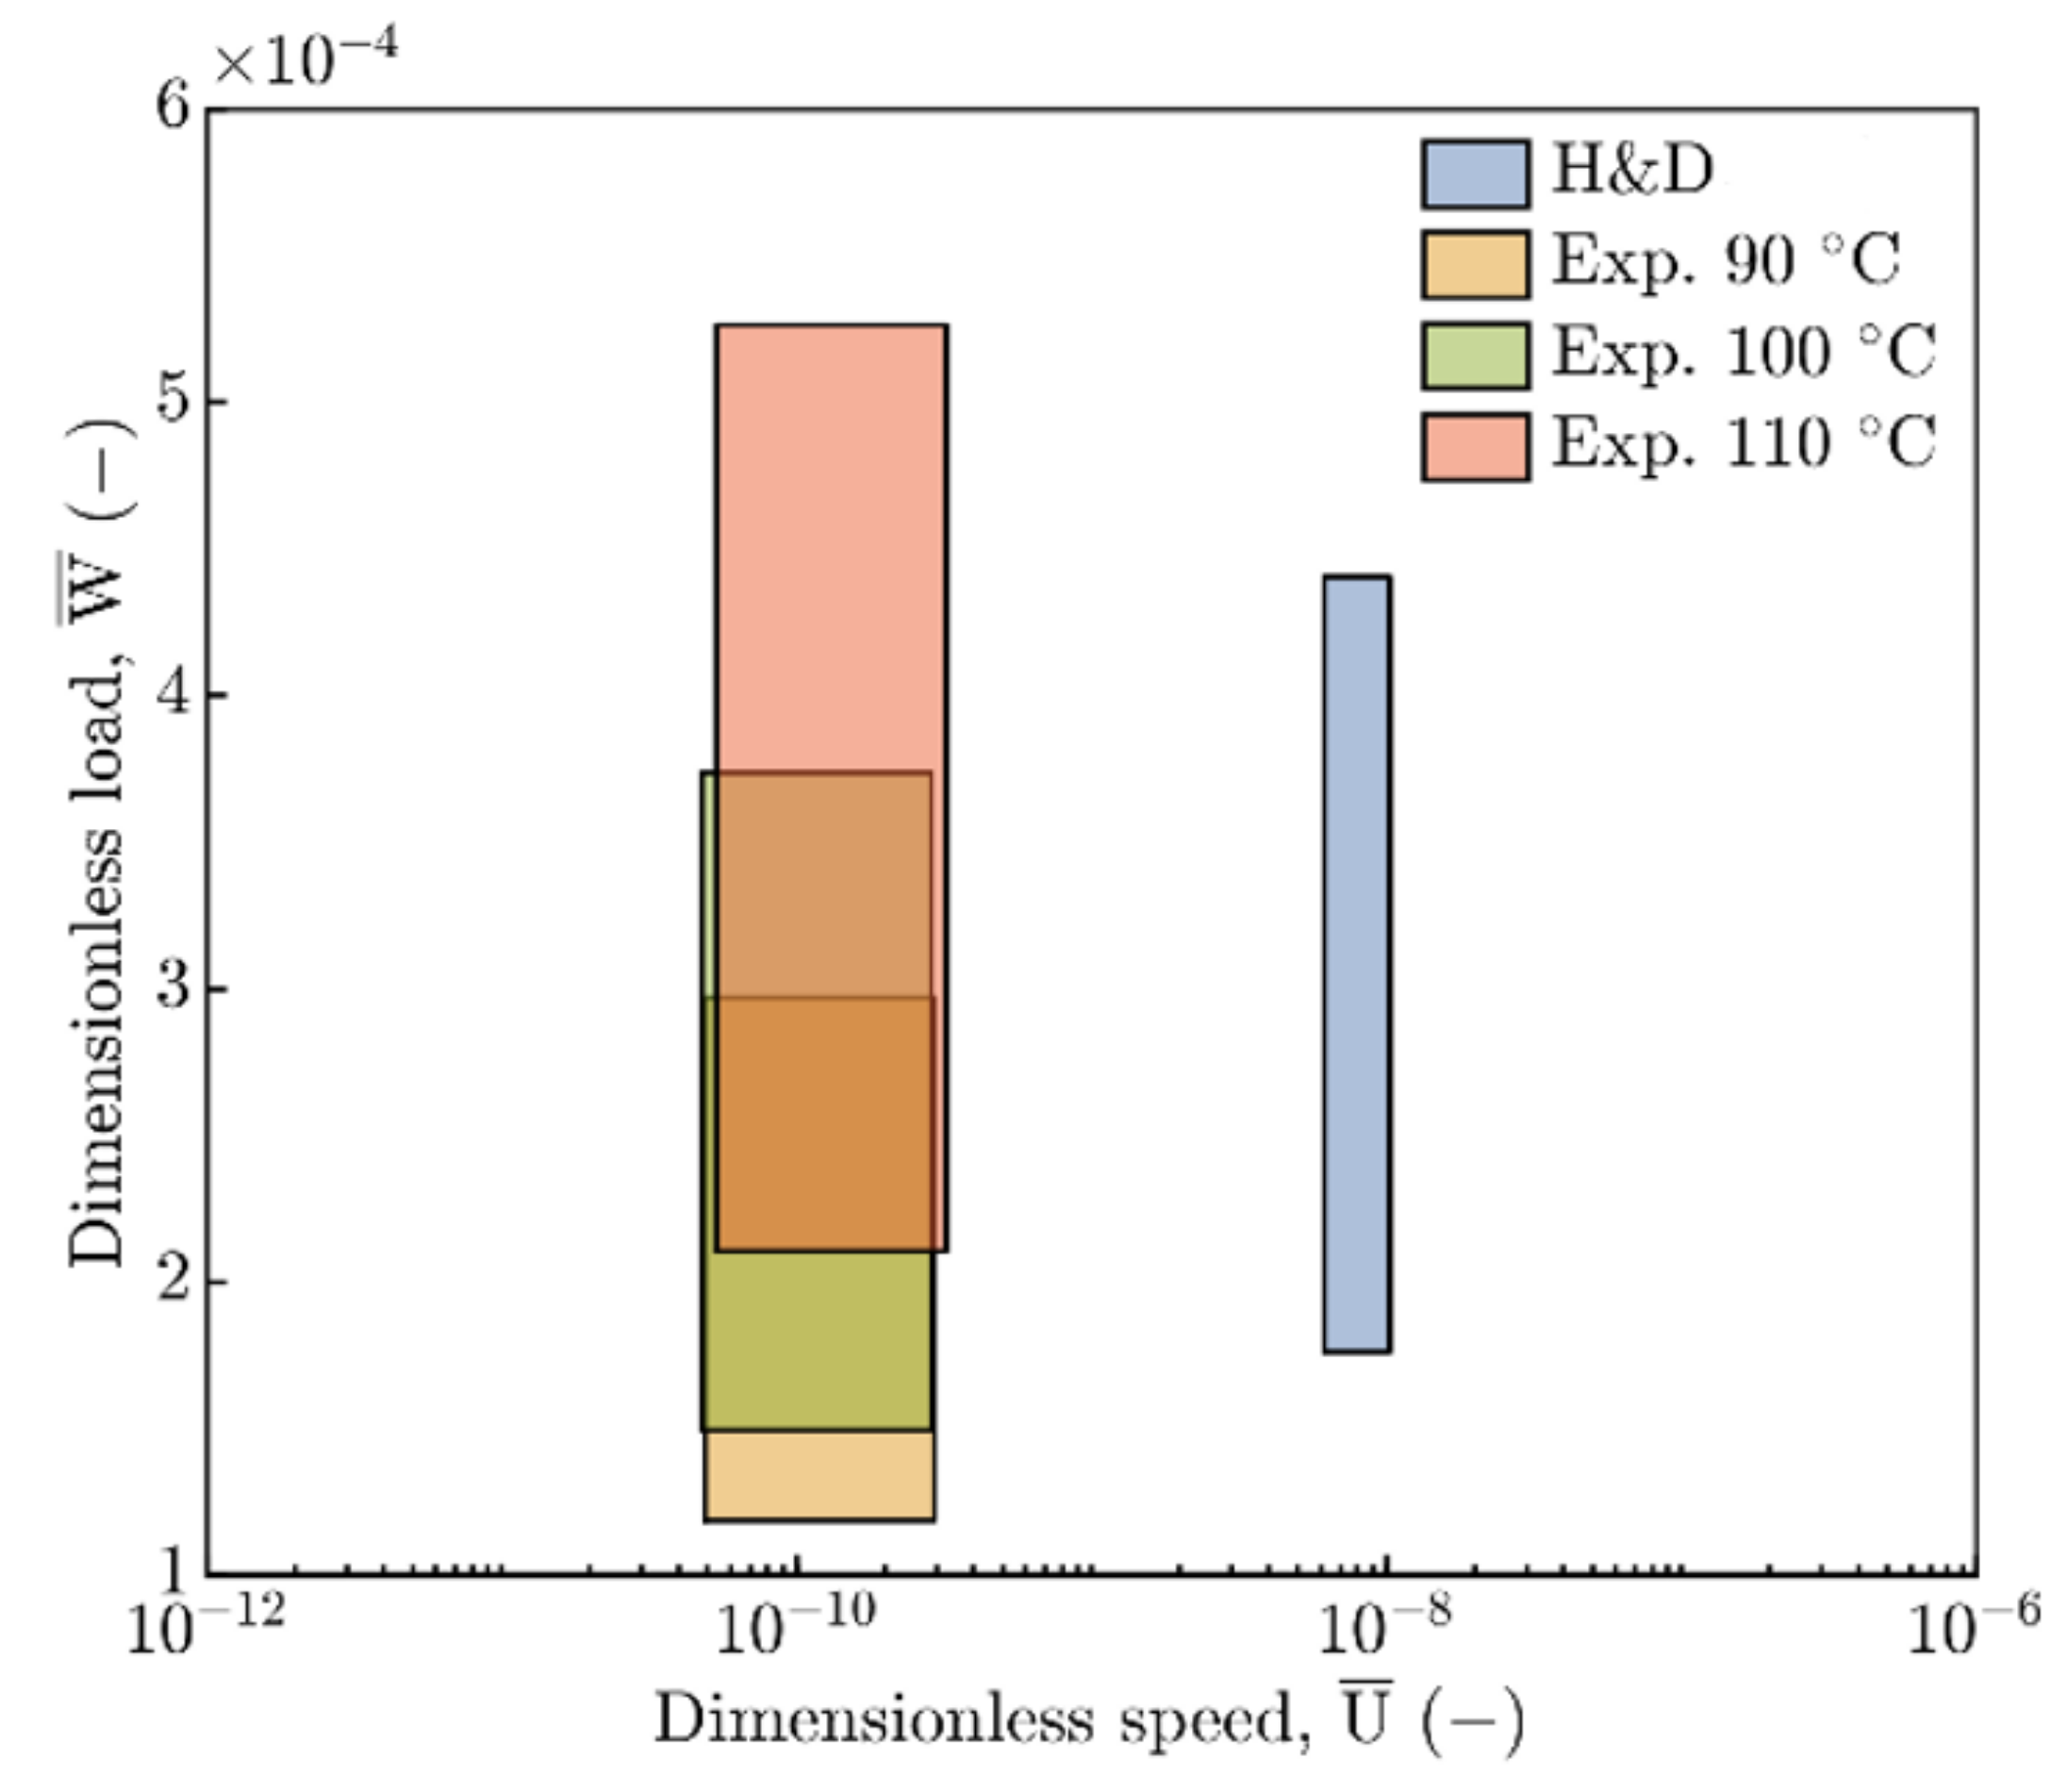
Figure 11 illustrates experimental conditions compared to the interval where the H&D prediction model [19] was derived. Although these values of dimensionless load are very similar, the range of dimensionless speed is significantly different, which could be one of possible justifications of central film thickness hc deviation. Figure 11 also demonstrates the importance of the dimensionless load , which, as inlet temperature T increases, affects film thickness more significantly.
Minimum film thickness hm was always localized on the side lobes of horseshoe shape constriction of the contact, which is typical for hard EHL contacts [32]. This is in contradiction to the Hooke’s prediction model [20], where the relocation of minimum film thickness hm from the exit into side lobes of the contact was expected with increasing entrainment speed U, and decreasing load W. However, good agreement was observed for Hooke’s prediction model [20] for the minimum film thickness at the exit of the contact hm,exit, in the case minimum film thickness on the side lobes hm,side it was exactly opposite, which led to large deviations from the Hooke’s model [20].
Moreover, it is interesting to see how the effect of rising temperature contributes to the difference between hm,exit and hm,side, where, at 90 °C, minimum thicknesses are very similar; however, above this temperature, the difference significantly increases and it applies that hm,exit >> hm,side. At the same time, the results indicate that the relocation of the minimum film thickness from the exit to inlet of the contact with an increase of entrainment speed U was not achieved due to viscoelastic behavior described by Putignano et al. [43].
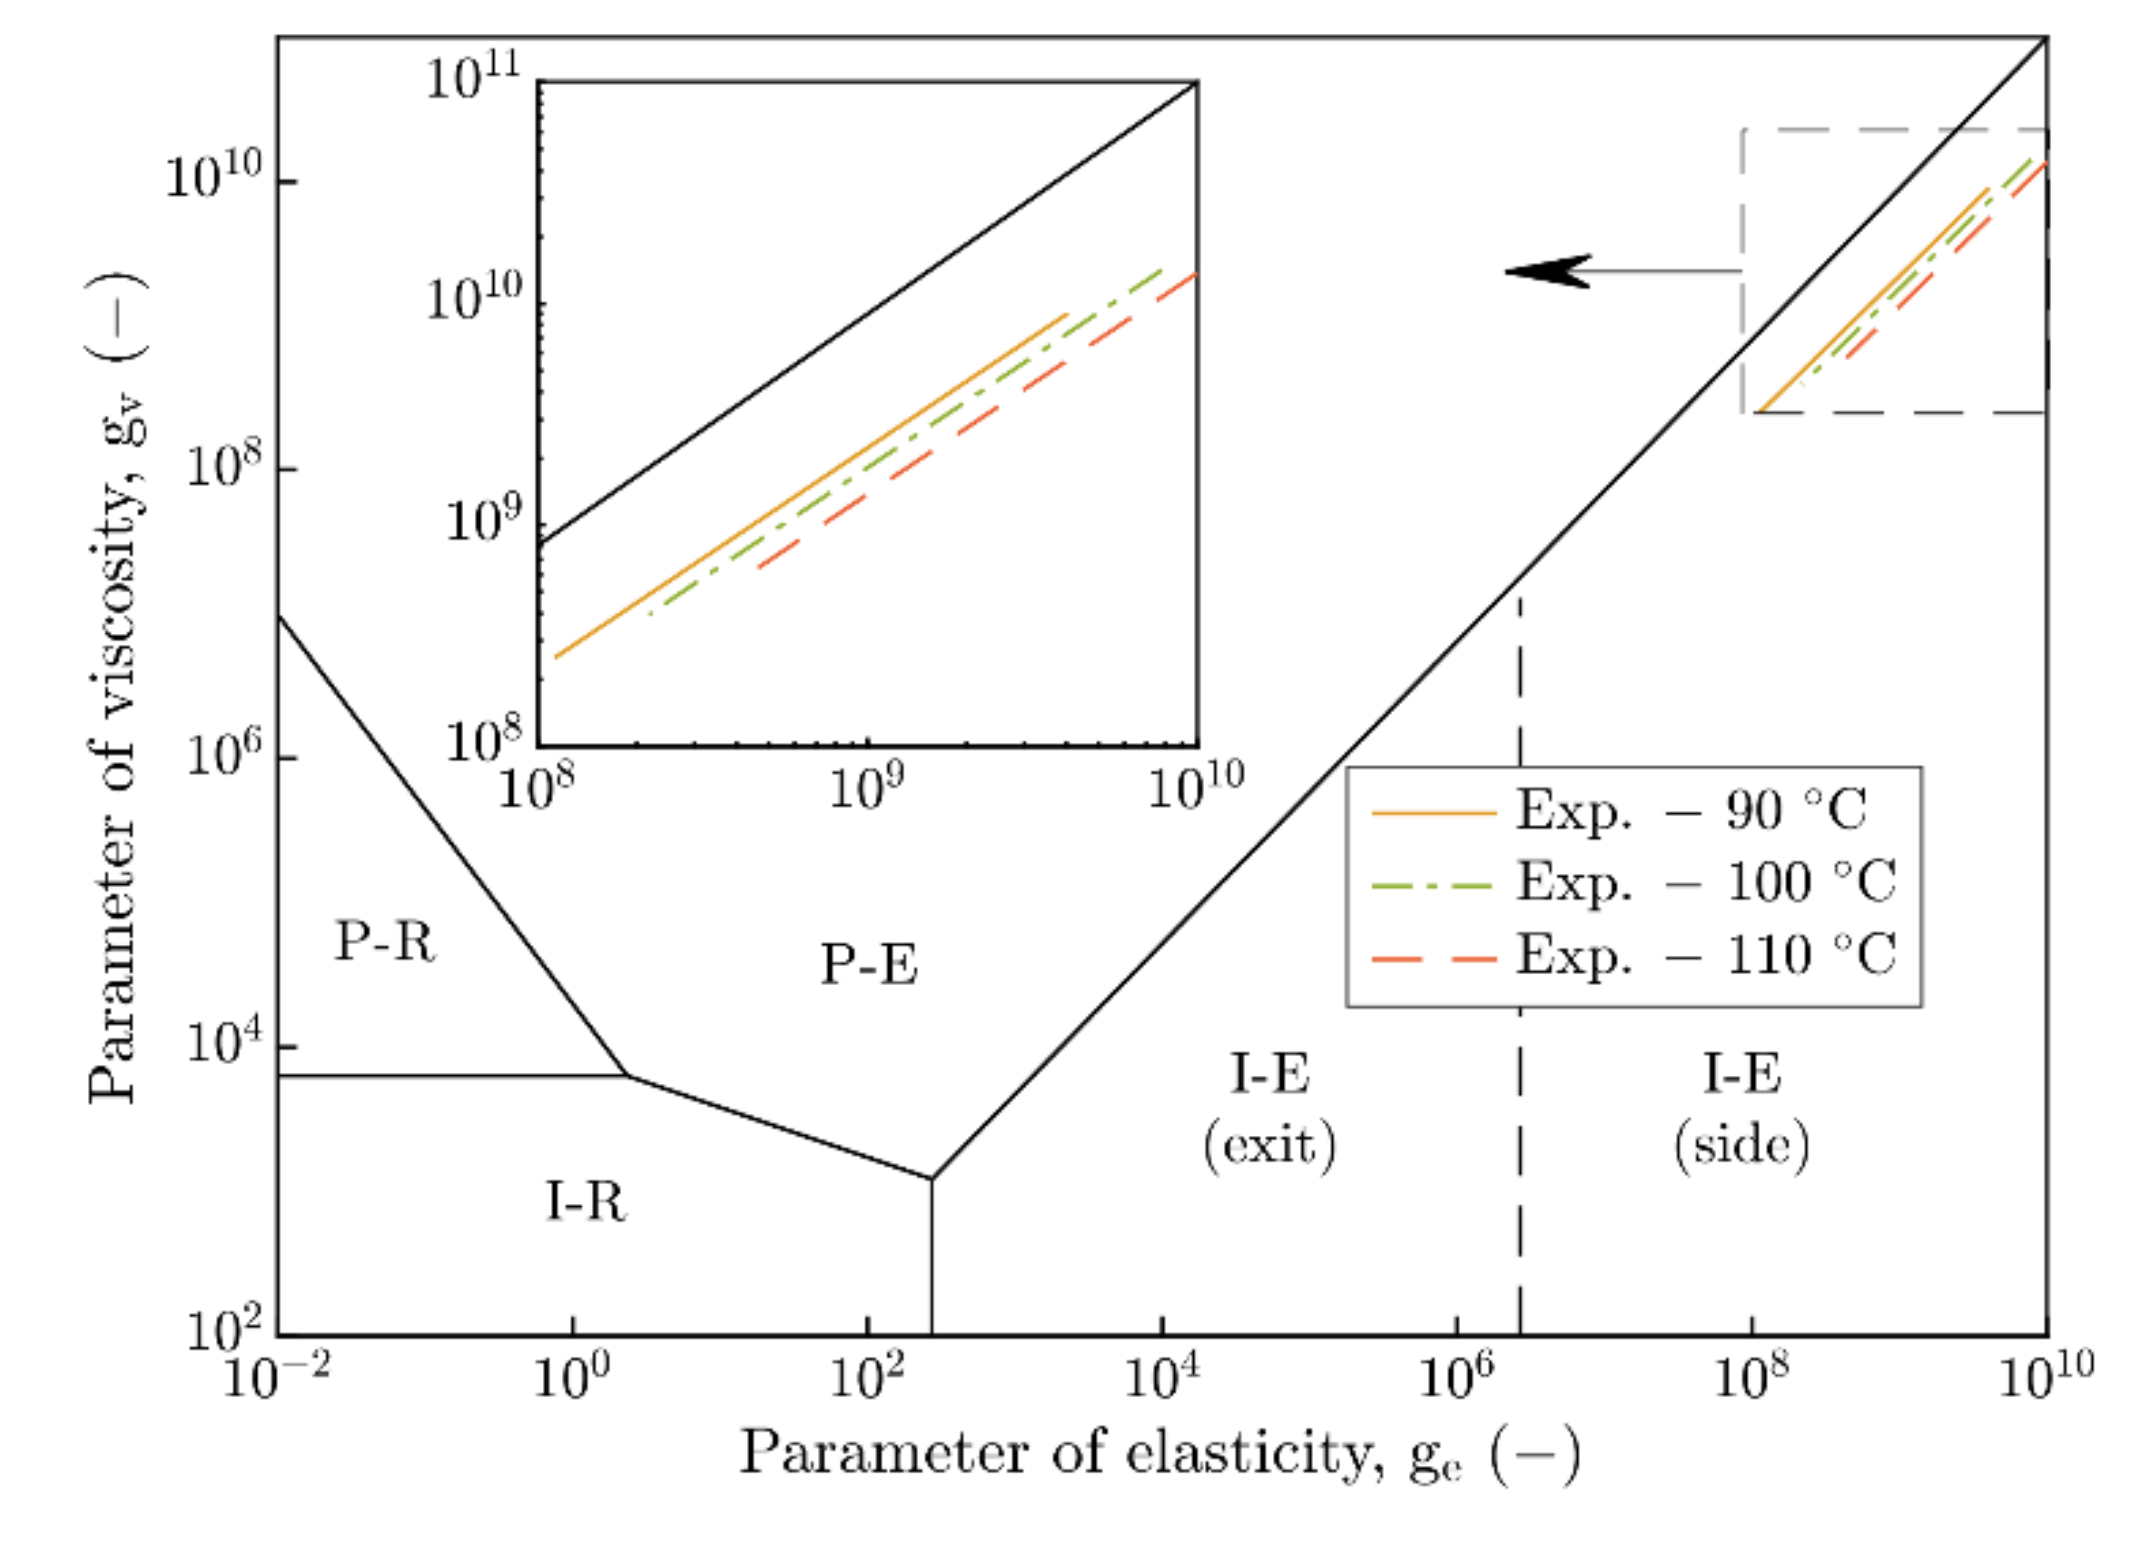
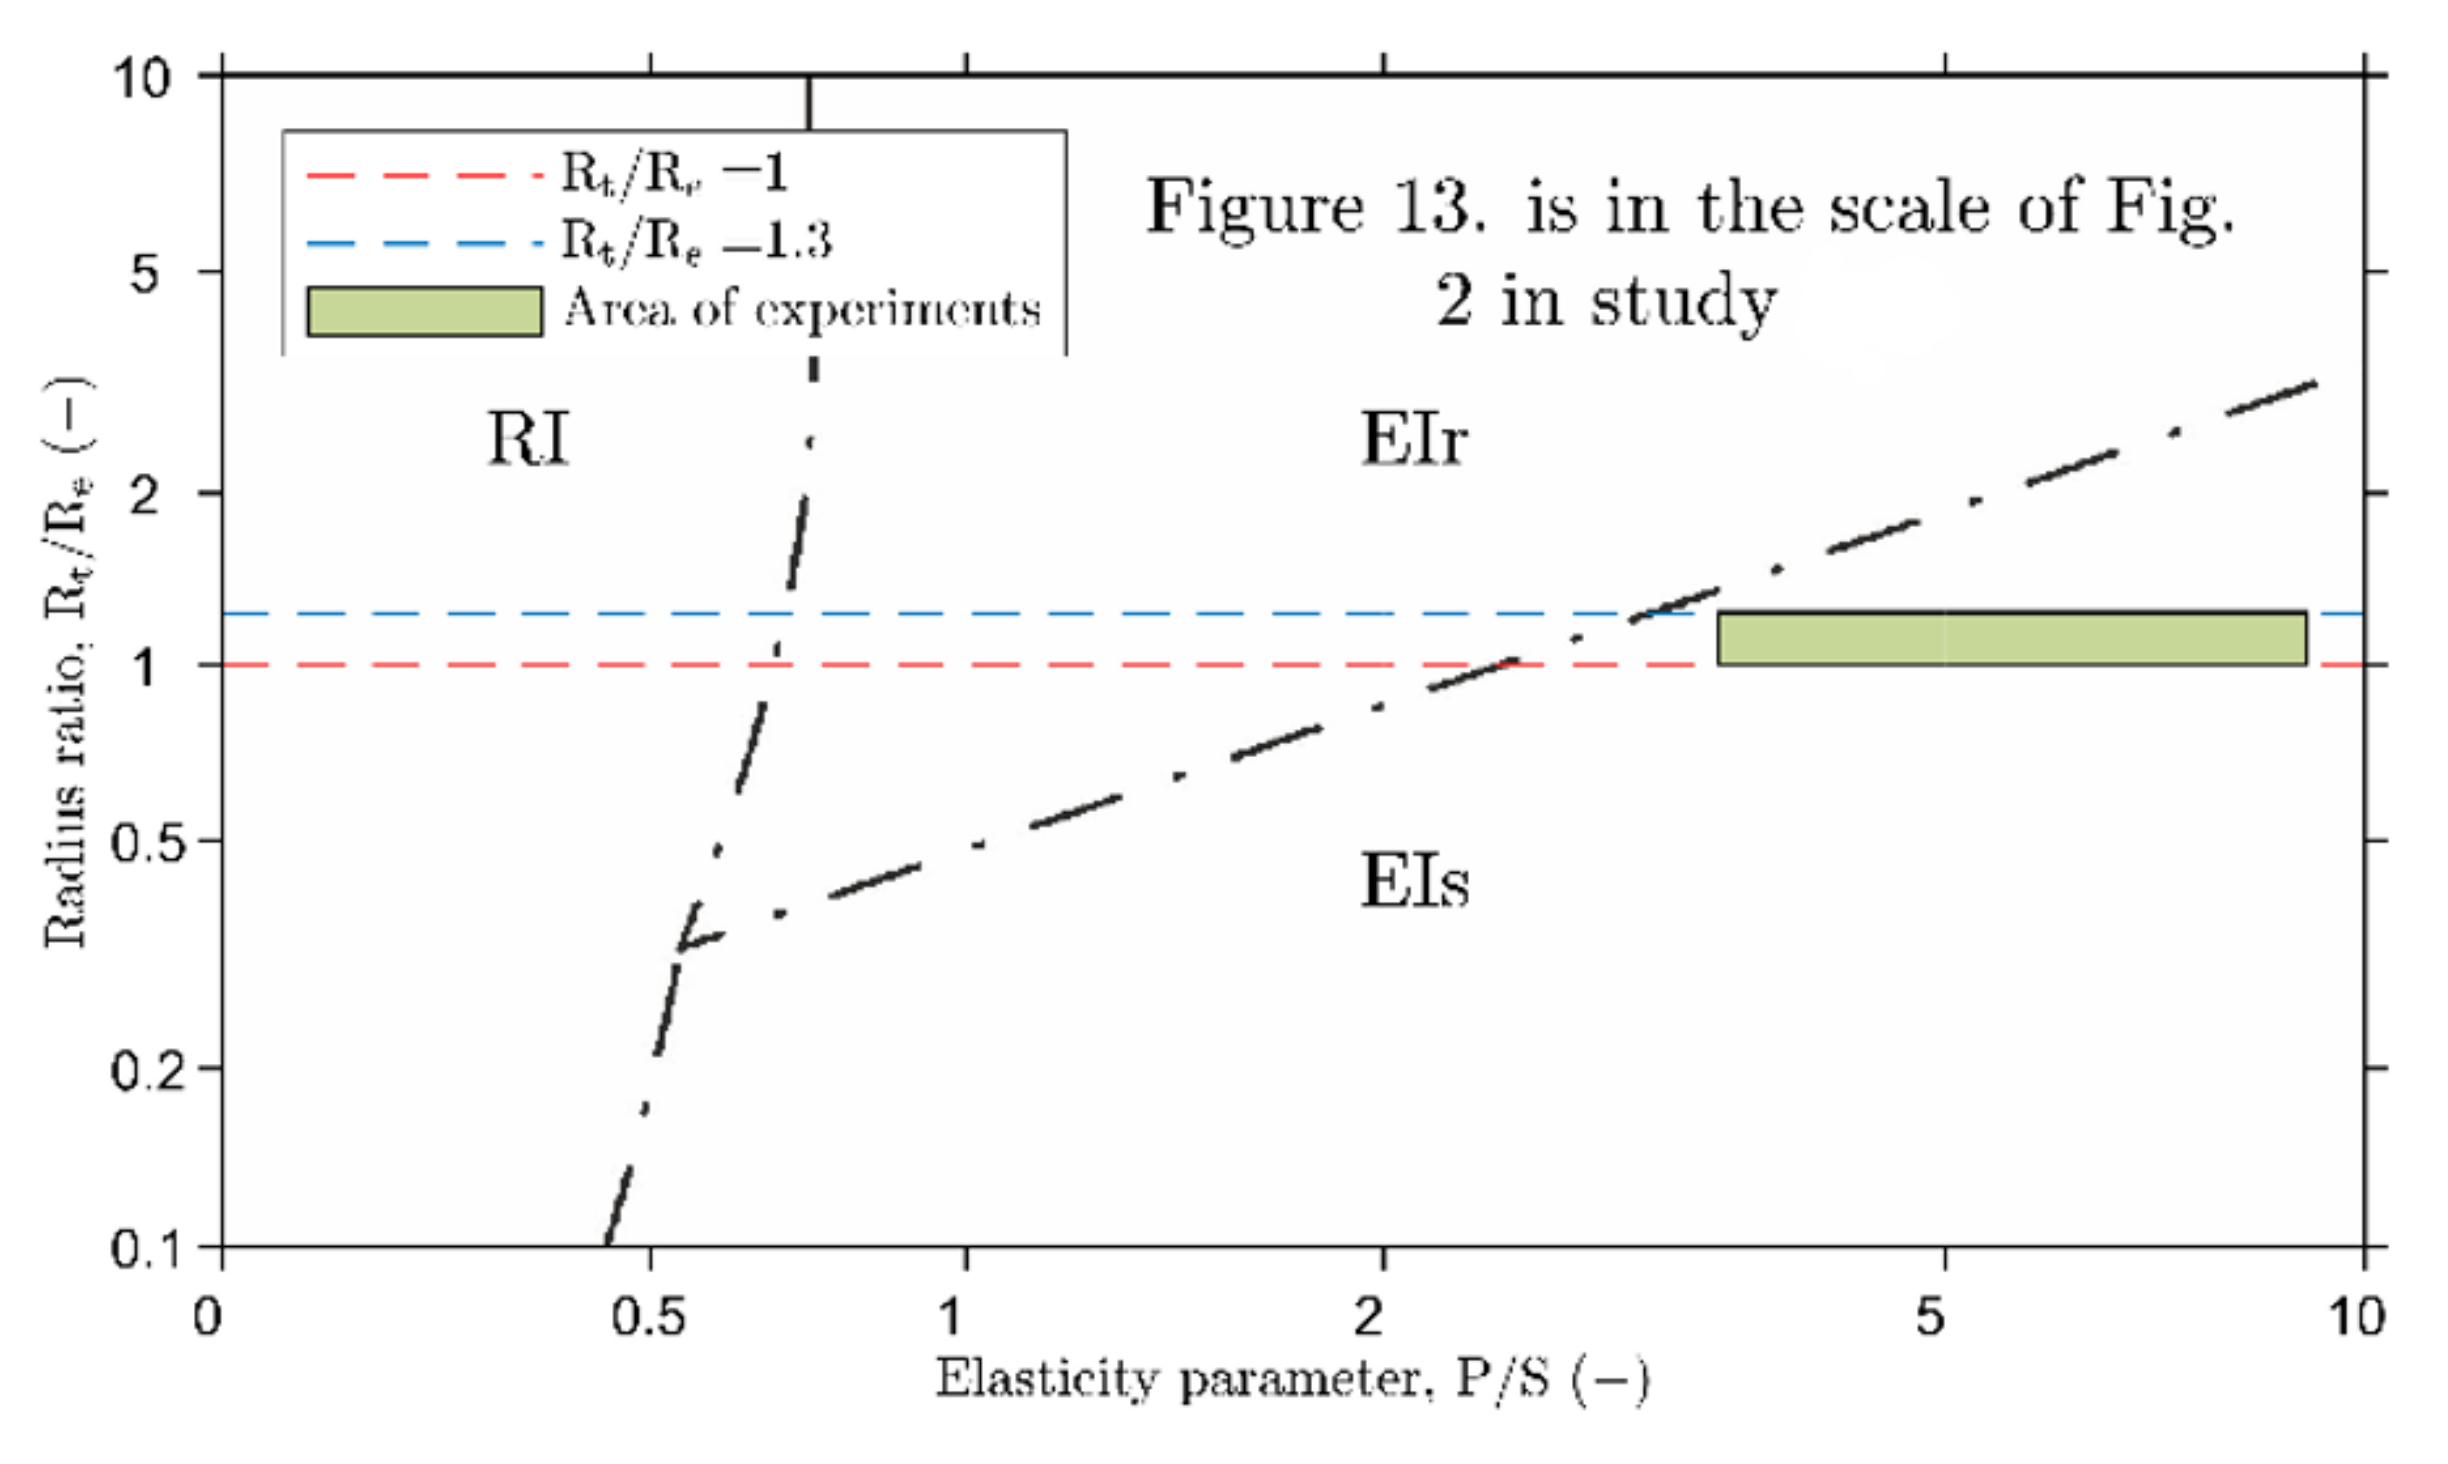
Nevertheless, the contact was always operated in fully flooded conditions, and minimum film thickness hm was several times higher than the RMS roughness Rq, which implicates the EHL lubrication. Individual regimes of elastohydrodynamic lubrication were defined by parameters of elasticity ge and viscosity gv in the EHL map, as was introduced by Johnson [13]. The EHL map with highlighted experimental conditions in Figure 12 confirms the assumption that the contact was operated in all experiments in Isoviscous-elastic regime (I-E) of elastohydrodynamic lubrication with minimum film thickness on side lobes of contact. Similarly, the operation area of soft EHL contacts was described by Hooke [20] via dimensionless Greenwood’s parameters of pressure P and speed S as Figure 13 shows. A ratio P/S between them represents the so-called elasticity parameter in the horizontal axis. The vertical axis is described by ratio Rt/Re that corresponds to the parameter of ellipticity k as was specified earlier. Figure 13 again confirms the operation of the contact in Isoviscous-elastic regime (I-E) of EHL with minimum film thickness hm,side on side lobes of horseshoe, similar to that described by Johnson’s map [13] in Figure 12.
The influence of load W exhibits very similar trends (see Figure 6a) up to Tg where central film thickness hc decreases with increasing load as was experimentally confirmed in [26,28] for the temperature range up to 40 °C. However, this is in contradiction to the observed results after the temperature exceeds Tg, where the increase of load leads to the growth of central film thickness hc, as was demonstrated in Figure 6b. Hence, a described deviation from soft EHL theory could be connected to the effects of temperature and load on viscoelastic deformation of the contact region which has not been a subject of interest in soft EHL theory [13,19].
In respect to the EHL theory [13,15,19,20,23], the temperature, on the one hand, causes a decrease of dynamic viscosity of the lubricant and thus of film thickness in the contact region. On the other hand, the temperature causes a decrease of mechanical properties of polymer, especially of the Young’s modulus and, as consequence, the increase of lubricant film thickness. The latter dependence has so far been of predominant interest of numerical and experimental studies covering the issue of rheology of polymers [43,44,45,46,47] rather than the studies directly focusing on lubrication of soft EHL contacts [26,28,29].
From Figure 1, it is evident that the PMMA disc is forced down on the steel ball by normal load W, which results in normal stress. An unusual phenomenon was observed in Figure 3, where the change of static contact size at constant load (W = 50 N) and rising temperature led only to a small change of its dimensions. This could be considered a part of the viscoelastic behavior, especially after the temperature exceeds Tg (for 110 °C). Furthermore, this is demonstrated by the irregular shape of the initially circular static contact in Figure 3f, which is dimensionally smaller than for W = 20 N in Figure 3c at the same temperature. Nevertheless, for W = 20 N, a gradual increase of contact size with inlet temperature was manifested.
Good agreement was observed in Figure 4 in comparison to the Young’s modulus E1 evaluated from the Hertzian theory based on the contact size from interferograms, and DMA experimental results by Boubimba et al. [42]. This may be confirmed by sufficient suitability of this evaluation approach, at least, in area of the linear viscoelasticity (up to Tg). Quantitative deviation (about 18%) in values against the results of Boumbimba et al. [42] could be related to different values of material properties of PMMA in dependence on the material composition of polymer given by the manufacturer. This was also confirmed by the results of other authors, where, for example, Chaudhri et al. [48] and Liu et al. [49] stated that the Young’s modulus of PMMA of E = 3.0 GPa and E = 3.4 GPa for the ambient temperature, respectively, against the nearly E1 ≈ 3.2 GPa reported in this study.
The influence of U and W contributed to the manifestation of viscoelastic behavior in a different way; however, this also leads to the deformation of the originally circular contact as was evident from Figure 7A,B. Only slight changes of ellipticity of contact were observed across the whole entrainment speed interval U (0.2–1.2 m/s) for 90 °C and 100 °C. This is in contradiction to the results from the viscoelastic model (without temperature effect) by Putignano et al. [43], where deformation of contact (in direction of U) is expected as result of the increase of entrainment speed.
However, for 110 °C, after Tg, strong dependence on load W was observed, which causes a gradual increase in ellipticity up to k = 1.3 with entrainment speed U, see interferograms (g-i) in Figure 7A,B. Nevertheless, a strong impact of load W also affects the area of contact A. While with lower loads, there is an evident decrease in the size of A in the middle range (from 500 to 900 mm/s) of entrainment speeds, increase of load in dependence on temperature leads to unclear development in the size of the contact area A with increasing entrainment speed. This generally correlates with studies [50,51] which attribute the described phenomenon to an increase in stiffness with entrainment speed as result of viscoelastic development of elastic ES and viscous EL components of Young’s modulus E near the glass-transition temperature. This seems to confirm the presumption of a dominant contribution of temperature involved in the present study.
Figure 8 and Figure 9 statistically summarize the overall trends in the development of contact geometry by k and A based on the realized experiments across the entire temperature, load, and entrainment speed range. Ellipticity k (Rx/Ry) of running contacts in Figure 8 gradually increases with inlet temperature and load from 1.08 at 90 °C to 1.3 at 110 °C, which leads to the beginning of transformation from circular (k = 1) contact to wide elliptical contact (k > 1). Hence, Figure 7 and Figure 8 demonstrate predominant anisotropic deformation of the contact in direction (x) perpendicular to the vector of entrainment speed.
The area of contact A, similar to ellipticity k, increases with inlet temperature for both loads but only for 90 °C and 100 °C, as shown in Figure 9. After the inlet temperature exceeds Tg of PMMA, strong dependence on load and unexpected decrease of the contract area was recorded as shown in Figure 3 for static contacts as well as in Figure 9 for running contacts. Figure 3 shows a possible effect of thermal softening of PMMA polymer when the area of static contact gradually increases with temperature from 90 °C to 110 °C for both loads, but differently. Difference in strain rate is evident in comparison of points a–c (W = 20 N) and d–f (W = 50 N) in that figure.
At the same time, this may indicate the exceeding of the PMMA yield strength after which the material exhibits strain softening or hardening depending on temperature, pressure (load), and strain rate. [43,44,45,46,47]. Hence, thermal softening and softening/hardening of strain act jointly or vice versa [46]. Moreover, it may be a response for the results in Figure 8 which underline the overall trend of reduced contact area over the entire range of entrainment speed at 110 °C and 50 N due to hardening of strain [45]. Nevertheless, this is in direct conflict with the presumption that, if Tg is exceeded, the strain softening/hardening is vanished [45]. Based on this, the contact probably operates on the glass-transition interval.
As temperature increases, PMMA polymer stiffness decreases in the tension—compression stress asymmetric relationship where the effect of compressive stress is more significant than that of the tensile stress as was referred to in [43,44,45,46,47]. At the same time, compressive stress causes a higher deformation of PMMA polymer which results in the initialization of cracks [52]. After the PMMA disc was removed from the optical tribometer, these cracks were easily visible in the cross-section near the outside radius of disc. However, the plastic deformation of the disc surface was not noticeable after optical measurement of surface texture. Inverse to stiffness is the compliance of polymer, which is maximal near glass-transition temperature region, where alfa—relaxation of PMMA polymer—occurs [47].
5. Conclusions
In this study, the optical chromatic interferometry [30] method has been applied to investigate the development of central and minimum film thickness of compliant contacts near glass-transition temperature of PMMA polymer. Results and discussion are as follows:
- No difference was observed in the change of the position of the minimum thickness hm suggested by Hooke [20] as well as transition of hm from the exit to the inlet of the contact with an increase of entrainment speed as a result of phenomena of viscoelastic behavior of PMMA described by Putignano et al. [43];
- Above the glass-transition temperature Tg of PMMA, central film thickness increases with load W and, at the same time, it differs even more from prediction models [19,20] with increase of entrainment speed U. The possible explanation of this phenomenon is the transition from the linear to nonlinear region of viscoelasticity according to the observed step change in ellipticity k and contact area A above Tg;
- Ellipticity k and contact area A manifested a gradual increase hand by hand with increase of inlet temperature T and load W up to Tg. Above Tg, viscoelastic deformation occurs, where the contact becomes wide elliptical with k > 1, and to the reduction of contact area A with increasing load. The former could be attributed to the inlet temperature involved in the thermal softening of polymer. The latter could be described by load dependence where, after exceeding the PMMA yield strength, the material exhibits strain softening/hardening depending on temperature, pressure (load), and strain rate [43,44,45,46,47]. However, deviations of contact shape (ellipticity k and contact area A) are probably a result of combination of both effects.
Author Contributions
Conceptualization, J.K. and K.D.; Methodology, J.K.; Validation, J.K. and K.D.; Formal analysis, J.K. and K.D.; Investigation, J.K.; visualization, J.K. and K.D.; Writing—original draft preparation, J.K.; Supervision, I.K.; Project administration, M.H. All authors have read and agreed to the published version of the manuscript.
Funding
This research was funded by the Czech Science Foundation (GACR), grant number 18-26849J.
Institutional Review Board Statement
Not applicable.
Informed Consent Statement
Not applicable.
Data Availability Statement
The data concerned have been obtained through the research of the author and reported exclusively in this article.
Acknowledgments
The authors thank to our colleagues from Gear Research center (FZG) and Technical University Munich (TUM) in Germany for donation in providing the FVA3 reference lubricant for experiments.
Conflicts of Interest
The authors declare no conflict of interest. The funders had no role in the design of the study; in the collection, analyses, or interpretation of data; in the writing of the manuscript; or in the decision to publish the results.
Nomenclature
| A | Area of contact, (mm2) | |
| a | Semi-contact radius, (µm) | a3 = 3WR′/2E′ |
| CI, CII | Light beam I and II, (-) | |
| E | Young’s modulus, (GPa) | |
| E1, E2 | Young’s modulus of solid 1 and 2, (GPa) | |
| EL | Elastic part of E (Storage modulus), (MPa) | |
| ES | Viscous part of E (Loss modulus), (MPa) | |
| E′ | Reduced Young’s modulus, (GPa) | 2/E′ = (1 − υ12)/E1 + (1 − υ22)/E2 |
| Dimensionless parameter of material, (-) | ||
| ge | Parameter of elasticity, (-) | |
| gv | Parameter of viscosity, (-) | |
| hm | Minimum film thickness, (nm) | |
| hm,exit | Minimum film thickness at contact exit, (nm) | |
| hm,side | Minimum film thickness on side lobes, (nm) | |
| hc | Central film thickness, (nm) | |
| hcp | Predicted central film thickness, (nm) | |
| k | Parameter of ellipticity, (-) | |
| P | Parameter of pressure, (-) | |
| p0 | Maximum contact pressure, (MPa) | p0 = 3W/2πa2 |
| R1, R2 | Curvature radius of solid 1 and 2, (mm) | |
| R′ | Reduced curvature radius, (mm) | 1/R′ = 1/R1 + 1/R2 |
| Rq | Root mean square roughness (RMS), (µm) | |
| Rt/Re | Parameter of ellipticity by Greenwood, (-) | |
| S | Speed parameter, (-) | |
| T | Inlet temperature, (°C) | |
| Tg | Glass-transition temperature, (°C) | |
| U | Entrainment speed, (m/s) | U = (U1 + U2)/2 |
| Dimensionless speed parameter, (-) | ||
| U1, U2 | Surface speed of solid 1 and 2, (m/s) | |
| W | Normal load, (N) | |
| Dimensionless load parameter, (-) | ||
| α | Pressure-viscosity coefficient, (GPa−1) | |
| η0 | Dynamic viscosity at atm., (Pa s) | |
| υ1, υ2 | Poisson’s ratio of solid 1 and 2, (-) | |
| υ40 | Kinematic viscosity at 40 °C, (mm2/s) | |
| υ100 | Kinematic viscosity at 100 °C, (mm2/s) | |
| ρ15 | Density of lubricant at 15 °C, (kg/m3) | |
| φ | Phase shift, (-) |
Appendix A

Table A1.
Experimental data deviations of hc from prediction models hcp. Ratio hc/hcp.
| Exp. | A | B | C | D | E | F |
|---|---|---|---|---|---|---|
| Exp. cond. | 90 °C, 20 N | 90 °C, 50 N | 100 °C, 20 N | 100 °C, 50 N | 110 °C, 20 N | 110 °C, 50 N |
| H&D, [19] | 13.7% | 13.7% | 6.4% | 18.1% | 4.0% | 4.9% |
| Hooke, [20] | −7.3% | −0.3% | −18.2% | −9.4% | −25.7% | −25.2% |
| Marx, [28] | −37.0% | −36.0% | −52.3% | −49.2% | −63.8% | −59.9% |
References
- Gilbert, M. Chapter 1—Plastics Materials: Introduction and Historical Development. In Brydson’s Plastics Materials, 8th ed.; Gilbert, M., Ed.; Butterworth-Heinemann: Amsterdam, The Netherlands, 2017; pp. 1–18. ISBN 978-0-323-35824-8. [Google Scholar]
- Dearn, K.D.; Hoskins, T.J.; Andrei, L.; Walton, D. Lubrication regimes in high-performance polymer spur gears. Adv. Tribol. 2013, 2013, 987251. [Google Scholar] [CrossRef] [Green Version]
- Kunishima, T.; Nagai, Y.; Kurokawa, T.; Bouvard, G.; Abry, J.C.; Fridrici, V.; Kapsa, P. Tribological behavior of glass fiber reinforced-PA66 in contact with carbon steel under high contact pressure, sliding and grease lubricated conditions. Wear 2020, 456–457, 203383. [Google Scholar] [CrossRef]
- Harrass, M.; Friedrich, K.; Almajid, A.A. Tribological behavior of selected engineering polymers under rolling contact. Tribol. Int. 2010, 43, 635–646. [Google Scholar] [CrossRef]
- Dearn, K.D.; Hoskins, T.J.; Petrov, D.G.; Reynolds, S.C.; Banks, R. Applications of dry film lubricants for polymer gears. Wear 2013, 298–299, 99–108. [Google Scholar] [CrossRef]
- Terashima, K.; Tsukamoto, N.; Nishida, N.; Shi, J. Development of Plastic Gear for Power Transmission: Abnormal Wear on the Tooth Root and Tooth Fracture near Pitch Point. Bull. JSME 1986, 29, 1598–1604. [Google Scholar] [CrossRef] [Green Version]
- Tsukamoto, N. Investigation about the Strength of Plastic Gear: 2nd Report; Abrasion of the Nylon Gear for Power Transmission, Meshing with the Steel Gear. JSME Int. J. Ser. B Fluids Therm. Eng. 1981, 24, 872–881. [Google Scholar] [CrossRef] [Green Version]
- Cummins, R.A.; Doyle, E.D.; Rebecchi, B. Wear damage to spur gears. Wear 1974, 27, 115–120. [Google Scholar] [CrossRef]
- Fetters, L.J.; Lohse, D.J.; Richter, D.; Witten, T.A.; Zirkel, A. Connection between Polymer Molecular Weight, Density, Chain Dimensions, and Melt Viscoelastic Properties. Macromolecules 1994, 27, 4639–4647. [Google Scholar] [CrossRef]
- Mao, K. A new approach for polymer composite gear design. Wear 2007, 262, 432–441. [Google Scholar] [CrossRef]
- Mao, K.; Langlois, P.; Hu, Z.; Alharbi, K.; Xu, X.; Milson, M.; Li, W.; Hooke, C.J.; Chetwynd, D. The wear and thermal mechanical contact behaviour of machine cut polymer gears. Wear 2015, 332–333, 822–826. [Google Scholar] [CrossRef]
- Masjedi, M.; Khonsari, M.M. Mixed lubrication of soft contacts: An engineering look. Proc. Inst. Mech. Eng. Part J. Eng. Tribol. 2017, 231, 263–273. [Google Scholar] [CrossRef]
- Johnson, K.L. Regimes of elastohydrodynamic lubrication. J. Mech. Eng. Sci. 1970, 12, 9–16. [Google Scholar] [CrossRef]
- Dowson, D. Paper 10: Elastohydrodynamics. Proc. Inst. Mech. Eng. Conf. Proc. 1967, 182, 151–167. [Google Scholar] [CrossRef]
- Greenwood, J.A. An extension of the Grubin theory of elastohydrodynamic lubrication. J. Phys. D Appl. Phys. 1972, 5, 2195–2211. [Google Scholar] [CrossRef]
- Spikes, H. Basics of EHL for practical application. Lubr. Sci. 2015, 27, 45–67. [Google Scholar] [CrossRef] [Green Version]
- Hooke, C.J.; O’Donoghue, J.P. Elastohydrodynamic Lubrication of Soft, Highly Deformed Contacts. J. Mech. Eng. Sci. 1972, 14, 34–48. [Google Scholar] [CrossRef]
- Hooke, C. The Elastohydrodynamic Lubrication of Heavily Loaded Contacts. J. Mech. Eng. Sci. 1977, 19, 149–156. [Google Scholar] [CrossRef]
- Hamrock, B.J.; Dowson, D. Elastohydrodynamic lubrication of elliptical contacts for materials of low elastic modulus i—Fully flooded conjunction. J. Tribol. 1978, 100, 236–245. [Google Scholar] [CrossRef]
- Hooke, C.J. The Elastohydrodynamic Lubrication of Elliptical Point Contacts Operating in the Isoviscous Region. Proc. Inst. Mech. Eng. Part J. Eng. Tribol. 1995, 209, 225–234. [Google Scholar] [CrossRef]
- Myers, T.G.; Hall, R.W.; Savage, M.D.; Gaskell, P.H. The Transition Region of Elastohydrodynamic Lubrication. Proc. R. Soc. Lond. A Math. Phys. Eng. Sci. 1991, 432, 467–479. [Google Scholar]
- Hamrock, B.J.; Dowson, D. Isothermal Elastohydrodynamic Lubrication of Point Contacts—4. Starvation Results. Am. Soc. Mech. Eng. 1976, 99, 223–228. [Google Scholar]
- Dowson, D.; Dunn, J.F.; Taylor, C.M. The Piezo-Viscous Fluid, Rigid Solid Regime of Lubrication. Proc. Inst. Mech. Eng. Part C J. Mech. Eng. Sci. 1983, 197, 43–52. [Google Scholar] [CrossRef]
- Stupkiewicz, S.; Lengiewicz, J.; Sadowski, P.; Kucharski, S. Finite deformation effects in soft elastohydrodynamic lubrication problems. Tribol. Int. 2016, 93, 511–522. [Google Scholar] [CrossRef]
- Hooke, C.J. Calculation of clearances in soft point contacts. J. Tribol. 1988, 110, 167–173. [Google Scholar] [CrossRef]
- Myant, C.; Fowell, M.; Spikes, H.A.; Stokes, J.R. An investigation of lubricant film thickness in sliding compliant contacts. Tribol. Trans. 2010, 53, 684–694. [Google Scholar] [CrossRef] [Green Version]
- Esfahanian, M.; Hamrock, B.J. Fluid-film lubrication regimes revisited. Tribol. Trans. 1991, 34, 628–632. [Google Scholar] [CrossRef]
- Marx, N.; Guegan, J.; Spikes, H.A. Elastohydrodynamic film thickness of soft EHL contacts using optical interferometry. Tribol. Int. 2016, 99, 267–277. [Google Scholar] [CrossRef] [Green Version]
- Myant, C.; Reddyhoff, T.; Spikes, H.A. Laser-induced fluorescence for film thickness mapping in pure sliding lubricated, compliant, contacts. Tribol. Int. 2010, 43, 1960–1969. [Google Scholar] [CrossRef] [Green Version]
- Hartl, M.; Krupka, I.; Poliscuk, R.; Liska, M.; Molimard, J.; Querry, M.; Vergne, P. Thin film colorimetric interferometry. Tribol. Trans. 2001, 44, 270–276. [Google Scholar] [CrossRef]
- Reddyhoff, T.; Choo, J.H.; Spikes, H.A.; Glovnea, R.P. Lubricant flow in an elastohydrodynamic contact using fluorescence. Tribol. Lett. 2010, 38, 207–215. [Google Scholar] [CrossRef] [Green Version]
- Kaneta, M.; Kanada, T.; Nishikawa, H. Optical interferometric observations of the effects of a moving dent on point contact EHL. Tribol. Ser. 1997, 32, 69–79. [Google Scholar]
- Ciulli, E.; Draexl, T.; Stadler, K. Film thickness analysis for EHL contacts under steady-state and transient conditions by automatic digital image processing. Adv. Tribol. 2015, 55, 678–705. [Google Scholar]
- Lin, Y.; Bilotti, E.; Bastiaansen, C.W.M.; Peijs, T. Transparent semi-crystalline polymeric materials and their nanocomposites: A review. Polym. Eng. Sci. 2020, 60, 2351–2376. [Google Scholar] [CrossRef]
- Djukic, S.; Bocahut, A.; Bikard, J.; Long, D.R. Mechanical properties of amorphous and semi-crystalline semi-aromatic polyamides. Heliyon 2020, 6, e03857. [Google Scholar] [CrossRef]
- Johnson, J.A.; Jones, D.W. The mechanical properties of PMMA and its copolymers with ethyl methacrylate and butyl methacrylate. J. Mater. Sci. 1994, 29, 870–876. [Google Scholar] [CrossRef]
- Jee, A.Y.; Lee, M. Mechanical properties of polycarbonate and poly (methyl methacrylate) films reinforced with surface-functionalized nanodiamonds. J. Nanosci. Nanotechnol. 2011, 11, 533–536. [Google Scholar] [CrossRef] [PubMed]
- Ali, U.; Karim, K.J.B.A.; Buang, N.A. A Review of the Properties and Applications of Poly (Methyl Methacrylate) (PMMA). Polym. Rev. 2015, 55, 678–705. [Google Scholar] [CrossRef]
- Mathiesen, D.; Vogtmann, D.; Dupaix, R.B. Characterization and constitutive modeling of stress-relaxation behavior of Poly (methyl methacrylate) (PMMA) across the glass transition temperature. Mech. Mater. 2014, 71, 74–84. [Google Scholar] [CrossRef]
- Gold, P.W.; Schmidt, A.; Dicke, H.; Loos, J.; Assmann, C. Viscosity-pressure-temperature behaviour of mineral and synthetic oils. J. Synth. Lubr. 2001, 18, 51–79. [Google Scholar] [CrossRef]
- Liu, H.; Link, F.; Lohner, T.; Stahl, K. Computational fluid dynamics simulation of geared transmissions with injection lubrication. Proc. Inst. Mech. Eng. Part C J. Mech. Eng. Sci. 2019, 233, 7412–7422. [Google Scholar] [CrossRef]
- Boumbimba, R.M.; Ahzi, S.; Bahlouli, N.; Ruch, D.; Gracio, J. Dynamic mechanical properties of PMMA/organoclay nanocomposite: Experiments and modeling. J. Eng. Mater. Technol. Trans. ASME 2011, 133, 1–6. [Google Scholar] [CrossRef]
- Putignano, C.; Dini, D. Soft Matter Lubrication: Does Solid Viscoelasticity Matter? ACS Appl. Mater. Interfaces 2017, 9, 42287–42295. [Google Scholar] [CrossRef] [Green Version]
- Boyce, M.C.; Parks, D.M.; Argon, A.S. Large inelastic deformation of glassy polymers. part I: Rate dependent constitutive model. Mech. Mater. 1988, 7, 15–33. [Google Scholar] [CrossRef]
- Richeton, J.; Ahzi, S.; Vecchio, K.S.; Jiang, F.C.; Adharapurapu, R.R. Influence of temperature and strain rate on the mechanical behavior of three amorphous polymers: Characterization and modeling of the compressive yield stress. Int. J. Solids Struct. 2006, 43, 2318–2335. [Google Scholar] [CrossRef] [Green Version]
- Richeton, J.; Ahzi, S.; Vecchio, K.S.; Jiang, F.C.; Makradi, A. Modeling and validation of the large deformation inelastic response of amorphous polymers over a wide range of temperatures and strain rates. Int. J. Solids Struct. 2007, 44, 7938–7954. [Google Scholar] [CrossRef] [Green Version]
- De Deus, J.F.; Souza, G.P.; Corradini, W.A.; Atvars, T.D.Z.; Akcelrud, L. Relaxations of poly (methyl methacrylate) probed by covalently attached anthryl groups. Macromolecules 2004, 37, 6938–6944. [Google Scholar] [CrossRef]
- Chaudhri, M.M. Impact breakage of semi-brittle spheres. Powder Technol. 2004, 143–144, 31–40. [Google Scholar] [CrossRef]
- Liu, Y.; Liaw, B. Drop-weight impact tests and finite element modeling of cast acrylic/aluminum plates. Polym. Test. 2009, 28, 808–823. [Google Scholar] [CrossRef]
- Putignano, C.; Reddyhoff, T.; Carbone, G.; Dini, D. Experimental investigation of viscoelastic rolling contacts: A comparison with theory. Tribol. Lett. 2013, 51, 105–113. [Google Scholar] [CrossRef]
- Carbone, G.; Putignano, C. A novel methodology to predict sliding and rolling friction of viscoelastic materials: Theory and experiments. J. Mech. Phys. Solids 2013, 61, 1822–1834. [Google Scholar] [CrossRef]
- Blumenthal, W.R. Influence of Temperature and Strain Rate on the Compressive Behavior of PMMA and Polycarbonate Polymers. AIP Conf. Proc. 2003, 665, 665–668. [Google Scholar]
Figure 1.
Rotary optical tribometer in ball-on-disc configuration.

Figure 2.
Process of film thickness evaluation in compliant contacts. (A) optical interference principle; (B) calibration principle.
Figure 2.
Process of film thickness evaluation in compliant contacts. (A) optical interference principle; (B) calibration principle.

Figure 3.
Size of static contacts in dependence on W and T. (a) 20 N, 90 °C; (b) 20 N, 100 °C; (c) 20 N, 110 °C; (d) 50 N, 90 °C; (e) 50 N, 100 °C; (f) 50 N, 110 °C.
Figure 3.
Size of static contacts in dependence on W and T. (a) 20 N, 90 °C; (b) 20 N, 100 °C; (c) 20 N, 110 °C; (d) 50 N, 90 °C; (e) 50 N, 100 °C; (f) 50 N, 110 °C.

Figure 4.
Young’s modulus E1 of PMMA versus inlet temp. T.

Figure 5.
Central film thickness hc versus entrainment speed U: (a) W = 20 N and (b) W = 50 N.

Figure 6.
Comparison of experimental results with H&D [19] prediction model: (a) 90 °C and (b) 110 °C.
Figure 6.
Comparison of experimental results with H&D [19] prediction model: (a) 90 °C and (b) 110 °C.

Figure 7.
Interferograms of running contact at different temperatures and entrainment speeds: (A) W = 20 N, (B) W = 50 N, and (C) assignment of film thickness to the color spectrum.
Figure 7.
Interferograms of running contact at different temperatures and entrainment speeds: (A) W = 20 N, (B) W = 50 N, and (C) assignment of film thickness to the color spectrum.

Figure 8.
Mean values of ellipticity k.

Figure 9.
Mean values of area of contact A.


Figure 11.
Comparison of the experimental conditions with interval of validity of H&D predictive relationships [19].
Figure 11.
Comparison of the experimental conditions with interval of validity of H&D predictive relationships [19].

Figure 12.
EHL map for circular contacts (k = 1) [13] versus experimental conditions.
Figure 12.
EHL map for circular contacts (k = 1) [13] versus experimental conditions.

Figure 13.
Validation of EHL regime based on Hooke’s model [20] via P and S dimensionless parameters. Used with permission of SAGE Publications Ltd. Journals, from The Elastohydrodynamic Lubrication of Elliptical Point Contacts Operating in the Isoviscous Region, Hooke, C.J., 209, Proc. Inst. Mech. Eng. Part J. Eng. Tribol. 1995; permission conveyed through Copyright Clearance Center, Inc.

Table 1.
Material properties of specimens.
| Specimens | Specification | Young’s Modulus, E | Poisson’s Ratio, υ | Glass-Transition Temperature, Tg | RMS Roughness, Rq |
|---|---|---|---|---|---|
| PMMA disc | Polymethyl-methacrylate | 3.3 GPa | 0.39 | 105 °C | Rq < 0.005 µm |
| Steel ball | 100Cr6 | 206 GPa | 0.30 | - | Rq < 0.01 µm |
Table 2.
FVA3 lubricant properties [41].
Table 2.
FVA3 lubricant properties [41].
| Oil | Kinematic Viscosity at 40 °C, υ40 | Kinematic Viscosity at 100 °C, υ100 | Density at 15 °C, ρ15 |
|---|---|---|---|
| FVA3 | 95.0 mm2/s | 10.7 mm2/s | 864 kg/m3 |
Table 3.
Experimental conditions.
| Parameter | Value |
|---|---|
| Entrainment speed, U | 0.2–1.2 m/s |
| Load, W | 20, 50 N |
| Maximal contact pressure (24 °C), p0 | 45, 62 MPa |
| Dynamic viscosity of FVA3 at atm., η0 | 0.013–0.008 Pa s |
| Inlet temperature, T | 90–110 °C |
Publisher’s Note: MDPI stays neutral with regard to jurisdictional claims in published maps and institutional affiliations. |
© 2022 by the authors. Licensee MDPI, Basel, Switzerland. This article is an open access article distributed under the terms and conditions of the Creative Commons Attribution (CC BY) license (https://creativecommons.org/licenses/by/4.0/).
Share and Cite
MDPI and ACS Style
Krupka, J.; Dockal, K.; Krupka, I.; Hartl, M. Elastohydrodynamic Lubrication of Compliant Circular Contacts near Glass-Transition Temperature. Lubricants 2022, 10, 155. https://0-doi-org.brum.beds.ac.uk/10.3390/lubricants10070155
AMA Style
Krupka J, Dockal K, Krupka I, Hartl M. Elastohydrodynamic Lubrication of Compliant Circular Contacts near Glass-Transition Temperature. Lubricants. 2022; 10(7):155. https://0-doi-org.brum.beds.ac.uk/10.3390/lubricants10070155
Chicago/Turabian StyleKrupka, Jiri, Krystof Dockal, Ivan Krupka, and Martin Hartl. 2022. "Elastohydrodynamic Lubrication of Compliant Circular Contacts near Glass-Transition Temperature" Lubricants 10, no. 7: 155. https://0-doi-org.brum.beds.ac.uk/10.3390/lubricants10070155
Note that from the first issue of 2016, this journal uses article numbers instead of page numbers. See further details here.