Influence of Al2O3 Nanoparticles Addition in ZA-27 Alloy-Based Nanocomposites and Soft Computing Prediction

 , , , ,
Abstract
:1. Introduction
2. Experimental Details
2.1. Materials
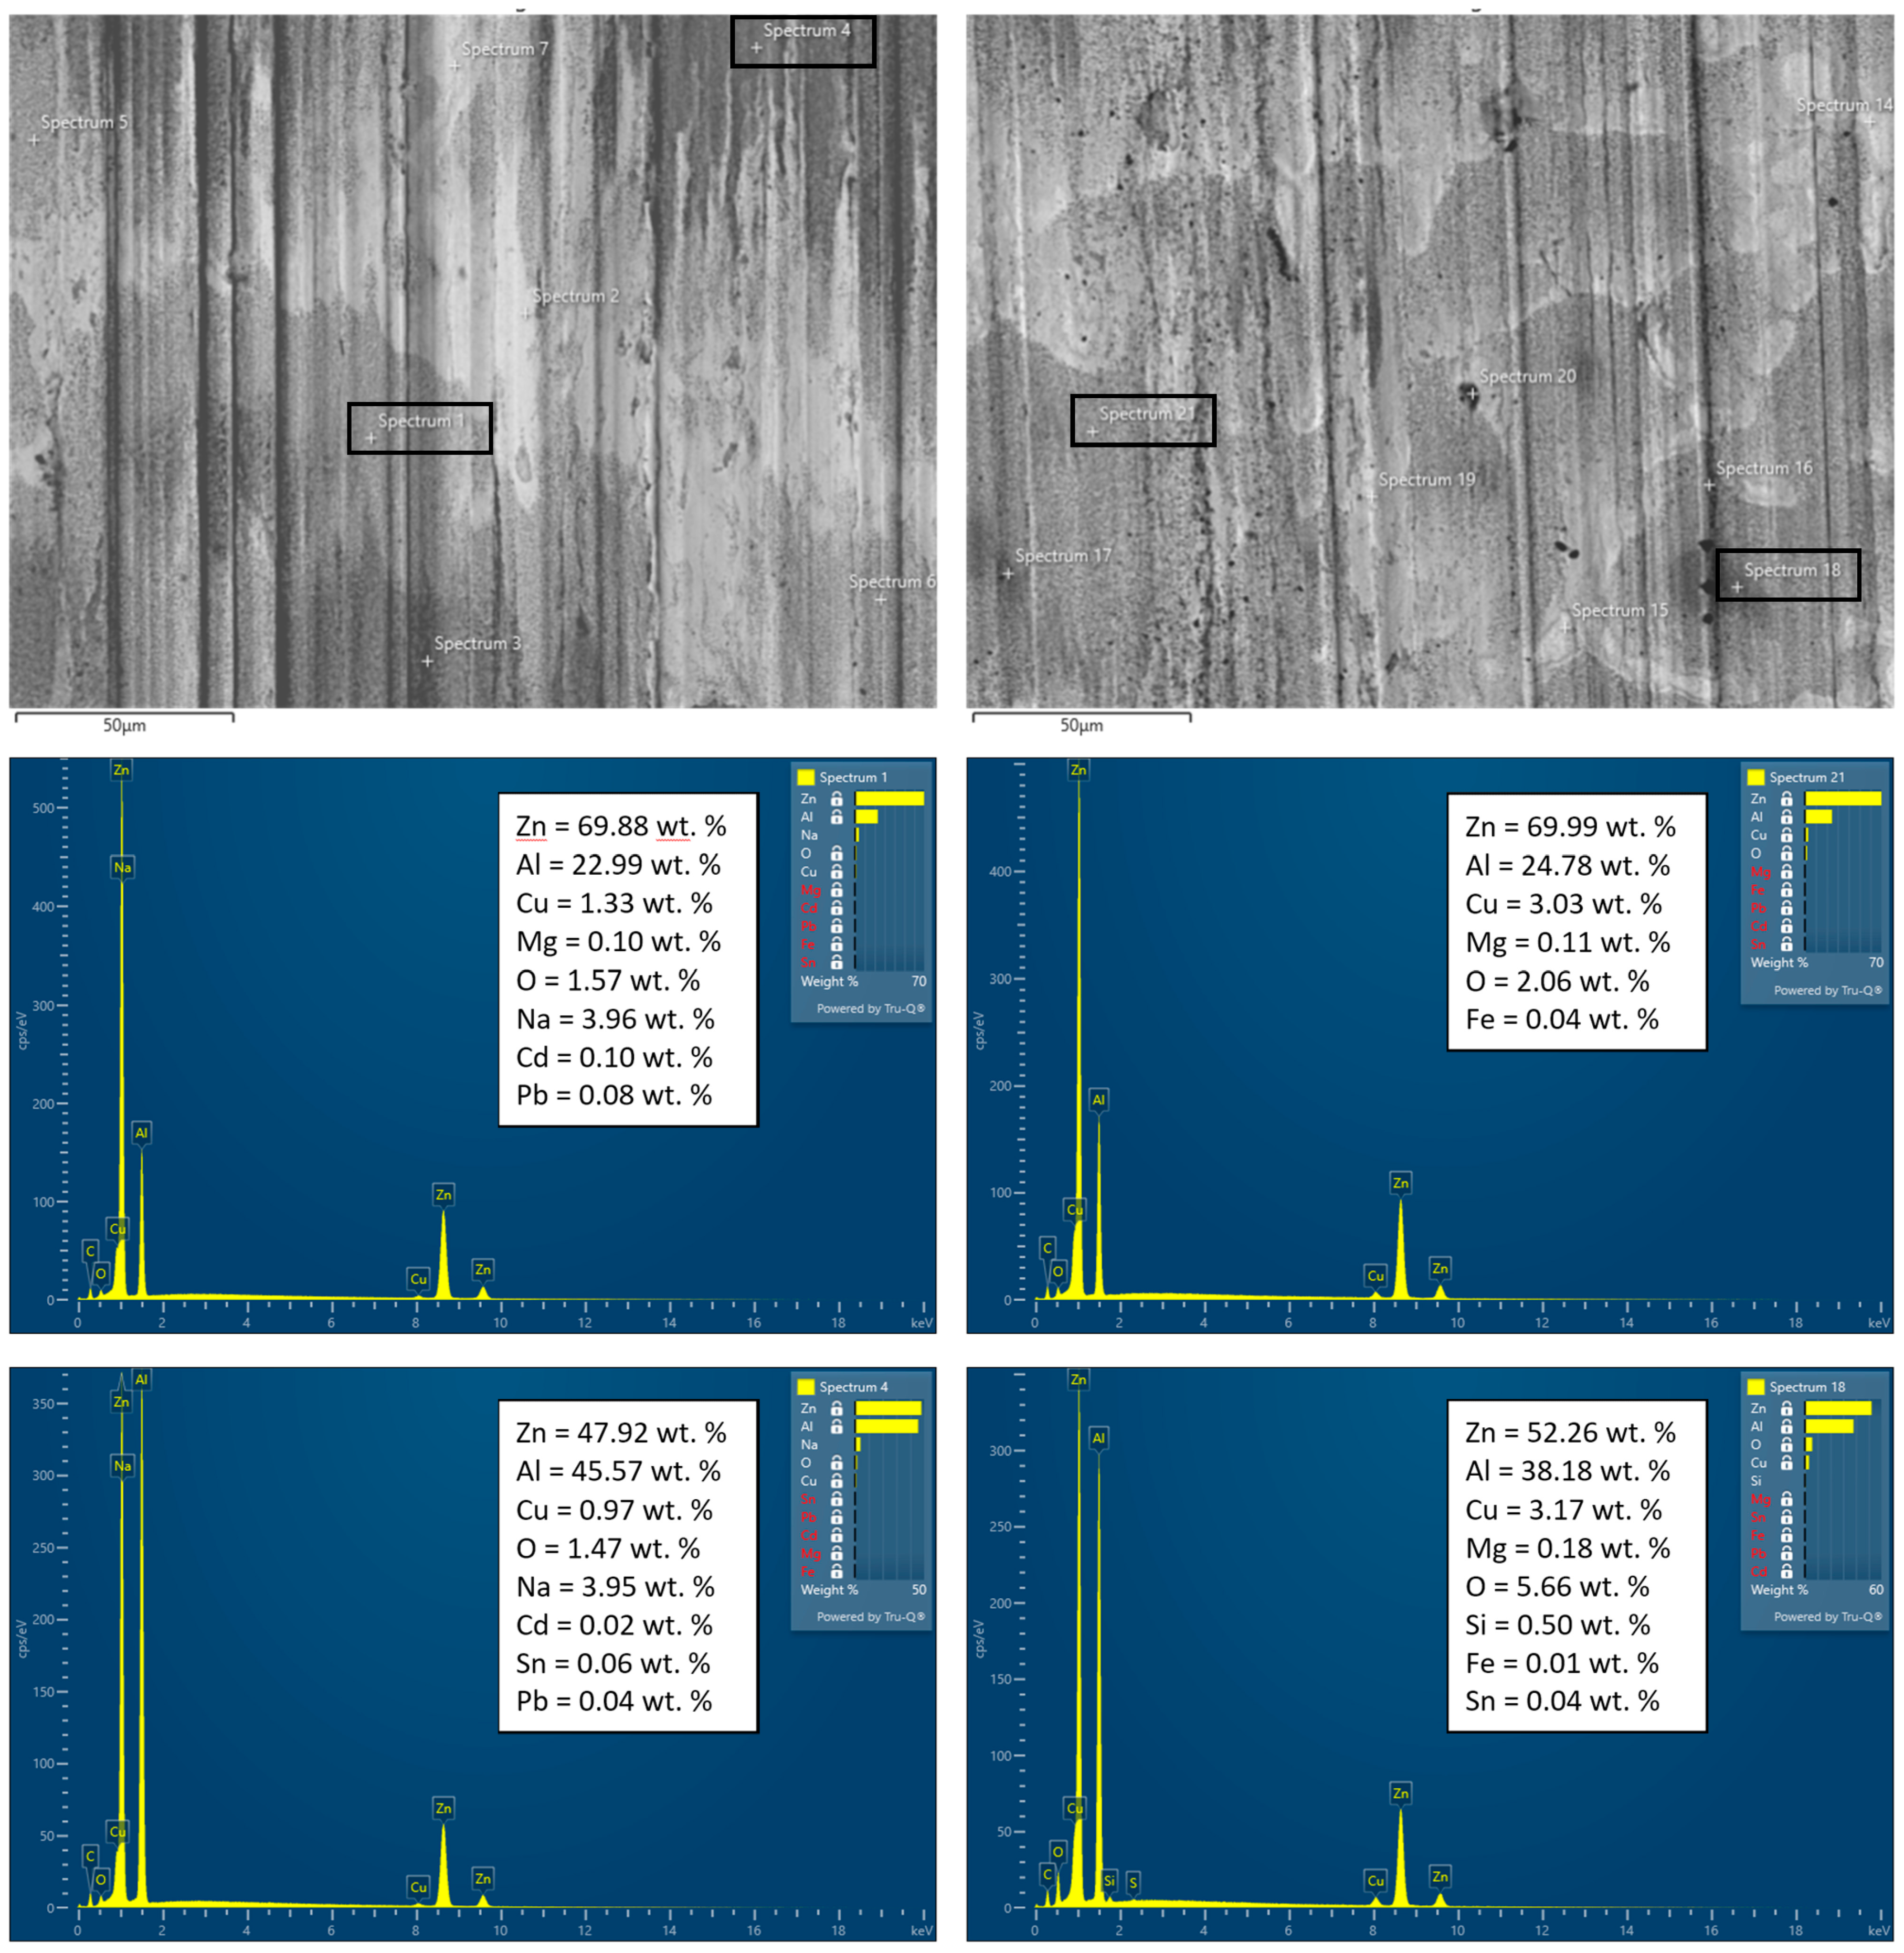
2.2. Methods of Characterisation
2.3. Experimental Design
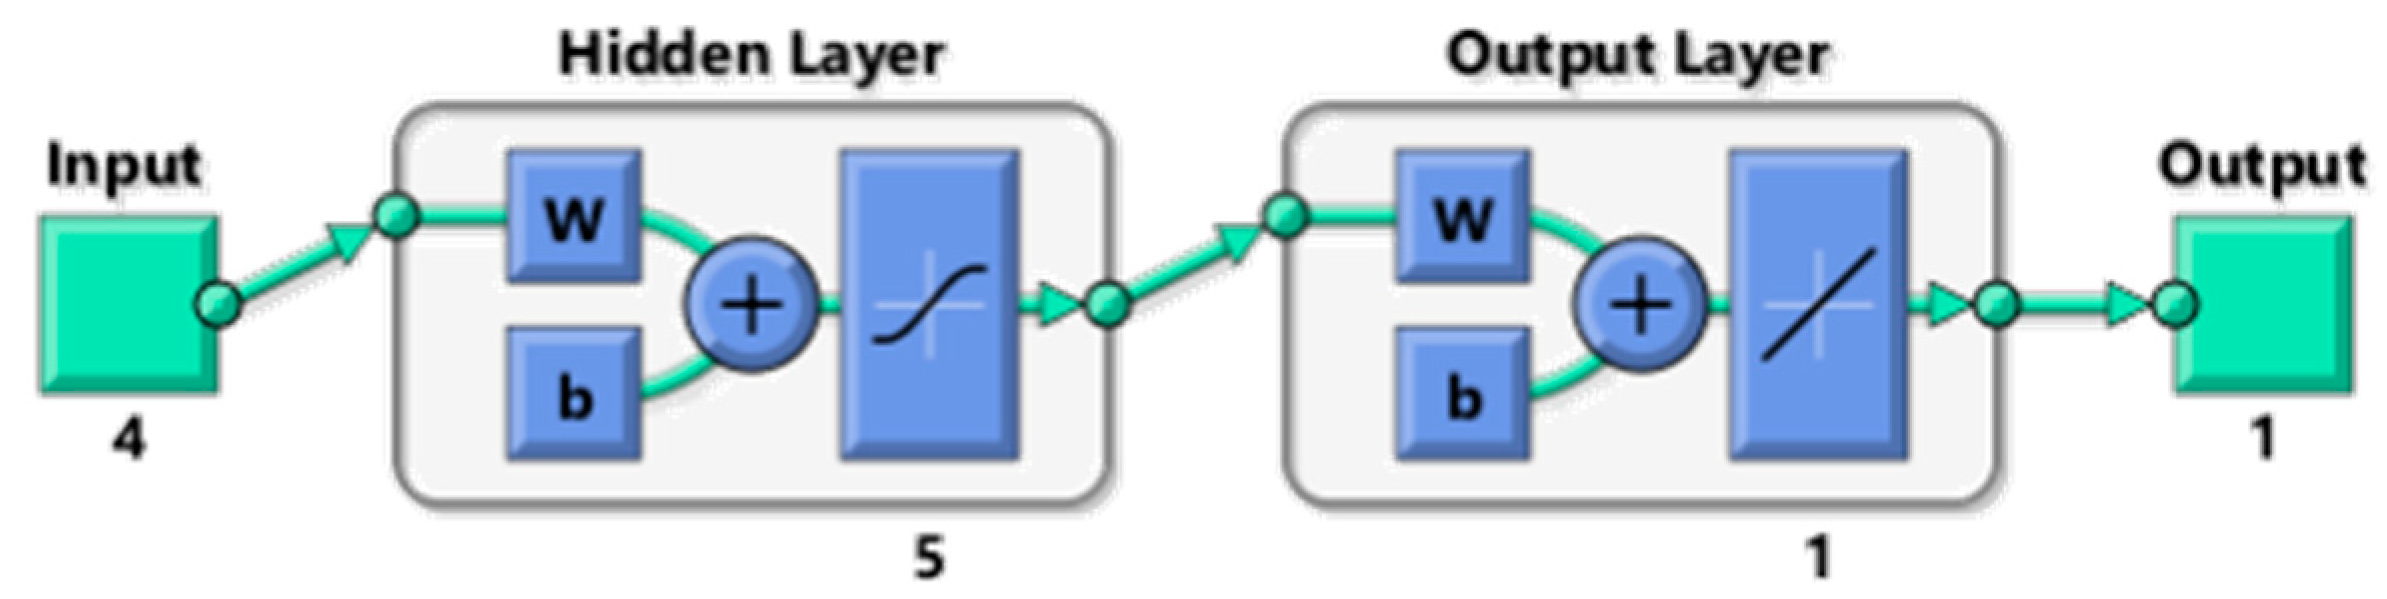
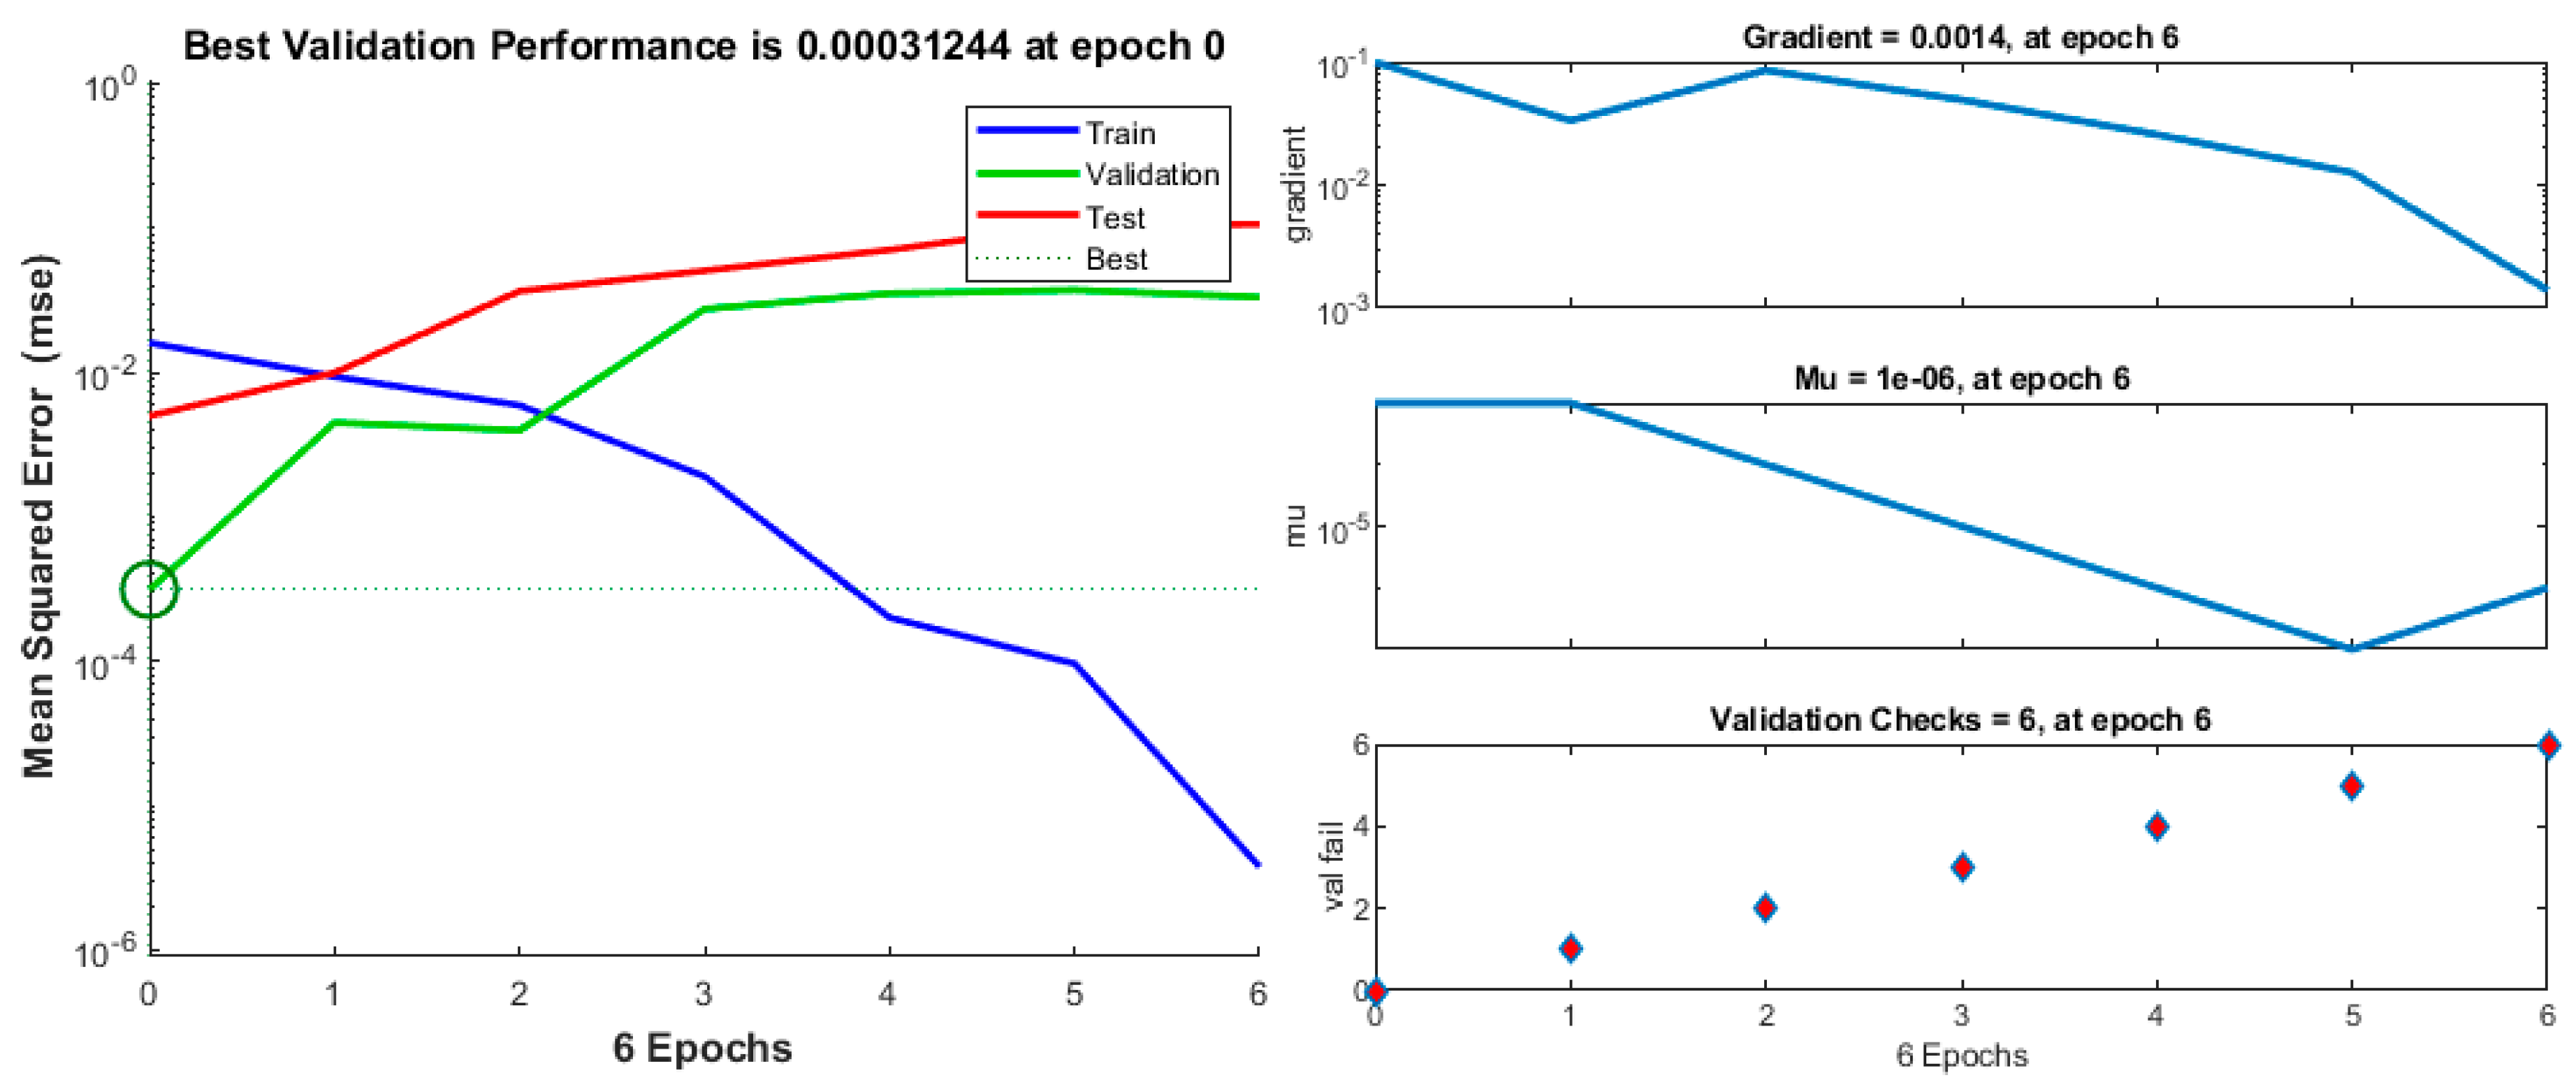
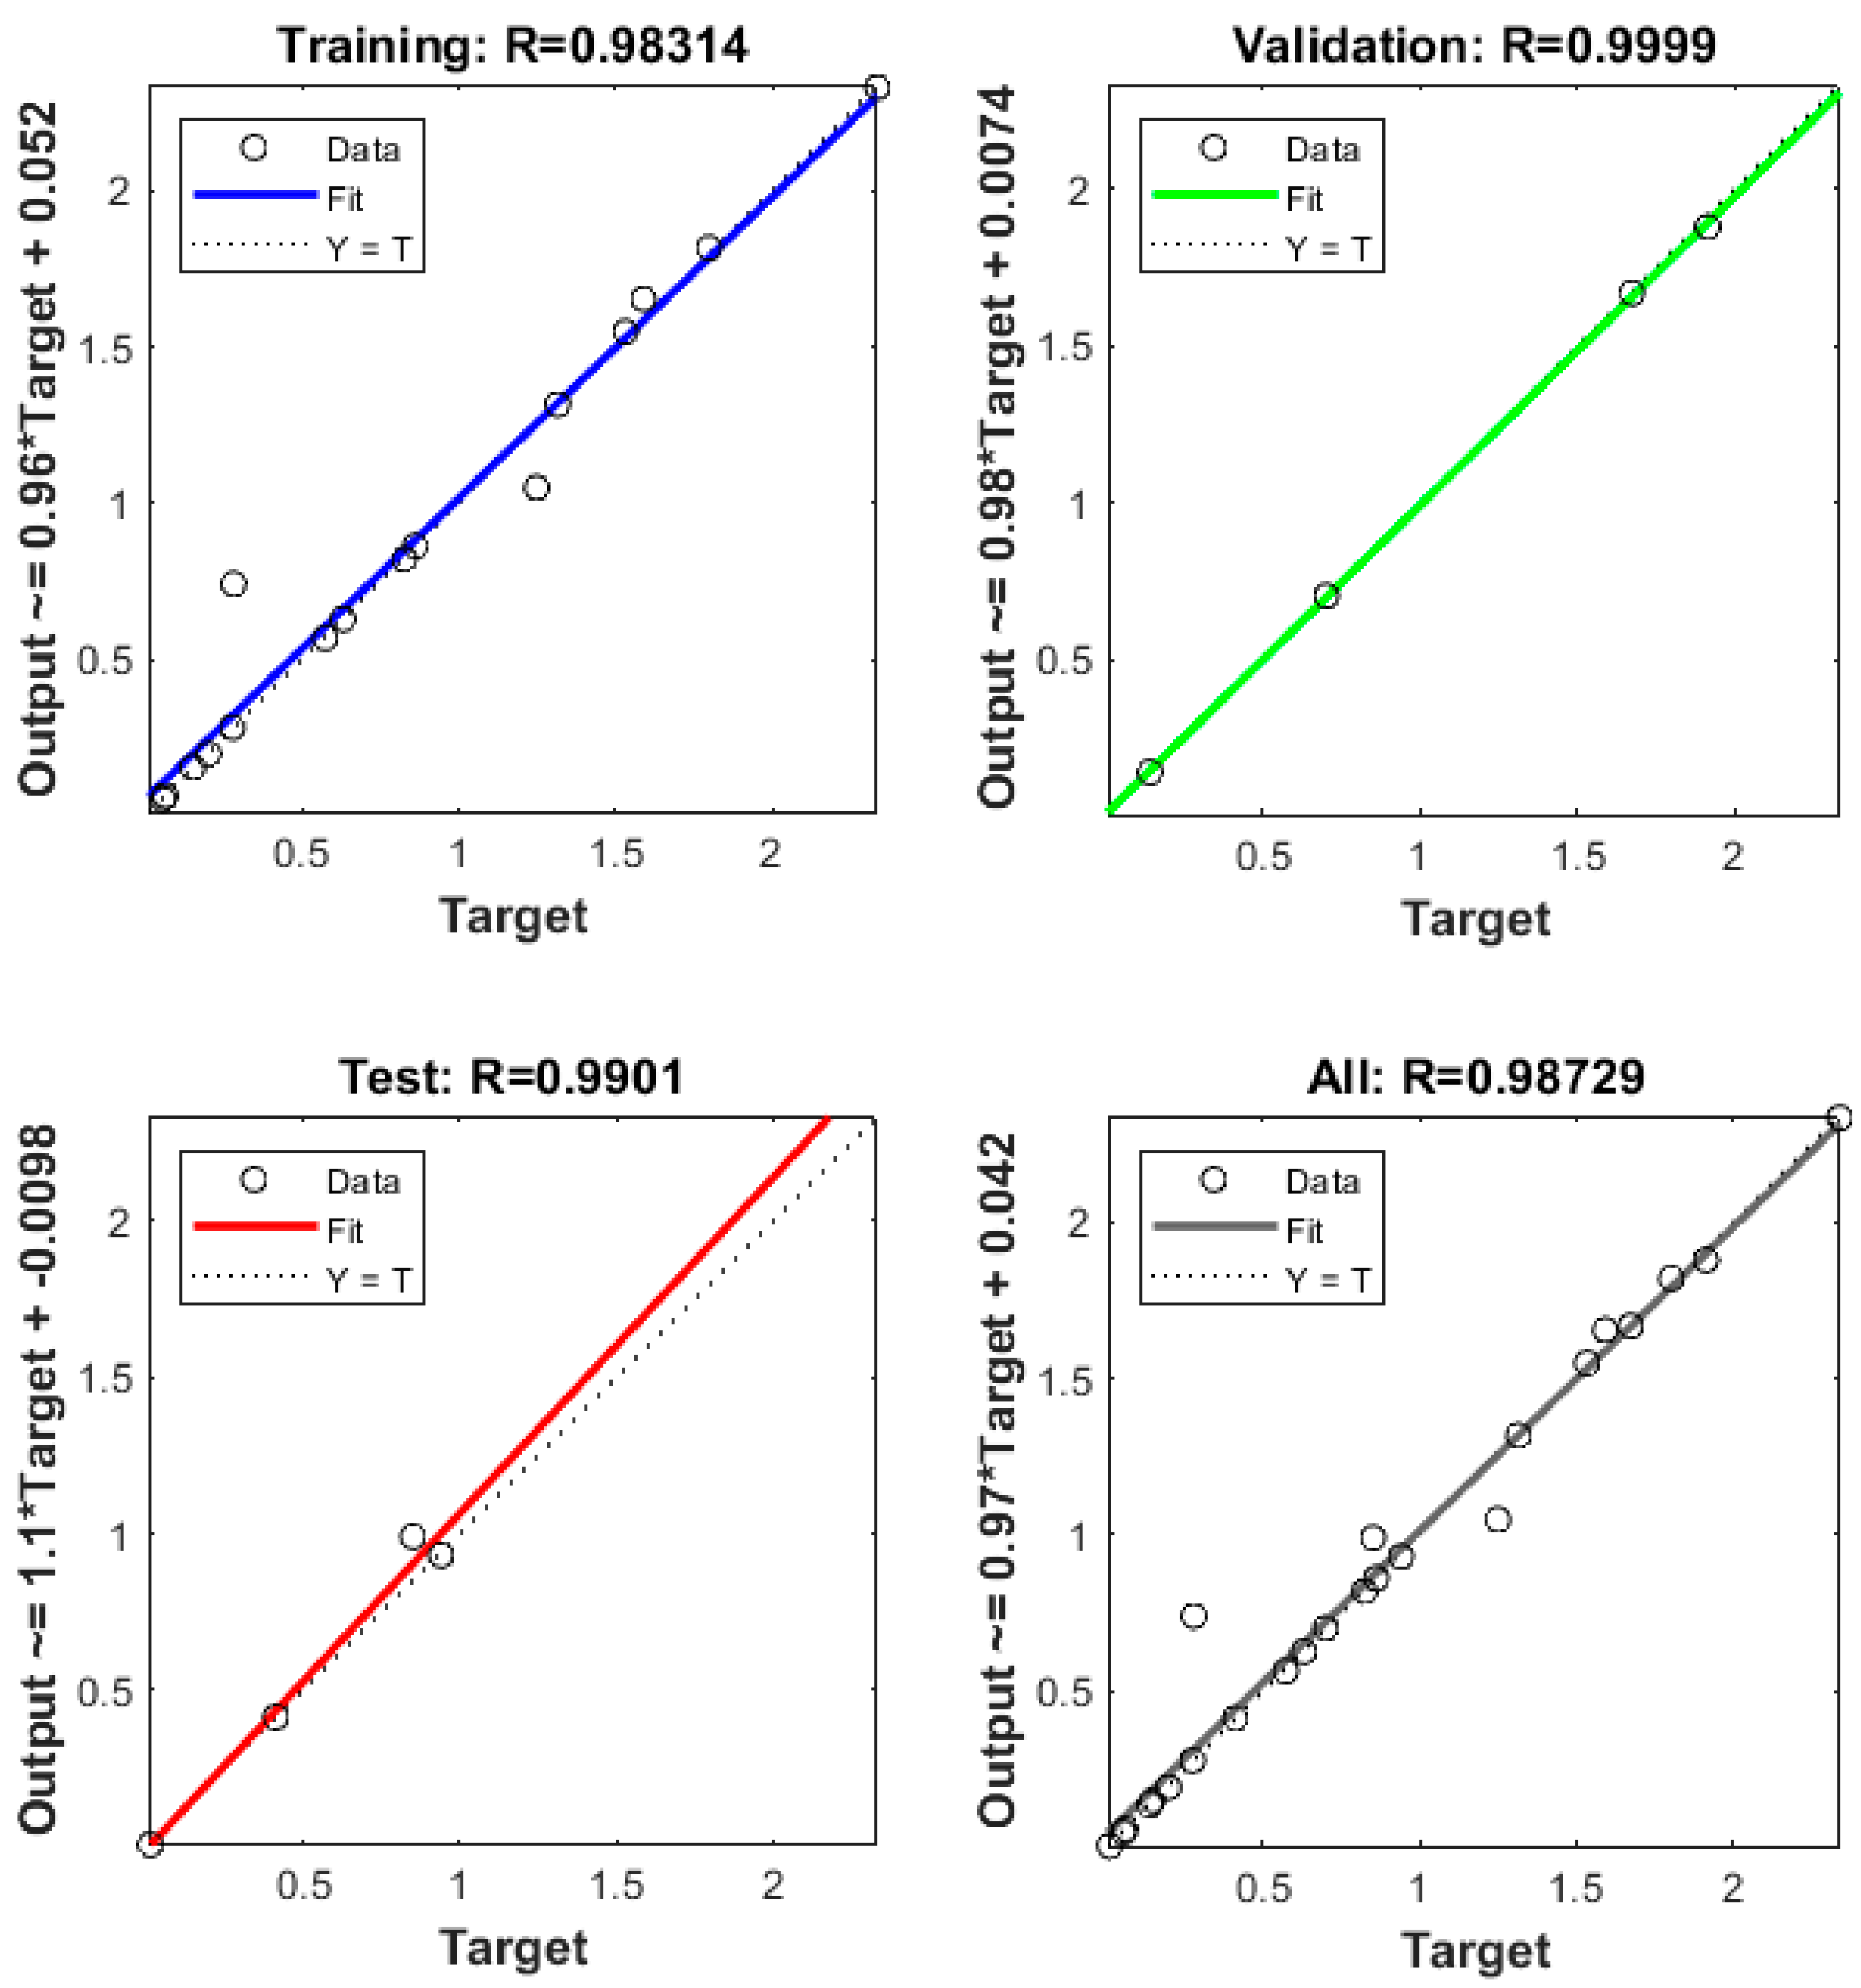
3. Results and Discussion
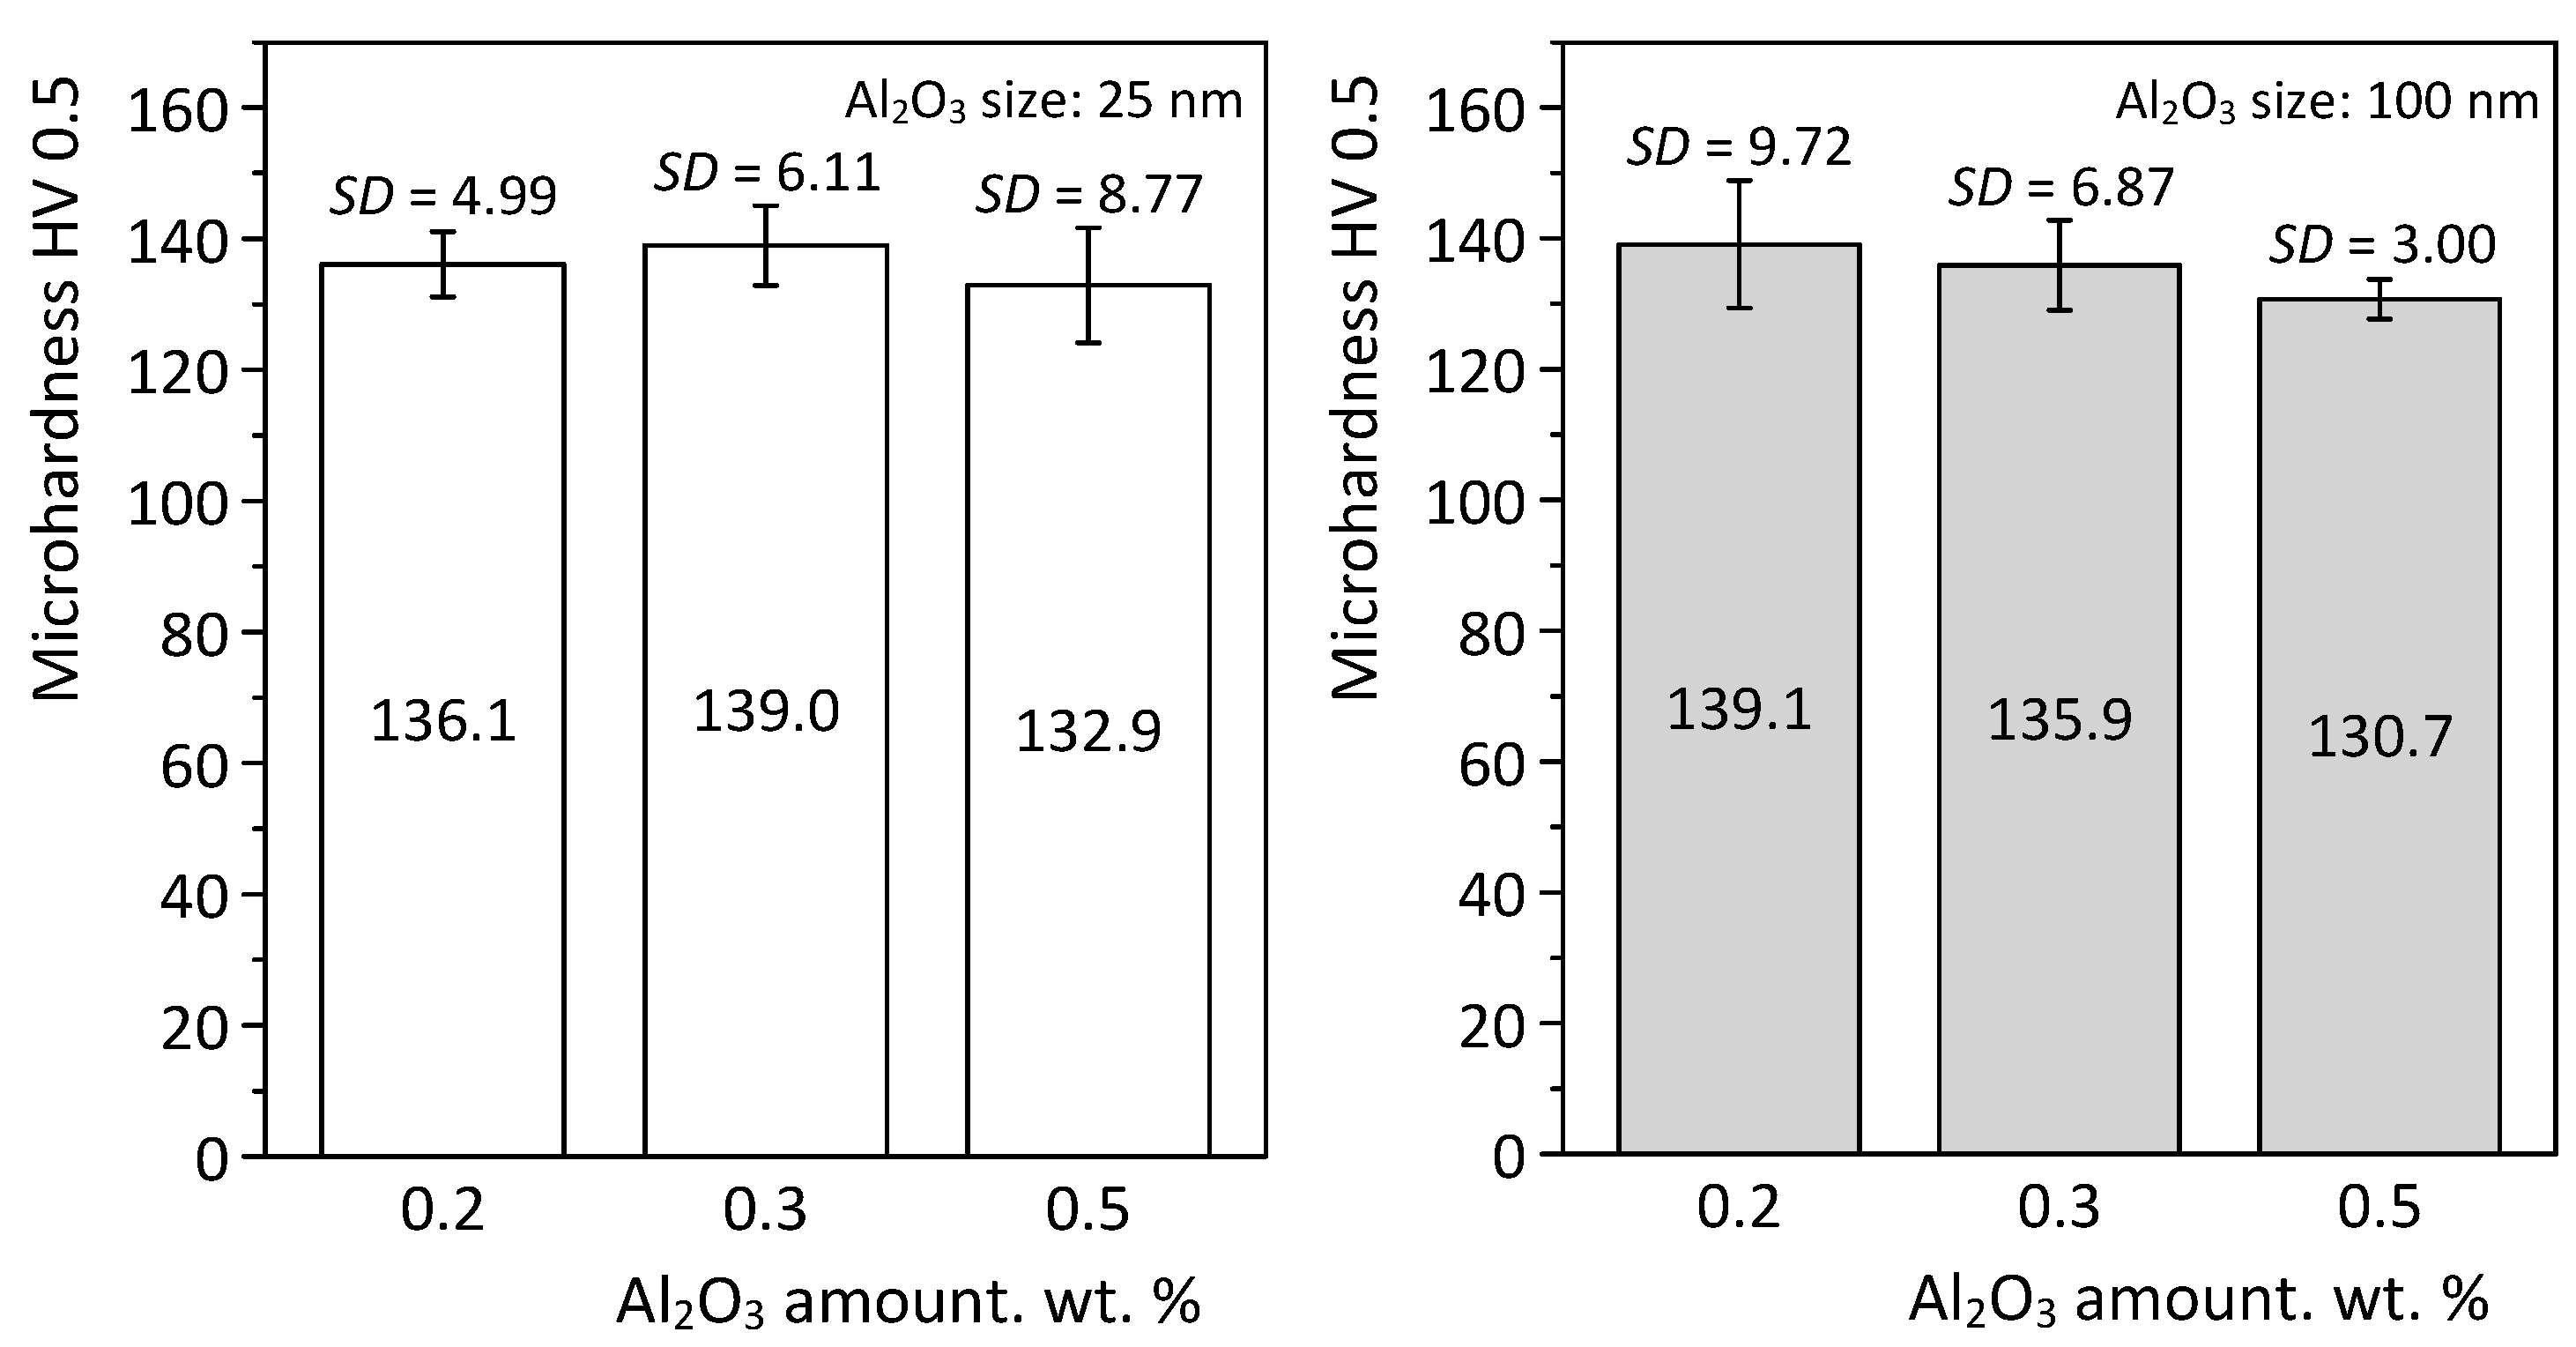
3.1. Microhardness
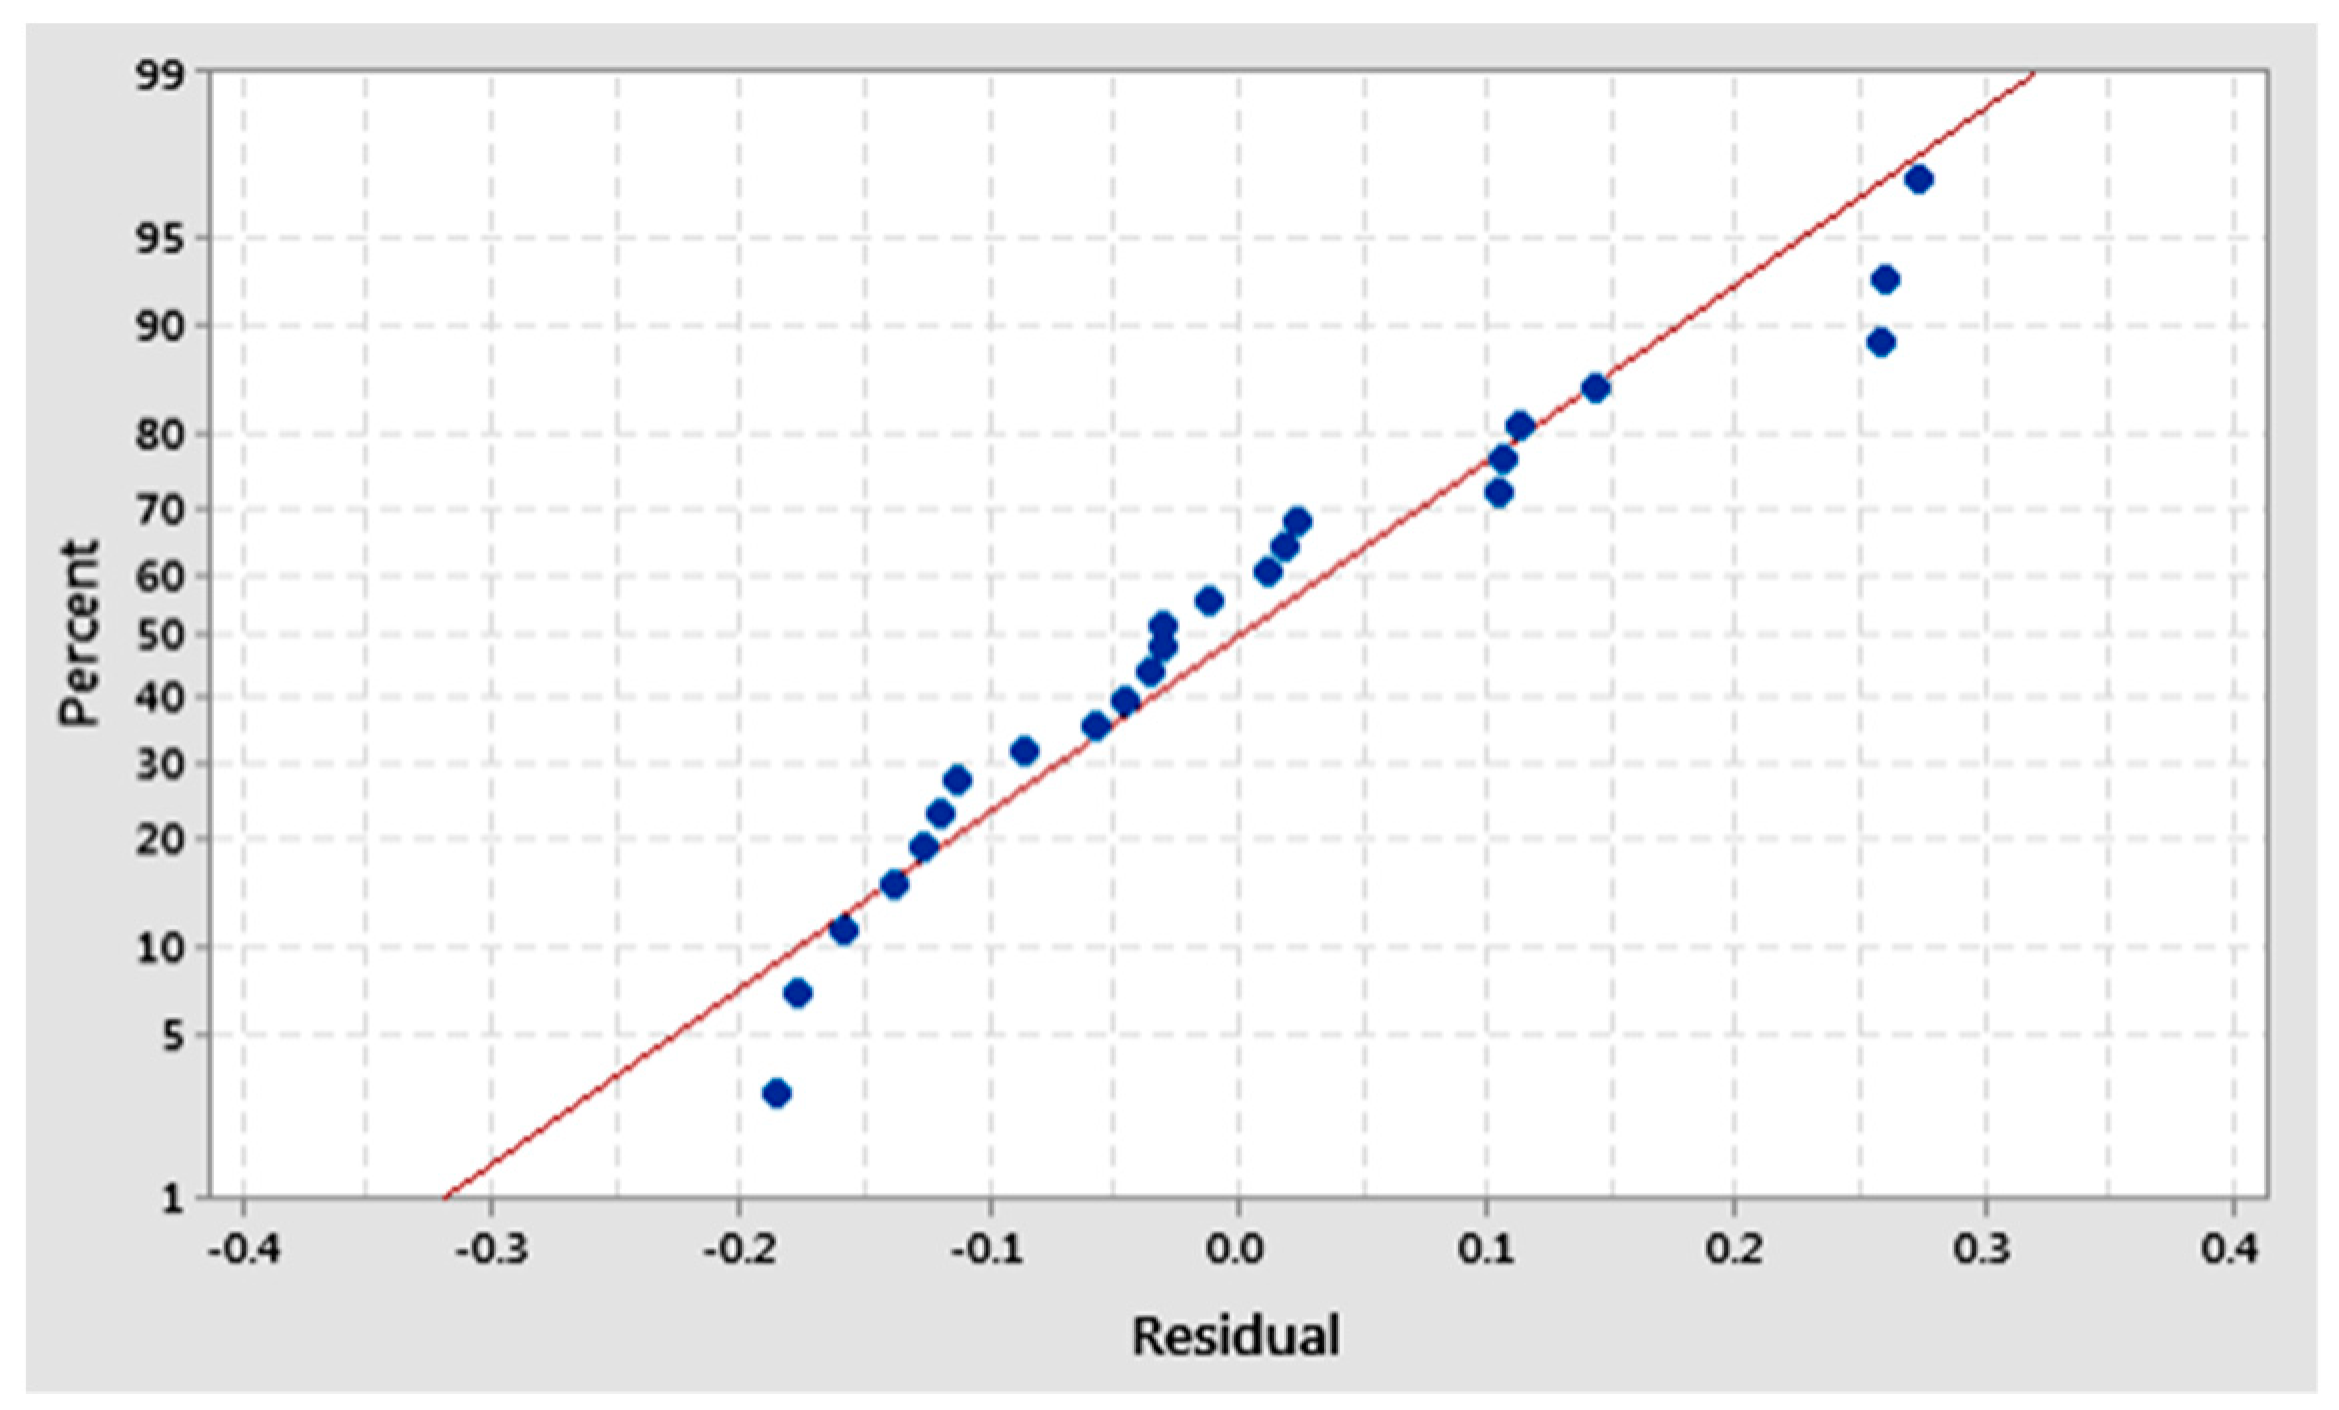
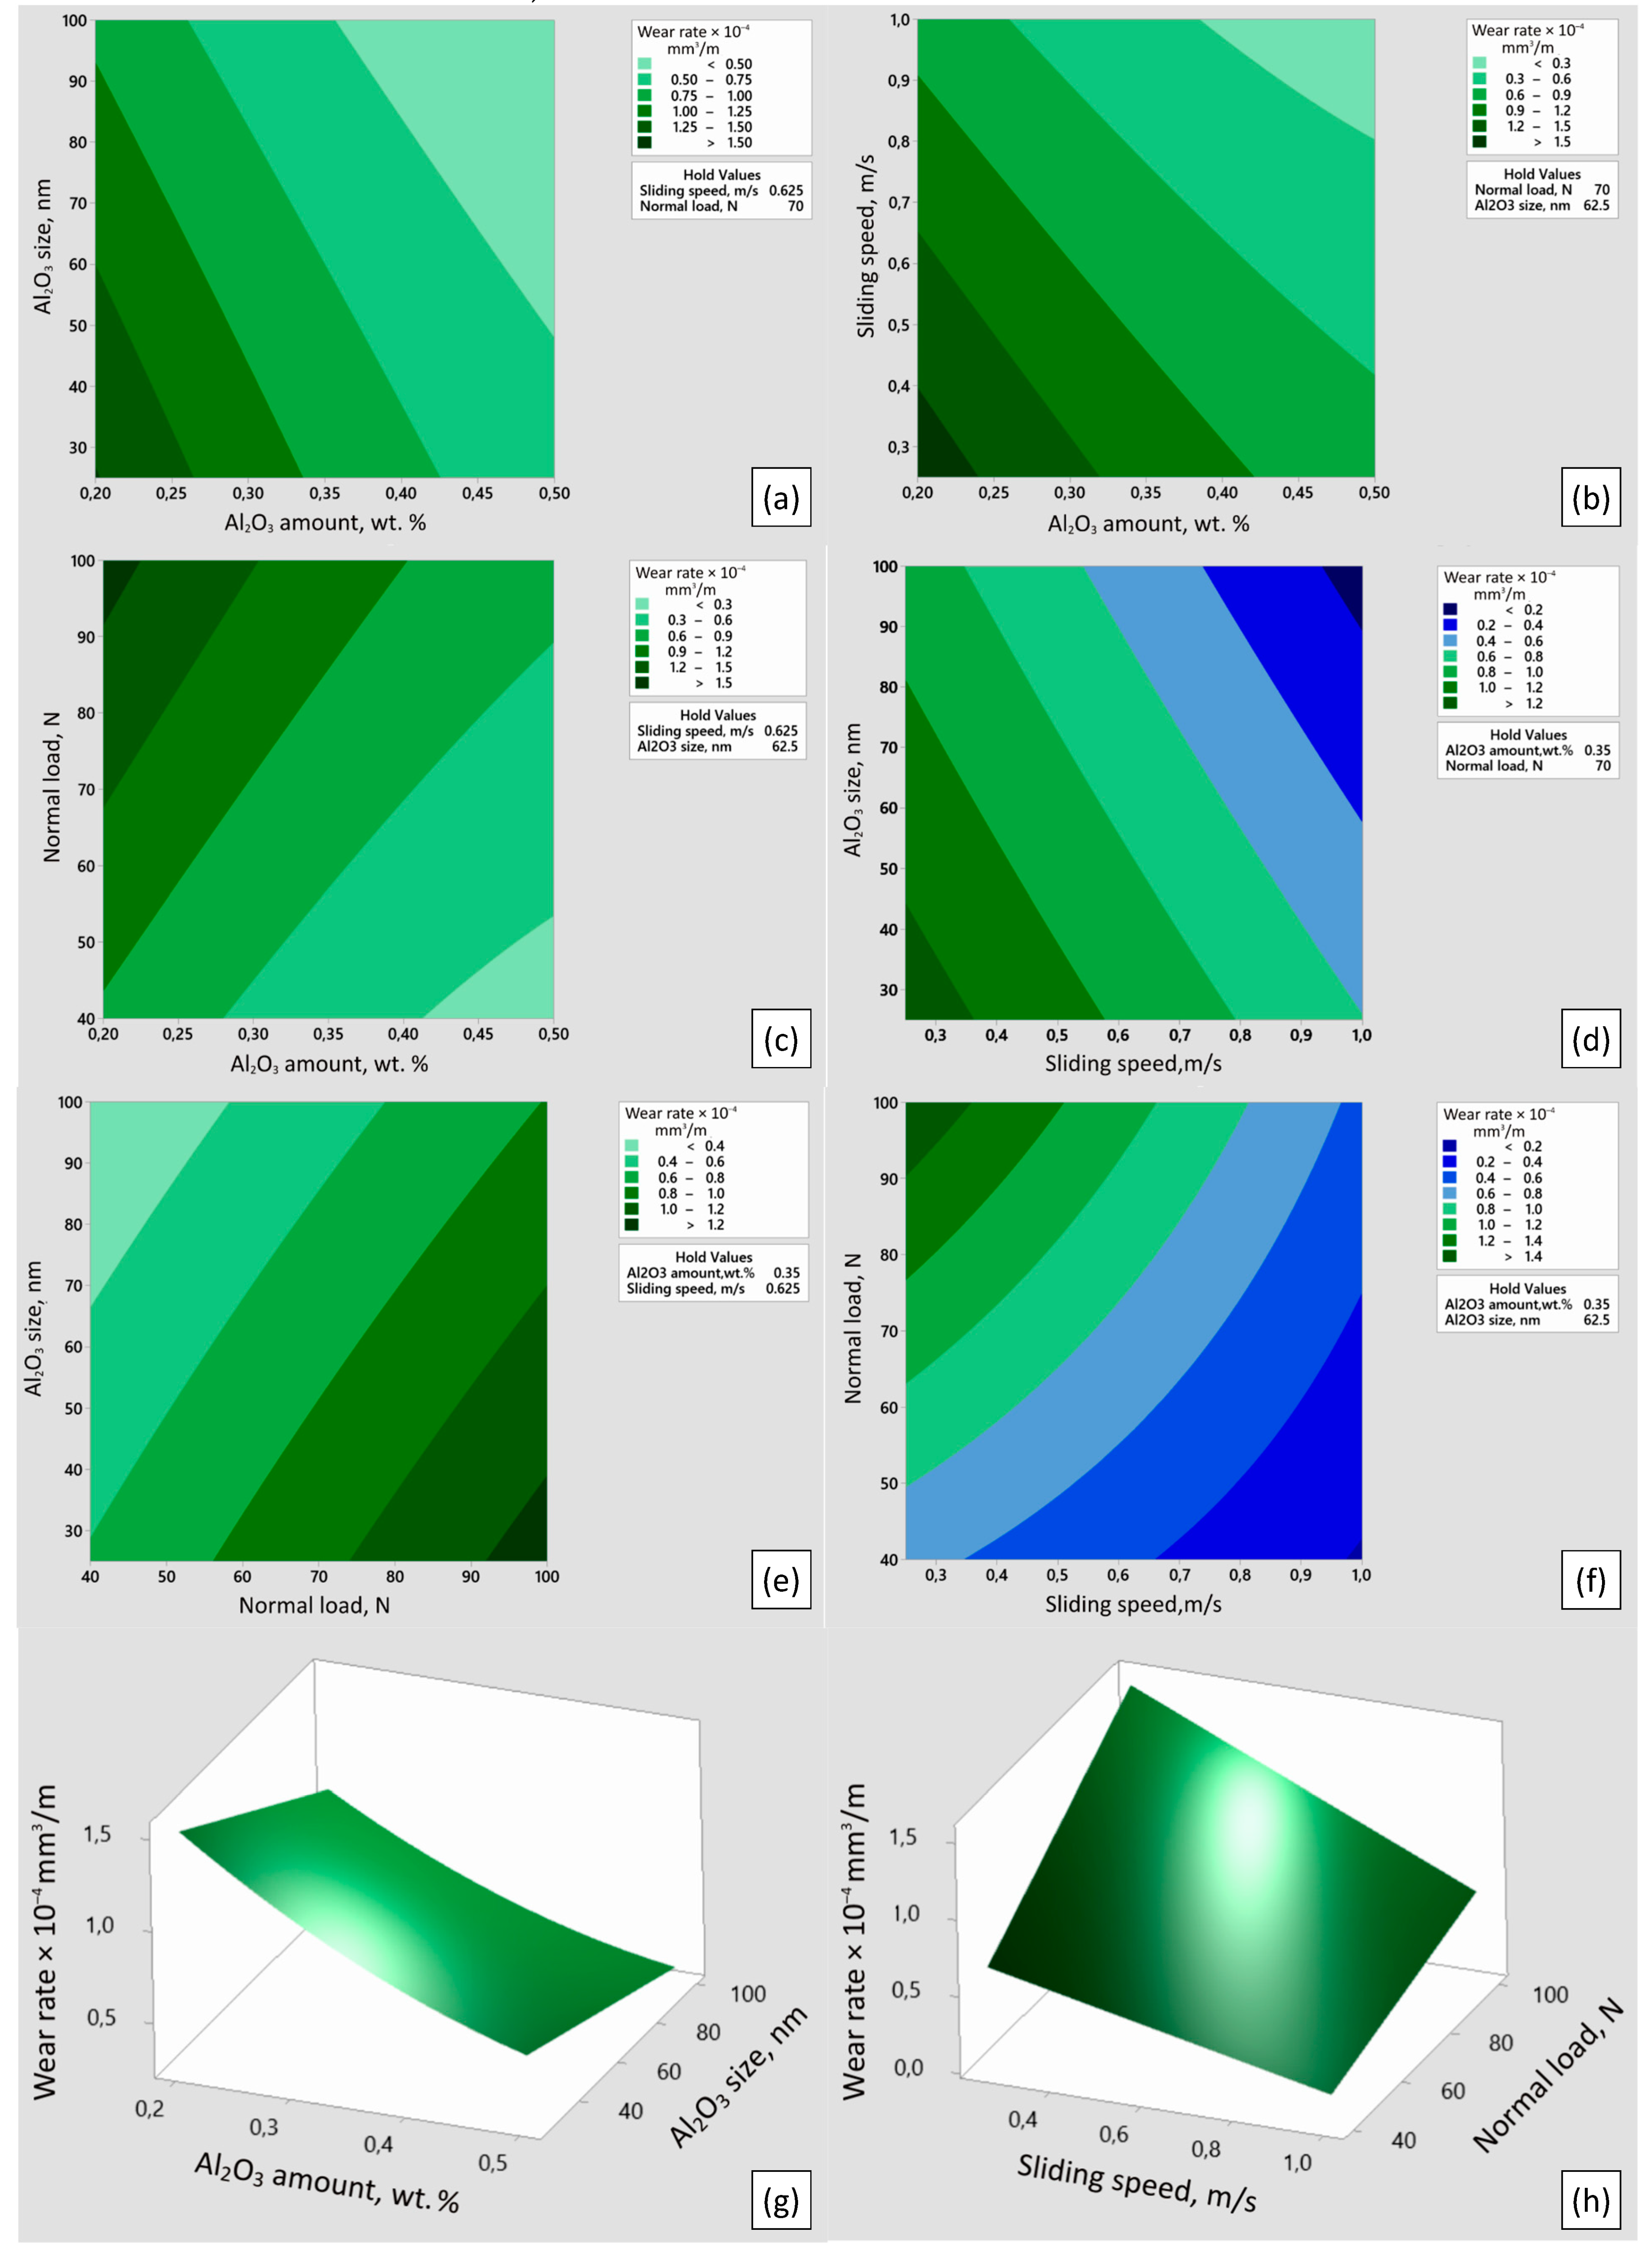
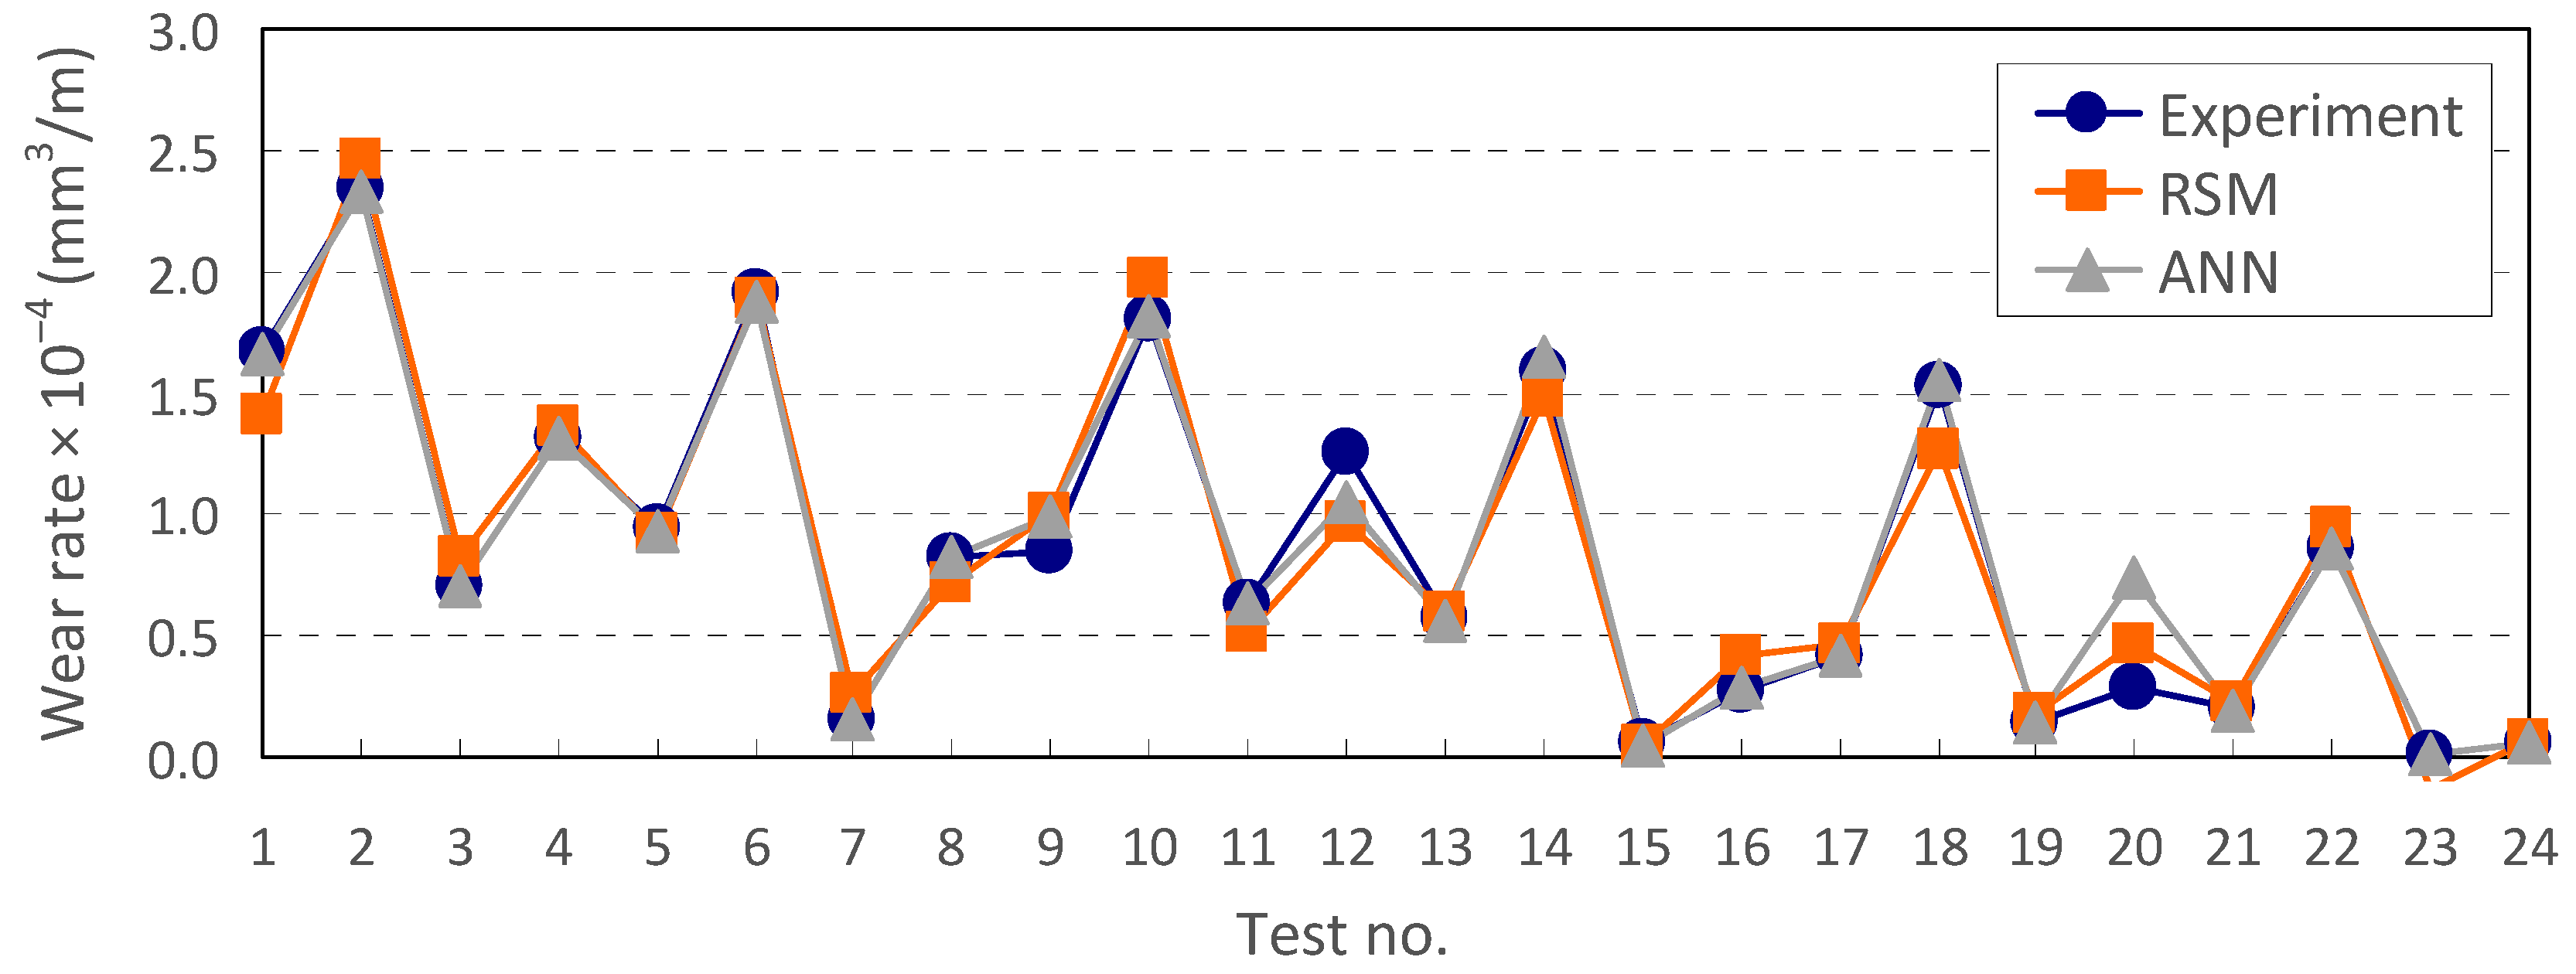
3.2. Wear Rate
+ 1.316 · A · C − 0.0139 · A · D − 0.0012 · B · C − 0.000019 · B · D − 0.01135 · C · D
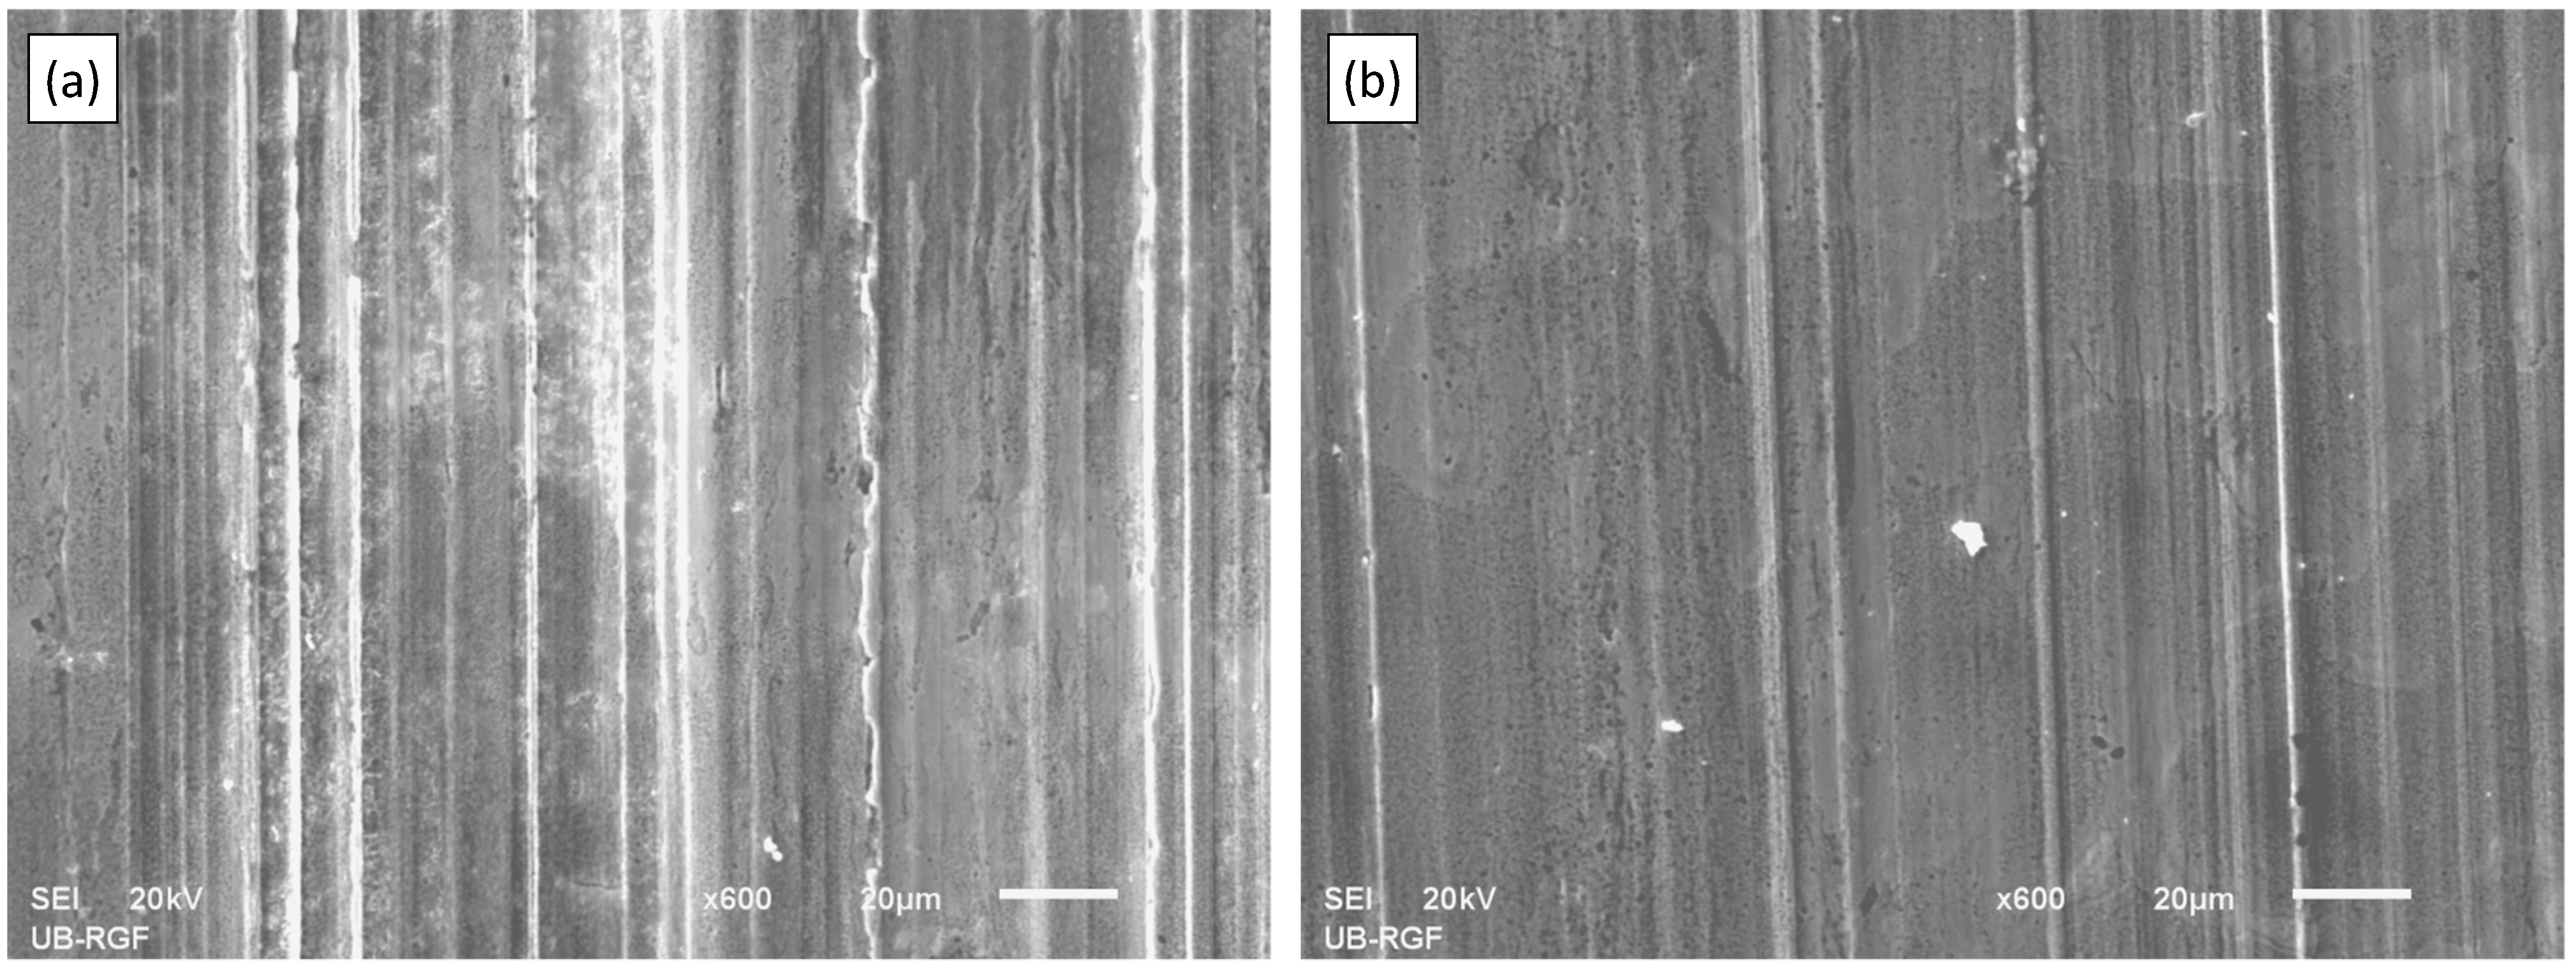
3.3. Wear Mechanism
4. Conclusions
Author Contributions
Funding
Data Availability Statement
Conflicts of Interest
References
- Rohatgi, P.K.; Schultz, B. Lightweight metal matrix nanocomposites—Stretching the boundaries of metals. Mater. Matters 2007, 2, 16–20. [Google Scholar]
- Casati, R.; Vedani, M. Metal matrix composites reinforced by nano-particles—A review. Metals 2014, 4, 65–83. [Google Scholar] [CrossRef] [Green Version]
- Vencl, A.; Stojanović, B.; Gojković, R.; Klančnik, S.; Czifra, Á.; Jakimovska, K.; Harničárová, M. Enhancing of ZA-27 alloy wear characteristics by addition of small amount of SiC nanoparticles and its optimisation applying Taguchi method. Tribol. Mater. 2022, 1, 96–105. [Google Scholar] [CrossRef]
- Shivakumar, N.; Vasu, V.; Narasaiah, N. Synthesis and characterization of nano-sized Al2O3 particle reinforced ZA-27 metal matrix composites. Procedia Mater. Sci. 2015, 10, 159–167. [Google Scholar] [CrossRef] [Green Version]
- Çelebi, M.; Çanakçi, A.; Özkaya, S.; Karabacak, A.H. The effect of milling time on the mechanical properties of ZA27/Al2O3 nanocomposites. Univers. J. Mater. Sci. 2018, 6, 163–169. [Google Scholar] [CrossRef] [Green Version]
- Bobić, B.; Vencl, A.; Ružić, J.; Bobić, I.; Damnjanović, Z. Microstructural and basic mechanical characteristics of ZA27 alloy-based nanocomposites synthesized by mechanical milling and compocasting. J. Compos. Mater. 2019, 53, 2033–2046. [Google Scholar] [CrossRef]
- Vencl, A.; Bobić, I.; Bobić, B.; Jakimovska, K.; Svoboda, P.; Kandeva, M. Erosive wear properties of ZA-27 alloy-based nanocomposites: Influence of type, amount and size of nanoparticle reinforcements. Friction 2019, 7, 340–350. [Google Scholar] [CrossRef] [Green Version]
- Vencl, A.; Bobić, I.; Jovanović, M.T.; Babić, M.; Mitrović, S. Microstructural and tribological properties of A356 Al-Si alloy reinforced with Al2O3 particles. Tribol. Lett. 2008, 32, 159–170. [Google Scholar] [CrossRef]
- Stojanović, B.; Gajević, S.; Kostić, N.; Miladinović, S.; Vencl, A. Optimization of parameters that affect wear of A356/Al2O3 nanocomposites using RSM, ANN, GA and PSO methods. Ind. Lubr. Tribol. 2022, 74, 350–359. [Google Scholar] [CrossRef]
- Vorkapić, M.; Mladenović, I.; Pergal, M.; Ivanov, T.; Baltić, M. Optimisation of tensile stress of poly(lactic acid) 3D printed materials using response surface methodology. Tribol. Mater. 2022, 1, 70–80. [Google Scholar] [CrossRef]
- Yankov, E.; Minev, R.; Tonchev, N.; Lazov, L. Determination of the optimal mode of laser surface marking of aluminium composite panels with CO2 laser. Tribol. Mater. 2022, 1, 114–119. [Google Scholar] [CrossRef]
- Vencl, A.; Stojanović, B.; Miladinović, S.; Klobčar, D. Prediction of the wear characteristics of ZA-27/SiC nanocomposites using the artificial neural network. In Proceedings of the 6th International Scientific Conference “COMETa 2022”, Jahorina, Bosnia and Herzegovina, 17–19 November 2022; pp. 107–114. [Google Scholar]
- Rohatgi, P.K.; Liu, Y.; Ray, S. Friction and wear of metal-matrix composites. In ASM Handbook, Friction, Lubrication, and Wear Technology; Blau, P.J., Ed.; ASM International: Metals Park, OH, USA, 1992; Volume 18, pp. 801–811. [Google Scholar]
- Karimzadeh, F.; Enayati, M.H.; Tavoosi, M. Synthesis and characterization of Zn/Al2O3 nanocomposite by mechanical alloying. Mater. Sci. Eng. A 2008, 486, 45–48. [Google Scholar] [CrossRef]
- Vencl, A. Tribological behavior of ferrous-based APS coatings under dry sliding conditions. J. Therm. Spray Technol. 2015, 24, 671–682. [Google Scholar] [CrossRef]
- Kato, K.; Adachi, K. Wear mechanisms. In Modern Tribology Handbook; Bhushan, B., Ed.; CRC Press: Boca Raton, FL, USA, 2001; Chapter 7. [Google Scholar]
- Vencl, A.; Bobić, B.; Vučetić, F.; Svoboda, P.; Popović, V.; Bobić, I. Effect of Al2O3 nanoparticles and strontium addition on structural, mechanical and tribological properties of Zn25Al3Si alloy. J. Braz. Soc. Mech. Sci. Eng. 2018, 40, 513. [Google Scholar] [CrossRef]
- Kandeva, M.; Kalitchin, Z.; Zadorozhnaya, E.; Vencl, A. Performance characteristics of lubricant based on rapeseed oil containing different amounts of metal-containing additive. Ind. Lubr. Tribol. 2022, 74, 309–315. [Google Scholar] [CrossRef]


| Element | Al | Cu | Mg | Zn |
|---|---|---|---|---|
| Percentage | 25–27 | 2.0–2.5 | 0.015–0.02 | Balance |
| Factor | Unit | Level | ||
|---|---|---|---|---|
| 1 | 2 | 3 | ||
| A: Al2O3 amount | wt. % | 0.2 | 0.3 | 0.5 |
| B: Al2O3 size | nm | 25 | 100 | |
| C: sliding speed | m/s | 0.25 | 1.00 | |
| D: normal load | N | 40 | 100 | |
| Test no. | Al2O3 Amount, wt. % | Al2O3 Size, nm | Sliding Speed, m/s | Normal Load, N | Wear Rate × 10–4, mm3/m |
|---|---|---|---|---|---|
| 1 | 0.2 | 25 | 0.25 | 40 | 1.671859 |
| 2 | 0.2 | 25 | 0.25 | 100 | 2.337679 |
| 3 | 0.2 | 25 | 1 | 40 | 0.701434 |
| 4 | 0.2 | 25 | 1 | 100 | 1.315875 |
| 5 | 0.2 | 100 | 0.25 | 40 | 0.940843 |
| 6 | 0.2 | 100 | 0.25 | 100 | 1.911662 |
| 7 | 0.2 | 100 | 1 | 40 | 0.150596 |
| 8 | 0.2 | 100 | 1 | 100 | 0.825748 |
| 9 | 0.3 | 25 | 0.25 | 40 | 0.851294 |
| 10 | 0.3 | 25 | 0.25 | 100 | 1.800392 |
| 11 | 0.3 | 25 | 1 | 40 | 0.630633 |
| 12 | 0.3 | 25 | 1 | 100 | 1.249261 |
| 13 | 0.3 | 100 | 0.25 | 40 | 0.573598 |
| 14 | 0.3 | 100 | 0.25 | 100 | 1.591235 |
| 15 | 0.3 | 100 | 1 | 40 | 0.055426 |
| 16 | 0.3 | 100 | 1 | 100 | 0.277412 |
| 17 | 0.5 | 25 | 0.25 | 40 | 0.414330 |
| 18 | 0.5 | 25 | 0.25 | 100 | 1.532718 |
| 19 | 0.5 | 25 | 1 | 40 | 0.141480 |
| 20 | 0.5 | 25 | 1 | 100 | 0.281368 |
| 21 | 0.5 | 100 | 0.25 | 40 | 0.200666 |
| 22 | 0.5 | 100 | 0.25 | 100 | 0.861667 |
| 23 | 0.5 | 100 | 1 | 40 | 0.013621 |
| 24 | 0.5 | 100 | 1 | 100 | 0.062987 |
| Source | Degree of Freedom | Adjusted Sums of Square | Adjusted Mean Square | F-Value | p-Value |
|---|---|---|---|---|---|
| Model | 11 | 10.2340 | 0.93037 | 25.57 | 0.000 |
| Linear | 4 | 9.1493 | 2.28733 | 62.87 | 0.000 |
| Al2O3 amount | 1 | 2.5177 | 2.51766 | 69.20 | 0.000 |
| Al2O3 size | 1 | 1.1482 | 1.14815 | 31.56 | 0.000 |
| Sliding speed | 1 | 3.1590 | 3.15903 | 86.83 | 0.000 |
| Normal load | 1 | 2.3245 | 2.32447 | 63.89 | 0.000 |
| Square | 1 | 0.0406 | 0.04060 | 1.12 | 0.312 |
| Al2O3 amount × Al2O3 amount | 1 | 0.0406 | 0.04060 | 1.12 | 0.312 |
| 2-way interaction | 6 | 0.6295 | 0.10491 | 2.88 | 0.056 |
| Al2O3 amount × Al2O3 size | 1 | 0.0649 | 0.06494 | 1.78 | 0.206 |
| Al2O3 amount × sliding speed | 1 | 0.0909 | 0.09094 | 2.50 | 0.140 |
| Al2O3 amount × normal load | 1 | 0.0649 | 0.06488 | 1.78 | 0.207 |
| Al2O3 size × sliding speed | 1 | 0.0069 | 0.00686 | 0.19 | 0.672 |
| Al2O3 size × normal load | 1 | 0.0109 | 0.01085 | 0.30 | 0.595 |
| Sliding speed × normal load | 1 | 0.3910 | 0.39099 | 10.75 | 0.007 |
| Error | 12 | 0.4366 | 0.03638 | ||
| Total | 23 | 10.6706 |
| Test no. | Wear Rate × 10–4, mm3/m | |||
|---|---|---|---|---|
| RSM Predicted | RSM Error | ANN Predicted | ANN Error | |
| 1 | 1.41255 | 0.259309 | 1.66686 | 0.004998 |
| 2 | 2.46300 | −0.125321 | 2.33126 | 0.006419 |
| 3 | 0.82170 | −0.120266 | 0.70289 | −0.001455 |
| 4 | 1.36140 | −0.045525 | 1.31694 | −0.001060 |
| 5 | 0.92235 | 0.018493 | 0.93234 | 0.008505 |
| 6 | 1.88730 | 0.024362 | 1.87669 | 0.034968 |
| 7 | 0.26400 | −0.113404 | 0.15359 | −0.002993 |
| 8 | 0.71820 | 0.107548 | 0.82110 | 0.004648 |
| 9 | 1.00965 | −0.158356 | 0.99211 | −0.140817 |
| 10 | 1.97670 | −0.176308 | 1.81776 | −0.017371 |
| 11 | 0.51750 | 0.113133 | 0.62818 | 0.002449 |
| 12 | 0.97380 | 0.275461 | 1.04952 | 0.199744 |
| 13 | 0.60285 | −0.029252 | 0.56660 | 0.006995 |
| 14 | 1.48440 | 0.106835 | 1.65411 | −0.062870 |
| 15 | 0.04320 | 0.012226 | 0.05107 | 0.004356 |
| 16 | 0.41400 | −0.136588 | 0.28120 | −0.003788 |
| 17 | 0.47025 | −0.055920 | 0.41495 | −0.000617 |
| 18 | 1.27050 | 0.262218 | 1.54915 | −0.016427 |
| 19 | 0.17550 | −0.034020 | 0.14163 | −0.000147 |
| 20 | 0.46500 | −0.183632 | 0.74115 | −0.459785 |
| 21 | 0.23025 | −0.029584 | 0.19544 | 0.005228 |
| 22 | 0.94500 | −0.083333 | 0.86240 | −0.000736 |
| 23 | −0.13200 | 0.145621 | 0.00828 | 0.005345 |
| 24 | 0.07200 | −0.009013 | 0.06262 | 0.000362 |
Disclaimer/Publisher’s Note: The statements, opinions and data contained in all publications are solely those of the individual author(s) and contributor(s) and not of MDPI and/or the editor(s). MDPI and/or the editor(s) disclaim responsibility for any injury to people or property resulting from any ideas, methods, instructions or products referred to in the content. |
© 2023 by the authors. Licensee MDPI, Basel, Switzerland. This article is an open access article distributed under the terms and conditions of the Creative Commons Attribution (CC BY) license (https://creativecommons.org/licenses/by/4.0/).
Share and Cite
Vencl, A.; Svoboda, P.; Klančnik, S.; But, A.; Vorkapić, M.; Harničárová, M.; Stojanović, B. Influence of Al2O3 Nanoparticles Addition in ZA-27 Alloy-Based Nanocomposites and Soft Computing Prediction. Lubricants 2023, 11, 24. https://0-doi-org.brum.beds.ac.uk/10.3390/lubricants11010024
Vencl A, Svoboda P, Klančnik S, But A, Vorkapić M, Harničárová M, Stojanović B. Influence of Al2O3 Nanoparticles Addition in ZA-27 Alloy-Based Nanocomposites and Soft Computing Prediction. Lubricants. 2023; 11(1):24. https://0-doi-org.brum.beds.ac.uk/10.3390/lubricants11010024
Chicago/Turabian StyleVencl, Aleksandar, Petr Svoboda, Simon Klančnik, Adrian But, Miloš Vorkapić, Marta Harničárová, and Blaža Stojanović. 2023. "Influence of Al2O3 Nanoparticles Addition in ZA-27 Alloy-Based Nanocomposites and Soft Computing Prediction" Lubricants 11, no. 1: 24. https://0-doi-org.brum.beds.ac.uk/10.3390/lubricants11010024