Article

A Discussion on Present Theories of Rubber Friction, with Particular Reference to Different Possible Choices of Arbitrary Roughness Cutoff Parameters

1
Department of Industrial Engineering, University of Naples Federico II, Via Claudio, 21-80125 Naples, Italy
2
Department of Mechanics, Mathematics and Management, Politecnico di Bari, Via Orabona 4, 70125 Bari, Italy
3
Department of Mechanical Engineering, Hamburg University of Technology, Am Schwarzenberg-Campus 1, 21073 Hamburg, Germany
*
Author to whom correspondence should be addressed.
Submission received: 24 July 2019 / Revised: 19 September 2019 / Accepted: 24 September 2019 / Published: 26 September 2019
(This article belongs to the Special Issue Adhesion, Friction and Lubrication of Viscoelastic Materials)

Abstract

:
Since the early study by Grosch in 1963 it has been known that rubber friction shows generally two maxima with respect to speed—the first one attributed to adhesion, and another at higher velocities attributed to viscoelastic losses. The theory of Klüppel and Heinrich and that of Persson suggests that viscoelastic losses crucially depend on the “multiscale” aspect of roughness and in particular on truncation at fine scales. In this study, we comment a little on both theories, giving some examples using Persson’s theory on the uncertainties involved in the truncation of the roughness spectrum. It is shown how different choices of Persson’s model parameters, for example the high-frequency cutoff, equally fit experimental data on viscoelastic friction, hence it is unclear how to rigorously separate the adhesive and the viscoelastic contributions from experiments.

Graphical Abstract

1. Introduction

After the fundamental study by Grosch [1], who took advantage of the other fundamental study of Williams Landel & Ferry [2] which relates temperature and rate dependence of viscoelastic properties, it is known that rubber friction shows two maxima as a function of speed, one more easily attributed to adhesion with the track, and another at high velocities due to viscoelastic losses. In the search for more quantitative models, two main theories appeared, one by Klüppel and Heinrich [3], and another by Persson [4], both concentrating heavily on the multiscale nature of surfaces and their fractal roughness, which introduced more than one complication. For about 20 years, we have had to solve several mathematical problems to deal with the fractal roughness issue, how to rigorously define the measurement and the mathematical structure, and all theories have experienced several problems to define cutoffs to the fractal scaling, particularly at short scales [5], where generally friction would tend towards extremely high values and hence the choice of the truncation is critical.
Klüppel and Heinrich’s early theories [3] recognize this problem more explicitly than Persson’s original paper [4] as an upper cutoff frequency ωmax = 2πvmin is introduced into the integral of their Equation (35), where λmin is the lower cutoff length of the excitation spectra and v is the velocity. They showed that the results strongly depend on λmin as v2 in their Equation (36) does depend on λmin. On the other hand, differently from Persson’s theory, they use the elastic contact model of the Greenwood and Williamson (GW) asperity model for the contact mechanics, which has later found to have some limitations and to be inaccurate, especially for broad spectra of roughness. A profound analysis of their theory is not simple: GW seems to lead to reasonable predictions for the mean penetration depth, which appears to depend only on macroscopic wavelengths, as does Persson’s theory much later [6] (see also [7]). For the cutoff λmin, they introduce an energy balance [3] in the presence of adhesion, which turns out to be relevant only in the normal force regime, i.e., when the external load is dominant for the formation of elastic contacts, giving a cutoff λmin very sensible to the surface fractal dimension, especially in the limit of D ≅ 2, which in turns is the most common case for real surfaces. Contrary to Persson [4], Klüppel and Heinrich [3] suggest that adhesion-induced hysteretic losses may play a role only for extremely smooth surfaces, such as glasses with D = 2, but they do not seem to be relevant on rough surfaces such as road tracks with typical D = 2.2. Klüppel and Heinrich [3] try to apply the theory to the original cases of Grosch, namely friction on the silicon carbide paper and the glass surface, by changing the broadness of the spectrum, although only very qualitatively, and not really explaining the appearance of the two maxima in the case of Grosch data on silicon carbide: choices of cutoffs are not immediately clear to the reader.
Persson’s theory, on the other hand, in the latest forms (Lorenz et al. [8]), seems to have a surprisingly simple criterion for truncation wavenumber q1 = 2π/λmin: it is defined where the rms slope reaches
Hrms (q1) = 1.3
although other authors (Carbone & Putignano [9]) are more cautious about many possible choices to the truncation cutoff, e.g., small dirt particles or rubber wear particles.
However, more recently, both Klüppel and co-authors [10,11,12] and Persson and Volokitin [13] seem to attribute a lot more importance to the adhesive term than the viscoelastic one. For example, Lang & Klüppel [12], has an adhesion contribution attributed to peeling effects at the edges which depends on velocity and viscoelastic properties in the simplified form
τ s = τ s 0 ( 1 + E / E 0 ( 1 + v c / v ) n )
where τs0 is a static shear stress for very low velocities and vc is a certain critical velocity to a plateau. There are explicit expressions for τs0 based on contact angle measurements; obviously E/E0 is the ratio of dynamic modulus in a glassy and rubbery state, n can be estimated from the power law behavior of the relaxation time spectra H(τ) in the glass transition range. Notice that this term is then multiplied by the real contact area, and hence the dependence on roughness spectrum and its truncation is very important. Even the viscoelastic properties, which in Equation (2) are limited to two elastic moduli, with no reference to relaxation spectra, could have more effect on the contact area. The agreement with an extensive set of measurements is quite good over an extensive range of velocities, except perhaps at very low ones of the order of 10−4 m/s, where the discrepancy is significant.
Turning back to recent Persson’s theories [8,13], the dominant mechanics is also adhesion, and for it, based on ideas such as stretching, detaching, relaxing, and reattaching of rubber molecules of Schallamach/Cherniak (see Persson and Volokitin [13]), they suggest an adhesive contribution proportional to the frictional shear stress, which is a Gaussian-like curve as a function of the logarithm sliding velocity:
μ adh = τ f p 0 A A 0
where
τ f = τ f 0 exp [ c ( log 10 v v * ) 2 ]
and where A/A0 is the relative contact area, p0 is the nominal contact pressure and v is the sliding velocity. This adhesive contribution on one hand, is also very simple in form, and basically as semi-empirical as is Klüppel’s one, but on the other, is symmetrical contrary to the Lang & Klüppel [12]. It maintains the complications (or the effects) of the full-contact mechanics theory with roughness, since the contact area A/A0 depends in principle on the full viscoelastic spectrum, and on the full roughness spectrum. However, in the end, the choices of the factors τf0, c, and v* are not from independent experiments such as contact angle measurements in Lang & Klüppel [12].
In this paper, short of making a full comparison of the Klüppel and Persson’s theories, which both seem (at least in the presentation of their authors) to fit friction measurements quite well, we discuss how the choice to be made about the truncation of the spectrum influences the determination of the various coefficients, with reference in particular to Persson’s theory. Here, we shall use in particular a simplified version for the viscoelastic losses, since they are no longer considered so relevant. Persson, indeed, in recent papers (Tolpekina & Persson, [14], see also [15]), seems to agree with Klüppel [10,11,12] (just looking at the how the friction data are separated into viscoelastic and adhesive contributions) that the contribution due to adhesion is now considered prevalent over the hysteretic one. Obviously, this shift is also a sign of the uncertainty of the choice on how to interpret the two contributions (viscoelastic and adhesive ones), which appear to have a similar bell-shape. In this paper, we shall discuss exactly this point, where for brevity we consider only Persson’s theories.

2. Experimental Data
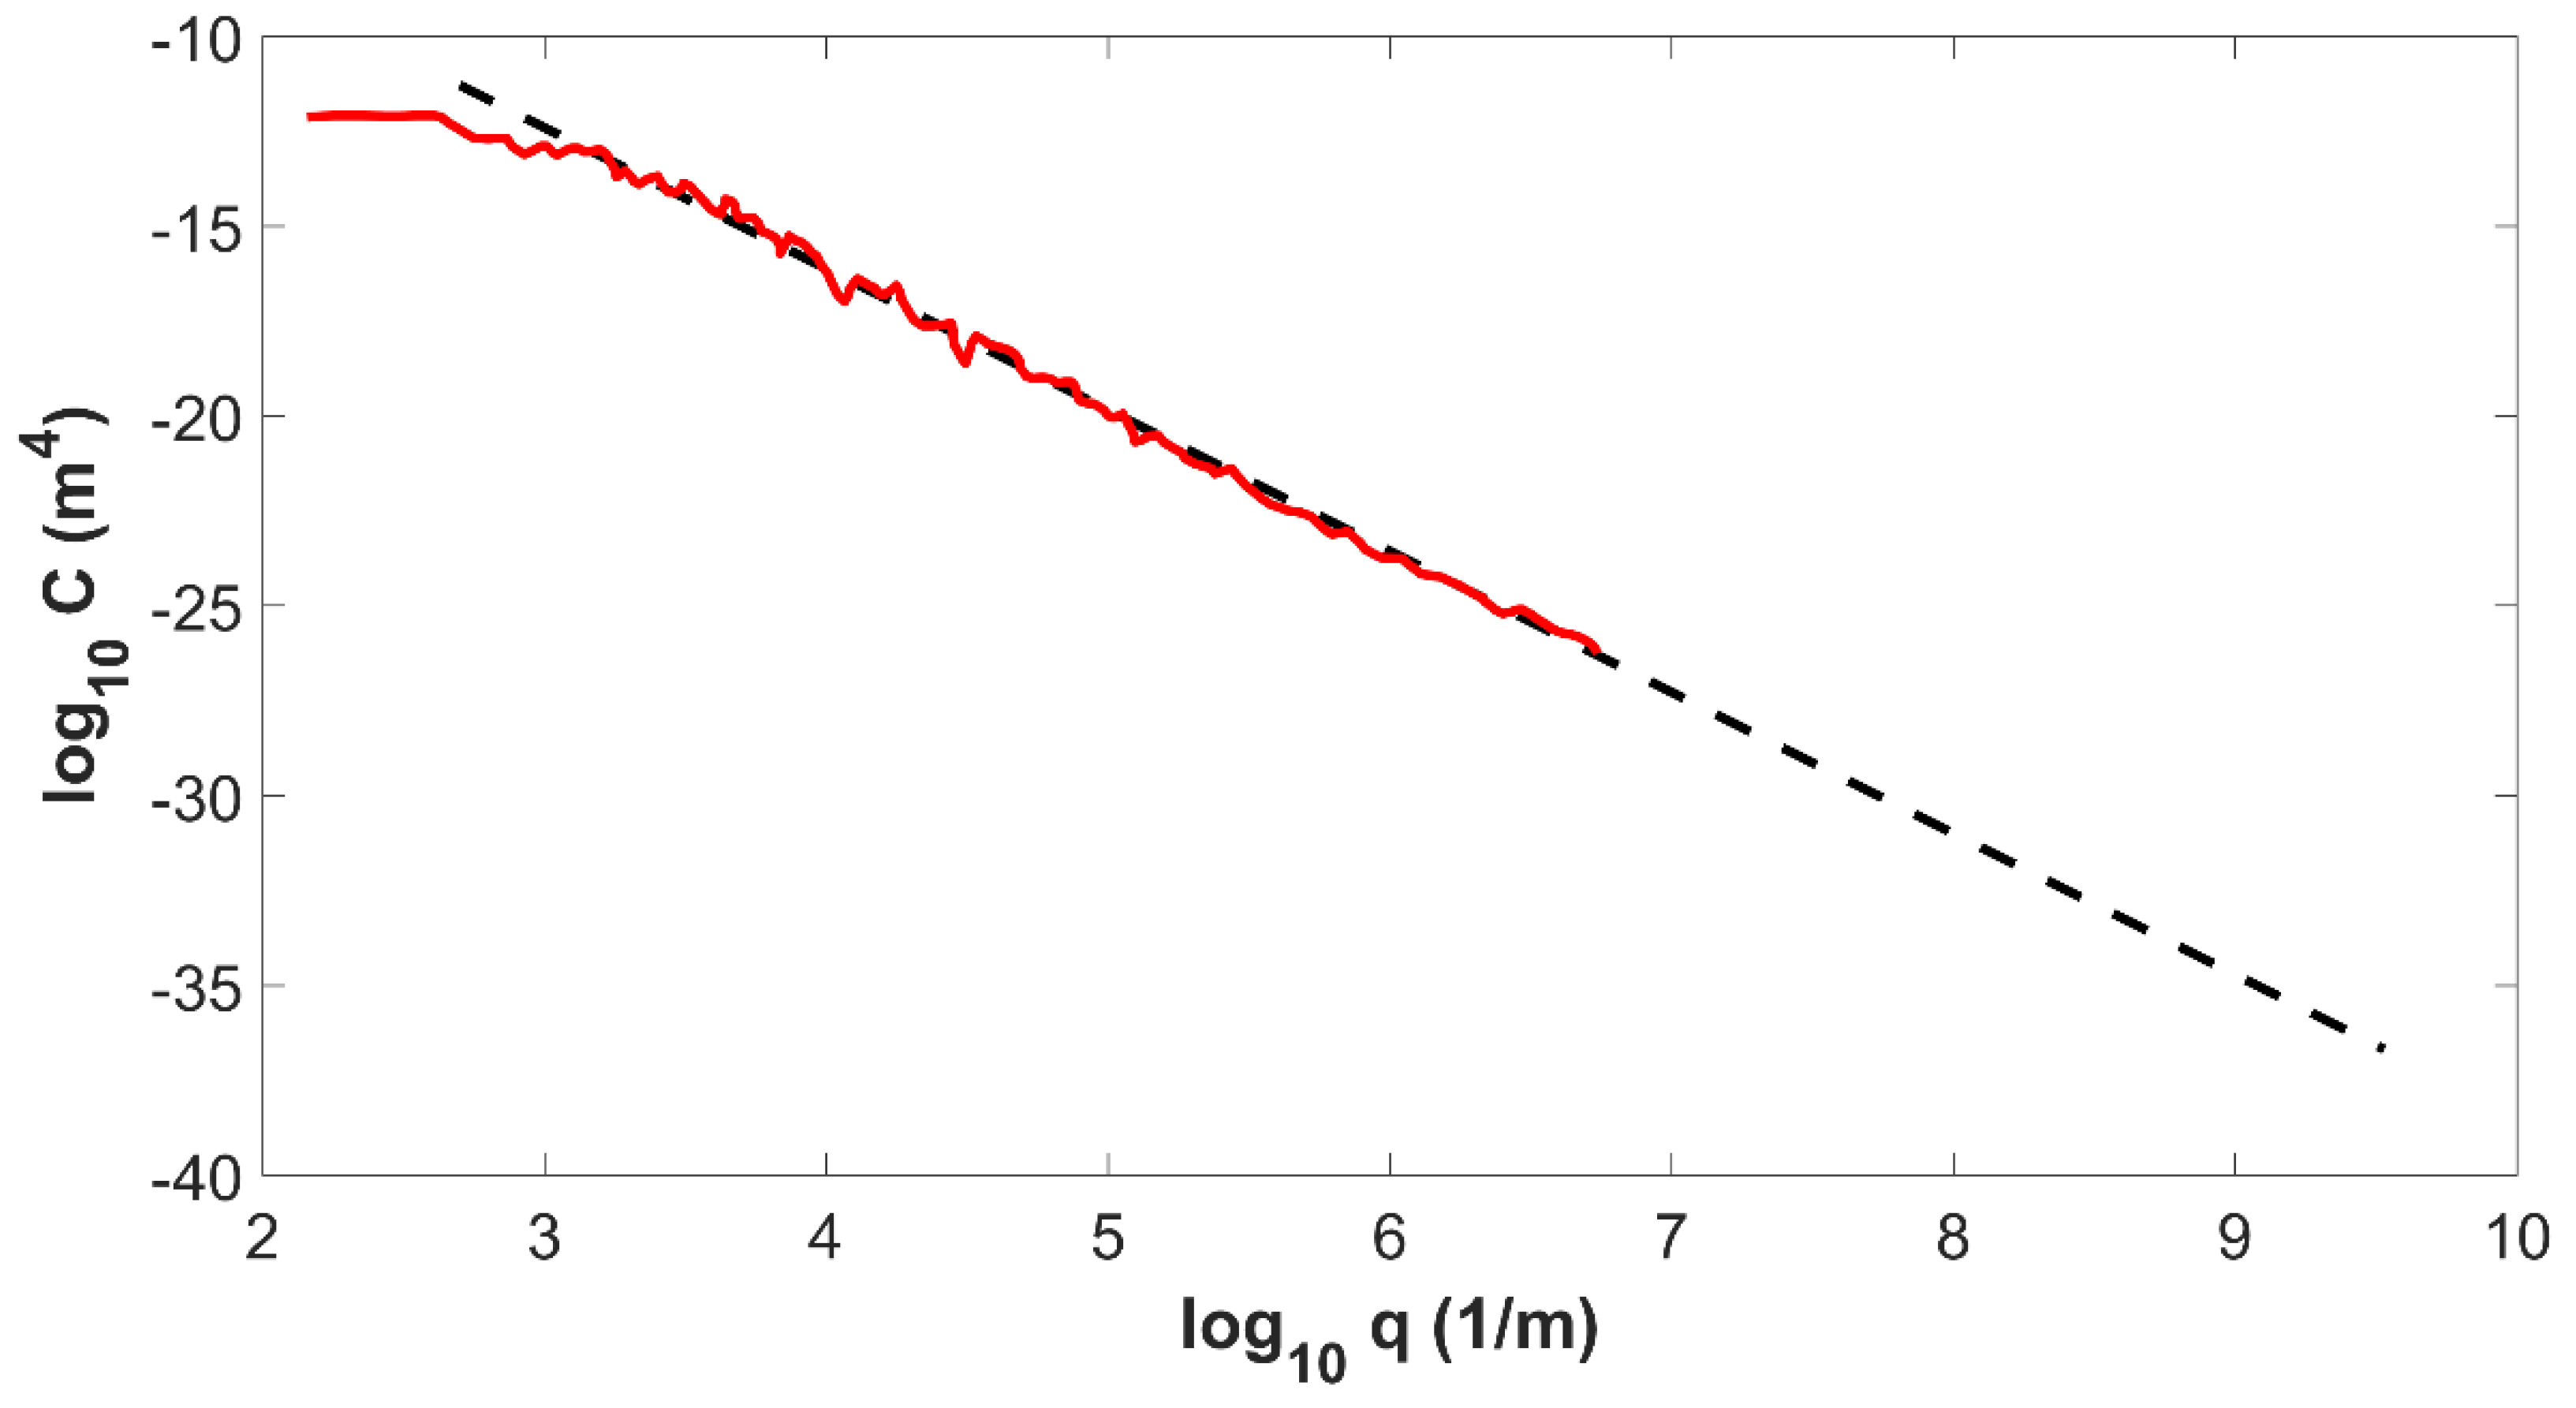
To analyze typical compounds of interest in asphalt vs. tire contact and to give a quantitative example of the analysis made, all of the following is referred to the experimental data obtained by Tolpekina and Persson [14] (TP in the following) for three different reference compounds A, B, and C (see [14]), on which quite general information are provided: “B is a summer tread compound filled with carbon black. A is a summer tread compound filled with silica and containing a traction resin. C is a winter tread compound, filled with silica and containing the same traction resin (in the same relative volume fraction) as for Compound A”. In the following subsection the power spectral density (PSD) of a rough surface, the viscoelastic properties of the rubber, and experimental friction data used as references for theoretical results are shown.

2.1. Surface PSD

For rough surface for the rubber friction analysis, a concrete block was considered. This type of substrate is very stable (negligible wear) and is easily available in a large number of nominally identical blocks. The most important information about the substrate is the surface roughness power spectrum. Notice that it is possible to find different normalization of the PSD and therefore it is important to pay attention to the formulations used for the calculation of the quantities such as the root-mean-square (RMS) height hrms, the RMS slope hrms, and the RMS curvature hrms [16]. Referring to the Persson formulation, Figure 1 shows the 2D surface roughness power spectrum of the concrete surface. The significant range of interest of this self-affine fractal power spectrum can be assumed to be a power law:
C ( q ) = C 0 · q 2 ( 1 + H )
where the Hurst exponent H = 0.86 and C0 = 0.001152 m^(2−2H). The wavenumber q0 considered in this study is q0 = 102.7 [1/m] but fortunately the choice of this truncation is not very relevant for friction estimation, while the choice of the large wavenumber cutoff is extremely more sensible and arbitrary, as debated in the next section.

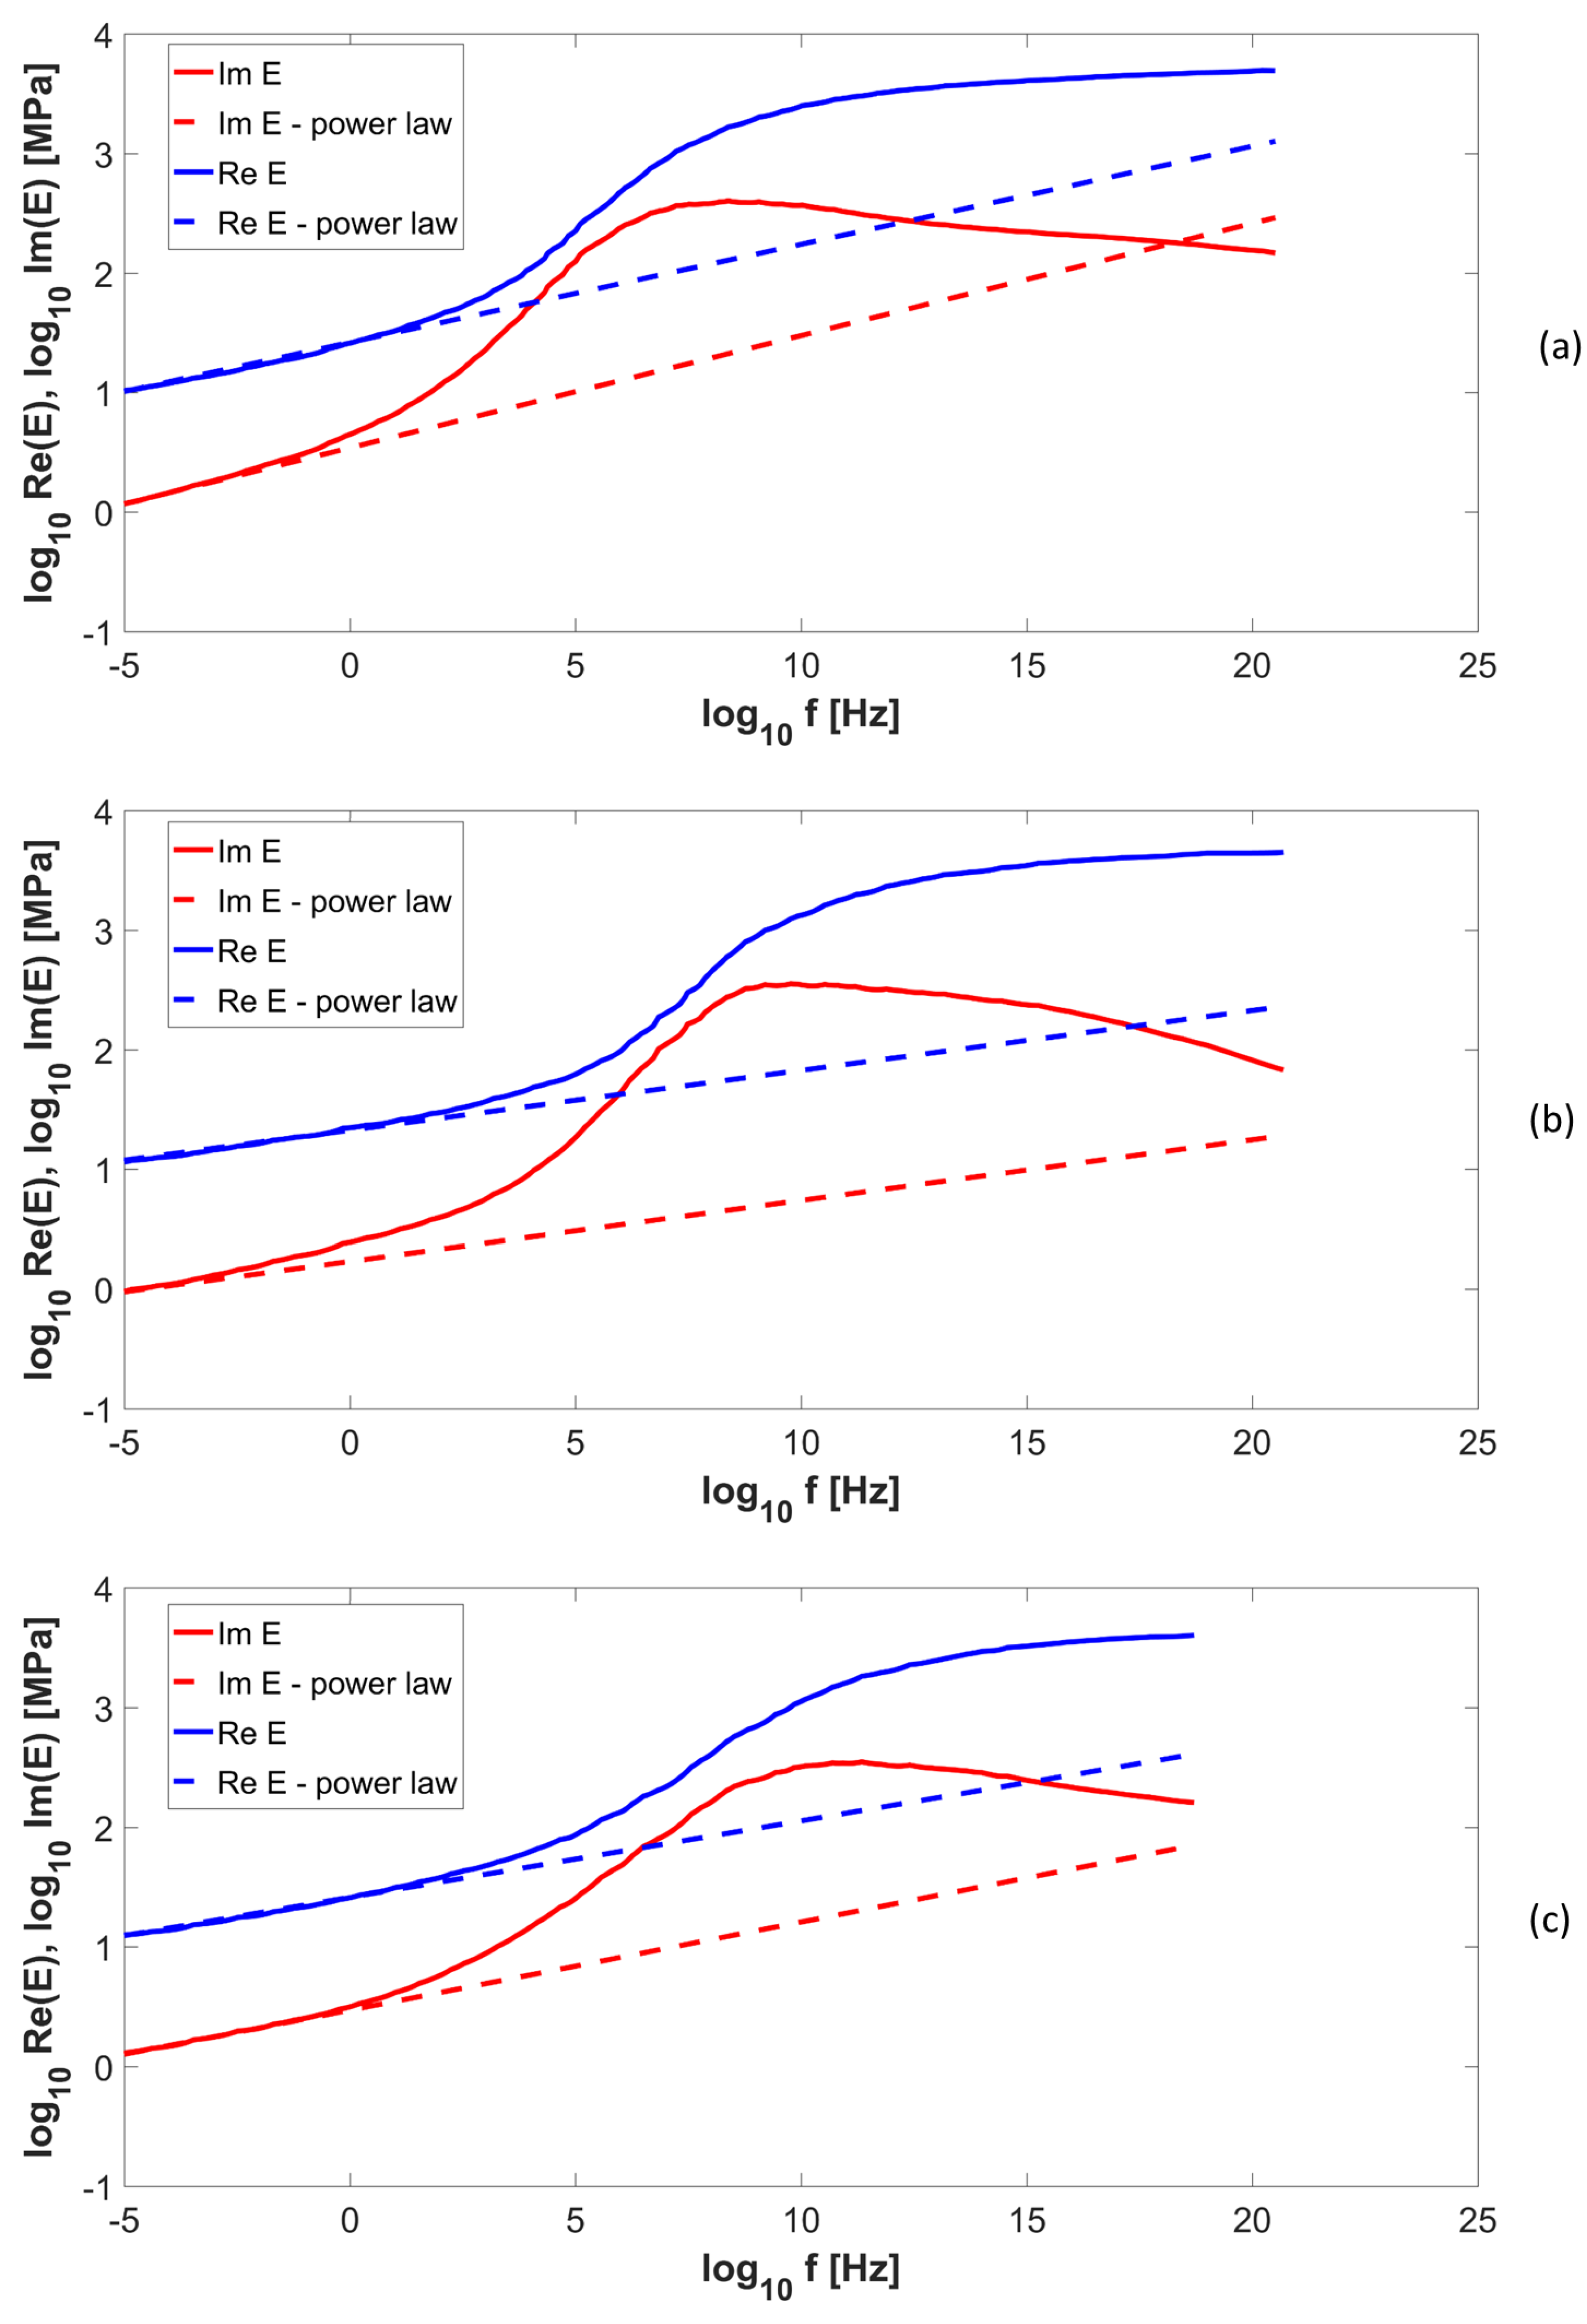
2.2. Material Viscoelastic Properties
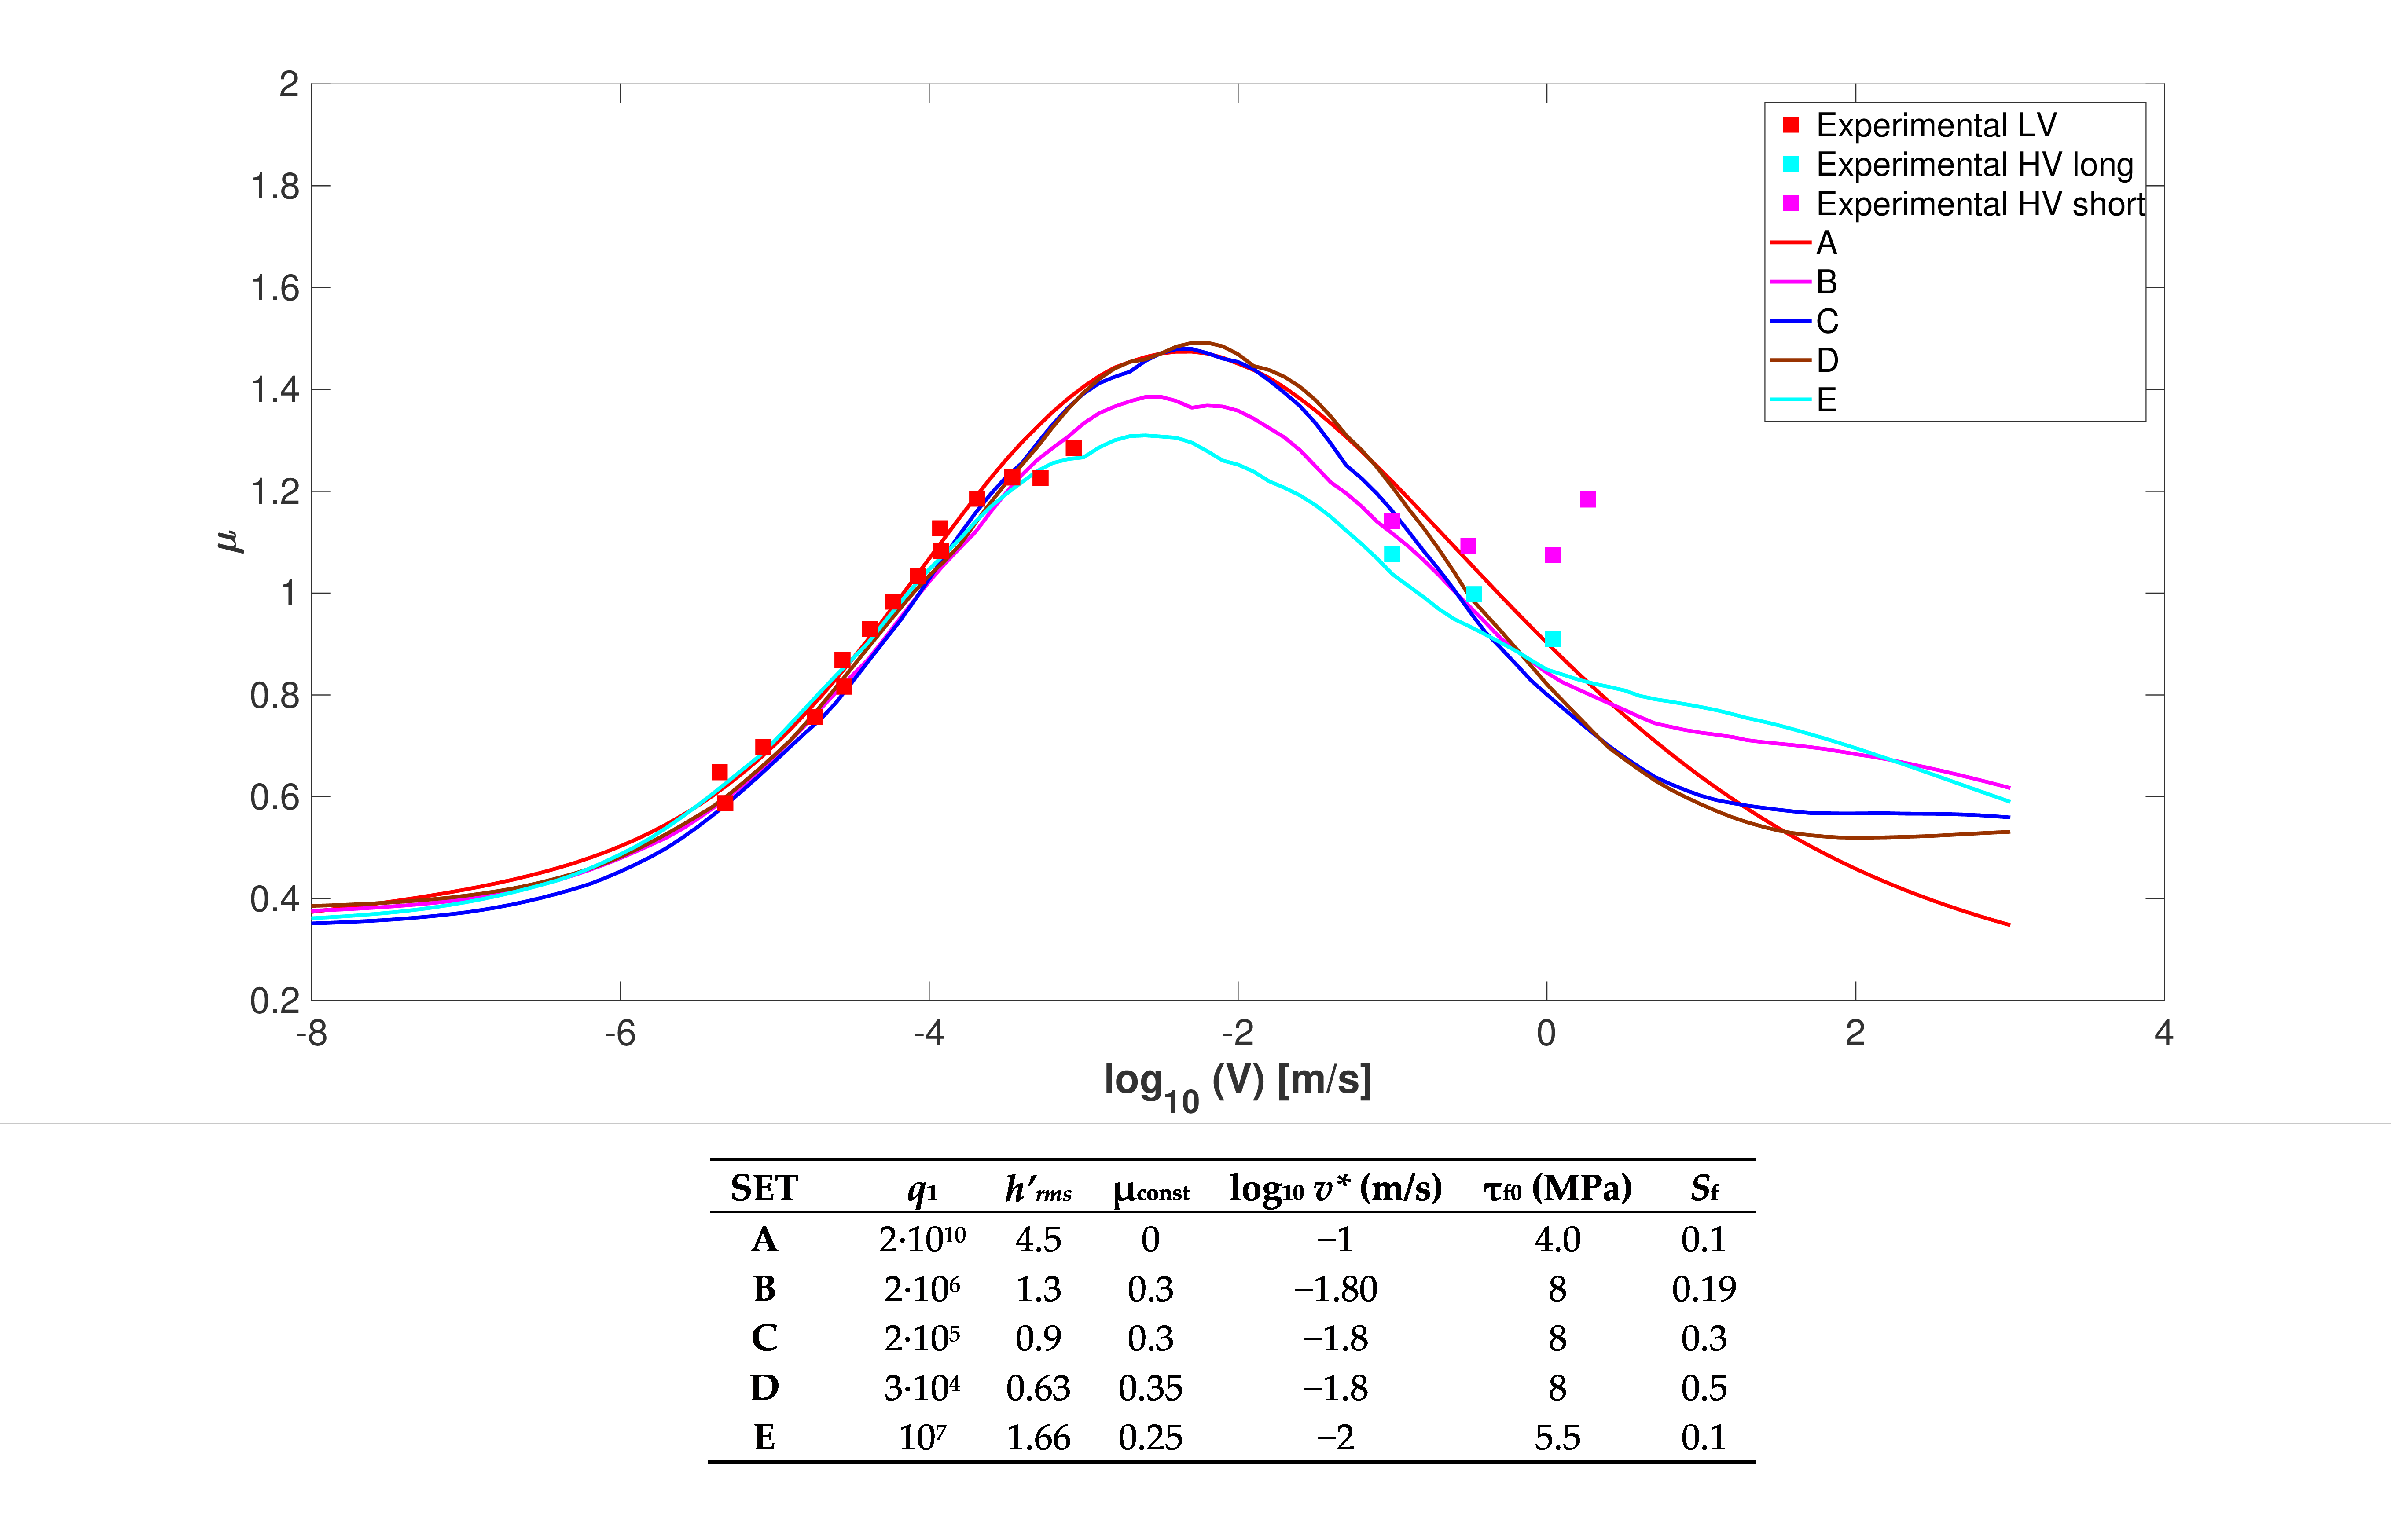
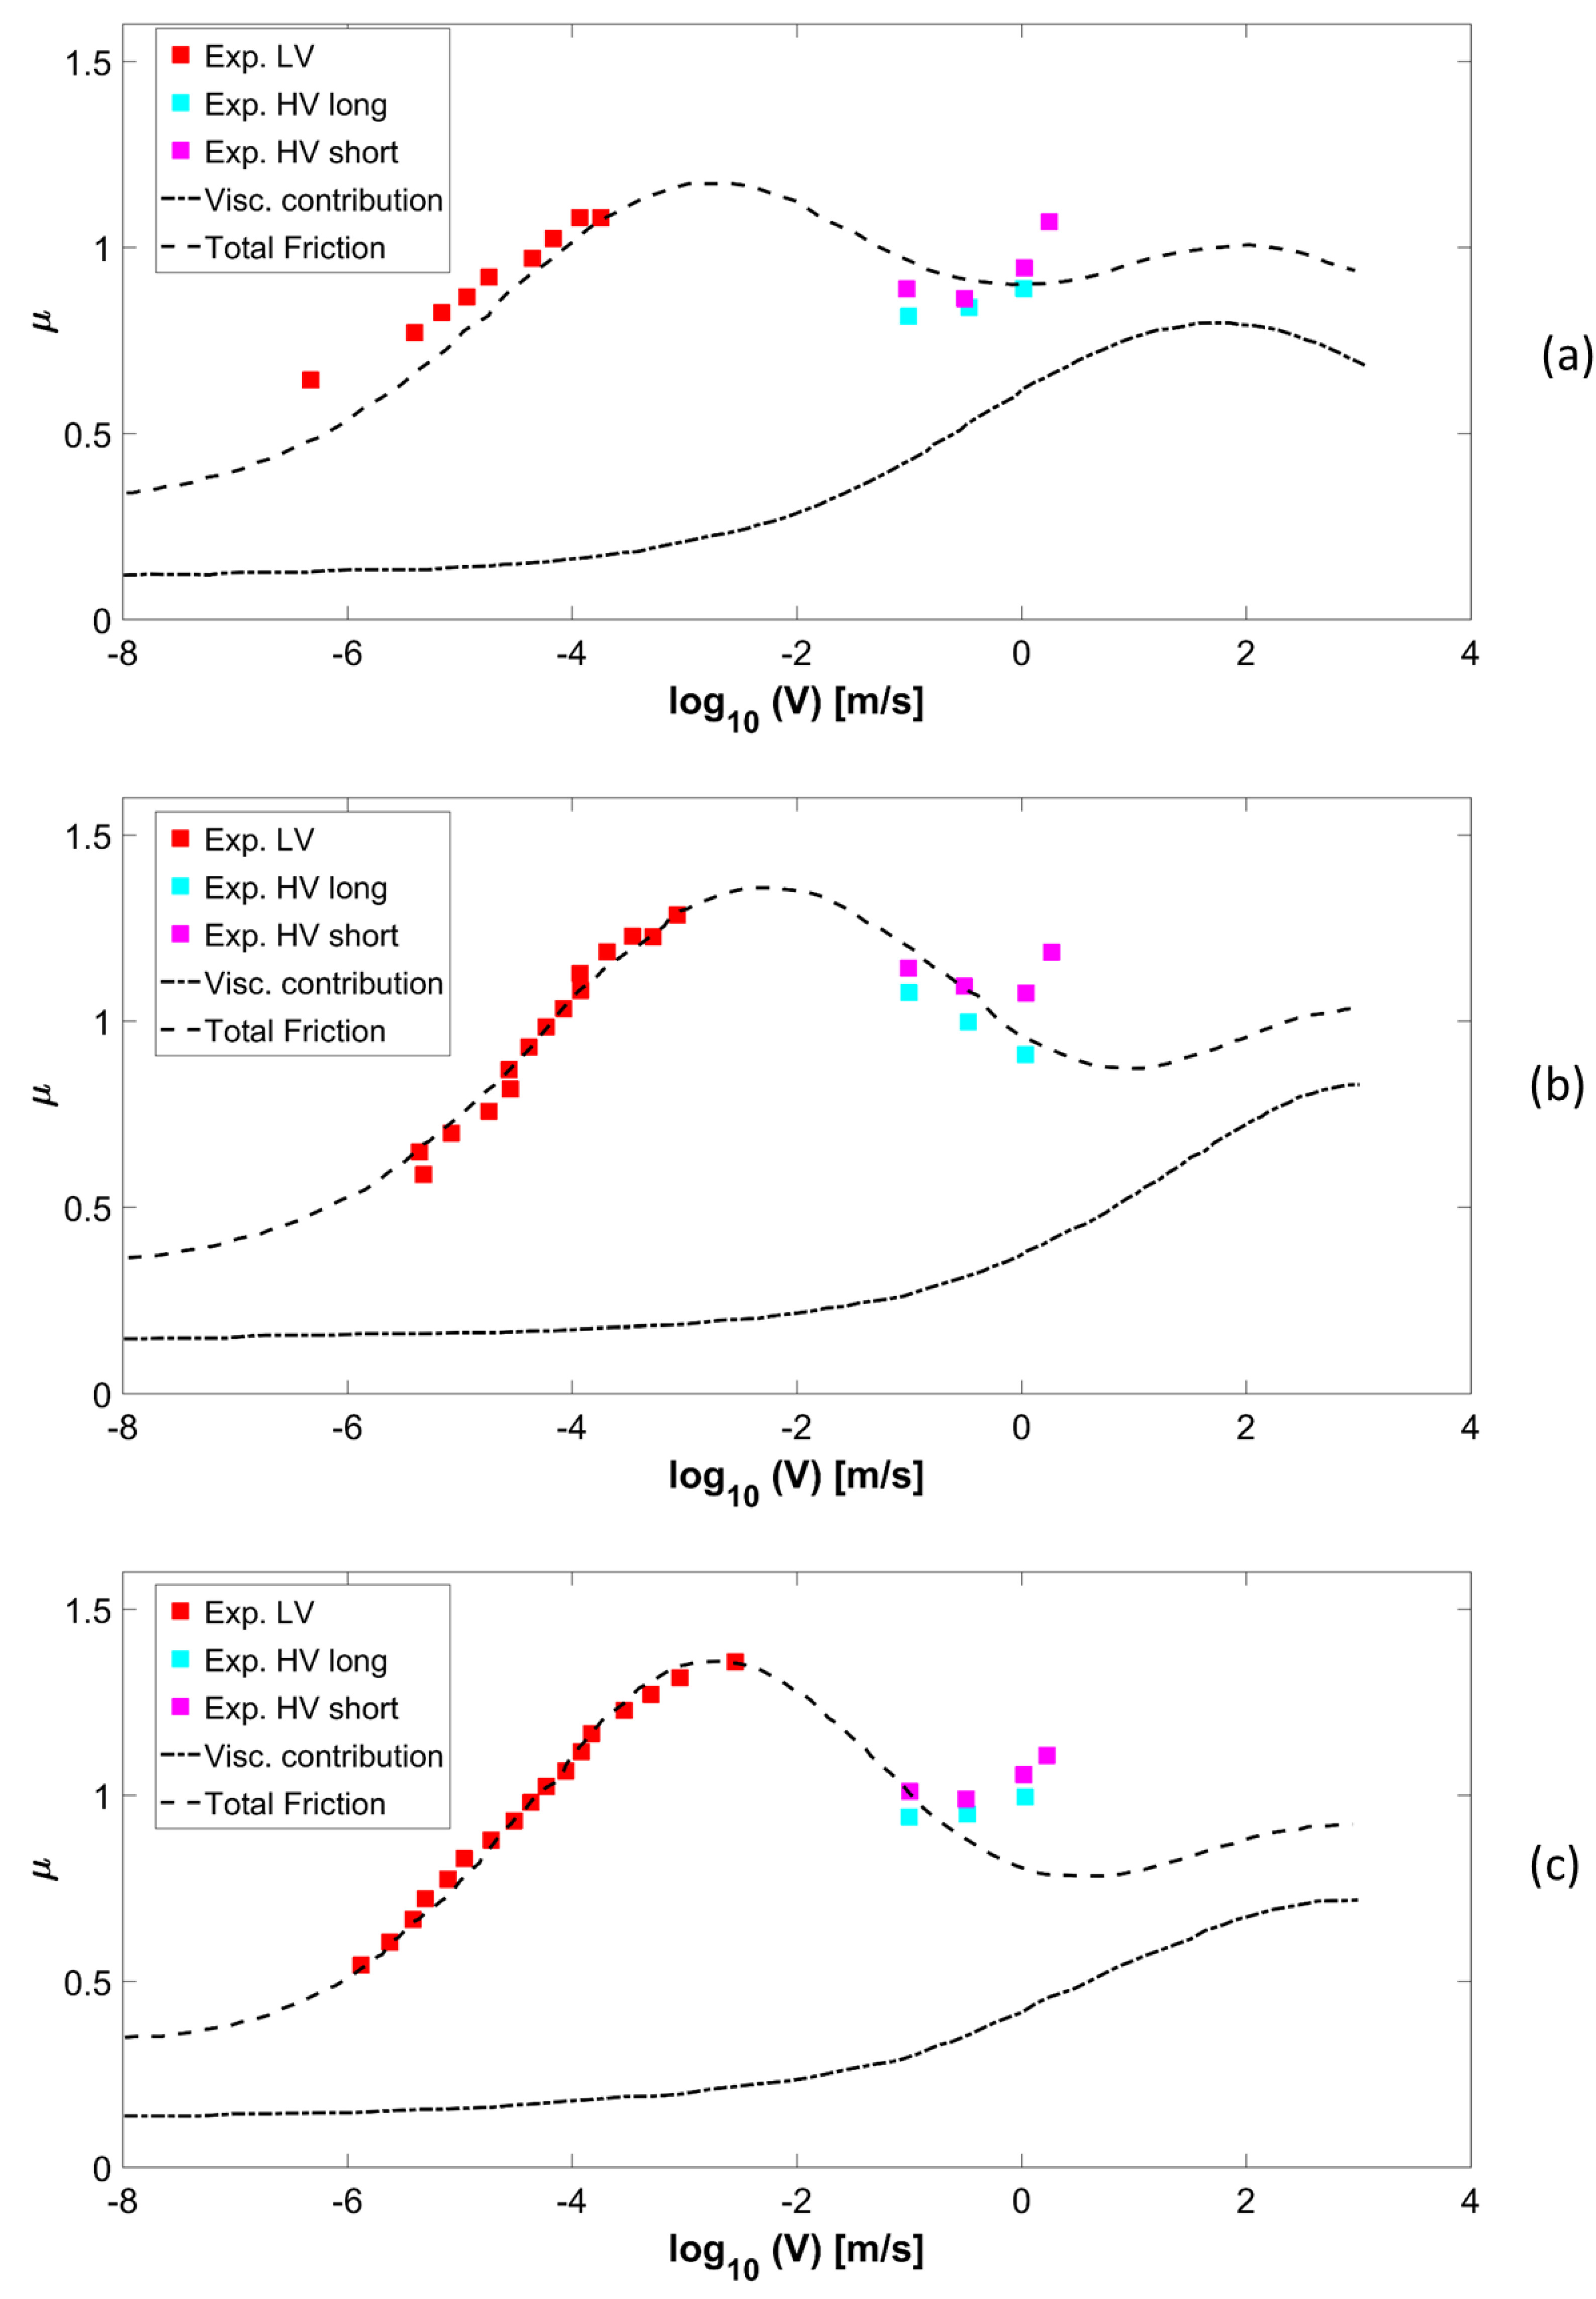
A full viscoelastic rubber characterization is fundamental for the friction calculations. The knowledge of the complex elastic modulus of the rubber over a rather large frequency range is necessary, and more recently it has been suggested also its behavior at different strain values when the non-linear effects related to the viscoelastic modulus of the rubber should be taken into account. The standard way of measuring the viscoelastic modulus is to deform the rubber sample in an oscillatory manner with a constant strain or stress amplitude. This is done at different frequencies and then repeated at different temperatures. The results measured at different temperatures can be shifted according to the time–temperature superposition principle to form a master curve covering a wide range of frequencies at the chosen reference temperature. TP have performed measurements of the viscoelastic modulus in both shear and in tensile (elongation) modes, providing both the shear modulus G(ω) and the Young’s modulus E(ω). These moduli are related, for the lack of better approximations, via E = 2G (1 + ν) where ν = 0.5 is the Poisson ratio.
In their paper, TP [14] tested three different compounds: A is a summer tread containing silica and resin, B is a summer tread filled with carbon black and C is a winter tread filled with silica and traction resin. The viscoelastic moduli of the three different rubber compounds A, B, C, are detailed in Figure 2, as storage (Re E) and loss (Im E) moduli.
Let us consider for the compound under investigation a power law approximation for the moduli, at low frequency. This approximation, which appears quite good in the practical range of interest for rubber compounds used in tires (as depicted in Figure 2), also permits a simple estimate of the relevant equations in closed form at low speeds. The power law behavior considered is:
R e   E ( ω ) = 10 α r ω β r   and   I m   E ( ω ) = 10 α i ω β i
In Table 1 the parameters of the power law approximation for the three compounds are summarized.
Notice that TP affirms that when a rubber tread block is sliding on a road surface, the strain in asperity contact regions is typically of order one, ε ≅ 1. To take into account the effect of these large strain, they perform strain sweep measurements up to a strain of order one, resulting in a reduction of the small strain modulus E(ω) of a factor Sf ≅ 0.1, where Sf is the strain softening factor [15].

2.3. Friction

The available measured data for low velocities (LV) and higher velocity (HV) was obtained by TP [14] using two different experimental setups. Friction for LV was obtained by means the Leonardo da Vinci experiment, which allows only measurement of the friction coefficient on the branch of the μ(v)-curve where the friction coefficient increases with increasing sliding speed. The friction coefficients for the sliding speeds of 0.1, 0.3, 1, and 1.8 m/s were obtained by means of a linear friction tester (LFT).
Figure 3 shows the measured data and calculated results, by using Persson formulation, for rubber sliding on concrete. Notice that the total friction curve is calculated as a sum of the viscoelastic and adhesive contribution plus a constant term μconst = 0.2 (an empirical choice, for the lack of better data), which the authors refer to the “scratching of the concrete surface by the hard filler particles”.
The parameters adopted for the friction calculation are summarized in Table 2.

3. Discussion on the Viscoelastic and Adhesive Contributions

In this section, we want to point out that the recognition of the importance of the adhesive and viscoelastic contribution is not at all simple and obvious. Indeed, starting from the viscoelastic properties of the rubber and the PSD of a rough surface, we propose different set of arbitrarily determined parameters, which return a different combination of Gaussian-like curves of the two contributions, allowing an equally good fit of the experimental data.
For all the three compounds, the theoretical results obtained calculating the viscoelastic contribution using the simplified formulation were first investigated
μ visc = h rms ( q 1 ) · K · I m   E   ( q 1 v ) | E   ( q 1 v ) |
where hrms is the rms slope of the surface that depends on the cutoff wavenumber q1 and E(q1 v) is the complex viscoelastic modulus of the rubber (for a given temperature), at the circular frequency 2πf = q1v. Adopting the power law approximation of the moduli at low frequencies, the coefficient K is calculated as:
K = 1 H 1 H + β i β r Γ ( 1 + β i / 2 ) Γ ( 3 / 2 + β i / 2 ) Γ ( 1 / 2 + β r ) Γ ( 1 + β r ) π π 2 ( β r + 1 H )
Again, the total friction curve is calculated as a sum of the viscoelastic and adhesive contributions plus the constant term μconst = 0.2. The parameters are the same as those used for the calculation with the Persson theory and reported in Table 2.
For each compound, Figure 4 shows the measured and calculated friction coefficient on the concrete surface as a function of the logarithm of sliding speed, using the simplified formulation. The lower red curve represents the (calculated) viscoelastic contribution to the friction coefficient, while the green is the adhesive contribution and the upper blue curve is the total calculated friction.
The results obtained with Persson theory and with our simplified assumption for the loss and storage modulus do not show significant difference for low-velocity friction data being these results considered to be principally influenced by the adhesion. For high sliding velocity some difference can be appreciated but these data are often not predicted appropriately.
Here it should be emphasized that these results are strongly influenced by the value of some parameters that are fixed in a non-rigorous way. In particular:
-
the choice of the cutoff wavenumber q1 influences strongly both viscoelastic and adhesive contributions;
-
the term μconst = 0.2 which is attributed to scratching of the concrete surface by the hard filler particles is quite arbitrary;
-
The reference velocity v* and the τf0 significantly influence the adhesive curve;
-
The assumption that for sliding friction on the rough surfaces the deformation is ε ≅ 1 implies a reduction of the strain modulus E(ω) of a strain factor Sf ≅ 0.1. Due to the non-linear effects related to the viscoelastic modulus of the rubber, lower strain values would cause sensible variation of the Sf and therefore of the adhesive friction.
Adopting the simplified formulation (7) for the viscoelastic friction and Equations (3) and (4) for the adhesion, different combinations in the choice of these parameters are proposed, which are able to give an equally good fitting of the available experimental data. In Table 3, Table 4 and Table 5, five different parameters set used for simulation for Compound A, B, and C, respectively, are reported. Figure 5 reports the corresponding friction results. All the proposed fits predict quite accurately the low-velocity experimental data, while at high velocity the fit is generally poor. Notice that we have varied the high-wavenumber cutoff q1 of several orders of magnitude obtaining almost equally good fits for the friction coefficient. This poses fundamental questions on the physical meaning of this quantity and on the role that it plays in modern theories of viscoelastic friction.

4. Conclusions

In conclusion, the theories of rubber friction seem to have evolved over the years, but now the emphasis on the viscoelastic losses for tire–road contact due to fractal roughness has been much reduced, because the adhesive term is considered dominant. Persson’s theories [4,13,14,15] seem to have evolved more rigorously in the contact mechanics treatment (they are approximate, but the approximations have been corrected over the years), but the adhesion part is less fundamentally rigorously introduced, having been less studied and compared with experiments, and perhaps more effort in the coming years should concentrate on this. Klüppel’s theories [3,10,11,12], which seem instead to remain attached to the GW asperity description of roughness, which today is considered inaccurate. While this may not be very important for viscoelastic losses, since anyway there is an arbitrary truncation to be defined, it is less clear how this has an impact in the real contact area estimation, and hence the adhesive friction. While Klüppel’s theories have attempted to discuss at length the problem of truncation of roughness—and the resulting conclusion is not so clear—Persson’s theory has recently made a very abrupt choice of truncation at rms slope of 1.3, which is not well explained. We have indeed offered some examples on how different choices of the parameters (for example varying by orders of magnitude the high-frequency cutoff) equally fit the data, and hence it is unclear in Persson’s theory, for example, how to rigorously separate the two contributions from experiments.

Author Contributions

Conceptualization, F.F., A.G., A.P. and M.C.; Data curation, A.G.; Investigation, A.G. and F.F.; Methodology, A.P. and M.C.; Supervision, F.F. and M.C.; Writing–original draft, F.F. and M.C.; Writing–review & editing, A.G., A.P. and M.C.

Funding

A.P. is thankful to the DFG (German Research Foundation) for funding the project PA 3303/1-1. A.P. acknowledge support from PON Ricerca e Innovazione 2014/2020-Azione I.2-D.D. n. 407 del 27/02/2018, bando “AIM”. M.C. is supported by the Italian Ministry of Education, University and Research (MIUR) under the Departments of Excellence. Grant No. L.232/2016.

Conflicts of Interest

The authors declare no conflict of interest.

References

  1. Grosch, K.A. Visco-elastic properties and the friction of solids: Relation between the friction and visco-elastic properties of rubber. Nature 1963, 197, 858–859. [Google Scholar] [CrossRef]
  2. Williams, M.L.; Landel, R.F.; Ferry, J.D. The Temperature Dependence of Relaxation Mechanisms in Amorphous Polymers and Other Glass-forming Liquids. J. Am. Chem. Soc. 1955, 77, 3701–3707. [Google Scholar] [CrossRef]
  3. Klüppel, M.; Heinrich, G. Rubber Friction on Self-Affine Road Tracks. Rubber Chem. Technol. 2000, 73, 578–606. [Google Scholar] [CrossRef]
  4. Persson, B.N.J. Theory of rubber friction and contact mechanics. J. Chem. Phys. 2001, 115, 3840–3861. [Google Scholar] [CrossRef] [Green Version]
  5. Ciavarella, M.; Papangelo, A. Discussion of “Measuring and Understanding Contact Area at the Nanoscale: A Review” (Jacobs, T.D.B., and Ashlie Martini, A., 2017, ASME Appl. Mech. Rev., 69 (6), p. 060802). Appl. Mech. Rev. 2017, 69, 065502. [Google Scholar] [CrossRef]
  6. Persson, B.N.J. Relation between Interfacial Separation and Load: A General Theory of Contact Mechanics. Phys. Rev. Lett. 2007, 99, 125502. [Google Scholar] [CrossRef] [PubMed] [Green Version]
  7. Papangelo, A.; Hoffmann, N.; Ciavarella, M. Load-separation curves for the contact of self-affine rough surfaces. Sci. Rep. 2017, 7, 6900. [Google Scholar] [CrossRef]
  8. Lorenz, B.; Oh, Y.R.; Nam, S.K.; Jeon, S.H.; Persson, B.N.J. Rubber friction on road surfaces: Experiment and theory for low sliding speeds. J. Chem. Phys. 2015, 142, 194701. [Google Scholar] [CrossRef] [Green Version]
  9. Carbone, G.; Putignano, C. Rough viscoelastic sliding contact: Theory and experiments. Phys. Rev. E 2014, 89, 032408. [Google Scholar] [CrossRef]
  10. Le Gal, A.; Yang, X.; Klüppel, M. Evaluation of sliding friction and contact mechanics of elastomers based on dynamic-mechanical analysis. J. Chem. Phys. 2005, 123, 014704. [Google Scholar] [CrossRef] [PubMed]
  11. Le Gal, A.; Klüppel, M. Investigation and modelling of rubber stationary friction on rough surfaces. J. Phys. Condens. Matter 2008, 20, 015007. [Google Scholar] [CrossRef]
  12. Lang, A.; Klüppel, M. Influences of temperature and load on the dry friction behaviour of tire tread compounds in contact with rough granite. Wear 2017, 380, 15–25. [Google Scholar] [CrossRef]
  13. Persson, B.N.J.; Volokitin, A.I. Rubber friction on smooth surfaces. Eur. Phys. J. E 2006, 21, 69–80. [Google Scholar] [CrossRef] [PubMed] [Green Version]
  14. Tolpekina, T.V.; Persson, B.N.J. Adhesion and Friction for Three Tire Tread Compounds. Lubricants 2019, 7, 20. [Google Scholar] [CrossRef]
  15. Tolpekina, T.; Pyckhout-Hintzen, W.; Persson, B.N.J. Linear and Nonlinear Viscoelastic Modulus of Rubber. Lubricants 2019, 7, 22. [Google Scholar] [CrossRef]
  16. Jacobs, T.D.B.; Junge, T.; Pastewka, L. Quantitative characterization of surface topography using spectral analysis. Surf. Topogr. Metrol. Prop. 2017, 5, 013001. [Google Scholar] [CrossRef]
Figure 1. The surface roughness power spectrum of the concrete substrate.
Lubricants 07 00085 g001
Figure 2. Real (solid blue) and imaginary (solid red) parts of the viscoelastic modulus of rubber Compound A (a), B (b), C (c) in TP [14]. The dashed lines indicate the power law approximations at low frequencies.
Lubricants 07 00085 g002
Figure 3. The measured (symbols, from [14]) and calculated (lines) friction coefficient using the Persson formulation for Compound A (a), B (b), C (c).
Lubricants 07 00085 g003
Figure 4. The measured (symbols, from [14]) and calculated (lines) friction coefficient on concrete as a function of the logarithm of the sliding speed, using the simplified formulation for the viscoelastic contribution, for Compound A (a), B (b), C (c).
Lubricants 07 00085 g004
Figure 5. The measured (symbols, form [14]) and calculated (lines) friction coefficient on concrete as a function of the logarithm of the sliding speed considered five different sets of arbitrary parameters for each Compound A (a), B (b), C (c).
Lubricants 07 00085 g005
Table 1. Parameters for power law approximation.
Compoundαrβrαiβi
Compound A1.41930.08200.53750.0939
Compound B1.32620.05010.23120.0507
Compound C1.41400.06390.47130.0737
Table 2. Summary of the reference parameters adopted for the friction calculation.
Compoundq1hrmsμconstlog10 v* (m/s)τf0 (MPa)Sf
Compound A2·1061.30.2−2.473.60.1
Compound B2·1061.30.2−1.974.00.1
Compound C2·1061.30.2−2.534.10.1
Table 3. Summary of the different parameter sets adopted for the friction calculation of the Compound A.
SETq1hrmsμconstlog10 v* (m/s)τf0 (MPa)Sf
A2·1093.60−1.580.1
B2·1061.30.3−2.24.10.1
C2·1071.850.3−1.970.1
D2·1050.90.35−2.170.3
E3·1040.630.35−2.170.5
Table 4. Summary of the different parameter sets adopted for the friction calculation of the Compound B.
SETq1hrmsμconstlog10 v* (m/s)τf0 (MPa)Sf
A2·10104.50−14.00.1
B2·1061.30.3−1.8080.19
C2·1050.90.3−1.880.3
D3·1040.630.35−1.880.5
E1071.660.25−25.50.1
Table 5. Summary of the different parameter sets adopted for the friction calculation of the Compound C.
SETq1hrmsμconstlog10 v* (m/s)τf0 (MPa)Sf
A2·1061.30.25−2.05.250.1
B1071.660.25−26.90.1
C3·1071.960.25−280.1
D1050.80.3−2.17.10.3
E1040.50.3−2.16.40.5

