Article

High-Rate Laser Surface Texturing for Advanced Tribological Functionality

1
Laserinstitut Hochschule Mittweida, University of Applied Sciences Mittweida, Technikumplatz 17, 09648 Mittweida, Germany
2
Fraunhofer Institute for Ceramic Technologies and Systems IKTS, Winterbergstrasse 28, 01277 Dresden, Germany
3
Institute of Design Engineering and Drive Technology IKAT, Chemnitz University of Technology, Reichenhainer Straße 70, 09126 Chemnitz, Germany
*
Author to whom correspondence should be addressed.
Submission received: 27 February 2020 / Revised: 13 March 2020 / Accepted: 15 March 2020 / Published: 20 March 2020

Abstract

:
This article features with the enhancement of the static coefficient of friction by laser texturing the contact surfaces of tribological systems tested under dry friction conditions. The high-rate laser technology was applied for surface texturing at unprecedented processing rates, namely using powerful ultrashort pulses lasers in combination with ultrafast polygon-mirror based scan systems. The laser textured surfaces were analyzed by ion beam slope cutting and Raman measurements, showing a crystallographic disordering of the produced microscopic surface features. The laser induced self-organizing periodic surface structures as well as deterministic surface textures were tested regarding their tribological behavior. The highest static coefficient of friction was found of µ20 = 0.68 for a laser textured cross pattern that is 126% higher than for a fine grinded reference contact system. The line pattern was textured on a shaft-hub connection where the static coefficient of friction increased up to 75% that demonstrates the high potential of the technology for real-world applications.

1. Introduction

Laser surface texturing has been established as an effective method to tailor and control the micro-topographic but also physiochemical properties of surfaces. During the last decades, a wide variety of multi-scale surface textures ranging from nanometer to micrometer feature dimensions have been reported that can be produced using pulsed and ultrashort pulsed lasers in surface processing. There is also an increasing trend for applying such microscopic laser textures for functionalization in advanced surface engineering. This is emphasized in Figure 1 on the basis of the SCOPUS abstract and citation database [1], showing a steadily growing number of peer-reviewed journal articles published per year for the search term “Laser surface texturing” (blue bar).
Inspired by nature, a great number of these basic research activities reveal the potential of multi-scale laser textures mimicking natural concepts to be applied for biomimetic surface functionalities, interfaces and products. In this manner, Figure 2 illustrates a variety of characteristic laser textures produced on stainless steel plates: (a) rippled surface texture, (b) multi-scale surface texture and (c) riblets, which can be used, for example, to control optical, wetting or aerodynamic surface behaviors. Thereby, the specific functionality strongly depends on the individual texture feature geometry.
Laser surface texturing has also attracted great attention in tribology applications which can be recognized in Figure 1 for the search terms “Laser surface texturing AND Tribology” (red bar) as well as “Laser surface texturing AND Tribology AND Friction” (green bar). The ongoing upward trend of research activities in this field is mainly due to the ability of laser textures to also improve the frictional performance of tribological systems with regard to their efficiency, load capacity, wear resistance and life-time. However, most of these tribological studies report on laser surface texturing for reducing internal torque in the lubricant friction regime and micro-dimpled laser textures were applied to function as micro-hydrodynamic bearings, micro reservoirs for lubricant retention or micro-traps for wear particles of sliding systems, for example, in seals, piston rings and thrust bearings [2,3,4,5,6,7,8]. Recent studies also report on the reduction of the coefficient of friction (COF) for ripples tested under lubrication friction conditions [9,10]. However, only little research has been spent so far on the increase of friction forces in dry friction contacts. Therein, it was demonstrated that the static COF of frictional engaged connections (cam, press fittings) can be increased by laser fabricated molten and re-solidified bulged microscopic structures [11,12].
In another recent approach, laser made dimples were identified being valuable for COF enhancement in dry friction contacts [13,14,15]. As a specialty, the microscopic dimples produced on the surface were surrounded by prominent molten and re-solidified walls potentially enhancing the mechanical interconnection along with higher adhesive friction forces for the joint frictional contact. However, the limited processing speed and throughput of these basically investigated processes are actually the major drawback to bring this promising technology to industrial production and manufacturing.

2. High-Rate Laser Processing Technology

The high-rate laser technology was developed at the Laserinstitut Hochschule Mittweida [16,17,18] with the goal to speed up the achievable processing speeds and throughputs in laser micro machining. In fact, high-rate machining combines powerful laser systems supplying hundreds to thousands Watts average laser powers and ultrafast beam deflection methods. Therewith, the ultrafast laser beam movement is essential for the efficient upscaling of the processing rates when using such unprecedented high laser powers. This is due to the fact that only a few micro joules optical energy at low fluence is needed for most-efficient material removal [19,20,21]. In consequence, the optimum method for upscaling the processing rate will be increasing the pulse repetition frequency instead of using higher pulse energies. In this case, the laser beam should be deflected at ultrafast speeds thus to avoid strong pulse-overlap effects, for example, laser beam shielding and heat accumulation that will detrimentally affect the machining process [18,22,23,24]. Therefore, the conventional (galvanometer mirror based) scan systems cannot reach the necessary fast scan speeds of hundreds of meters per second and above. Alternatively, in the last decade rotating cylinders, electro- and acousto-optical deflectors, resonant scanners or fast rotating polygons have been successfully tested for high-speed laser micro machining [25,26,27,28]. However, the multi-facet (polygon) mirror based biaxial scan technique seems to be the most promising approach for ultrafast and flexible two-dimensional (2-D) laser beam raster scanning.
Figure 3a depicts a schematic view of the unique polygon scanner architecture engineered at the Laserinstitut Hochschule Mittweida [18,29]. The fast rotating double-reflecting polygon mirror is used to achieve the ultrafast laser beam moving speed along the fast axis. For raster scanning, the laser beam is shifted along the slow axis by the galvanometer scanner when the beam flips from one facet to the other. The moving laser beam can be focused by standard f-theta lenses by what focus spot sizes in the range between 30 µm and 100 µm will be reached that depends on the focal length of the adapted objective. The maximum achievable laser beam moving speed is also determined by the optical scanner configuration, for example, up to 1000 m/s for the 420 mm lens. Therefore, representative laser textures produced on stainless steel metal sheets at ultrafast 950 m/s scan speed can be seen in Figure 3b,c.
The nano-featured surface textures in Figure 3b were made by a single pass raster-scan over the substrate surface. Therefore, the picosecond laser pulses were placed one after another in fast axis direction by irradiating 263 W average laser power. The pulse distance pd was set of about the focus spot diameter and with little overlap in orthogonal direction (slow axis) as the line distance ld between the raster scanned lines was half of the spot diameter. In initial studies, such kind of weak surface roughness is considered as inter-pulse feedback mechanism for the self-organizing formation of regular surface patterns as induced upon multi-pulse laser irradiations [30,31,32]. This material response is also confirmed by the SEM micrograph presented in Figure 3c, showing more prominent surface features originating from the higher accumulated irradiation dose that was due to higher pulse overlap at smaller line distance.
A further technical development is schematically illustrated in Figure 3d, combining the polygon scanner and a four-spot diffractive optical element (DOE) for ultrafast and parallel surface texturing. The feasibility of this groundbreaking technology is exemplified in Figure 3f by the homogeneous ripple texture produced on a stainless steel metal sheet using a femtosecond laser beam of 416 W average power at 560 m/s scan speed. The laser beam was scanned three times over the sample in order to achieve a well-shaped ripple texture, as can be seen in Figure 3e.
The overall processing rate that will be achieved applying high-rate laser technologies in surface texturing can easily be estimated by the following calculations. In theory, the maximum area processing rate APRmax for a complete single pass raster-scan pattern over the substrate surface results from the product of the applied scan speed vS and the chosen line distance ld according to Equation (1):
APRmax = vSld
APReff = vSldη
From practical point of view, the utilization rate η of the polygon scan system must seriously be taken into consideration to calculate the effective area processing rate APReff on the substrate. This is described in Equation (2), where the utilization rate is the ratio between the theoretical and effective processible scan length on each polygon mirror facet. Hence, the utilization rate is restricted by the technical polygon scanner architecture and the implemented optical components ranging of 49% or rather 40% for the applied scanner configurations. Table 1 provides an overview of the area processing rates that can be reached for producing the laser textures shown in Figure 3. A maximum area processing rate of 1.14 m2/min or 3.76 m2/min could theoretically be achieved with the applied 263 W picosecond or 416 W femtosecond average laser power. The given effective area processing rates will only be reached when the full length of the accessible scan field is used. This was effectively 0.56 m2/min for the picosecond single spot and 1.51 m2/min for the femtosecond multi spot laser procedure. A further decrease of the area processing rate can be seen for the laser made ripple texture of Figure 3e. The shown highly uniform ripples were produced by three repeated overscans applied on the stainless steel substrate while the effective APR reduced to be 0.50 m2/min. Moreover, as the length of the rippled surface texture in Figure 3f was almost 1/4 of the accessible length of the scanning field the duty cycle decreased to 10%. Thus, the effective APR was as low as 0.13 m2/min for this specific machining example.

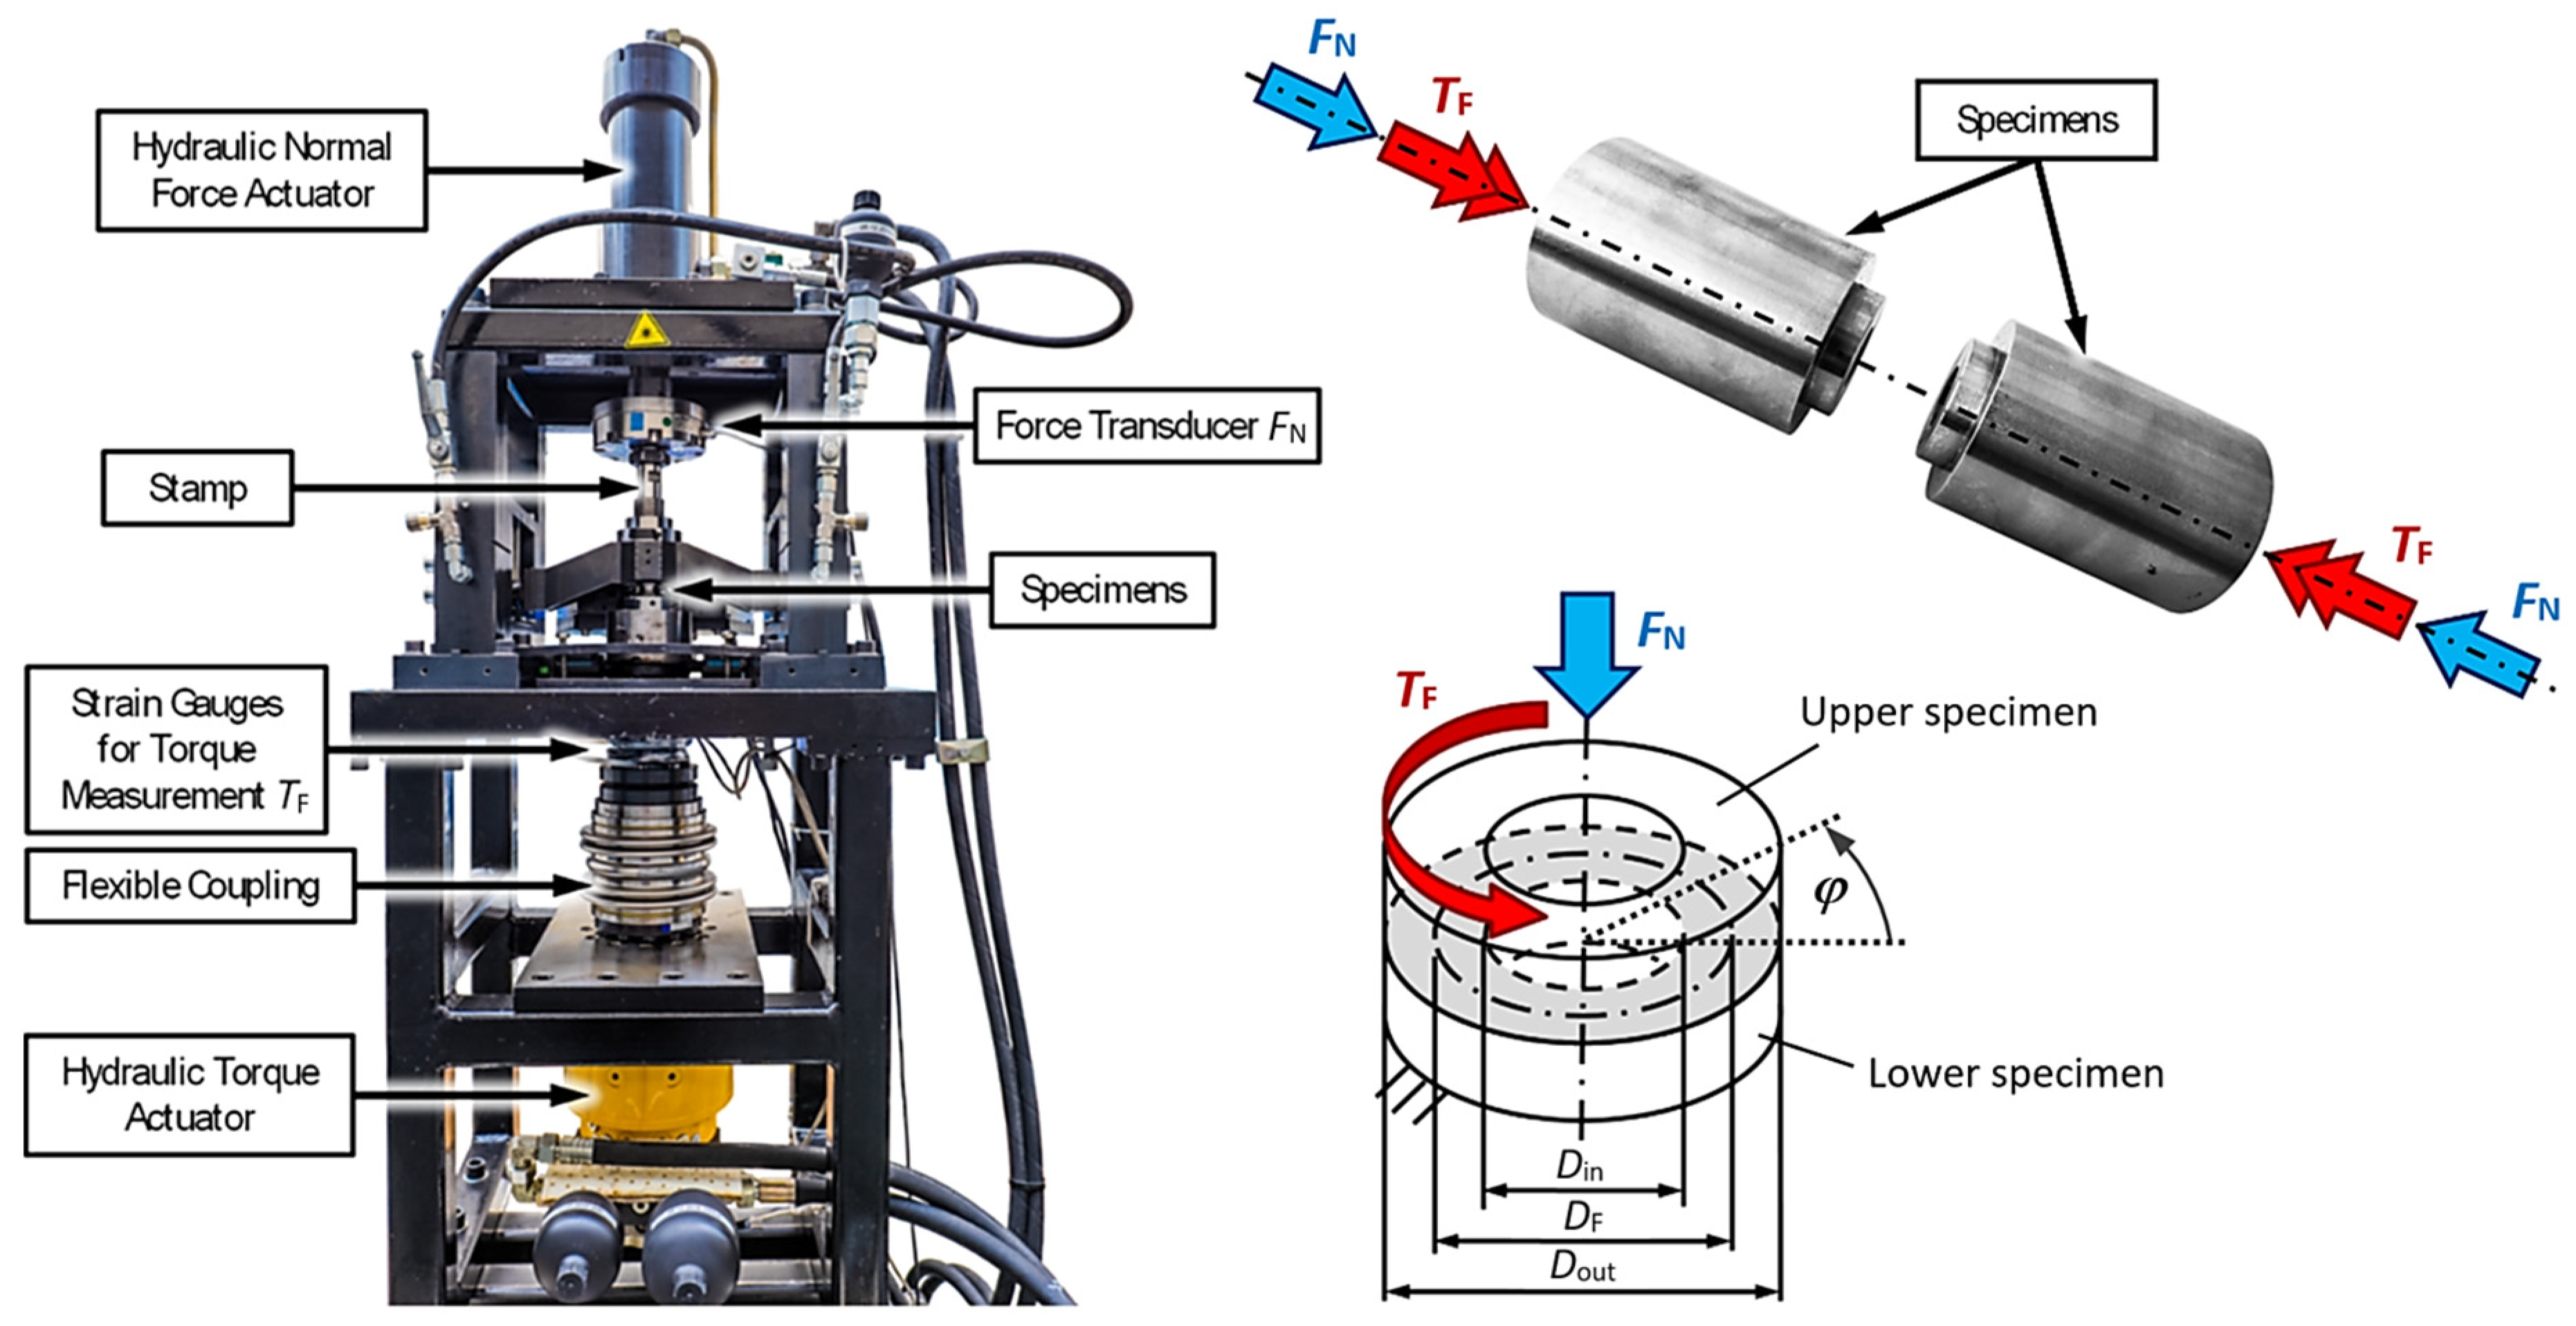
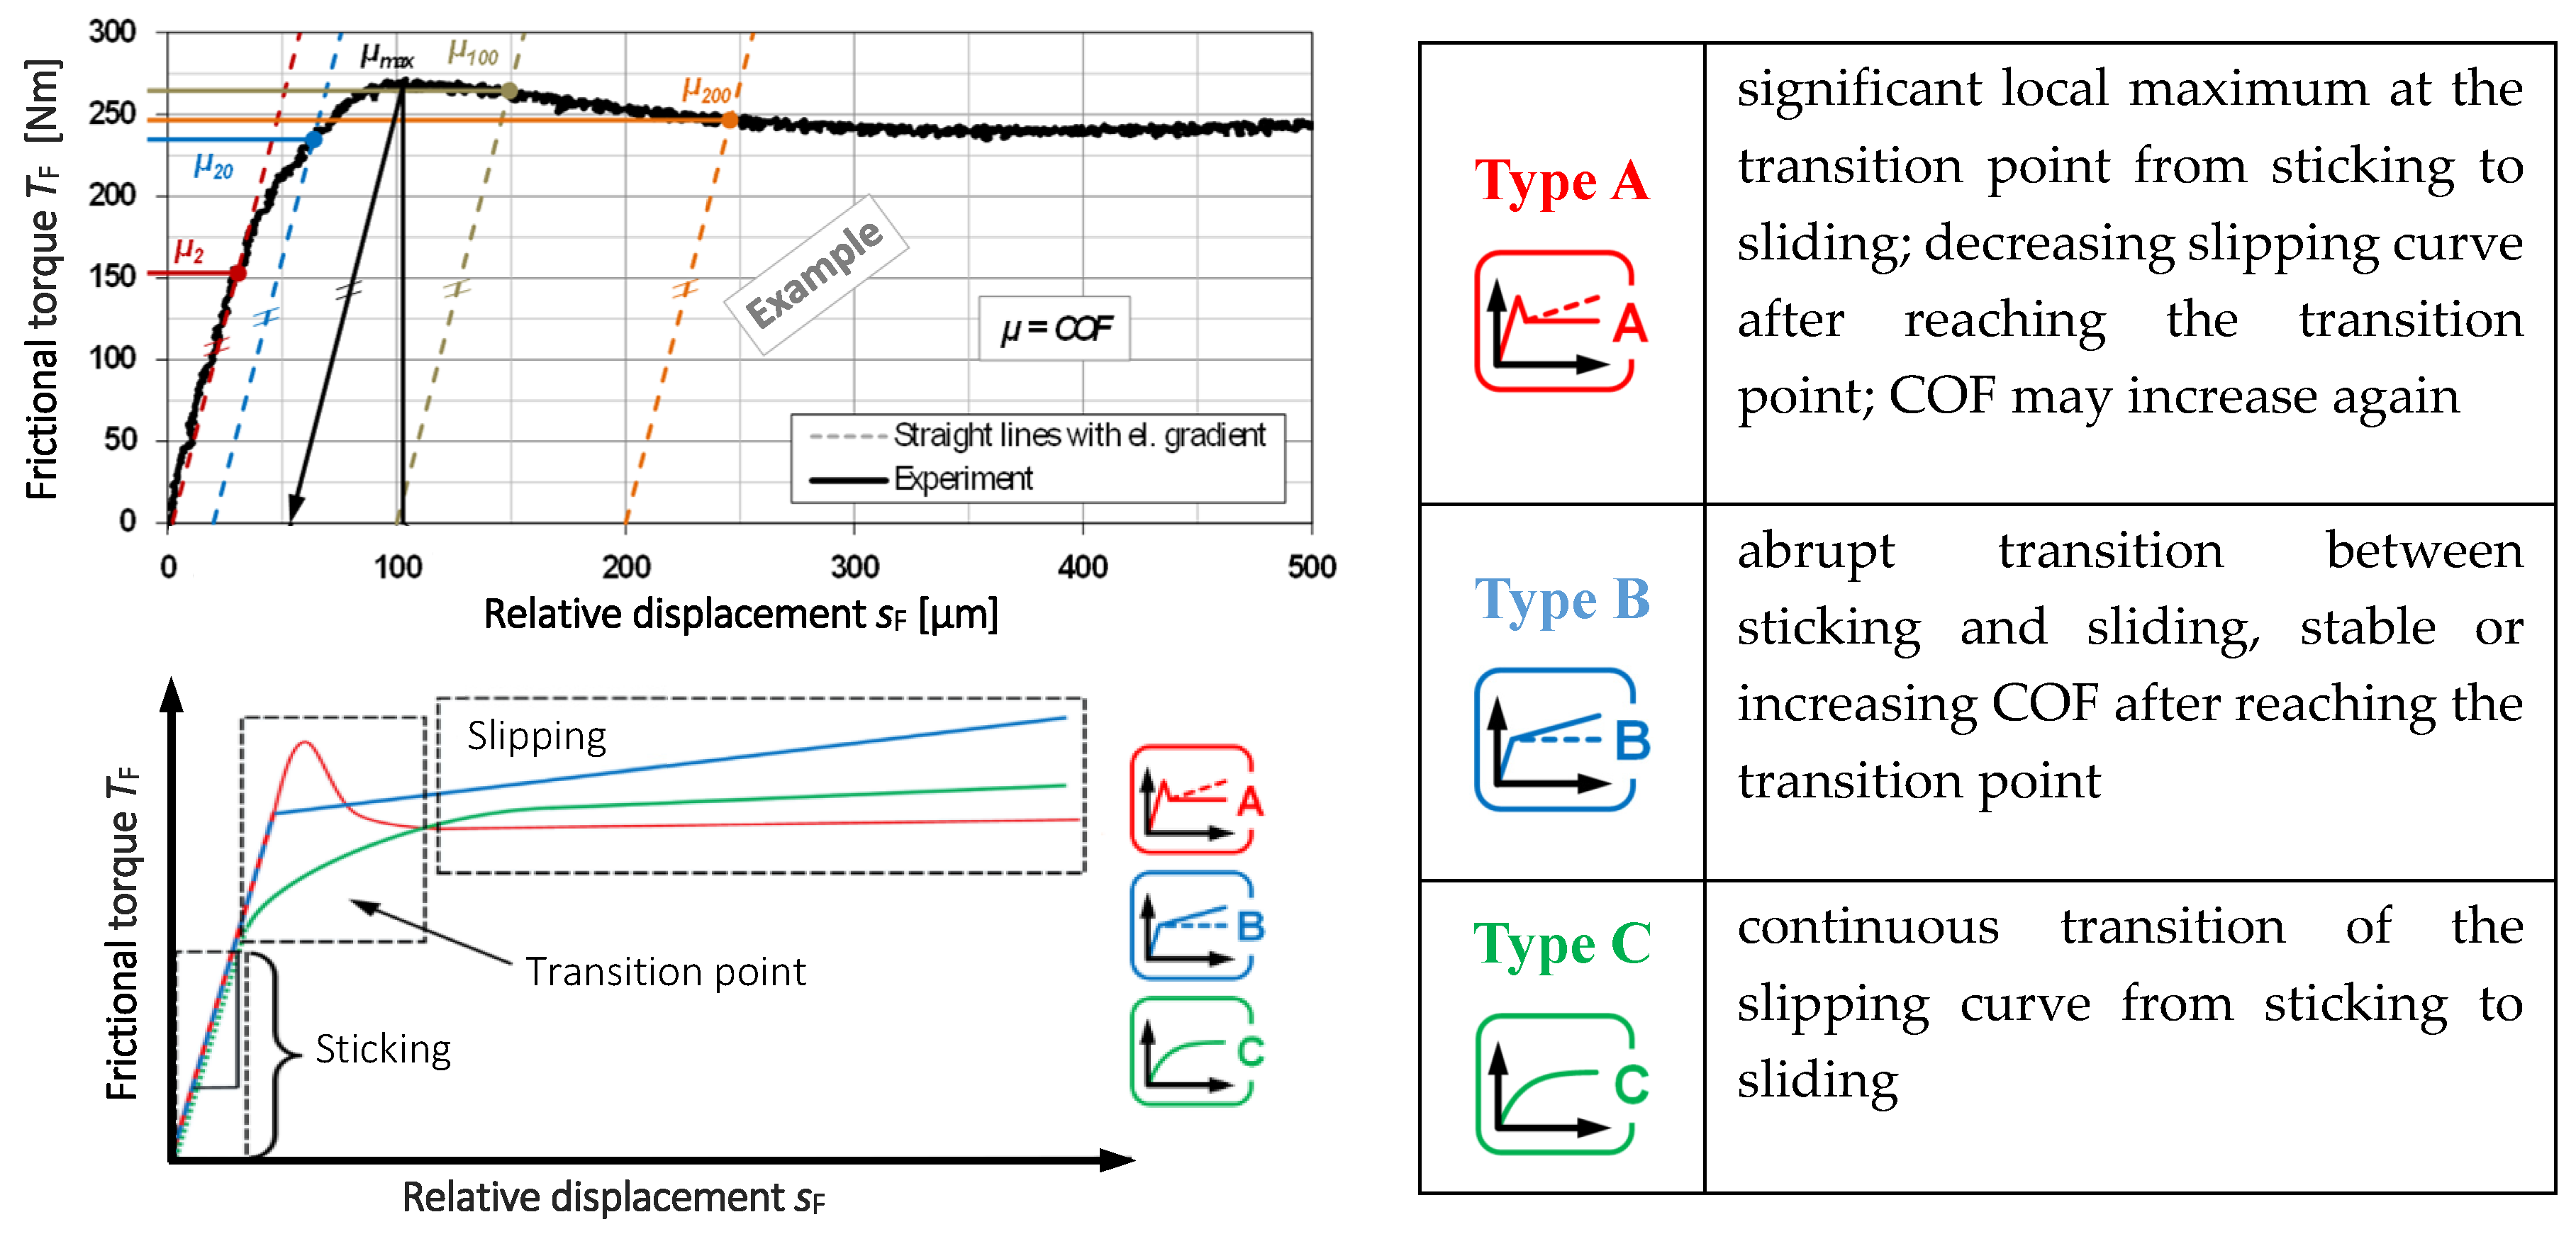
3. Static Friction Analysis Method

A standard analysis procedure developed by the IKAT institute at Chemnitz University of Technology [33,34] was applied for the evaluation of the tribological behavior of the laser textured surfaces. Therewith, both the static coefficient of friction (COF) and the type of frictional performance could be assessed from the recorded slipping curves. The functional principle of this analysis method is shown in Figure 4, displaying the implemented friction test bench assembly (left) and the cylindrical test specimen with a specially defined geometry (top right). The inner and the outer diameter of the ring-shaped contact surface area on top of the cylinder were Din = 15 mm and Dout = 30 mm, respectively, and the cylinder height was 65 mm. Two identical cylinders were clamped in the test bench and coaxially fastened with the normal force FN to achieve a nominal surface pressure of 100 MPa that is a typical contact pressure in tribological systems. Based on Equation (3), the effective friction diameter DF of the contact area was determined to be 23.3 mm. By rotating the cylinders against each other, friction shear stresses develop in the joint resulting from the frictional torque TF on the contact area. The frictional torque was measured by the strain gauges as a function of the torsion angle φ, which is indicated in Figure 4.
The recorded slipping curves are schematically shown in Figure 5 by plotting the torque measurements as function of the relative displacement sF of the contact areas. In this depiction, the relative displacement sF calculates according to Equation (4) and by taking into account the torsion angle and the effective friction diameter of the ring-shaped contact surface. As further can be seen in the schematic (bottom, left), three different types of characteristic friction performance could be recognized for the tribological contacts. These different types are distinguished depending on their typical slipping curve progression [35,36,37] that is briefly described in Figure 5 (right).
D F = 2 3 · D out 3 D i n 3 D out 2 D in 2
s F = φ · D F 2
μ = 2 · T F F N · D F
In Coulomb´s law of friction, the static coefficient of friction µ is defined as the constant of proportionality for the frictional contact of two bodies under the action of normal and sheer forces. The static COF states the transition point from sticking/adhesion to sliding and can be understood as the maximum boundary value of the load capacity of a contact which does not yet trigger a relative displacement of the two active partners towards each other. For the specified friction characteristic of Type A, this boundary value is well defined by the first local maximum of the slipping curve. Though, the boundary value is less clear for the friction Types B and C that can be seen by the corresponding slipping curves presented in the schematic of Figure 5 (bottom, left).
Following the analysis procedure, stiffness lines are included in the plot of the torque vs. relative displacement measurements where their intersection points support the determination of the torque at a specific position along the slipping path. The advantage of this method is to eliminate deformations of the entire tribological system that will affect the nominal value of the torsion angle, such as elastic deformation of the test bench or rather micro-movements in the joint resulting from surface asperities during specimen alignments. In the example of Figure 5 (top, left), the stiffness lines are indicated by the dashed lines. By considering the slope of the slipping curve, the stiffness line is shifted parallel along the abscissa (displacement axis) until its intersection at a desired lateral displacement position, e.g., 2 µm or 20 µm relative displacement between the test specimen contact areas. Then, by taking into account the torque value at the respective intersection of the stiffness line with the slipping curve, the corresponding COFs µ2, µ20, etc. can be calculated according to Equation (5).
In the following, in order to consider static instead of dynamic friction performance of the laser textured surfaces, the static COFs µ2 and µ20 will be discussed. The static COFs were calculated on the basis of the maximum torque values determined for the torsion angles 0.01° and 0.1° that is equivalent to 2 µm and 20 µm lateral displacements in the frictional contact area. In addition, the maximum value of the COF µmax that could be obtained within the tested range (φ ≤ 3°, sF ≤ 600 µm) will be presented. It should be mentioned for the static COF Type A, most commonly the maximum value will be obtained within 20 µm lateral displacement, while for COF Types B and C, the maximum COF value is steadily increasing with increasing relative displacement. In the latter case, where the highest values were obtained at comparably large lateral displacements, the maximum COF´s represent dynamic rather than static frictional performances.

4. Self-Organized Surface Textures for Advanced Tribological Functionality

4.1. Self-Organizing Periodic Surface Features

The development of self-organizing periodic surface structures of microscopic feature size represents a typical phenomenon in laser materials processing. The specific morphology of the originating surface features can be controlled by the irradiation conditions with particular influence of wavelength and polarization state of the laser beam as well as laser peak fluence, number of impinging pulses and respective irradiation dose, the latter quantifying the total optical energy irradiated to the substrates per laser spot area. The great impact of the processing conditions on the characteristic feature properties is exemplified in Figure 6 by a variety of microscopic surface features originating upon femtosecond laser irradiations on mirror-polished stainless steel substrates. Figure 6b illustrates schematically the direct-write laser processing method applied to produce such radial matrixes shown in Figure 6a,c for different laser peak fluence. As indicated in this scheme, the lines 1, 2, 3, …, n to be processed are scanned from center to edge, while the rotating angle α between the individual lines increased steadily from one line to the next. The spatial distance between the pulses within a single scanned line is determined by the chosen pulse repetition frequency and respective scan speed. In Figure 6c, this was set to 200 kHz at 1 m/s and in Figure 6a and 100 kHz and 0.2 m/s, respectively.
In this way, the spatial line distance along the single processed lines enlarges continuously from matrix center to outer edge that is the main advantage of the applied radial matrix method. This in turn, comprehensively overviews the potentially emerging surface features as function of irradiated dose, because the line distance varies from highly overlapping in the center to completely separated pulses at matrix edge. By doing so, a number of complex micro-scale surface morphologies could be identified in Figure 6 that have already been reported for repetitive laser pulse irradiations [38,39,40,41,42,43,44]. In fact, the developed self-organizing periodic surface structures can be differentiated as follows:
(i)
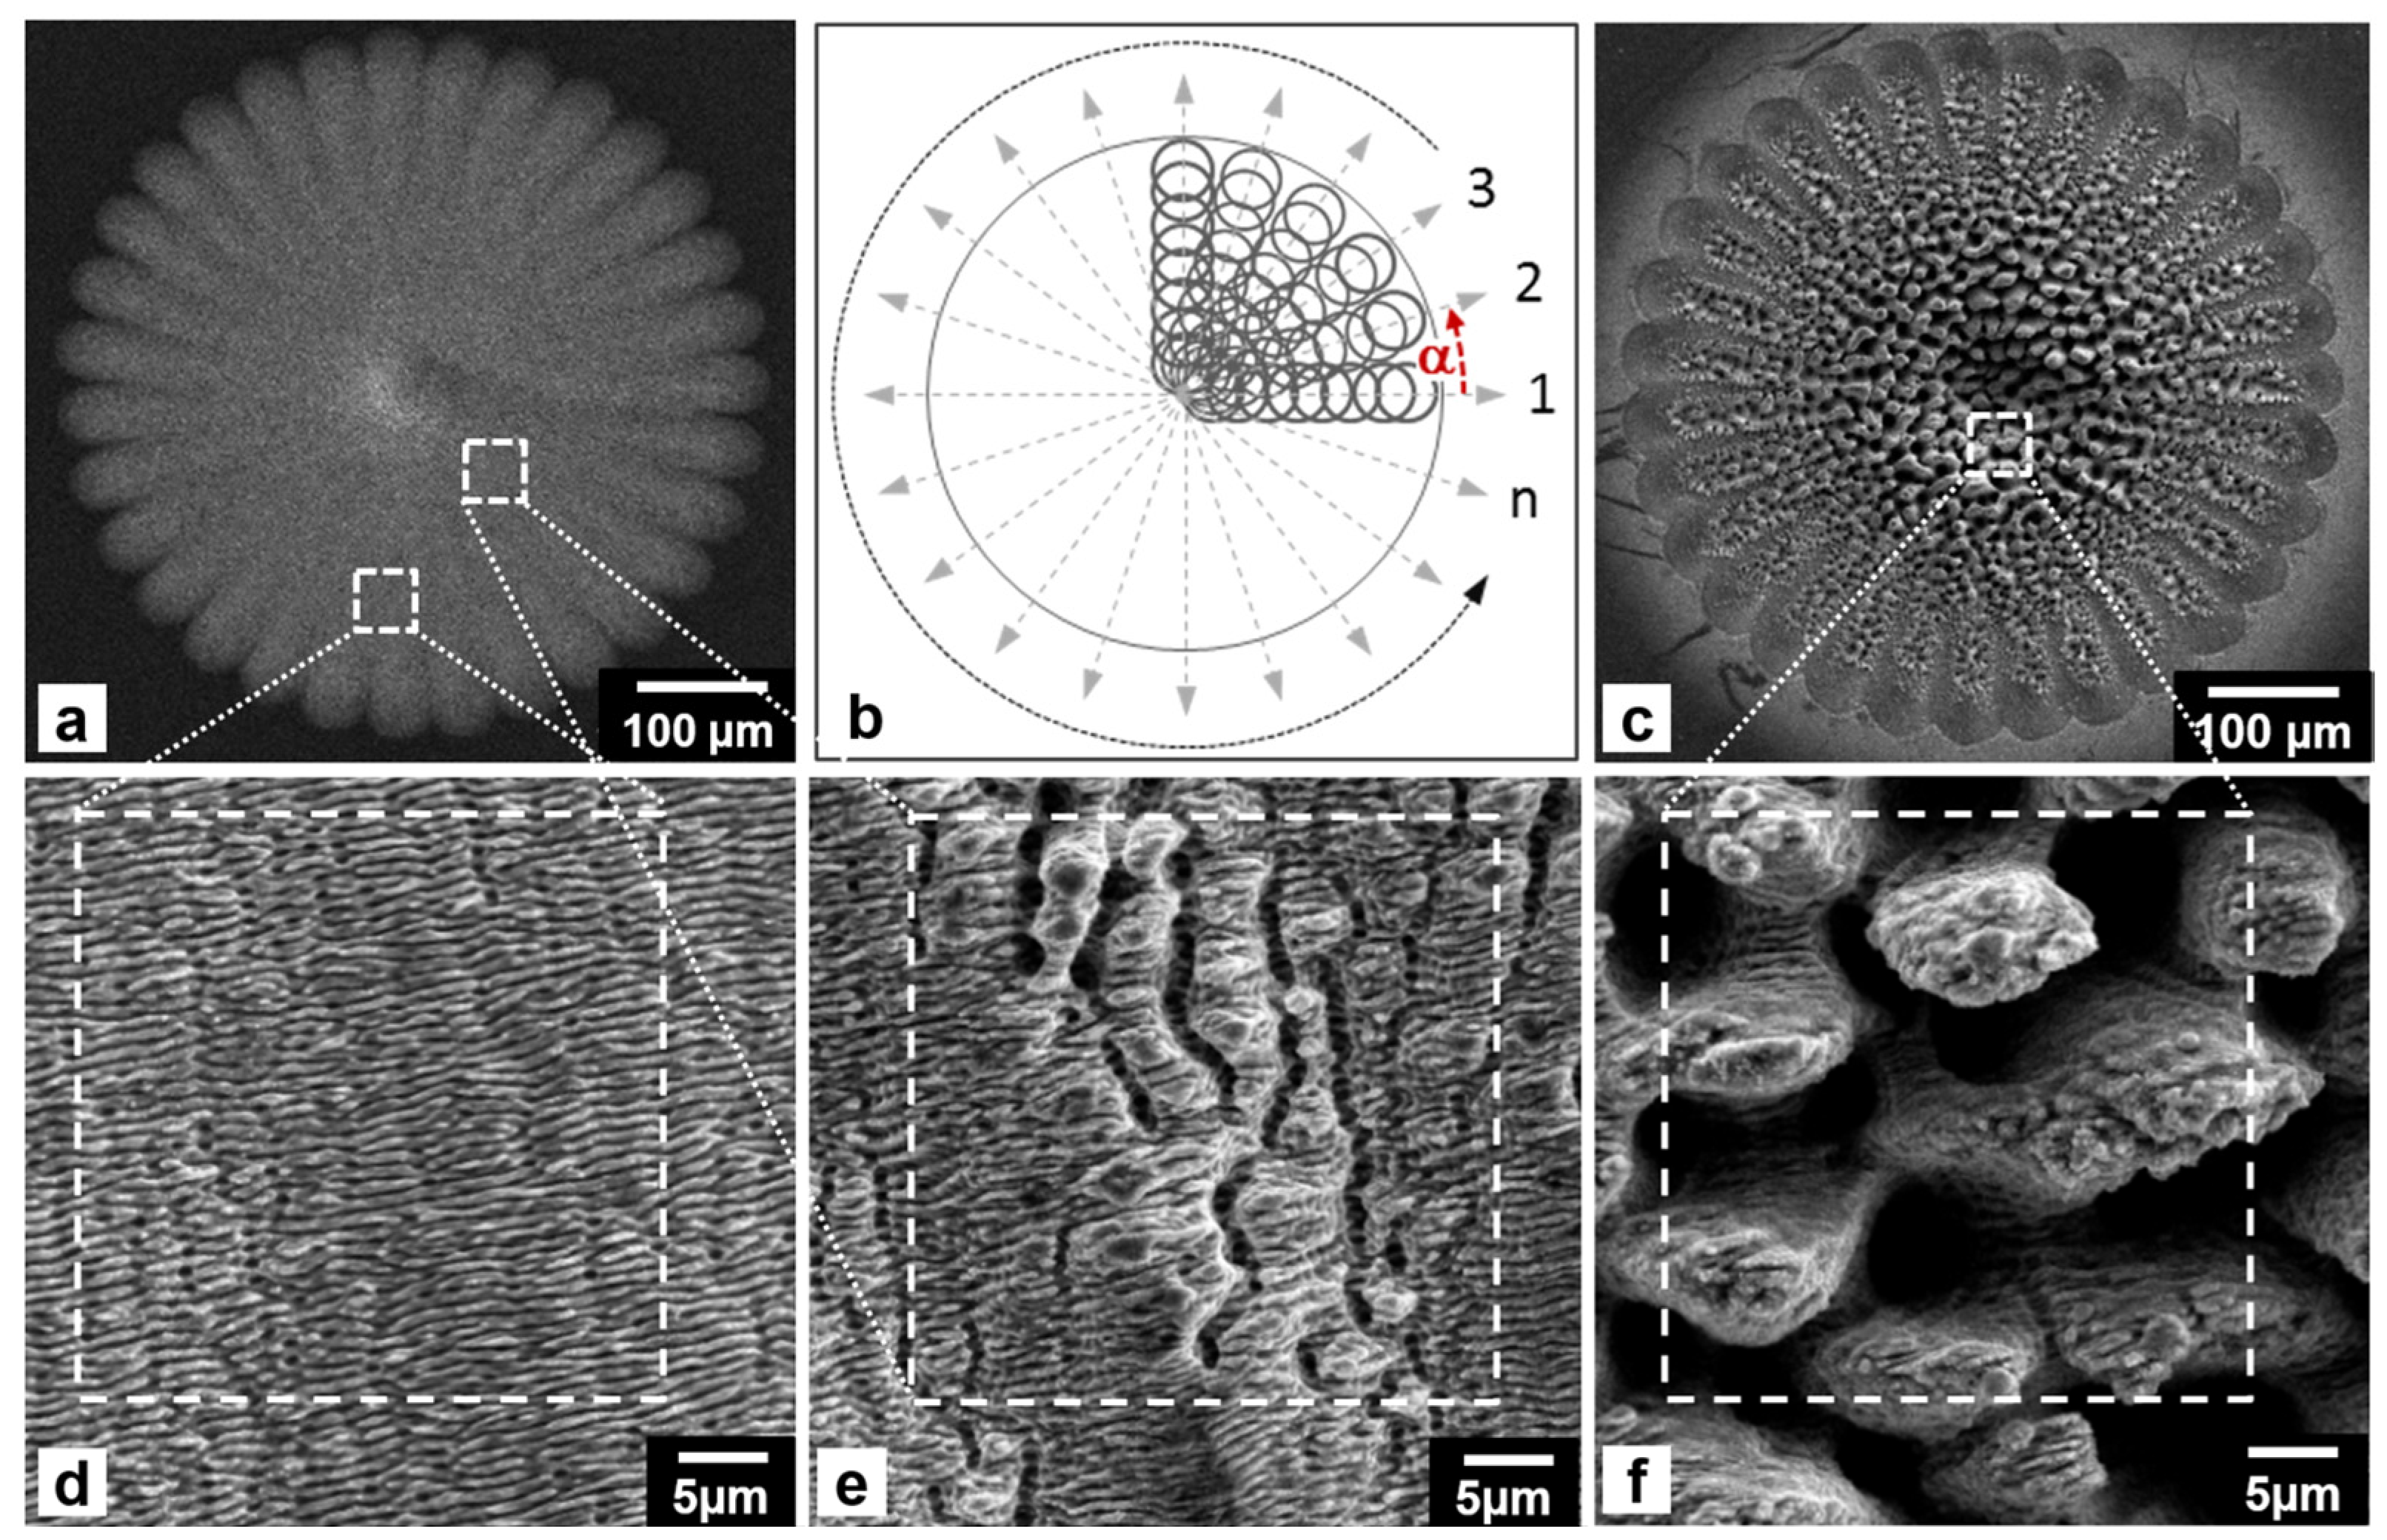
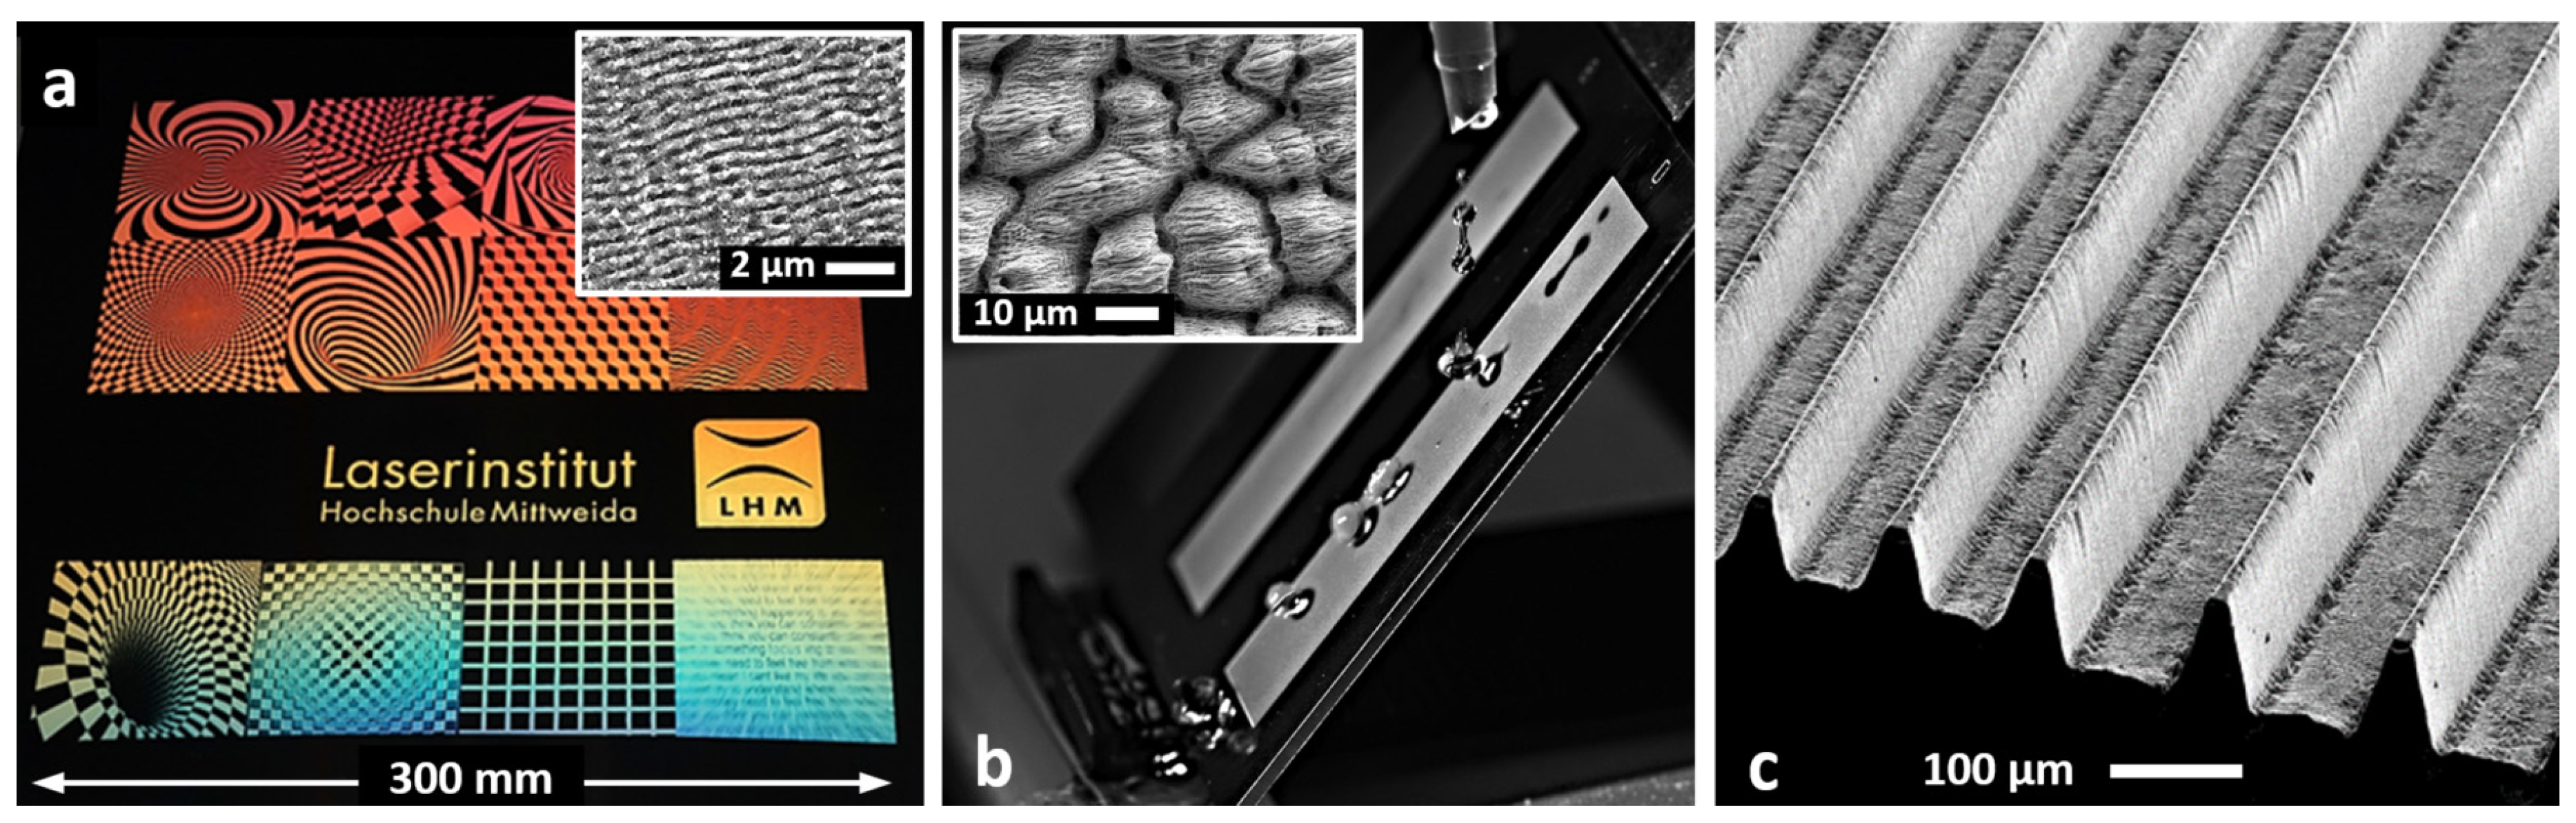
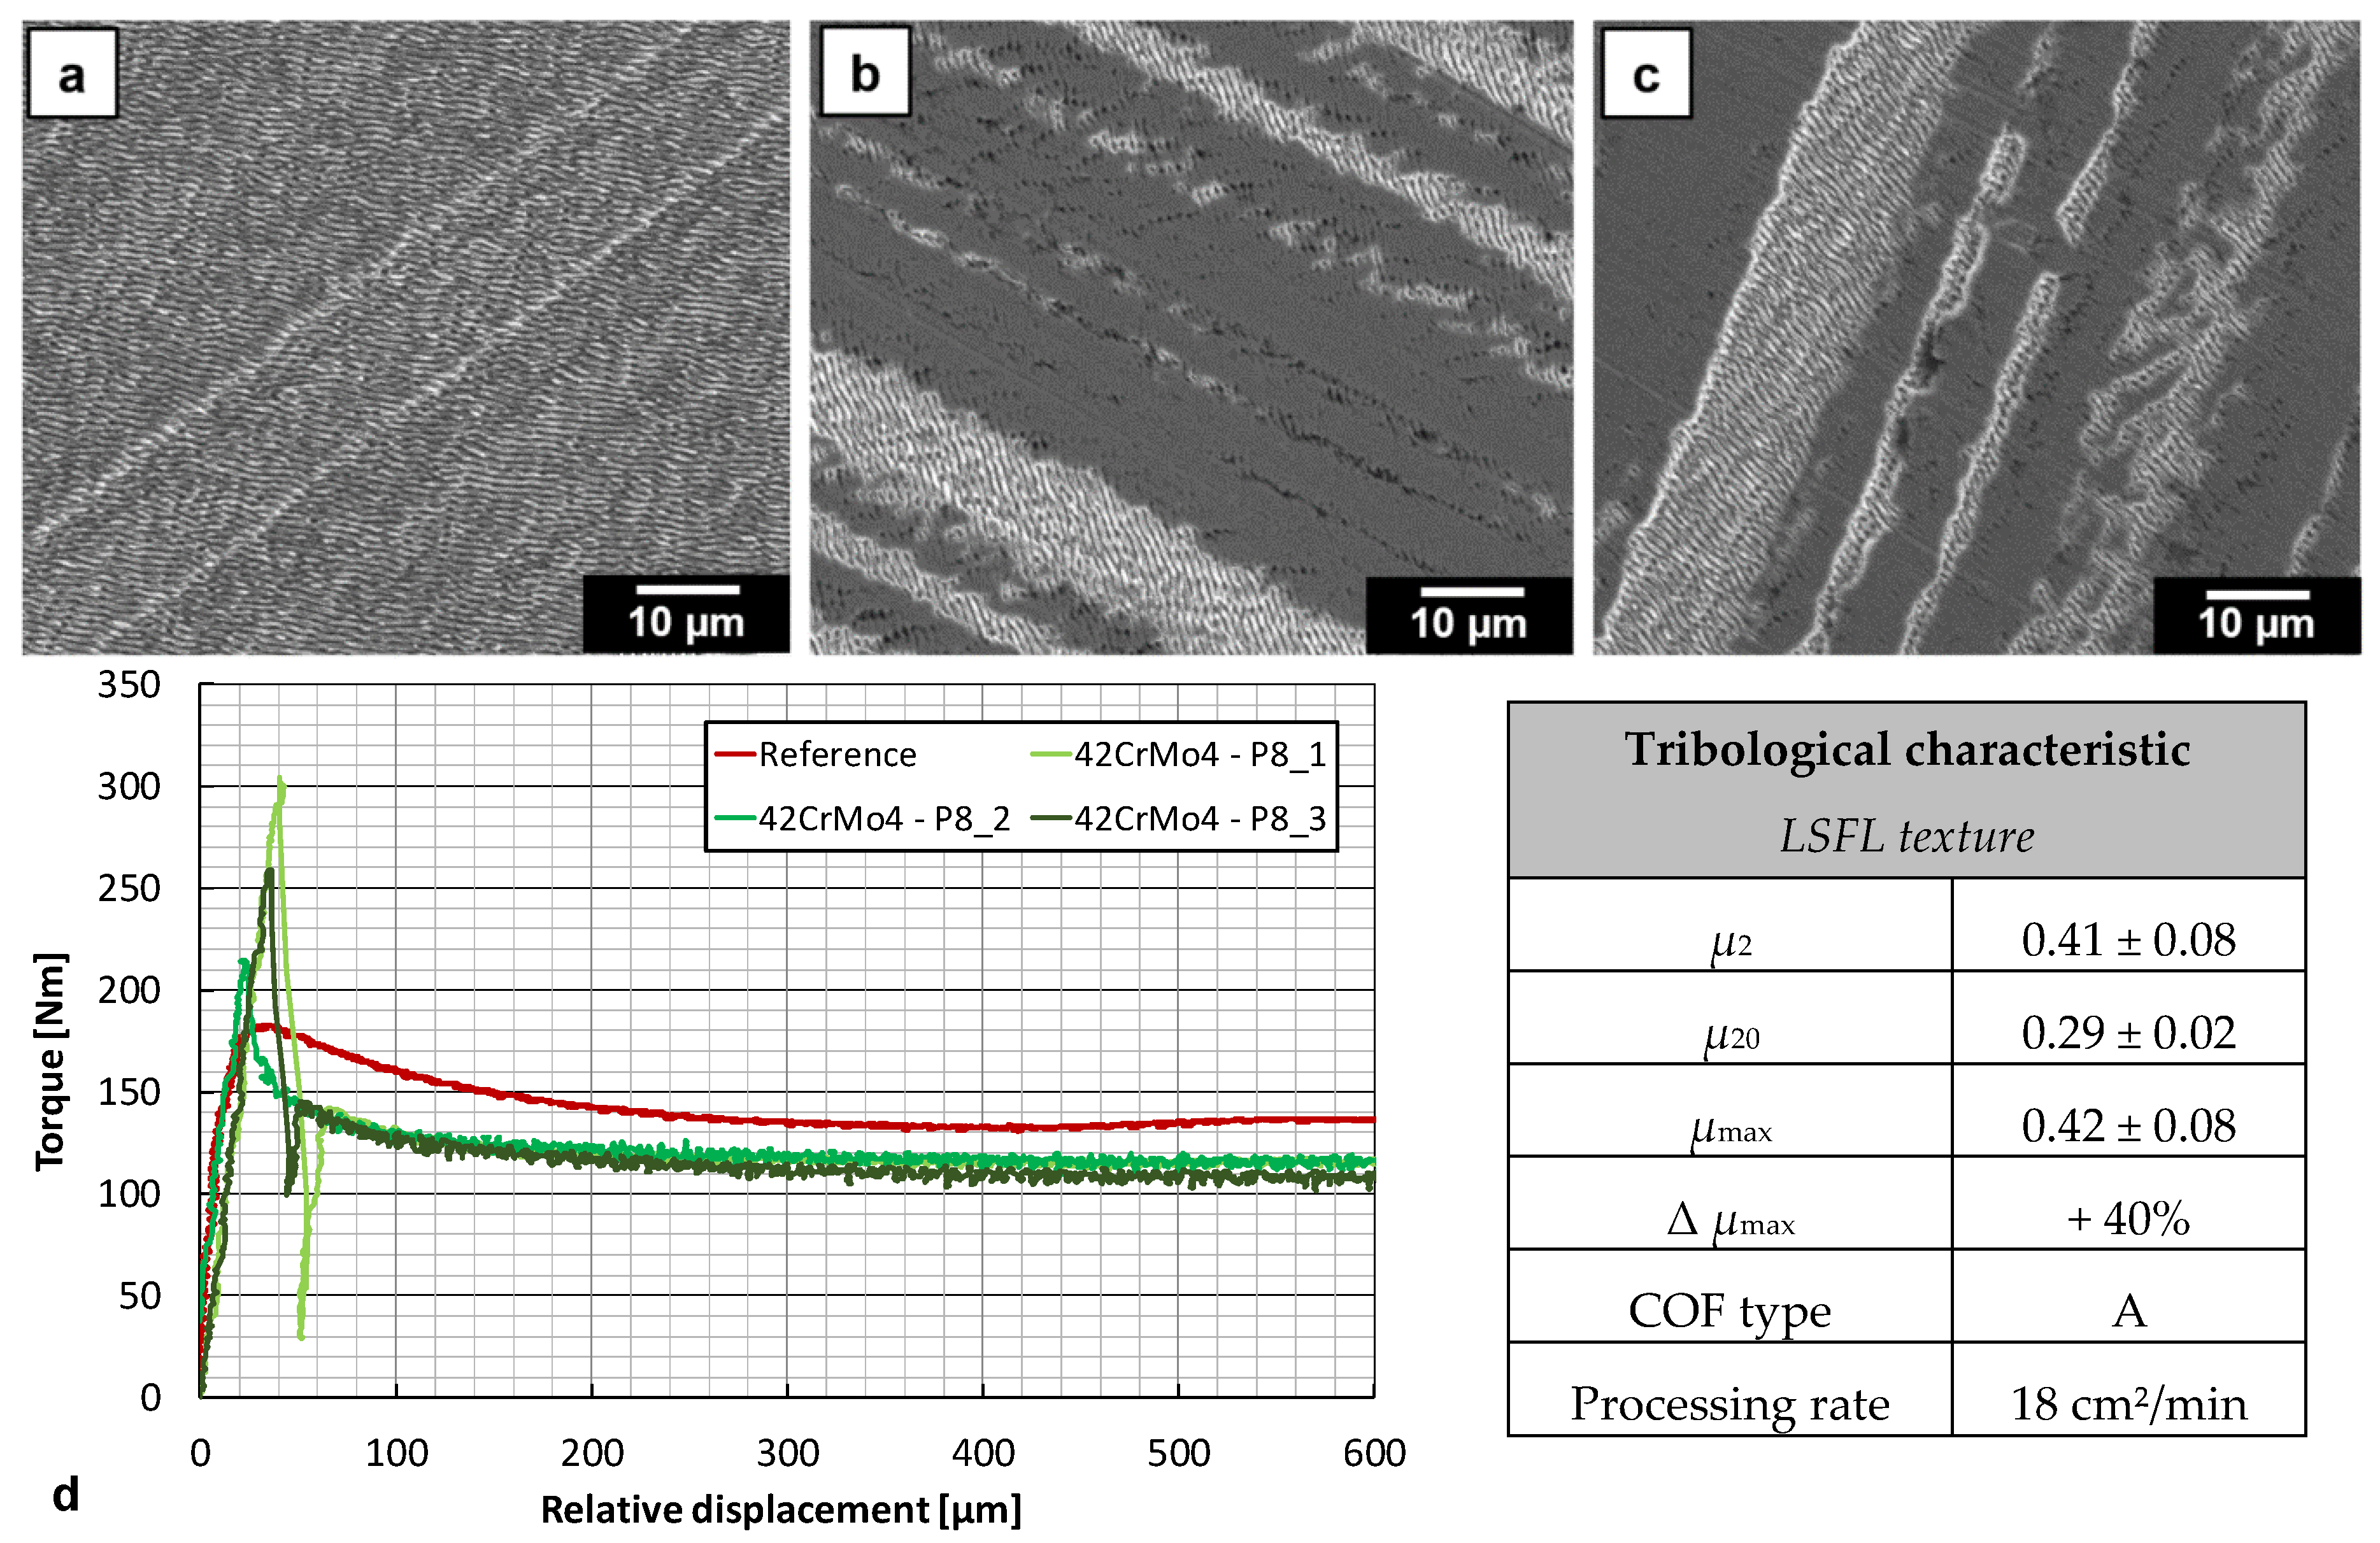
Ripples, or rather LIPSS, denote laser induced periodic surface structures. The ripples can be distinguished between low spatial frequency LIPSS (LSFL) and high spatial frequency LIPSS (HSFL). As indicated in Figure 6a, LSFLs emerge with spatial periods close to the wavelength of the incident laser beam at comparatively low irradiation dose where pulses of low laser peak fluence, H0 = 0.7 J/cm2, slightly above ablation threshold at low spatial pulse overlaps were applied. HSFLs originate at lower irradiation dose with the ripple period significantly smaller than the applied laser beam wavelength,
(ii)
Undulated surfaces carved with micro-grooves form orthogonal to the ripples at supra-wavelength periods. This kind of surface feature is pointed out in Figure 6e emerging at higher irradiation dose in areas of intermediate line overlaps such as indicated in Figure 6a.
(iii)
Micro-spikes start to grow in between the micro-grooves that might be affected by hydrodynamic effects induced by inhomogeneous laser beam absorption at corrugated surfaces [45], as highlighted in Figure 6e.
(iv)
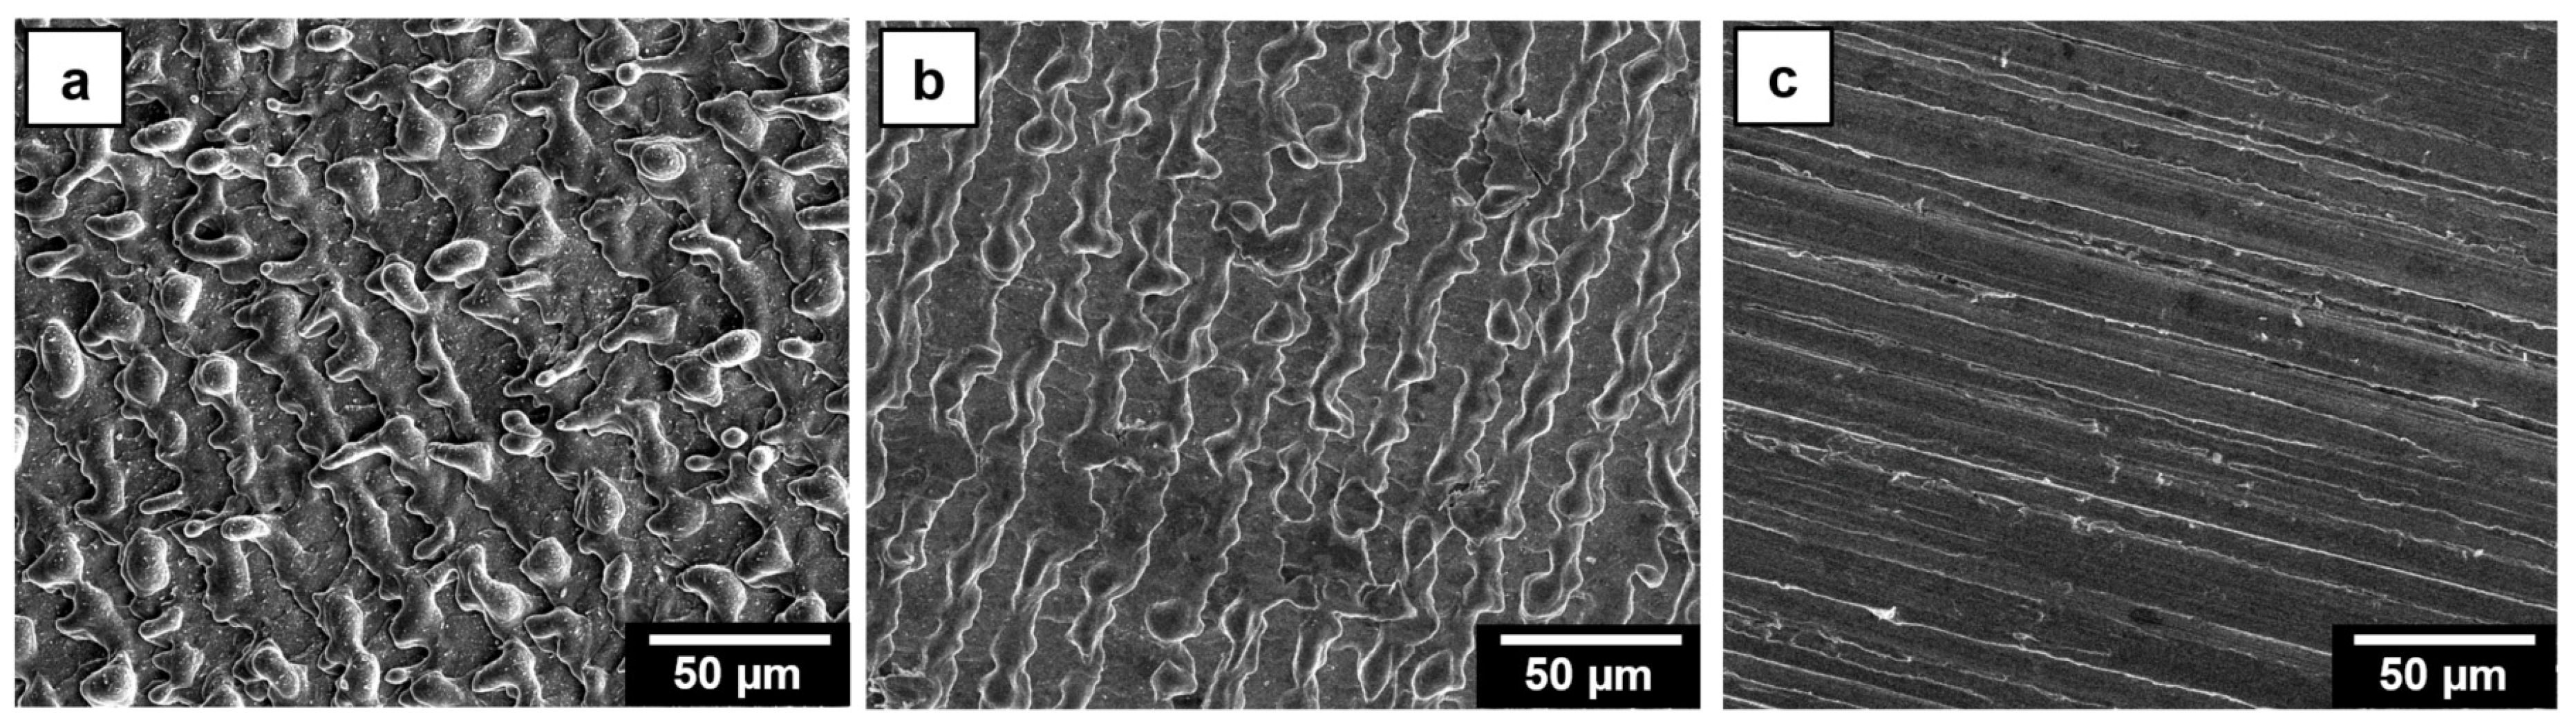
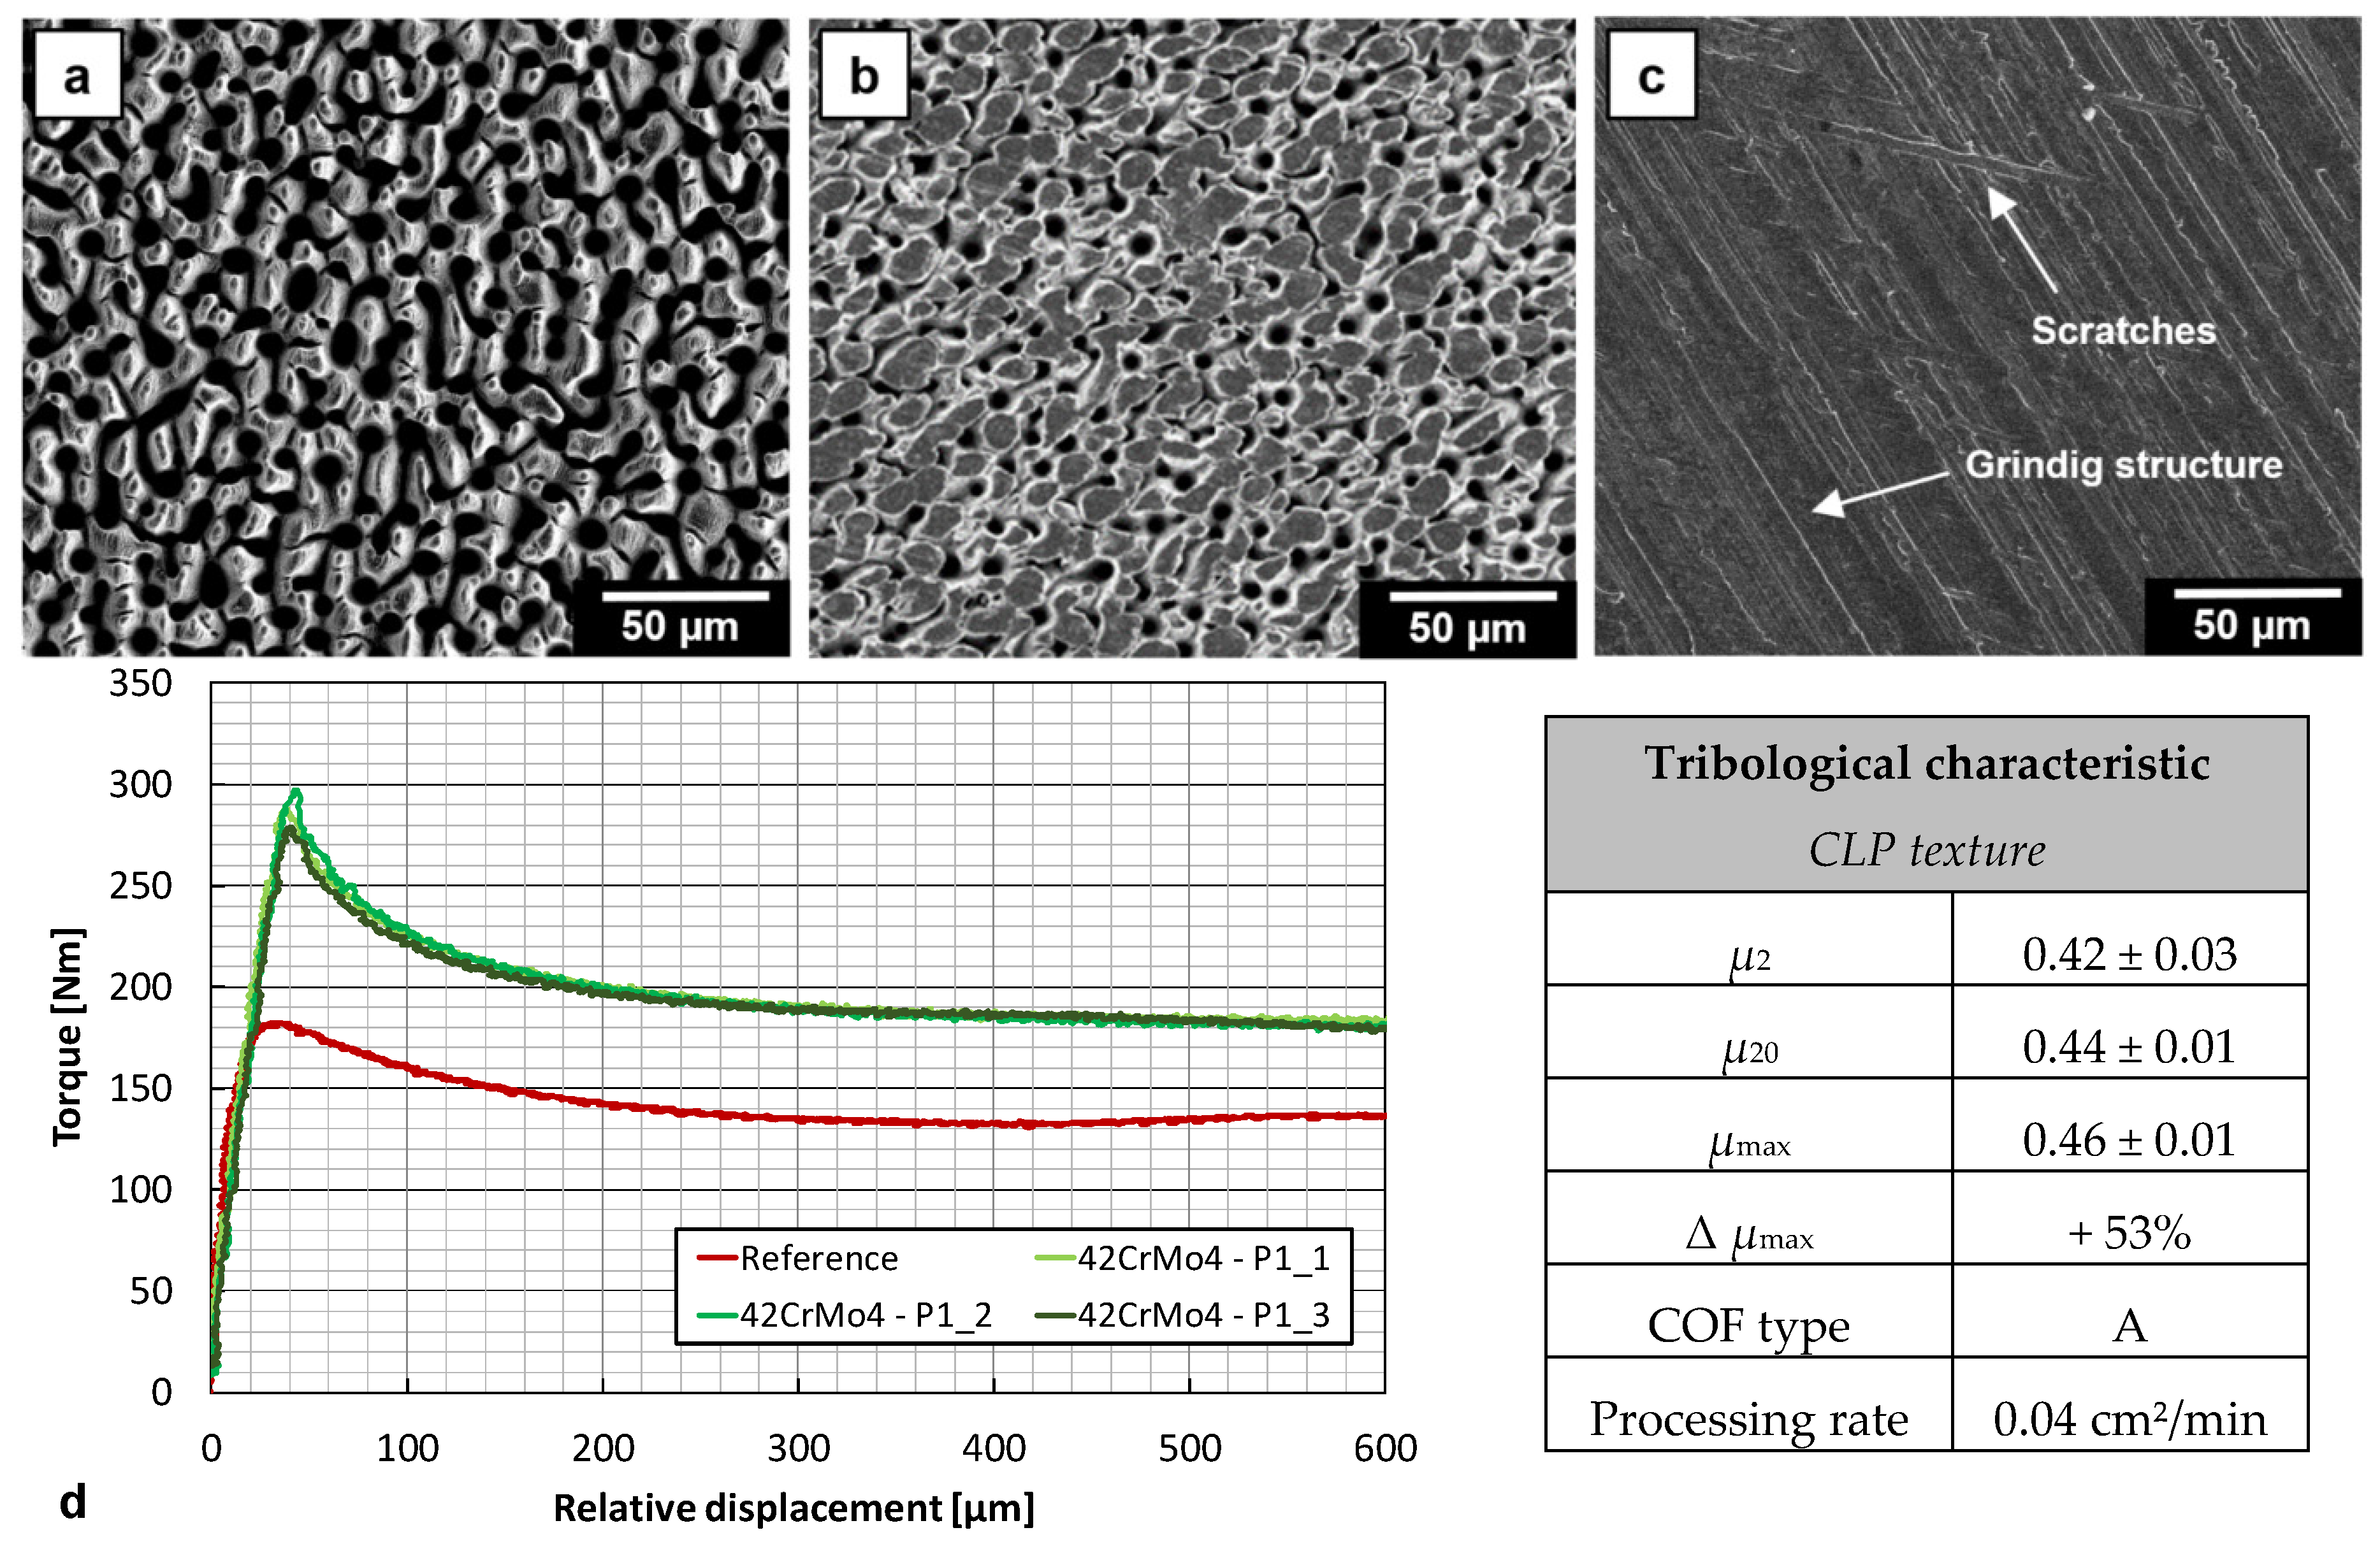
Cone-like protrusions (CLPs) originate in regions of highest dose that can be seen in Figure 6c and f for pulses of H0 = 3.7 J/cm2 impinging at high spatial pulse overlaps.

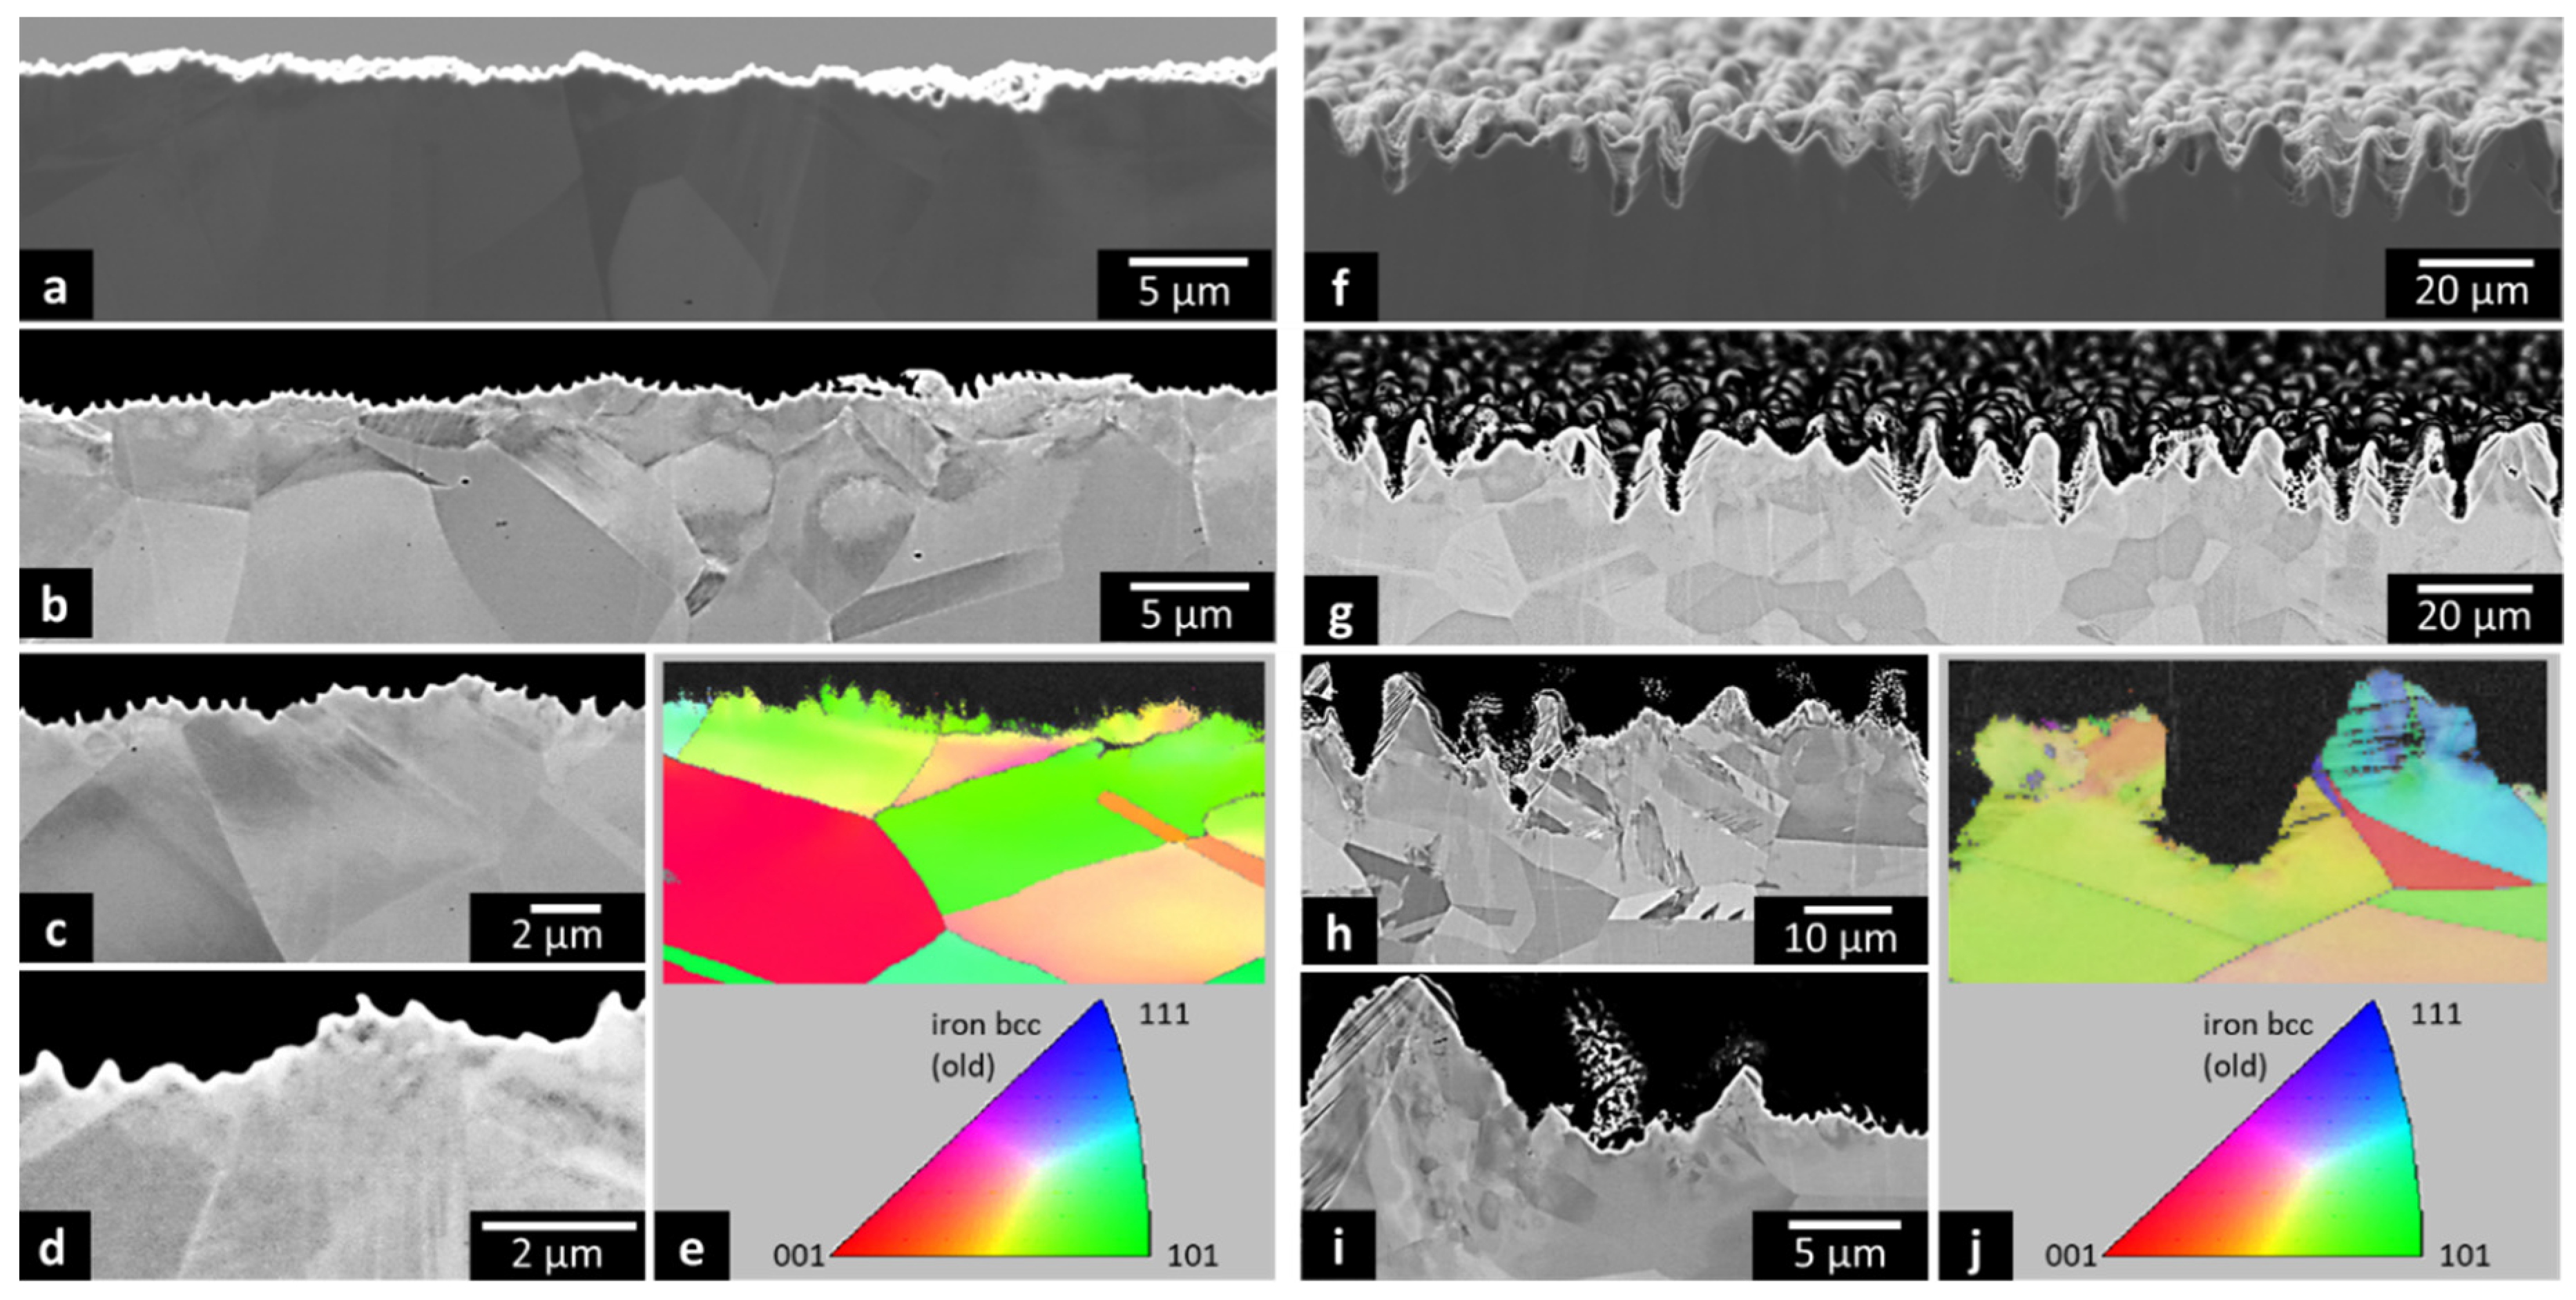
4.2. Microstructure Characterization

The laser made microscopic surfaces features were investigated regarding their microstructural characteristics in order to assess whether or not the metallographic structure underneath the surface was affected by the laser processing. Therefore, the ion beam slope cutting (IBSC) technique [46,47] was applied with help of the EM TIC 020 Milling System (Leica Microsystems) to prepare the laser textured regions for cross-sectional scanning electron microscope (SEM) and electron back scatter diffraction (EBSD) inspections. The areas of interest were exposed at an angle of 90° to create a slope plane for the representative view on the laser-treated near-surface region. The advantage of the IBSC preparation method over common mechanical preparation techniques was that no additional deformations were introduced to the material [47] and thus the original metallographic structure of the microscopic features was exposed as developed during laser processing.
In the SEM analysis, two detector modes were used for providing different information for the ion beam cut slope planes on the laser processed surfaces. First, the signal detected from the secondary electrons (SE detector mode) is carrying more detailed information from the laser treated surface as it originated from the inelastic interaction between the electron beam and the sample atoms. And second, the signal received from the backscattered electrons (BSE detector mode) resulted from the inelastic interactions between the electron beam and the sample providing in depth information from deeper regions of the laser processed areas. In addition, the EBSD method was applied for a more precise insight on the grain size, crystallographic structure and orientation of the laser affected subsurface regions.
The cross-section SEM micrographs of Figure 7 show two laser textures at different magnifications: LSFL-ripples produced on the steel sample at 1.7 J/cm2 and 5 scan passes (left, a–e) and CLP formations covering the steel surface that were made with pulses of same laser peak fluence but 20 scan passes (right, f–j). On the one hand, there is a clear difference in the height and period of the developed laser texture features. From Figure 7 left, the height of the LSFL can be estimated of about 0.4 µm and the period is somewhat less than the wavelength of the impinging laser beam of 1.03 µm which is consistent to our previous findings for near-infrared ultrashort laser beams [48]. The height of the CLP structures can be seen in the range between 10 µm and 20 µm and their period of about 10 µm is almost one order of magnitude greater than the ripple period. On the other hand, there is a grain structure variation between the near surface region and the base material thus indicating the laser affected subsurface region. This can clearly be seen in Figure 7c,d as well as in Figure 7h,i where the grain size is much smaller in the molten and re-solidified transition layer than in the bulk metal. According to this, the depth of the laser affected region is approximated by the thickness of the transformed subsurface layer, which is in the range between 2 µm and 5 µm for the ripple textures and from 20 µm up to 30 µm for the CLPs. The formation of such a transition layer is also confirmed in Figure 7e,j showing the results of the EBSD measurements carried out on the laser-treated near-surface region. The re-solidified areas formerly melted by the laser irradiations become visible in the EBSD mappings by slight orientation changes within the larger grains.

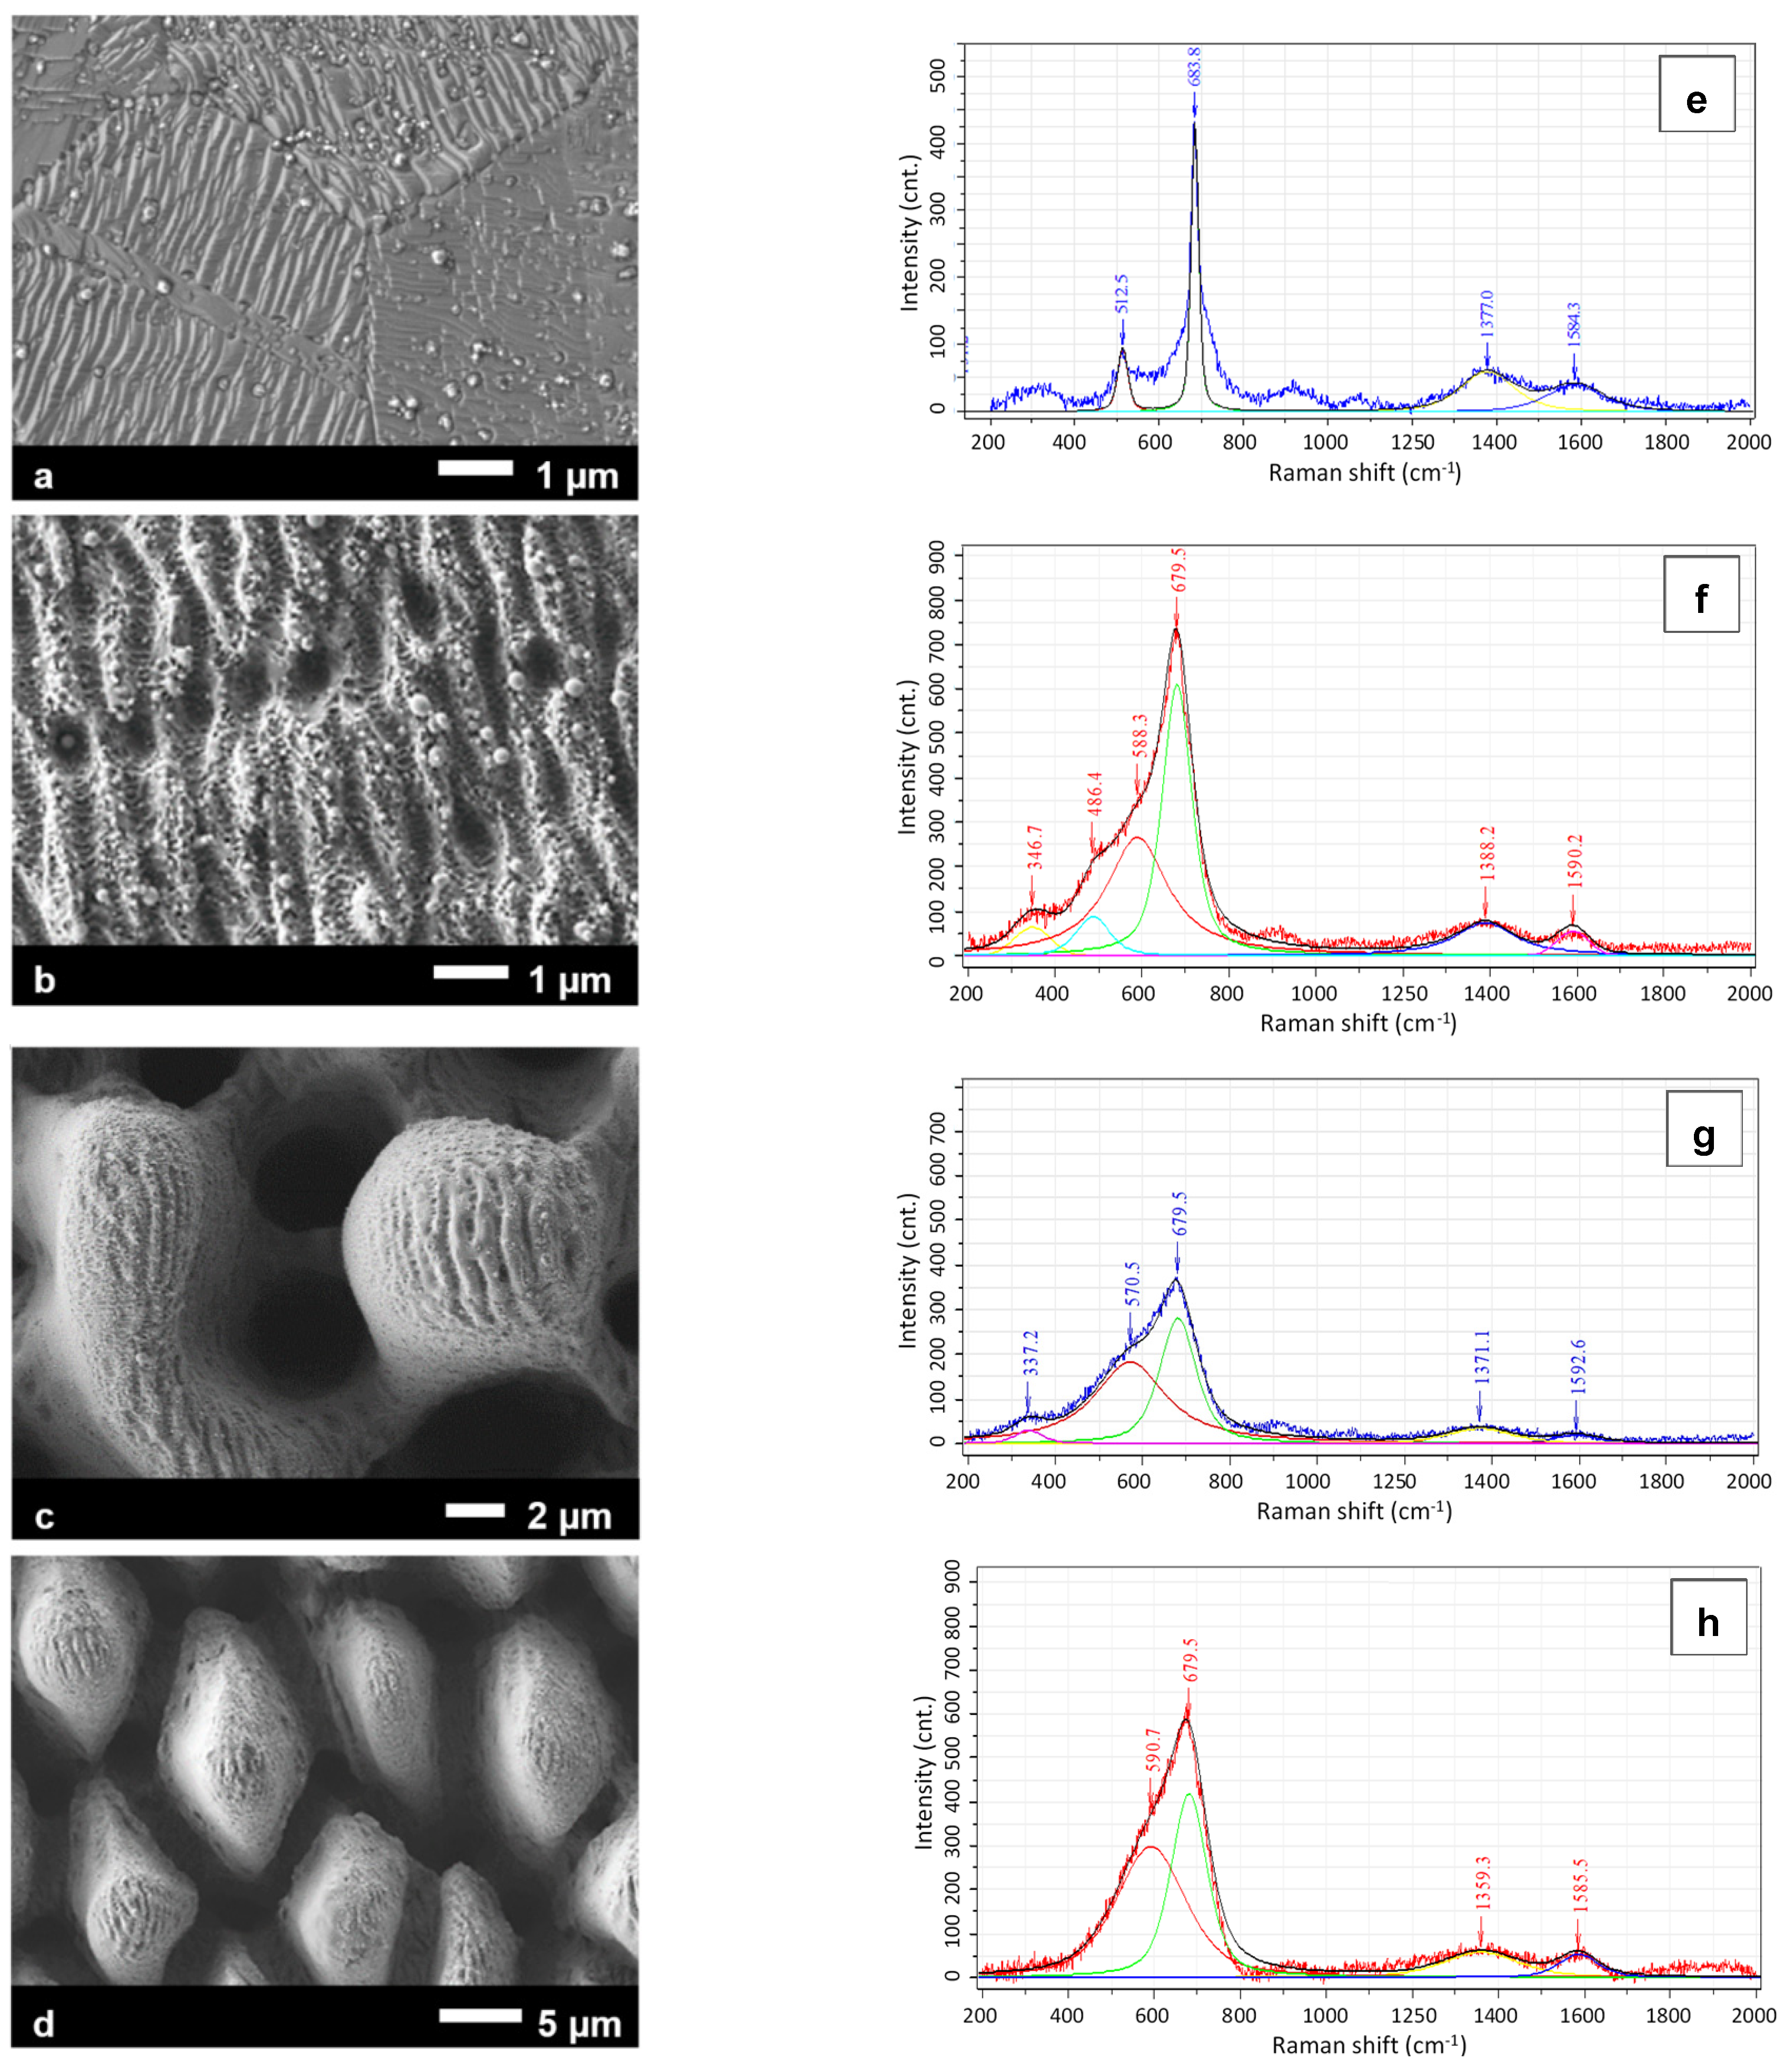
4.3. Raman Spectroscopy Analysis

The disordering of the crystallographic structure is also validated by Raman spectroscopy measurements on the surface of the laser textured areas using the micro Raman microscope LabRam HR VIS (Horiba Scientific). The excitation wavelength of 473 nm was deliberately chosen to measure with a shallow depth of penetration and thus to determine the superficially changes in the material properties. Figure 8 (left) illustrates the investigated microscopic features by high-resolution field emission scanning electron microscopy (FESEM) images, such as: a) untreated steel surface for reference purposes, as well as ripples and CLP´s produced with H0 = 1.7 J/cm2 and b) pd = 2 µm, ld = 10 µm, 5 scans; c) pd = 2 µm, ld = 10 µm, 20 scans; and d) pd = 2 µm, ld = 2 µm, 20 scans. The corresponding Raman signals detected from the laser excitation of the substrate surfaces are presented in Figure 8 (right, e–h). The reference spectrum in Figure 8e shows two sharp bands below 800 cm-1 which are characteristic for the original (untreated) steel material. On the laser processed surfaces, however, these bands merge and become wider with increasing total energy input. Further information on this signal broadening can be found in the literature reporting broad spectral features appearing on furnace heat treated Fe-Cr-Ni alloy [49]. The spectra broadening was related to spinel-like chromium oxide, disordered FexCr3-xO4 spinel or an amorphous oxide layer forming at the substrate surface at temperatures ranging between 300 °C and 500 °C. From this it can be concluded, the crystal structure of the laser textured surfaces is no longer ordered and becomes more amorphous due to potential deformation or melting during the laser processing.
In Figure 8, the spectral features shown in the range from 600 cm−1 to 800 cm−1 matches pretty well with FeCr2O4 and Cr2O3 Raman spectra published in the RRUFF™ database [50]. The slight shift of the spectral peaks, for instance 683.8 cm−1 versus 679.5 cm−1 for the untreated and laser textured substrates, gives a hint for compressive or tensile stresses induced by the laser process. The weak features appearing in the Raman spectra between 1250 cm−1 and 1500 cm−1 might result from the carbon layer developed on the metal alloy surface without significant effect from the laser texturing. However, the detected Raman signals could not unambiguously be assigned to specific chemical compounds due to overlapping peak positions. In consequence, the Raman analysis carried out here is more suitable for the qualitative assessment of the laser textured substrates than for the exact determination of the chemical composition of the laser treated (sub)surface region.

4.4. Tribological Performance Test

For tribological performance testing, the self-organizing laser textures were produced on the ring-shaped contact surface of the test specimens described above in Section 3. The test specimens were made of molybdenum alloy steel 42CrMo4 + QT which is a high-grade steel widely used in engineering purposes. Preliminary tests reveal that the microscopic surface textures produced on austenitic chromium-nickel steel 1.4301 metal plates for Raman and cross section analysis develop of similar topographical shape on 42CrMo4 + QT specimen material. The COF values given in the following represent mean values averaged over 3 individual measurements for 100 MPa surface pressure in the contact area under dry friction condition. As a reference, two non-laser treated test specimen with fine grinded surface topography were tested, showing a static COF of µmax = 0.30 and Type A frictional characteristic for 100 MPa contact surface pressure [37]. The corresponding slipping curve for the non-laser textured contact system will be given in the following plots (indicated by a red line) for reference purposes.
The self-organizing CLP texture shown in Figure 9a was made by crossover scanning a near-infrared laser beam of 10 ps pulse duration, 15 W average laser power at 1 MHz pulse repetition frequency and 3.7 J/cm2 laser peak fluence. The hatch and line distance of the raster-scanned cross grid was kept constant of 10 µm. The effective area processing rate was considerably low of 0.04 cm²/min that resulted from the high number of scan crossings applied to produce this special shape of CLPs. The maximum height SZ and the root mean square height Sq as representative surface roughness values were measured of SZ = 21.4 μm and Sq = 3.46 µm, respectively.
In the frictional tests, the CLP textures were tested against a counter body with a fine grinded (non-laser treated) contact area of SZ = 2.9 μm and Sq = 0.28 µm average surface roughness. The recorded slipping curves presented in Figure 9d indicate a tribological characteristic according to Type A. The summary of the tribological characteristics of the CLP texture is provided in the table of Figure 9 (bottom, right) showing static COFs of µ2 = 0.42 and µ20 = 0.44. The maximum static COF was determined of µmax = 0.46 that is about + 53 % higher than the COF reference value of 0.30. In addition, SEM micrographs taken from the CLP texture and the contact area of the counter body after the friction test are shown in Figure 9b,c. The CLPs appeared squashed after the testing and scratches with a maximum depth of 5.6 µm can be observed on the counter body contact surface.
The LSFL ripples presented in Figure 10a were produced on the fine grinded specimen surface by irradiating ultrashort pulses of 400 fs pulse duration at 1.03 MHz pulse repetition frequency and 7.9 J/cm2 laser peak fluence. The laser beam was raster-scanned in a single line-scan pattern where the line distance was set of 10 µm. The effective area processing rate was 18 cm2/min obtained at 10 m/s laser beam moving speed. The height of the ripples could be estimated of about 0.4 µm in Section 4.2. The LSFL ripple textured specimen were tested against another rippled surface textured with the same laser parameter set. The testing against a laser textured counter body was due to the fact that the roughness of the fine grinded surfaces was significantly larger than the ripple height and thus no significant effect on the friction performance was expected for the test of ripple textured surfaces against surfaces of larger roughness. The slipping curve recorded for the ripple versus ripple contact system reveal a clear increase of the static COF of µ2 = 0.41 at the very beginning until the maximum of µmax = 0.42 was reached. However, with further displacement a rapid drop can be seen in the curve with COF of about the non-laser textured reference value of µ20 = 0.29. This result for the stainless steel alloy is a bit contrary to our expectations as higher friction forces were reported for ripple textured silicon [51] as well as the hypothesis of a potential enhancement of the adhesion part of friction resultant from the lower roughness of the ripple textured surfaces. Figure 10a–c shows the LSFL textured surface before and after the friction test, the underlying fine grinded surface structure is still apparent. On both test specimens, the ripple texture smeared, or rather was pushed away during frictional testing. The recorded slipping curve in Figure 10d indicates a COF Type A.

5. Deterministic Surface Textures for Advanced Tribological Functionality

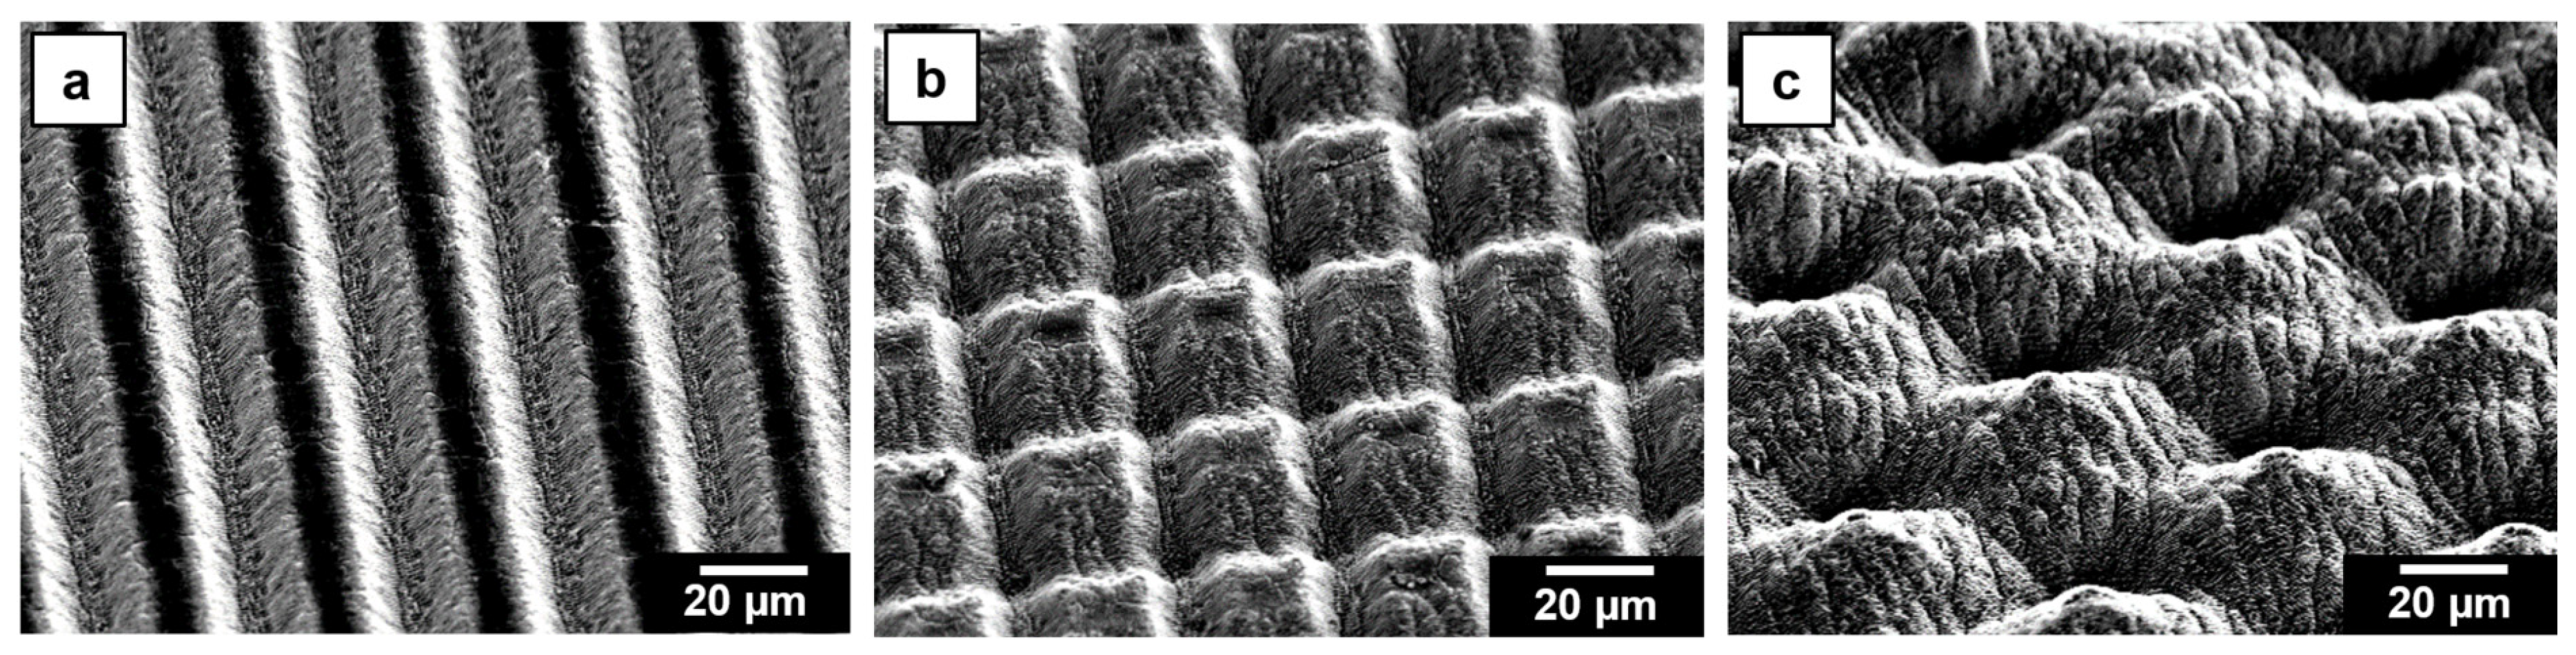
5.1. Deterministic Surface Textures and Groove Structures

Deterministic surface textures made by direct laser structuring provide another practical method to control the surface functionality in general, and here in particular the frictional performance of tribological systems. Therewith, the surface feature characteristic can easily be adjusted by the chosen processing parameters, for instance, the laser beam spot size in the processing plane, the laser peak fluence of the irradiated pulses and the scan regime by the lateral pulse and line distance as well as the number of scan passes. As the width of the microscopic features can be varied by the pulse/line spacing, the scan number has a greater effect on the feature height. In particular, nanosecond lasers have been used during the past for the fabrication of high aspect-ratio surface features, among others, demonstrated in [52,53]. A recent study reports on the gradually increase of the friction coefficient with higher line density [54]. In any case, the fabrication of deterministic surface features with nanosecond lasers is characterized by strong material melting accompanied by a greater influence of the laser processing on the crystallographic structure, as observed up to 80 μm from the surface for the nanosecond laser regime [53]. This processing behavior can be a serious disadvantage that hinders the use of the cost-effective nanosecond laser technology for desired (micro-)engineering needs. A promising alternative therefore is provided by the ultrashort pulse laser technology, in particular for high-precision engineering applications. As a machining example, Figure 11 presents a number of different surface topographies made with an ultrashort pulse laser beam and a varied beam scanning pattern, such as (a) line pattern, (b) cross pattern and (c) a combination of an alternating line and crosswise scanned laser beam. The feature depth can easily be adjusted by the number of scan passes.

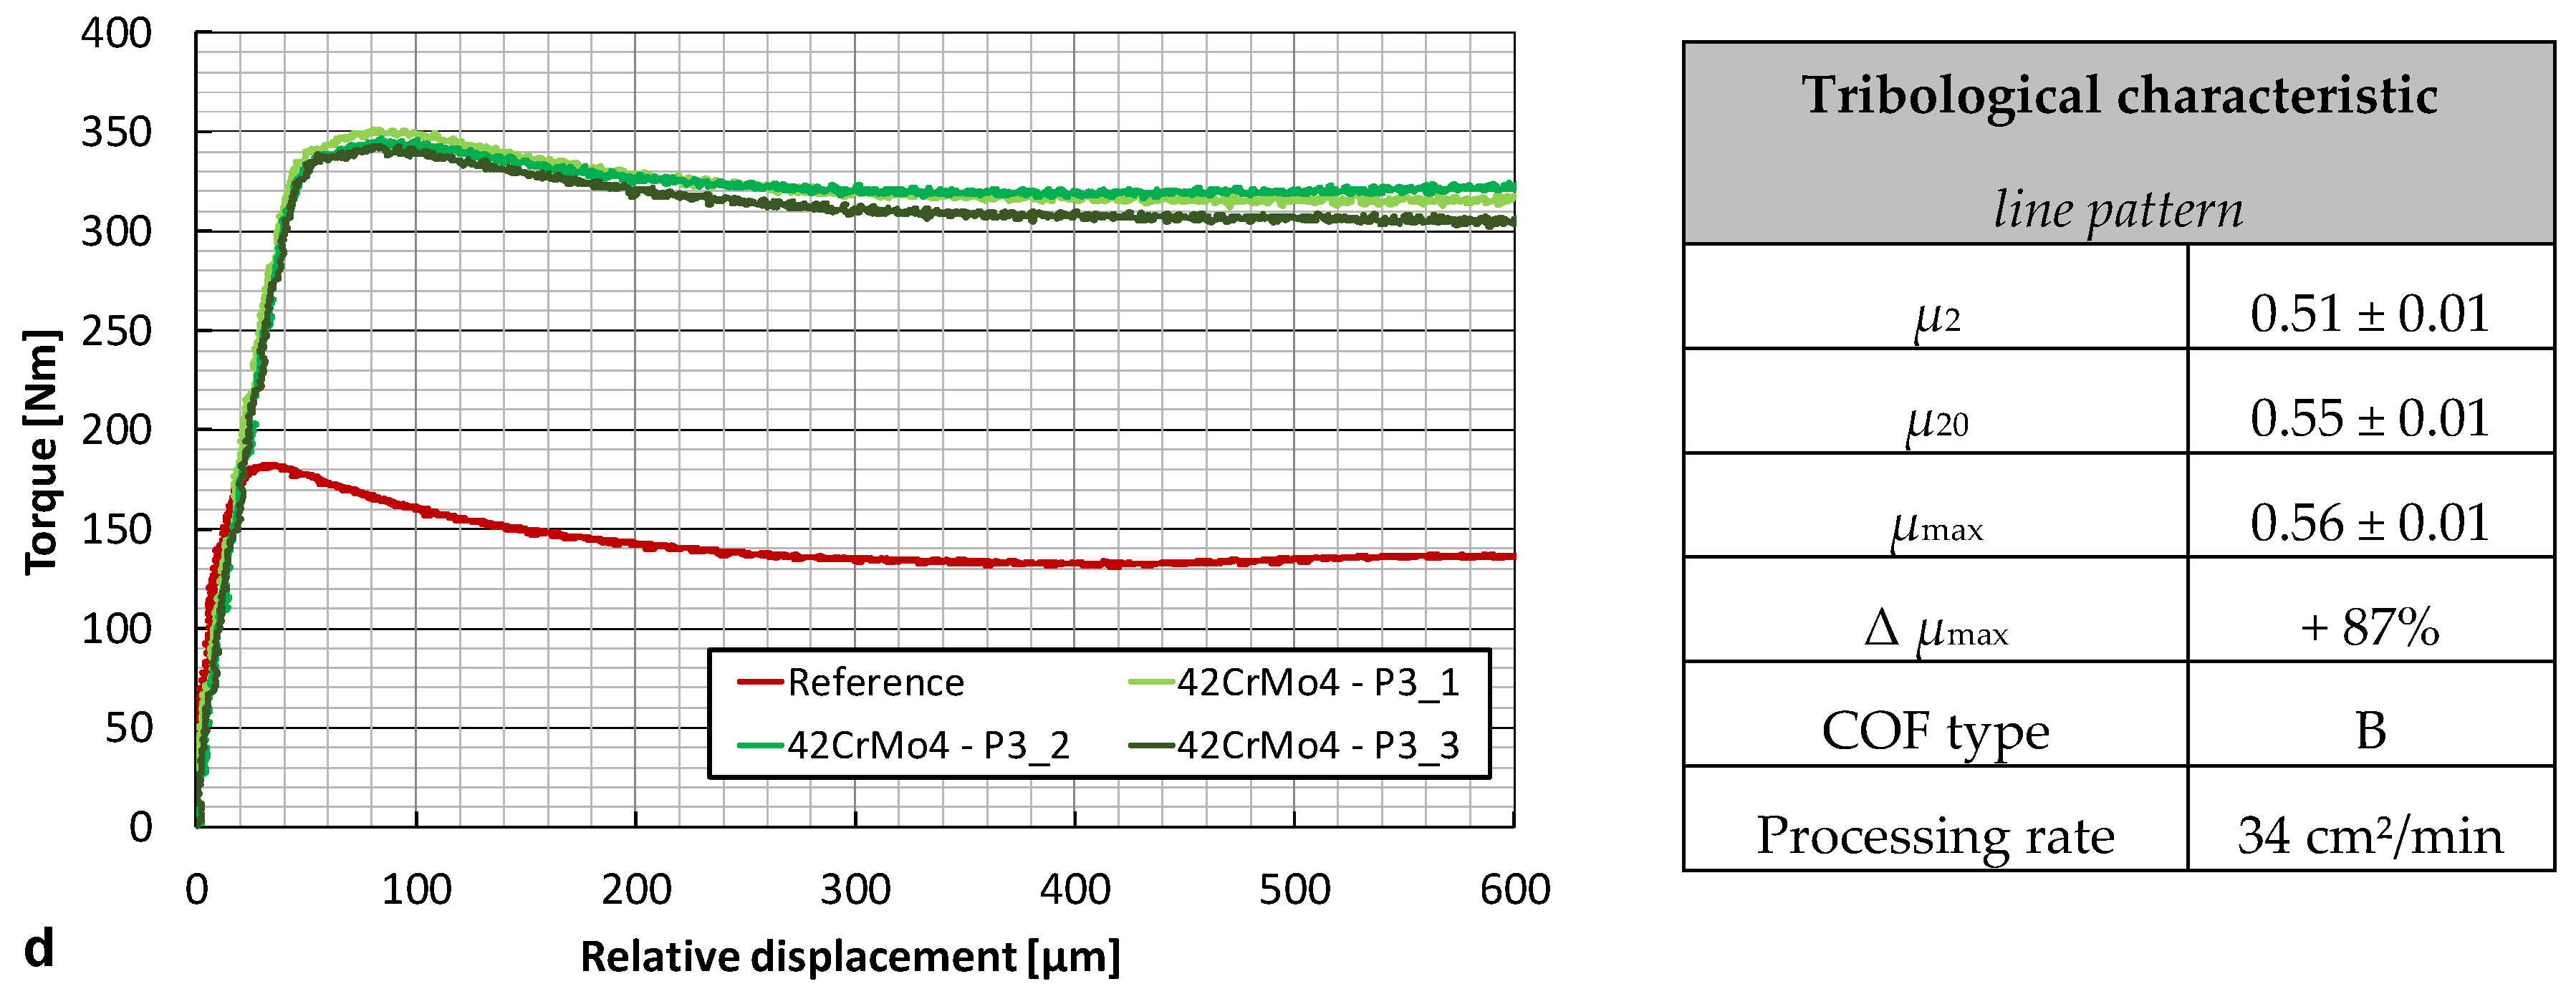
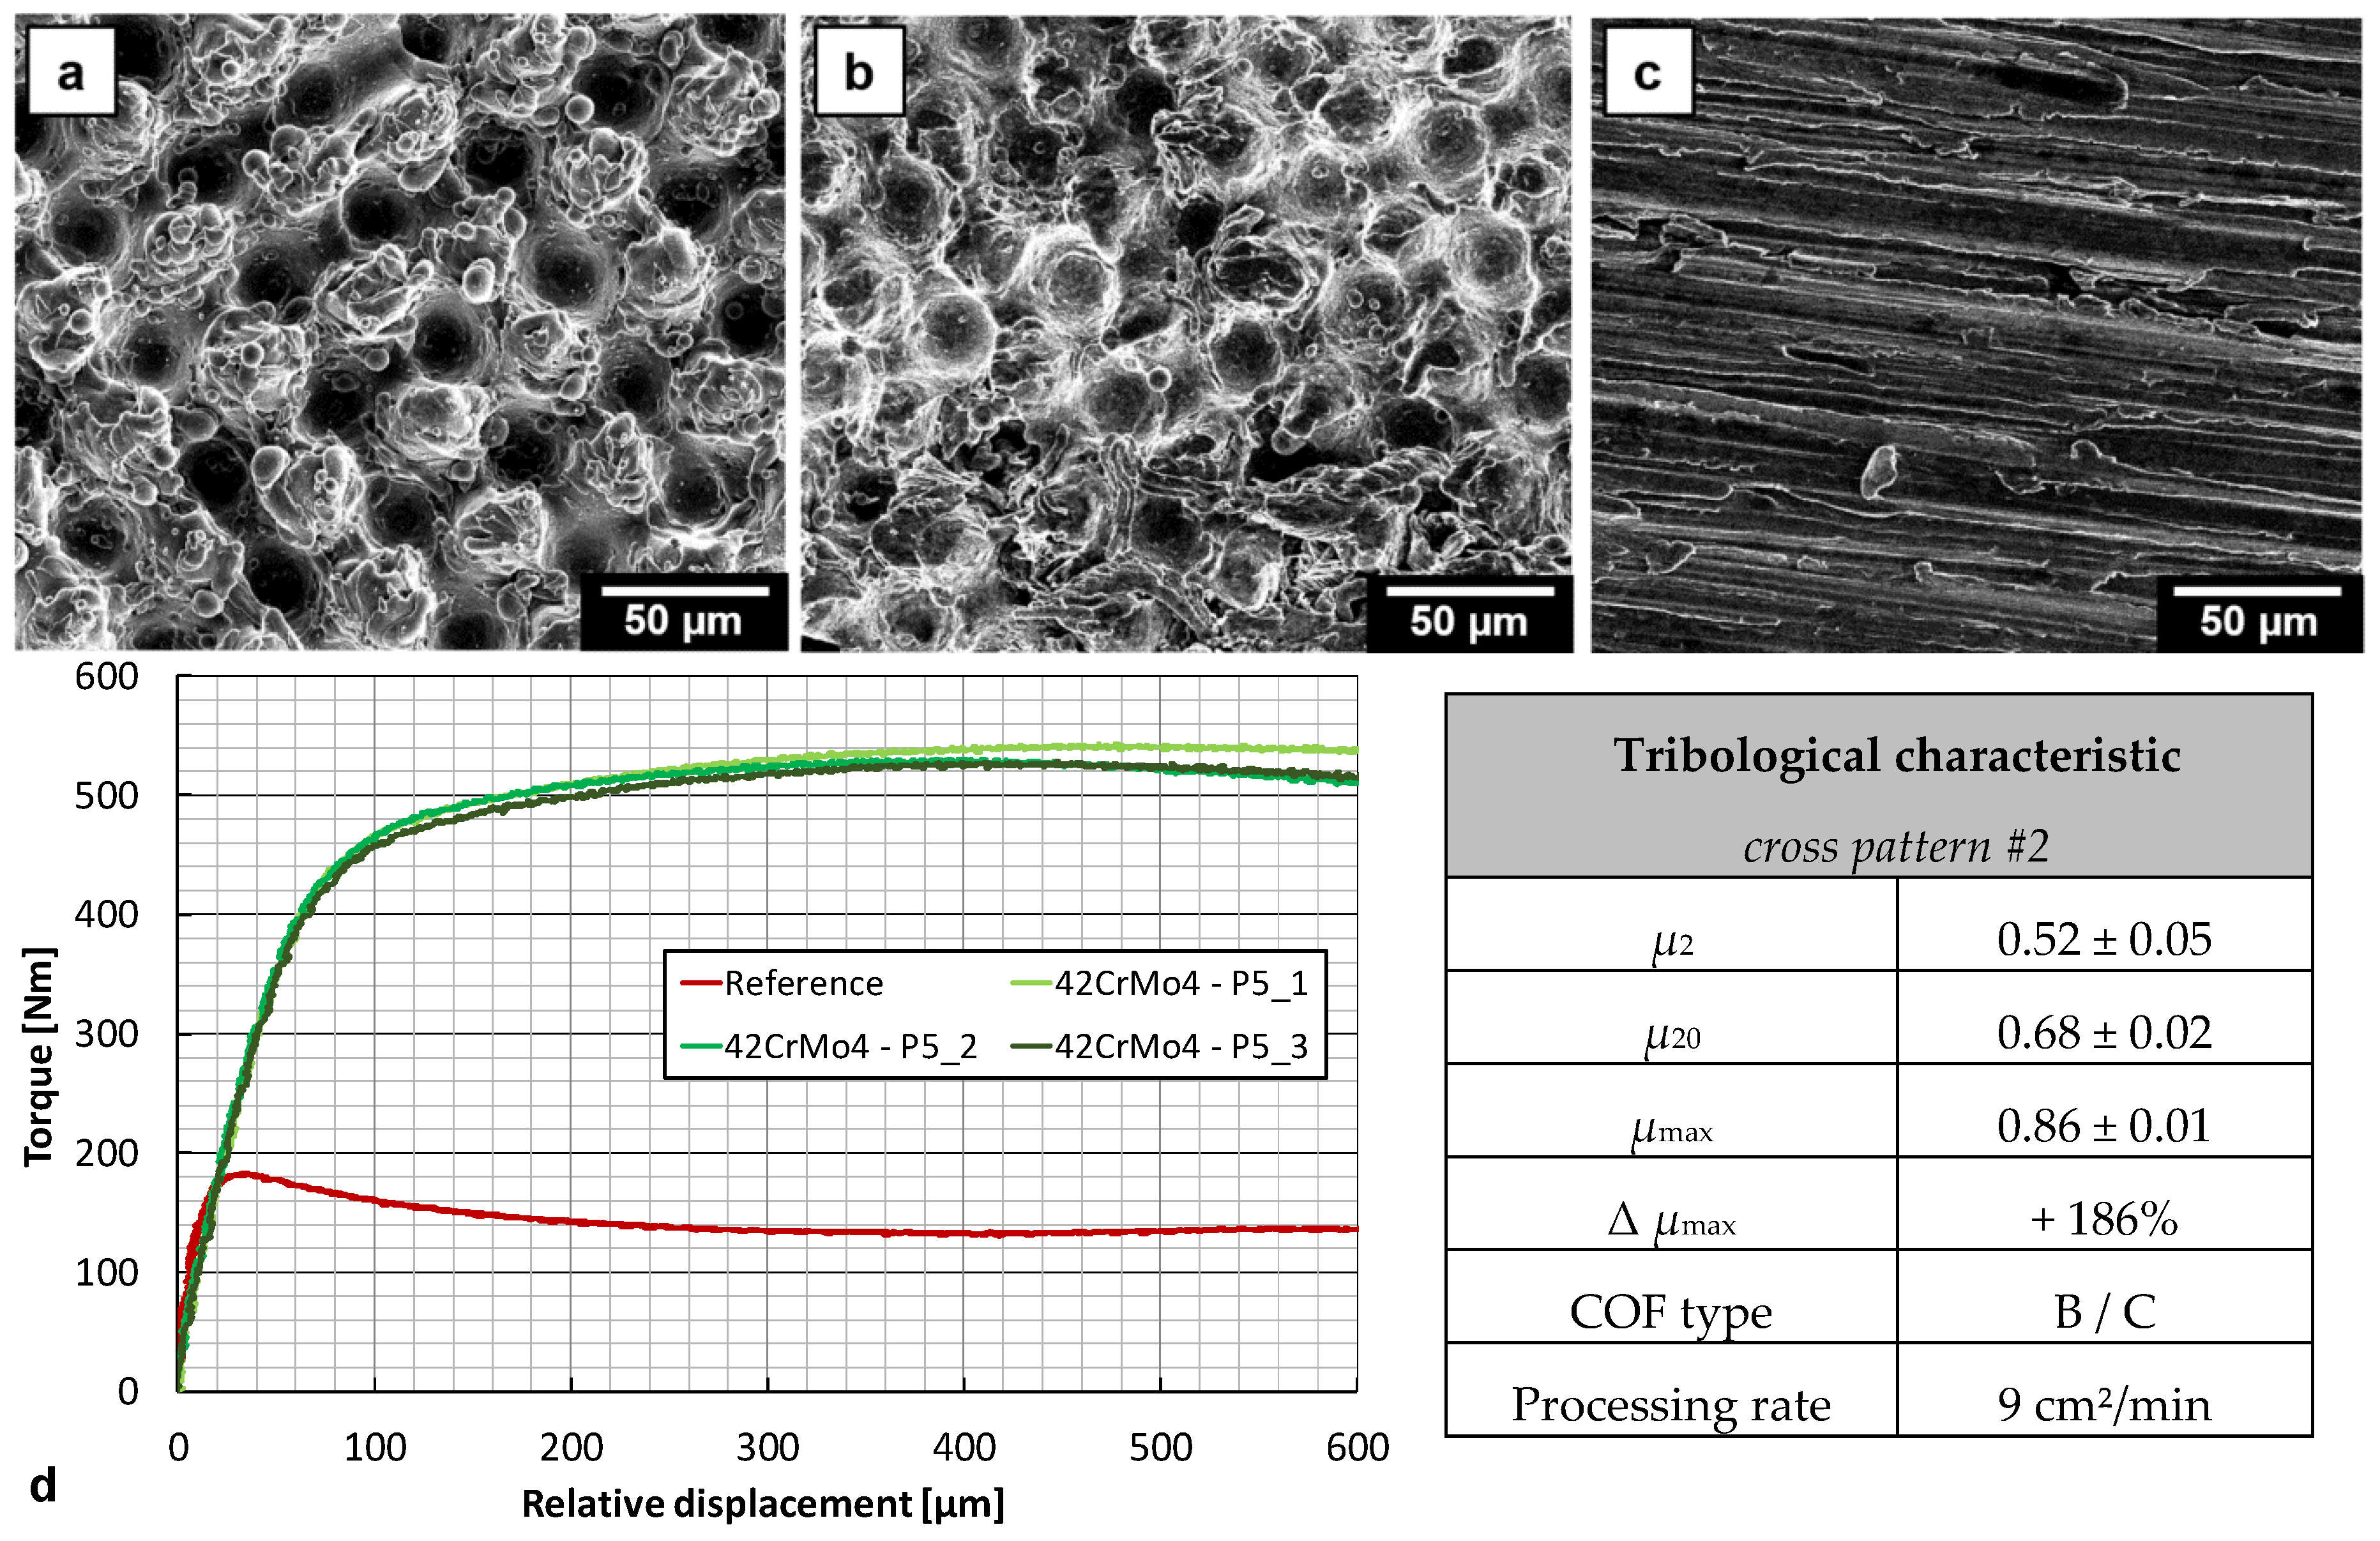
5.2. Tribological Performance

Two different surface textures were investigated regarding their dry friction performance, a line pattern and a cross pattern consisting of 2 perpendicularly crossed lines. The line pattern in Figure 12 was made on the 42CrMo4 + QT specimen contact surface by irradiating 10 ps pulses at 10 MHz and 200 W average laser power and respective 5.0 J/cm2 laser peak fluence. The lateral distance between the lines in the raster-scanned pattern was 20 µm, the lateral pulse distance within a line was 1 µm. The effective area processing rate for this line pattern textured with a single pass was 34 cm2/min.
In Figure 12a, a high number of molten and re-solidified surface features can be seen following the line-by-line raster scan pattern with a spatial distance of 20 µm. The reason for material melting was the high optical energy deposition onto the material resulting from the high average laser power irradiated at high pulse overlaps within a line. The average surface roughness of the laser textured contact area was measured of SZ = 12.8 μm, Sa = 1.43 µm and Sq = 1.76 µm. After friction testing, the roughness values have been found almost unchanged of SZ = 11.6 μm, Sa = 1.57 µm and Sq = 1.87 µm. The SEM inspection of Figure 12b shows slightly compressed features after the friction test while the surface of the counter body appeared corrugated in Figure 12c. A clear indication for this surface corrugation is also given by the surface roughness values where SZ increased from 2.9 µm to 4.9 µm that was measured before and after the friction test. From the slipping curves presented in Figure 12 d, the static COF was determined of µmax = 0.56 for the line pattern that is about + 87% higher than the reference COF of the non-laser textured contact system. The frictional characteristic of the slipping curve follows Type B.
Aside from the pulse and line distance which were set of 1.5 µm and 40 µm, the laser settings chosen for the line pattern were also applied for the fabrication of the cross pattern shown in Figure 13a. For two scan passes in total the area processing rate was 43 cm2/min. The characteristic topography parameters of the surface features were measured of SZ = 14.8 μm, Sa = 1.65 µm and Sq = 2.05 µm. After friction testing, the tips seem to be compressed in Figure 13b but the surface roughness parameter were measured of similar dimension as before of SZ = 13.2 μm, Sa = 1.83 µm and Sq = 2.24 µm. The counter body surface appeared plastically deformed, see Figure 13. The maximum static COF was derived from the Type B slipping curve of µmax = 0.66 that is about + 120% higher than the COF reference value.
By further scanning the laser beam, high-aspect ratio surface topographies could be produced. The deterministic surface features presented in Figure 14 have been achieved only by increasing the number of scan passes from 2 to 10. A considerably rougher surface topography was achieved that was measured of SZ = 47.3 μm, Sa = 8.55 µm and Sq = 9.85 µm. While the processing rate significantly decreased to 9 cm²/min resulting from the higher number of scan passes, only a little higher static COF was determined from the recorded slipping curves of µ20 = 0.68 or rather + 127% increase compared to the reference contact. The maximum COF, however, was of µmax = 0.86 implying a substantial COF increase up to + 186%.

6. Shaft-Hub Connection

The transferability of model-based static COF´s to real components was recently demonstrated for mechanical manufacturing processes [55]. However, in this study a shaft-hub connection was chosen to transfer the advanced tribological performance of laser textured surfaces to a real-life application for the first time. The shaft diameter was 40 mm with H7 press fit for the shaft-hub connection. As a reference, the static COFs were determined of µ20 = 0.20 and 0.24 for this specific shaft-hub connection considering a turned or rather fine-grinded surface quality of the contact area [34]. In this very initial test, the width of the laser textured area was 50 mm, as can be seen in the topographical analysis in Figure 15, left. Three different laser textures were analyzed: (i) the LSFL texture of Figure 10, (ii) the line pattern of Figure 12 and for reference purposes (iii) a dimple-shaped micro texture produced with a nanosecond laser as described in a previous study [14]. The frictional performance was analyzed by using a specially designed test rig for joined real components. The surface pressure varied in the measurements that was due to manufacturing tolerances of the shaft-hub assembly. The recorded slipping curves can be seen for the three different laser textures in Figure 15, right. Therefrom, the static and the maximum COFs µ20 and µmax as well as the COF type were assessed. It is noteworthy, all COF values determined for the laser textured shaft-hub connection are larger than that for the non-laser textured contact surfaces. Table 2 shows the highest static COF for the line-patterned laser texture, µ20 = 0.34 Type A while the maximum COF µmax = 0.4 was obtained with the dimple textured surface. Thus, the maximum COF increase was found of about + 20% for the LSFL, + 70% for the line pattern and + 100% for the dimple-shaped laser texture, respectively.
The processing rates given in Table 2 for the LSFL and line pattern, however, are noticeably lower than that presented above in Table 1 for ultrafast laser beam scanning. Therefore, it should be mentioned the processing rates in Table 2 are derived from the total processing time as spent for this specific shaft laser texturing using a galvanometer scanner at this very initial state. By further optimizing the laser texturing implementing polygon-mirror based and multi-beam strategies here, a substantially increase of the processing rates will also be achieved for rotational parts.

7. Summary

High-rate laser texturing was presented as a powerful method for advanced surface engineering and functionalization. By combining high-power laser systems with polygon mirror based scan techniques for ultrafast surface texturing, a maximum area processing rate up to 3.8 m2/min could be achieved. This unprecedented processing rate was experimentally realized by single pass raster scanning the laser beam at 950 m/s scan speeds producing microscopic surface features over a large area on stainless steel metal sheets. The effective area processing rate decreased noticeably when a higher number of scan passes was required to fabricate a distinct surface topography for a specific surface functionality, as demonstrated by a regular ripple structure where the effective area processing rate was 0.13 m2/min.
The laser textured surfaces were analyzed regarding their frictional performance by using a standardized friction test method. The highest static COF was found of µ20 = 0.68 for the laser textured cross pattern that is about + 126% higher than that obtained for the fine grinded reference contact system. The static COF determined for self-organizing cone-like protrusions was µ20 = 0.44 while a little effect on the tribological performance was observed for LSFL textured contact surfaces with µ2 = 0.41 at the very beginning of the measurement. The effective area processing rates for both self-organizing and deterministic laser surface textures were typically achieved in the range between 0.04 cm2/min and 43 cm2/min.
Finally, the ultrashort pulse laser made microscopic surface features were tested for the first time in a shaft-hub connection. For the line pattern textured on the shaft surface, the COF increased to µmax = 0.35 that is + 75% higher than the reference value. Even though further optimization on the surface texture is needed for this special machining example, the high potential of laser textured microscopic surface features could be demonstrated for advanced tribological functionality by a real-world application. Moreover, in addition to the increase of the static coefficient of friction presented here, the laser textured surfaces may also provide great potential to enhance adhesive strength and stability for bonded joints and hard coatings, e.g., on forming and milling tools that will be investigated in the ongoing study.

Author Contributions

Conceptualization, J.S., F.R.; methodology, L.S., J.S., F.R., S.S., S.H., J.P.; investigation, L.S., J.S., F.R., S.S., S.H.; validation, all authors; resources, U.L., J.S., E.L., J.P.; writing—original draft preparation, J.S., F.R., S.S., S.H., S.M.; writing—review and editing, all authors. All authors have read and agreed to the published version of the manuscript.

Funding

The presented study was funded by the German Federal Ministry of Education and Research (grant numbers 03FH037PX4 and 03PSIPT1A) and by the Federal Ministry of Economic Affairs through the German Federation of Industrial Research Associations (AiF grant numbers 17229 BR/1 and 18500 BR/1).

Conflicts of Interest

The authors declare no conflict of interest.

References

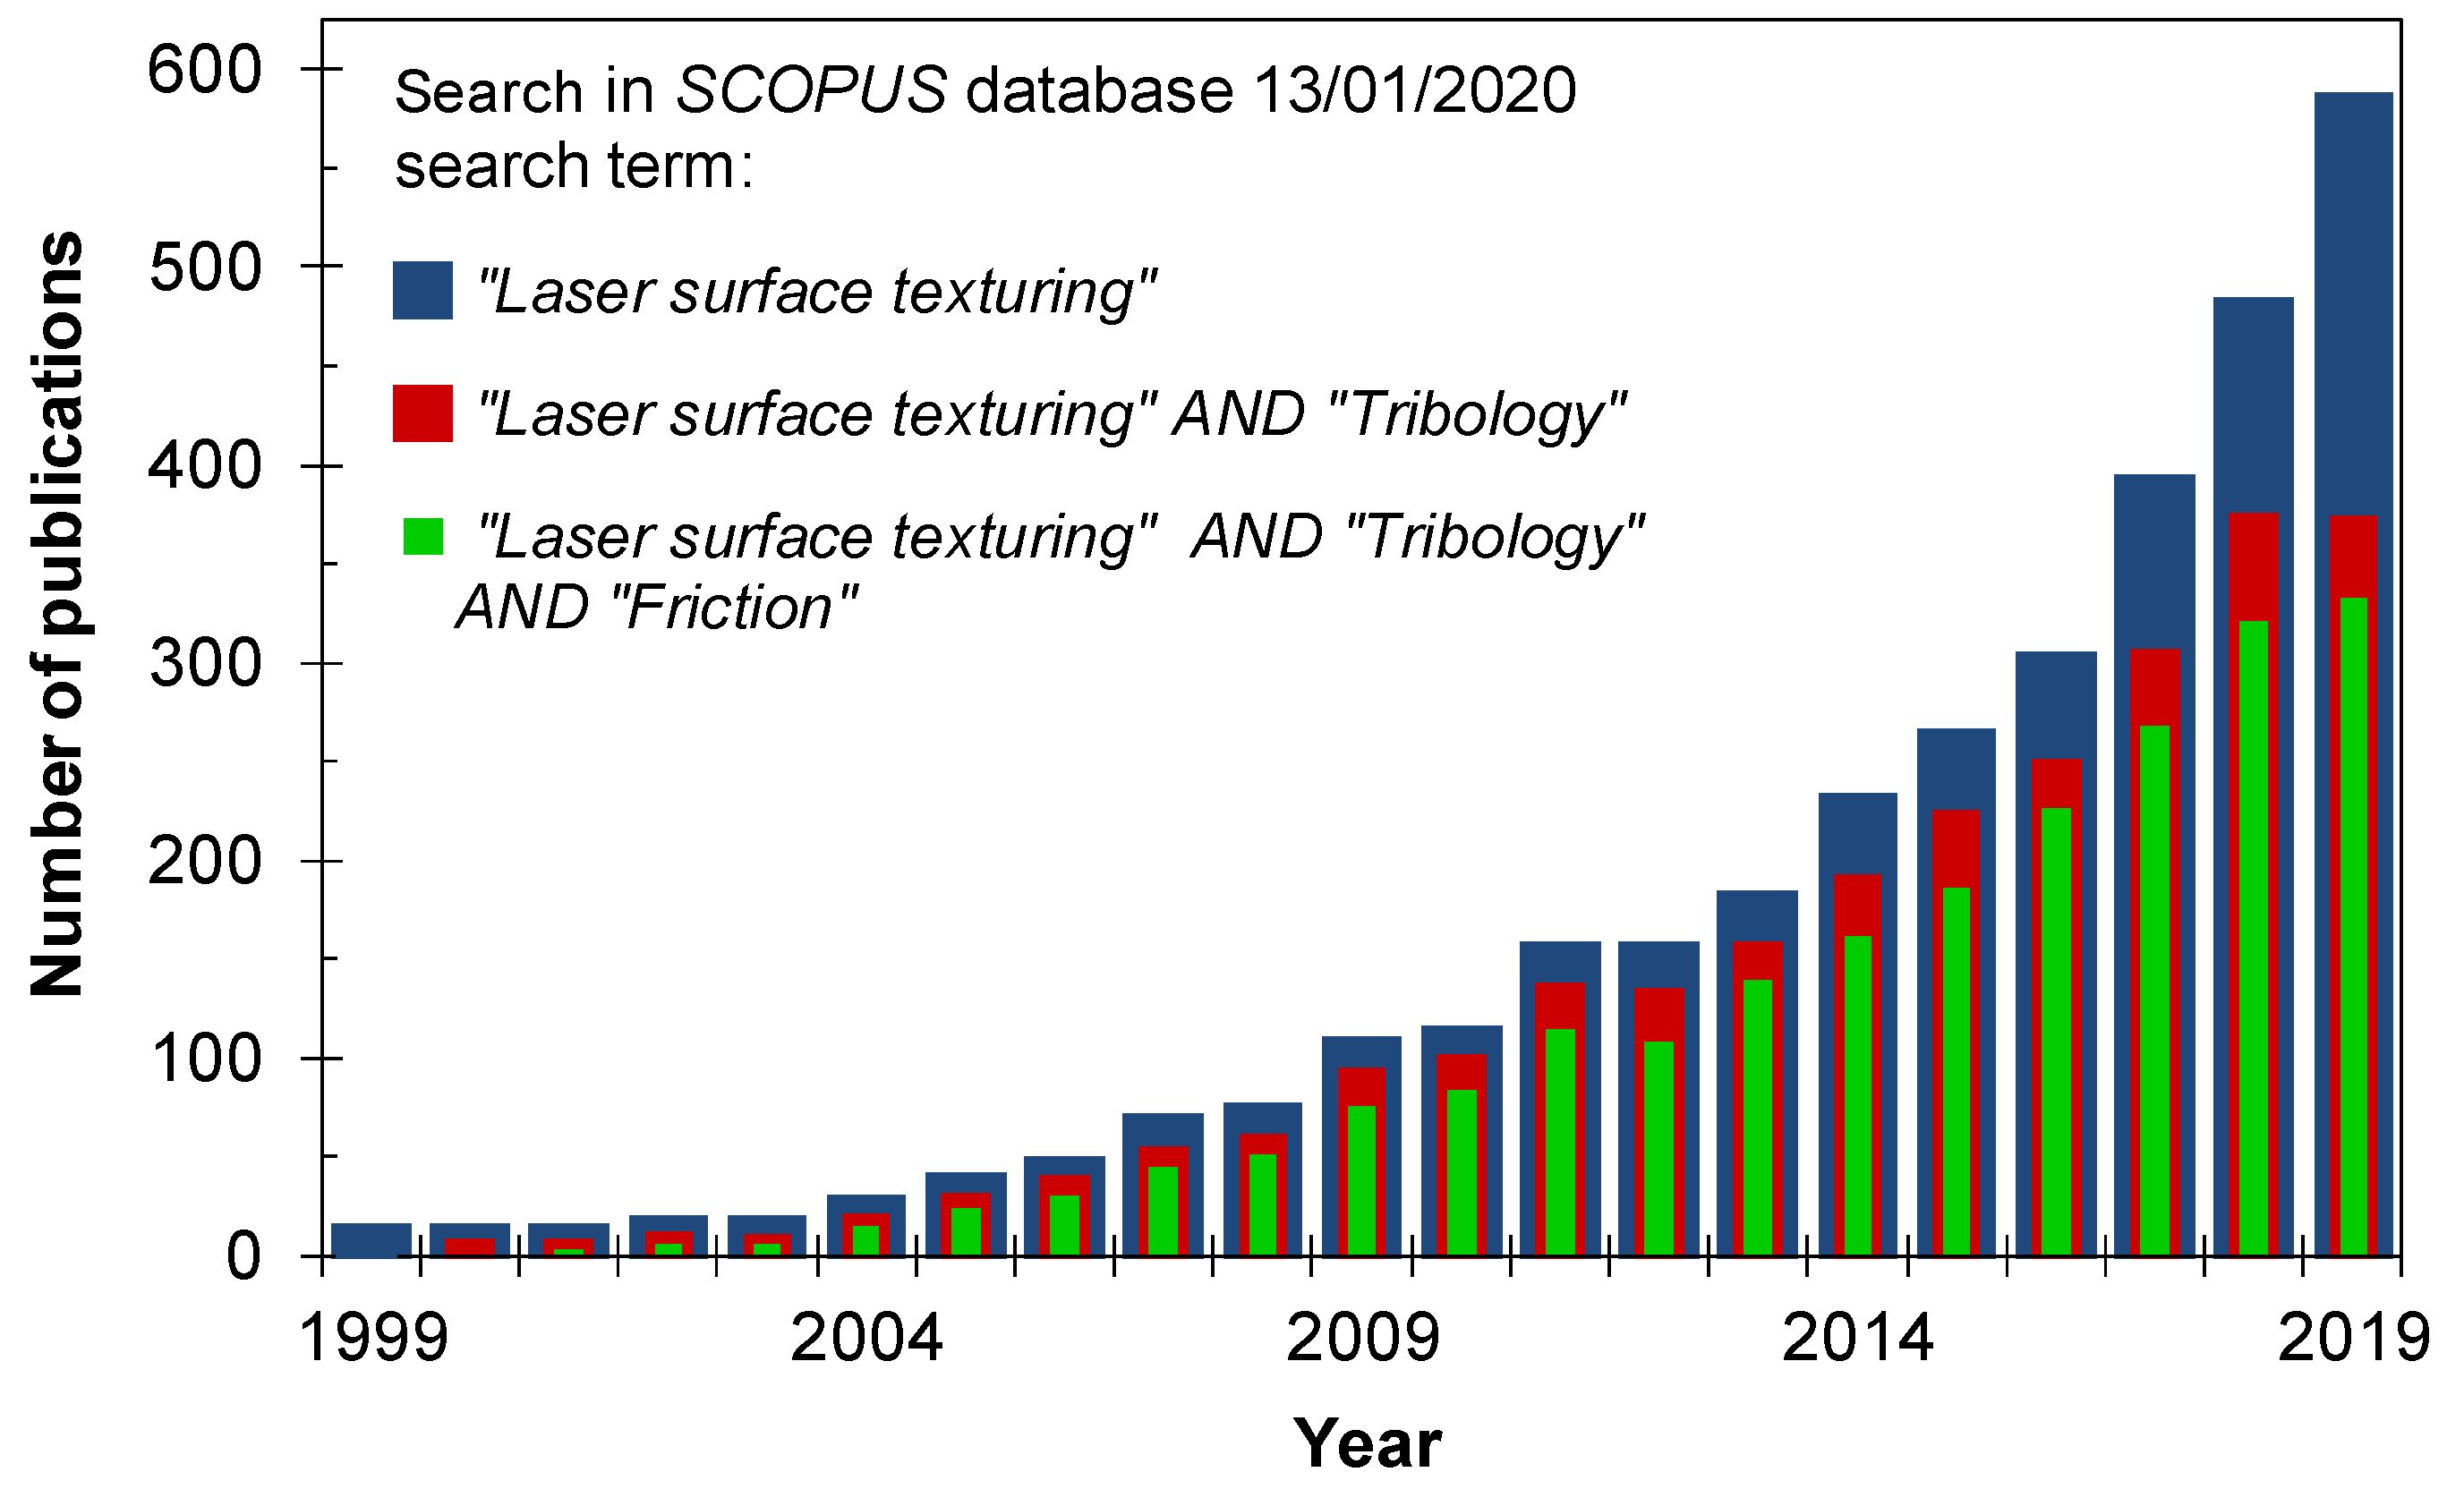
  1. Scopus Database Document Search. Available online: https://0-www-scopus-com.brum.beds.ac.uk/search/form.uri?display=basic (accessed on 13 January 2020).
  2. Yu, X.Q.; He, S.; Cai, R.L. Frictional characteristics of mechanical seals with a laser-textured seal face. J. Mater. Process. Technol. 2002, 129, 463–466. [Google Scholar] [CrossRef]
  3. Etsion, I.; Halperin, G.; Brizmer, V.; Kligerman, Y. Experimental investigation of laser surface textured parallel thrust bearings. Tribol. Lett. 2004, 17, 295–300. [Google Scholar] [CrossRef]
  4. Ryk, G.; Etsion, I. Testing piston rings with partial laser surface texturing for friction reduction. Wear 2006, 261, 792–796. [Google Scholar] [CrossRef]
  5. Mezzapesa, F.P.; Scaraggi, M.; Carbone, G.; Sorgente, D.; Ancona, A.; Lugarà, P.M. Varying the geometry of laser surface microtexturing to enhance the frictional behavior of lubricated steel surfaces. Phys. Procedia 2013, 41, 677–682. [Google Scholar] [CrossRef] [Green Version]
  6. Greiner, C.; Merz, T.; Braun, D.; Codrignani, A.; Magagnato, F. Optimum dimple diameter for friction reduction with laser surface texturing: The effect of velocity gradient. Surf. Topogr. Metrol. Prop. 2015, 3, 044001. [Google Scholar] [CrossRef]
  7. Ma, C.; Gu, W.; Tu, Q.; Sun, J.; Yu, B. Experimental investigation on frictional property of mechanical seals with varying dimple diameter along the radial face. Adv. Mech. Eng. 2016, 8, 1–9. [Google Scholar] [CrossRef] [Green Version]
  8. Houdková, Š.; Šperka, P.; Repka, M.; Martan, J.; Moskal, D. Shifted laser surface texturing for bearings applications. J. Phys. Conf. Ser. 2017, 843, 012076. [Google Scholar] [CrossRef] [Green Version]
  9. Bonse, J.; Koter, R.; Hartelt, M.; Spaltmann, D.; Pentzien, S.; Höhm, S.; Rosenfeld, A.; Krüger, J. Tribological performance of femtosecond laser-induced periodic surface structures on titanium and a high toughness. Appl. Surf. Sci. 2015, 336, 21–27. [Google Scholar] [CrossRef]
  10. Wang, Z.; Zhao, Q.; Wang, C. Reduction of Friction of Metals Using Laser-Induced Periodic Surface Nanostructures. Micromachines 2015, 6, 1606–1616. [Google Scholar] [CrossRef]
  11. Flores, G.; Wiens, A. Gelaserte Strukturen ersetzen bisherige kostenintensive Lösungen—Teil 1: Herstellung von Funktionsoberflächen mit hoher Haftreibung durch Laserstrukturieren (written in German). VDI Z 2016, 158, 62–64. [Google Scholar]
  12. Flores, G.; Wiens, A. Gelaserte Strukturen ersetzen bisherige kostenintensive Lösungen - Teil 2: Herstellung von Funktionsoberflächen mit hoher Haftreibung durch Laserstrukturieren (written in German). VDI Z 2016, 158, 38–40. [Google Scholar]
  13. Dunn, A.; Carstensen, J.V.; Wlodarczyk, K.L.; Hansen, E.B.; Gabzdyl, J.; Harrison, P.M.; Shephard, J.D.; Hand, D.P. Nanosecond laser texturing for high friction applications. Opt. Lasers Eng. 2014, 62, 9–16. [Google Scholar] [CrossRef] [Green Version]
  14. Schille, J.; Ullmann, F.; Schneider, L.; Gräfensteiner, M.; Schiefer, S.; Gerlach, M.; Leidich, E.; Exner, H. Experimental Study on Laser Surface Texturing for Friction Coefficient Enhancement. J. Laser Micro Nanoeng. 2015, 10, 245–253. [Google Scholar] [CrossRef] [Green Version]
  15. Dunn, A.; Wlodarczyk, K.L.; Carstensen, J.V.; Hansen, E.B.; Gabzdyl, J.; Harrison, P.M.; Shephard, J.D.; Hand, D.P. Laser surface texturing for high friction contacts. Appl. Surf. Sci. 2015, 357, 2313–2319. [Google Scholar] [CrossRef] [Green Version]
  16. Exner, H.; Hartwig, L.; Ebert, R.; Klötzer, S.; Streek, A.; Schille, J.; Löschner, U. High rate laser micro processing using high brilliant cw laser radiation. In Proceedings of the 11th International Symposium on Laser Precision Microfabrication 2010, Stuttgart, Germany, 7–10 June 2010. [Google Scholar]
  17. Löschner, U.; Schille, J.; Streek, A.; Knebel, T.; Hartwig, L.; Hillmann, R.; Endisch, C. High-rate laser microprocessing using a polygon scanner system. J. Laser Appl. 2015, 27, S28007-1. [Google Scholar]
  18. Schille, J.; Schneider, L.; Streek, A.; Klötzer, S.; Löschner, U. High-throughput machining using a high-average power ultrashort pulse laser and high-speed polygon scanner. Opt. Eng. 2016, 55, 096109-1. [Google Scholar] [CrossRef]
  19. Raciukaitis, G.; Brikas, M.; Gecys, P.; Voisiat, B.; Gedvilas, M. Use of high repetition rate and high power lasers in microfabrication: How to keep the efficiency high? J. Laser Micro Nanoeng. 2009, 4, 186–191. [Google Scholar] [CrossRef]
  20. Neuenschwander, B.; Jäggi, B.; Schmid, M.; Hennig, G. Surface structuring with ultra-short laser pulses: Basics, limitations and needs for high throughput. Phys. Procedia 2014, 56, 1047–1058. [Google Scholar] [CrossRef] [Green Version]
  21. Schille, J.; Schneider, L.; Löschner, U. Process optimization in high-average-power ultrashort pulse laser microfabrication: How laser process parameters influence efficiency, throughput and quality. Appl. Phys. A 2015, 120, 847–855. [Google Scholar] [CrossRef]
  22. Ancona, A.; Röser, F.; Rademaker, K.; Limpert, J.; Nolte, S.; Tünnermann, A. High speed laser drilling of metals using a high repetition rate, high average power ultrafast fiber CPA system. Opt. Express 2008, 16, 8958–8968. [Google Scholar] [CrossRef] [PubMed]
  23. Finger, J.; Reininghaus, M. Effect of pulse to pulse interactions on ultrashort pulse laser drilling of steel with repetition rates up to 10 MHz. Opt. Express 2014, 22, 18790–18799. [Google Scholar] [CrossRef]
  24. Jäggi, B.; Remund, S.; Streubel, R.; Gökce, B.; Barcikowski, S.; Neuenschwander, B. Laser Micromachining of Metals with Ultra-Short Pulses: Factors Limiting the Scale-Up Process. J. Laser Micro Nanoeng. 2017, 12, 267–273. [Google Scholar]
  25. Zeng, S.; Luo, Q.; Li, D.; Lue, X. Femtosecond pulse laser scanning using Acousto-Optic Deflector. Sci. China Series G Phys. Mech. Astron. 2009, 52, 685–692. [Google Scholar] [CrossRef]
  26. Brüning, S.; Hennig, G.; Eifel, S.; Gillner, A. Utrafast scan techniques for 3D-μm structuring of metal surfaces with high repetitive ps-laser pulses. Phys. Procedia 2011, 12, 105–115. [Google Scholar] [CrossRef]
  27. De Loor, R. Polygon scanner system for ultra short pulsed laser micro-machining applications. Phys. Procedia 2013, 41, 544–551. [Google Scholar] [CrossRef] [Green Version]
  28. Römer, G.R.B.E.; Bechtold, P. Electro-optic and Acousto-optic Laser Beam Scanners. Phys. Procedia 2014, 56, 29–39. [Google Scholar] [CrossRef] [Green Version]
  29. Streek, A.; Klötzer, S. Polygonscantechnik für die Lasermikrobearbeitung (written in German). Sci. Rep. J. Univ. Appl. Sci. Mittweida 2015, 4, 82–85. [Google Scholar]
  30. Bonse, J.; Krüger, J. Pulse number dependence of laser-induced periodic surface structures for femtosecond laser irradiation of silicon. J. Appl. Phys. 2010, 108, 034903. [Google Scholar] [CrossRef]
  31. Reif, J.; Varlamova, O.; Ratzke, M.; Schade, M.; Leipner, H.S.; Arguirov, T. Multipulse feedback in self-organized ripples formation upon femtosecond laser ablation from silicon. Appl. Phys. A 2010, 101, 361–365. [Google Scholar] [CrossRef]
  32. Rudenko, A.; Mauclair, C.; Garrelie, F.; Stoian, R.; Colombier, J.P. Self-organization of surfaces on the nanoscale by topography-mediated selection of quasi-cylindrical and plasmonic waves. Nanophotonics 2019, 8, 459–465. [Google Scholar] [CrossRef]
  33. Leidich, E.; Vidner, J.; Gräfensteiner, M. Endlich vergleichbare Werte - Standardisiertes Prüfverfahren für Reibungszahlen (written in German). Antriebstechnik 2012, 1, 32–35. [Google Scholar]
  34. Leidich, E.; Reiß, F.; Gräfensteiner, M. Untersuchungen zur Übertragbarkeit von modellbasierten Haftreibwerten und Reibcharakteristiken auf gefügte Realbauteilgeometrien (written in German). Abschlussbericht, FVV-Heft Nr. 1148, Forschungsvereinigung Verbrennungskraftmaschinen e.V., Frankfurt/Main, 2018.
  35. Boultcouncil—Research Council on Structural Connections. Specification for Structural Joints Using High-Strength Bolts. Chicago. Available online: www.boltcouncil.org (accessed on 11 November 2019).
  36. Leidich, E.; Gräfensteiner, M. Ermittlung charakterisierender Kennwerte für reibschlüssige Verbindungen (written in German). Forsch. Ing. 2016, 80, 71–84. [Google Scholar] [CrossRef]
  37. Leidich, E.; Gräfensteiner, M. GECKO - Analyse und Synthese charakterisierender Kennwerte zur funktionsgerechten Gestaltung von Wirkflächenpaaren in reibschlüssigen Verbindungen (written in German). Abschlussbericht/Teilbericht I, FVV-Heft Nr. 1077, Forschungsvereinigung Verbrennungskraftmaschinen e.V., Frankfurt/Main, 2015.
  38. Varlamova, O.; Costache, F.; Ratzke, M.; Reif, J. Control parameters in pattern formation upon femtosecond laser ablation. Appl. Surf. Sci. 2007, 253, 7932–7936. [Google Scholar] [CrossRef]
  39. Kurselis, K.; Kiyan, R.; Chichkov, B.N. Formation of corrugated and porous steel surfaces by femtosecond laser irradiation. Appl. Surf. Sci. 2012, 258, 8845–8852. [Google Scholar] [CrossRef]
  40. Ahmmed, T.K.M.; Grambow, C.; Kietzig, A.M. Fabrication of Micro/Nano Structures on Metals by Femtosecond Laser Micromachining. Micromachines 2014, 5, 1219–1253. [Google Scholar] [CrossRef]
  41. Ardron, M.; Weston, N.; Hand, D. A practical technique for the generation of highly uniform LIPSS. Appl. Surf. Sci. 2014, 313, 123–131. [Google Scholar] [CrossRef] [Green Version]
  42. Bonse, J.; Kirner, S.V.; Griepentrog, M.; Spaltmann, D.; Krüger, J. Femtosecond Laser Texturing of Surfaces for Tribological Applications. Materials 2018, 11, 801. [Google Scholar] [CrossRef] [Green Version]
  43. Fraggelakis, F.; Mincuzzi, G.; Lopez, J.; Manek-Hönninger, I.; Kling, R. Texturing metal surface with MHz ultra-short laser pulses. Opt. Express 2017, 25, 18131–18139. [Google Scholar] [CrossRef] [Green Version]
  44. Baron, C.F.; Mimidis, A.; Puerto, D.; Skoulas, E.; Stratakis, E.; Solis, J.; Siegel, J. Biomimetic surface structures in steel fabricated with femtosecond laser pulses: Influence of laser rescanning on morphology and wettability. Beilstein J. Nanotechnol. 2018, 9, 2802–2812. [Google Scholar] [CrossRef] [Green Version]
  45. Tsibidis, G.D.; Fotakis, C.; Stratakis, E. From ripples to spikes: A hydrodynamical mechanism to interpret femtosecond laser-induced self-assembled structures. Phys. Rev. B 2015, 92, 041405. [Google Scholar] [CrossRef] [Green Version]
  46. Hauffe, W. Vorrichtung zur Vorbereitung der Stoffproben für die Untersuchung, Gepr. Patent zum Ionenstrahl-Böschungsschnitt-Verfahren (written in German). Available online: https://depatisnet.dpma.de/DepatisNet/depatisnet?action=pdf&firstdoc=1&docid=DD000000139670A3 (accessed on 14 November 2019).
  47. Krawczyk-Bärsch, E.; Däbritz, S.; Hauffe, W. Combined use of ion beam slope cutting and scanning electron microscopy for the investigation of the 3-dimensional micro-structure of alterated mediaeval glass. Mikrochim. Acta 1997, 125, 89–91. [Google Scholar] [CrossRef]
  48. Schneider, L.; Schille, J.; Mauersberger, S.; Kujawa, K.; Löschner, U. Großflächige und schnelle Funktionalisierung von technischen Oberflächen mittels Ultrakurzpuls-Laserbearbeitung (written in German). Sci. Rep. 2017, 2, 37–42. [Google Scholar]
  49. Renusch, D.; Veal, B.; Natesan, K.; Grimsditch, M. Transient Oxidation in Fe-Cr-Ni Alloys: A Raman-Scattering Study. Oxid. Met. 1996, 46, 365–381. [Google Scholar] [CrossRef]
  50. Raman Spectra Search in RRUFF Sample Data Base. Available online: http://rruff.info/ (accessed on 24 February 2019).
  51. Eichstädt, J.; Römer, G.R.B.E.; Huis in’t Veld, A.J. Towards friction control using laser-induced periodic Surface Structures. Phys. Procedia 2011, 12, 7–15. [Google Scholar] [CrossRef] [Green Version]
  52. Romero, P.M.; Otero, N.; González, A.; Vázquez, P. High aspect ratio microfeatures with laser texturing in mixed ablative-melting regime. Proc. SPIE Int. Soc. Opt. Eng. 2012. [Google Scholar] [CrossRef]
  53. Gregorčič, P.; Šetina-Batič, B.; Hočevar, M. Controlling the stainless steel surface wettability by nanosecond direct laser texturing at high fluences. Appl. Phys. A 2017, 123, 1–8. [Google Scholar] [CrossRef] [Green Version]
  54. Conradi, M.; Drnovšek, A.; Gregorčič, P. Wettability and friction control of a stainless steel surface by combining nanosecond laser texturing and adsorption of superhydrophobic nanosilica particles. Sci. Rep. 2018, 8, 1–9. [Google Scholar] [CrossRef] [PubMed] [Green Version]
  55. Leidich, E.; Reiß, F. Transferability of Model-based Static Coefficients of Friction to Real Components. MTZ Worldw 2018, 79, 62–67. [Google Scholar] [CrossRef]
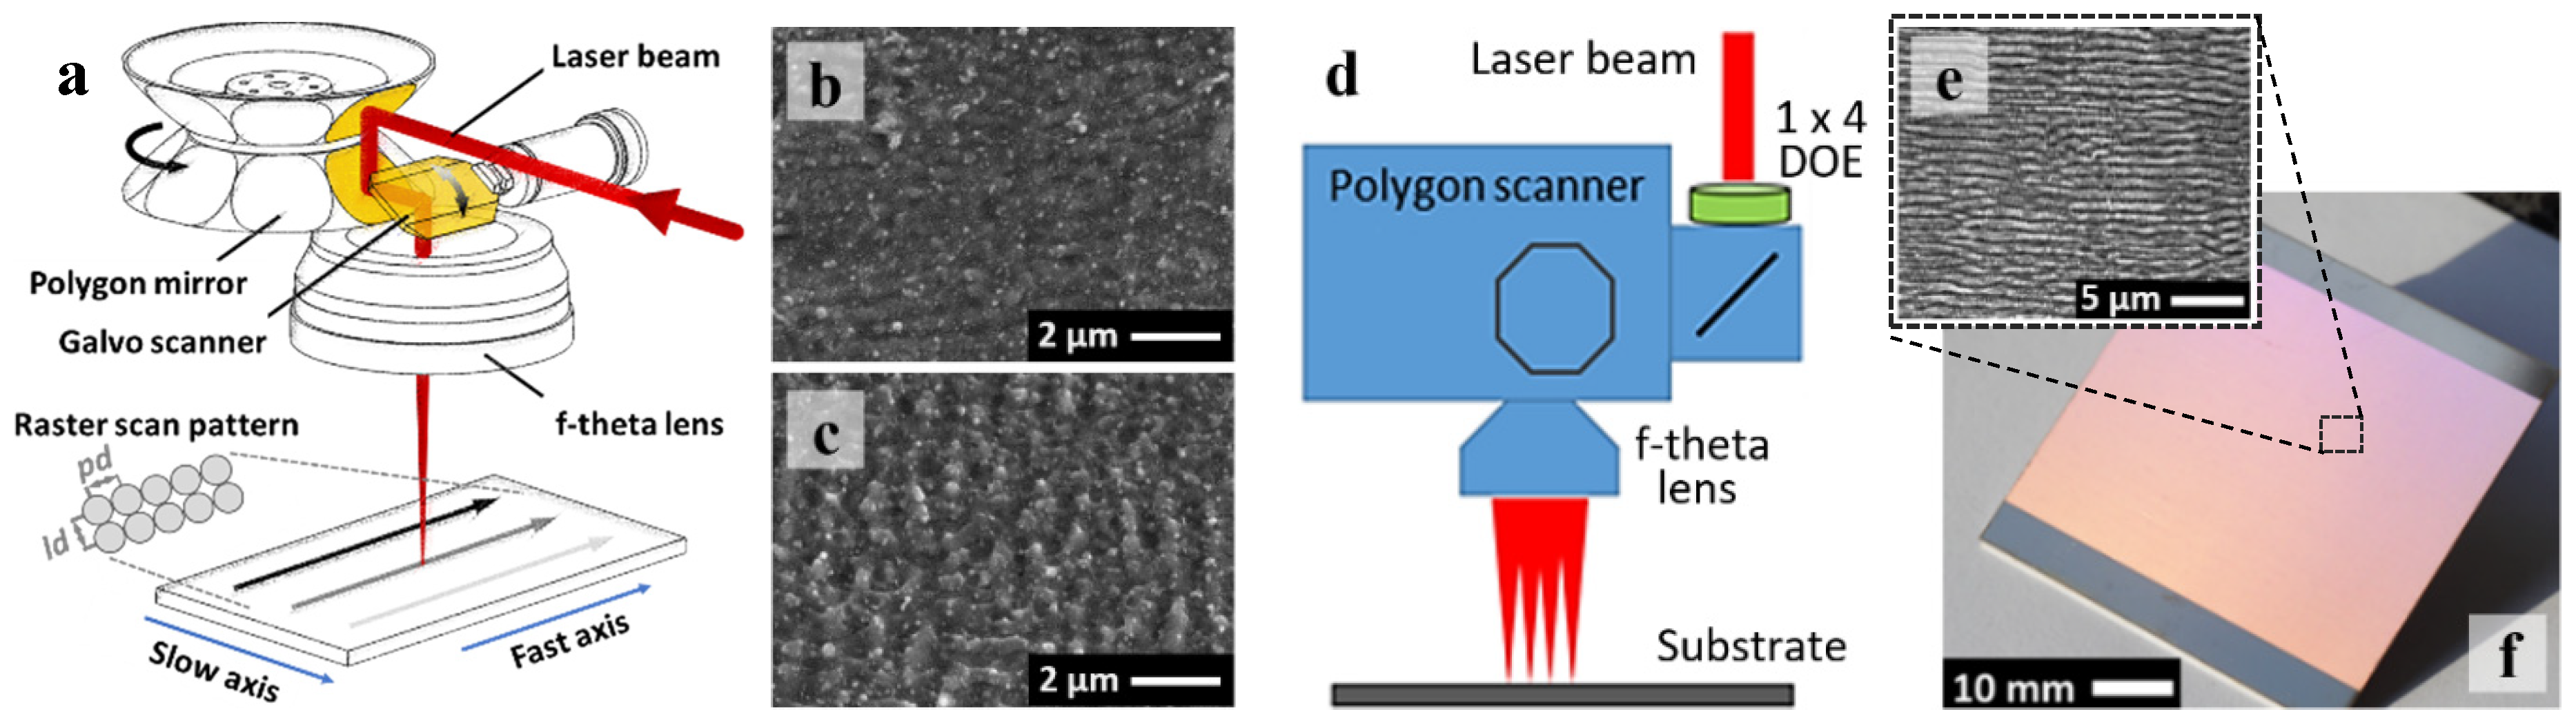
Figure 1. Overview of the number of peer-reviewed journal articles published per year in the SCOPUS abstract and citation database as received for the search term “Laser surface texturing” (blue bar), “Laser surface texturing AND Tribology” (red bar) and “Laser surface texturing AND Tribology AND Friction” (green bar) [1].
Lubricants 08 00033 g001
Figure 2. Laser made microscopic surface textures for mimicking natural functionalities on stainless steel: (a) rippled surface texture for optical effects; (b) multi-scale features imitating the hydrophobic and self-cleaning behavior of the lotus leaf and (c) riblets for skin friction drag reduction in turbulent flows inspired by shark’s skin micro structure.
Lubricants 08 00033 g002
Figure 3. Schematic view of the (a) polygon scanner architecture and (d) multi-beam high-speed scan technology, pd and ld represent the spatial pulse distance and line distance of a raster-scan pattern; nano-featured surface textures produced on stainless steel by applying a single pass raster-scan over the substrate at 950 m/s laser beam moving speed and (b) 20 µm or (c) 10 µm line distance; SEM micrograph (e) and optical microscope image (f) of a ripple textured stainless steel surface; the effective area processing rate for the given 40 × 50 mm² surface texture was 0.13 m²/min.
Lubricants 08 00033 g003
Figure 4. Test bench assembly and standard procedure developed at IKAT (Chemnitz University of Technology) to analyze the performance of frictional contacts [33,34].
Lubricants 08 00033 g004
Figure 5. Exemplary illustration of the evaluation methods applied to determine the static COF. In the example (top, left), the stiffness lines are indicated by dashed lines to determine the respective COF´s μ2, μ20 etc. Three types of friction can be distinguished depending on the torque progression curve schematically shown bottom, left. A detailed description of the different friction types is provided in the table on the right.
Lubricants 08 00033 g005
Figure 6. SEM micrographs showing ripple (a) and cone-like protrusion (CLP) (c) surface textures produced on stainless steel; the direct-write scanning procedure for the radial matrices as used for tightly mapping a variable set of pulse overlaps (b); magnified view on low spatial frequency LIPSS (LSFL) (d), micro grooves and spikes (e) as well as CLPs (f) originating at low and high peak fluence pulses of 0.7 J/cm² and 3.7 J/cm².
Lubricants 08 00033 g006
Figure 7. SEM micrographs recorded with the SE (a,f) and BSE detector (b,g); detailed micrographs (c,d,h,i) and electron back scatter diffraction (EBSD) mappings (e,j) to illustrate the depth of the laser affected zone.
Lubricants 08 00033 g007
Figure 8. Raman analysis carried out on untreated stainless steel surface for reference purposes (a) as well as laser made ripple (b) and CLP (c,d) surface textures. The corresponding Raman signals detected following 473 nm laser excitation are presented on the right side of the figure (eh).
Lubricants 08 00033 g008
Figure 9. SEM micrographs showing the CLP texture (a) before and (b) after friction testing and (c) the fine grinded counter body surface after the friction test; the recorded slipping curves (d) and a summary of the tribological characteristic of CLPs (table bottom, right) are presented.
Lubricants 08 00033 g009
Figure 10. SEM micrographs showing the LSFL ripple texture (a) before and (b) after friction testing and (c) the rippled counter body surface after the friction test; the recorded slipping curves (d) and a summary of the tribological characteristic of LSFLs (table bottom, right) are presented.
Lubricants 08 00033 g010
Figure 11. Deterministic surface textures made by ultrashort pulse laser processing under varied laser beam scanning procedures: (a) line pattern, (b) cross pattern and (c) alternating line and crosswise scanned laser beam.
Lubricants 08 00033 g011
Figure 12. SEM micrographs showing the line pattern (a) before and (b) after friction testing and (c) the counter body surface after the friction test; the recorded slipping curves (d) and a summary of the tribological characteristic of the line pattern texture (table bottom, right) are presented.
Lubricants 08 00033 g012aLubricants 08 00033 g012b
Figure 13. SEM micrographs showing the cross pattern made with 2 scan passes (a) before and (b) after friction testing and (c) the counter body surface after the friction test; the recorded slipping curves (d) and a summary of the tribological characteristic of the cross pattern texture are presented (table bottom, right).
Lubricants 08 00033 g013aLubricants 08 00033 g013b
Figure 14. SEM micrographs showing the cross pattern made with 10 scan passes (a) before and (b) after friction testing and (c) the counter body surface after the friction test; the recorded slipping curves (d) and a summary of the tribological characteristic of the cross pattern texture are presented (table bottom, right).
Lubricants 08 00033 g014
Figure 15. left: Topographical analysis of the shaft, the laser textured area is on the left shaft end; right: slipping curves captured in the frictional tests using a test rig for joined real components.
Lubricants 08 00033 g015
Table 1. Maximum and effective area processing rates APR estimated for different processing conditions and by considering a single pass raster-scan procedure applied on the substrate surface at maximal accessible scan length.
TexturePav
W
PRF
MHz
H0
J/cm2
vS
m/s
pd
µm
ld
µm
APRmax
m2/min
APReff
m²/min
Figure 3b263251.4595038201.140.56
Figure 3c263251.4595038100.570.28
Figure 3f41640 10.5056014283.761.51 1/0.50 2/0.13 3
APReff for 1) 40% facet utilization rate, 2) 3 scan passes and 3) 40 mm field length.
Table 2. Summary of the tribological characteristics of the different laser textures tested in a shaft-hub connection.
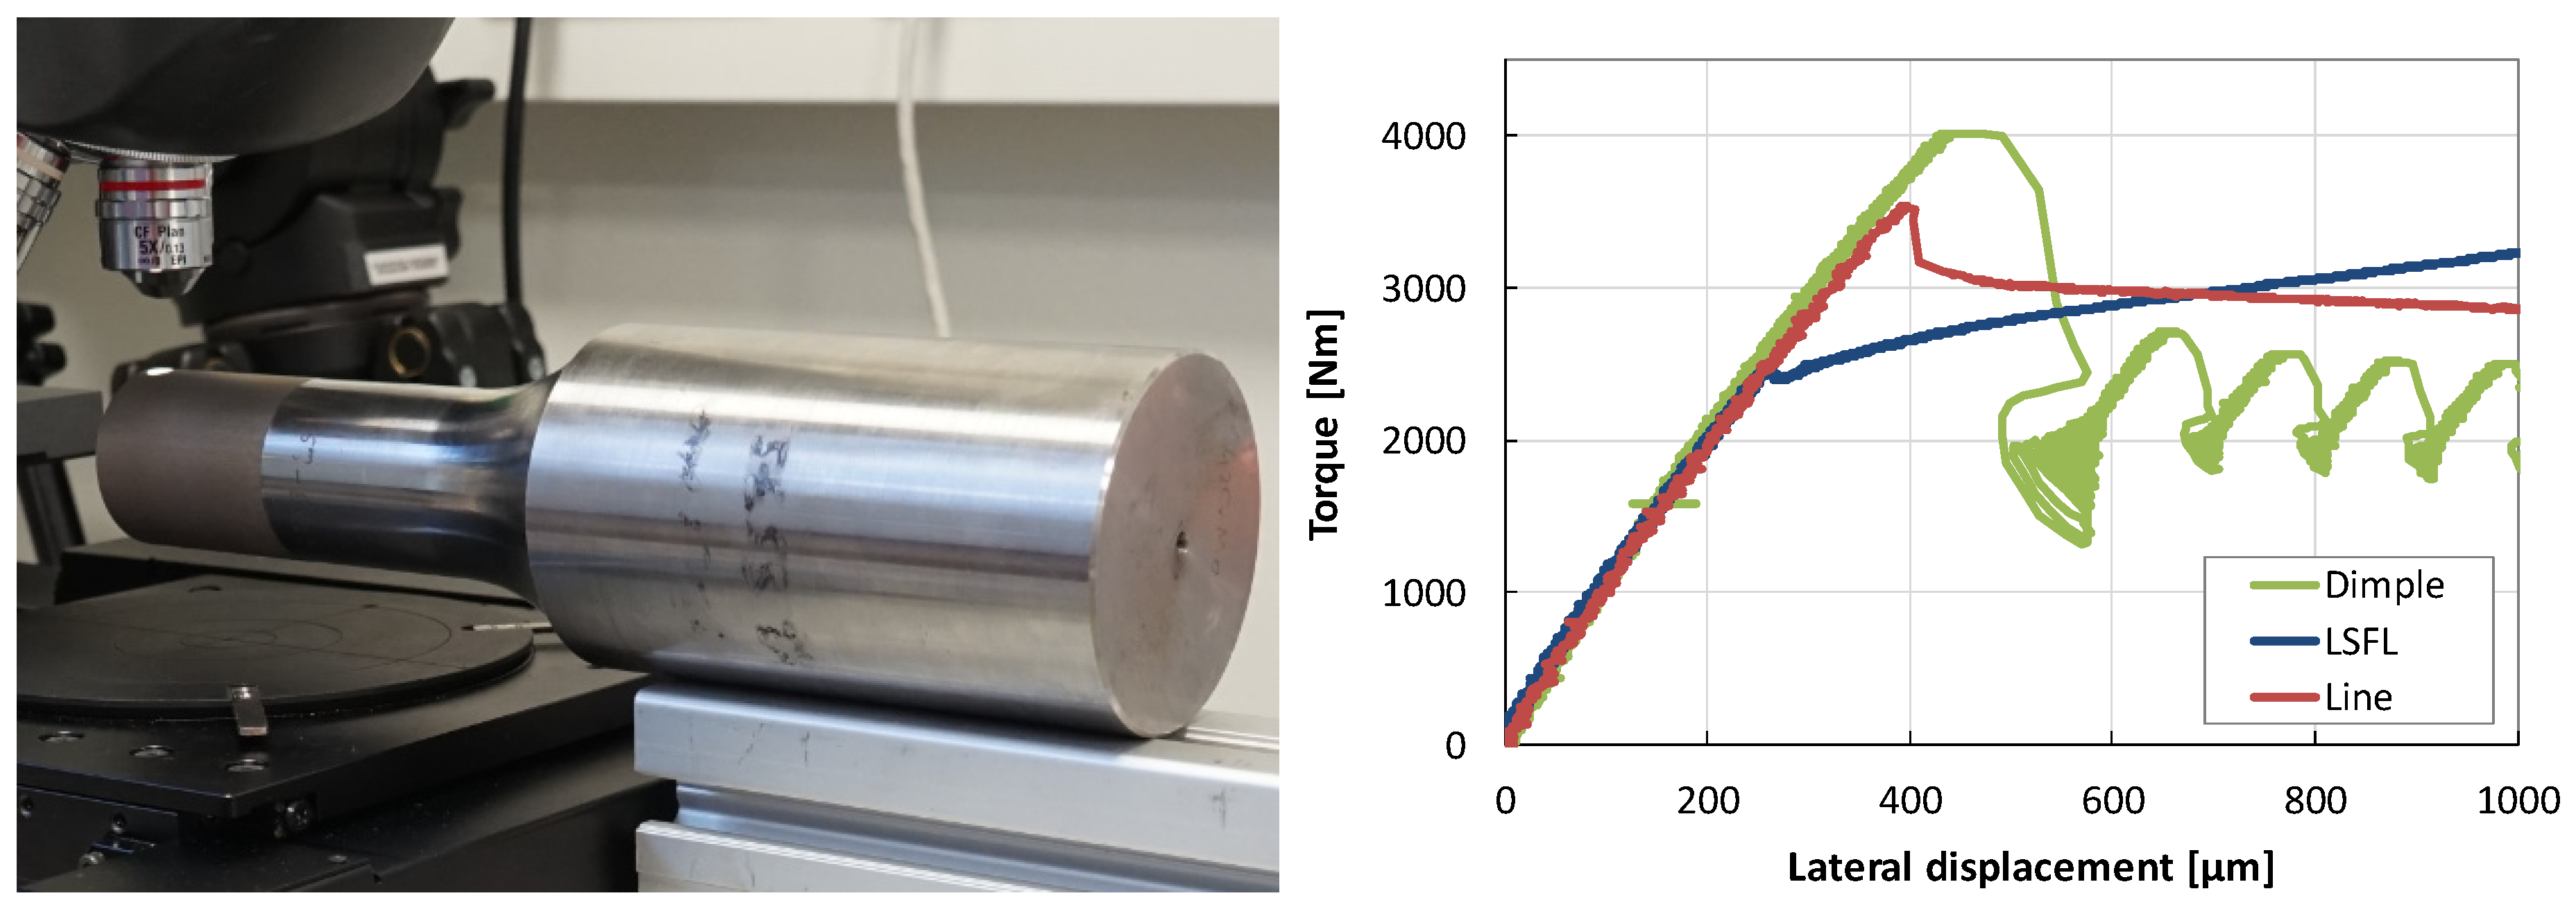
Tribological characteristic of laser textured shaft-hub connections.
Laser textureLSFLLine patternDimple-shaped texture
Surface pressure85 ± 2 MPa92 ± 9 MPa84 ± 2 MPa
COF typeBAA
µ200.24 ± 0.010.34 ± 0.020.32 ± 0.01
Δ µ20+ 20%+ 70%+ 60%
µmax0.24 ± 0.010.35 ± 0.010.40 ± 0.02
Δ µmax+ 20%+ 75%+ 100%
Processing
rate
14.4 cm2/min21.0 cm2/min14.0 cm2/min
Topography measurement
(before testing)
Lubricants 08 00033 i001 Lubricants 08 00033 i002 Lubricants 08 00033 i003

