Phylogenetic Community Structure and Niche Differentiation in Termites of the Tropical Dry Forests of Colombia


1
Departamento de Química y Biología, Universidad del Norte, Kilómetro 5 Antigua vía Puerto Colombia, 081007-Puerto Colombia, Colombia
2
Evolutionary Biology & Ecology, University of Freiburg, Hauptstrasse 1, 79104-Freiburg, Germany
*
Author to whom correspondence should be addressed.
Insects 2019, 10(4), 103; https://0-doi-org.brum.beds.ac.uk/10.3390/insects10040103
Submission received: 15 December 2018
/
Revised: 3 April 2019
/
Accepted: 8 April 2019
/
Published: 10 April 2019
(This article belongs to the Special Issue Ecology of Termites)
Abstract
:The mechanisms that structure species communities are still debated. We addressed this question for termite assemblages from tropical dry forests in Colombia. These forests are endangered and poorly understood ecosystems and termites are important ecosystem engineers in the tropics. Using biodiversity and environmental data, combined with phylogenetic community analyses, trait mapping, and stable isotopes studies, we investigated the termite community composition of three protected dry forests in Colombia. Our data suggest that the structuring mechanisms differed between sites. Phylogenetic overdispersion of termite assemblages correlated with decreasing rainfall and elevation and increasing temperature. Food niche traits—classified as feeding groups and quantified by δ15N‰ and δ13C‰ isotope signatures—were phylogenetically conserved. Hence, the overdispersion pattern implies increasing interspecific competition with decreasing drier and warmer conditions, which is also supported by fewer species occurring at the driest site. Our results are in line with a hypothesis that decreased biomass production limits resource availability for termites, which leads to competition. Along with this comes a diet shift: termites from drier plots had higher δ13C signatures, reflecting higher δ13C values in the litter and more C4 plants. Our study shows how a phylogenetic community approach combined with trait analyses can contribute to gaining the first insights into mechanisms structuring whole termite assemblages.
1. Introduction
The drivers that structure communities are still debated [1,2,3,4]. Neutral and/or deterministic mechanisms have been proposed to explain community assembly [5,6]. Neutral models highlight that mainly stochastic processes drive local communities. Species are regarded as ecologically equivalent. At larger scales, meta-communities are influenced by dispersal, speciation, and extinction [7]. On the other side, deterministic models describe local communities as an “arranged” assembly of species, based on their physiology and their defined niches [8,9]. These are two extreme views of processes affecting community composition. Real communities will often fall along a continuum containing components of randomness, as well as determinism. Whether processes differ systematically between taxa, habitats, geographic regions, or biomes is still unclear. A major unsolved question that remains is whether tropical ecosystems differ systematically from, for example, temperate regions, and whether such differences in the structuring mechanisms can contribute to explaining their high species richness. However, such species-rich ecosystems are notoriously difficult to study due to their high number of undescribed species. Two approaches can contribute to overcoming this hurdle. First, molecular barcoding uses short genetic markers in an organism’s DNA to identify it as belonging to a particular species [10]. Hence, species can be identified more easily. Second, phylogenetic community analyses deduce potential mechanisms from the co-occurrences of species and their phylogenetic relatedness. They combine phylogenetic data with distributional and ecological data to assess whether and how communities of species differ from random assemblages with regard to evolutionary relatedness [1,2,3,4,5,6]. For instance, if species which locally co-exist are less closely related on the phylogeny than a random selection of species that could potentially co-occur (i.e., species from the regional species pool), this can indicate that interspecific competition can play an important role in structuring communities, given closely related species share the same niche traits [5,11]. As genetic sequence information and phylogenies are becoming increasingly available for many taxa, the use of phylogenetic community analyses can be a helpful and easy tool to gain first insights into potential assembly mechanisms. They also allow standardized comparisons between sites within a habitat, and between habitats, regions, or disturbed and natural areas, to inform about changes and similarities in community structuring mechanisms (for termites: [12,13]). Thus, both genetic barcoding and phylogenetic community analyses can help to gain first insights into community structuring mechanisms.
Tropical dry forests are the most threatened of all major tropical forest types [14,15]. Colombia has one of the best-conserved areas, mainly along the Caribbean coast [16]. These poorly studied ecosystems are threatened by land use, climate change [14], and urban expansion [15]. Termites (Termitoidea) are important ecosystem engineers of such tropical ecosystems [17,18]. They are important food sources for a wide range of species [19,20,21,22,23]. As the main macro-detritivores, they essentially contribute to the biotransformation of wood and litter into organic matter and the re-distribution of structural soil components [24]. Tropical forests produce plenty of dead plant material, which termites consume [25,26]. Four functional feeding groups are distinguished in termites [27,28]: dead wood-feeders (group I); dead wood, leaf, plant-litter feeders (group II); humus feeders (group III); and true soil feeders (group IV). No fungus-growing termites occur in the Neotropics, hence the differentiation of the feeding group IIF (i.e., fungus-feeder) is irrelevant [29]. Most termites of dry forests feed on twigs and litter and belong to feeding group I and II, while soil-feeders (sensu Anoplotermes-group) are relatively scarce in richness and abundance [26]. Nitrogen and carbon stable isotope ratios have been used in termites to elucidate feeding habits in more detail, including dietary preferences [30,31] and niche food differentiation [32,33,34,35]. However, most studies on stable isotopes have been conducted in savannas [31,33,35] and rainforests [32,36,37]. Information related to the trophic ecology of termites in Neotropical dry forests is unknown. We used isotope analyses to characterize the feeding niche of termites and combined this approach with phylogenetic community analyses to gain first insights into the mechanisms that may structure termite assemblages in dry tropical forests.
2. Materials and Methods
2.1. Study Sites and Termite Sampling
Termites were studied in the Coraza Forestry Reserve ‘Colosó’ (hereafter, Colosó; Sucre; 9°31′51.3–9°32′24 N; 75°21′0–75°21′3.6 W ), the regional park ‘El Ceibal Mono Tití’ (hereafter, Ceibal; Santa Catalina, Bolívar; 10°37′40.8–10°38′13.2 N; 75°14′6–75°15′10.8 W), and the National Park ‘Tayrona’ (hereafter, Tayrona; Santa Marta, Magdalena; 11°19′19.2–11°18′43.2 N; 74°6′10.8–74°7′22.8 W) in Colombia (Figure 1). All these protected areas (hereafter ‘sites’) have important primary and secondary tropical dry forest [16,38,39,40,41,42].
In a former study, we characterized the termite communities of these three sites by determining species diversity and abundances and associating them with environmental variables [26]. We studied fives transect belts per site (hereafter called study plots) using the standardized belt transect sampling protocols of Jones and Eggleton [43] and Hausberger and Korb [44] developed for termites. We surveyed each site by sampling a transect measuring 2 m × 100 m, divided into twenty 2 m × 5 m sections. Each section was searched for termites on the ground, and in trees, mounds, and soil, (eight soil pits 15 cm ×15 cm ×15 cm depth) for 30 min by two trained persons. All study plots were randomly chosen and they were separated from each other by, on average, around 560 m (min: 225, max: 1043, SD +/− 253 m) in Colosó, 1074 m (min: 366, max: 1982, SD +/− 557 m) in Ceibal, and 1606 m (min: 508, max: 3157, SD +/− 985 m) in Tayrona. We also took soil and litter samples and retrieved climate data from WorldClim v 1.4 (http://www.worldclim.org/). The data layers were generated through the interpolation of average monthly climate data from weather stations on a 30 arc-second resolution grid (often referred to as a “1 km2” resolution). Variables included were monthly total precipitation and monthly mean temperature (for more details see http://www.worldclim.org). A combination of morphological and genetic analyses (molecular barcoding) revealed a total of 32 species for all three sites (Table A1).
2.2. Determination of Food Niche
To determine the feeding type and characterize the food niche using δ13C and δ15N isotope analyses, we used specimens and material from a former study [26]. δ13C and δ15N isotope analyses were done for termite workers, but also for soil and leaf litter (leaf and small pieces of wood), which is potential food for the termites. For each termite species, a whole termite was used. As in several other studies [30,31,34,45,46], we could not exclude the gut as this would have left too small amounts to conduct the analyses. Prior to analyses, termite samples were stored in ethanol (>99.5% Merck, Darmstadt, Germany). Three replicates (if available) per site were analyzed. Only workers were taken into account to eliminate the effect of inter-caste differences in isotopic values, which could bias cross-species comparisons [35,36]. In addition, workers are the caste that does the foraging and feeding within colonies. Five replicates of soil samples were collected from the top horizon (0–15 cm) at each site—one at each study plot—resulting in 15 samples in total for all study sites. Soil samples were cooled and directly dried after each field trip, and then sealed in plastic bags. Additionally, litter samples were collected on the ground; three samples were taken per study plot, including one at the start, in the middle, and at the end of each study plot, resulting in 15 replicates per site (45 in total). They included leaves, twigs, and dead wood. Like the soil samples, they were dried and kept cool, prior to analysis.
Soil samples were collected in each plot following the protocol by Pansu and Gautheyrou [47] and Osorio [48]. At a depth of 15 cm and a distance of 1 m parallel to each belt transect, three replicate soil samples were taken along the transect belt (one at the start, in the middle, and at the end of a belt transect), resulting in a total of 45 samples (3 sites × 5 belt transect × 3 replicates). Samples were prepared according to a protocol of the Centre for Stable Isotope Research and Analysis (KOSI) at the University of Göttingen (Germany). In short, all samples were dried at 60 °C for 24 h. Stones and gravel were removed before crushing samples and grounding them into fine powder. For soil and litter between 0.4 mg and 1.0 mg, one whole termite worker with gut was weighted, transferred into tin zinc capsules (HekaTech GmbH®, Wegberg, Germany), and sent to KOSI.
Carbon and nitrogen stable isotope ratios were measured on an elemental analyzer (NA 1500, Fisons-Instruments, Rodano, Milan, Italy) and an isotope ratio mass spectrometer (Delta V Plus, Thermo Fisher Scientific, Bremen, Germany). Stable isotope ratios were expressed using the delta (δ) notation in ‰ according to:
where R sample is the isotopic ratio of the sample (13C/12C or 15N/14N), R standard is the isotopic ratio of the international standard, and X is the respective element (13C or 15N). For 13C V-PDB and 15N, atmospheric nitrogen was used as the standard. Acetanilide (C8H9NO, Merck, Darmstadt, Germany) was used for internal calibration. For the amount of animal tissue analyzed per sample, precision of the measurement was about 0.1‰ for 13C and 0.2‰ for 15N. We calculated the mean and the standard deviation (SD) of all samples for each site.
2.3. Phylogenetic Community Analyses
The species pool of the three study sites comprises 32 species that have been morphologically and genetically identified (Table A1: GenBank accession numbers MH09082–MH090914 and KU510330, KX267100, KX267099, KX267098, KX267095, KX267092) [26]. As the input tree for the phylogenetic community structure analyses, we used the combined COII, 12S, and 16S nucleotide sequences and performed a Bayesian approach using MrBayes 3.2.1. [49]. We pruned the tree prior to analysis to include only species of the regional species pool and only one representative per species in the tree (Figure A1, Table A2).
A commonly used index to quantify the phylogenetic structure of a local community is the Net Relatedness Index (NRI) [5]. It measures whether locally co-occurring species are phylogenetically more/less closely related than expected by chance. It uses phylogenetic branch length to measure the distance between each sample to every other terminal sample in the phylogenetic tree, hence the degree of overall clustering. It is calculated as the difference between the mean phylogenetic distance (MPD) of the tested local community (i.e., each study plots) and the MPD of the regional community (i.e., all 32 species identified for dry forests in this region), divided by the standard deviation of the latter. NRI values close to zero indicate random community assembly, which may imply that neutral processes are important in structuring communities. Large positive values reflect phylogenetic clustering of co-occurring species (i.e., co-occurring species are more related than expected by chance), whereas low negative values point to over-dispersion (i.e., co-occurring species are less related than expected by chance) [1].
Depending on whether niche-relevant traits, such as the feeding niche, are evolutionary labile or conserved, the NRI values can hind at different assembly processes [3]: For instance, conserved traits and over-dispersion can indicate that interspecific competition plays an important role in structuring communities. We analyzed the phylogenetic community structure with PHYLOCOM 4.2 [5]. As the input tree, we used the Bayesian inference tree in combination with abundance data for all species. We conducted two analyses, including one testing the local assemblages against the regional species pool (all species found during this study) and one site specific analysis in which we tested the local assemblages against the species occurring at a specific study site. We tested whether our data significantly deviated from null models using the independent swap algorithm on occurrence data [50]. This algorithm creates swapped versions of the sample/species matrix while constraining row (species) and column (occurrence) totals to match the original matrix. We used two-tailed significant rank tests as suggested by Webb et al. [5] to determine if observed values differed significantly from the null model (e.g., with 9999 randomizations, rank values equal or higher than 9750 or equal or lower than 250 are statistically significant at p = 0.05).
2.4. Mapping Food Niche Traits on Phylogeny
In order to interpret the results of the phylogenetic community analysis, it is necessary to know whether the studied food niche traits were phylogenetically conserved or labile. To determine this, we conducted two analyses, including one with feeding groups and one for isotope signatures. We used (i) the feeding groups and (ii) the mean of the δ13C and δ15N values calculated over all collection sites for each species as character states and the phylogenetic tree from Casalla & Korb [26] (which was inferred from molecular sequence data) as the input, and performed ancestral state reconstruction (ASR). For inferring ancestral states, we used Mesquite version 3.04 [51,52], in particular, the module ‘Parsimonious Ancestral States: ‘Parsimony unordered’ for the categorical feeding group data and ‘Parsimony Squared’ for quantitative isotope data.
3. Results
3.1. Phylogenetic Community Structure
Overall, the NRI values which measured the phylogenetic structure of the termite assemblages across the regionals species pool ranged from −0.82 to 2.45 (Table A3a). NRI values did not differ significantly from random expectation, except for one site in Colosó (Colosó 5), which showed significant signs of phylogenetic clustering (Table A3a). Both sites, Colosó and Ceibal, had significantly higher NRI values than Tayrona, where species were more phylogenetically overdispersed (Figure 2, Table A3a). At the study plot level, NRI values did not correlate with species richness (Pearson correlation r = 0.339, p = 0.217). However, NRI values significantly increased with rainfall at a study plot (r = 0.862, p < 0.001; Figure 3a) and its elevation (r = 0.626, p = 0.012; Figure 3b). Contrarily, NRI decreased with temperature (r = −0.648, p = 0.009; Figure 3c).
When analyzing the NRI values generated by using the site-specific termite pool, we did not detect significant effects of the abiotic variables (Table A3b).
3.2. Isotopes Stable Analyses
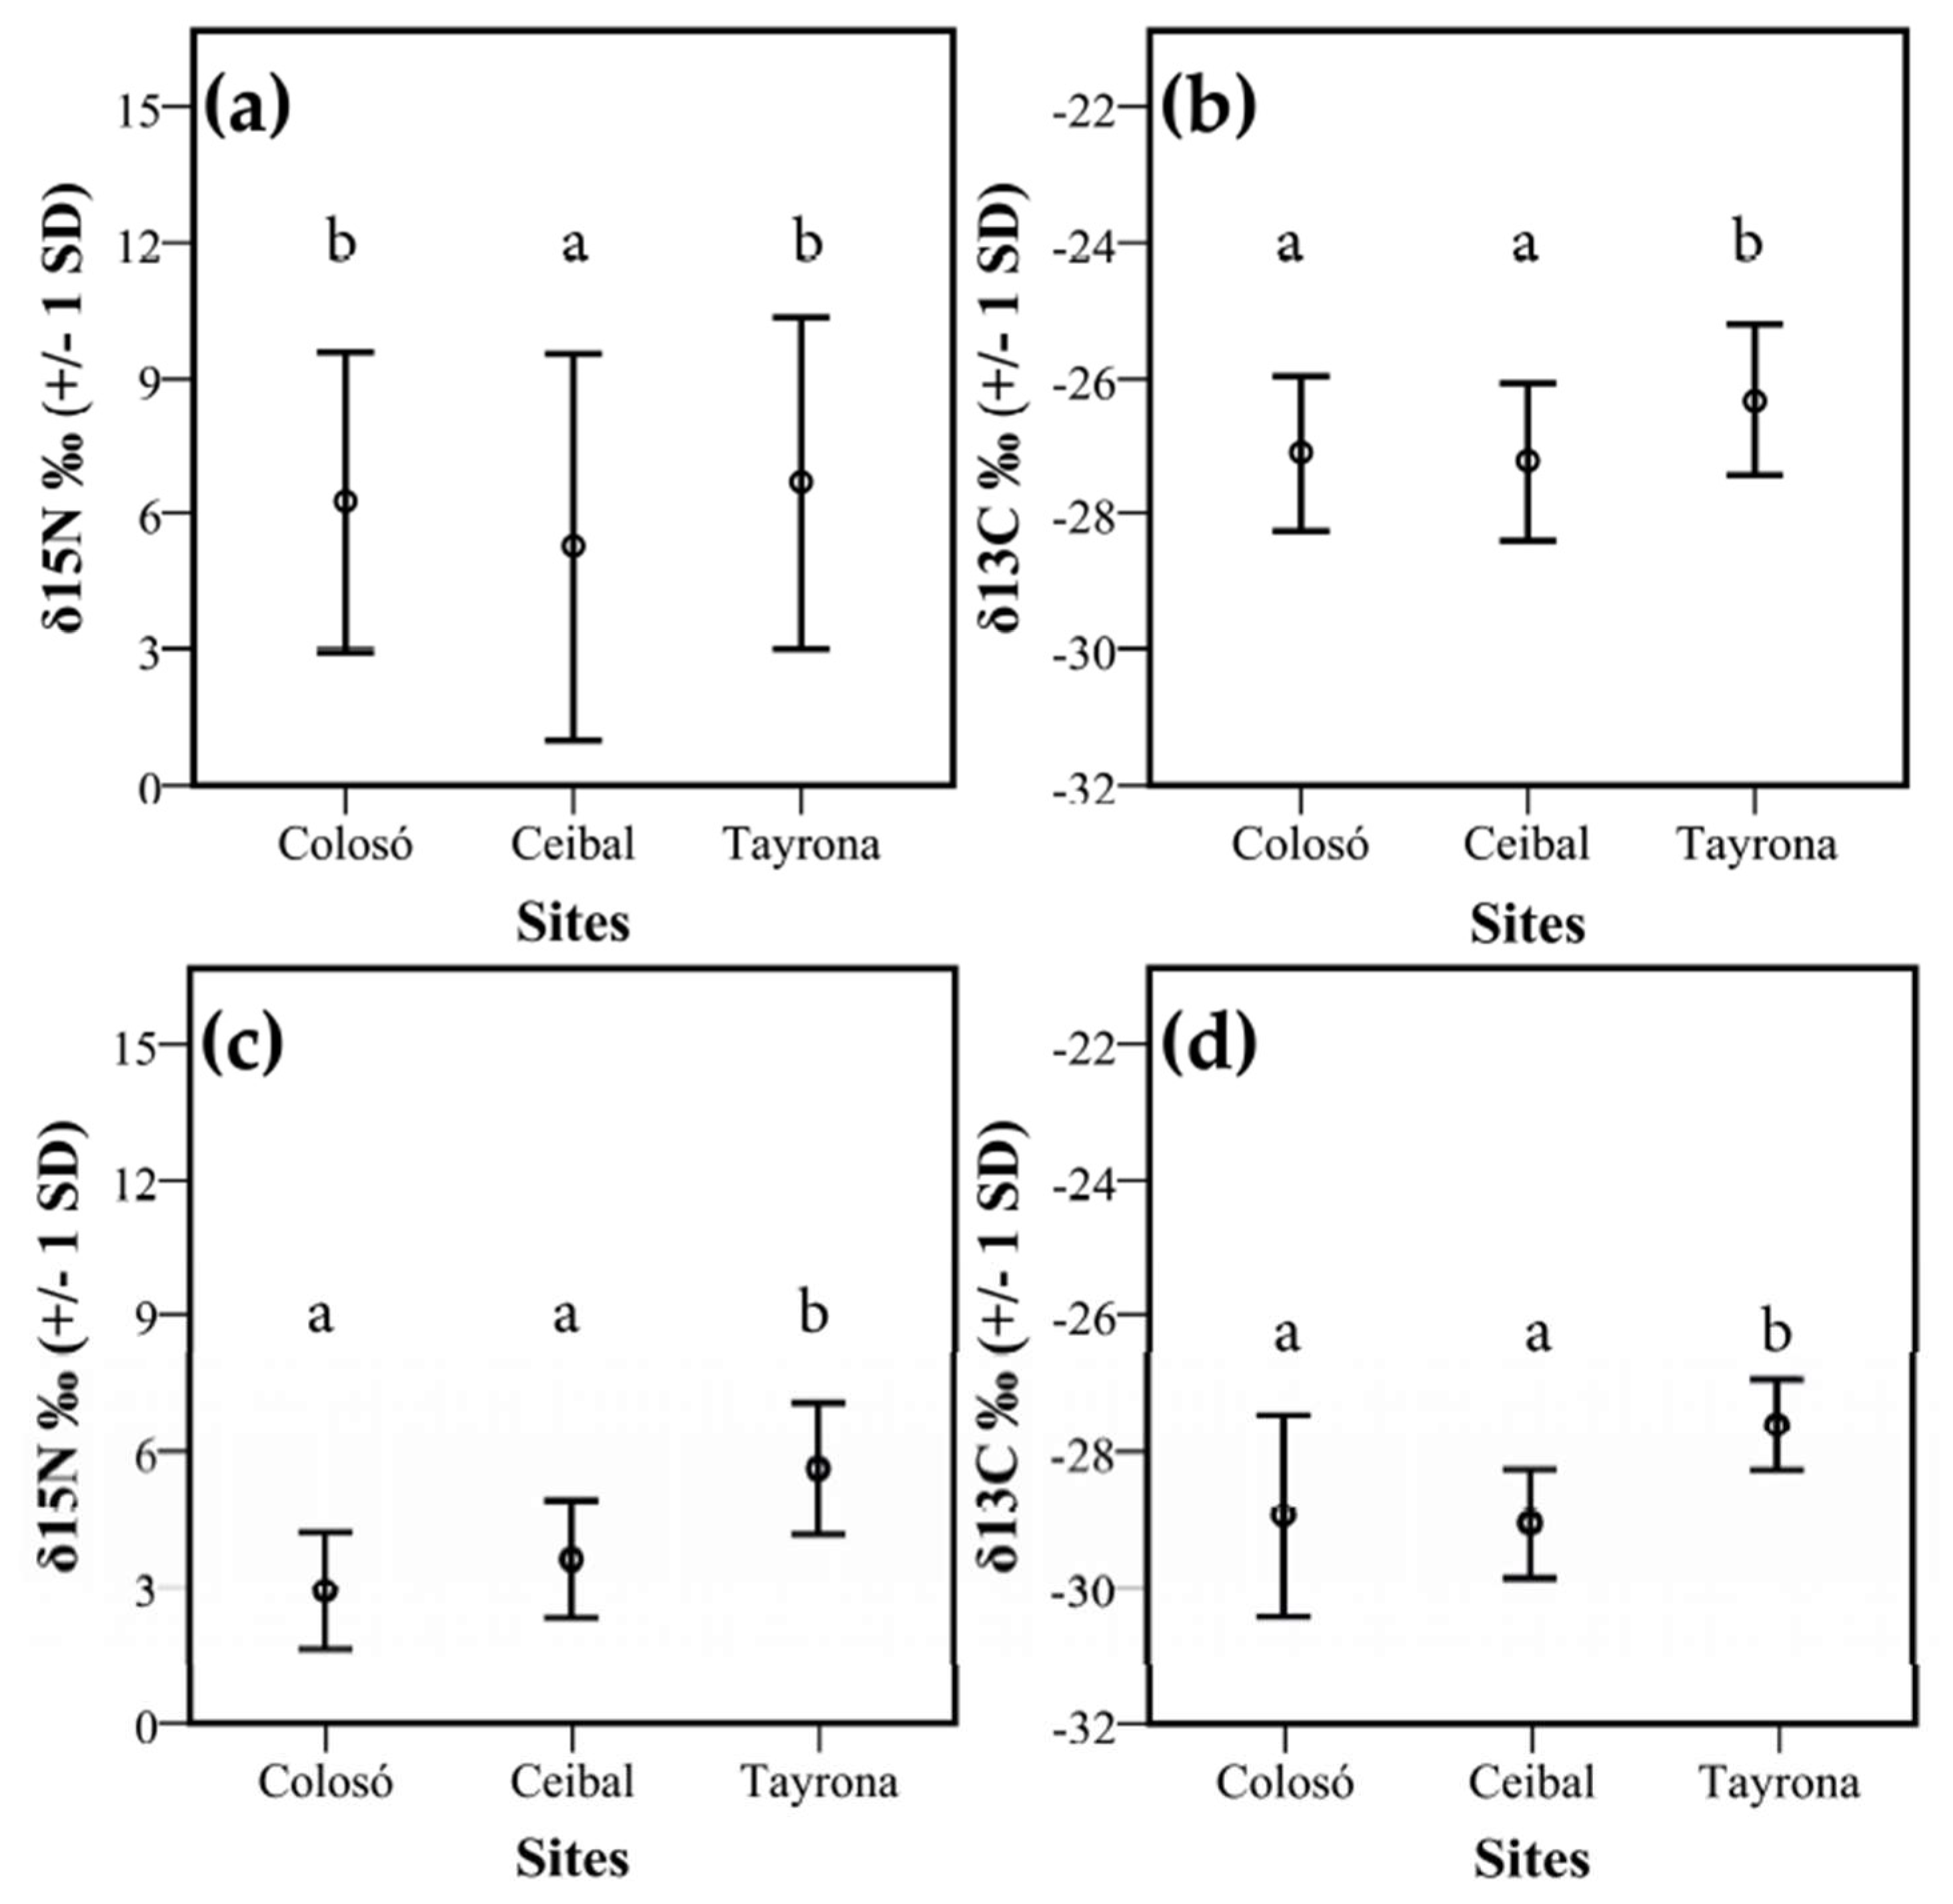
δ15N values of termites were highly variable, ranging from −1.6‰ to 17.8‰ (mean 6.0 ‰ +/− 1 SD 3.8, Figure A2, Table A4). Both Colosó and Tayrona differed significantly from Ceibal (F2, 12 = 4.78; p = 0.03, Figure 4a, Table A5). Additionally, the δ13C values of termites were highly variable (mean −27.0‰ +/− 1 SD 1.2; Min: −30.6, Max: −23.9). The termites from both Colosó (mean −27.1‰ +/− 1 SD 1.1) and Ceibal (mean −27.2‰ +/− 1 SD 1.2) had significantly lower δ13C values than those from Tayrona (mean −26.3 ‰ +/− 1 SD 1.1) (F2, 12 = 5.32; p = 0.022, Figure 4b, Table A6). In addition, the δ15N and δ13C signatures for litter samples were also significantly lower at these two sites than at the dry site Tayrona (ANOVA: F2, 72 = 26.90; p < 0.001, Tukey test p < 0.001, Figure 4c,d). Soil samples did not differ significantly between sites for δ15N (ANOVA: F2, 12 = 1.55; p = 0.253) and δ13C (ANOVA: F2, 12 = 1.01; p = 0.391). (Figure A3).
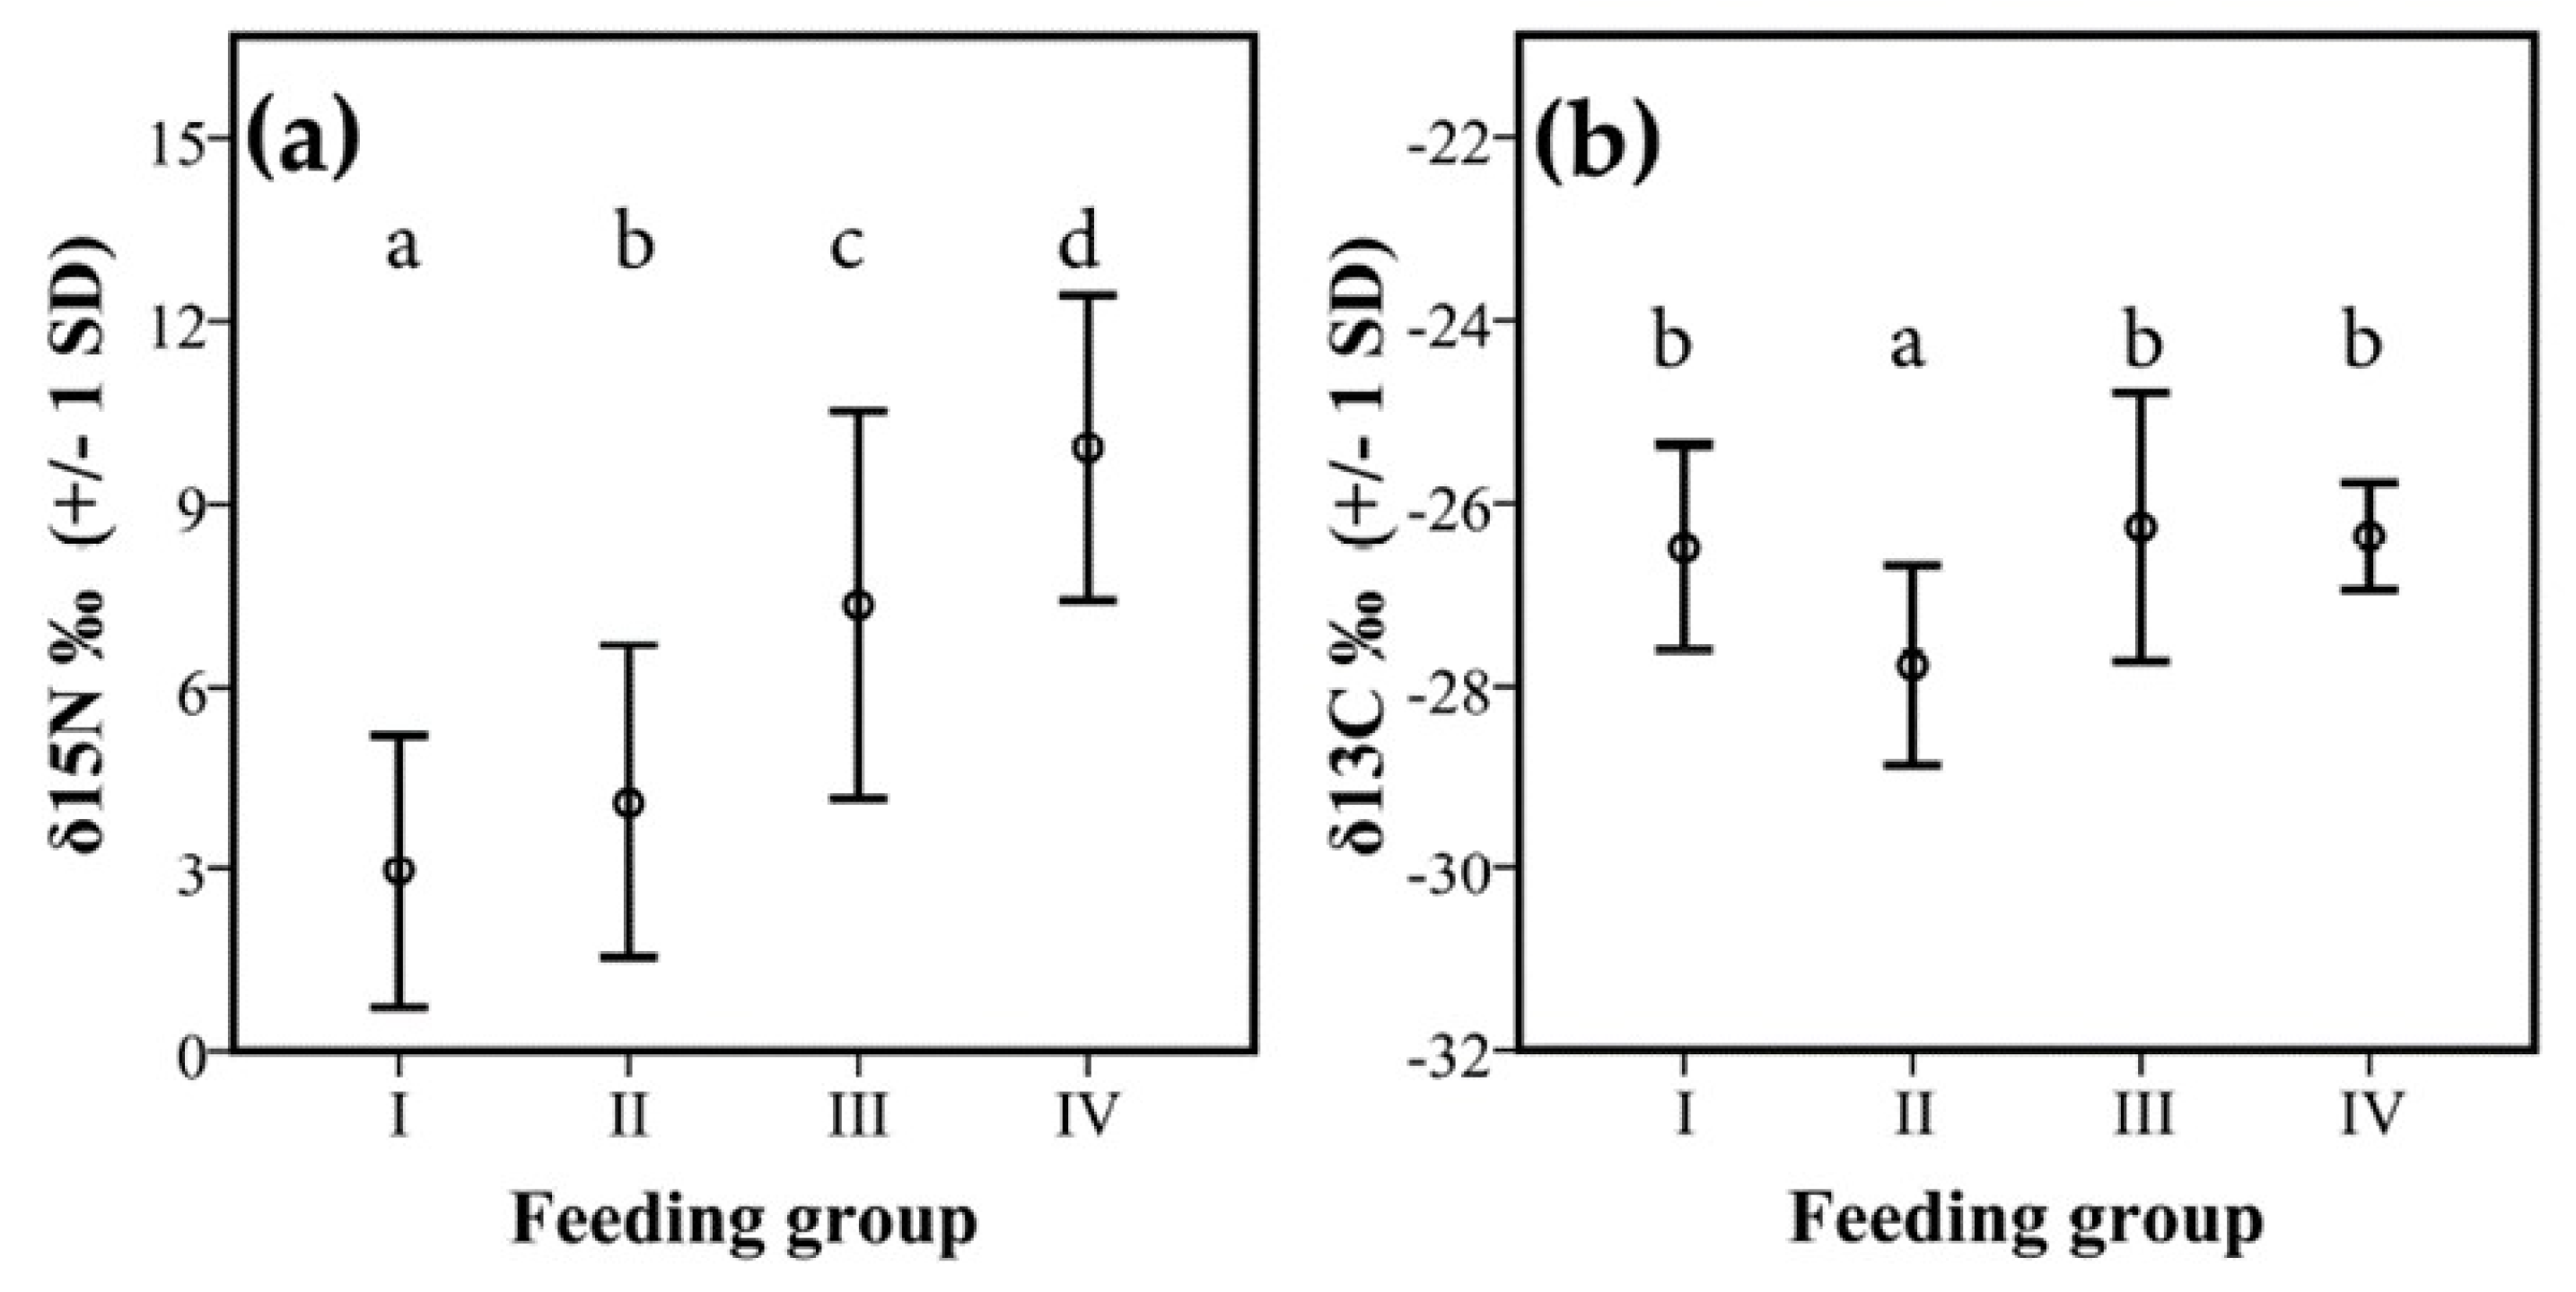
There were also significant differences in isotope signatures between feeding groups. δ15N values differed significantly between all groups (F1, 212 = 23.80, p < 0.001) (Figure 5a). Species from feeding group I had significantly lower δ15N values than those of feeding group II (p = 0.047), III (p < 0.001), and IV (p < 0.001). Termites from feeding group II had significantly lower δ15N values than those of the other feeding groups, III (p < 0.001) and IV (p < 0.001). Termites from feeding group III had significantly lower from feeding group IV (p < 0.001). Thus, there was a gradual increase of δ15N over the feeding groups.
For the δ13C, there were less strong differences between groups. Only feeding group II had significantly lower values than all other feeding groups (mean: −28.2‰ +/− 1 SD 1.0; F1, 212 = 9.34, p = 0.003, Figure 5b).
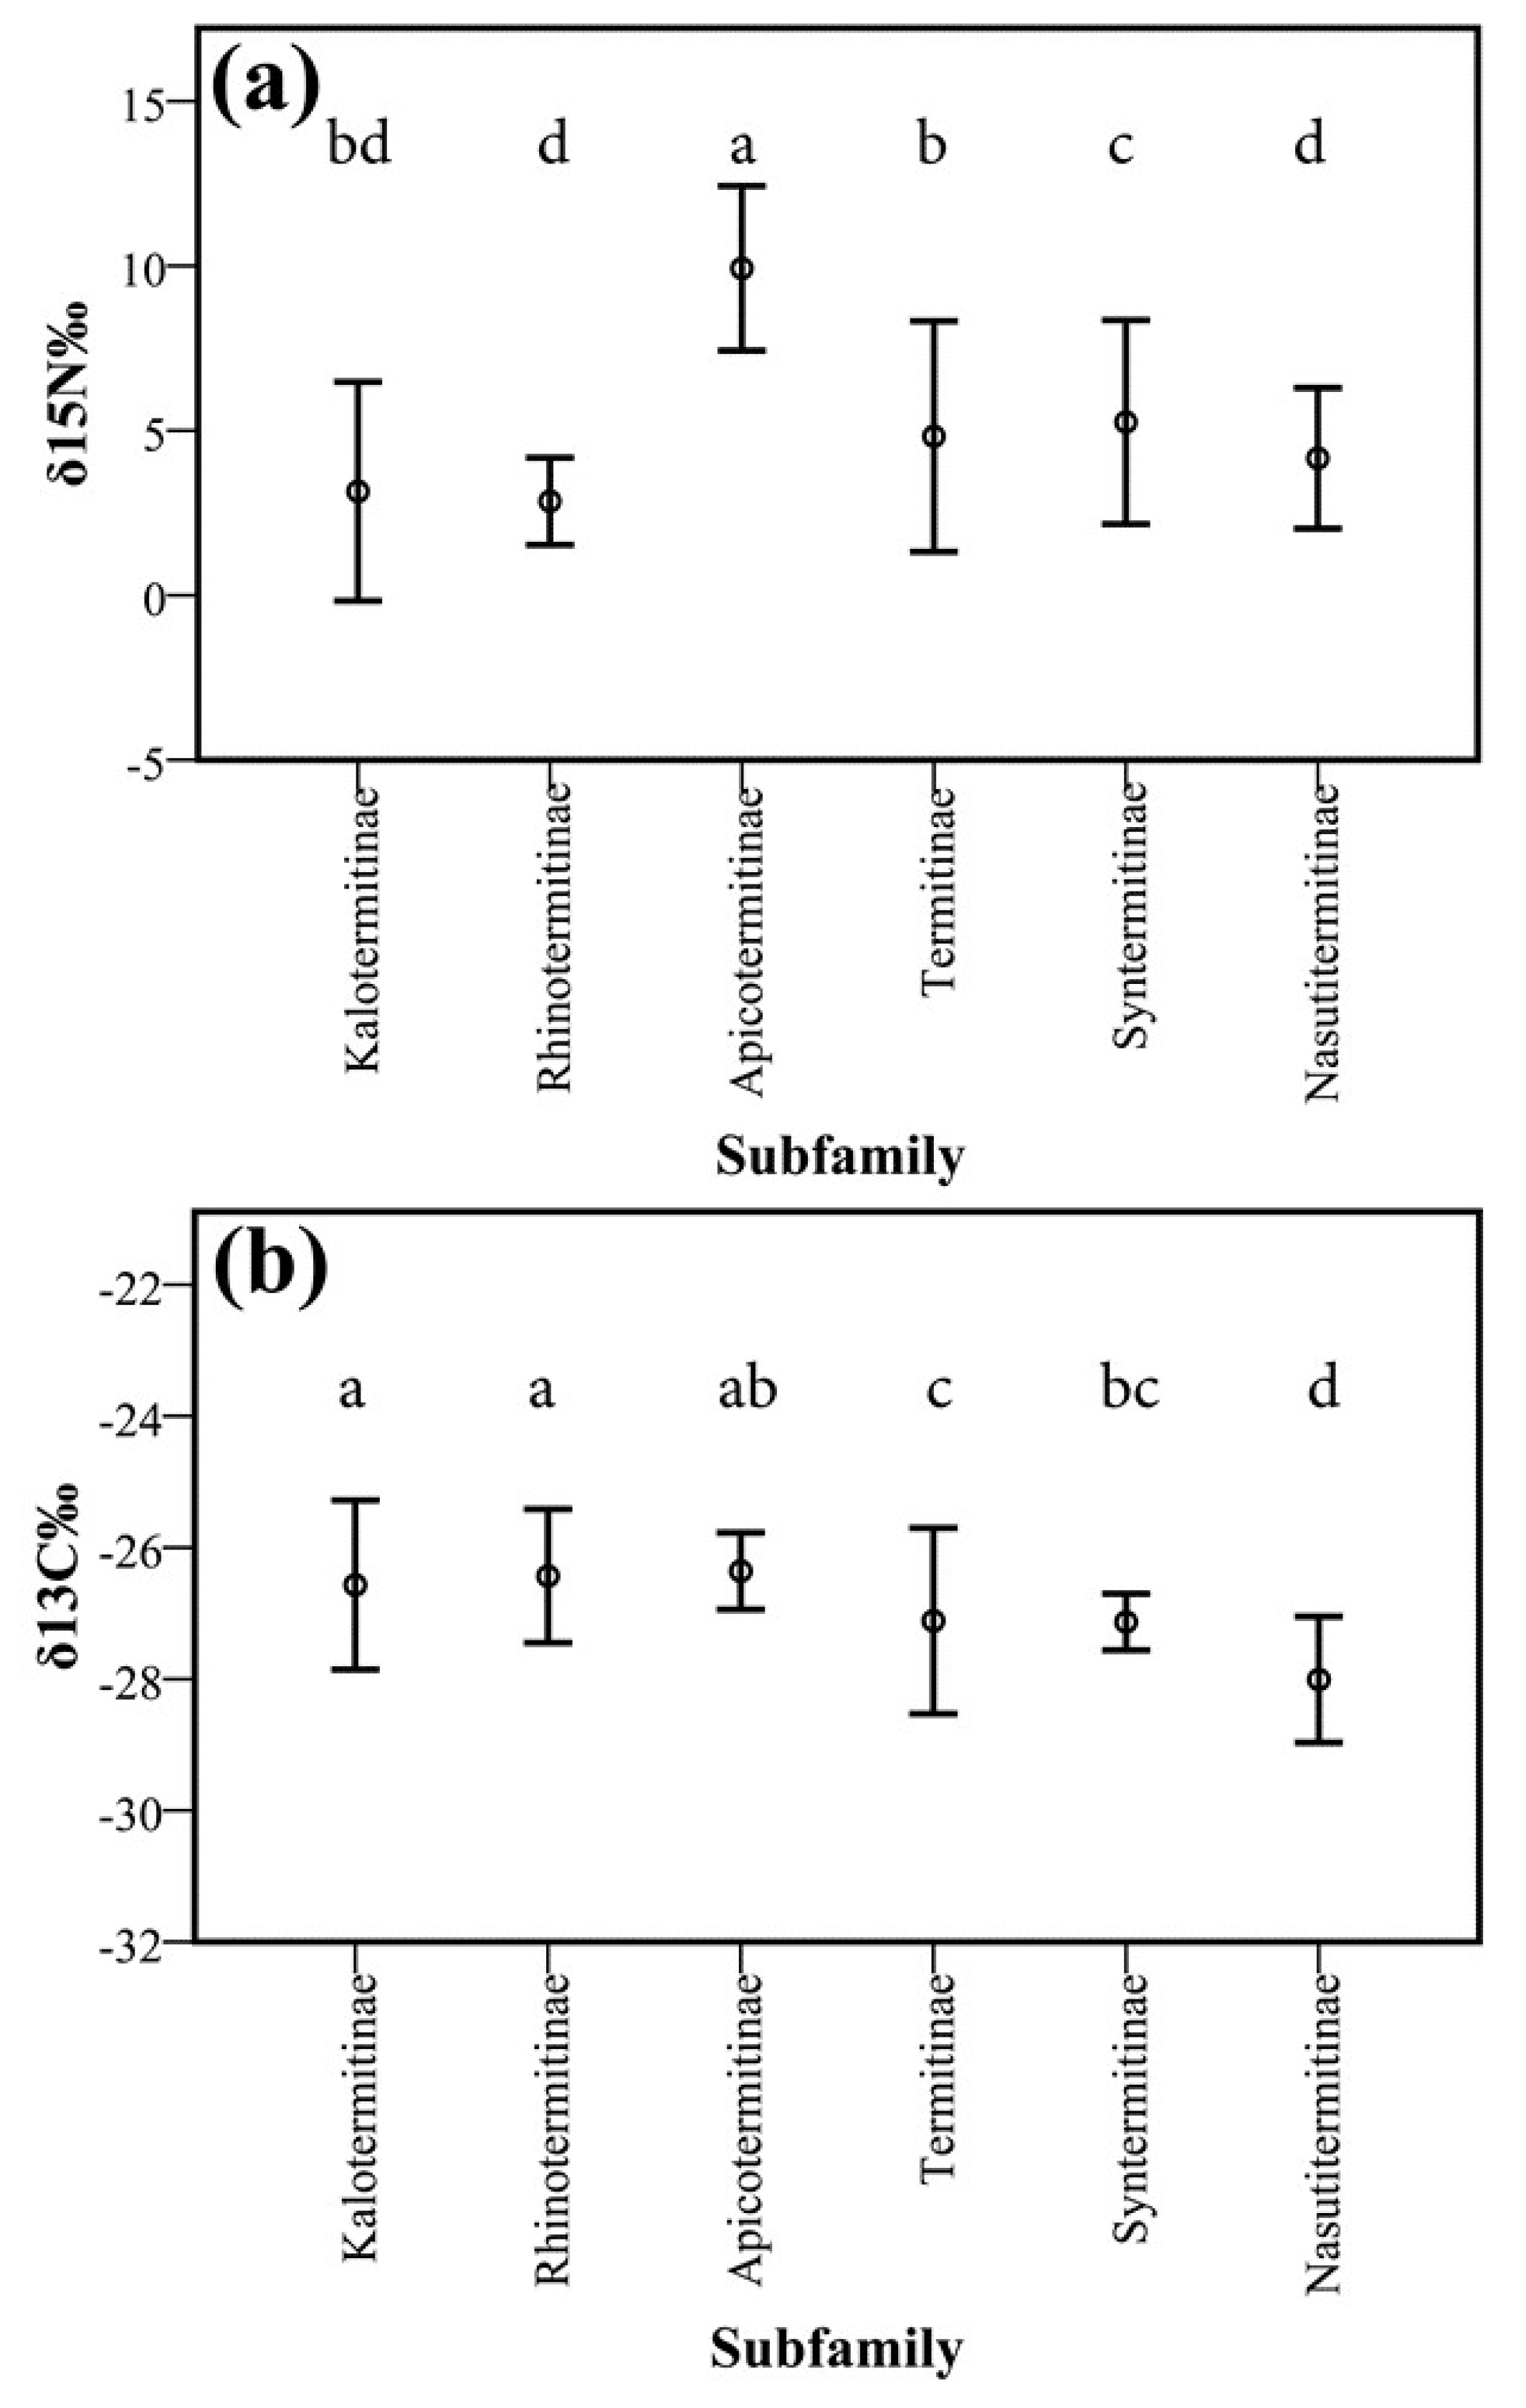
There were also differences in δ15N and δ13C signatures between taxonomic groups (Figure 6 and Figure A4, Table A4, Table A5 and Table A6). The lower termite species from the Rhinotermitidae (2.8‰ +/− 1 SD 1.3) and Kalotermitidae (3.2‰ +/− 1 SD 3.3) had the lowest δ15N values, which were significantly lower for the Rhinotermitidae than for species from the Termitidae (6.6‰ +/− 1 SD 3.8) (F3, 212 = 14.49; p < 0.001). Within the Termitidae, the δ15N also reflected the different feeding groups. Wood feeders of feeding group II, such as Microcerotermes, generally had lower values than humus and soil feeders, with the highest δ15N values occurring in the Anoplotermes-group (Figure 6). Some species (e.g., Cryptotermes cylindroceps, Rhynchotermes bulbinasus, and Termes sp1) had very high intraspecific variability (Figure 6a).
For δ13C, the subterranean Rhinotermitidae had the highest values (−26.4‰ +/− 1 SD 1.0), which were significantly higher than for species from the Termitidae (−27.1‰ +/− 1 SD 1.2, Figure 6b).
3.3. Mapping Food Niche Traits on Phylogeny
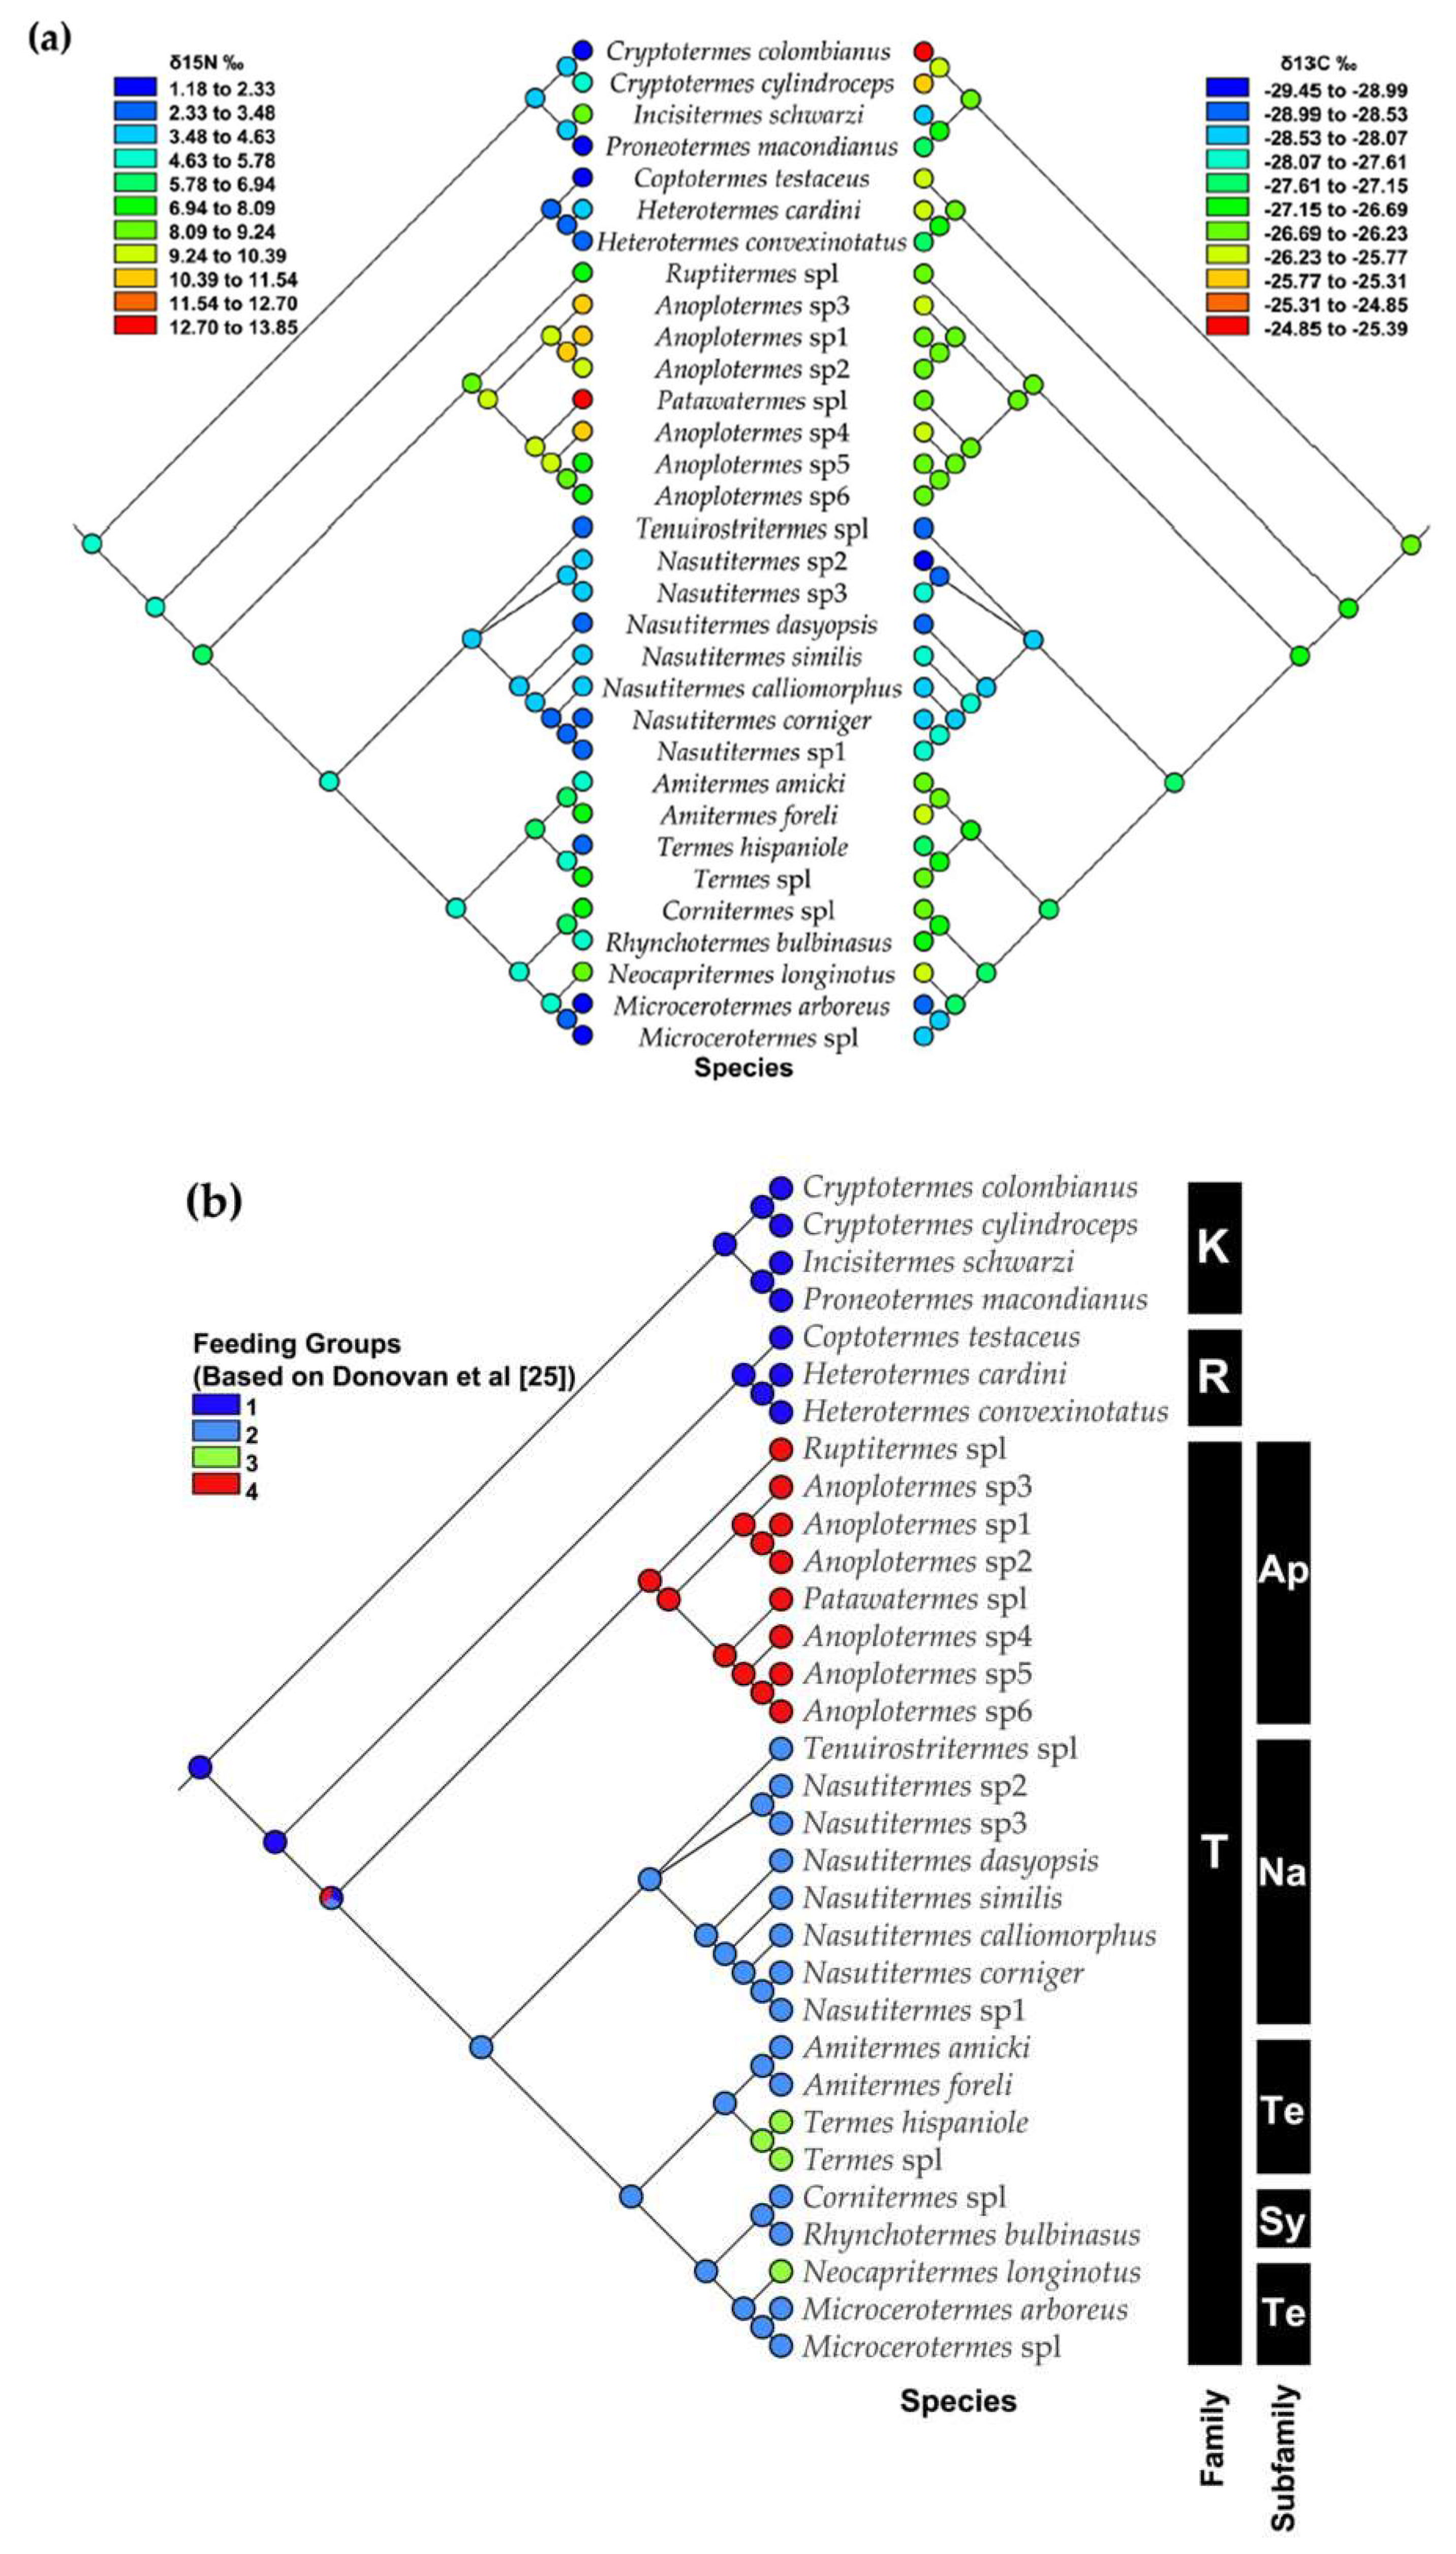
Our analyses showed that food niches, measured as feeding group membership and δ15N and δ13C signatures, are phylogenetically conserved traits in the studied species. Closely related species share the same feeding group (right part of Figure 7a,b). Among the studied termites, group IV soil feeders evolved only once from group II plant litter feeders or group I wood feeders. Interestingly, group IV soil feeders do not seem to have evolved from group III soil feeders (and vice versa). At the fine-scale of the δ15N and δ13C signatures, the δ15N signal reflects the feeding group pattern well, except for a few species, such as Incisitermes schwarzi and Termes sp.1 (Figure 7a, left part). Thus, the δ15N signature has a strong phylogenetic signal, with closely related species sharing similar signatures (Figure 7a). The δ13C signatures are also phylogenetically conserved, but their pattern does not reflect that of the feeding groups (Figure 7b, right part). The Kalotermitidae (feeding group I) (especially Cryptotermes) had the highest δ13C values, while Nasutitermitinae and Microcerotermes (both feeding group II, but independent transitions) had the lowest values.
4. Discussion
Our results imply that mechanisms which structure the termite assemblages differ between sites, with interspecific competition being more important at drier and warmer, lower-altitude plots (Figure 2 and Figure 3). This is in line with a hypothesis of food-limitation becoming important in such areas.
4.1. Mechanisms Structuring Termite Assemblages
Inferred from the phylogenetic community analyses, the assembly processes in the studied Colombian dry forests seem to differ between sites. The driest and lowest elevation site, Tayrona, had termite assemblages that were phylogenetically more overdispersed than those of the other sites (Figure 2). Overall, phylogenetic overdispersion correlated negatively with rainfall and elevation of study plots and positively with temperature (or vice versa, phylogenetic clustering increased with rainfall and elevation, but decreased with temperature) (Figure 3). The mixed model analyses including all three environmental analyses together, revealed that rainfall had the strongest and only significant effect (Table 1). That the results are non-significant when using the NRI values generated with the site-specific species pools as the reference supports the conclusion that the pattern is mainly driven by abiotic differences between study sites and not by differences between study plots within a site. To interpret this pattern ecologically requires knowledge of whether niche traits are phylogenetically conserved or labile. For conserved traits (i.e., closely related species share traits), overdispersion implies that species which share the same niche traits are less likely to co-exist than species that differ in these traits. Our phylogenetic trait mapping analyses showed that the food niche traits are phylogenetically conserved for the studied termite assemblages. This indicates that interspecific competition is more important in Tayrona, and in general, at the drier and warmer low-elevation study plots, than at the more humid and slightly colder high-elevation plots. In line with this, there are fewer termite species at the Tayrona plots [26]. In tropical dry forests, rainfall rather than temperature limits vegetation growth [53], with the latter still being optimal for plant growth at all sites (mean 26.5–27.7 °C). In line, the mixed model analyses only showed a significant effect for rainfall. Thus, there is lusher vegetation with higher biomass production in Colosó [54] and Ceibal [55,56] than in Tayrona [41], where Euphorbiaceae and Cactaceae are common. This supports the hypothesis that food is a limiting resource over which termites compete at Tayrona. Furthermore, other studies found evidence that food can be a limiting resource (i.e., dead plant material) for termites [57], which can lead to intra- and interspecific competition [57,58,59,60,61]. In a West African savannah, annual fires reduce the availability of dead plant material, so that the addition of dried grass after the fires leads to an increase in the number of sexual produced by the dominant mound building termite Macrotermes bellicosus [57].
This does not seem to be the case at the two other sites. NRI values close to zero imply that assemblages at Colosó and Ceibal do not differ much from random associations. The fact that the NRI values at the plot scale did not differ significantly from random expectation might be due to the low numbers of species per plot. Note, that the species number is the sample size for these tests and that small sample sizes are associated with low statistical power, hence making it unlikely to detect significant effects. One plot in Colosó even showed signs of phylogenetic clustering, implying that environmental variables select for a certain subset of termites at this specific plot, which was characterized by huge trees with a dense canopy and high humidity. Four Nasutitermes species and four species of the Anoplotermes-group co-existed in this plot. Several studies from Neotropical rain forests have also shown that these closely related species commonly co-occur [62,63,64].
How wide-spread are the implicated structuring mechanisms in termites? Comparable studies are rare. Most research on termite communities has concentrated on describing local or regional assemblages and testing associations between termite diversity and variables such as fire, disturbance, or elevation gradients [65,66,67,68]. The few studies that have addressed community processes in more detail in termites have often concentrated on a subset of species. They found evidence for interspecific competition in structuring assemblies at the local scale [32,44,58,69,70]. The only studies directly comparable to our study come from Africa. There phylogenetic community analyses imply random processes [49], but also evidence for interspecific competition [12,71] and environmental filtering [13], depending on the study site, disturbance regime, and presence of a dominant mound building termite species. Thus, we currently cannot derive any general conclusions and more similar studies are needed.
4.2. Food Niche: Isotopes and Termite Feeding Groups
In our study, also the isotope analyses, which admittedly included the termites’ gut, of the litter support the notion of vegetation differences in Tayrona as the δ15N and δ13C values were significantly higher at this site. Interestingly, the soil signatures did not differ between sites. For δ13C, but not δ15N, the shift in the litter signatures between sites is reflected in the termites’ isotope signal (Figure 5). Differences in δ13C mainly reflect varying proportions of C3 and C4 plants in the food of termites, while differences in δ15N indicate the diverse proportions of variably humified food resources [32,34,36]. The higher δ13C values at Tayrona reflect the presence of more grasses and especially abundant Euphorbiaceae [41], which are all C4 plants. In addition, due to the proximity of the sea and the associated salinity- and water-stress, also C3 plants have higher δ13C values [72,73].
In general, our isotope signatures were similar to those found for termites in other forests [31,32]. However, a study in an African savanna with many fungus-growing termites revealed higher δ13C values at the upper range and a lower δ15N signature at the lower range, reflecting a higher proportion of C4 grasses in the habitat and a broader food niche spectrum of fungus-growing termites [33,37].
Reflecting a humification gradient, the four commonly recognized feeding groups identified by Donovan et al. [27] can generally be distinguished by isotope signatures, especially δ15N [34,37]. Nevertheless, there can be limitations, as the rain forest and savanna revealed, which did not recover a discontinuity in δ15N values between group I and II or between III humus- and group IV soil-feeders [74]. Our current study separated all feeding groups for δ15N signatures (Figure 5a, Figure 6a and Figure 7a), supporting Donovan´s feeding group concept (Figure 7b). However, for δ13C, no such gradient was revealed and only feeding type II had δ13C values that were lower and differed significantly from all other feeding types (Figure 5b, Figure 6b and Figure 7b). This implies that isotope studies are required to reliably determine the food niches of termites.
5. Conclusions
Mechanisms that structure termite assemblages in dry forests are complex. Both neutral and deterministic processes seem to be present, with decreasing rainfall probably leading to interspecific competition and a reduction of species caused by limited food availability. More studies are needed that specifically test for these mechanisms. However, our study shows how a phylogenetic community approach combined with trait analyses can contribute to gaining the first insights into mechanisms structuring whole termite assemblages.
Author Contributions
Conceptualization J.K.; methodology, J.K.; software, J.K. and R.C.D.; validation, J.K. and R.C.D.; formal analysis, J.K. and R.C.D.; investigation, J.K. and R.C.D.; resources, J.K. and R.C.D.; data curation, J.K. and R.C.D.; writing—original draft preparation, J.K. and R.C.D.; writing—review and editing, J.K. and R.C.D.; visualization, R.C.D.; supervision, J.K.; project administration, J.K. and R.C.D.; funding acquisition, J.K. and R.C.D.
Funding
This research was funded by Evolution & Ecology: From Ecology to Genes from University of Freiburg (Germany) and Strategic Research Area in Biodiversity, Ecosystem Services and Human Well-being Program from Universidad del Norte (Colombia) and COLCIENCIAS-Colfuturo.
Acknowledgments
We are also grateful to the National Agency of Environmental Licenses for research permit no. 739/ANLA/MADS (8 July 2014) and the Natural Parks Unit research permit 005/PNNC/ANLA/MADS (10 July 2015). Thanks to Luis Fernando Lopez and Saudy Royero. Thanks to Karen Meusemann and Juan Pablo Gomez for comments on the text and all those who indirectly helped in conducting this work.
Conflicts of Interest
The authors declare no conflict of interest. The funders had no role in the design of the study; in the collection, analyses, or interpretation of data; in the writing of the manuscript, or in the decision to publish the results.
Appendix A

Table A1.
GenBank accession numbers for all species for the COII, 12S, and 16S sequences.
| Species | GenBank | ||
|---|---|---|---|
| Accession COII | Accession 12S | Accession 16S | |
| Blatta orientalis | DQ874267.1 | DQ87403.1 | U17774.1 |
| Amitermes amicki | MH090825 | MH090861 | MH090885 |
| Amitermes foreli | MH090826 | MH090860 | MH090886 |
| Anoplotermes sp1 | MH090827 | MH090876 | MH090887 |
| Anoplotermes sp2 | MH090828 | MH090881 | MH090888 |
| Anoplotermes sp3 | MH090829 | MH090878 | MH090889 |
| Anoplotermes sp4 | MH090831 | MH090880 | MH090891 |
| Anoplotermes sp5 | MH090832 | MH090877 | MH090892 |
| Anoplotermes sp6 | MH090833 | MH090879 | MH090893 |
| Coptotermes testaceus | MH090834 | MH090857 | MH090894 |
| Cornitermes sp1 | MH090835 | MH090866 | MH090895 |
| Cryptotermes colombianus | KU510330 | KX267100 | KX267099 |
| Cryptotermes cylindroceps | MH090836 | MH090856 | MH090896 |
| Heterotermes cardini | MH090837 | MH090859 | MH090897 |
| Heterotermes convexinotatus | MH090838 | MH090858 | MH090898 |
| Incisitermes schwarzi | MH090839 | MH090855 | MH090899 |
| Microcerotermes arboreus | MH090840 | MH090872 | MH090900 |
| Microcerotermes sp1 | MH090841 | MH090871 | MH090901 |
| Nasutitermes corniger | MH090846 | MH090882 | MH090906 |
| Nasutitermes dasyopsis | MH090843 | MH090869 | MH090903 |
| Nasutitermes similis | MH090844 | MH090873 | MH090904 |
| Nasutitermes callimorphus | MH090845 | MH090870 | MH090905 |
| Nasutitermes sp1 | MH090842 | MH090868 | MH090902 |
| Nasutitermes sp2 | MH090848 | MH090862 | MH090908 |
| Nasutitermes sp3 | MH090849 | MH090863 | MH090909 |
| Neocapritermes longinotus | MH090847 | MH090867 | MH090907 |
| Patawatermes sp1 | MH090830 | MH090874 | MH090890 |
| Proneotermes macondianus | KX267098 | KX267095 | KX267092 |
| Rhynchotermes bulbinasus | MH090850 | MH090865 | MH090910 |
| Ruptitermes sp1 | MH090851 | MH090875 | MH090911 |
| Tenuirostritermes sp1 | MH090852 | MH090864 | MH090912 |
| Termes hispaniolae | MH090853 | MH090883 | MH090913 |
| Termes sp1 | MH090854 | MH090884 | MH090914 |
Table A2.
Occurrences of termites per study plot (100 m).
| Species | F | SF | FG | CO1 | CO2 | CO3 | CO4 | CO5 | CE1 | CE2 | CE3 | CE4 | CE5 | TA1 | TA2 | TA3 | TA4 | TA5 | TOT |
|---|---|---|---|---|---|---|---|---|---|---|---|---|---|---|---|---|---|---|---|
| Cryptotermes colombianus | K | I | 0 | 0 | 0 | 0 | 0 | 0 | 0 | 0 | 0 | 0 | 1 | 0 | 0 | 0 | 0 | 1 | |
| Cryptotermes cylindroceps | K | I | 0 | 0 | 0 | 0 | 0 | 0 | 0 | 0 | 0 | 0 | 2 | 0 | 2 | 0 | 3 | 7 | |
| Incisitermes schwarzi | K | I | 0 | 0 | 0 | 0 | 0 | 0 | 0 | 0 | 0 | 2 | 0 | 0 | 0 | 0 | 0 | 2 | |
| Proneotermes macondianus | K | I | 0 | 0 | 0 | 1 | 0 | 0 | 0 | 7 | 0 | 0 | 0 | 0 | 0 | 1 | 0 | 9 | |
| Coptotermes testaceus | R | I | 1 | 0 | 0 | 5 | 0 | 4 | 0 | 0 | 6 | 0 | 0 | 0 | 0 | 0 | 0 | 16 | |
| Heterotermes cardini | R | I | 5 | 6 | 6 | 1 | 7 | 16 | 12 | 5 | 0 | 3 | 20 | 2 | 8 | 4 | 11 | 106 | |
| Heterotermes convexinotatus | R | I | 0 | 0 | 0 | 0 | 0 | 0 | 0 | 0 | 8 | 0 | 0 | 0 | 0 | 0 | 0 | 8 | |
| Anoplotermes sp1 | T | Ap | IV | 0 | 0 | 0 | 0 | 2 | 0 | 0 | 9 | 2 | 10 | 0 | 0 | 0 | 0 | 0 | 23 |
| Anoplotermes sp2 | T | Ap | IV | 2 | 5 | 7 | 6 | 1 | 0 | 0 | 0 | 0 | 0 | 0 | 0 | 0 | 0 | 0 | 21 |
| Anoplotermes sp3 | T | Ap | IV | 1 | 0 | 0 | 7 | 19 | 0 | 0 | 3 | 0 | 12 | 1 | 1 | 1 | 0 | 0 | 45 |
| Anoplotermes sp4 | T | Ap | IV | 0 | 3 | 2 | 2 | 0 | 0 | 0 | 1 | 0 | 4 | 1 | 0 | 3 | 1 | 1 | 18 |
| Anoplotermes sp5 | T | Ap | IV | 0 | 0 | 0 | 0 | 3 | 1 | 1 | 0 | 0 | 1 | 0 | 0 | 0 | 0 | 0 | 6 |
| Anoplotermes sp6 | T | Ap | IV | 2 | 15 | 1 | 8 | 3 | 0 | 0 | 0 | 0 | 0 | 0 | 0 | 0 | 0 | 0 | 29 |
| Patawatermes sp1 | T | Ap | IV | 0 | 1 | 0 | 0 | 0 | 0 | 0 | 0 | 0 | 4 | 0 | 0 | 1 | 0 | 0 | 6 |
| Ruptitermes sp1 | T | Ap | IV | 0 | 0 | 1 | 0 | 2 | 1 | 1 | 0 | 0 | 0 | 6 | 5 | 8 | 1 | 4 | 29 |
| Nasutitermes corniger | T | Na | II | 16 | 13 | 0 | 3 | 4 | 0 | 0 | 0 | 0 | 0 | 0 | 0 | 0 | 0 | 0 | 36 |
| Nasutitermes dasyopsis | T | Na | II | 0 | 0 | 0 | 0 | 1 | 1 | 1 | 2 | 1 | 5 | 21 | 1 | 5 | 0 | 9 | 47 |
| Nasutitermes similis | T | Na | II | 6 | 0 | 0 | 10 | 1 | 0 | 0 | 0 | 0 | 0 | 0 | 0 | 0 | 0 | 0 | 17 |
| Nasutitermes callimorphus | T | Na | II | 0 | 0 | 0 | 0 | 0 | 0 | 0 | 18 | 0 | 11 | 0 | 0 | 0 | 0 | 0 | 29 |
| Nasutitermes sp1 | T | Na | II | 0 | 0 | 28 | 18 | 35 | 0 | 0 | 0 | 0 | 0 | 0 | 0 | 0 | 0 | 0 | 81 |
| Nasutitermes sp2 | T | Na | II | 0 | 0 | 0 | 2 | 0 | 0 | 0 | 0 | 0 | 0 | 0 | 0 | 0 | 0 | 0 | 2 |
| Nasutitermes sp3 | T | Na | II | 0 | 0 | 0 | 1 | 0 | 0 | 1 | 0 | 0 | 0 | 4 | 0 | 0 | 2 | 0 | 8 |
| Tenuisrostritermes sp1 | T | Na | II | 0 | 0 | 0 | 3 | 0 | 0 | 0 | 0 | 0 | 0 | 0 | 0 | 0 | 0 | 0 | 3 |
| Amitermes amicki | T | Te | II | 0 | 0 | 0 | 0 | 0 | 0 | 0 | 0 | 0 | 0 | 1 | 1 | 2 | 1 | 0 | 5 |
| Amitermes foreli | T | Te | II | 0 | 0 | 1 | 3 | 0 | 6 | 5 | 0 | 8 | 24 | 7 | 0 | 3 | 1 | 1 | 59 |
| Microcerotermes arboreus | T | Te | II | 0 | 0 | 0 | 0 | 0 | 15 | 0 | 19 | 29 | 46 | 0 | 0 | 0 | 0 | 0 | 109 |
| Microcerotermes sp1 | T | Te | II | 8 | 12 | 1 | 16 | 22 | 6 | 37 | 6 | 47 | 21 | 35 | 24 | 17 | 11 | 22 | 285 |
| Neocapritermes longinotus | T | Te | III | 3 | 1 | 2 | 6 | 1 | 3 | 5 | 0 | 0 | 0 | 0 | 0 | 3 | 0 | 0 | 24 |
| Termes hispaniolae | T | Te | III | 3 | 0 | 0 | 0 | 0 | 0 | 0 | 0 | 0 | 0 | 0 | 0 | 0 | 0 | 0 | 3 |
| Termes sp1 | T | Te | III | 0 | 0 | 0 | 0 | 0 | 0 | 0 | 0 | 0 | 0 | 0 | 0 | 2 | 0 | 0 | 2 |
| Cornitermes sp1 | T | Sy | II | 7 | 21 | 16 | 6 | 3 | 0 | 0 | 0 | 0 | 0 | 0 | 0 | 0 | 0 | 0 | 53 |
| Rhynchotermes bulbinasus | T | Sy | II | 0 | 0 | 0 | 0 | 0 | 0 | 11 | 0 | 0 | 3 | 0 | 0 | 0 | 0 | 0 | 14 |
| Number of species | 32 | 11 | 9 | 10 | 17 | 14 | 9 | 9 | 9 | 7 | 13 | 11 | 6 | 12 | 8 | 7 | |||
| Number of occurrences | 54 | 77 | 65 | 98 | 104 | 53 | 74 | 70 | 101 | 146 | 99 | 34 | 55 | 22 | 51 | 1103 |
(F) = Family: (K) = Kalotermitidae; (R) = Rhinotermitidae; (T) = Termitidae. (SF) = Subfamily: (Ap) = Apicotermitidae; (Na) = Nasutitermitinae; (Te) =Termitinae; (Sy) = Syntermitidae. (FG) = Feeding groups follow Donovan et al. 2001: (I) = wood; (II) = leaf-litter; (III) = humus; (IV) = soil feeders.
Table A3.
(a) Results of phylogenic local community analyses from all the study plots using the regional species pool of all species occurring in the study as a reference for the null models. None of the NRI values except for Coloso_5 differed significantly from a random assemblage. (b) Results of the phylogenic community analyses using the site-specific termite pools as references. None of the NRI values differed significantly from a random assemblage.
(a)
| Plot | Taxa | NRI |
|---|---|---|
| Coloso_1 | 11 | 1.456 |
| Coloso_2 | 9 | 1.411 |
| Coloso_3 | 10 | 1.594 |
| Coloso_4 | 17 | 1.282 |
| Coloso_5 | 14 | 2.452 |
| Ceibal_1 | 9 | 1.18 |
| Ceibal_2 | 9 | 1.313 |
| Ceibal_3 | 9 | 0.009 |
| Ceibal_4 | 7 | 0.886 |
| Ceibal_5 | 13 | 0.738 |
| Tayrona_1 | 11 | −0.821 |
| Tayrona_2 | 6 | 0.798 |
| Tayrona_3 | 12 | 0.412 |
| Tayrona_4 | 7 | −0.576 |
| Tayrona_5 | 7 | −0.340 |
ANOVA from all the study plots at the regional level (p < 0.001).
| NRI | Sum of Squares | df | Mean Square | F | p-Value |
|---|---|---|---|---|---|
| Between sites | 7.80 | 2 | 3.900 | 15.76 | <0.001 |
| Within sites | 2.97 | 12 | 0.248 | ||
| Total | 10.77 | 14 |
Multiple comparisons from all the study plots at the regional level.
| (I) Site | (J) Site | Mean Difference (I–J) | Std. Error | p-Value |
|---|---|---|---|---|
| Colosó | Ceibal | 0.63 | 0.31 | 0.152 |
| Tayrona | 1.74 | 0.31 | <0.001 | |
| Ceibal | Tayrona | 1.11 | 0.31 | 0.011 |
(b)
| Plot | Taxa | NRI |
|---|---|---|
| Coloso_1 | 11 | 0.408 |
| Coloso_2 | 9 | 0.549 |
| Coloso_3 | 10 | 0.71 |
| Coloso_4 | 17 | −0.856 |
| Coloso_5 | 14 | 1.446 |
| Ceibal_1 | 9 | 1.023 |
| Ceibal_2 | 9 | 1.382 |
| Ceibal_3 | 9 | −0.219 |
| Ceibal_4 | 7 | 0.834 |
| Ceibal_5 | 13 | 0.659 |
| Tayrona_1 | 11 | −0.818 |
| Tayrona_2 | 6 | 0.828 |
| Tayrona_3 | 12 | 0.449 |
| Tayrona_4 | 7 | −0.522 |
| Tayrona_5 | 7 | −0.336 |
ANOVA (finer scale). None of the NRI values differed significantly between sites.
| NRI | Sum of Squares | df | Mean Square | F | p-Value |
|---|---|---|---|---|---|
| Between sites | 1.714 | 2 | 0.857 | 1.68 | 0.227 |
| Within sites | 6.113 | 12 | 0.509 | ||
| Total | 7.826 | 14 |
Results of the local phylogenic community analyses using the site-specific termite pools. Pearson correlation (finer scale).
Results of the local phylogenic community analyses using the site-specific termite pools. Pearson correlation (finer scale).
| Rainfall | Elevation | Temperature | |
|---|---|---|---|
| NRI | 0.354 (p = 0.195) | 0.147 (p = 0.600) | −0.144 (p = 0.609) |
Estimates of the mixed effect model between NRI (using the site-specific termite pools) and the three abiotic variables rainfall, elevation, and temperature. The mixed model was insignificant (p > 0.087).
Estimates of the mixed effect model between NRI (using the site-specific termite pools) and the three abiotic variables rainfall, elevation, and temperature. The mixed model was insignificant (p > 0.087).
| Variable | Estimate | Standard Error | df | t-Value | p-Value |
|---|---|---|---|---|---|
| Intercept | 0.369 | 0.192 | 9 | 1.92 | 0.087 |
| Rainfall | 0.657 | 0.393 | 9 | 1.67 | 0.129 |
| Temperature | 0.490 | 0.593 | 9 | 0.82 | 0.430 |
| Elevation | 0.044 | 0.478 | 9 | 0.09 | 0.928 |
Table A4.
Isotopic composition of δ13C‰ and δ15N‰ for each species of termites, soil, and litter.
| Species | n | Delta Nitro | Delta Carbon | ||
|---|---|---|---|---|---|
| Mean | +/− SD | Mean | +/− SD | ||
| Amitermes amicki | 5 | 5.65 | 0.57 | −26.59 | 0.51 |
| Amitermes foreli | 10 | 7.57 | 2.68 | −26.19 | 0.81 |
| Anoplotermes sp1 | 11 | 11.31 | 2.11 | −26.38 | 0.62 |
| Anoplotermes sp2 | 10 | 10.35 | 1.12 | −26.38 | 0.41 |
| Anoplotermes sp3 | 10 | 10.81 | 2.54 | −26.16 | 0.60 |
| Anoplotermes sp4 | 11 | 10.76 | 2.53 | −26.29 | 0.66 |
| Anoplotermes sp5 | 6 | 8.00 | 1.15 | −26.61 | 0.36 |
| Anoplotermes sp6 | 10 | 7.51 | 0.96 | −26.40 | 0.60 |
| Coptotermes testaceus | 8 | 2.23 | 1.26 | −26.03 | 0.71 |
| Cornitermes sp1 | 10 | 7.98 | 0.93 | −26.65 | 0.57 |
| Cryptotermes colombianus | 2 | 1.35 | 1.76 | −24.83 | 0.46 |
| Cryptotermes cylindroceps | 4 | 4.64 | 3.69 | −25.56 | 1.02 |
| Heterotermes cardini | 11 | 3.52 | 1.42 | −26.21 | 1.16 |
| Heterotermes convexinotatus | 6 | 2.47 | 0.60 | −27.38 | 0.32 |
| Incisitermes schwarzi | 2 | 8.86 | 0.24 | −28.23 | 0.25 |
| Microcerotermes arboreus | 10 | 1.86 | 0.96 | −28.58 | 1.01 |
| Microcerotermes sp1 | 11 | 1.42 | 1.09 | −27.95 | 0.67 |
| Nasutitermes calliomorphus | 8 | 3.81 | 0.62 | −28.51 | 0.82 |
| Nasutitermes corniger | 9 | 2.93 | 0.43 | −27.69 | 0.62 |
| Nasutitermes dasyopsis | 7 | 3.30 | 1.35 | −28.52 | 0.68 |
| Nasutitermes similis | 7 | 3.57 | 2.64 | −27.95 | 0.75 |
| Nasutitermes sp1 | 9 | 2.66 | 0.53 | −28.40 | 0.51 |
| Nasutitermes sp2 | 2 | 3.91 | 0.52 | −29.45 | 0.26 |
| Nasutitermes sp3 | 8 | 4.40 | 1.86 | −28.00 | 0.93 |
| Neocapritermes longinotus | 10 | 8.64 | 1.36 | −26.13 | 0.61 |
| Patawatermes sp1 | 6 | 12.99 | 0.77 | −26.04 | 0.60 |
| Proneotermes macondianus | 7 | 1.19 | 0.72 | −27.17 | 0.53 |
| Rhinchotermes bulbinasus | 6 | 5.26 | 3.10 | −27.13 | 0.43 |
| Ruptitermes sp1 | 10 | 7.91 | 2.21 | −26.57 | 0.69 |
| Tenuirostritermes sp1 | 3 | 3.42 | 0.62 | −28.99 | 0.27 |
| Termes sp1 | 3 | 8.02 | - | −24.57 | - |
| Termes hispaniole | 1 | 2.87 | 4.28 | −27.23 | 3.06 |
| Litter | 75 | 4.0653 | 1.7535 | −28.56 | 1.2804 |
| Soil | 15 | 5.98 | 1.4387 | −27.34 | 0.9068 |
Table A5.
Results of generalized linear models (GLM) that best fit the variation in isotope composition of δ15N ‰ in termites within tropical dry forest.
| Source | df | F | p-Value | |
|---|---|---|---|---|
| Intercept | Hypothesis | 1 | 376.28 | <0.001 |
| Error | 27 | |||
| Sites | Hypothesis | 2 | 4.78 | 0.030 |
| Error | 12 | |||
| Feeding | Hypothesis | 1 | 23.80 | <0.001 |
| Error | 212 | |||
| Subfamily | Hypothesis | 3 | 12.22 | <0.001 |
| Error | 212 | |||
| Plots | Hypothesis | 12 | 3.32 | <0.001 |
| Error | 212 | |||
Tukey post hoc test between sites for δ15N‰.
| (I) Sites | (J) Sites | Mean Difference (I–J) | Std. Error | p-Value |
|---|---|---|---|---|
| CE | CO | −0.99 | 0.34 | 0.013 |
| PT | −1.41 | 0.43 | 0.004 | |
| CO | PT | −0.42 | 0.42 | 0.580 |
Tukey post hoc test between feeding groups for δ15N‰.
| Feeding Groups | Mean Difference (I–J) | Std. Error | p-Value | |
|---|---|---|---|---|
| I | II | −1.15 | 0.44 | 0.047 |
| III | −4.39 | 0.73 | <0.001 | |
| IV | −6.96 | 0.46 | <0.001 | |
| II | III | −3.24 | 0.67 | <0.001 |
| IV | −5.81 | 0.36 | <0.001 | |
| III | IV | −2.57 | 0.69 | 0.001 |
Tukey post hoc test between subfamilies for δ15N‰.
| (I) Subfamily | (J) Subfamily | Mean Difference (I–J) | Std. Error | p-Value |
|---|---|---|---|---|
| Kalotermitinae | Rhinotermitinae | 0.30 | 0.75 | 0.999 |
| Apicotermitinae | −6.77 | 0.65 | <0.001 | |
| Termitinae | −1.67 | 0.68 | 0.143 | |
| Syntermitinae | −3.80 | 0.83 | <0.001 | |
| Nasutitermitinae | −0.28 | 0.68 | 0.998 | |
| Rhinotermitinae | Apicotermitinae | −7.07 | 0.53 | <0.001 |
| Termitinae | −1.97 | 0.57 | 0.008 | |
| Syntermitinae | −4.10 | 0.74 | <0.001 | |
| Nasutitermitinae | −0.58 | 0.56 | 0.903 | |
| Apicotermitinae | Termitinae | 5.10 | 0.42 | <0.001 |
| Syntermitinae | 2.97 | 0.64 | <0.001 | |
| Nasutitermitinae | 6.49 | 0.42 | <0.001 | |
| Termitinae | Syntermitinae | −2.14 | 0.66 | 0.018 |
| Nasutitermitinae | 1.38 | 0.46 | 0.031 | |
| Syntermitinae | Nasutitermitinae | 3.52 | 0.66 | <0.001 |
Table A6.
Results of generalized linear models (GLM) that best fit the variation in isotope composition of δ13C ‰ in termites within tropical dry forest.
GLM univariate for δ13C‰.
| Source | df | F | p-Value | |
|---|---|---|---|---|
| Intercept | Hypothesis | 1 | 57,708.37 | <0.001 |
| Error | 37 | |||
| Sites | Hypothesis | 2 | 5.32 | 0.022 |
| Error | 12 | |||
| Feeding | Hypothesis | 1 | 9.34 | 0.003 |
| Error | 212 | |||
| Subfamily | Hypothesis | 3 | 14.49 | <0.001 |
| Error | 212 | |||
| Plots | Hypothesis | 12 | 2.13 | 0.016 |
| Error | 212 | |||
Tukey post hoc test between sites for δ13C‰.
| (I) Sites | (J) Sites | Mean Difference (I–J) | Std. Error | p-Value |
|---|---|---|---|---|
| CE | CO | −0.12 | 0.12 | 0.560 |
| PT | −0.91 | 0.15 | <0.001 | |
| CO | PT | −0.79 | 0.15 | <0.001 |
Tukey post hoc test between feeding groups for δ13C‰.
| Feeding Groups | Mean Difference (I–J) | Std. Error | p-Value | |
|---|---|---|---|---|
| I | II | 1.28 | 0.15 | <0.001 |
| III | −0.23 | 0.25 | 0.809 | |
| IV | −0.13 | 0.16 | 0.863 | |
| II | III | −1.51 | 0.23 | <0.001 |
| IV | −1.41 | 0.12 | <0.001 | |
| III | IV | 0.10 | 0.24 | 0.974 |
Tukey post hoc test between subfamilies for δ13C‰.
| (I) Subfamily | (J) Subfamily | Mean Difference (I–J) | Std. Error | p-Value |
|---|---|---|---|---|
| Kalotermitinae | Rhinotermitinae | −0.14 | 0.27 | 0.996 |
| Apicotermitinae | −0.21 | 0.23 | 0.944 | |
| Termitinae | 0.55 | 0.24 | 0.211 | |
| Syntermitinae | 0.26 | 0.29 | 0.950 | |
| Nasutitermitinae | 1.70 | 0.24 | <0.001 | |
| Rhinotermitinae | Apicotermitinae | −0.07 | 0.19 | 0.999 |
| Termitinae | 0.68 | 0.20 | 0.010 | |
| Syntermitinae | 0.40 | 0.26 | 0.656 | |
| Nasutitermitinae | 1.83 | 0.20 | <0.001 | |
| Apicotermitinae | Termitinae | 0.76 | 0.15 | <0.001 |
| Syntermitinae | 0.47 | 0.23 | 0.298 | |
| Nasutitermitinae | 1.91 | 0.15 | <0.001 | |
| Termitinae | Syntermitinae | −0.29 | 0.23 | 0.827 |
| Nasutitermitinae | 1.15 | 0.16 | <0.001 | |
| Syntermitinae | Nasutitermitinae | 1.44 | 0.23 | <0.001 |
Appendix B
Figure A1.
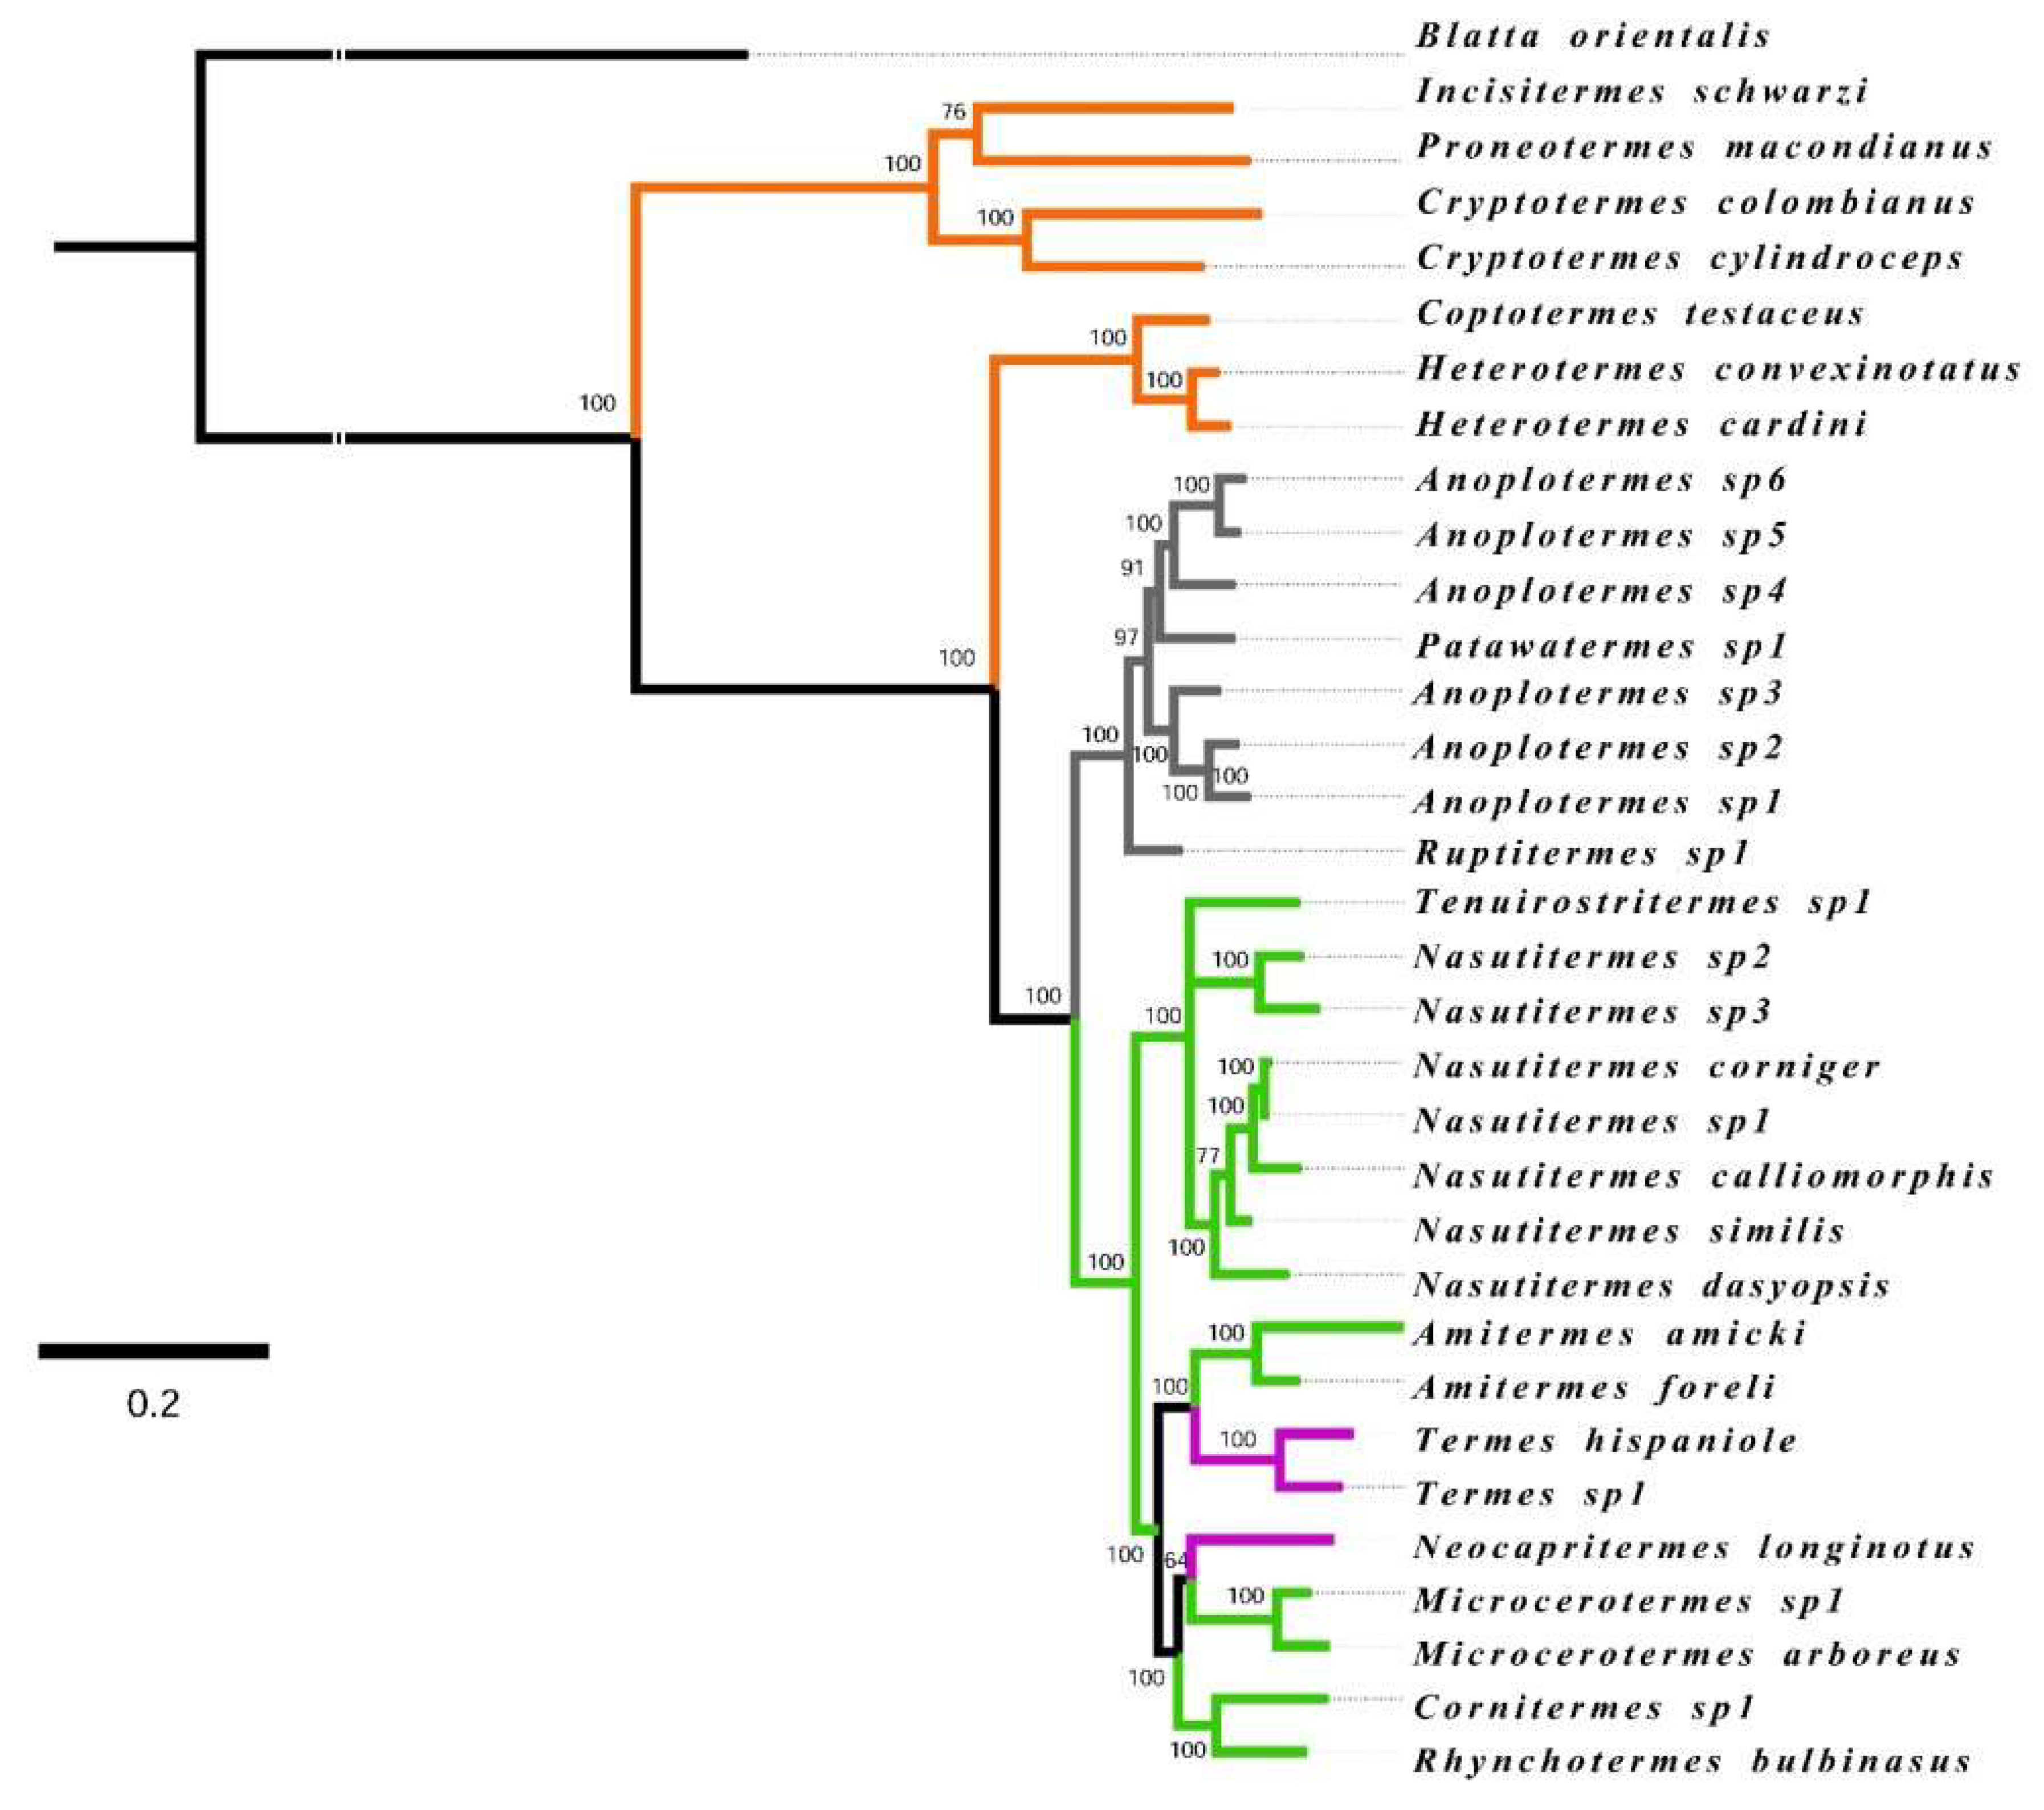
Phylogenetic tree inferred from COII, 12S, and 16S sequence data (nodes show Bayesian posterior probability support, BPP). Red: Kalotermitidae, Blue: Rhinotermitidae, Green: Termitidae. Outgroup: Blatta orientalis.
Figure A1.
Phylogenetic tree inferred from COII, 12S, and 16S sequence data (nodes show Bayesian posterior probability support, BPP). Red: Kalotermitidae, Blue: Rhinotermitidae, Green: Termitidae. Outgroup: Blatta orientalis.

Figure A2.
Scatterplot between δ15N and δ13C. Symbols: Orange square: feeding group I; green circle: feeding group II; purple circle: feeding group III; black circle: feeding group IV.
Figure A2.
Scatterplot between δ15N and δ13C. Symbols: Orange square: feeding group I; green circle: feeding group II; purple circle: feeding group III; black circle: feeding group IV.

Figure A3.
Boxplot showing mean values for (a) δ15N‰ and (b) δ13C‰ +/− 1 SD for soil between sites. Soil samples did not differ significantly between sites for δ15N‰ (ANOVA: F2, 12 = 1.55; p = 0.253) and δ13C‰ (ANOVA: F2, 12 = 1.01; p = 0.391).
Figure A3.
Boxplot showing mean values for (a) δ15N‰ and (b) δ13C‰ +/− 1 SD for soil between sites. Soil samples did not differ significantly between sites for δ15N‰ (ANOVA: F2, 12 = 1.55; p = 0.253) and δ13C‰ (ANOVA: F2, 12 = 1.01; p = 0.391).

Figure A4.
Boxplot showing mean +/− 1 SD for δ15N‰ (a) and δ13C‰ (b) by termite subfamily. Different letters indicate significant differences (p < 0.05).
Figure A4.
Boxplot showing mean +/− 1 SD for δ15N‰ (a) and δ13C‰ (b) by termite subfamily. Different letters indicate significant differences (p < 0.05).

References
- Webb, C.; Ackerly, D.; McPeek, M.; Donoghue, J. Phylogenies and community ecology. Annu. Rev. Ecol. Syst. 2002, 33, 475–505. [Google Scholar] [CrossRef]
- Kraft, N.; Cornwell, W.; Webb, C.; Ackerly, D. Trait evolution, community assembly, and the phylogenetic structure of ecological communities. Am. Nat. 2007, 170, 271–283. [Google Scholar] [CrossRef] [PubMed]
- Emerson, B.; Gillespie, R. Phylogenetic analysis of community assembly and structure over space and time. Trends Ecol. Evol. 2008, 23, 619–630. [Google Scholar] [CrossRef]
- Cavender-Bares, J.; Kozak, K.; Fine, P.; Kembel, S. The merging of community ecology and phylogenetic biology. Ecol. Lett. 2009, 12, 693–715. [Google Scholar] [CrossRef] [Green Version]
- Webb, C.; Ackerly, D.; Kembel, S. Phylocom: Software for the analysis of phylogenetic community structure and trait evolution. Bioinformatics 2008, 24, 2098–2100. [Google Scholar] [CrossRef] [PubMed]
- Weiher, E.; Freund, D.; Bunton, T.; Stefanski, A.; Lee, T.; Bentivenga, S. Advances, challenges and a developing synthesis of ecological community assembly theory. Philos. Trans. R. Soc. Lond. B Biol. Sci. 2011, 366, 2403–2413. [Google Scholar] [CrossRef] [PubMed] [Green Version]
- Hubbell, S. The Unified Neutral Theory of Biodiversity and Biogeography; Princeton University Press: Princeton, NJ, USA, 2001; p. 392. ISBN 9780691021287. [Google Scholar]
- Diamond, J. Assembly of Species Communities. In Ecology and Evolution of Communities; Cody, M.L., Diamond, J., Eds.; Belknap Press of Harvard University Press: Cambridge, MA, USA, 1975; pp. 342–444. ISBN 9780674224445. [Google Scholar]
- Tilman, D. Resource Competition and Community Structure; Princeton University Press: Princeton, NJ, USA, 1982; p. 296. ISBN 9780691083025. [Google Scholar]
- Hebert, P.; Cywinska, A.; Ball, S.; Dewaard, J. Biological identification through DNA barcodes. Proc. R. Soc. Lond. B 2003, 270, 313–321. [Google Scholar] [CrossRef]
- Delgado-Salinas, A.; Dexter, K.; Linares-Palomino, R.; Oliveira-Filho, A.; Prado, D.; Pullan, M.; Quintana, C.; Riina, R.; Rodríguez, M.G.M.; Weintritt, J.; et al. Plant diversity patterns in neotropical dry forests and their conservation implications. Science 2016, 353, 1383–1387. [Google Scholar] [CrossRef] [Green Version]
- Hausberger, J.; Korb, J. The impact of anthropogenic disturbance on assembly patterns of termite communities. Biotropica 2016, 48, 356–364. [Google Scholar] [CrossRef]
- Schyra, J.; Korb, J. Termite communities along a disturbance gradient in a West African savanna. Insects 2019, 10, 17. [Google Scholar] [CrossRef]
- Miles, L.; Newton, A.; DeFries, R.; Ravilious, C.; May, I.; Blyth, S.; Kapos, V.; Gordon, J. A global overview of the conservation status of tropical dry forests. J. Biogeogr. 2006, 33, 491–505. [Google Scholar] [CrossRef]
- Portillo-Quintero, C.; Sánchez, G. Extent and conservation of tropical dry forests in the Americas. Biol. Conserv. 2010, 143, 144–155. [Google Scholar] [CrossRef]
- Instituto de Investigación Alexander von Humboldt. El Bosque Seco Tropical en Colombia; Pizano, C., García, H., Eds.; Instituto de Investigación Alexander von Humboldt: Bogotá, Colombia, 2014; p. 353. ISBN 978-958-8343-97-6. [Google Scholar]
- Bignell, D.; Eggleton, P. Termites in ecosystems. In Termites: Evolution, Sociality, Symbioses, Ecology; Abe, T., Bignell, D., Higashi, M., Eds.; Kluwer Academic Publishers: Dordrecht, The Netherlands, 2000; pp. 363–387. ISBN 978-94-017-3223-9. [Google Scholar]
- Jones, D.; Eggleton, P. Global Biogeography of Termites: A Modern Synthesis; Bignell, D., Rosin, Y., Lo, N., Eds.; Springer: New York, NY, USA, 2010; pp. 477–498. ISBN 978-90-481-3977-4. [Google Scholar]
- Bodot, P. Destruction of the nests of termites, Bellicositermes natalensis Hay., by an ant, Dorylus (Typhlopone) dentifrons Wasmann. Compt. Rend. Hebd. Séances Acad. Sci. 1961, 253, 3053–3054. [Google Scholar]
- Petrakova, L.; Lıznarova, E.; Pekar, S.; Haddad, C.; Sentenska, L.; Symondson, W. Discovery of a monophagous true predator, a specialist termite-eating spider (Araneae: Ammoxenidae). Sci. Rep. 2015, 5, 14013. [Google Scholar] [CrossRef] [Green Version]
- Mirco, S.; Ketterl, J.; Di-Bernardo, M.; Kwet, A. Ants and termites are the diet of the microhylid frog Elachistocleis ovalis (Schneider, 1799) at an Araucaria forest in Rio Grande do Sul, Brazil. Herpetol. Bull. 2002, 79, 14–17. [Google Scholar]
- Abensperg-Traun, M.; Steven, D. Ant- and termite-eating in Australian mammals and lizards: A comparison. Aust. J. Ecol. 1997, 22, 9–17. [Google Scholar] [CrossRef]
- Mcgrew, W.; Marchant, L. Chimpanzees, tools and termites: Hand preference or handedness? Curr. Anthropol. 1992, 33, 114–119. [Google Scholar] [CrossRef]
- Wood, T.G.; Sands, W.A. The role of termites in ecosystems. In Production Ecology of Ants and Termites; Brian, M.V., Ed.; Cambridge University Press: Cambridge, UK, 1978; pp. 245–292. ISBN 0521107148. [Google Scholar]
- Collins, N.M. Termite populations and their role in litter removal in Malaysian rain forests. In Tropical Rain Forest: Ecology and Management; Sutton, S.L., Whitmore, T.C., Chadwick, A.C., Eds.; Blackwell Science: Oxford, UK, 1983; pp. 311–325. ISBN 0632011424. [Google Scholar]
- Casalla, R.; Korb, J. Termite diversity in Neotropical dry forests of Colombia and the potential role of rainfall in structuring termite diversity. Biotropica 2019, 51, 165–177. [Google Scholar] [CrossRef]
- Donovan, S.E.; Eggleton, P.; Bignell, D.E. Gut content analysis and a new feeding group classification of termites. Ecol. Entmol. 2001, 26, 356–366. [Google Scholar] [CrossRef]
- Eggleton, P.; Tayasu, I. Feeding groups, lifetypes and the global ecology of termites. Ecol. Res. 2001, 16, 941–960. [Google Scholar] [CrossRef]
- Dahlsjö, C.; Parr, C.; Malhi, Y.; Meir, P.; Eggleton, P. Describing termite assemblage structure in a Peruvian lowland tropical rain forest: A comparison of two alternative methods. Insectes Soc. 2014, 62, 141–150. [Google Scholar] [CrossRef]
- Tayasu, I.; Abe, T.; Eggleton, P.; Bignell, D. Nitrogen and carbon isotope ratios in termites: An indicator of trophic habit along the gradient from wood-feeding to soil-feeding. Ecol. Entomol. 1997, 22, 343–351. [Google Scholar] [CrossRef]
- Florencio, F.D.; Marins, A.; Rosa, S.C.; Cristaldo, P.F.; Albano Araújo, A.P.; Silva, I.R.; DeSouza, O. Diet segregation between cohabiting builder and inquiline termite species. PLoS ONE 2013, 8, e66535. [Google Scholar] [CrossRef]
- Bourguignon, T.; Šobotník, J.; Lepoint, G.; Martin, J.; Roisin, Y. Niche differentiation among neotropical soldierless soil-feeding termites revealed by stable isotope ratios. Soil Biol. Biochem. 2009, 41, 2038–2043. [Google Scholar] [CrossRef]
- Boutton, T.; Arshad, M.; Tieszen, L. Stable isotope analysis of termite food habits in East African grasslands. Oecologia 1983, 59, 1–6. [Google Scholar] [CrossRef]
- Tayasu, I.; Nakamura, T.; Oda, H.; Hyodo, F.; Takematsu, Y.; Abe, T. Termite ecology in a dry evergreen forest in Thailand in terms of stable (δ13C and δ15N) and radio (14C, 137Cs and 210Pb) isotopes. Ecol. Res. 2002, 17, 195–206. [Google Scholar] [CrossRef]
- Lepage, M.; Abbadie, L.; Marriotti, A. Food habits of sympatric termite species (Isoptera, Macrotermitinae) as determined by stable carbon isotope analysis in a Guinean savanna (Lamto, CBte d’voire). J. Trop. Ecol. 1993, 9, 303–311. [Google Scholar]
- Tayasu, I.; Hyodo, F.; Takematsu, Y.; Sugimoto, A.; Inoue, T.; Kirtibutr, N.; Abe, T. Stable isotope ratios and uric acid preservation in termites belonging to three feeding habits in Thailand. Isot. Environ. Health Stud. 2000, 36, 259–272. [Google Scholar] [CrossRef]
- Tayasu, I.; Hyodo, F.; Abe, T. Caste-specific N and C isotope ratios in fungus-growing termites with special reference to uric acid preservation and their nutritional interpretation. Ecol. Entomol. 2002, 27, 355–361. [Google Scholar] [CrossRef] [Green Version]
- Instituto Nacional de los Recursos Naturales Renovables y del Ambiente. Acuerdo 0028 del 6 de Julio 1983. Por el Cual se Declara Área de Reserva Forestal Protectora, la Serranía de Coraza y Montes de María (Serranía de San Jacinto), Ubicada en Jurisdicción de los Municipios de Toluviejo, Colosó y Chalán (Departamento de Sucre); Instituto Nacional de los Recursos Naturales Renovables y del Ambiente: Bogotá, Colombia, 1983; 6p. [Google Scholar]
- Corporación Autónoma Regional Del Canal del Dique. Acuerdo No 0004 27 Nov 2013. Declaratoria Parque Natural Regional Bosque Seco El Ceibal Mono Tití; Corporación Autónoma Regional Del Canal del Dique: Santa Catalina, Bolívar, Colombia, 2013; 60p. [Google Scholar]
- Instituto Colombiano para la Reforma Agraria. Resolución Nº 191 Declaratoria Parque Nacional Natural Tayrona; Instituto Colombiano para la Reforma Agraria: Bogota, Colombia, 1964; 2p. [Google Scholar]
- Carbonó, E. Terrestrial vegetation at Neguanje cove, Tayrona National Natural Park (Magdalena, Colombia). Caldasia 2010, 32, 235–256. [Google Scholar]
- Gentry, A. Diversity and floristic composition of Neotropical dry forests. In Seasonally Dry Tropical Forests; Bullock, S.H., Mooney, H., Medina, E., Eds.; Cambridge University Press: Cambridge, UK, 1995; pp. 146–194. ISBN 9780511753398. [Google Scholar]
- Jones, D.; Eggleton, P. Sampling termite assemblages in tropical forests: Testing a rapid biodiversity assessment protocol. J. Appl. Ecol. 2000, 37, 191–203. [Google Scholar] [CrossRef]
- Hausberger, B.; Korb, J. A phylogenetic community approach for studying termite communities in a West African savannah. Biol. Lett. 2015, 11, 20150625. [Google Scholar] [CrossRef] [Green Version]
- Tayasu, I.; Sugimoto, A.; Wada, E.; Abe, T. Xylophagous termites depending on atmospheric nitrogen. Naturwissenschaften 1994, 81, 229–231. [Google Scholar] [CrossRef]
- Tayasu, I.; Inoue, T.; Miller, L.; Sugimoto, A.; Takeichi, S.; Abe, T. Confirmation of soil-feeding termites (Isoptera; Termitidae; Termitinae) in Australia using stable isotope ratios. Funct. Ecol. 1998, 12, 536–542. [Google Scholar] [CrossRef] [Green Version]
- Pansu, M.; Gautheyrou, J. Hand Book of Soil Analysis; Springer-Verlag: Berlin, Germany, 2006; 993p. [Google Scholar]
- Osorio, N. Muestra de Suelos; Universidad Nacional de Colombia: Medellín, Colombia, 2012; pp. 1–4. [Google Scholar]
- Ronquist, F.; Huelsenbeck, J. MrBayes 3: Bayesian phylogenetic inference under mixed models. Bioinformatics 2003, 19, 1572–1574. [Google Scholar] [CrossRef] [Green Version]
- Gotelli, N.; Entsminger, G. Swap algorithms in null model analysis. Ecology 2003, 84, 532–535. [Google Scholar] [CrossRef]
- Maddison, W. Squared-change parsimony reconstructions of ancestral states for continuous-valued characters on a phylogenetic tree. Syst. Zool. 1991, 40, 304–314. [Google Scholar] [CrossRef]
- Maddison, W.; Maddison, D.R. Mesquite: A Modular System for Evolutionary Analysis. Version 3.51. 2018. Available online: http://www.mesquiteproject.org (accessed on 15 November 2018).
- Allen, K.; Dupuy, J.; Gei, M.; Hulshof, C.; Medvigy, D.; Pizano, C.; Salgado-Negret, B.; Smith, B.M.; Trierweiler, A.; Van Bloem, S.J.; et al. Will seasonally dry tropical forests be sensitive or resistant to future changes in rainfall regimes? Environ. Res. Lett. 2017, 12, 23001. [Google Scholar] [CrossRef] [Green Version]
- Olascuaga-Vargas, D.; Mercado-Gómez, J.; Sanchez-Montaño, L. Analysis of successional vegetation in a tropical dry forest fragment in Toluviejo-Sucre (Colombia). Colomb. For. 2015, 19, 23–40. [Google Scholar] [CrossRef]
- Rodríguez, G. Inventario Florístico de un Bosque seco Tropical (Bs-T) en la Hacienda “El Ceibal”, Santa Catalina, Bolívar, con Énfasis en las Especies Asociadas a la Dieta del Tití Cabeciblanco (Saguinus oedipus). Bachelor’s Thesis, Universidad Nacional de Colombia, Bogotá, Colombia, 2001. [Google Scholar]
- Rodríguez, G.; Banda-R., K.; Reyes, S.; Estupiñán, A. Lista comentada de las plantas vasculares de bosques secos prioritarios para la conservación en los departamentos de Atlántico y Bolívar (Caribe colombiano). Biota Colomb. 2012, 13, 7–39. [Google Scholar]
- Korb, J.; Linsenmair, K.E. The causes of spatial patterning of mounds of a fungus-growing termite: Results from nearest neighbour analysis and ecological studies. Oecologia 2001, 127, 324–333. [Google Scholar] [CrossRef]
- Korb, J.; Linsenmair, K.E. Resource availabiliy and distribution patterns, indicators of competition between Macrotermes bellicosus and other macro-detritores in the Comoé National Park, Cote d’Ivoire. Afr. J. Ecol. 2001, 39, 257–265. [Google Scholar] [CrossRef]
- Leponce, M.; Roisin, Y.; Pasteels, J.M. Intraspecific interactions in a community of arboreal nesting termites (Isoptera: Termitidae). J. Insect Behav. 1996, 9, 799–817. [Google Scholar] [CrossRef]
- Bourguignon, T.; Leponce, M.; Roisin, Y. Beta-diversity of termite assemblages among primary French Guiana rain forests. Biotropica 2011, 43, 473–479. [Google Scholar] [CrossRef]
- Korb, J.; Foster, K.R. Ecological competition favours cooperation in termite societies. Ecol. Lett. 2010, 13, 754–760. [Google Scholar] [CrossRef]
- Valladares, C. Ensamblaje de Comunidades de Termitas (Blattodea: Isoptera) en dos Bosques Tropicales Amazónicos de Ecuador, Parque Nacional. Yasuní y Parque Nacional Podocarpus. Master’s Thesis, Universidad Técnica de Loja, Loja, Ecuador, 2016. [Google Scholar]
- Palin, O.; Eggleton, P.; Malhi, Y.; Girardin, C.; Rozas-Dávila, A.; Parr, C. Termite diversity along an Amazon–Andes elevation gradient, Perú. Biotropica 2011, 43, 100–107. [Google Scholar] [CrossRef]
- Davies, R.; Hernández, L.; Eggleton, P.; Didham, R.; Fagan, L.; Winchester, N. Environmental and spatial influences upon species composition of a termite assemblage across neotropical forest islands. J. Trop. Ecol. 2003, 19, 509–524. [Google Scholar] [CrossRef]
- Dosso, K.; Deligne, J.; Yeó, K.; Konate, S.; Linsenmair, K. Changes in the termite assemblage across a sequence of land-use systems in the rural area around lamto reserve in central cote d’ivoire. J. Insect Conserv. 2013, 17, 1047–1057. [Google Scholar] [CrossRef]
- Gathorne-Hardy, F.; Syaukani, F.; Eggleton, P. The effects of altitude and rainfall on the composition of the termites (Isoptera) of the Leuser ecosystem (Sumatra, Indonesia). J. Trop. Ecol. 2001, 17, 379–393. [Google Scholar] [CrossRef]
- Vasconcellos, A.; Bandeira, A.; Moura, F.; Araujo, V.; Gusmão, M.; Constantino, R. Termite assemblages in three habitats under different disturbance regimes in the semi-arida Caatinga of NE Brazil. J. Arid Environ. 2010, 74, 298–302. [Google Scholar] [CrossRef]
- Viana, A.; Souza, V.; Reis, Y.; Costa, A. Termite assemblages in dry tropical forests of Northeastern Brazil: Are termites bioindicators of environmental disturbances? Sociobiology 2014, 61, 324–331. [Google Scholar]
- Su, N.; Scheffrahn, R. Intra-and interspecific competition of the Formosan and the Eastern subterranean termite: Evidence from field observations (Isoptera: Rhinotermitidae). Sociobiology 1988, 14, 157–164. [Google Scholar]
- Leponce, M.; Roisin, Y.; Pasteels, J. Structure and dynamics of the arboreal termite community in New Guinean coconut plantations. Biotropica 1997, 29, 193–203. [Google Scholar] [CrossRef]
- Schyra, J.; Scheu, S.; Korb, J. Cryptic niche differentiation in West African savannah termites as indicated by stable isotopes: Niche differentiation in termites. Ecol. Entomol. 2018. [Google Scholar] [CrossRef]
- Goldstein, G.; Drake, D.; Alpha, C.; Melcher, P.; Heraux, J.; Azocar, A. Growth and photosynthetic responses of Scaevola sericea, a Hawaiian coastal shrub, to substrate salinity and salt spray. Int. J. Plant. Sci. 1996, 157, 171–179. [Google Scholar] [CrossRef]
- Diefendorf, A.; Mueller, K.; Wing, S.; Koch, P.; Freeman, K. Global patterns in leaf 13C discrimination and implications for studies of past and future climate. Proc. Natl. Acad. Sci. USA 2010, 107, 5738–5743. [Google Scholar] [CrossRef] [Green Version]
- Tayasu, I. Use of carbon and nitrogen isotope ratios in termite research. Ecol. Res. 1998, 13, 377–387. [Google Scholar] [CrossRef]
Figure 1.
Study sites in Colombia: Reserva forestal de Coraza, Montes de María, Colosó, Sucre (green square); Parque Natural regional Bosque seco El Ceibal Mono Titi, Santa Catalina, Bolívar (blue square); and Parque Nacional Natural Tayrona, Santa Marta, Magdalena (red square).
Figure 1.
Study sites in Colombia: Reserva forestal de Coraza, Montes de María, Colosó, Sucre (green square); Parque Natural regional Bosque seco El Ceibal Mono Titi, Santa Catalina, Bolívar (blue square); and Parque Nacional Natural Tayrona, Santa Marta, Magdalena (red square).

Figure 2.
NRI (Net Relatedness Index) of study sites in Colombia. High positive values indicate phylogenetic clustering, while negative values indicate phylogenetic overdispersion. Shown are bars with mean (+/− 1 SD). Different letters indicate significant differences (ANOVA: F2, 12 = 15.75; and p = 0.011, p < 0.001 respectively, Tukey p < 0.001, Table A3a).

Figure 3.
Pearson correlations between Net Related Index of study plots and (a) rainfall (mm year−1), r = 0.862, p < 0.001; (b) elevation r = 0.626, p < 0.012; and (c) temperature (°C) r = −0.648, p = 0.009.
Figure 3.
Pearson correlations between Net Related Index of study plots and (a) rainfall (mm year−1), r = 0.862, p < 0.001; (b) elevation r = 0.626, p < 0.012; and (c) temperature (°C) r = −0.648, p = 0.009.

Figure 4.
Isotope signatures of δ15N and δ13C between study sites. Shown are mean values +/− 1 SD for termite (a) δ15N‰ and (b) δ13C‰ and litter (c) δ15N‰ and (d) δ13C‰ over all three sites: Colosó, Ceibal, and Tayrona. Different letters indicate significant differences between sites (Tukey test, p < 0.05).

Figure 5.
Difference in isotope signatures between feeding groups. Shown are mean values +/− 1 SD for (a) δ15N‰ and (b) δ13C‰ between the four feeding groups: I: dead wood-feeders; II: dead wood, leaf, plant-litter feeders; III: humus feeders; and IV: true soil feeders. Different letters indicate significant differences in litter samples (p < 0.05, Table A3 and Table A4).

Figure 6.
Phylogenetic relationships between the studied termites and their associated δ15N and δ13C signatures, together with that of litter and soil. Bootstrap values close to nodes. (a) Shown are bars with mean for δ15N‰ +/− 1 SD over all three study sites. (b) Bars with mean for δ13C‰ +/− 1 SD over all three study sites. Orange: Feeding group I, Green: Feeding Group II, Purple: Feeding group III, Grey: Feeding group IV. Families: K: Kalotermitidae, R: Rhinotermitidae, and T: Termitidae. Subfamilies: Ap: Apicotermitinae, Na: Nasutitermitinae, Te: Termitinae, and Sy: Syntermitinae.

Figure 7.
(a) Mirrored phylogenetic trees for a subset of 32 termites species, showing parsimony reconstruction of quantitative δ15N values from tropical dry forest termites (left-side tree) compared to quantitative δ13C (right-side tree), (b) ancestral states for categorical feeding groups based on Donovan et al., 2001 [25]; Dark blue represents feeding group I, light blue represents feeding group II (down-side tree), green represents feeding group III, and red represents feeding group IV. Ancestral states represented by colors at the nodes of the phylogeny observed at the tips are circled at each node. Families: K: Kalotermitidae, R: Rhinotermitidae, and T: Termitidae. Subfamilies: Ap: Apicotermitinae, Na: Nasutitermitinae, Te: Termitinae, and Sy: Syntermitinae.

Table 1.
Estimates of the mixed effect model of NRI and the three abiotic variables rainfall, elevation, and temperature. The random variable “Sites” was not considered within the model, and variability was insignificant (standard deviation = 2.30e−05).
Table 1.
Estimates of the mixed effect model of NRI and the three abiotic variables rainfall, elevation, and temperature. The random variable “Sites” was not considered within the model, and variability was insignificant (standard deviation = 2.30e−05).
| Variable | Estimate | Standard Error | df | t-Value | p-Value |
|---|---|---|---|---|---|
| Intercept | 0.787 | 0.142 | 9 | 5.55 | <0.001 |
| Rainfall | 0.885 | 0.290 | 9 | 3.05 | 0.014 |
| Temperature | 0.395 | 0.437 | 9 | 0.90 | 0.391 |
| Elevation | 0.263 | 0.352 | 9 | 0.74 | 0.475 |
© 2019 by the authors. Licensee MDPI, Basel, Switzerland. This article is an open access article distributed under the terms and conditions of the Creative Commons Attribution (CC BY) license (http://creativecommons.org/licenses/by/4.0/).
Share and Cite
MDPI and ACS Style
Casalla Daza, R.; Korb, J. Phylogenetic Community Structure and Niche Differentiation in Termites of the Tropical Dry Forests of Colombia. Insects 2019, 10, 103. https://0-doi-org.brum.beds.ac.uk/10.3390/insects10040103
AMA Style
Casalla Daza R, Korb J. Phylogenetic Community Structure and Niche Differentiation in Termites of the Tropical Dry Forests of Colombia. Insects. 2019; 10(4):103. https://0-doi-org.brum.beds.ac.uk/10.3390/insects10040103
Chicago/Turabian StyleCasalla Daza, Robin, and Judith Korb. 2019. "Phylogenetic Community Structure and Niche Differentiation in Termites of the Tropical Dry Forests of Colombia" Insects 10, no. 4: 103. https://0-doi-org.brum.beds.ac.uk/10.3390/insects10040103
Note that from the first issue of 2016, this journal uses article numbers instead of page numbers. See further details here.