
Spatio-Temporal Distribution and Fixed-Precision Sampling Plan of Scirtothrips dorsalis (Thysanoptera: Thripidae) in Florida Blueberry


Abstract
:Simple Summary
Abstract
1. Introduction
2. Materials and Methods
2.1. Field Surveys
2.2. Statistical Analysis
2.3. Spatial Analysis
2.4. Sampling Plan
3. Results
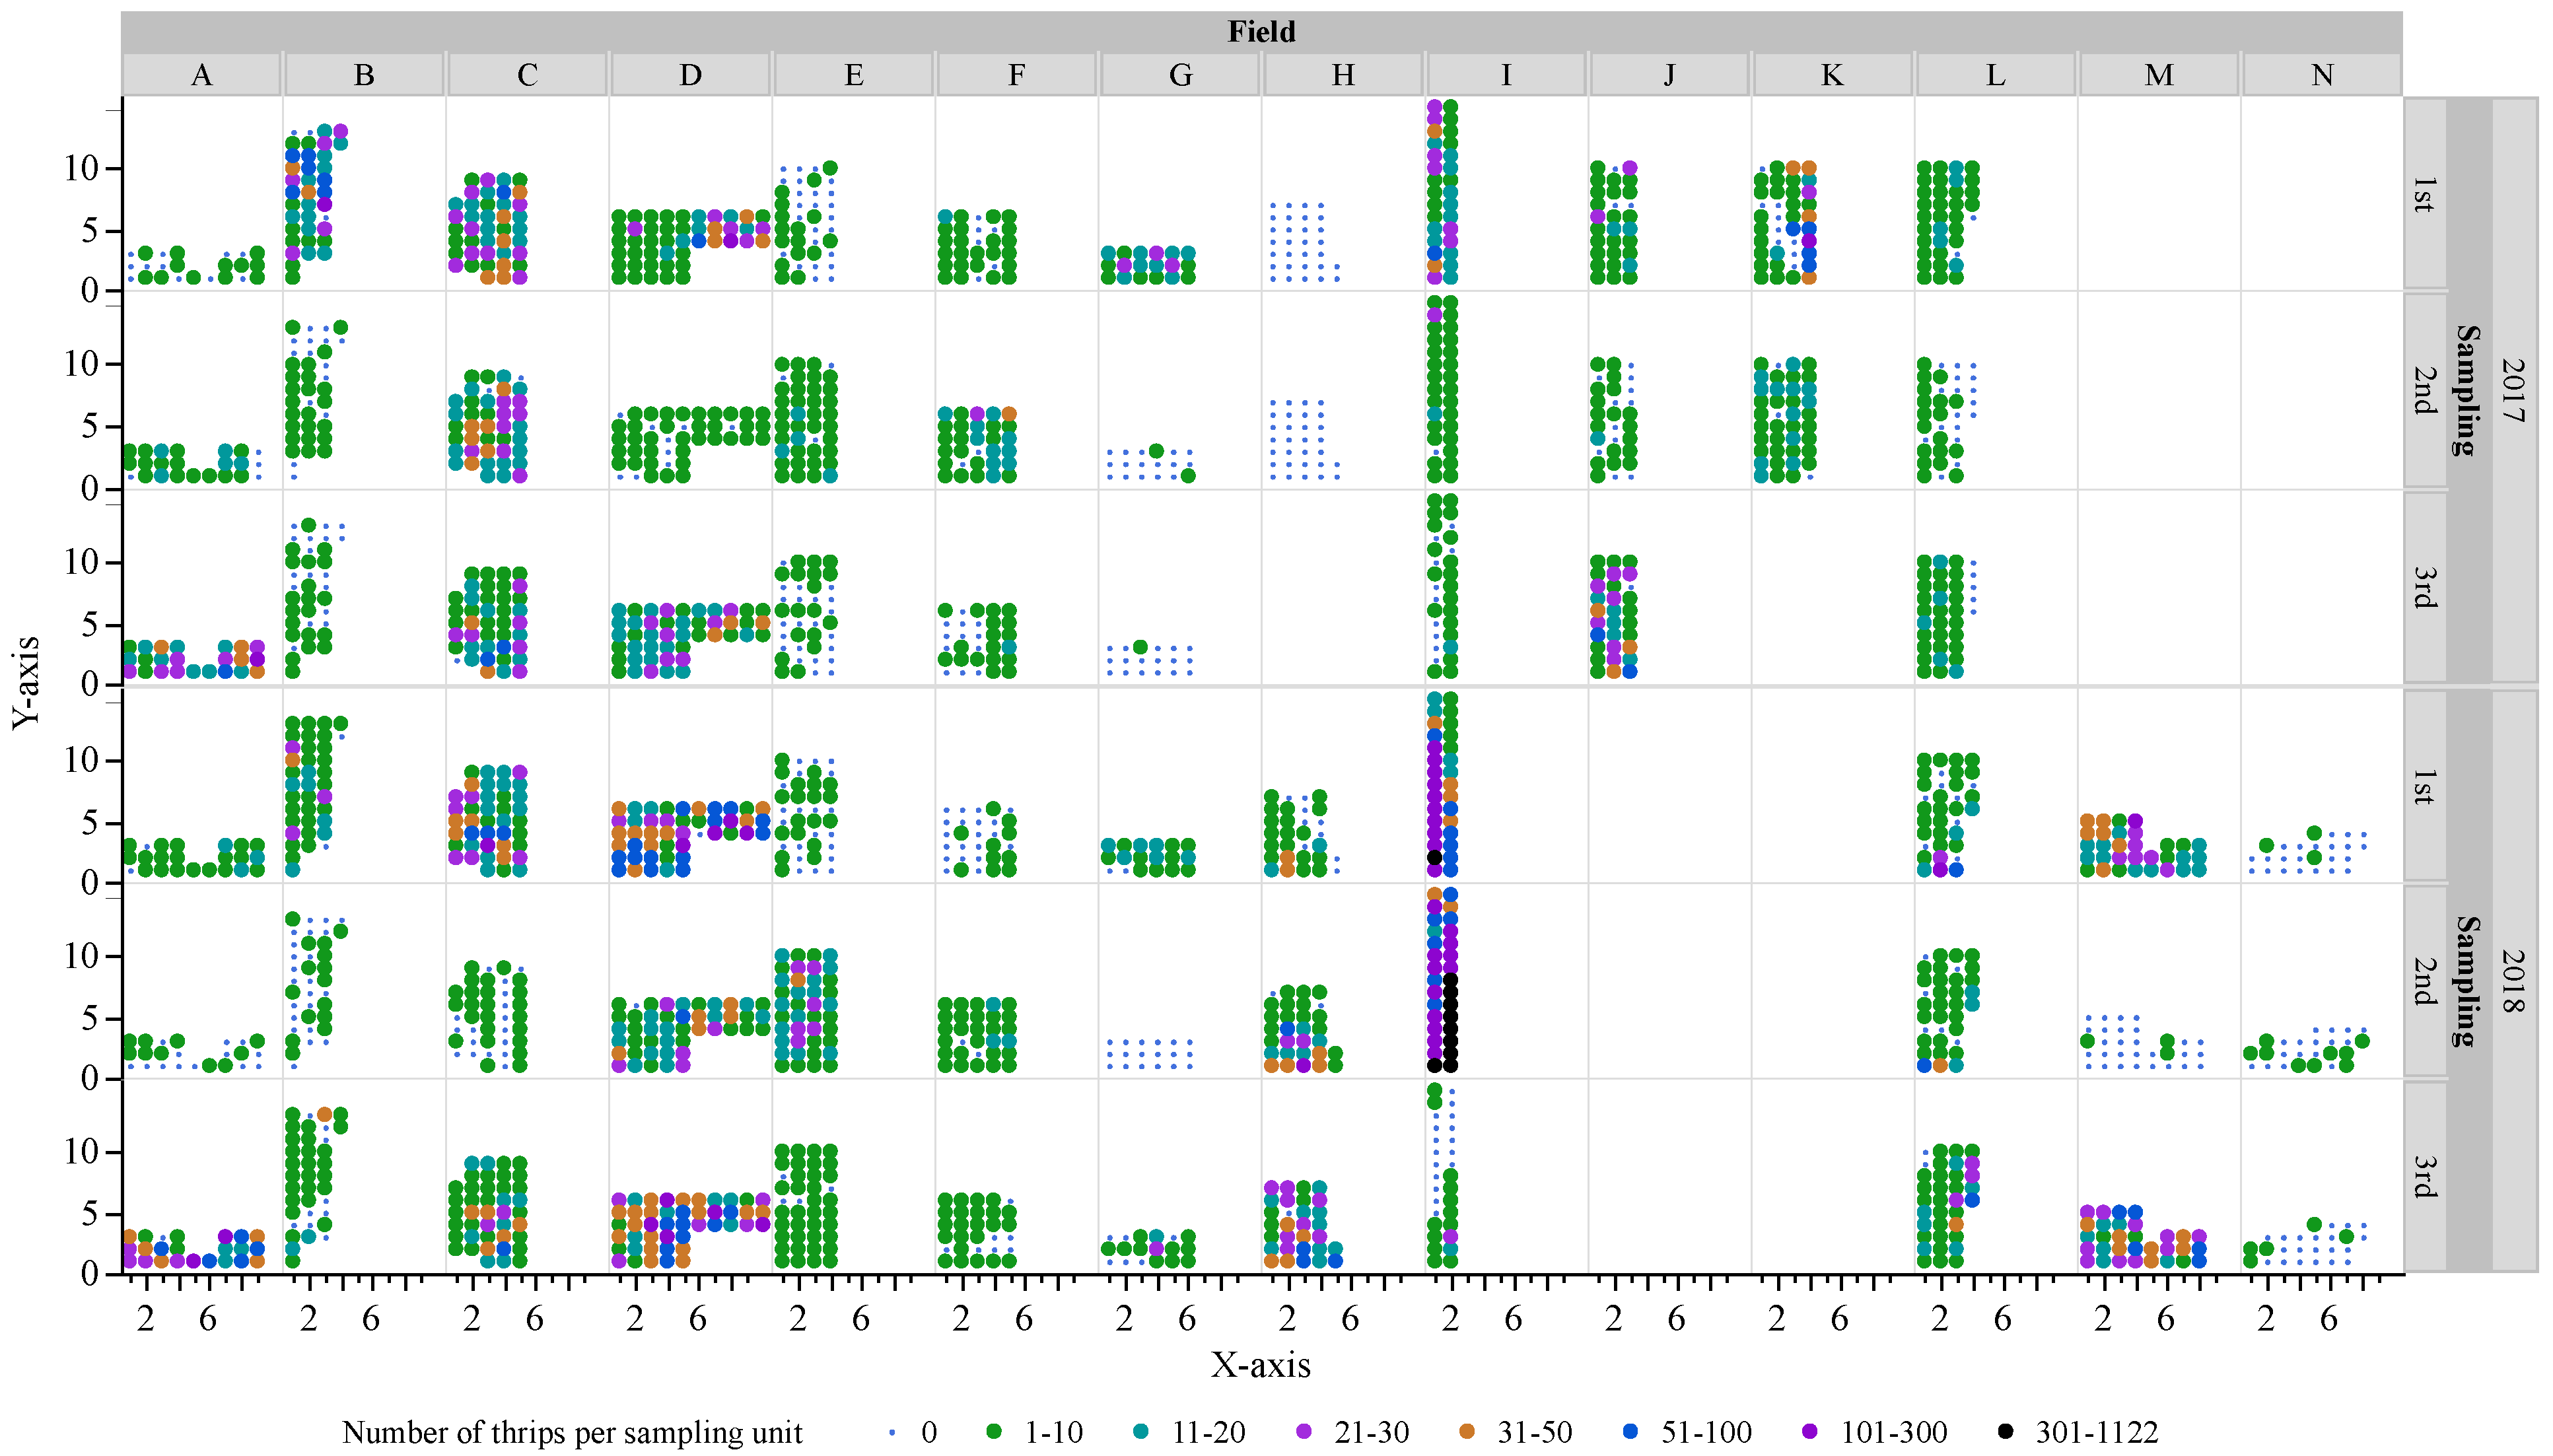
3.1. Field Surveys
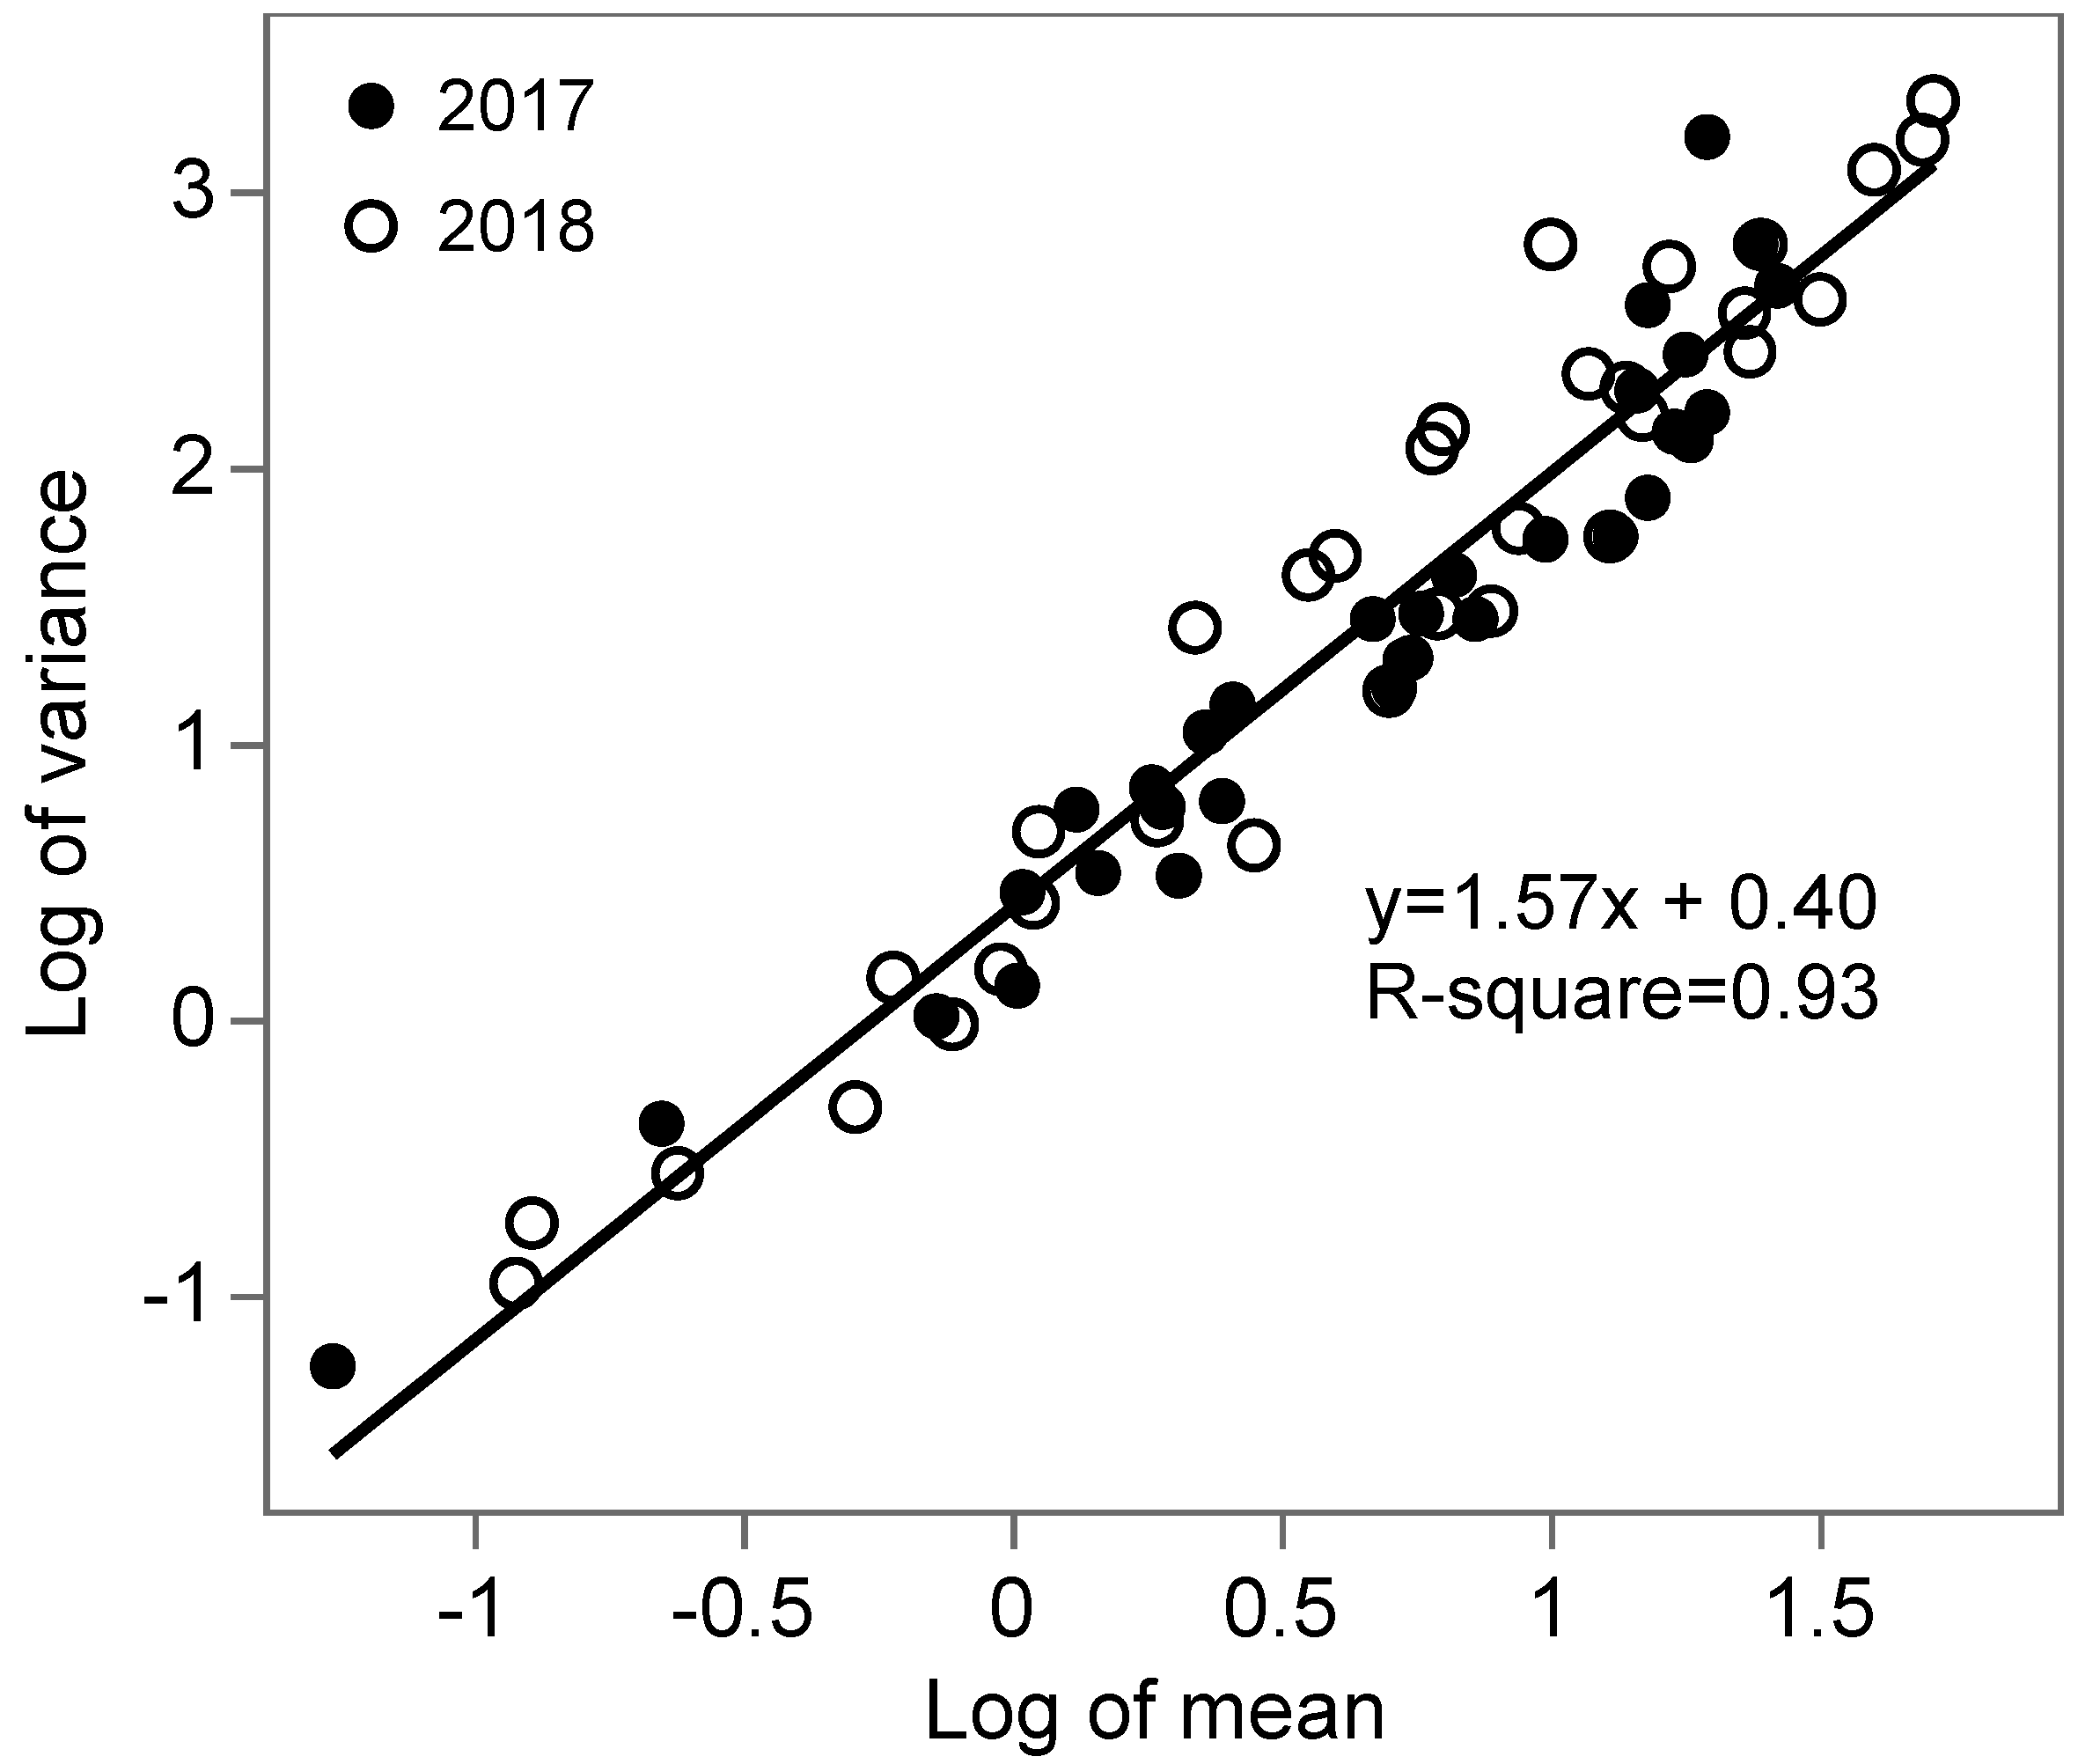
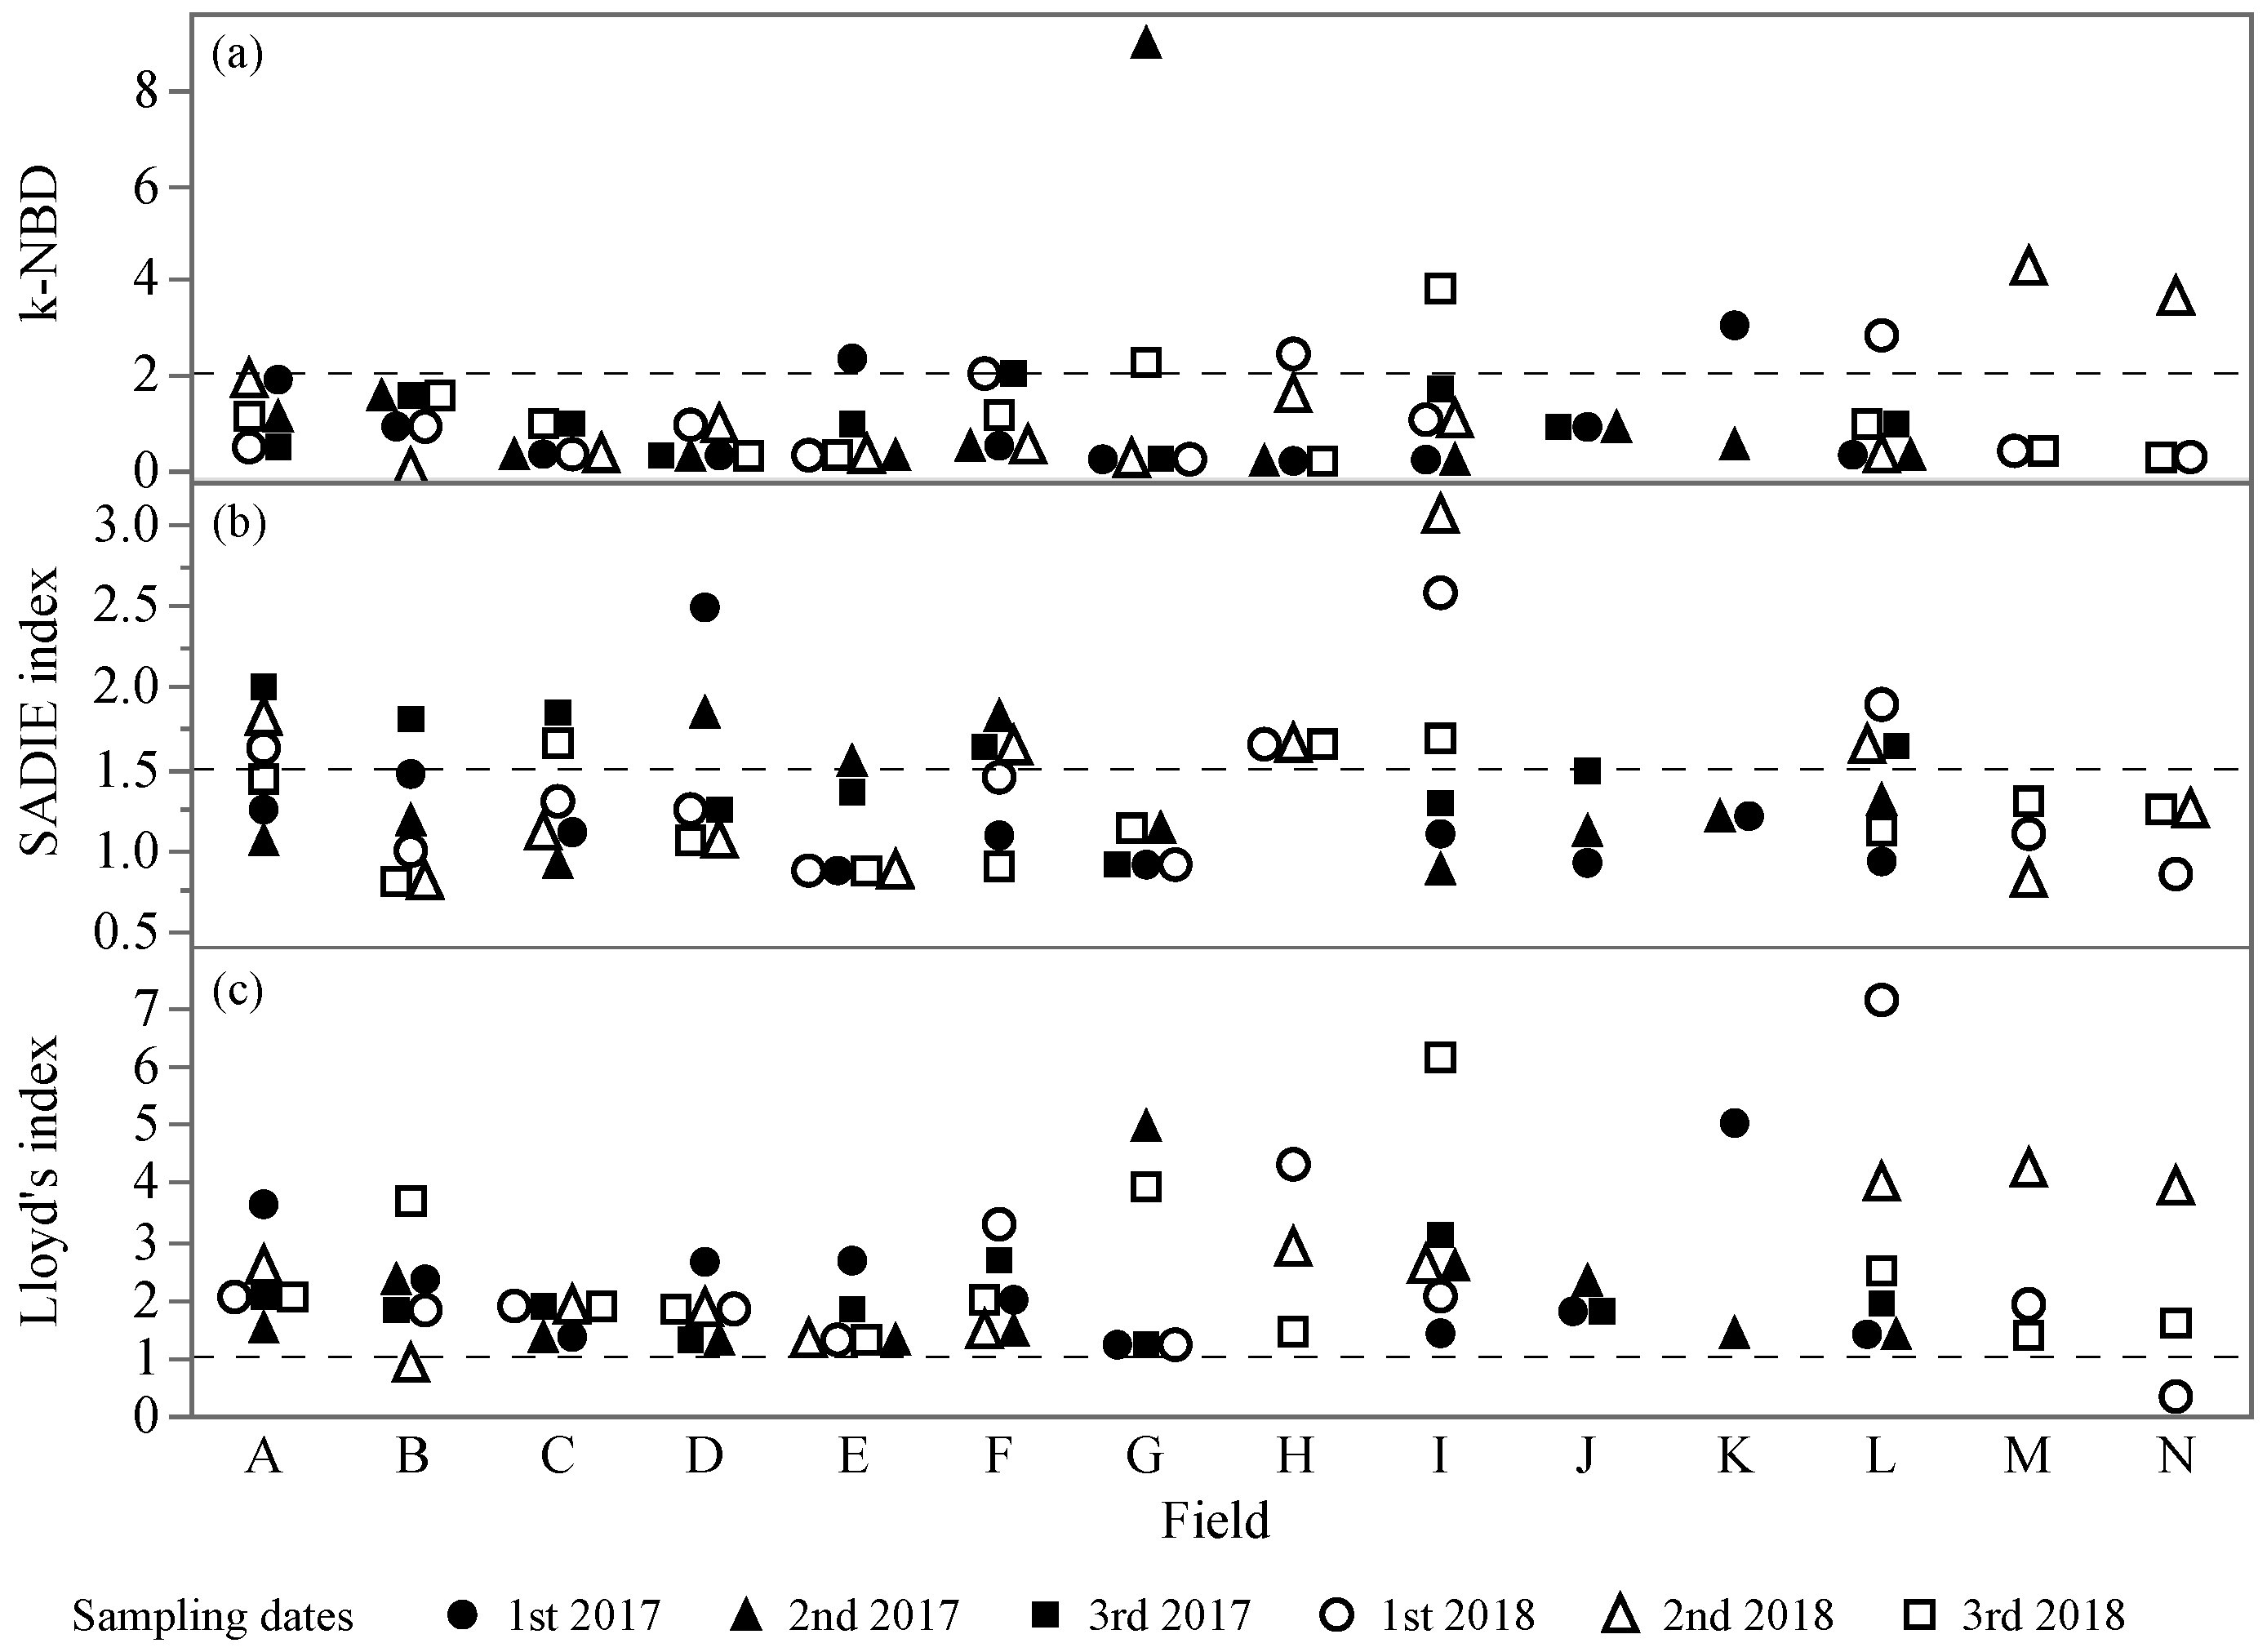
3.2. Spatial Analysis
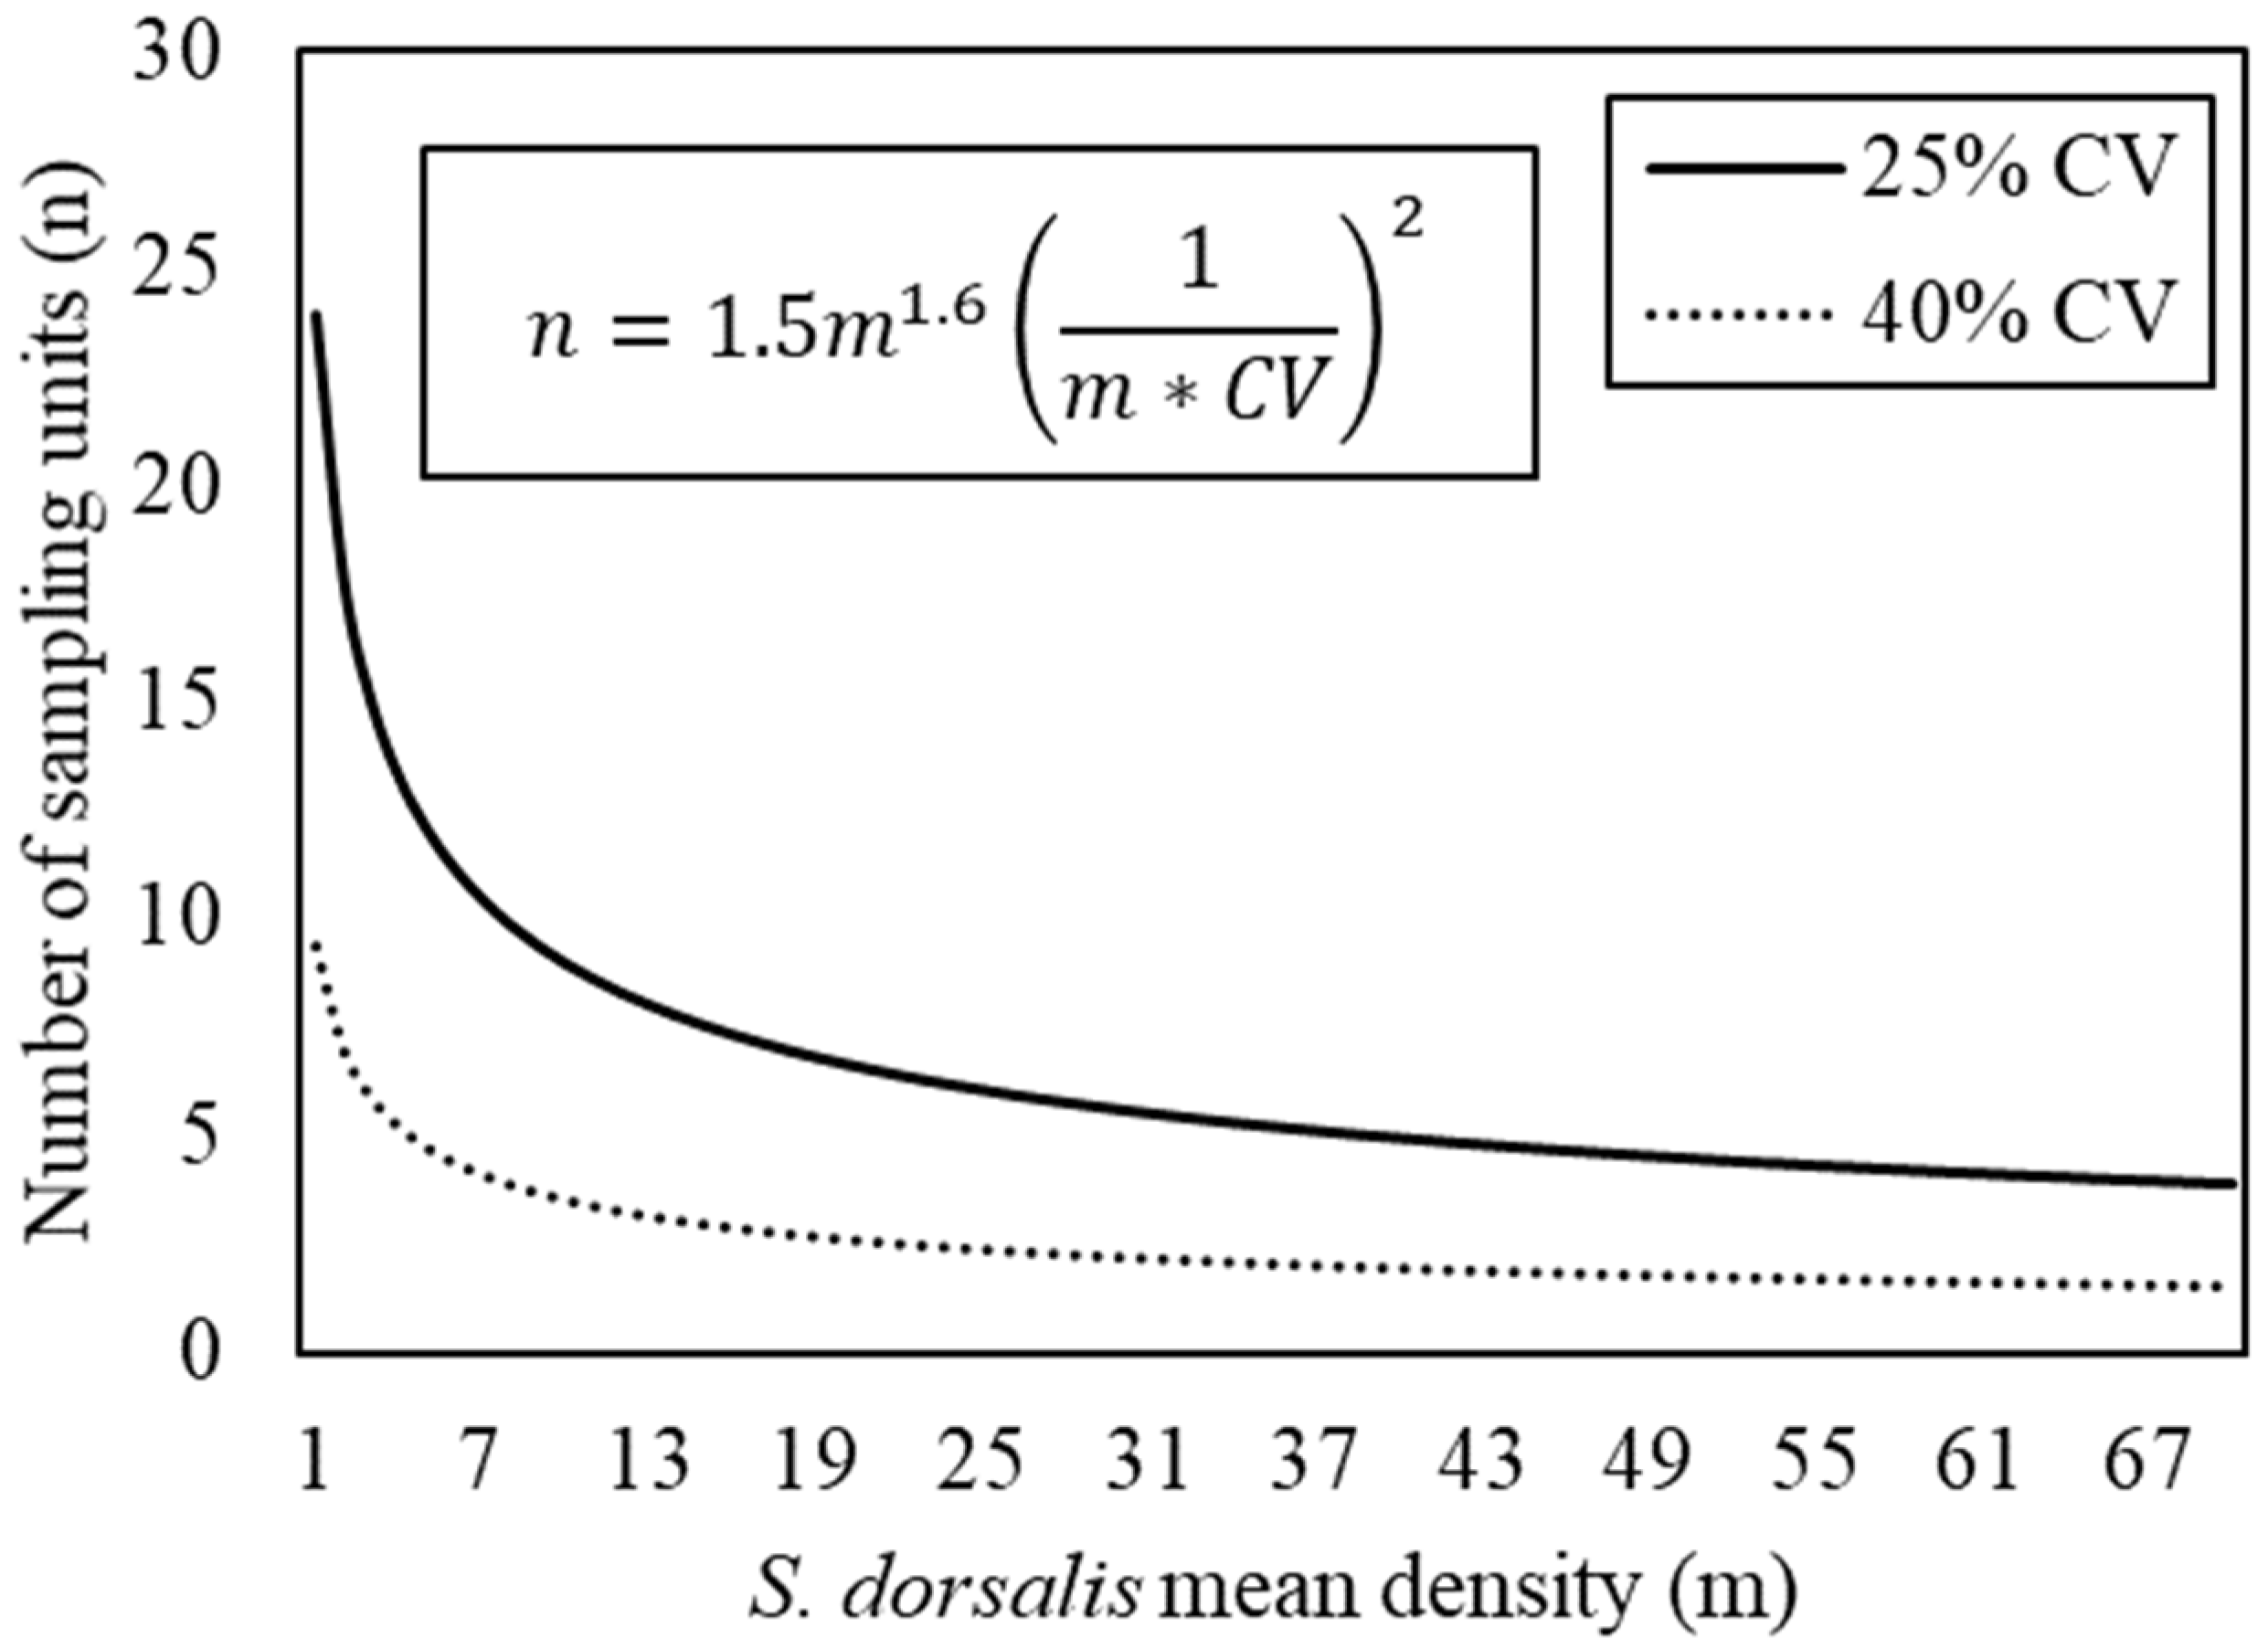
3.3. Fixed-Precision Sampling Plan
4. Discussion
5. Conclusions
Author Contributions
Funding
Institutional Review Board Statement
Data Availability Statement
Acknowledgments
Conflicts of Interest
References
- Kumar, V.; Kakkar, G.; McKenzie, C.L.; Seal, D.R.; Osborne, L.S. An Overview of Chilli Thrips, Scirtothrips dorsalis (Thysanoptera: Thripidae) Biology, Distribution and Management. IntechOpen 2013. Available online: http://www.intechopen.com/books/weed-and-pest-control-conventional-and-new-challenges/an-overview-of-chilli-thrips-scirtothrips-dorsalis-thysanoptera-thripidae-biology-distribution-and-m (accessed on 17 March 2021). [CrossRef] [Green Version]
- Hodges, G.; Edwards, G.B.; Dixon, W. Chilli Thrips Scirtothrips dorsalis Hood (Thysanoptera: Thripidae) a New Pest Thrips for Florida; Florida Department of Agriculture and Consumer Service, Department of Primary Industries: St. Gainesville, FL, USA, 2005. [Google Scholar]
- Panthi, B.; Renkema, J. Managing Scirtothrips dorsalis Hood (Thysanoptera: Thripidae) in Florida Strawberry with Flupyradifurone. Int. J. Fruit Sci. 2020, 1–11. [Google Scholar] [CrossRef]
- Liburd, O.E.; Panthi, B.R.; Phillips, D.A. Chilli Thrips on Blueberries in Florida. EDIS 2020, 2020, 4. [Google Scholar] [CrossRef]
- Dale, A.G.; Borden, M.A. Evaluation of Reduced-Risk Insecticides to Control Chilli Thrips (Thysanoptera: Thripidae) and Conserve Natural Enemies on Ornamental Plants. Fla. Entomol. 2018, 101, 237–243. [Google Scholar] [CrossRef] [Green Version]
- Mannion, C.M.; Derksen, A.I.; Seal, D.R.; Osborne, L.S.; Martin, C.G. Population Dynamics of Scirtothrips dorsalis (Thysanoptera: Thripidae) and Other Thrips Species on Two Ornamental Host Plant Species in Southern Florida. Environ. Entomol. 2014, 43, 849–858. [Google Scholar] [CrossRef] [PubMed]
- Seal, D.R.; Klassen, W.; Kumar, V. Biological Parameters of Scirtothrips dorsalis (Thysanoptera: Thripidae) on Selected Hosts. Environ. Entomol. 2010, 39, 1389–1398. [Google Scholar] [CrossRef]
- Nietschke, B.S.; Borchert, D.M.; Magarey, R.D.; Ciomperlik, M.A. Climatological Potential for Scirtothrips dorsalis (Thysanoptera: Thripidae) Establishment in the United States. Fla. Entomol. 2008, 91, 79–86. [Google Scholar] [CrossRef]
- Dickey, A.M.; Kumar, V.; Hoddle, M.S.; Funderburk, J.E.; Morgan, J.K.; Jara-Cavieres, A.; Shatters, R.G.J.; Osborne, L.S.; McKenzie, C.L. The Scirtothrips dorsalis Species Complex: Endemism and Invasion in a Global Pest. PLoS ONE 2015, 10, e0123747. [Google Scholar] [CrossRef] [Green Version]
- Seal, D.R.; Ciomperlik, M.A.; Richards, M.L.; Klassen, W. Distribution of Chilli Thrips, Scirtothrips dorsalis (Thysanoptera: Thripidae), in Pepper Fields and Pepper Plants on St. Vincent. Fla. Entomol. 2006, 89, 311–320. [Google Scholar] [CrossRef]
- Aristizábal, L.F.; Mascarin, G.M.; Cherry, R.H.; Chaves-Cordoba, B.; Arthurs, S.P. A Rapid Sampling Plan for Scirtothrips dorsalis (Thysanoptera: Thripidae) on Container Shrub Rose (Rosa ‘Radrazz’). J. Econ. Entomol. 2016, 109, 2543–2550. [Google Scholar] [CrossRef]
- Panthi, B.R.; Renkema, J.M.; Lahiri, S.; Liburd, O.E. The Short-Range Movement of Scirtothrips dorsalis (Thysanoptera: Thripidae) and Rate of Spread of Feeding Injury among Strawberry Plants. Environ. Entomol. 2020. [Google Scholar] [CrossRef]
- Panthi, B.; Liburd, O.; Lahiri, S.; Rhodes, E. Efficacy Test of Various Insecticides to Control Scirtothrips dorsalis in Southern Highbush Blueberries. Arthropod Manag. Tests 2020, 45. [Google Scholar] [CrossRef]
- Kumar, V.; Seal, D.R.; Osborne, L.S.; McKenzie, C.L. Coupling Scanning Electron Microscopy with DNA Bar Coding: A Novel Approach for Thrips Identification. Appl. Entomol. Zool. 2014, 49, 403–409. [Google Scholar] [CrossRef]
- Kang, S.H.; Lee, J.-H.; Kim, D.-S. Temperature-Dependent Fecundity of Overwintered Scirtothrips dorsalis (Thysanoptera: Thripidae) and Its Oviposition Model with Field Validation. Pest Manag. Sci. 2015, 71, 1441–1451. [Google Scholar] [CrossRef] [PubMed]
- Tatara, A. Effect of Temperature and Host Plant on the Development, Fertility and Longevity of Scirtothrips dorsalis Hood (Thysanoptera: Thripidae). Appl. Entomol. Zool. 1994, 29, 31–37. [Google Scholar] [CrossRef] [Green Version]
- Reddy, G.P.V.; Prasad, V.; Rao, R.S. Relative Resistance in Chilli Thrips, Scirtothrips dorsalis Hood Populations in Andhra Pradesh to Some Conventional Insecticides. Indian J. Plant Prot. 1992, 20, 218–222. [Google Scholar]
- Rao, C.N.; George, A.; Rahangadale, S. Monitoring of Resistance in Field Populations of Scirtothrips dorsalis (Thysanoptera: Thripidae) and Diaphorina citri (Hemiptera: Liviidae) to Commonly Used Insecticides in Citrus in Central India. J. Econ. Entomol. 2019, 112, 324–328. [Google Scholar] [CrossRef]
- James, D.; Price, T.S.; Wright, L.C.; Perez, J. Abundance and Phenology of Mites, Leafhoppers, and Thrips on Pesticide-Treated and Untreated Wine Grapes in Southcentral Washington. J. Agric. Urban Entomol. 2002, 19, 45–54. [Google Scholar]
- Wang, Z.-H.; Gong, Y.-J.; Jin, G.-H.; Li, B.-Y.; Chen, J.-C.; Kang, Z.-J.; Zhu, L.; Gao, Y.-L.; Reitz, S.; Wei, S.-J. Field-Evolved Resistance to Insecticides in the Invasive Western Flower Thrips Frankliniella Occidentalis (Pergande) (Thysanoptera: Thripidae) in China. Pest Manag. Sci. 2016, 72, 1440–1444. [Google Scholar] [CrossRef]
- Southwood, T.R.E.; Henderson, P.A. Ecological Methods, 4th ed.; John Wiley & Sons: Hoboken, NJ, USA, 2016. [Google Scholar]
- Aliakbarpour, H.; Salmah, M.R.C. Seasonal Abundance and Spatial Distribution of Larval and Adult Thrips (Thysanoptera) on Weed Host Plants in Mango Orchards in Penang, Malaysia. Appl. Entomol. Zool. 2011, 46, 185–194. [Google Scholar] [CrossRef]
- Binns, M.R.; Nyrop, J.P.; van der Werf, W.; Werf, W. Sampling and Monitoring in Crop Protection: The Theoretical Basis for Developing Practical Decision Guides; CABI: Wallingford, UK, 2000. [Google Scholar]
- Kumar, V.; Kakkar, G.; Seal, D.R.; McKenzie, C.L.; Colee, J.; Osborne, L.S. Temporal and Spatial Distribution of an Invasive Thrips Species Scirtothrips dorsalis (Thysanoptera: Thripidae). Crop Prot. 2014, 55, 80–90. [Google Scholar] [CrossRef]
- Panthi, B. Ecology, Behavior, and Management of Scirtothrips dorsalis Hood in Florida Strawberry and Blueberry. Ph.D. Thesis, University of Florida, Gainesville, FL, USA, 2020. [Google Scholar]
- Perry, J.N. Spatial Analysis by Distance Indices. J. Anim. Ecol. 1995, 64, 303–314. [Google Scholar] [CrossRef]
- Winder, L.; Alexander, C.; Griffiths, G.; Holland, J.; Woolley, C.; Perry, J. Twenty Years and Counting with SADIE: Spatial Analysis by Distance Indices Software and Review of Its Adoption and Use. Rethink. Ecol. 2019, 4, 1–16. [Google Scholar] [CrossRef] [Green Version]
- Kirk, W.D.J. The Aggregation Pheromones of Thrips (Thysanoptera) and Their Potential for Pest Management. Int. J. Trop. Insect Sci. 2017, 37, 41. [Google Scholar] [CrossRef] [Green Version]
- Rhainds, M.; Shipp, L. Dispersal of Adult Western Flower Thrips (Thysanoptera: Thripidae) on Chrysanthemum Plants: Impact of Feeding-Induced Senescence of Inflorescences. Environ. Entomol. 2003, 32, 1056–1065. [Google Scholar] [CrossRef] [Green Version]
- Shibao, M.; Tanaka, F.; Fujisaki, K.; Nakasuji, F. Effects of Lateral Shoot Cutting on Population Density of the Chillie Thrips, Scirtothrips dorsalis Hood (Thysanoptera: Thripidae) on Grape. Appl. Entomol. Zool. 1993, 28, 35–41. [Google Scholar] [CrossRef] [Green Version]
- Taylor, L.R. Aggregation, Variance and the Mean. Nature 1961, 189, 732–735. [Google Scholar] [CrossRef]


| Field | GPS Coordinates | Florida County | No. of Samples | Field Area (ha) | Cultivars | 2017 Sample Dates | 2018 Sample Dates | |||||
|---|---|---|---|---|---|---|---|---|---|---|---|---|
| Latitude | Longitude | 1st | 2nd | 3rd | 1st | 2nd | 3rd | |||||
| A | 27.95216 | −82.15062 | Hillsborough | 23 | 2.4 | mdl, jwl | 20 June | 24 July | 30 August | 20 June | 24 July | 27 August |
| B | 27.95217 | −82.13344 | Hillsborough | 37 | 3.5 | jwl, emr, ksr, ckd, sph | 20 June | 1 August | 31 August | 20 June | 24 July | 27 August |
| C | 27.95160 | −82.12887 | Hillsborough | 41 | 4.8 | fth | 21 June | 27 July | 31 August | 27 June | 26 July | 27 August |
| D | 27.94213 | −82.14359 | Hillsborough | 45 | 5.9 | ckd | 21 June | 24 July | 30 August | 27 June | 26 July | 27 August |
| E | 27.73754 | −82.22836 | Hillsborough | 40 | 4.7 | ksr | 22 June | 26 July | 29 August | 22 June | 27 July | 14 September |
| F | 27.74114 | −82.23246 | Hillsborough | 30 | 3.5 | vnt, fth | 22 June | 26 July | 29 August | 22 June | 27 July | 14 September |
| G | 27.82484 | −82.18275 | Hillsborough | 18 | 1.6 | jwl, emr | 23 June | 27 July | 29 August | 5 July | 24 July | 7 September |
| H | 28.75730 | −82.27129 | Citrus | 30 | 3.1 | emr | 19 June | 26 July | x | 3 July | 3 August | 5 September |
| I | 28.42770 | −81.78181 | Lake | 30 | 2.8 | emr | 19 June | 28 July | 30 August | 3 July | 3 August | 5 September |
| J | 28.44823 | −81.68027 | Lake | 30 | 2.9 | emr | 20 June | 31 July | 30 August | x | x | x |
| K | 28.38861 | −82.34166 | Pasco | 40 | 4.7 | emr | 27 June | 2 August | x | x | x | x |
| L | 28.44956 | −82.34541 | Hernando | 35 | 4.2 | emr | 30 June | 26 July | 30 August | 3 July | 3 August | 5 September |
| M | 27.69529 | −82.15803 | Hillsborough | 31 | 2.9 | jwl, emr | x | x | x | 5 July | 24 July | 14 September |
| N | 28.74367 | −82.27950 | Citrus | 25 | 3.0 | swt | x | x | x | 3 July | 3 August | 5 September |
| Field Code | Pruning Dates | Insecticide Application Dates | ||||||||||||
|---|---|---|---|---|---|---|---|---|---|---|---|---|---|---|
| 2017 | 2018 | 2017 | 2018 | |||||||||||
| 1st | 2nd | 3rd | 1st | 2nd | 3rd | |||||||||
| A | 12 June | 6 June | * | 27 July | fen † | 21 August | fen | 13 June | cya | 27 July | cya | 18 August | kao | |
| B | 1 June | 30 May | 16 July | ace | 26 July | fen | 19 August | spi + nov | * | * | 18 August | spi + nov | ||
| C | 30 May | 1 June | 1 July | cya | 15 August | mal | 30 August | mal | 1 July | cya | - | - | ||
| D | 15 May | 18 May | 7 June | spi | 17 July | spi | * | 14 June | ace | 14 July | ace | 6 August | bif | |
| E | 1 June | 1 June | 1 July | cya | 15 August | mal | 30 August | mal | 1 July | cya | * | 18 August | spi | |
| F | 1 June | 1 June | 1 July | cya | 15 August | mal | 30 August | mal | 1 July | cya | * | 18 August | spi | |
| G | 30 May | 30 May | 4 July | spi + nov | 8 July | bif | 20 August | spi + ace | 2 July | spi + ace | * | - | ||
| L | - | - | - | - | - | * | * | 15 August | spi | |||||
| Occurrence | Location | Field Edge | ||
|---|---|---|---|---|
| Inside of Field | Field Edge | Open Space | Surrounding Vegetation | |
| No (=0 S. dorsalis) | 248 | 315 | 170 | 145 |
| Yes (>0 S. dorsalis) | 828 | 891 | 598 | 293 |
| Likelihood ratio test | Chi-square = 2.9, p = 0.089 | Chi-square = 17.07, p < 0.001 | ||
Publisher’s Note: MDPI stays neutral with regard to jurisdictional claims in published maps and institutional affiliations. |
© 2021 by the authors. Licensee MDPI, Basel, Switzerland. This article is an open access article distributed under the terms and conditions of the Creative Commons Attribution (CC BY) license (http://creativecommons.org/licenses/by/4.0/).
Share and Cite
Panthi, B.R.; Renkema, J.M.; Lahiri, S.; Liburd, O.E. Spatio-Temporal Distribution and Fixed-Precision Sampling Plan of Scirtothrips dorsalis (Thysanoptera: Thripidae) in Florida Blueberry. Insects 2021, 12, 256. https://0-doi-org.brum.beds.ac.uk/10.3390/insects12030256
Panthi BR, Renkema JM, Lahiri S, Liburd OE. Spatio-Temporal Distribution and Fixed-Precision Sampling Plan of Scirtothrips dorsalis (Thysanoptera: Thripidae) in Florida Blueberry. Insects. 2021; 12(3):256. https://0-doi-org.brum.beds.ac.uk/10.3390/insects12030256
Chicago/Turabian StylePanthi, Babu R., Justin M. Renkema, Sriyanka Lahiri, and Oscar E. Liburd. 2021. "Spatio-Temporal Distribution and Fixed-Precision Sampling Plan of Scirtothrips dorsalis (Thysanoptera: Thripidae) in Florida Blueberry" Insects 12, no. 3: 256. https://0-doi-org.brum.beds.ac.uk/10.3390/insects12030256