
Crop and Semi-Natural Habitat Configuration Affects Diversity and Abundance of Native Bees (Hymenoptera: Anthophila) in a Large-Field Cotton Agroecosystem

 ,
, 
Abstract
:Simple Summary
Abstract
1. Introduction
2. Materials and Methods
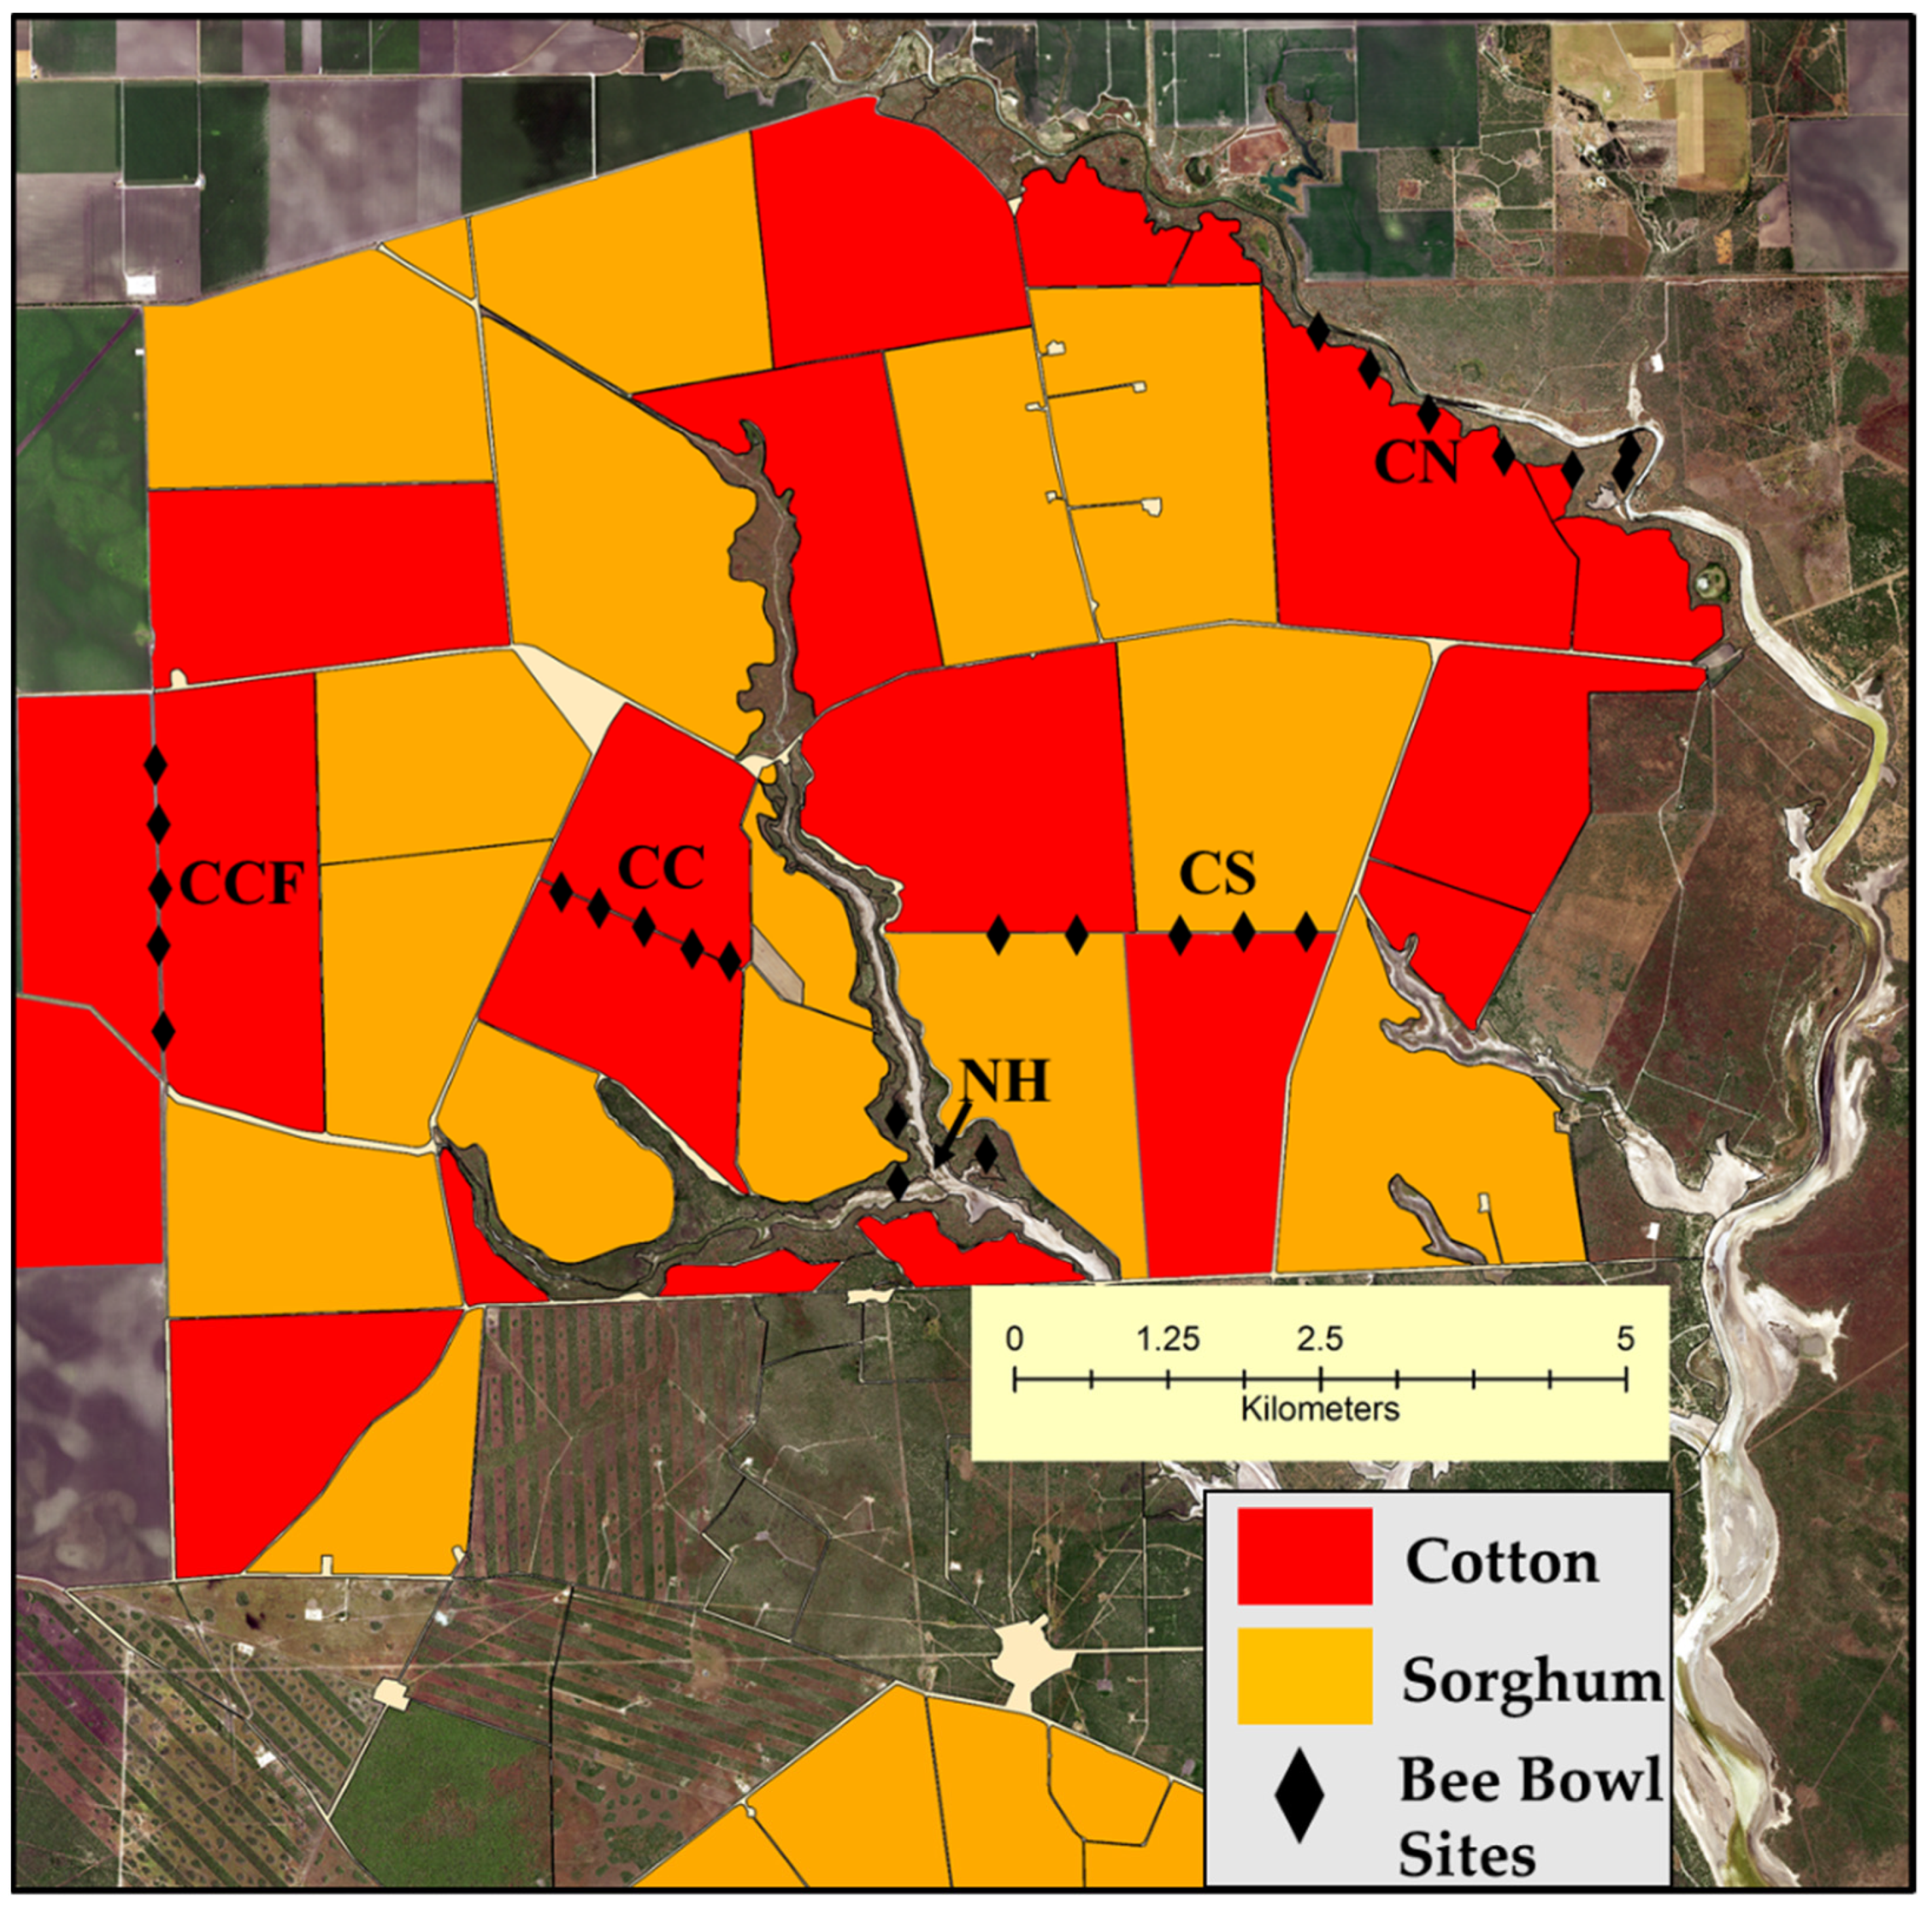
2.1. Study System
2.2. Bee Collection and Processing
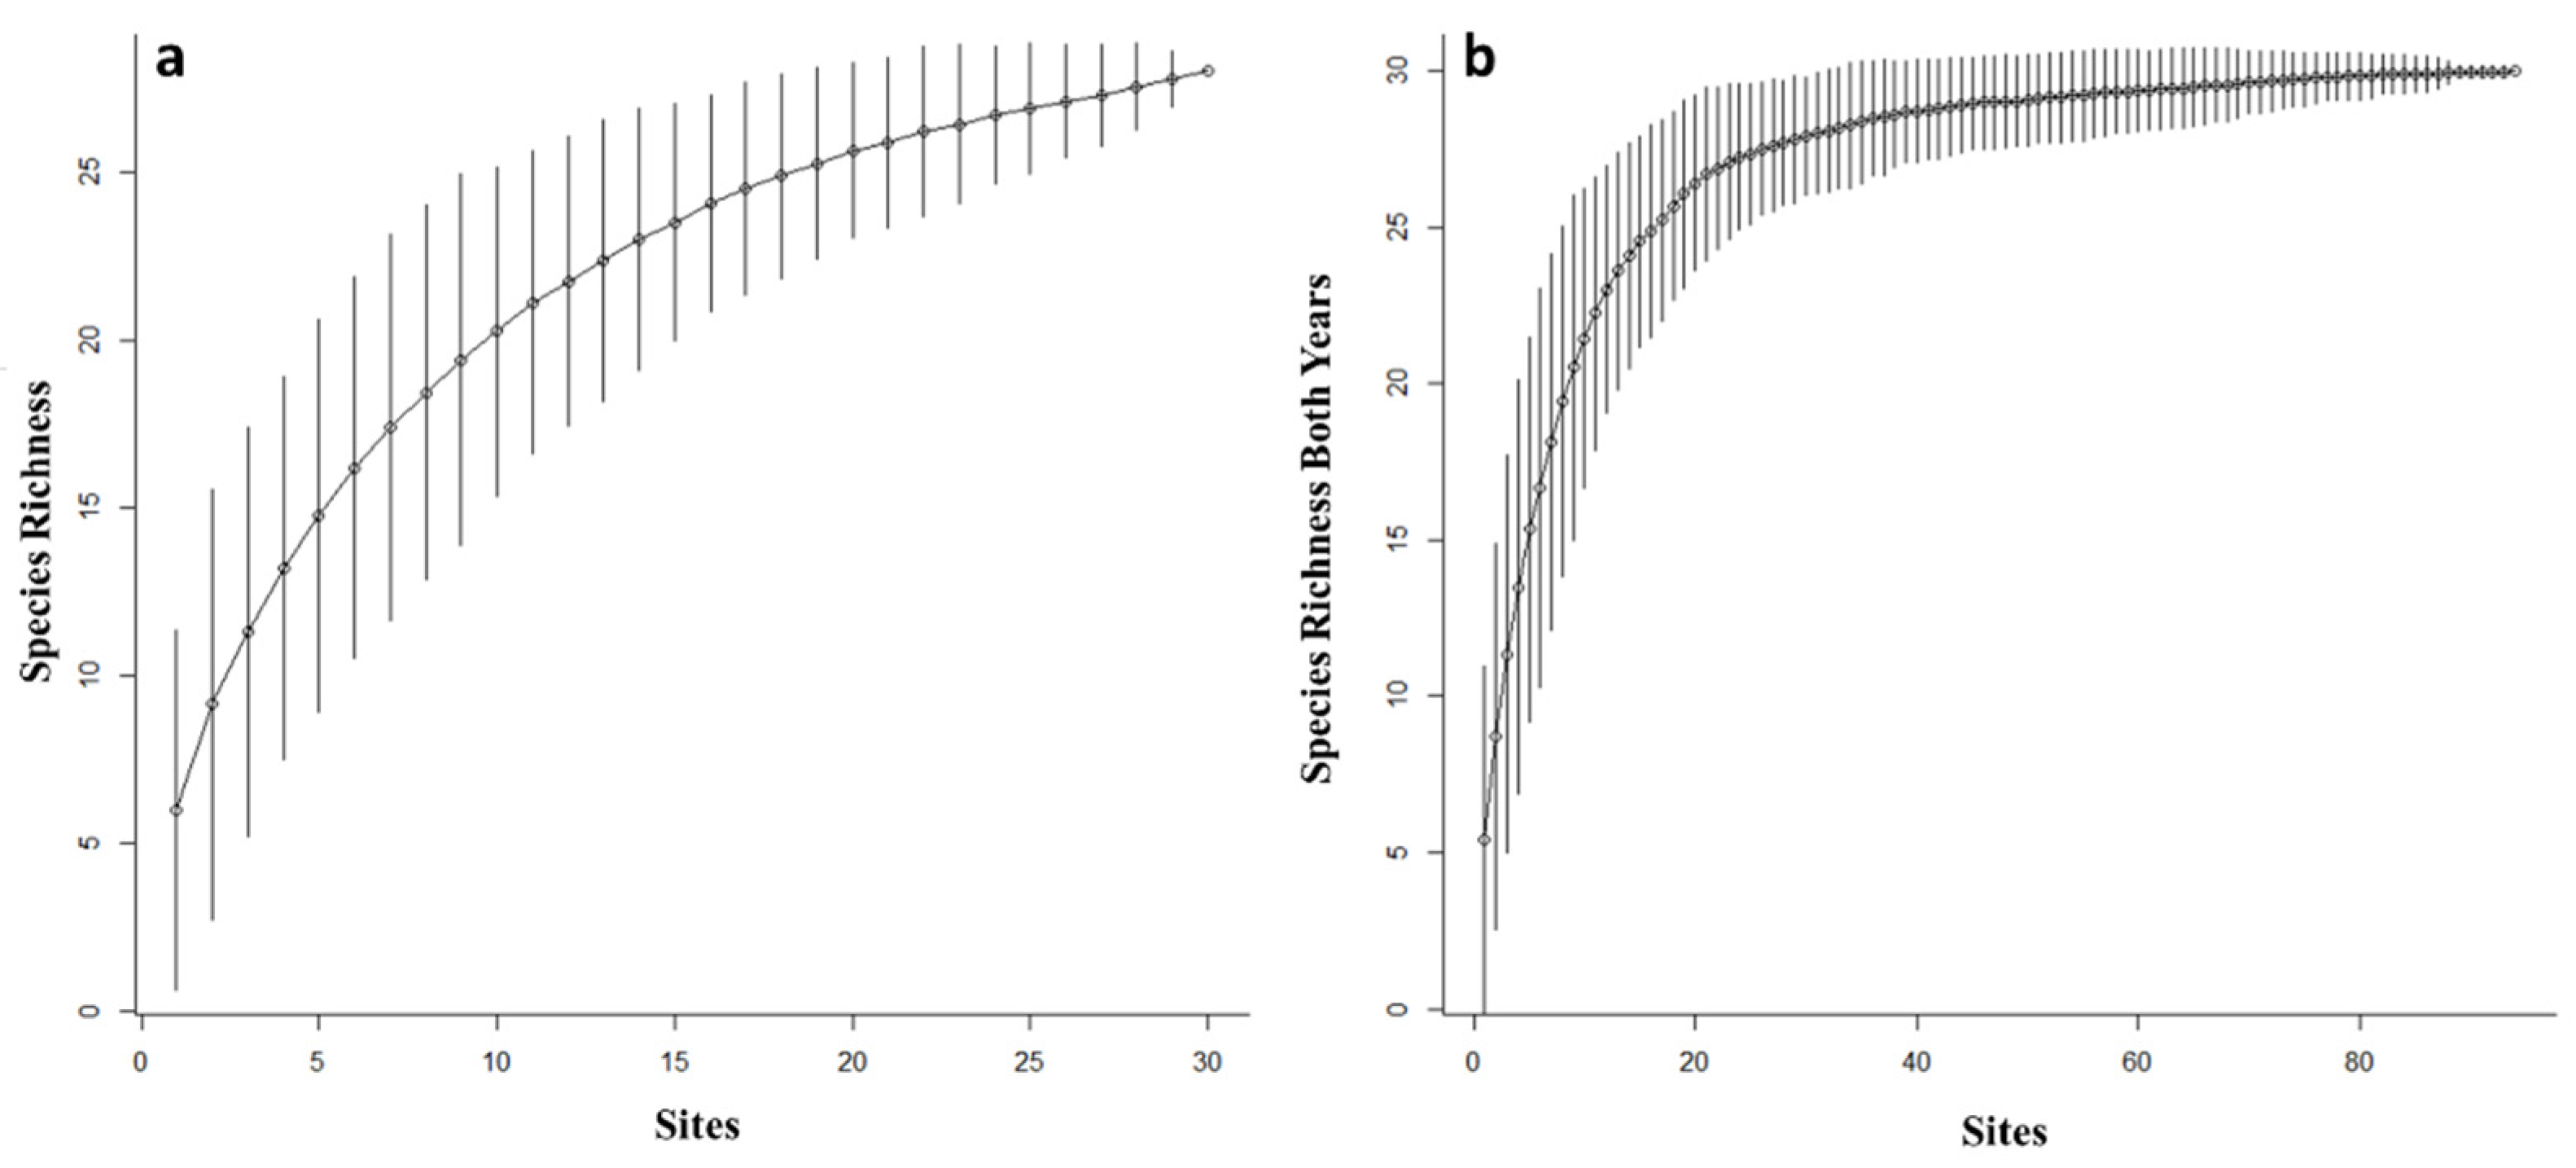
2.3. Analyses
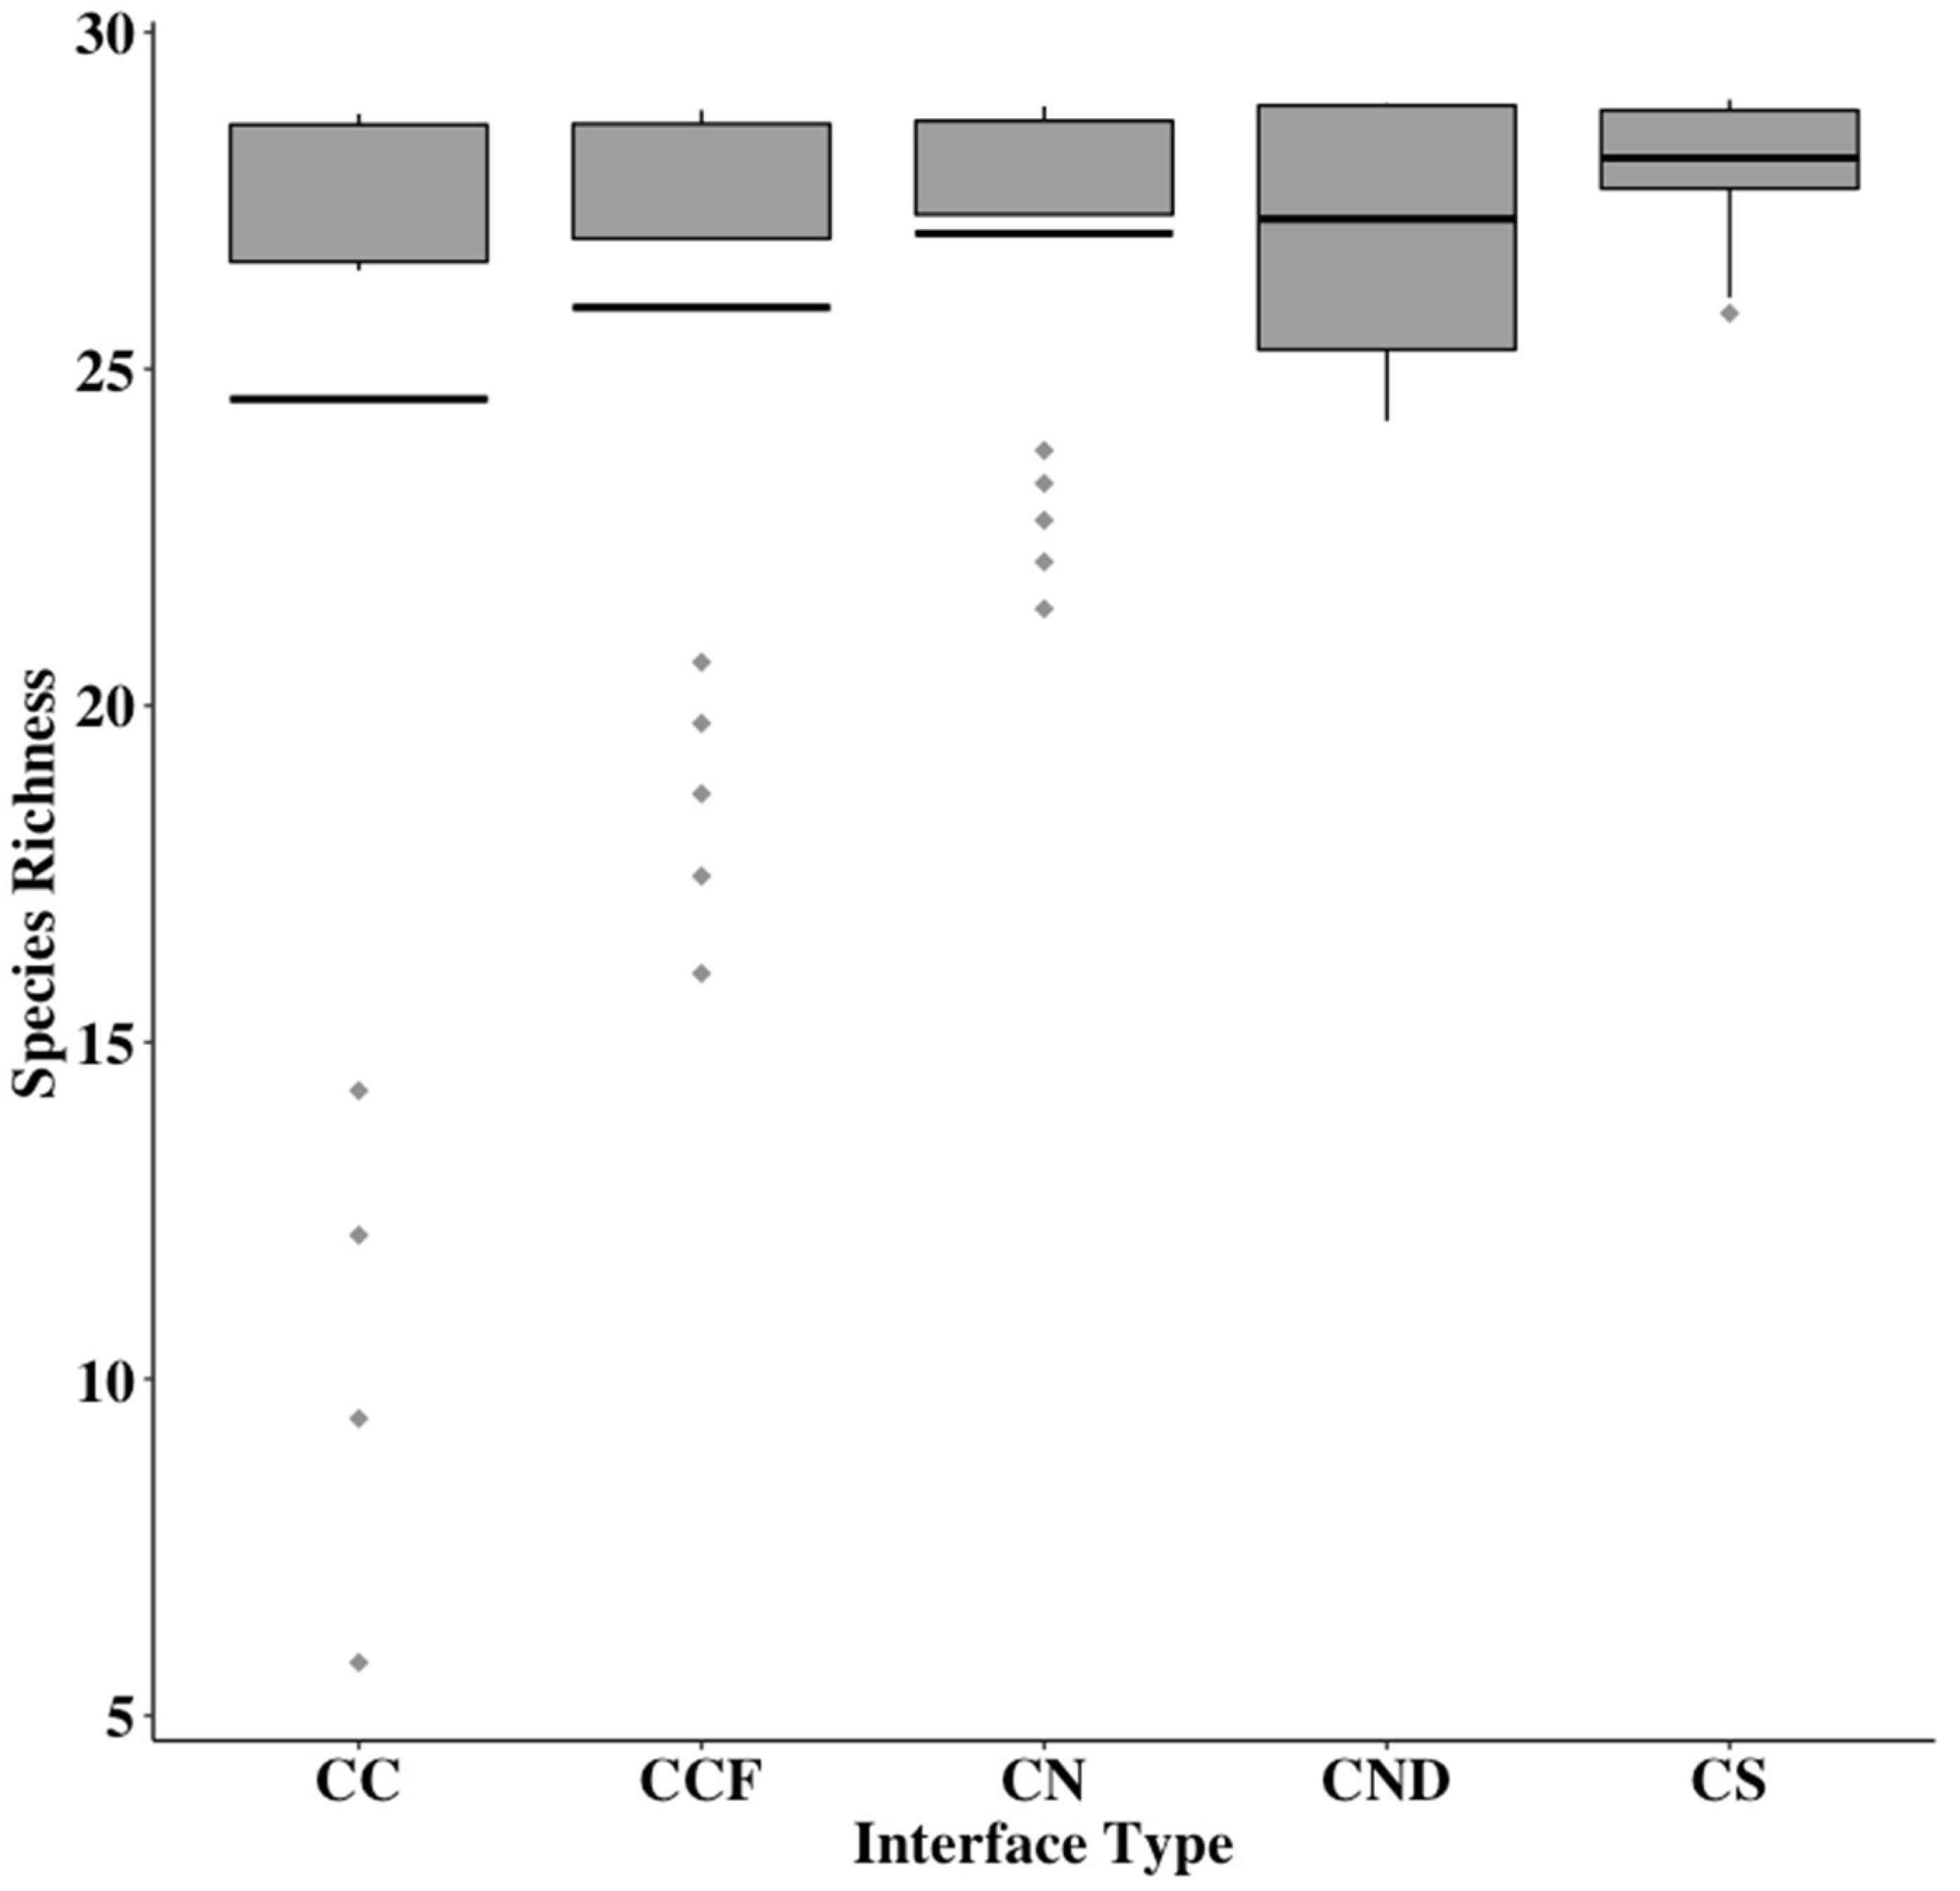
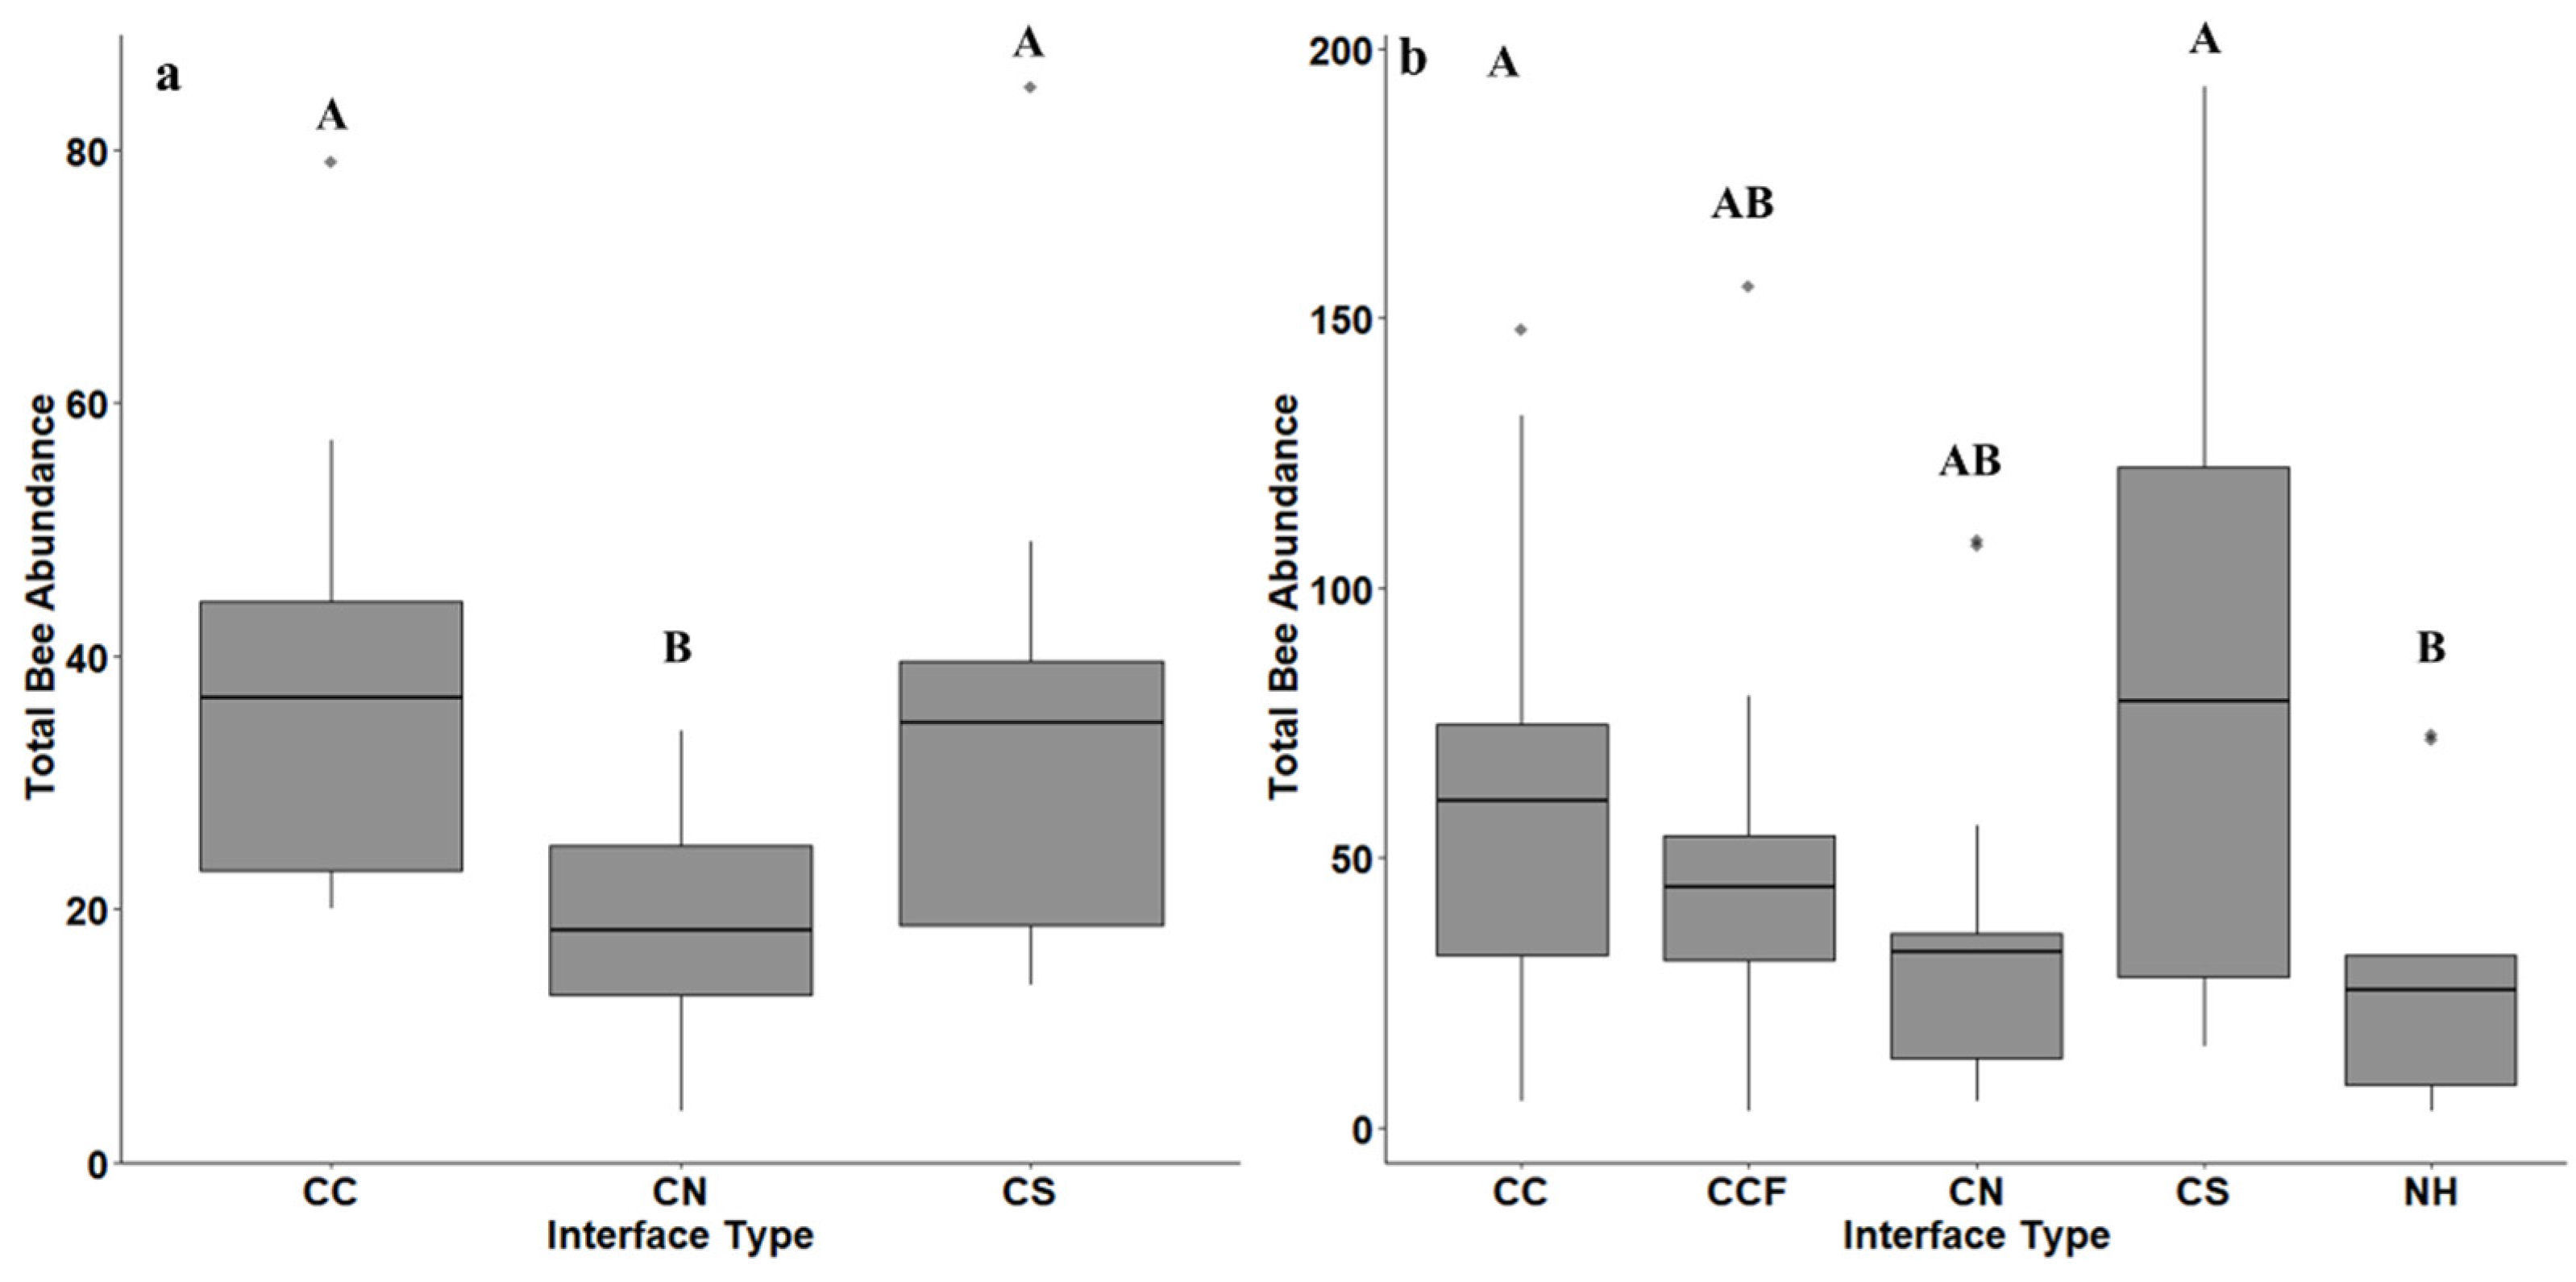
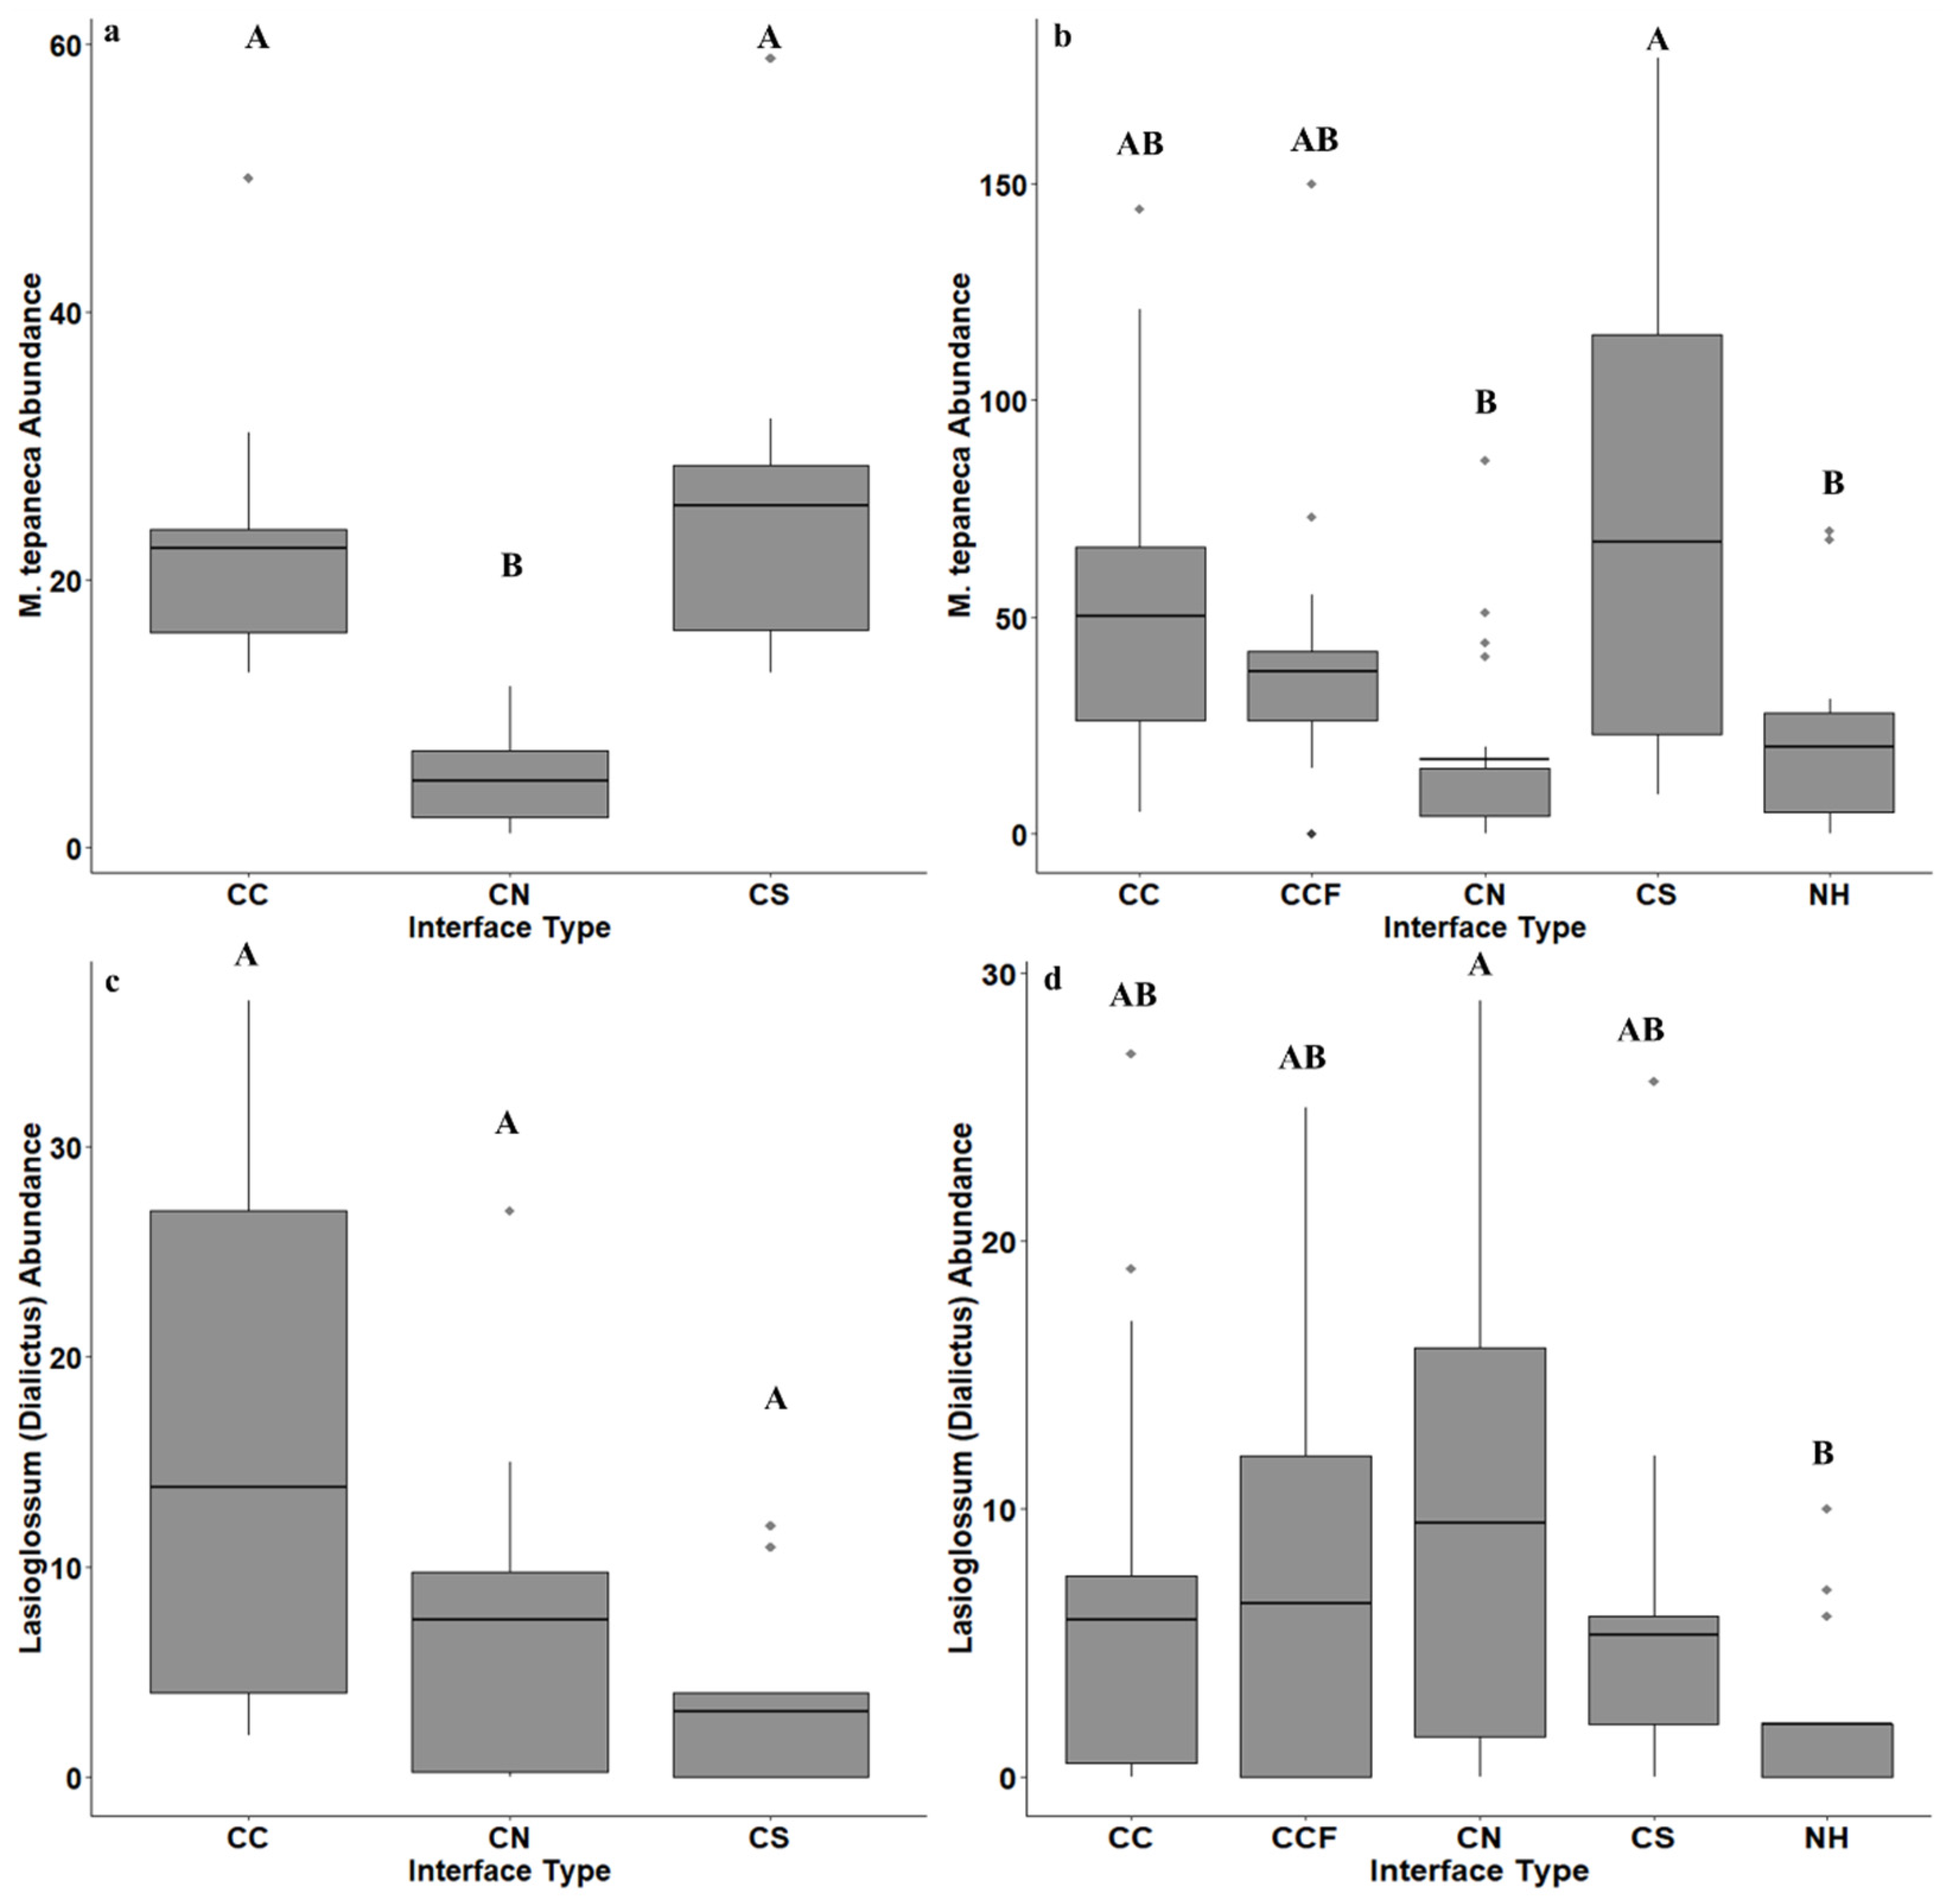
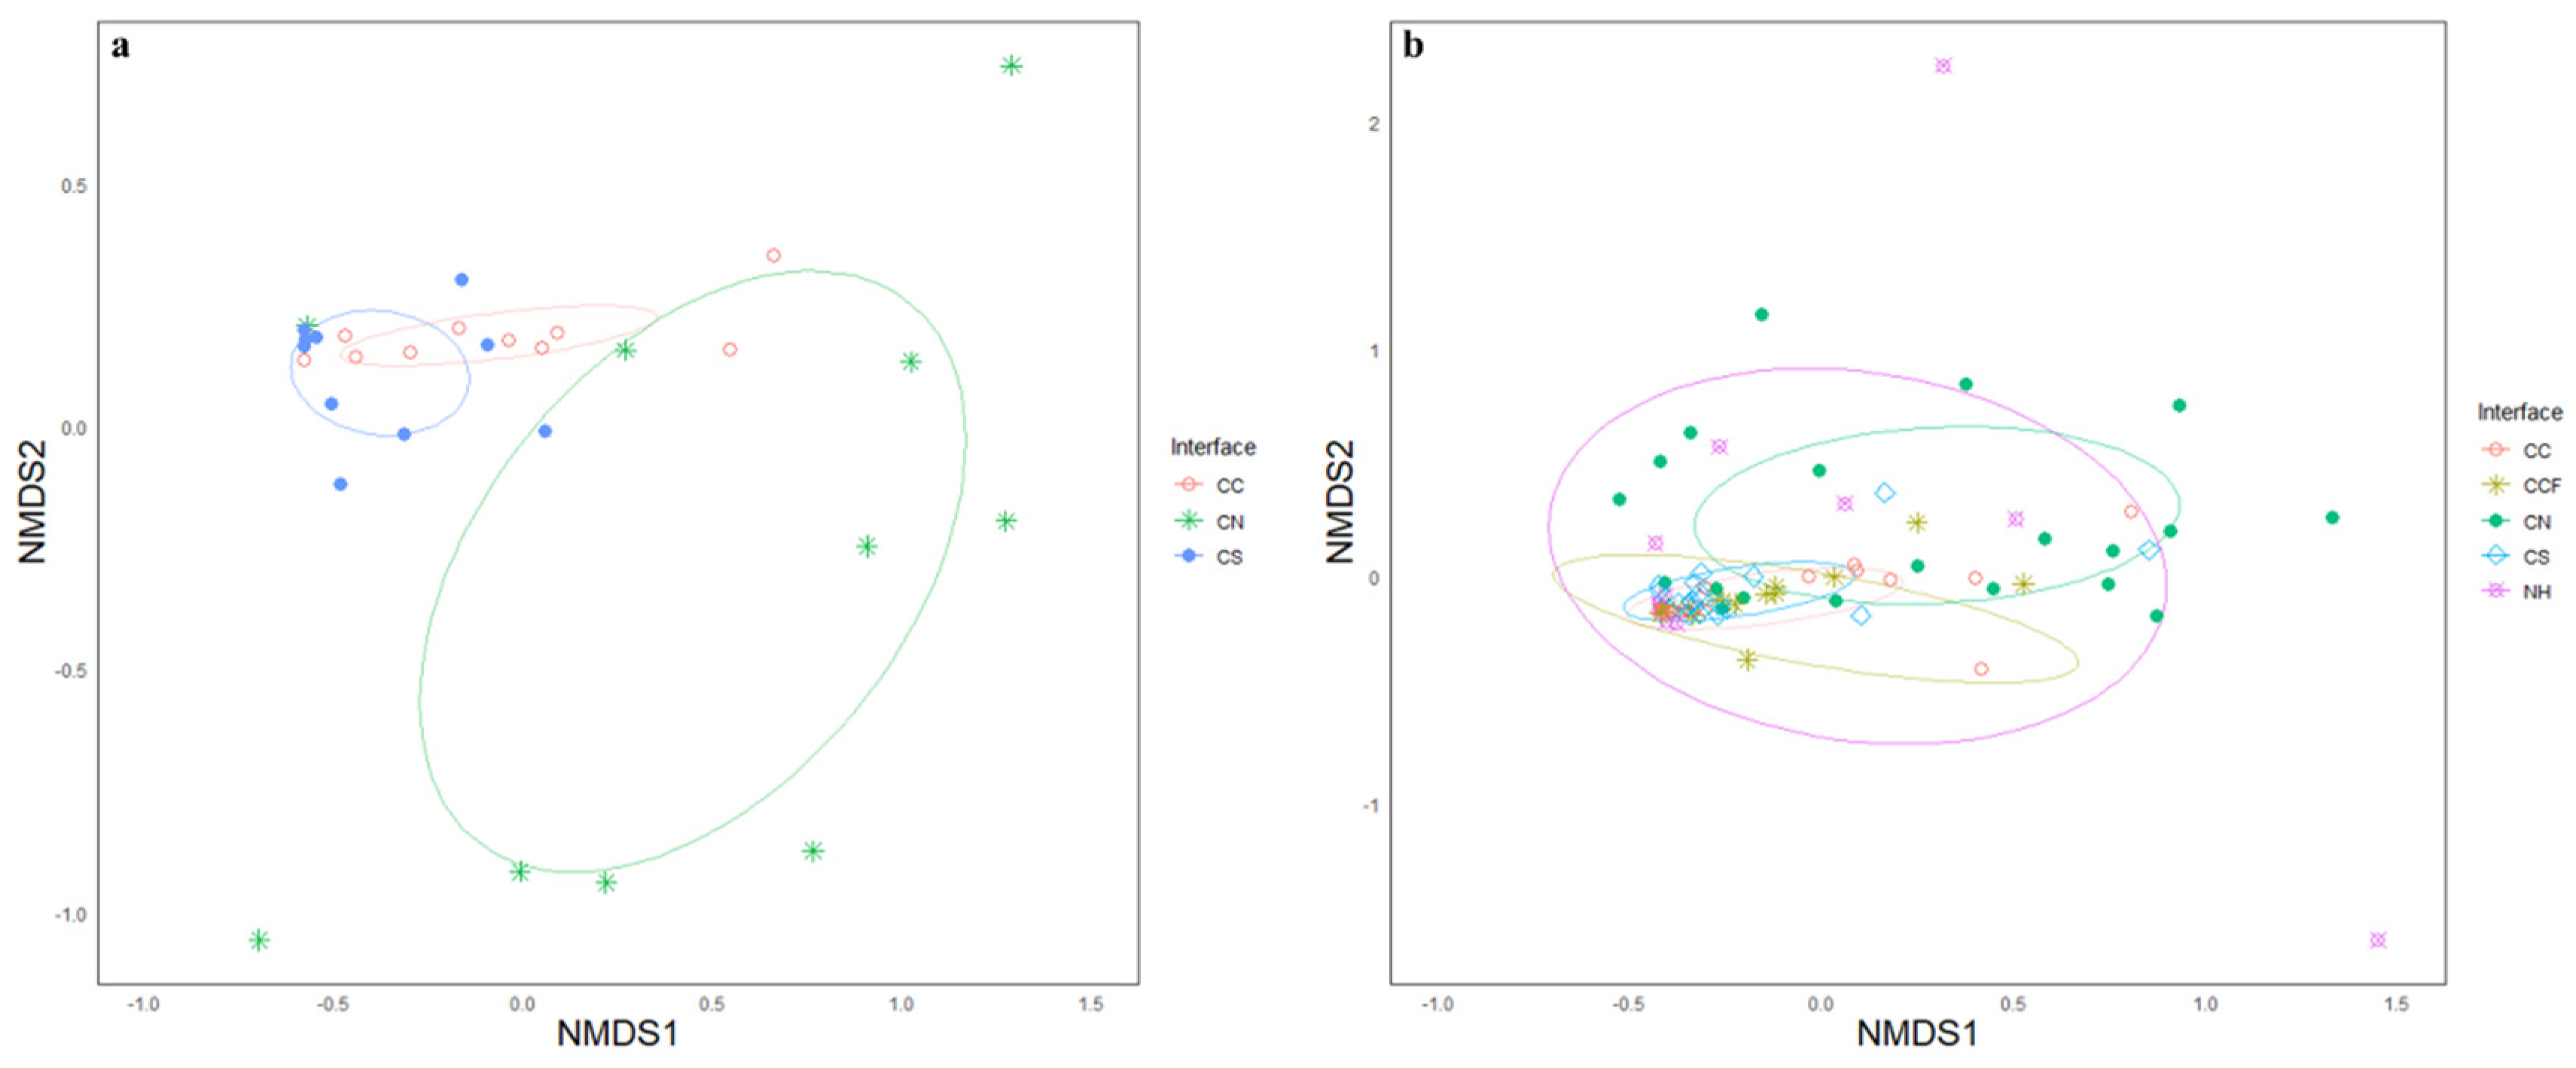
3. Results
4. Discussion
Author Contributions
Funding
Acknowledgments
Conflicts of Interest
References
- Tscharntke, T.; Rand, T.A.; Bianchi, F.J.J.A. The landscape context of trophic interactions: Insect spillover across the crop-noncrop interface. Ann. Zool. Fenn. 2005, 42, 421–432. [Google Scholar]
- Tscharntke, T.; Clough, Y.; Wanger, T.C.; Jackson, L.; Motzke, I.; Perfecto, I.; Vandermeer, J.; Whitbread, A. Global food security, biodiversity conservation and the future of agricultural intensification. Biol. Conserv. 2012, 151, 53–59. [Google Scholar] [CrossRef]
- Bolton, D.K.; Friedl, M.A. Forecasting crop yield using remotely sensed vegetation indices and crop phenology metrics. Agric. For. Meteorol. 2013, 173, 74–84. [Google Scholar] [CrossRef]
- Parys, K.A.; Esquivel, I.L.; Wright, K.W.; Griswold, T.; Brewer, M.J. Native Pollinators (Hymenoptera: Anthophila) in Cotton Grown in the Gulf South, United States. Agronomy 2020, 10, 698. [Google Scholar] [CrossRef]
- Westphal, C.; Steffan-Dewenter, I.; Tscharntke, T. Mass flowering crops enhance pollinator densities at a landscape scale. Ecol. Lett. 2003, 6, 961–965. [Google Scholar] [CrossRef]
- Moffett, J.O.; Stith, L.E.E.S.; Burkhardt, C.C.; Shipman, C.W. Fluctuation of wild bee and wasp visits to cotton flowers. J. Arizona Acad. Sci. 1976, 11, 64–68. [Google Scholar] [CrossRef]
- Cusser, S.; Neff, J.L.; Jha, S. Natural land cover drives pollinator abundance and richness, leading to reductions in pollen limitation in cotton agroecosystems. Agric. Ecosyst. Environ. 2016, 226, 33–42. [Google Scholar] [CrossRef] [Green Version]
- Esquivel, I.L.; Coulson, R.N.; Brewer, M.J. A native bee, Melissodes tepaneca (Hymenoptera: Apidae), benefits cotton production. Insects 2020, 1, 487. [Google Scholar] [CrossRef]
- Peterson, G.; Allen, C.R.; Holling, C.S. Ecological resilience, biodiversity, and scale. Ecosystems 1998, 1, 6–18. [Google Scholar] [CrossRef]
- Vaissière, B.E.; Vinson, S.B. Pollen morphology and its effect on pollen collection by honey bees, Apis mellifera L. (Hymenoptera: Apidae), with special reference to upland cotton, Gossypium hirsutum L. (Malvaceae). Grana 1994, 33, 128–138. [Google Scholar] [CrossRef]
- Konzmann, S.; Koethe, S.; Lunau, K. Pollen grain morphology is not exclusively responsible for pollen collectability in bumble bees. Sci. Rep. 2019, 9, 1–8. [Google Scholar] [CrossRef]
- Morgan, G. Cotton.tamu.edu. Texas A&M AgriLife Extension, College Station. 2018. Available online: http://cotton.tamu.edu/index.html (accessed on 5 June 2018).
- Luttrell, R.G.; Teague, T.G.; Brewer, M.J. Cotton Insect Pest Management. Cotton 2015, 22, 509–546. [Google Scholar]
- Gill, K.A.; O’Neal, M.E. Survey of soybean insect pollinators: Community identification and sampling method analysis. Environ. Entomol. 2015, 44, 488–498. [Google Scholar] [CrossRef] [Green Version]
- Wheelock, M.J.; Rey, K.P.; O’Neal, M.E. Defining the insect pollinator community found in Iowa corn and soybean fields: Implications for pollinator conservation. Environ. Entomol. 2016, 45, 1099–1106. [Google Scholar] [CrossRef]
- Michener, C.D. The Bees of the World; John Hopkins University Press: Baltimore, MD, USA, 2007. [Google Scholar]
- Michener, C.D.; McGinley, R.J.; Danforth, B.N. The Bee Genera of North and Central America: Hymenoptera Apoidea; Smithsonian Inst Press: Washington, DC, USA, 1994; p. 304. [Google Scholar]
- Roberts, R.B. Bees of northwestern America: Agapostemon (Hymenoptera: Halictidae). Agric. Exp. Stn. Oregon State Tech. Bull. 1973, 126, 1–23. [Google Scholar]
- Cresson, E.T. A list of the North American species of the genus Anthophora, with descriptions of new species. Trans. Am. Entomol. Soc. 1868, 2, 289–293. [Google Scholar] [CrossRef]
- Sandhouse, G.A. The American bees of the subgenus Halictus. Entomol. Am. 1941, 21, 23–39. [Google Scholar]
- Mitchell, T.B. Bees of the Eastern United States (I). North Carol. Agric. Exp. Sta. Bull. 1960, 141, 1–538. [Google Scholar]
- Daly, H.V. Bees of the genus Ceratina in America north of Mexico. Publ. Entomol. Univ. Calif. 1973, 74, 172–175. [Google Scholar]
- Rehan, S.M.; Sheffield, C.S. Morphological and molecular delineation of a new species in the Ceratina dupla species-group (Hymenoptera: Apidae: Xylocopinae) of eastern North America. Zootaxa 2011, 50, 35–50. [Google Scholar] [CrossRef]
- Sipes, S.D.; Wolf, P.G. Phylogenetic relationships within Diadasia, a group of specialist bees. Mol. Phylogenet. Evol. 2001, 19, 144–156. [Google Scholar] [CrossRef]
- Mitchell, T.B. Bees of the eastern United States Vol II. Tech. Bull. 1960, 1, 513–546. [Google Scholar]
- Gibbs, J. Revision of the metallic Lasioglossum (Dialictus) of eastern North America (Hymenoptera: Halictidae: Halictini). Zootaxa 2011, 3073, 1–216. [Google Scholar] [CrossRef] [Green Version]
- Gibbs, J.; Packer, L.; Dumesh, S.; Danforth, B.N. Revision and reclassification of Lasioglossum (Evylaeus), L. (Hemihalictus) and L. (Sphecodogastra) in eastern North America (Hymenoptera: Apoidea: Halictidae). Zootaxa 2013, 3672, 1–117. [Google Scholar]
- Sheffield, C.S.; Ratti, C.; Packer, L.; Griswold, T. Leafcutter and mason bees of the genus Megachile Latreille (Hymenoptera: Megachilidae) in Canada and Alaska. Can. J. Arthropod. Identif. 2011, 18, 1–107. [Google Scholar] [CrossRef]
- LaBerge, W.E. A revision of the bees of the genus Melissodes in North and Central America. Part I. Univ. Kansas Sci. Bull. 1956, 37, 911–1194. [Google Scholar]
- LaBerge, W.E. A revision of the bees of the genus Melissodes in North and Central America. Part II. Univ. Kansas Sci. Bull. 1956, 38, 533–578. [Google Scholar]
- LaBerge, W.E. A revision of the bees of the genus Melissodes in North and Central America. Part III. Univ. Kansas Sci. Bull. 1961, 42, 283–663. [Google Scholar]
- Cockerell, T.D.A. The North American Bees of the Genus Nomia; U.S. Government Printing Office: Washington, DC, USA, 1911. [Google Scholar]
- Hurd, P.D. The carpenter bees of California. Bull. Calif. Insect Surv. 1955, 4, 35–72. [Google Scholar] [CrossRef]
- Gotelli, N.J.; Colwell, R.K. Quantifying biodiversity: Procedures and pitfalls in the measurement and comparison of species richness. Ecol. Lett. 2001, 4, 379–391. [Google Scholar] [CrossRef] [Green Version]
- Kindt, R. Coe, R. Tree Diversity Analysis. A Manual and Software for Common Statistical Methods for Ecological and Biodiversity Studies; World Agroforestry Centre (ICRAF): Nairobi, Kenya, 2005; ISBN 92-9059-179-X. [Google Scholar]
- Bates, D.; Maechler, M.; Bolker, B.; Walker, S. Fitting linear mixed-effects models using lme4. J. Stat. Soft. 2015, 67, 1–48. [Google Scholar] [CrossRef]
- Wickham, H. ggplot2: Elegant Graphics for Data Analysis; Springer: Cham, Switzerland, 2016. [Google Scholar]
- Oksanen, J.; Blanchet, F.G.; Friendly, M.; Kindt, R.; Legendre, P.; McGlinn, D.; Minchin, P.R.; O’Hara, R.B.; Simpson, G.L.; Solymos, P.; et al. VEGAN: Community Ecology Package. R Package Version 2, 5–6. 2019. Available online: https://CRAN.R-project.org/package=vegan (accessed on 14 May 2020).
- R Core Team. A Language and Environment for Statistical Computing. 2020. Available online: https://www.r-project.org/ (accessed on 30 January 2020).
- Clarke, K.R. Non-parametric multivariate analyses of changes in community structure. Aust. J. Ecol. 1993, 18, 117–143. [Google Scholar] [CrossRef]
- Allard, H.A. Some experimental observations concerning the behavior of various bees in their visits to cotton blossoms II. Am. Nat. 1911, 45, 668–685. [Google Scholar] [CrossRef]
- Grando, C.; Amon, N.D.; Clough, S.J.; Guo, N.; Wei, W.; Azevedo, P.; López-Uribe, M.M.; Zucchi, M.I. Two colors, one species: The case of Melissodes nigroaenea (Apidae: Eucerini), an important pollinator of cotton fields in Brazil. Sociobiology 2018, 65, 645–653. [Google Scholar] [CrossRef]
- Cusser, S.; Grando, C.; Zucchi, M.I.; López-Uribe, M.M.; Pope, N.S.; Ballare, K.; Luna-Lucena, D.; Almeida, E.A.B.; Neff, J.L.; Young, K.; et al. Small but critical: Semi-natural habitat fragments promote bee abundance in cotton agroecosystems across both Brazil and the United States. Landsc. Ecol. 2019, 34, 1825–1836. [Google Scholar] [CrossRef]
- Esquivel, I.L.; Parys, K.A.; Brewer, M.J. Pollination by non- Apis bees and potential benefits in self-pollinating crops. Ann. Entomol. Soc. Am. 2021, 114, 257–266. [Google Scholar] [CrossRef]
- O’Brien, C.; Arathi, H.S. Bee genera, diversity and abundance in genetically modified canola fields. GM Crop. Food 2018, 9, 31–38. [Google Scholar] [CrossRef] [PubMed] [Green Version]
- Hall, M.A.; Nimmo, D.G.; Cunningham, S.A.; Walker, K.; Bennett, A.F. The response of wild bees to tree cover and rural land use is mediated by species’ traits. Biol. Conserv. 2019, 231, 1–12. [Google Scholar] [CrossRef]
- Gathmann, A.; Tscharntke, T. Foraging ranges of solitary bees. J. Anim. Ecol. 2002, 71, 757–764. [Google Scholar] [CrossRef]
- Butler, G.D.; Todd, F.E.; McGregor, S.E.; Werner, F.G. Melissodes bees in Arizona cotton fields. Agric. Exp. Stn. Univ. Arizona 1960, 3, 1–11. [Google Scholar]
- Clement, S.L. The Nesting Biology of Melissodes (Eumelissodes) rustica (Say), with a description of the larva. J. Kansas Entomol. Soc. 1973, 46, 516–525. [Google Scholar]
- Cameron, A.S.A.; Whitfield, J.B.; Hulslander, C.L.; Cresko, W.A.; Isenberg, S.B.; King, R.W. Nesting biology and foraging patterns of the solitary bee Melissodes rustica (Hymenoptera: Apidae) in northwest Arkansas. J. Kansas Entomol. Soc. 1993, 69, 260–273. [Google Scholar]
- Brewer, M.J.; Goodell, P.B. Approaches and incentives to implement integrated pest management that addresses regional and environmental issues. Annu. Rev. Entomol. 2012, 57, 41–59. [Google Scholar] [CrossRef] [PubMed] [Green Version]
- Collins, W.W.; Qualset, C.O. Biodiversity in Agroecosystems; CRC Press: Boca Raton, FL, USA, 1999. [Google Scholar]
- Bengtsson, J.; Angelstam, P.; Elmqvist, T.; Emanuelsson, U.; Folke, C.; Ihse, M.; Moberg, F.; Nyström, M. Reserves, resilience and dynamic landscapes. AMBIO A J. Hum. Environ. 2003, 32, 389–396. [Google Scholar] [CrossRef]
- Kleijn, D.; Winfree, R.; Bartomeus, I.; Carvalheiro, L.G.; Henry, M.; Isaacs, R.; Klein, A.M.; Kremen, C.; M’Gonigle, L.K.; Rader, R.; et al. Delivery of crop pollination services is an insufficient argument for wild pollinator conservation. Nat. Commun. 2015, 6. [Google Scholar] [CrossRef] [PubMed] [Green Version]
- Kleijn, D.; Baquero, R.A.; Clough, Y.; Díaz, M.; De Esteban, J.; Fernández, F.; Gabriel, D.; Herzog, F.; Holzschuh, A.; Jöhl, R.; et al. Mixed biodiversity benefits of agri-environment schemes in five European countries. Ecol. Lett. 2006, 9, 243–254. [Google Scholar] [CrossRef]


| Year of Collection | 2017 | 2018 | ||||||
|---|---|---|---|---|---|---|---|---|
| Bees Collected by Family 2 | CC 1 | CS | CN | CC | CS | CN | CCF | NH |
| HALICTIDAE: Augochlorini | ||||||||
| Augochlora aurifera (Cockerell) | 1 | 1 | 0 | 0 | 0 | 0 | 0 | 0 |
| Augochlorella aurata (Smith) | 0 | 4 | 0 | 0 | 0 | 0 | 0 | 3 |
| HALICTIDAE: Halictini | ||||||||
| Agapostemon melliventris (Cresson) | 4 | 1 | 8 | 2 | 11 | 5 | 1 | 4 |
| Agapostemon splendens (Lepeletier) | 1 | 4 | 0 | 0 | 3 | 6 | 2 | 1 |
| Agapostemon texanus (Cresson) | 4 | 0 | 8 | 7 | 1 | 11 | 6 | 2 |
| Halictus (Odontalictus) ligatus Say | 2 | 16 | 1 | 8 | 7 | 10 | 4 | 0 |
| Lasioglossum (Dialictus) coactum (Cresson) | 0 | 7 | 0 | 5 | 2 | 3 | 4 | 0 |
| Lasioglossum (Dialictus) connexum (Cresson) | 2 | 0 | 0 | 5 | 3 | 5 | 8 | 0 |
| Lasioglossum (Dialictus) disparile (Cresson) | 11 | 8 | 2 | 6 | 0 | 7 | 3 | 0 |
| Lasioglossum (Dialictus) sp. A | 30 | 15 | 22 | 25 | 17 | 18 | 10 | 4 |
| Lasioglossum (Dialictus) sp. B | 68 | 33 | 21 | 9 | 15 | 30 | 19 | 0 |
| Lasioglossum (Dialictus) sp. C | 2 | 3 | 0 | 0 | 12 | 0 | 6 | 0 |
| Lasioglossum (Dialictus) sp. D | 8 | 0 | 2 | 8 | 2 | 1 | 4 | 8 |
| Lasioglossum (Dialictus) sp. G | 1 | 1 | 0 | 23 | 35 | 71 | 21 | 4 |
| Lasioglossum (Dialictus) sp. H | 2 | 3 | 1 | 40 | 34 | 42 | 14 | 6 |
| Lasioglossum (Dialictus) sp. I | 0 | 4 | 0 | 25 | 30 | 39 | 22 | 3 |
| Lasioglossum (Dialictus) sp. J | 0 | 1 | 0 | 29 | 17 | 31 | 25 | 1 |
| Lasioglossum (Dialictus) sp. K | 0 | 0 | 1 | 0 | 0 | 0 | 0 | 0 |
| HALICTIDAE: Nomiini | ||||||||
| Nomia (Acunomia) nortoni Cresson | 0 | 0 | 0 | 0 | 6 | 0 | 0 | 0 |
| MEGACHILIDAE: Megachilini | ||||||||
| Megachile (Litomegachile) brevis Say | 0 | 0 | 7 | 0 | 7 | 8 | 0 | 4 |
| Megachile (Litomegachile) lippiae Say | 1 | 2 | 0 | 1 | 0 | 4 | 0 | 4 |
| Megachile (Litomegachile) gentilis Cresson | 2 | 9 | 6 | 1 | 6 | 6 | 0 | 5 |
| Megachile (Litomegachile) policaris Cresson | 0 | 10 | 0 | 0 | 4 | 4 | 0 | 3 |
| APIDAE: Anthophorini | ||||||||
| Anthophora californica Cresson | 0 | 1 | 0 | 0 | 2 | 0 | 0 | 0 |
| APIDAE: Ceratini | ||||||||
| Ceratina (Zadontomerus) spp. | 0 | 0 | 0 | 1 | 0 | 9 | 2 | 9 |
| APIDAE: Emphorini | ||||||||
| Diadasia rinconis Cockerell | 0 | 3 | 0 | 0 | 0 | 5 | 0 | 6 |
| Melitoma spp. | 0 | 0 | 0 | 0 | 0 | 0 | 0 | 3 |
| APIDAE: Eucerini | ||||||||
| Florilegus condignus (Cresson) | 1 | 0 | 3 | 2 | 6 | 0 | 0 | 0 |
| Melissodes (Melissodes) communis Cresson | 2 | 0 | 6 | 3 | 6 | 1 | 1 | 0 |
| Melissodes (Melissodes) tepaneca Cresson | 223 | 50 | 255 | 1004 | 1277 | 360 | 786 | 259 |
| Svastra (Epimelissodes) obliqua (Say) | 0 | 8 | 3 | 0 | 9 | 7 | 0 | 0 |
| Svastra (Epimelissodes) petulca (Cresson) | 2 | 1 | 1 | 4 | 3 | 0 | 1 | 2 |
| APIDAE: Xylocopini | ||||||||
| Xylocopa (Notoxylocopa) tabaniformis Smith | 0 | 0 | 0 | 2 | 0 | 0 | 0 | 0 |
| Total Specimens Collected | 367 | 185 | 346 | 1210 | 1505 | 681 | 938 | 331 |
Publisher’s Note: MDPI stays neutral with regard to jurisdictional claims in published maps and institutional affiliations. |
© 2021 by the authors. Licensee MDPI, Basel, Switzerland. This article is an open access article distributed under the terms and conditions of the Creative Commons Attribution (CC BY) license (https://creativecommons.org/licenses/by/4.0/).
Share and Cite
Esquivel, I.L.; Parys, K.A.; Wright, K.W.; Eubanks, M.D.; Oswald, J.D.; Coulson, R.N.; Brewer, M.J. Crop and Semi-Natural Habitat Configuration Affects Diversity and Abundance of Native Bees (Hymenoptera: Anthophila) in a Large-Field Cotton Agroecosystem. Insects 2021, 12, 601. https://0-doi-org.brum.beds.ac.uk/10.3390/insects12070601
Esquivel IL, Parys KA, Wright KW, Eubanks MD, Oswald JD, Coulson RN, Brewer MJ. Crop and Semi-Natural Habitat Configuration Affects Diversity and Abundance of Native Bees (Hymenoptera: Anthophila) in a Large-Field Cotton Agroecosystem. Insects. 2021; 12(7):601. https://0-doi-org.brum.beds.ac.uk/10.3390/insects12070601
Chicago/Turabian StyleEsquivel, Isaac L., Katherine A. Parys, Karen W. Wright, Micky D. Eubanks, John D. Oswald, Robert N. Coulson, and Michael J. Brewer. 2021. "Crop and Semi-Natural Habitat Configuration Affects Diversity and Abundance of Native Bees (Hymenoptera: Anthophila) in a Large-Field Cotton Agroecosystem" Insects 12, no. 7: 601. https://0-doi-org.brum.beds.ac.uk/10.3390/insects12070601