
Evaluation of Optimal Reference Genes for qRT-PCR Analysis in Hyphantria cunea (Drury)
by
Xudong Zhao
1,2, 
Yishu Geng
1,2,
Tianyi Hu
1,2,
Yongang Zhao
3,
Suling Yang
3 and
Dejun Hao
1,2,* 1
Co-Innovation Center for Sustainable Forestry in Southern China, Nanjing Forestry University, Nanjing 210037, China
2
College of Forestry, Nanjing Forestry University, Nanjing 210037, China
3
Forest Station of Huaian District, Huaian 223001, China
*
Author to whom correspondence should be addressed.
Insects 2022, 13(1), 97; https://0-doi-org.brum.beds.ac.uk/10.3390/insects13010097
Submission received: 7 December 2021
/
Revised: 8 January 2022
/
Accepted: 12 January 2022
/
Published: 14 January 2022
(This article belongs to the Section Insect Molecular Biology and Genomics)
Abstract
:Simple Summary
Reverse transcription-quantitative polymerase chain reaction (qRT-PCR) has rapidly become the most accessible and widely-applied method for quantifying gene transcription. Stable reference genes need to be normalized to facilitate gene expression studies and obtain more accurate qRT-PCR data. In this research, eight reference genes from different functional categories and gene families were used to assess the stability level of gene expression under different conditions in H. cunea. Finally, the expression pattern of the target gene serine proteases (HcSP1) was evaluated under different conditions to verify the precision and reliability of the results. This study provides a comprehensive list of suitable reference genes for analyses and optional reference genes for other gene function research in H. cunea.
Abstract
The relative quantification of gene expression is mainly achieved through reverse transcription-quantitative PCR (qRT-PCR); however, its reliability and precision rely on proper data normalization using one or more optimal reference genes. Hyphantria cunea (Drury) has been an invasive pest of forest trees, ornamental plants, and fruit trees in China for many years. Currently, the molecular physiological role of reference genes in H. cunea is unclear, which hinders functional gene study. Therefore, eight common reference genes, RPS26, RPL13, UBI, AK, RPS15, EIF4A, β-actin, α-tub, were selected to evaluate levels of gene expression stability when subjected to varied experimental conditions, including developmental stage and gender, different tissues, larvae reared on different hosts and different larval density. The geNorm, BestKeeper, ΔCt method, and NormFinder statistical algorithms were used to normalize gene transcription data. Furthermore, the stability/suitability of these candidates was ranked overall by RefFinder. This study provides a comprehensive evaluation of reference genes in H. cunea and could help select reference genes for other Lepidoptera species.
1. Introduction
The fall webworm, Hyphantria cunea (Drury) (Lepidoptera: Noctuidae), is a polyphagous leaf-eating pest. It is native to North America and has now spread to more than 32 countries in Asia and Europe [1,2]. In 1979, it was first reported in China as a significant invasive species on the international quarantine list and it is distributed across 13 provinces in China [3,4,5].
The rapid adaptability of the fall webworm is probably due to its high degree of polyphagy and fecundity [6]. The larvae feed on more than 400 species of deciduous tree leaves, including garden trees in urban areas [7]. In its native areas, their activity does not cause significant damage because there are natural enemies. However, the insect has caused considerable loss to host plants, including the consumption of nearly-whole leaves in newly distributed areas [2].
The ecology and physiology of H. cunea have been extensively studied in recent years [4,8,9,10,11,12], but their molecular mechanisms are still unclear. The advent of next-generation sequencing methods makes it possible to investigate the genetic foundation of its physiology and biology.
Due to its high sensitivity, rapidity, specificity, and accuracy [13,14,15], qRT-PCR has been widely used to analyze functional gene transcription and expression levels in animals, plants, and microorganisms [16,17,18,19,20]. However, batch-to-batch variations in RNA extraction and variable efficiency of cDNA synthesis have limited the accuracy and reliability of qRT-PCR [13,21]. Besides, several other factors can also affect the precision and authenticity of qRT-PCR results, such as the accuracy of the biological signals, the yield of the RNA extraction process, quantity and quality of templates used, differences in polymerase reactions, amplification efficiency of primers, and the stability of reference genes [22,23,24]. Therefore, during qRT-PCR assays, it is necessary to normalize the gene transcription data to ensure more accurate and reliable results when comparing the expression of reference and target genes in the same sample after correcting for unnecessary experimental variation.
Recently, ribosomal protein L13 (RPL13), glyceraldehyde-3-phosphate dehydrogenase (GAPDH), ribosomal protein 32 (RP32), actin, β-actin, β-tubulin (β-tub), elongation factors 1a (EF1α) were selected as reference gene(s) to study the function of indicator genes in H. cunea [4,8,9,10,11,12,25,26]. However, the stability of reference genes, in abiotic or biotic conditions, has not been systematically evaluated and validated. Therefore, there is an urgent need to identify and validate reference genes suitable for H. cunea.
In this study, the expression stability of eight candidate reference genes was assessed in H. cunea, including RPL13, arginine kinase (AK), eukaryotic initiation factor 4A (EIF4A), α-tubulin (α-tub), polyubiquitin (UBI), ribosomal protein S26 (RPS26), ribosomal protein S15 (RPS15), and β-actin. These reference genes were selected from different functional categories and gene families to prevent the influence of co-regulation. These candidate genes were assessed under varying abiotic conditions (i.e., different hosts, larval density) and biotic factors (i.e., developmental stage and gender and different tissues) by using the four statistical algorithms: geNorm [27], NormFinder [28], BestKeeper [29], and the ΔCt method [30]. Moreover, RefFinder, a comprehensive platform that can integrate the above-mentioned algorithms, comprehensively compared and ranked the overall stability of these candidates [31]. Our results provide a comprehensive assessment of the reference genes and validate their stability and reliability in H. cunea, and they also provide a valuable resource to select reference genes for other lepidopterans.
2. Materials and Methods
2.1. Insect Culture
Third instar larvae were collected from Populus deltoides (Marshall) in Huaian county of Jiangsu Province (33.62° N, 119.02° E) in May 2020, and were reared with fresh Populus leaves in a light incubator at 25 ± 1 °C with a 16 h light/8 h dark cycle and 60 ± 5% humidity. Leaves were replaced every two days until the larvae pupated. Pupae were sexed based on the morphology of a few terminal abdominal segments and maintained under the same conditions as larval rearing. A total of 80 newly emerged adults (at a ratio of 1 female to 3 males) were placed in screen cages (40 × 50 × 30 cm) at room temperature for mating and oviposition.
2.2. Experimental Treatments
2.2.1. Developmental Stages and Gender
Samples were collected from each developmental stage and gender of H. cunea and included 200 eggs, 10–20 1st–6th instar larvae, 5 pupae (3 days old), 5 male and female adults (2 days old). Then, they were flash-frozen in liquid nitrogen and stored at −80 °C until use. Each sample was collected in triplicate.
2.2.2. Tissues
Tissue samples (head, silk gland, midgut, cuticle, Malpighian tubule, and fat body) were collected from 10 4th instars (2 or 3 days-old) following molting, which were dissected under a binocular microscope by using a sterilized scalpel and tweezers on ice. Each sample was treated and stored as above.
2.2.3. Reared on Different Hosts
The newly-hatched larvae were obtained from an established population reared on artificial diets, classified into four groups, and maintained on different host plants for one generation. The 4th instar larvae from the next generation were used for collection. The four plant species examined were Populus deltoides (Marshall), Camptotheca acuminata, Cerasus serrulata var. lannesiana, Cerasus serrulata (Lindl.). Each sample was treated and stored as above.
2.2.4. Different Larval Density
The fall webworm colony was reared for two generations on artificial diets. In the first-generation, the larvae were reared at a fixed density (50 larvae/box (21.5 × 14.5 × 7 cm)). Subsequently, in the next generation, newborn larvae were classified into six density groups of 1, 3, 6, 9, 12, and 15 larvae per Petri dish (diameter 8 cm). For all the density treatments, the number of larvae was kept the same during the feeding period. New artificial diets were supplemented every day. Each sample was treated and stored as above.
2.3. Total RNA Isolation and cDNA Synthesis
According to the manufacturer’s protocol, total RNA was isolated from each sample using TRIzol reagent (Invitrogen, Carlsbad, CA, USA), and subsequently treated with DNase-treatment (Vazyme, Nanjing, China). The RNA integrity and purity were determined by 1% agarose gel electrophoresis and assessed by a Nano-Drop 2000 Spectrophotometer (Thermo Scientific, Wilmington, DE, USA). Finally, 1000 ng of total RNA were used to synthesize cDNA by HiScript 1st Strand cDNA Synthesis Kit (Vazyme, Nanjing, China), then applied to both PCR and qRT-PCR.
2.4. Identification of Candidate Reference Genes, One Target Gene, and Primers Design
Based on H. cunea transcriptomic data (unpublished), sequences corresponding to eight candidate reference genes (β-actin, RPL13, AK, EIF4A, α-tub, UBI, RPS26, and RPS15) were amplified by PCR from H. cunea cDNA. The primer sequences used for gene cloning are shown in the Supplementary Materials, Table S1. The PCR program included 3 min at 95 °C, 30 cycles of 95 °C for 10 s, 50 °C for 15 s, and 72 °C for 50 s, and 72 °C for 5 min. The PCR products were detected by 1.5% agarose gel and extracted by a DNA purification kit (TIANGEN, Beijing, China). Subsequently, the fragments were ligated to pCE2 vector and transformed into DH5α competent cells (Vazyme, Nanjing, China). Afterward, the positive clones were selected randomly for each construct and sequenced by SHENGGONG BIOLOGY (Shanghai, China). After verifying the candidate reference genes, an online tool (http://www.primer3plus.com/cgi-bin/dev/primer3plus.cgi#opennewwindow 22 November 2021) was used to design the primers for qRT-PCR analyses. The specificity of primers was determined based on qRT-PCR and melting curve analysis. The presence of individual peaks confirmed the specificity of amplicons.
2.5. qRT-PCR
The qRT-PCR reactions were performed in the ABI 7500 System (Applied Biosystems, Foster City, CA, USA). A total of 20 µL reaction volume was configured by the protocol of Hieff UNICON® qPCR SYBR Green Master Mix (YEASEN, Shanghai, China), and contained 10 µL 2 × SYBR Premix Ex Taq™ II, 0.4 µL (10 μM) of each gene-specific primer, 1.2 µL of cDNA, and 8 µL of ddH2O. The thermal cycling conditions were as follows: 95 °C for 5 min, 40 cycles of 95 °C for 10 s, and 60 °C for 40 s. Subsequently, a melting curve analysis was conducted in the 60–95 °C temperature range to verify the consistency and specificity of each reaction product.
A series of 10-fold dilutions of cDNAs from 500 ng/µL to 0.05 ng/µL were used to make the five-point standard curves by using a linear regression model. The following equation was used to estimate the qRT-PCR amplification efficiency (E) of all genes: E = (10[−1/slope] − 1) × 100%.
2.6. Expression Stability of Candidate Reference Genes under Different Conditions
The ABI 7500 System software (ver. 2.3) (Applied Biosystems, USA) was used to analyze the qRT-PCR data. In this study, the expression stability of each candidate gene was calculated and ranked by four statistical algorithms: geNorm [27], BestKeeper [29], NormFinder [28], and the comparative delta Ct algorithm [30].
The GeNorm algorithm appraised the stability of the candidate reference gene on the basis of the “M” value [27]. The lowest M value indicated the most stable expression genes. Moreover, GeNorm also determined the optimal number of reference genes. The pairwise variation value calculated by geNorm (Vn/Vn+1) was below 0.15, suggesting no additional reference genes were required for normalization. NormFinder calculated the stability value (SV) of candidate reference genes. The lower the SV, the more stable they were [28]. The BestKeeper program was used to evaluate standard deviations (SD) of the Ct values, which determined the stability of reference genes [29]. The comparative ΔCt method calculated the mean standard deviation of Ct values for candidate reference genes and then determined the stability based on the delta Ct values. Candidate reference genes with higher delta Ct variability were considered as the least stable.
Finally, a web-based comprehensive tool, RefFinder (https://www.heartcure.com.au/reffinder/ 10 December 2021), which can integrate the four computational programs (geNorm, BestKeeper, Normfinder, and the ΔCt methods), was used to comprehensively compare and rank the candidate reference genes [31]. It assigned an appropriate weight to each gene and calculated the geometrical mean of their weights for the final rank.
2.7. Validation of Reference Genes
To validate the recommended reference genes, we selected the serine proteases (HcSP1) that are widely distributed in insects as the target gene. They are the most dominant digestive enzymes and play an important role in the protein hydrolysis process in Lepidopteran larval guts, accounting for about 95% of the digestive activity [32,33]. The transcription levels of HcSP1 were estimated in different development stages, tissues, larval density, and fourth instar larvae after feeding on different host plants. qRT-PCR amplification of HcSP1 (Accession number: MH663425) was performed with primers as follows: Forward (AACAGGAATAACCGCCCACTAC) and Reverse (GGCAAGGATCCAGCTAATGAAA). The relative expression levels of HcSP1 were determined according to the 2−ΔΔCt method [34].
3. Results
3.1. Amplification Specificity and Efficiency of Candidate Reference Genes
Agarose gel electrophoresis and melting curve analysis by qRT-PCR were performed to evaluate the amplification specificity and efficiency of the primers. The results indicated that all the primers of candidate genes showed a single amplicon with a predicted strip size ranging from 92 to 165 bp on 1% agarose gel (Figure S1A). Furthermore, melting curve analysis exhibited individual peaks that confirmed the amplification specificity of primer pairs (Figure S1B), and all amplicons were sequenced and showed 99–100% similarity with the transcriptomic sequences. The efficiency (E) of qRT-PCR and correlation coefficient (R2) for each standard curve are shown in Table S1. The efficiencies of all tested primer pairs ranged from 87.0 for HcSP1 to 127.4% for RPL13, with associated R2 values of 0.974–0.999 (Table S1).
3.2. Expression Profiles of Candidate Reference Genes
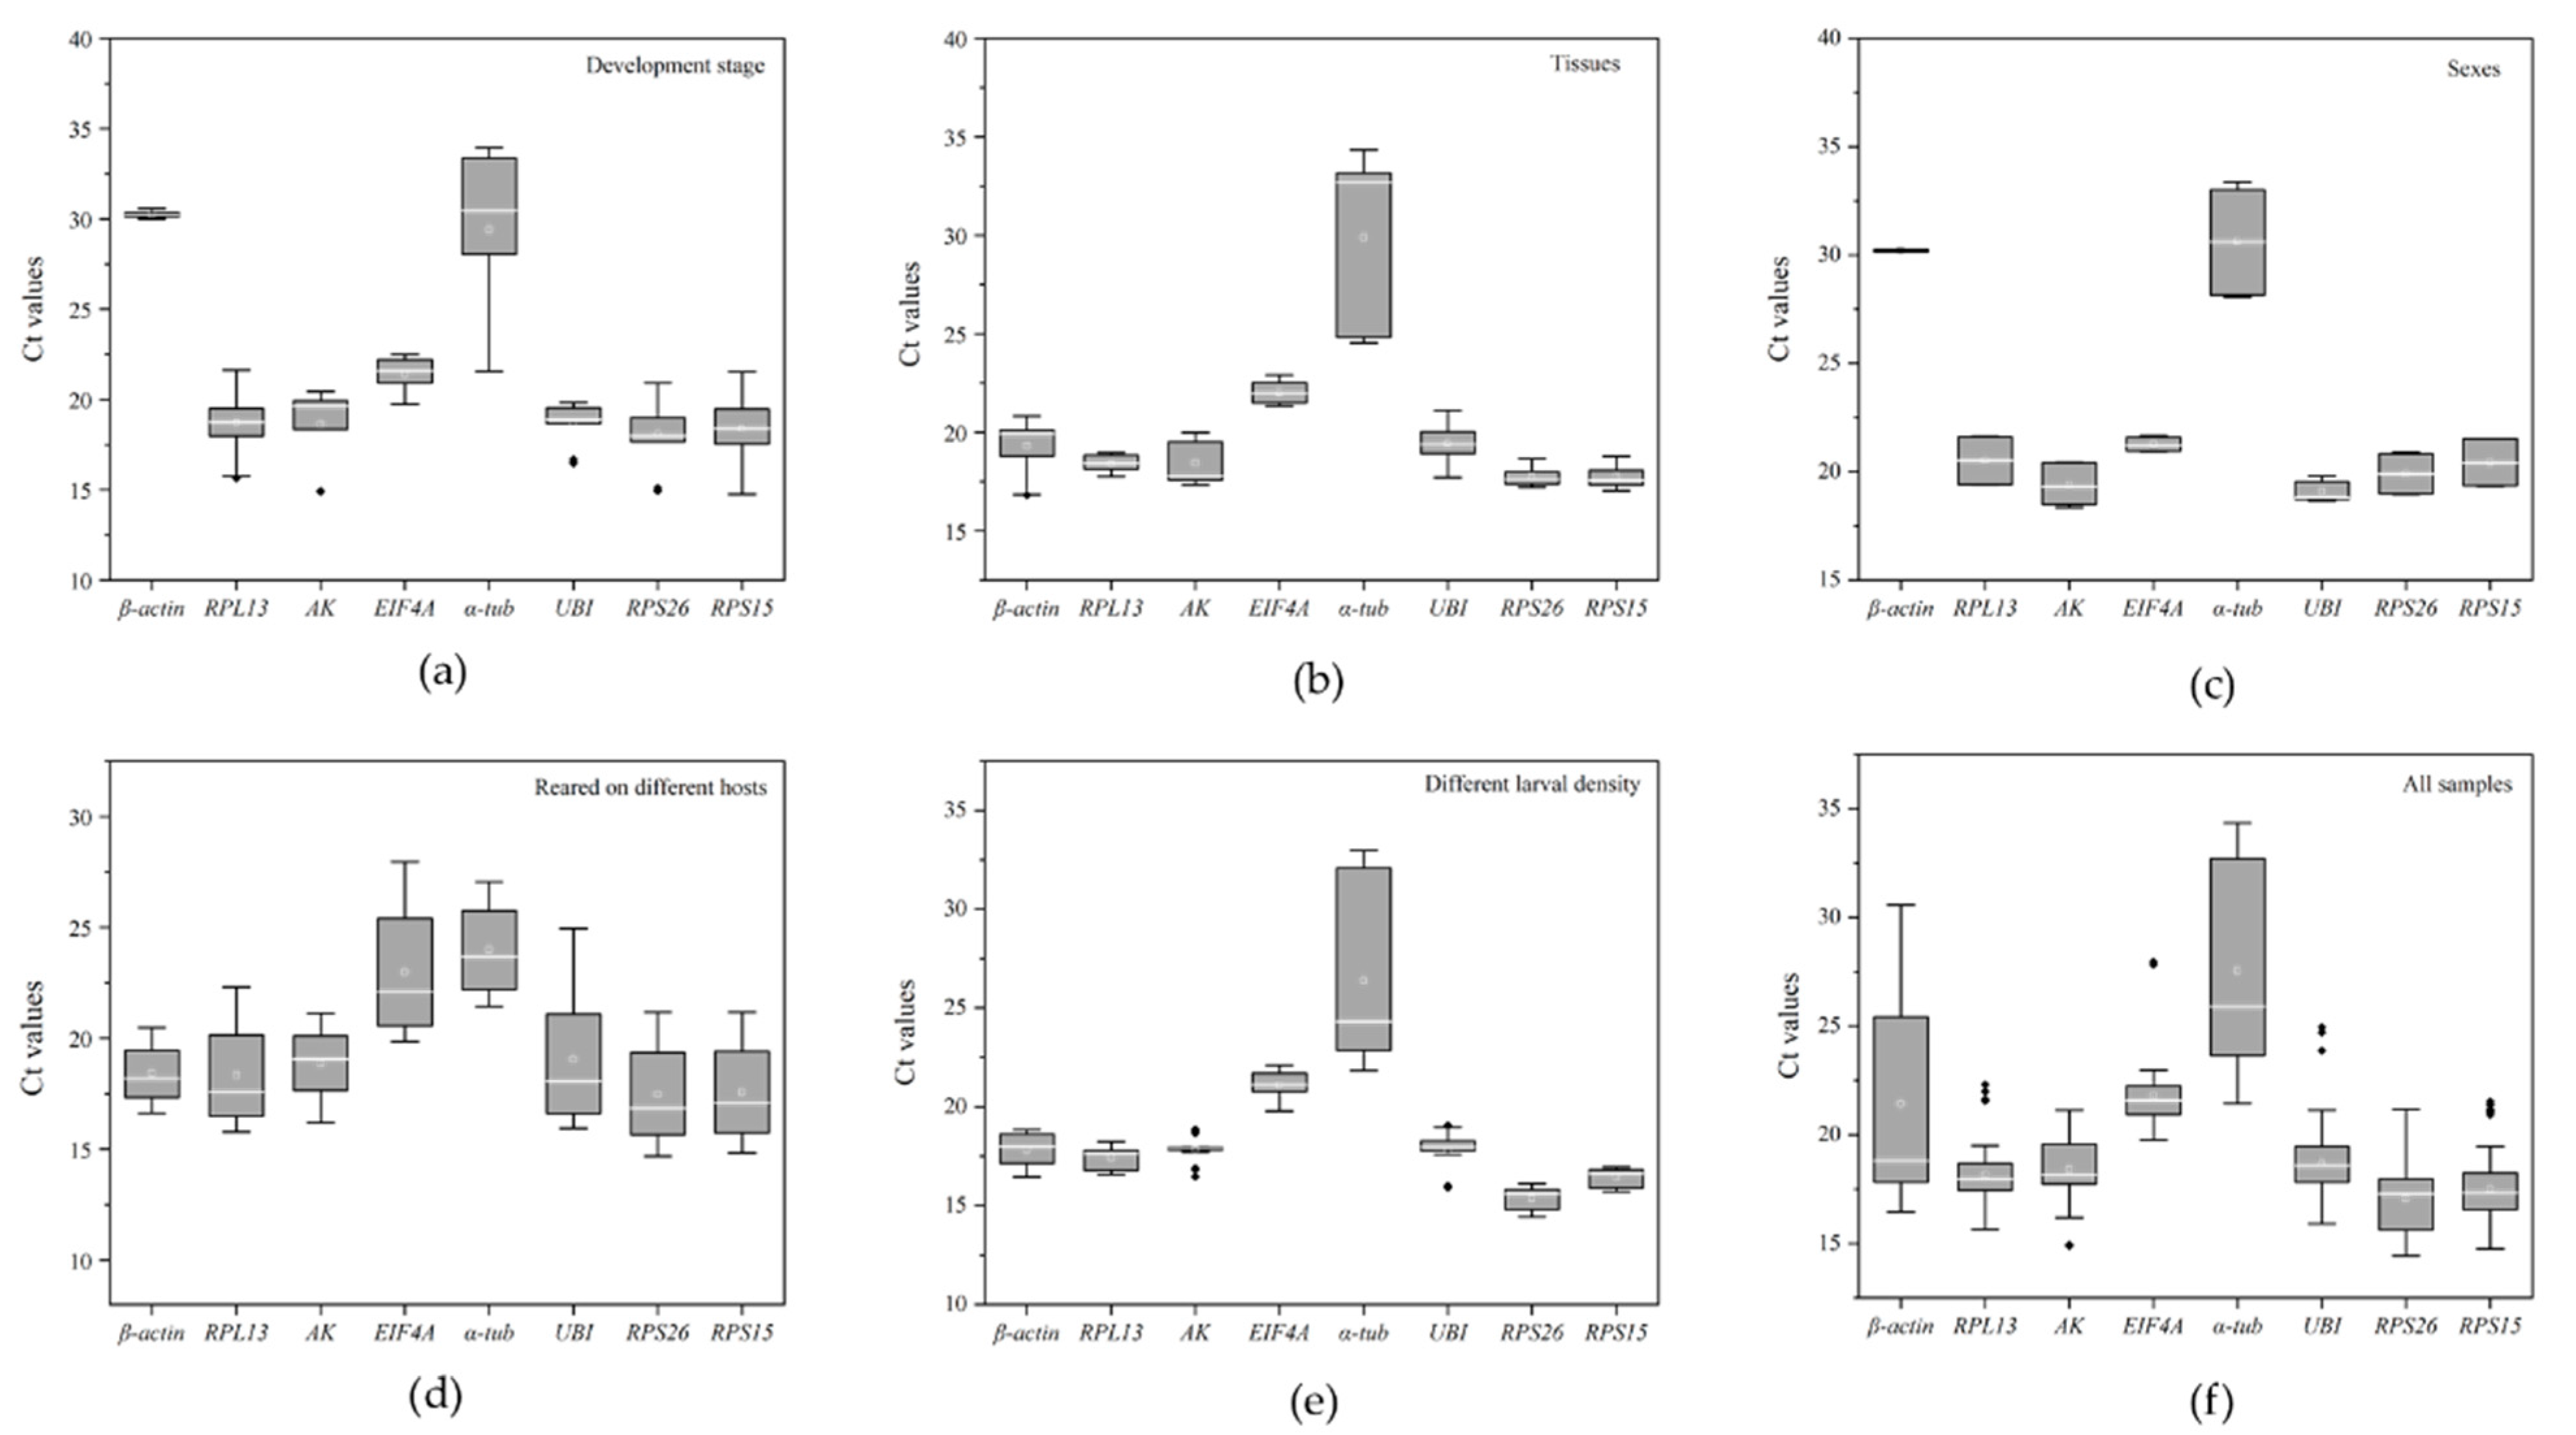
The cycle threshold (Ct) values under different conditions were calculated by qRT-PCR to evaluate the transcription levels of the eight candidate reference genes (Figure 1). The Ct mean values ranged from 14.4–34.3 cycles. α-tub exhibited a mean Ct-value > 26 cycles, while the other candidate reference genes (β-actin, RPL13, AK, EIF4A, UBI, RPS26, and RPS15) ranged from 14 to 22 cycles (Figure 1a–f). RPS26 (average Ct value = 17.08) and RPS15 (average Ct value = 17.50) were expressed at the highest levels while α-tub (average Ct value = 27.61) was expressed at the lowest level. Moreover, the gene β-actin showed the greatest variation (SD ± 4.42) in the Ct values (ranging from 16.45 to 30.57), while RPL13 showed the smallest variation (SD ± 1.08) in Ct values (ranging from 15.63 to 22.30) (Figure 1f).
3.3. Expression Stability of Candidate Reference Genes under Different Conditions
The results of the analysis of the stability of the candidate reference genes were as follows.
3.3.1. Developmental Stage and Gender
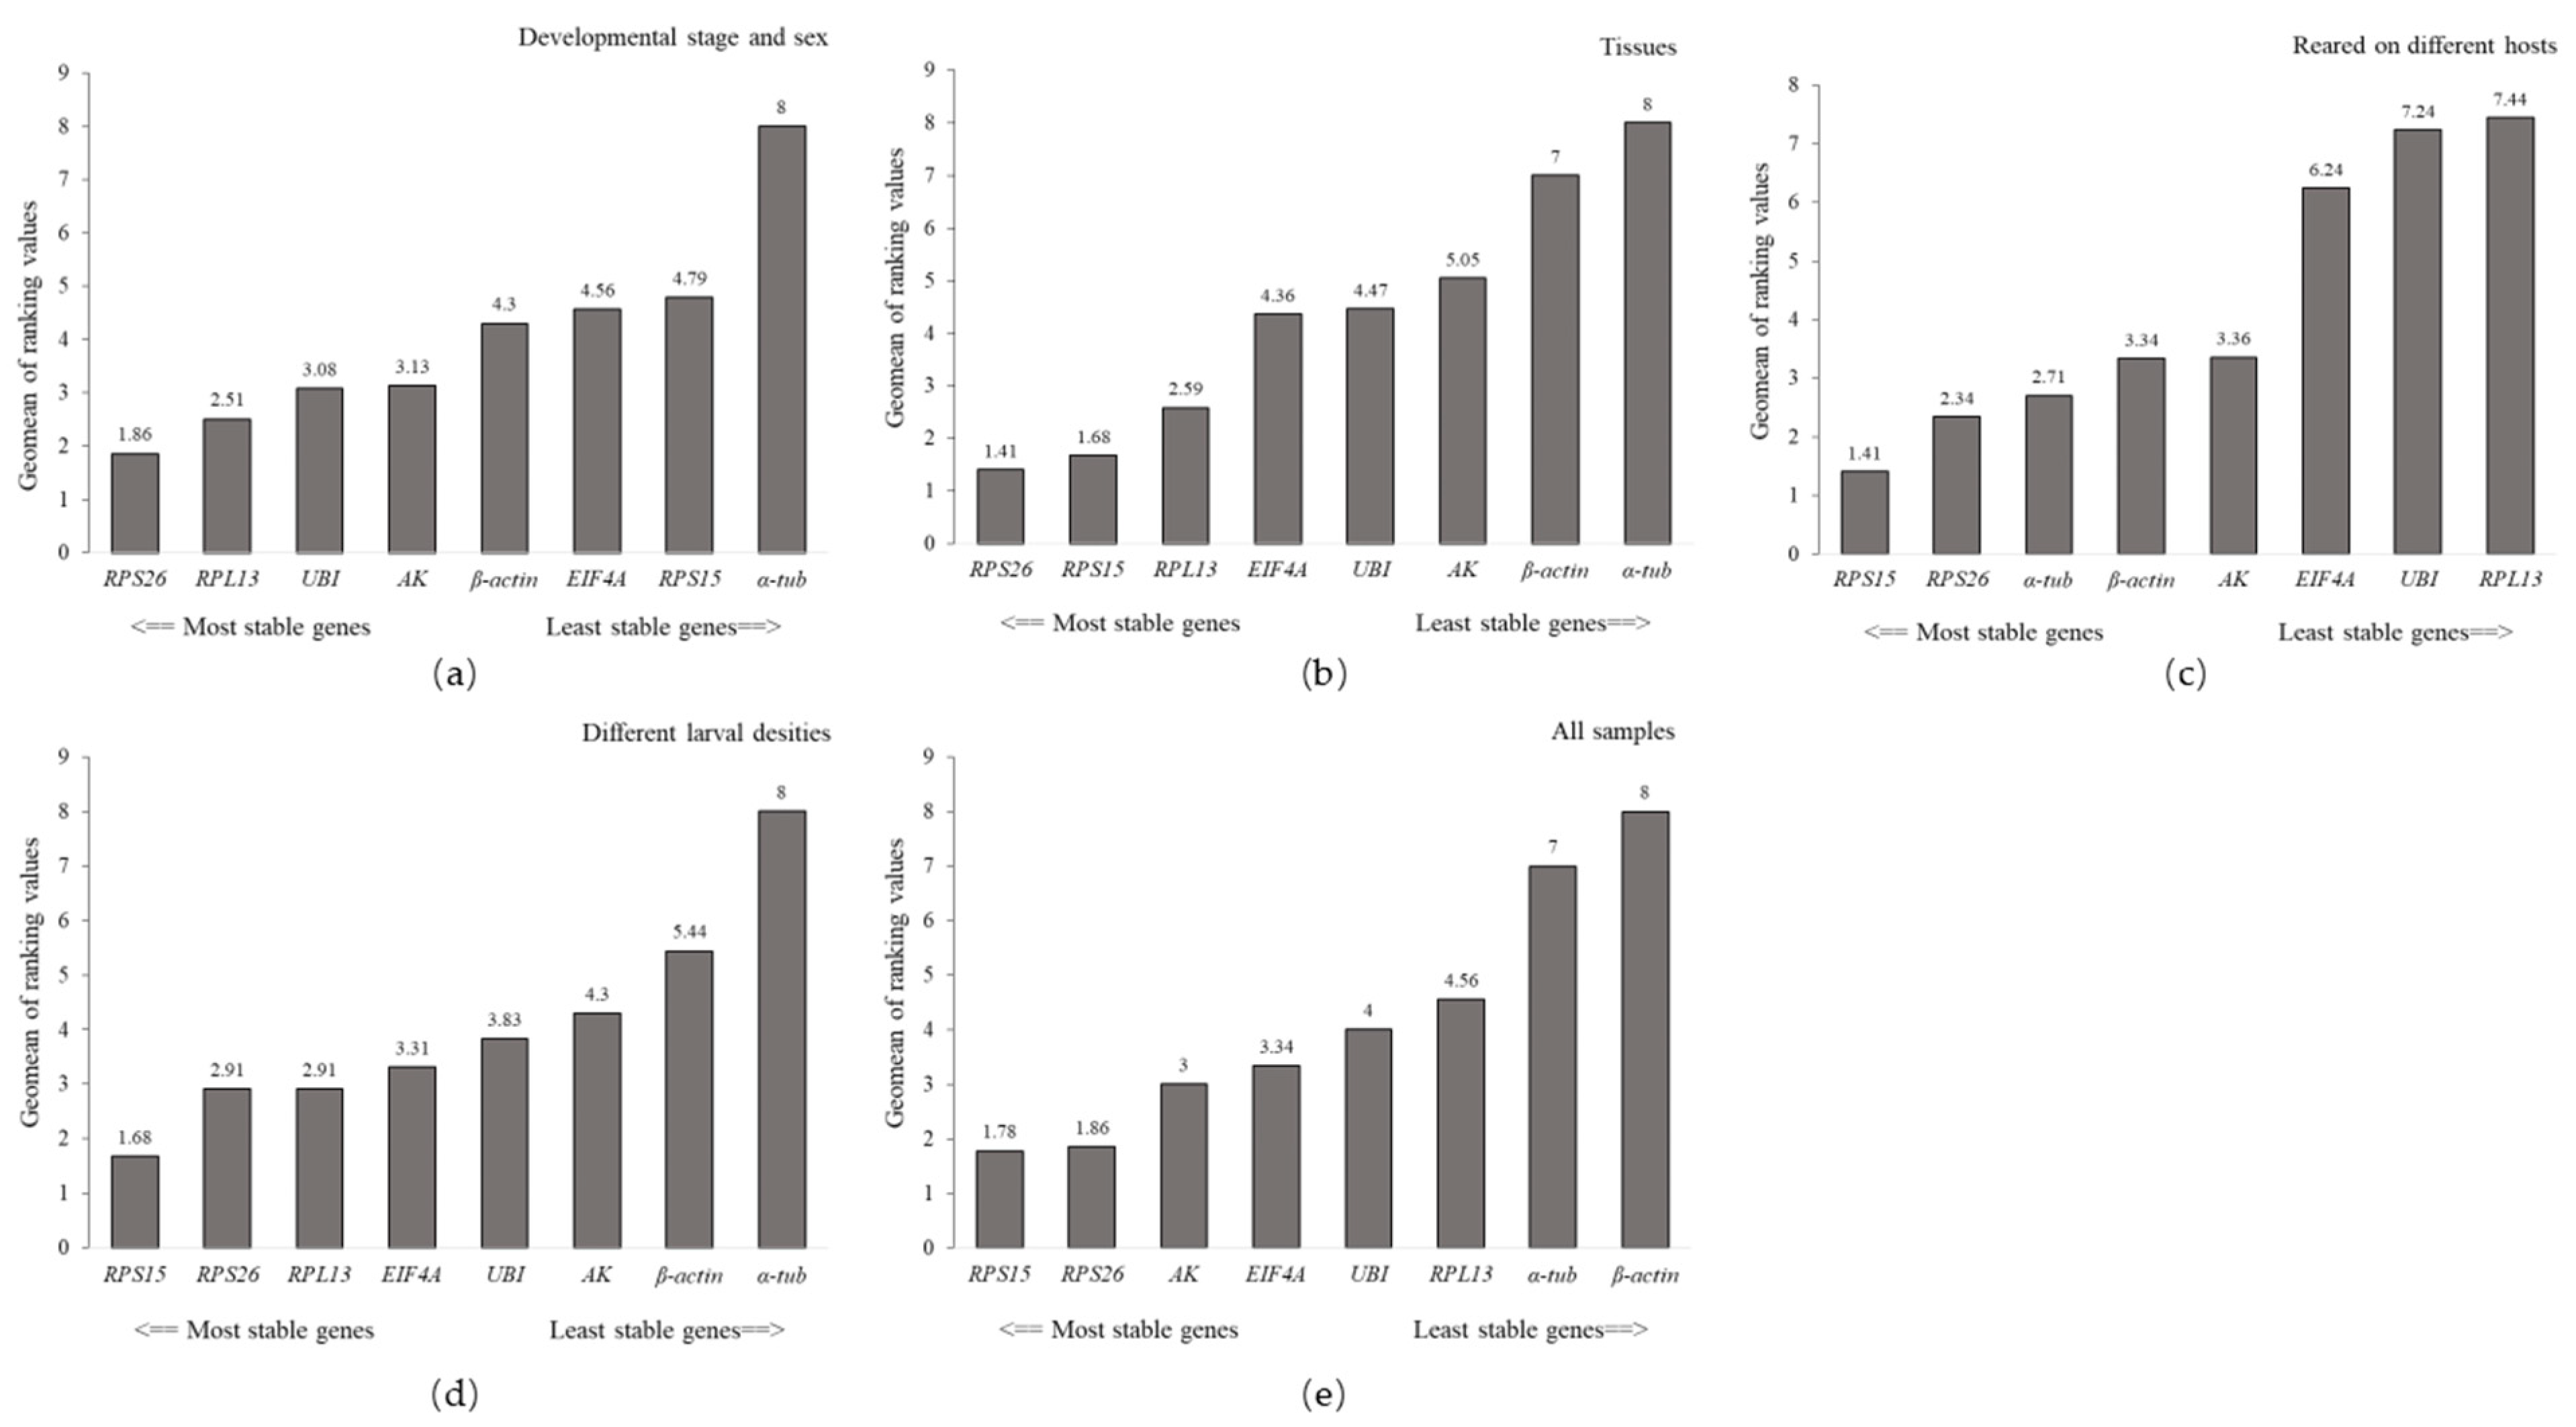
The BestKeeper and NormFinder indicated that β-actin and AK were the most stable in different developmental stages and gender, respectively. In contrast, α-tub exhibited the greatest variation (Table 1). Based on the ΔCt method, RPS26 and RPL13 were the two most stable reference genes (Table 1). Similarly, the lowest M (0.205) value for the RPS26/RPL13 pair was calculated by GeNorm, suggesting they were the most stable transcripts. The RefFinder ranked the stability of candidate genes from highest to lowest as follows: RPS26 > RPL13 > UBI > AK > β-actin > EIF4A > RPS15 > α-tub (Figure 2).
3.3.2. Tissues
The four algorithms consistently suggested RPS15, RPS26, and RPL13 were the most stable reference genes, whereas α-tub and β-actin were unsuitable reference genes in different tissues. The RefFinder ranked the overall stability of reference genes for tissues (from highest to lowest) as: RPS26 > RPS15 > RPL13 > EIF4A > UBI > AK > β-actin > α-tub (Figure 2).
3.3.3. Reared on Different Plants
The ranking of the stability of candidate reference genes in regard to the larvae feeding on different plants was diverse according to the four algorithms. The most stable reference gene was RPS15 according to the geNorm algorithm and ΔCt method. However, β-actin was the most stable reference gene according to BestKeeper. In addition, the lowest M value for the RPS26/RPS15 pair (0.189) calculated by geNorm, indicated they were the most stable transcripts. RefFinder evaluated the stability ranking of eight candidate reference genes from the most to the least stable as RPS15 > RPS26 > α-tub > β-actin > AK > EIF4A > UBI > RPL13 (Figure 2).
3.3.4. Different Larval Density
BestKeeper and NormFinder suggested that UBI and AK were the most stable genes in different larval densities, whereas the ΔCt method evaluated RPS15 as the most stable gene, geNorm identified RPS15 and RPS26 as the best pair. α-tub was again identified as the least stable reference gene by all four algorithms (Table 1). The RefFinder ranking was: RPS15 > RPS26 > RPL13 > EIF4A > UBI > AK > β-actin > α-tub (Figure 2).
3.3.5. All Samples
In the final experiment, candidate genes were evaluated to determine the optimal reference gene in all samples. The ΔCt method and NormFinder suggested that RPS15 and RPS26 were the two most stable genes. Similarly, the geNorm identified RPS15 and RPS26 as the best pair, while BestKeeper ranked EIF4A as the most stable gene. Furthermore, β-actin was selected as the least stable reference gene by all four algorithms in all samples. The RefFinder ranking was: RPS15 > RPS26 > AK > EIF4A > UBI > RPL13 > α-tub > β-actin (Figure 2).
3.4. Determination of the Optimal Number of Reference Genes for Normalization
Based on the pairwise variation (Vn/Vn+1) of all experimental conditions calculated by geNorm, all experimental conditions showed values below the proposed 0.15 cut-off value at V2/3. This indicated that combining the top two reference genes would be sufficient for the normalization of gene expression data (Figure 3).
3.5. Validation of Selected Reference Genes in H. cunea
The relative transcript levels of the target gene HcSP1 under all conditions were normalized to verify the stability of the selected reference genes by the top-ranked genes, the least stable gene, and the combination of stable reference genes, respectively.
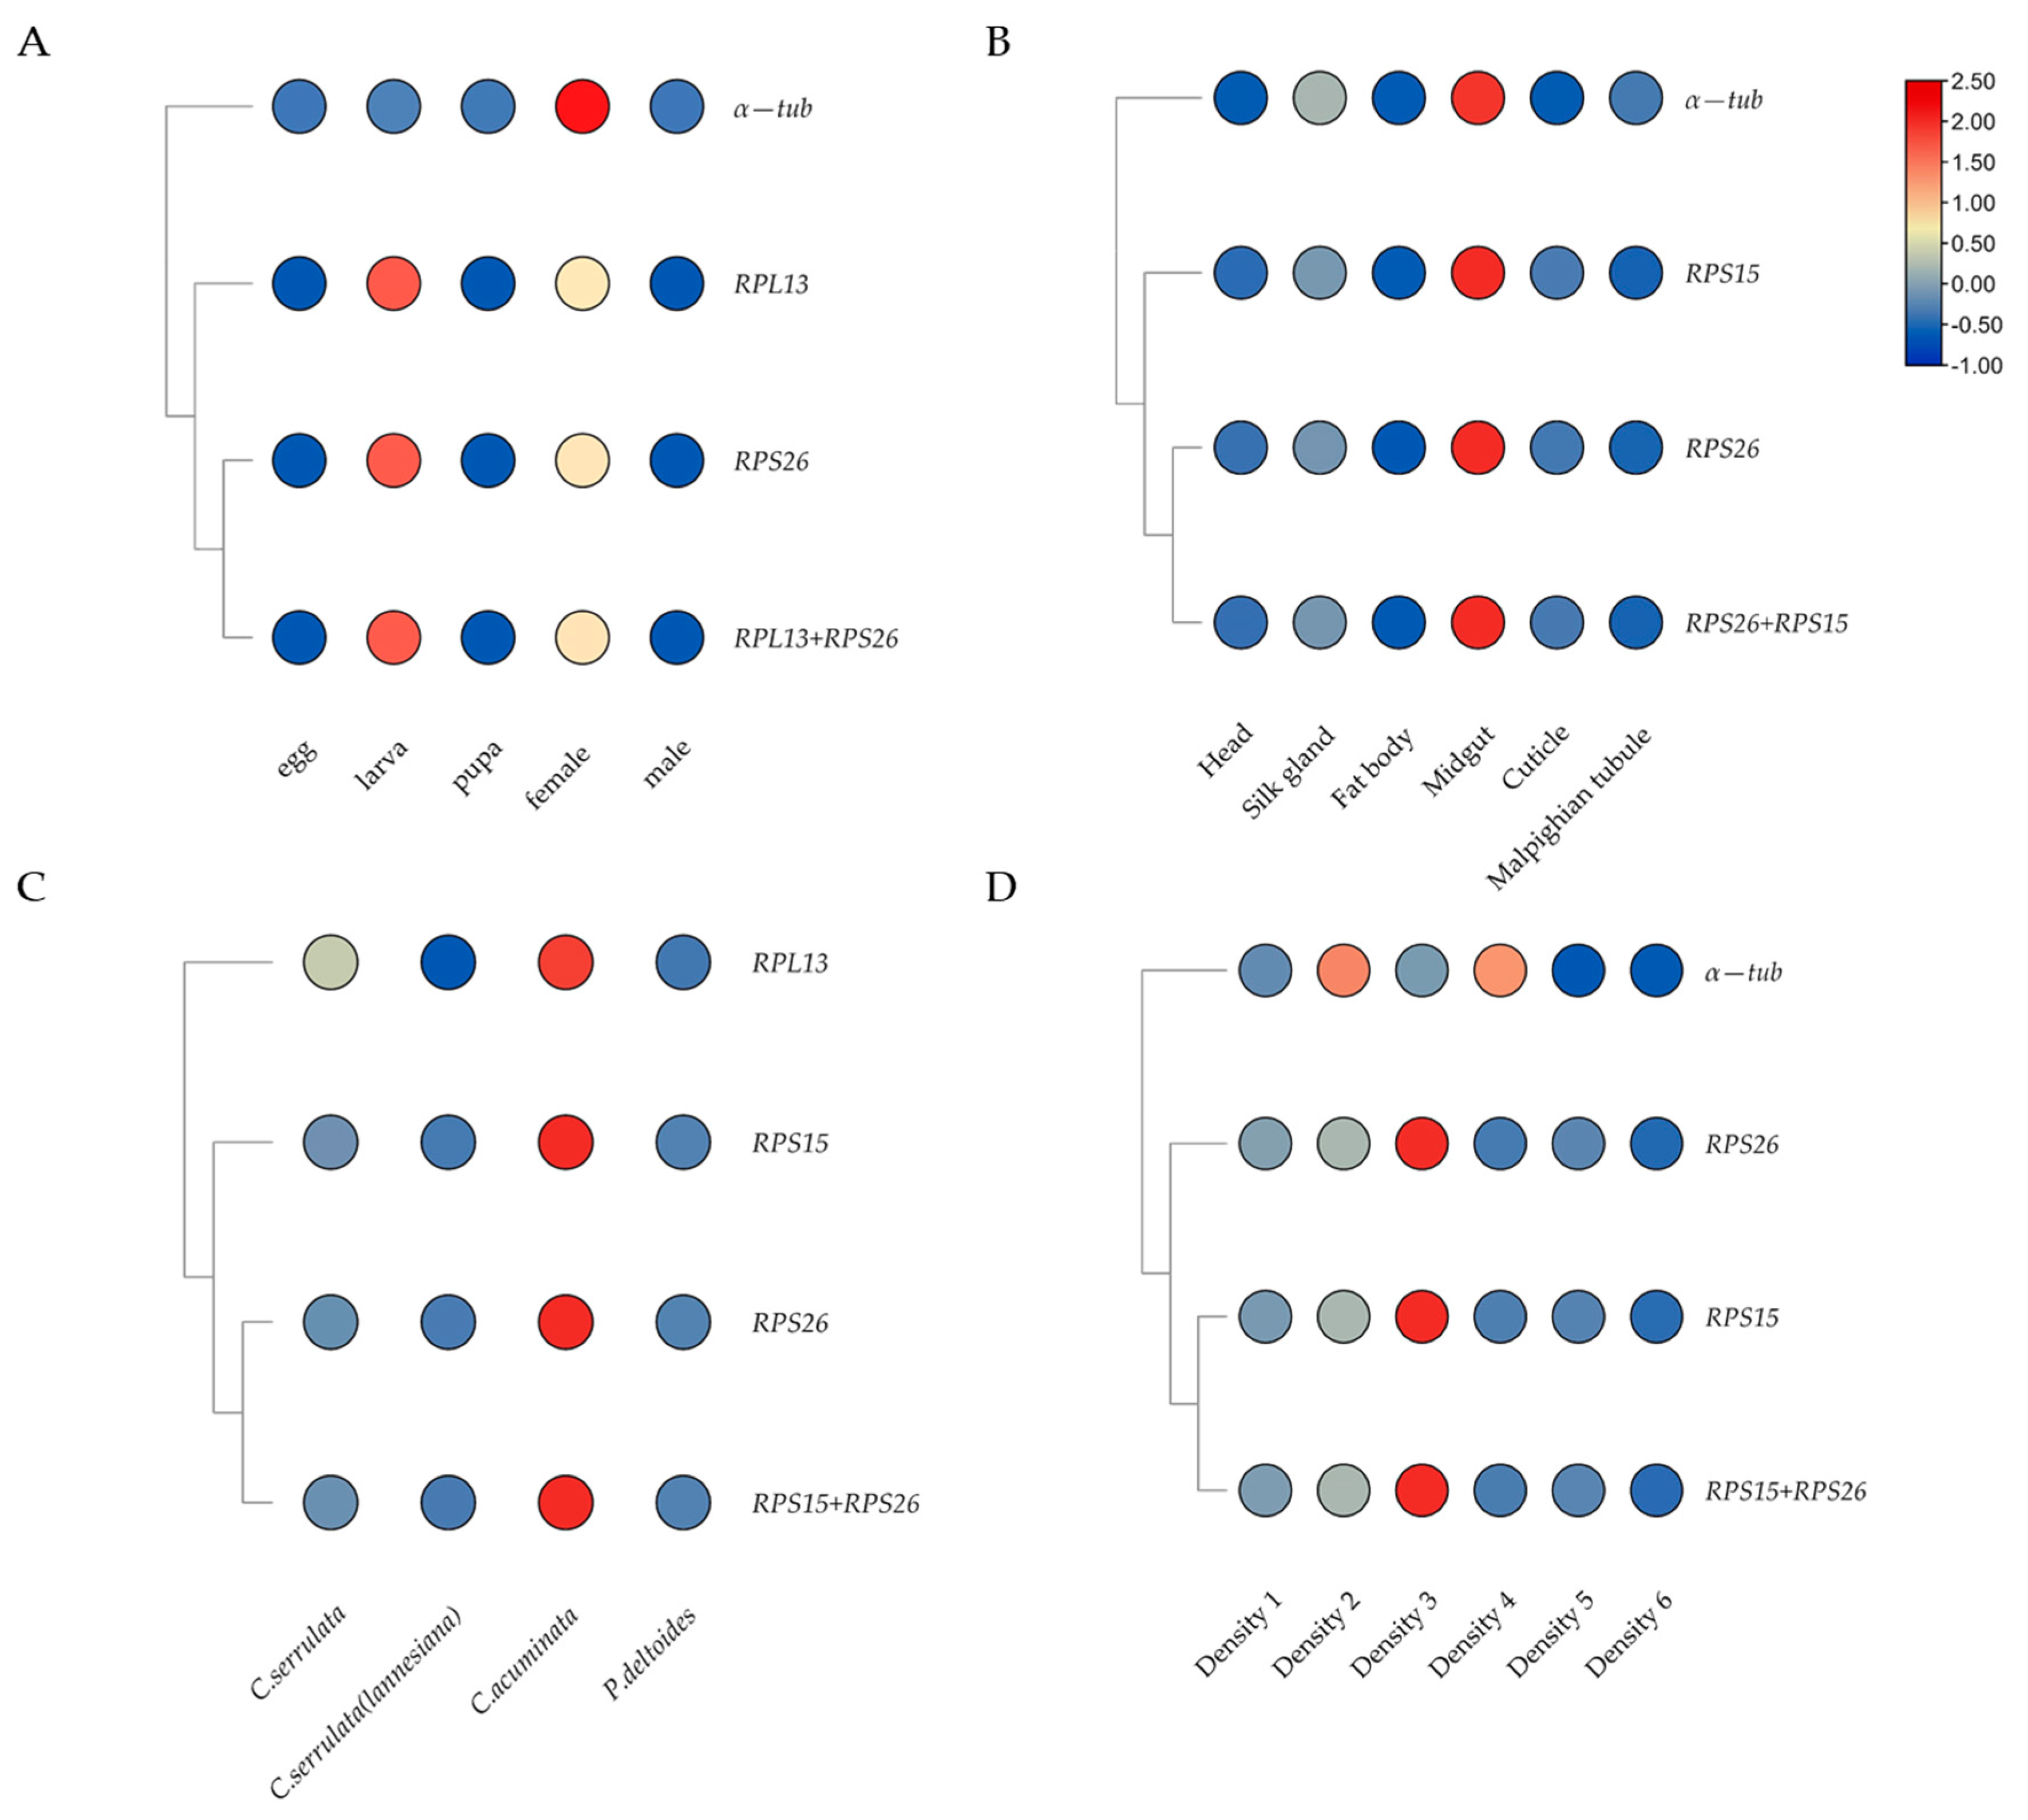
The relative expression level of HcSP1 was significantly up-regulated in the midgut compared to other tissues, which was normalized by the top-ranked gene (RPS26 or RPS15) (Figure 4). Similar expression-profile changes were obtained by the combination of stable reference genes (RPS26 + RPS15), and there were no significant differences among those normalized by RPS26 and RPS15 individually, and RPS26 + RPS15. However, when the normalization by the least stable reference gene (α-tub) led to a strong bias in the expression level of HcSP1 in different tissues, it significantly increased the transcription of HcSP1 in the midgut and silk glands, and decreased in the head and cuticle. At the developmental stage and different larval densities, the expression levels of HcSP1 normalized by RPS26 and RPS15 individually, or RPS26 + RPS15 were different with α-tub. While normalized by α-tub, the expression of HcSP1 decreased in the larval stage and density 5 and 6 (12 and 15 larvae per Petri dish) and significantly increased in density 2 and 4. For larvae feeding on different hosts, the expression levels of HcSP1 were normalized by RPS26, RPS15, RPS26 + RPS15, and RPL13. Although the expression trends were very similar, normalization with the unstable reference gene RPL13 increased the expression level of HcSP1 in larvae reared on C. serrulata and resulted in larger standard deviation values.
4. Discussion
Due to its high sensitivity, rapidity, specificity, and accuracy, the qRT-PCR has become a standard procedure to measure target gene transcript levels and has been widely used for functional gene analysis in insects. However, the assessment of reference genes is an essential procedure to normalize target gene expression and ensure data precision [35,36,37,38,39]. The ideal reference genes must be stably transcribed under any condition, whether it is under different species, varieties, tissues, abiotic and biotic stresses, etc. Unfortunately, when species and experimental conditions vary, selecting the perfect reference gene became problematic. In Lepidoptera insects, such as Spodoptera litura (Lepidoptera: Noctuidae) [38]; Plutella xylostella (L.) (Lepidoptera, Plutellidae) [40]; Danaus plexippus (Lepidoptera, Nymphalidae) [41]; Sesamia inferens (Walker) (Lepidoptera, Noctuidae) [39]; Thitarodes armoricanus (Lepidoptera, Hepialidae) [42]; Helicoverpa armigera (Hübner) (Lepidoptera, Noctuidae) [43], and Chilo suppressalis (Walker) (Lepidoptera, Pyralidae) [44]; Trichoplusia ni (Lepidoptera: Saturniidae) [45] Diaphania caesalis (Lepidoptera, Pyralidae) [46]; Tuta absoluta Meyrick (Lepidoptera: Gelechiidae) [47], the stability of reference genes has been well studied, and these studies showed significant differences among different species in different conditions.
H. cunea has caused significant economic damage, mainly to forest trees, ornamental plants, and fruit trees. Its molecular physiology and the function of the gene(s) has been actively explored with the publication of genomes [6,11], and recent transcriptomic advances [4,48,49] have opened a window for functional genomics research and interesting gene transcription and regulation studies. In the present study, the stability of reference genes in H. cunea was evaluated under different experimental designs by four statistical algorithms (ΔCt, geNorm, NormFinder, and Bestkeeper) to obtain a reliable assessment and avoid selecting co-regulated transcripts. In our results, the most suitable reference gene varied with the conditions. The ranking of genes by geNorm, NormFinder, BestKeeper, and ΔCt algorithms was diverse, probably because different programs have different algorithmic logic [50], and the differences in the scaling systems used by the algorithms can also lead to these variations [35,51]. Although the ranking order varies depending on the analysis program used, the overall trend was similar. Therefore, we used RefFinder, which integrated the four computational programs to comprehensively compare and rank the overall stability of candidate reference genes.
In this study, the geNorm suggested that RPL13/RPS26 was the most stable pair depending on M values in the developmental stages; the ΔCt method and RefFinder were consistent with the geNorm. At the same time, RPS26 and RPS15 were identified as optimal reference genes in different tissue types, different larval densities, and larvae reared on different hosts by combining the four algorithms and RefFinder. Besides, it was observed that host plants induced more variations in the Ct values in H. cunea. In Amphitetranychus viennensis, host plants caused dramatic variations in the Ct values and can cause significant changes in A. viennensis at the molecular level [52]. Plants respond to herbivory through various morphological, biochemical, and molecular mechanisms to counter/offset the effects of herbivore attacks. Inhibitors and secondary metabolites produced by host plants may affect the gene expression of herbivores, subsequently affecting their physiology and phenotype [53,54]. In previous studies, under the same rearing conditions, H. cunea larvae feeding on different host plants had a significant impact on larval growth and development, feeding behavior, detoxification enzyme activity, and digestive enzymes activity [55,56]. This study suggested that host plants can also cause variations in transcript levels in H. cunea.
In the reference gene selection studies, ribosomal proteins exhibited the same stability compared to other types of candidate genes in relation to the abiotic (reared on different hosts and variety of larval densities) and other biotic (developmental stages and multiple tissue types) factors. Other detailed studies have yielded similar results. Ribosomal proteins have been reported as optimal reference genes in several insects. For example, in Dichelops melacanthus, RPS23 exhibited a high level of stability in different genders and tissues as well as RPL9 for starvation stress and RPL10 for tissues in Pagiophloeus tsushimanus [57,58]. In Adelphocoris suturalis, RPS15 and RPL32 were identified as the most stable pair for metathoracic scent glands from different developmental stages and gender [59]. In Bradysia odoriphaga, RPS15 was a particularly stable reference gene in different temperature treatments [60]. Our results and previous studies demonstrate that ribosome proteins generally show extremely high stability under diverse conditions in insects. In eukaryotes, ribosome proteins are highly conserved and they are involved in the processes of DNA repair, replication, and transcription; RNA processing, translation, and regulation; protein synthesis; self-translational regulation; and developmental regulation. Therefore, they are used in most eukaryotes for reference genes [61,62].
β-actin and α-tub were often selected as internal reference genes. For example, actin was the most stable reference gene in development stages, different tissues, and sex of Diaphania caesalis [46]. In C. bowringi Baly [36], actin was used to normalize target gene expressions in the tissues of female adults. In experiments with the Antheraea pernyi infected by multicapsid nucleopolyhedrovirus, actin and α-tub were suitable reference genes for normalizing qRT-PCR data [45]. However, under certain conditions, β-actin and α-tub were unstable as reference genes. In our research, β-actin and α-tub showed instability in most conditions (different tissue types, larval densities, and all samples) evaluated by combining four algorithms and RefFinder. Consistent with results for A. suturalis, while subjected to several experimental conditions, β-actin was particularly inconstant in these conditions [59]. After fungal challenge experiments with Tribolium castaneum, β-actin and α-tub also showed instability for qRT-PCR data normalization [63].
Most studies have shown that combining multiple reference genes rather than a single reference gene can increase the precision of relative quantification [27,64,65]. In this study, when the pairwise variation (Vn/Vn+1) of all experimental conditions was calculated by geNorm, all of the experimental conditions showed values below the proposed 0.15 cut-off value at V2/3. This indicates that combining the top two reference genes would be adequate for the normalization of gene expression data.
Furthermore, the accuracy of the reference genes screened by different computational methods needs to be verified, and the HcSP1 was selected as the target gene. The overall transcriptional pattern of HcSP1 normalized by the most stable reference gene was similar using a combination of optimal reference genes at different developmental stages, multiple tissue types, different larval densities, and larvae feeding on different host plants. The expression level of HcSP1 reached a peak at the larval stage when normalized by the top-ranked genes and the combination of stable reference genes, which is consistent with results from P. xylostella (L.) [66], S. litura [67], and Mythimna separata Walker [68]. On the contrary, normalization with α-tub showed the highest transcription of HcSP1 in female adults. Under certain conditions, although expression trends were very similar, normalizing with an unsuitable reference gene affected the relative gene expression and resulted in more significant standard deviations [59]. The expression level of HcSP1 in the midgut was higher than in other tissues when normalized by the top-ranked genes and combination of stable reference genes, and the same expression pattern was also observed in P. xylostella [66,69], M. separata [68], and B. mori [70]. However, normalization by the least stable reference gene resulted in a strong bias. The transcriptions of HcSP1 significantly increased in the midgut and silk gland, and decreased in the head and cuticle. Similar results were observed in other conditions. Normalization with the unstable reference genes leads to an inconsistent expression level of HcSP1. Consequently, our findings confirm the importance of selecting and validating accurate reference genes for qRT-PCR analysis to avoid the misinterpretation of target gene transcription data.
5. Conclusions
In this study, we systematically assessed and validated the transcriptional stability of candidate reference genes in H. cunea under multiple experimental conditions. We concluded that ribosomal proteins were the most stable reference genes under different conditions.
RPS15 and RPS26 were optimal for different tissues, larval densities, and larvae feeding on different hosts, while RPS26 and RPL13 could be used to normalize for different developmental stages and gender. Furthermore, β-actin and α-tub showed instability in most conditions in this research. The results could lead to a better understanding of the developmental, physiological, and molecular processes of H. cunea. In addition, the study provides a comprehensive list of suitable reference genes for analyses and optimal reference genes for other gene function research in H. cunea.
Supplementary Materials
The following supporting information can be downloaded at https://0-www-mdpi-com.brum.beds.ac.uk/article/10.3390/insects13010097/s1, Figure S1: Amplification specificity of primers in RT-PCR and qRT-PCR., Table S1: Oligonucleotide primers for candidate qRT-PCR reference genes in H. cunea.
Author Contributions
Data curation, T.H.; Formal analysis, X.Z.; Investigation, Y.Z. and S.Y.; Project administration, X.Z. and Y.G.; Writing—original draft, X.Z.; Writing—review & editing, D.H. All authors have read and agreed to the published version of the manuscript.
Funding
This research was supported by the Forestry Science and Technology Innovation and Promotion Project in Jiangsu Province (LYKJ[2021]17), the Postgraduate Research & Practice Innovation Program of Jiangsu Province (KYCX18_0957).
Institutional Review Board Statement
Not applicable.
Data Availability Statement
The data presented in this study are available on request from the corresponding author.
Conflicts of Interest
The authors declare no conflict of interest.
References
- Sullivan, G.T.; Karaca, I.; Ozman-Sullivan, S.K.; Kara, K. Tachinid (Diptera: Tachinidae) parasitoids of overwintered Hyphantria cunea (Drury) (Lepidoptera: Arctiidae) pupae in hazelnut plantations in Samsun province, Turkey. J. Entomol. Res. Soc. 2012, 14, 21–30. [Google Scholar]
- Ge, X.; He, S.; Zhu, C.; Wang, T.; Xu, Z.; Zong, S. Projecting the current and future potential global distribution of Hyphantria cunea (Lepidoptera: Arctiidae) using CLIMEX. Pest. Manag. Sci. 2019, 75, 160–169. [Google Scholar] [CrossRef] [PubMed] [Green Version]
- Ji, R.; Xie, B.; Li, X.; Gao, Z.; Li, D. Research progress on the invasive species, Hyphantria cunea. Entomol. Knowl. 2003, 40, 13–18. [Google Scholar]
- Zhang, L.-W.; Kang, K.; Jiang, S.-C.; Zhang, Y.-N.; Wang, T.-T.; Zhang, J.; Sun, L.; Yang, Y.-Q.; Huang, C.-C.; Jiang, L.-Y. Analysis of the antennal transcriptome and insights into olfactory genes in Hyphantria cunea (Drury). PLoS ONE 2016, 11, e0164729. [Google Scholar] [CrossRef] [PubMed]
- Bai, P.H.; Wang, H.M.; Liu, B.S.; Li, M.; Liu, B.M.; Gu, X.S.; Tang, R. Botanical Volatiles Selection in Mediating Electrophysiological Responses and Reproductive Behaviors for the Fall Webworm Moth Hyphantria cunea. Front. Physiol. 2020, 11, 486. [Google Scholar] [CrossRef]
- Wu, N.; Zhang, S.; Li, X.; Cao, Y.; Liu, X.; Wang, Q.; Liu, Q.; Liu, H.; Hu, X.; Zhou, X.J. Fall webworm genomes yield insights into rapid adaptation of invasive species. Nat. Ecol. Evol. 2019, 3, 105–115. [Google Scholar] [CrossRef]
- Schowalter, T.; Ring, D. Biology and management of the fall webworm, Hyphantria cunea (Lepidoptera: Erebidae). J. Integr. Pest. Manag. 2017, 8. [Google Scholar] [CrossRef] [Green Version]
- Yan, X.; Zhao, D.; Zhang, Y.; Guo, W.; Wang, W.; Zhao, K.; Gao, Y.; Wang, X. Identification and characterization of chitin deacetylase2 from the American white moth, Hyphantria cunea (Drury). Gene 2018, 670, 98–105. [Google Scholar] [CrossRef]
- Sun, L.; Yin, J.; Du, H.; Liu, P.; Cao, C. Characterisation of GST genes from the Hyphantria cunea and their response to the oxidative stress caused by the infection of Hyphantria cunea nucleopolyhedrovirus (HcNPV). Pestic Biochem. Phys. 2020, 163, 254–262. [Google Scholar] [CrossRef]
- Ye, J.; Mang, D.; Kang, K.; Chen, C.; Zhang, X.; Tang, Y.; Purba, E.R.; Song, L.; Zhang, Q.-H.; Zhang, L. Putative carboxylesterase gene identification and their expression patterns in Hyphantria cunea (Drury). PeerJ 2021, 9, e10919. [Google Scholar] [CrossRef]
- Chen, Q.; Zhao, H.; Wen, M.; Li, J.; Zhou, H.; Wang, J.; Zhou, Y.; Liu, Y.; Du, L.; Kang, H. Genome of the webworm Hyphantria cunea unveils genetic adaptations supporting its rapid invasion and spread. BMC Genomics 2020, 21, 242. [Google Scholar] [CrossRef]
- Zhang, X.; Wang, Y.; Zhang, S.; Kong, X.; Liu, F.; Zhang, Z. RNAi-Mediated Silencing of the Chitinase 5 Gene for Fall Webworm (Hyphantria cunea) Can Inhibit Larval Molting Depending on the Timing of dsRNA Injection. Insects 2021, 12, 406. [Google Scholar] [CrossRef]
- Bustin, S.; Benes, V.; Nolan, T.; Pfaffl, M. Quantitative real-time RT-PCR–a perspective. J. Mol. Endocrinol. 2005, 34, 597–601. [Google Scholar] [CrossRef] [Green Version]
- Valasek, M.A.; Repa, J.J. The power of real-time PCR. Adv. Physiol. Educ. 2005, 29, 151–159. [Google Scholar] [CrossRef]
- Bustin, S.A. Developments in real-time PCR research and molecular diagnostics. Expert Rev. Mol. Diagn. 2010, 10, 713–715. [Google Scholar] [CrossRef]
- Roy, S.G.; Hansen, I.A.; Raikhel, A.S. Effect of insulin and 20-hydroxyecdysone in the fat body of the yellow fever mosquito, Aedes aegypti. Insect Biochem. Mol. 2007, 37, 1317–1326. [Google Scholar] [CrossRef] [PubMed] [Green Version]
- Jia, H.; Sun, R.; Shi, W.; Yan, Y.; Li, H.; Guo, X.; Xu, B. Characterization of a mitochondrial manganese superoxide dismutase gene from Apis cerana cerana and its role in oxidative stress. J. Insect Physiol. 2014, 60, 68–79. [Google Scholar] [CrossRef] [PubMed]
- Zhang, Y.; Liu, Y.; Guo, X.; Li, Y.; Gao, H.; Guo, X.; Xu, B. sHsp22. 6, an intronless small heat shock protein gene, is involved in stress defence and development in Apis cerana cerana. Insect Biochem. Mol. 2014, 53, 1–12. [Google Scholar] [CrossRef]
- Ding, M.; Zhu, Q.; Liang, Y.; Li, J.; Fan, X.; Yu, X.; He, F.; Xu, H.; Liang, Y.; Yu, J. Differential roles of three FgPLD genes in regulating development and pathogenicity in Fusarium graminearum. Fungal Genet. Biol. 2017, 109, 46–52. [Google Scholar] [CrossRef]
- Sun, Q.; Wang, S.; Xu, G.; Kang, X.; Zhang, M.; Ni, M. SHB1 and CCA1 interaction desensitizes light responses and enhances thermomorphogenesis. Nat. Commun. 2019, 10, 3110. [Google Scholar] [CrossRef] [PubMed] [Green Version]
- Huggett, J.; Dheda, K.; Bustin, S.; Zumla, A. Real-time RT-PCR normalisation; strategies and considerations. Genes Immun. 2005, 6, 279–284. [Google Scholar] [CrossRef] [PubMed] [Green Version]
- Wang, X.; Xiong, M.; Wang, J.; Lei, C.; Zhu, F. Reference gene stability of a synanthropic fly, Chrysomya megacephala. Parasite Vector 2015, 8, 565. [Google Scholar] [CrossRef] [Green Version]
- Hu, Y.; Fu, H.; Qiao, H.; Sun, S.; Zhang, W.; Jin, S.; Jiang, S.; Gong, Y.; Xiong, Y.; Wu, Y. Validation and evaluation of reference genes for quantitative real-time PCR in Macrobrachium nipponense. Int. J. Mol. Sci. 2018, 19, 2258. [Google Scholar] [CrossRef] [Green Version]
- Zhang, B.-Z.; Liu, J.-J.; Yuan, G.-H.; Chen, X.-L.; Gao, X.-W. Selection and evaluation of potential reference genes for gene expression analysis in greenbug (Schizaphis graminum Rondani). J. Integr. Agric. 2018, 17, 2054–2065. [Google Scholar] [CrossRef]
- Qiu, Q.; Zou, H.; Zou, H.; Jing, T.; Li, X.; Yan, G.; Geng, N.; Zhang, B.; Zhang, Z.; Zhang, S. 3-Bromopyruvate-induced glycolysis inhibition impacts larval growth and development and carbohydrate homeostasis in fall webworm, Hyphantria cunea Drury. Pestic Biochem. Phys. 2021, 179, 104961. [Google Scholar] [CrossRef]
- Li, X.; Liu, Q.; Liu, H.; Bi, H.; Wang, Y.; Chen, X.; Wu, N.; Xu, J.; Zhang, Z.; Huang, Y. Mutation of doublesex in Hyphantria cunea results in sex-specific sterility. Pest. Manag. Sci. 2020, 76, 1673–1682. [Google Scholar] [CrossRef]
- Vandesompele, J.; De Preter, K.; Pattyn, F.; Poppe, B.; Van Roy, N.; De Paepe, A.; Speleman, F. Accurate normalization of real-time quantitative RT-PCR data by geometric averaging of multiple internal control genes. Genome Biol. 2002, 3, research0034.1. [Google Scholar] [CrossRef] [Green Version]
- Andersen, C.L.; Jensen, J.L.; Ørntoft, T.F. Normalization of real-time quantitative reverse transcription-PCR data: A model-based variance estimation approach to identify genes suited for normalization, applied to bladder and colon cancer data sets. Cancer Res. 2004, 64, 5245–5250. [Google Scholar] [CrossRef] [Green Version]
- Pfaffl, M.W.; Tichopad, A.; Prgomet, C.; Neuvians, T.P. Determination of stable housekeeping genes, differentially regulated target genes and sample integrity: BestKeeper–Excel-based tool using pair-wise correlations. Biotechnol. Lett. 2004, 26, 509–515. [Google Scholar] [CrossRef]
- Silver, N.; Best, S.; Jiang, J.; Thein, S.L. Selection of housekeeping genes for gene expression studies in human reticulocytes using real-time PCR. BMC Mol. Biol. 2006, 7, 33. [Google Scholar] [CrossRef] [Green Version]
- Xie, F.; Xiao, P.; Chen, D.; Xu, L.; Zhang, B. miRDeepFinder: A miRNA analysis tool for deep sequencing of plant small RNAs. Plant. Mol. Biol. 2012, 80, 75–84. [Google Scholar] [CrossRef]
- Terra, W.R.; Ferreira, C. Insect digestive enzymes: Properties, compartmentalization and function. Comp. Biochem. Physiol. B 1994, 109, 1–62. [Google Scholar] [CrossRef]
- Srinivasan, A.; Giri, A.; Gupta, V. Structural and functional diversities in lepidopteran serine proteases. Cell Mol. Biol. Lett. 2006, 11, 132–154. [Google Scholar] [CrossRef]
- Livak, K.J.; Schmittgen, T.D. Analysis of relative gene expression data using real-time quantitative PCR and the 2− ΔΔCT method. Methods 2001, 25, 402–408. [Google Scholar] [CrossRef]
- Zhai, Y.; Lin, Q.; Zhou, X.; Zhang, X.; Liu, T.; Yu, Y. Identification and validation of reference genes for quantitative real-time PCR in Drosophila suzukii (Diptera: Drosophilidae). PLoS ONE 2014, 9, e106800. [Google Scholar] [CrossRef]
- Tan, Q.-Q.; Zhu, L.; Li, Y.; Liu, W.; Ma, W.-H.; Lei, C.-L.; Wang, X.-P. A de novo transcriptome and valid reference genes for quantitative real-time PCR in Colaphellus bowringi. PLoS ONE 2015, 10, e0118693. [Google Scholar] [CrossRef]
- Sun, M.; Lu, M.-X.; Tang, X.-T.; Du, Y.-Z. Exploring valid reference genes for quantitative real-time PCR analysis in Sesamia inferens (Lepidoptera: Noctuidae). PLoS ONE 2015, 10, e0115979. [Google Scholar] [CrossRef]
- Lu, Y.; Yuan, M.; Gao, X.; Kang, T.; Zhan, S.; Wan, H.; Li, J. Identification and validation of reference genes for gene expression analysis using quantitative PCR in Spodoptera litura (Lepidoptera: Noctuidae). PLoS ONE 2013, 8, e68059. [Google Scholar] [CrossRef] [Green Version]
- Lu, Y.; Zheng, X.; Liang, Q.; Xu, H.; Yang, Y.; Tian, J.; He, X.; Lu, Z. Evaluation and validation of reference genes for SYBR Green qRT-PCR normalization in Sesamia inferens (Lepidoptera: Noctuidae). J. Asia-Pac. Entomol. 2015, 18, 669–675. [Google Scholar] [CrossRef]
- Fu, W.; Xie, W.; Zhang, Z.; Wang, S.; Wu, Q.; Liu, Y.; Zhou, X.; Zhou, X.; Zhang, Y. Exploring valid reference genes for quantitative real-time PCR analysis in Plutella xylostella (Lepidoptera: Plutellidae). Int. J. Biol. Sci. 2013, 9, 792. [Google Scholar] [CrossRef] [Green Version]
- Pan, H.; Yang, X.; Bidne, K.; Hellmich, R.L.; Siegfried, B.D.; Zhou, X. Selection of reference genes for RT-qPCR analysis in the monarch butterfly, Danaus plexippus (L.), a migrating bio-indicator. PLoS ONE 2015, 10, e0129482. [Google Scholar] [CrossRef]
- Liu, G.; Qiu, X.; Cao, L.; Zhang, Y.; Zhan, Z.; Han, R. Evaluation of reference genes for reverse transcription quantitative PCR studies of physiological responses in the ghost moth, Thitarodes armoricanus (Lepidoptera, Hepialidae). PLoS ONE 2016, 11, e0159060. [Google Scholar] [CrossRef]
- Chandra, G.S.; Asokan, R.; Manamohan, M.; Kumar, N.K.; Sita, T. Evaluation of reference genes for quantitative real-time PCR normalization in cotton bollworm Helicoverpa armigera. Mol. Biol. 2014, 48, 813–822. [Google Scholar] [CrossRef]
- Xu, J.; Lu, M.-X.; Cui, Y.-D.; Du, Y.-Z. Selection and evaluation of reference genes for expression analysis using qRT-PCR in Chilo suppressalis (Lepidoptera: Pyralidae). J. Econ. Entomol. 2017, 110, 683–691. [Google Scholar]
- Zhao, Z.; Wang, L.; Yue, D.; Ye, B.; Li, P.; Zhang, B.; Fan, Q. Evaluation of reference genes for normalization of RT-qPCR gene expression data for Trichoplusia ni cells during Antheraea pernyi (Lepidoptera: Saturniidae) multicapsid nucleopolyhedrovirus (AnpeNPV) infection. J. Insect Sci. 2019, 19, 4. [Google Scholar] [CrossRef] [Green Version]
- Wang, Z.; Meng, Q.; Zhu, X.; Sun, S.; Liu, A.; Gao, S.; Gou, Y. Identification and evaluation of reference genes for normalization of gene expression in developmental stages, sexes; tissues of Diaphania caesalis (Lepidoptera, Pyralidae). J. Insect Sci. 2020, 20, 6. [Google Scholar] [CrossRef]
- Yan, X.; Zhang, Y.; Xu, K.; Wang, Y.; Yang, W. Selection and Validation of Reference Genes for Gene Expression Analysis in Tuta absoluta Meyrick (Lepidoptera: Gelechiidae). Insects 2021, 12, 589. [Google Scholar] [CrossRef]
- Deng, Y.; Li, F.; Rieske, L.K.; Sun, L.-L.; Sun, S.-H. Transcriptome sequencing for identification of diapause-associated genes in fall webworm, Hyphantria cunea Drury. Gene 2018, 668, 229–236. [Google Scholar] [CrossRef]
- Sun, L.; Liu, P.; Sun, S.; Yan, S.; Cao, C. Transcriptomic analysis of interactions between Hyphantria cunea larvae and nucleopolyhedrovirus. Pest. Manag. Sci. 2019, 75, 1024–1033. [Google Scholar] [CrossRef]
- Yuan, M.; Lu, Y.; Zhu, X.; Wan, H.; Shakeel, M.; Zhan, S.; Jin, B.-R.; Li, J. Selection and evaluation of potential reference genes for gene expression analysis in the brown planthopper, Nilaparvata lugens (Hemiptera: Delphacidae) using reverse-transcription quantitative PCR. PLoS ONE 2014, 9, e86503. [Google Scholar] [CrossRef] [Green Version]
- Sagri, E.; Koskinioti, P.; Gregoriou, M.-E.; Tsoumani, K.T.; Bassiakos, Y.C.; Mathiopoulos, K.D. Housekeeping in Tephritid insects: The best gene choice for expression analyses in the medfly and the olive fly. Sci. Rep. 2017, 7, 45634. [Google Scholar] [CrossRef] [Green Version]
- Yang, J.; Zhang, Y.; Zhao, J.; Gao, Y.; Liu, Z.; Zhang, P.; Fan, J.; Zhou, X.; Fan, R. Selection of Reference Genes for RT-qPCR Analysis Under Extrinsic Conditions in the Hawthorn Spider Mite, Amphitetranychus viennensis. Front. Physiol. 2020, 11, 378. [Google Scholar] [CrossRef] [PubMed] [Green Version]
- War, A.R.; Paulraj, M.G.; Ahmad, T.; Buhroo, A.A.; Hussain, B.; Ignacimuthu, S.; Sharma, H.C. Mechanisms of plant defense against insect herbivores. Plant. Signal. Behav. 2012, 7, 1306–1320. [Google Scholar] [CrossRef] [Green Version]
- Huang, X.; Ma, J.; Qin, X.; Tu, X.; Cao, G.; Wang, G.; Nong, X.; Zhang, Z. Biology, physiology and gene expression of grasshopper Oedaleus asiaticus exposed to diet stress from plant secondary compounds. Sci. Rep. 2017, 7, 8655. [Google Scholar] [CrossRef] [Green Version]
- Li, L.; Yuan, Y.; Wu, L.; Chen, M. Effects of host plants on the feeding behavior and detoxification enzyme activities in Hyphantria cunea (Lepidoptera: Arctiidae) larvae. Acta Entomol. Sin. 2018, 61, 232–239. [Google Scholar]
- Zhao, X.; Sun, Y.; Chen, C.; Tian, S.; Tao, R.; Hao, D. Cloning and spatio-temporal expression of serine protease gene HcSP1 and its expression in response to feeding on different host plants in Hyphantria cunea (Lepidoptera: Arctiidae). Acta Entomol. Sin. 2019, 62, 160–169. [Google Scholar]
- Pinheiro, D.H.; Moreira, R.O.; Leite, N.A.; Redoan, A.C.; da Silva Xavier, A.; de Almeida Barros, B.; Carneiro, N.P. Suitable reference genes for RT-qPCR analysis in Dichelops melacanthus (Hemiptera: Pentatomidae). Mol. Biol. Rep. 2020, 47, 4989–5000. [Google Scholar] [CrossRef]
- Chen, C.; Li, S.; Zhu, H.; Fan, B.; Wang, Y.; Hao, D. Identification and evaluation of reference genes for gene expression analysis in the weevil pest Pagiophloeus tsushimanus using RT-qPCR. J. Asia-Pac. Entomol. 2020, 23, 336–344. [Google Scholar] [CrossRef]
- Jing, L.; Chao, M.; Zhe, L.; Zhu, B.-Q.; Zhang, J.; Lei, C.-L.; Jin, S.-X.; Hull, J.J.; Chen, L.-Z. Assessment of suitable reference genes for qRT-PCR analysis in Adelphocoris suturalis. J. Integr. Agric. 2018, 17, 2745–2757. [Google Scholar]
- Shi, C.; Yang, F.; Zhu, X.; Du, E.; Yang, Y.; Wang, S.; Wu, Q.; Zhang, Y. Evaluation of housekeeping genes for quantitative real-time PCR analysis of Bradysia odoriphaga (Diptera: Sciaridae). Int. J. Mol. Sci. 2016, 17, 1034. [Google Scholar] [CrossRef] [Green Version]
- Chen, X.; Zhang, X.; Huang, S.; Cao, Z.; Qin, Q.; Hu, W.; Sun, Y.; Zhou, Y. Selection of reference genes for quantitative real-time RT-PCR on gene expression in Golden Pompano (Trachinotus ovatus). Pol. J. Vet. Sci. 2017, 20. [Google Scholar] [CrossRef] [Green Version]
- Yang, X.; Tong, G.; Dong, L.; Tang, G.; Zhang, Y.; Yan, T.; Ma, K.; Yin, J.; Kuang, Y. Evaluation of qPCR reference genes for taimen (Hucho taimen) under heat stress. Sci. Rep. 2022, 12, 313. [Google Scholar] [CrossRef]
- Lord, J.C.; Hartzer, K.; Toutges, M.; Oppert, B. Evaluation of quantitative PCR reference genes for gene expression studies in Tribolium castaneum after fungal challenge. J. Microbiol. Meth. 2010, 80, 219–221. [Google Scholar] [CrossRef]
- Haller, F.; Kulle, B.; Schwager, S.; Gunawan, B.; von Heydebreck, A.; Sültmann, H.; Füzesi, L. Equivalence test in quantitative reverse transcription polymerase chain reaction: Confirmation of reference genes suitable for normalization. Anal. Biochem. 2004, 335, 1–9. [Google Scholar] [CrossRef]
- Veazey, K.J.; Golding, M.C. Selection of stable reference genes for quantitative rt-PCR comparisons of mouse embryonic and extra-embryonic stem cells. PLoS ONE 2011, 6, e27592. [Google Scholar] [CrossRef] [Green Version]
- Lin, H.; Xia, X.; Yu, L.; Vasseur, L.; Gurr, G.M.; Yao, F.; Yang, G.; You, M. Genome-wide identification and expression profiling of serine proteases and homologs in the diamondback moth, Plutella xylostella (L.). BMC Genomics 2015, 16, 1054. [Google Scholar] [CrossRef] [Green Version]
- Zhang, C.; Zhou, D.; Zheng, S.; Liu, L.; Tao, S.; Yang, L.; Hu, S.; Feng, Q. A chymotrypsin-like serine protease cDNA involved in food protein digestion in the common cutworm, Spodoptera litura: Cloning, characterization, developmental and induced expression patterns; localization. J. Insect Physiol. 2010, 56, 788–799. [Google Scholar] [CrossRef]
- Zhou, X.; Fan, D.; Zhao, K. Characterization of trypsin-like and chymotrypsin-like serine proteases from midgut of Mythimna separata walker. Arch. Insect Biochem. 2016, 92, 173–191. [Google Scholar] [CrossRef]
- Shi, M.; Zhu, N.; Yi, Y.; Chen, X. Four serine protease cDNAs from the midgut of Plutella xylostella and their proteinase activity are influenced by the endoparasitoid, Cotesia vestalis. Arch. Insect Biochem. 2013, 83, 101–114. [Google Scholar] [CrossRef]
- Liu, H.W.; Li, Y.S.; Tang, X.; Guo, P.C.; Wang, D.D.; Zhou, C.Y.; Xia, Q.Y.; Zhao, P. A midgut-specific serine protease, BmSP36, is involved in dietary protein digestion in the silkworm, Bombyx mori. Insect Sci. 2017, 24, 753–767. [Google Scholar] [CrossRef]
Figure 1.
Box-whisker plots of expression patterns of candidate reference genes under different conditions. (a) Developmental stages. (b) Different tissues. (c) Gender. (d) Larvae feeding on different hosts. (e) Different larval densities. (f) All samples. The white line denotes the median in the box. The interquartile range is denoted by the upper and lower edges, which represent the 75th and 25th percentiles. The whisker caps on each box represent the maximum and minimum values.

Figure 2.
The stability of the eight candidate reference genes was evaluated by the RefFinder. (a) Developmental stages and gender. (b) Different tissues. (c) Larva feeding on different hosts. (d) Different larval densities. (e) All samples.
Figure 2.
The stability of the eight candidate reference genes was evaluated by the RefFinder. (a) Developmental stages and gender. (b) Different tissues. (c) Larva feeding on different hosts. (d) Different larval densities. (e) All samples.

Figure 3.
Determination of the optimal number of reference genes according to geNorm. The pairwise variation values below 0.15 indicated that no additional reference gene was needed for the normalization.
Figure 3.
Determination of the optimal number of reference genes according to geNorm. The pairwise variation values below 0.15 indicated that no additional reference gene was needed for the normalization.

Figure 4.
The expression profiles of HcSP1 under different conditions normalized by selected reference genes. (A) Different developmental stages. (B) Different tissues. (C) Larva feeding on different hosts. (D) Different larval densities.
Figure 4.
The expression profiles of HcSP1 under different conditions normalized by selected reference genes. (A) Different developmental stages. (B) Different tissues. (C) Larva feeding on different hosts. (D) Different larval densities.


Table 1.
Ranking of the candidate reference genes under different conditions.
| Experimental Conditions | Rank | ΔCt | BestKeeper | Normfinder | geNorm | ||||
|---|---|---|---|---|---|---|---|---|---|
| Developmental stage and sex | 1 | RPS26 | 1.44 | β-actin | 0.11 | AK | 0.167 | RPS26 | 0.205 |
| RPL13 | 0.205 | ||||||||
| 2 | RPL13 | 1.46 | EIF4A | 0.8 | UBI | 0.563 | — | — | |
| 3 | UBI | 1.49 | UBI | 0.83 | RPS26 | 0.653 | RPS15 | 0.296 | |
| 4 | AK | 1.54 | RPS26 | 1.45 | RPL13 | 0.704 | AK | 0.756 | |
| 5 | RPS15 | 1.55 | RPL13 | 1.46 | RPS15 | 0.865 | UBI | 0.969 | |
| 6 | EIF4A | 1.81 | AK | 1.55 | EIF4A | 1.319 | EIF4A | 1.166 | |
| 7 | β-actin | 2.2 | RPS15 | 1.66 | β-actin | 1.975 | β-actin | 1.35 | |
| 8 | α-tub | 3.4 | α-tub | 3.56 | α-tub | 3.284 | α-tub | 1.862 | |
| Tissues | 1 | RPS15 | 1.11 | RPL13 | 0.33 | RPS26 | 0.106 | RPS26 | 0.212 |
| RPS15 | 0.212 | ||||||||
| 2 | RPS26 | 1.13 | RPS26 | 0.41 | RPS15 | 0.106 | — | — | |
| 3 | RPL13 | 1.19 | EIF4A | 0.46 | AK | 0.315 | RPL13 | 0.363 | |
| 4 | UBI | 1.25 | RPS15 | 0.47 | UBI | 0.458 | EIF4A | 0.437 | |
| 5 | EIF4A | 1.28 | UBI | 0.76 | RPL13 | 0.554 | UBI | 0.553 | |
| 6 | AK | 1.3 | AK | 1.01 | EIF4A | 0.764 | AK | 0.637 | |
| 7 | β-actin | 1.7 | β-actin | 1.23 | α-tub | 4.242 | β-actin | 0.784 | |
| 8 | α-tub | 6.69 | α-tub | 4.11 | β-actin | 4.242 | α-tub | 1.654 | |
| Reared on different hosts | 1 | RPS15 | 1.2 | β-actin | 1.03 | RPS15 | 0.094 | RPS26 | 0.189 |
| RPS15 | 0.189 | ||||||||
| 2 | α-tub | 1.22 | AK | 1.28 | RPS26 | 0.153 | — | — | |
| 3 | RPS26 | 1.23 | α-tub | 1.73 | α-tub | 0.187 | α-tub | 0.347 | |
| 4 | AK | 1.45 | RPS15 | 1.82 | AK | 0.263 | AK | 0.601 | |
| 5 | β-actin | 1.52 | RPS26 | 1.87 | β-actin | 0.471 | β-actin | 0.72 | |
| 6 | EIF4A | 1.65 | RPL13 | 1.88 | EIF4A | 1.345 | EIF4A | 0.906 | |
| 7 | UBI | 1.95 | EIF4A | 2.45 | UBI | 1.808 | UBI | 1.06 | |
| 8 | RPL13 | 3.85 | UBI | 2.73 | RPL13 | 3.813 | RPL13 | 1.757 | |
| Different larval densities | 1 | RPS15 | 0.99 | AK | 0.19 | UBI | 0.39 | RPS26 | 0.265 |
| RPS15 | 0.265 | ||||||||
| 2 | RPS26 | 1.02 | RPS15 | 0.41 | RPS15 | 0.41 | — | — | |
| 3 | EIF4A | 1.03 | RPS26 | 0.46 | RPS26 | 0.46 | RPL13 | 0.384 | |
| 4 | RPL13 | 1.04 | RPL13 | 0.52 | RPL13 | 0.52 | EIF4A | 0.501 | |
| 5 | β-actin | 1.14 | EIF4A | 0.59 | β-actin | 0.317 | UBI | 0.555 | |
| 6 | UBI | 1.19 | UBI | 0.64 | RPL13 | 0.347 | β-actin | 0.615 | |
| 7 | AK | 1.48 | β-actin | 0.68 | AK | 1.169 | AK | 0.718 | |
| 8 | α-tub | 4.15 | α-tub | 4.01 | α-tub | 4.132 | α-tub | 1.568 | |
| All samples | 1 | RPS15 | 2.07 | EIF4A | 1.02 | RPS26 | 0.257 | RPS26 | 0.514 |
| RPS15 | 0.514 | ||||||||
| 2 | RPS26 | 2.12 | RPL13 | 1.08 | RPS15 | 0.257 | — | — | |
| 3 | AK | 2.27 | AK | 1.16 | AK | 0.955 | AK | 0.918 | |
| 4 | UBI | 2.31 | UBI | 1.27 | UBI | 1.179 | UBI | 1.071 | |
| 5 | EIF4A | 2.47 | RPS15 | 1.28 | EIF4A | 1.601 | EIF4A | 1.143 | |
| 6 | RPL13 | 2.75 | RPS26 | 1.52 | RPL13 | 1.723 | RPL13 | 1.413 | |
| 7 | α-tub | 4.38 | α-tub | 4.23 | α-tub | 3.881 | α-tub | 2.188 | |
| 8 | β-actin | 5.25 | β-actin | 4.42 | β-actin | 4.942 | β-actin | 2.953 | |
Publisher’s Note: MDPI stays neutral with regard to jurisdictional claims in published maps and institutional affiliations. |
© 2022 by the authors. Licensee MDPI, Basel, Switzerland. This article is an open access article distributed under the terms and conditions of the Creative Commons Attribution (CC BY) license (https://creativecommons.org/licenses/by/4.0/).
Share and Cite
MDPI and ACS Style
Zhao, X.; Geng, Y.; Hu, T.; Zhao, Y.; Yang, S.; Hao, D. Evaluation of Optimal Reference Genes for qRT-PCR Analysis in Hyphantria cunea (Drury). Insects 2022, 13, 97. https://0-doi-org.brum.beds.ac.uk/10.3390/insects13010097
AMA Style
Zhao X, Geng Y, Hu T, Zhao Y, Yang S, Hao D. Evaluation of Optimal Reference Genes for qRT-PCR Analysis in Hyphantria cunea (Drury). Insects. 2022; 13(1):97. https://0-doi-org.brum.beds.ac.uk/10.3390/insects13010097
Chicago/Turabian StyleZhao, Xudong, Yishu Geng, Tianyi Hu, Yongang Zhao, Suling Yang, and Dejun Hao. 2022. "Evaluation of Optimal Reference Genes for qRT-PCR Analysis in Hyphantria cunea (Drury)" Insects 13, no. 1: 97. https://0-doi-org.brum.beds.ac.uk/10.3390/insects13010097
Note that from the first issue of 2016, this journal uses article numbers instead of page numbers. See further details here.