Acute Metabolic Changes with Thigh-Positioned Wearable Resistances during Submaximal Running in Endurance-Trained Runners


Abstract
:1. Introduction
2. Materials and Methods
2.1. Subjects
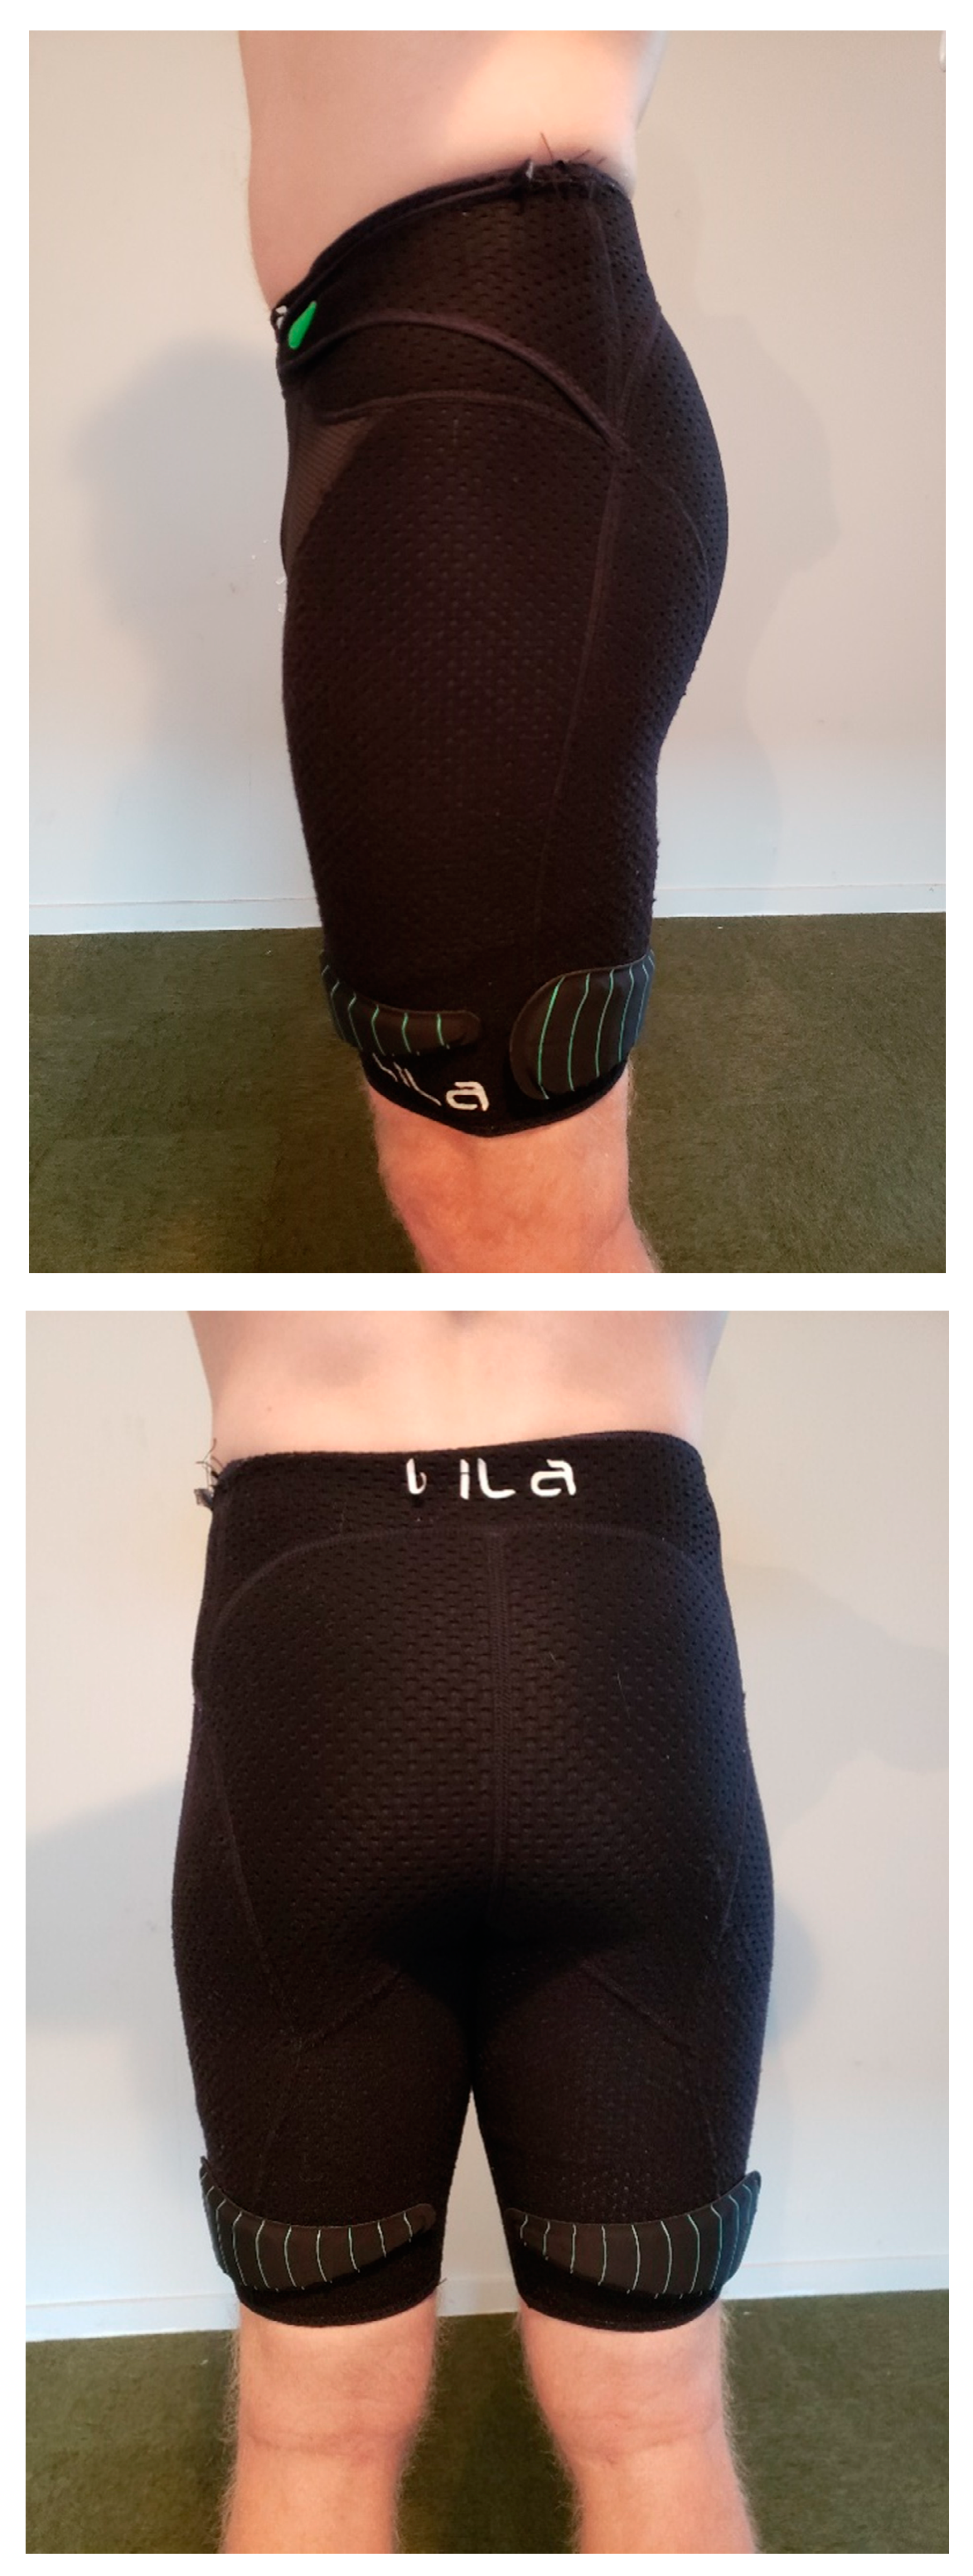
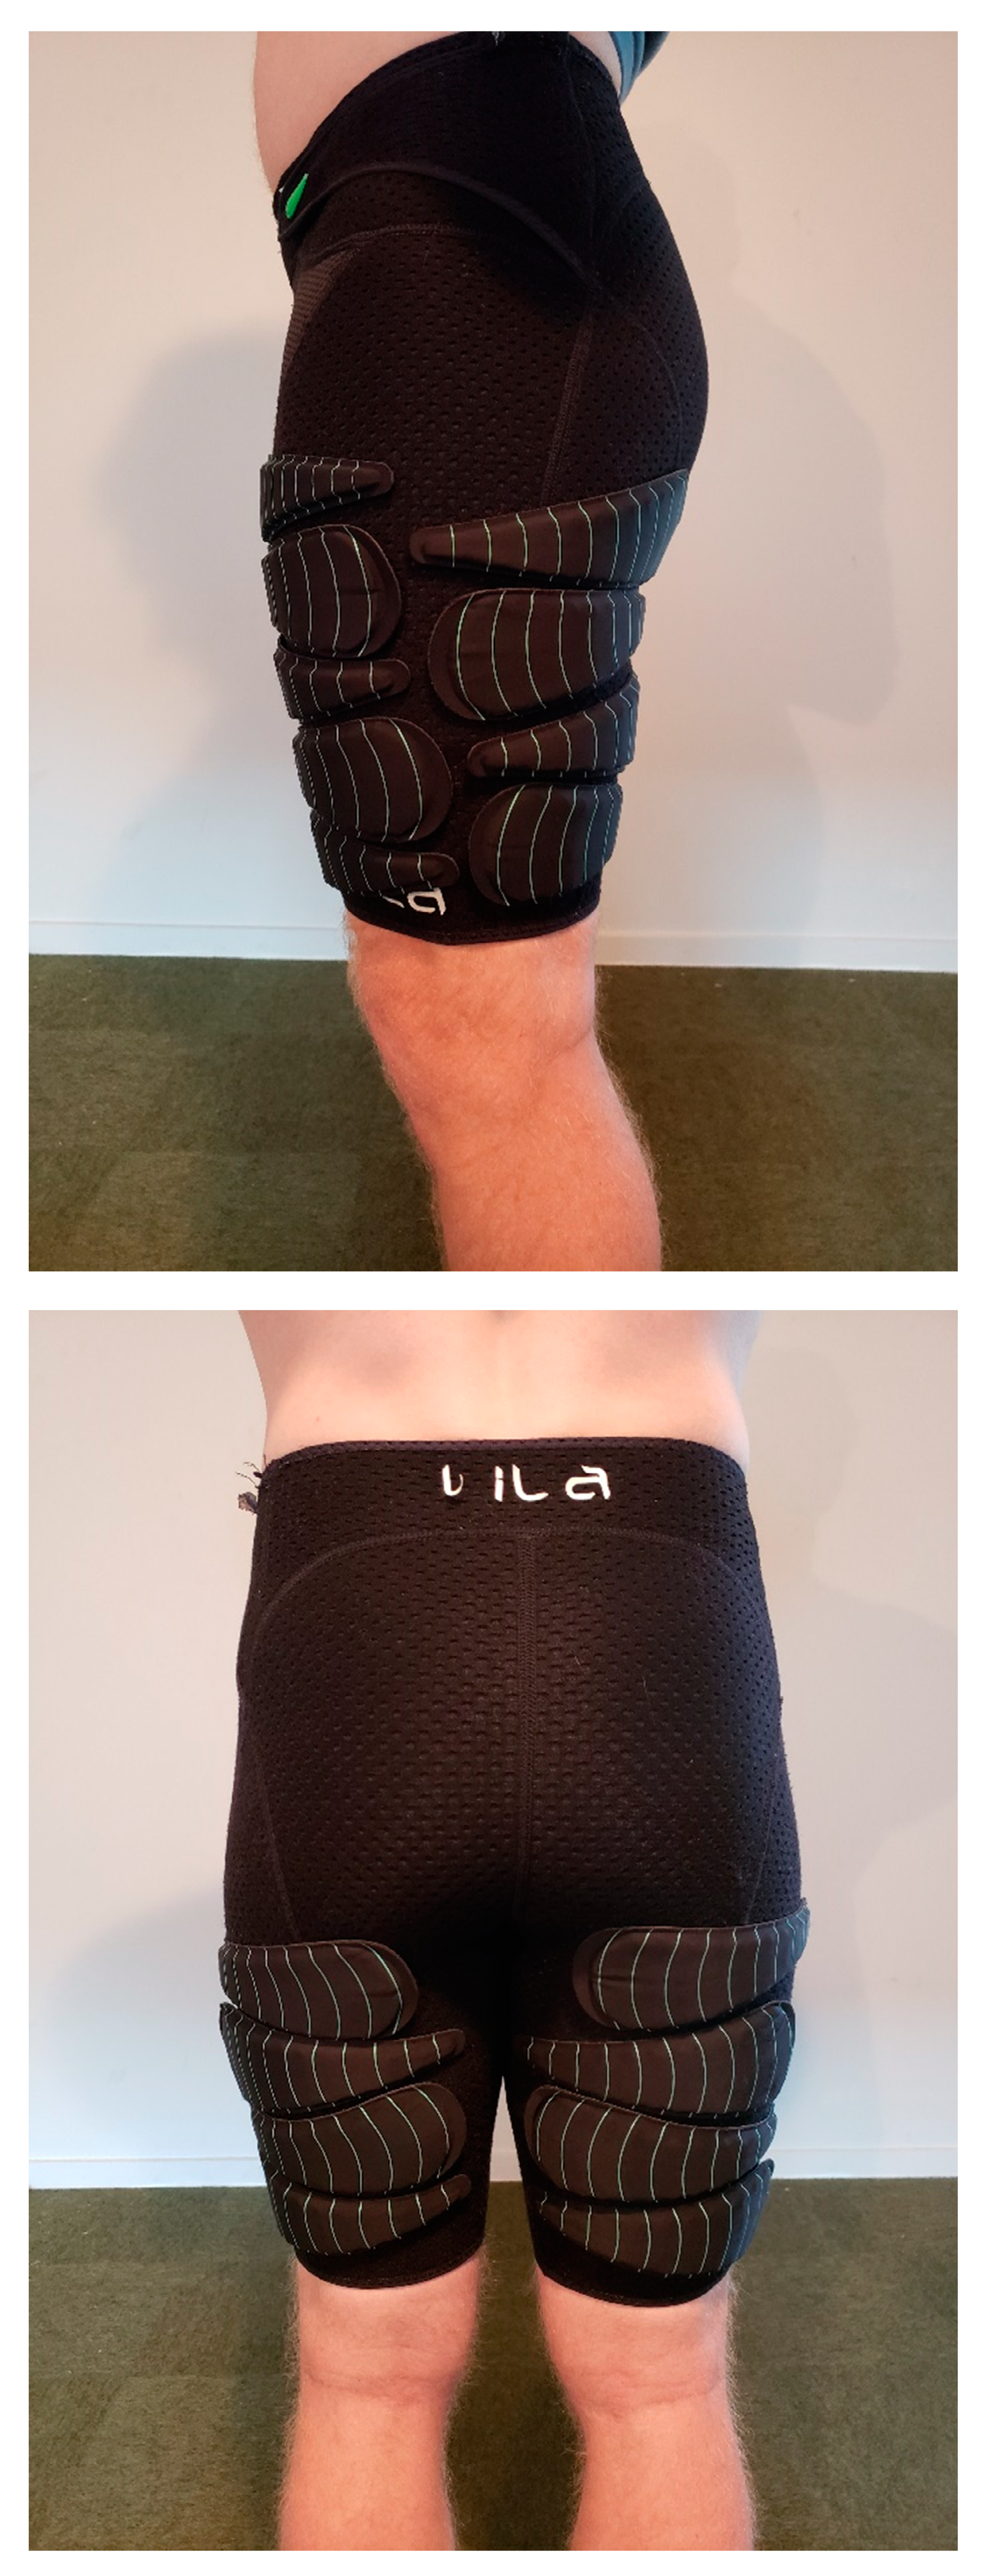
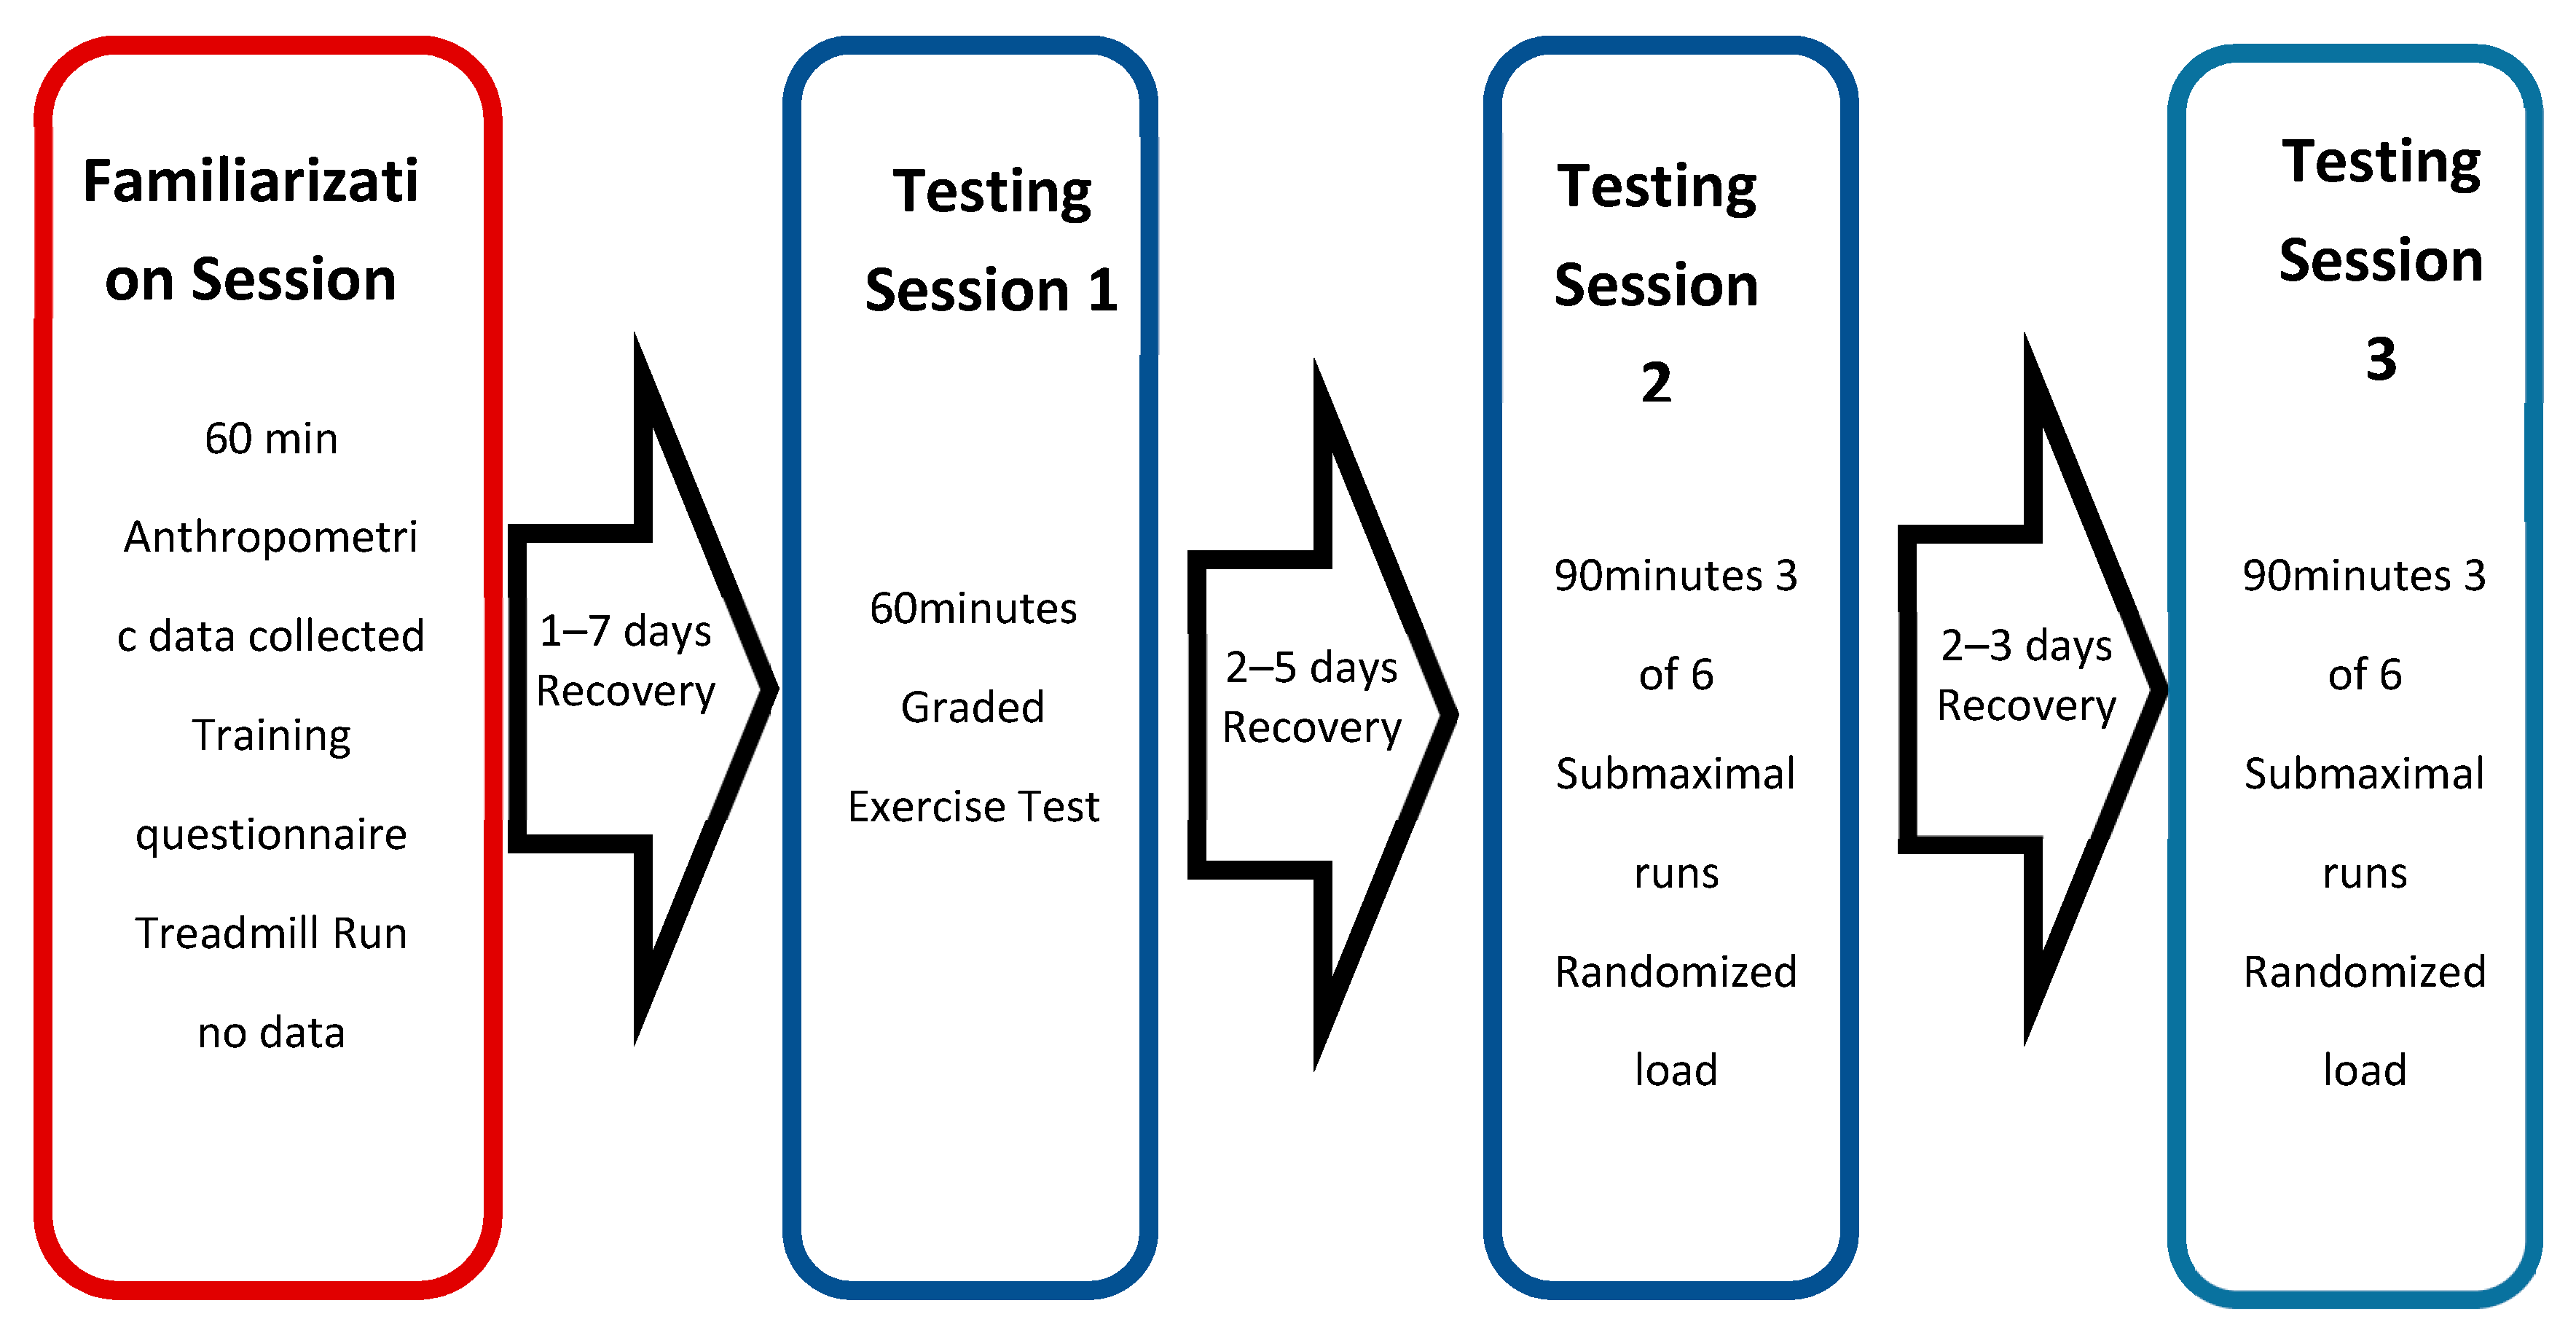
2.2. Procedure
Statistical Analysis
IF (intensity factor) = HR/VT2
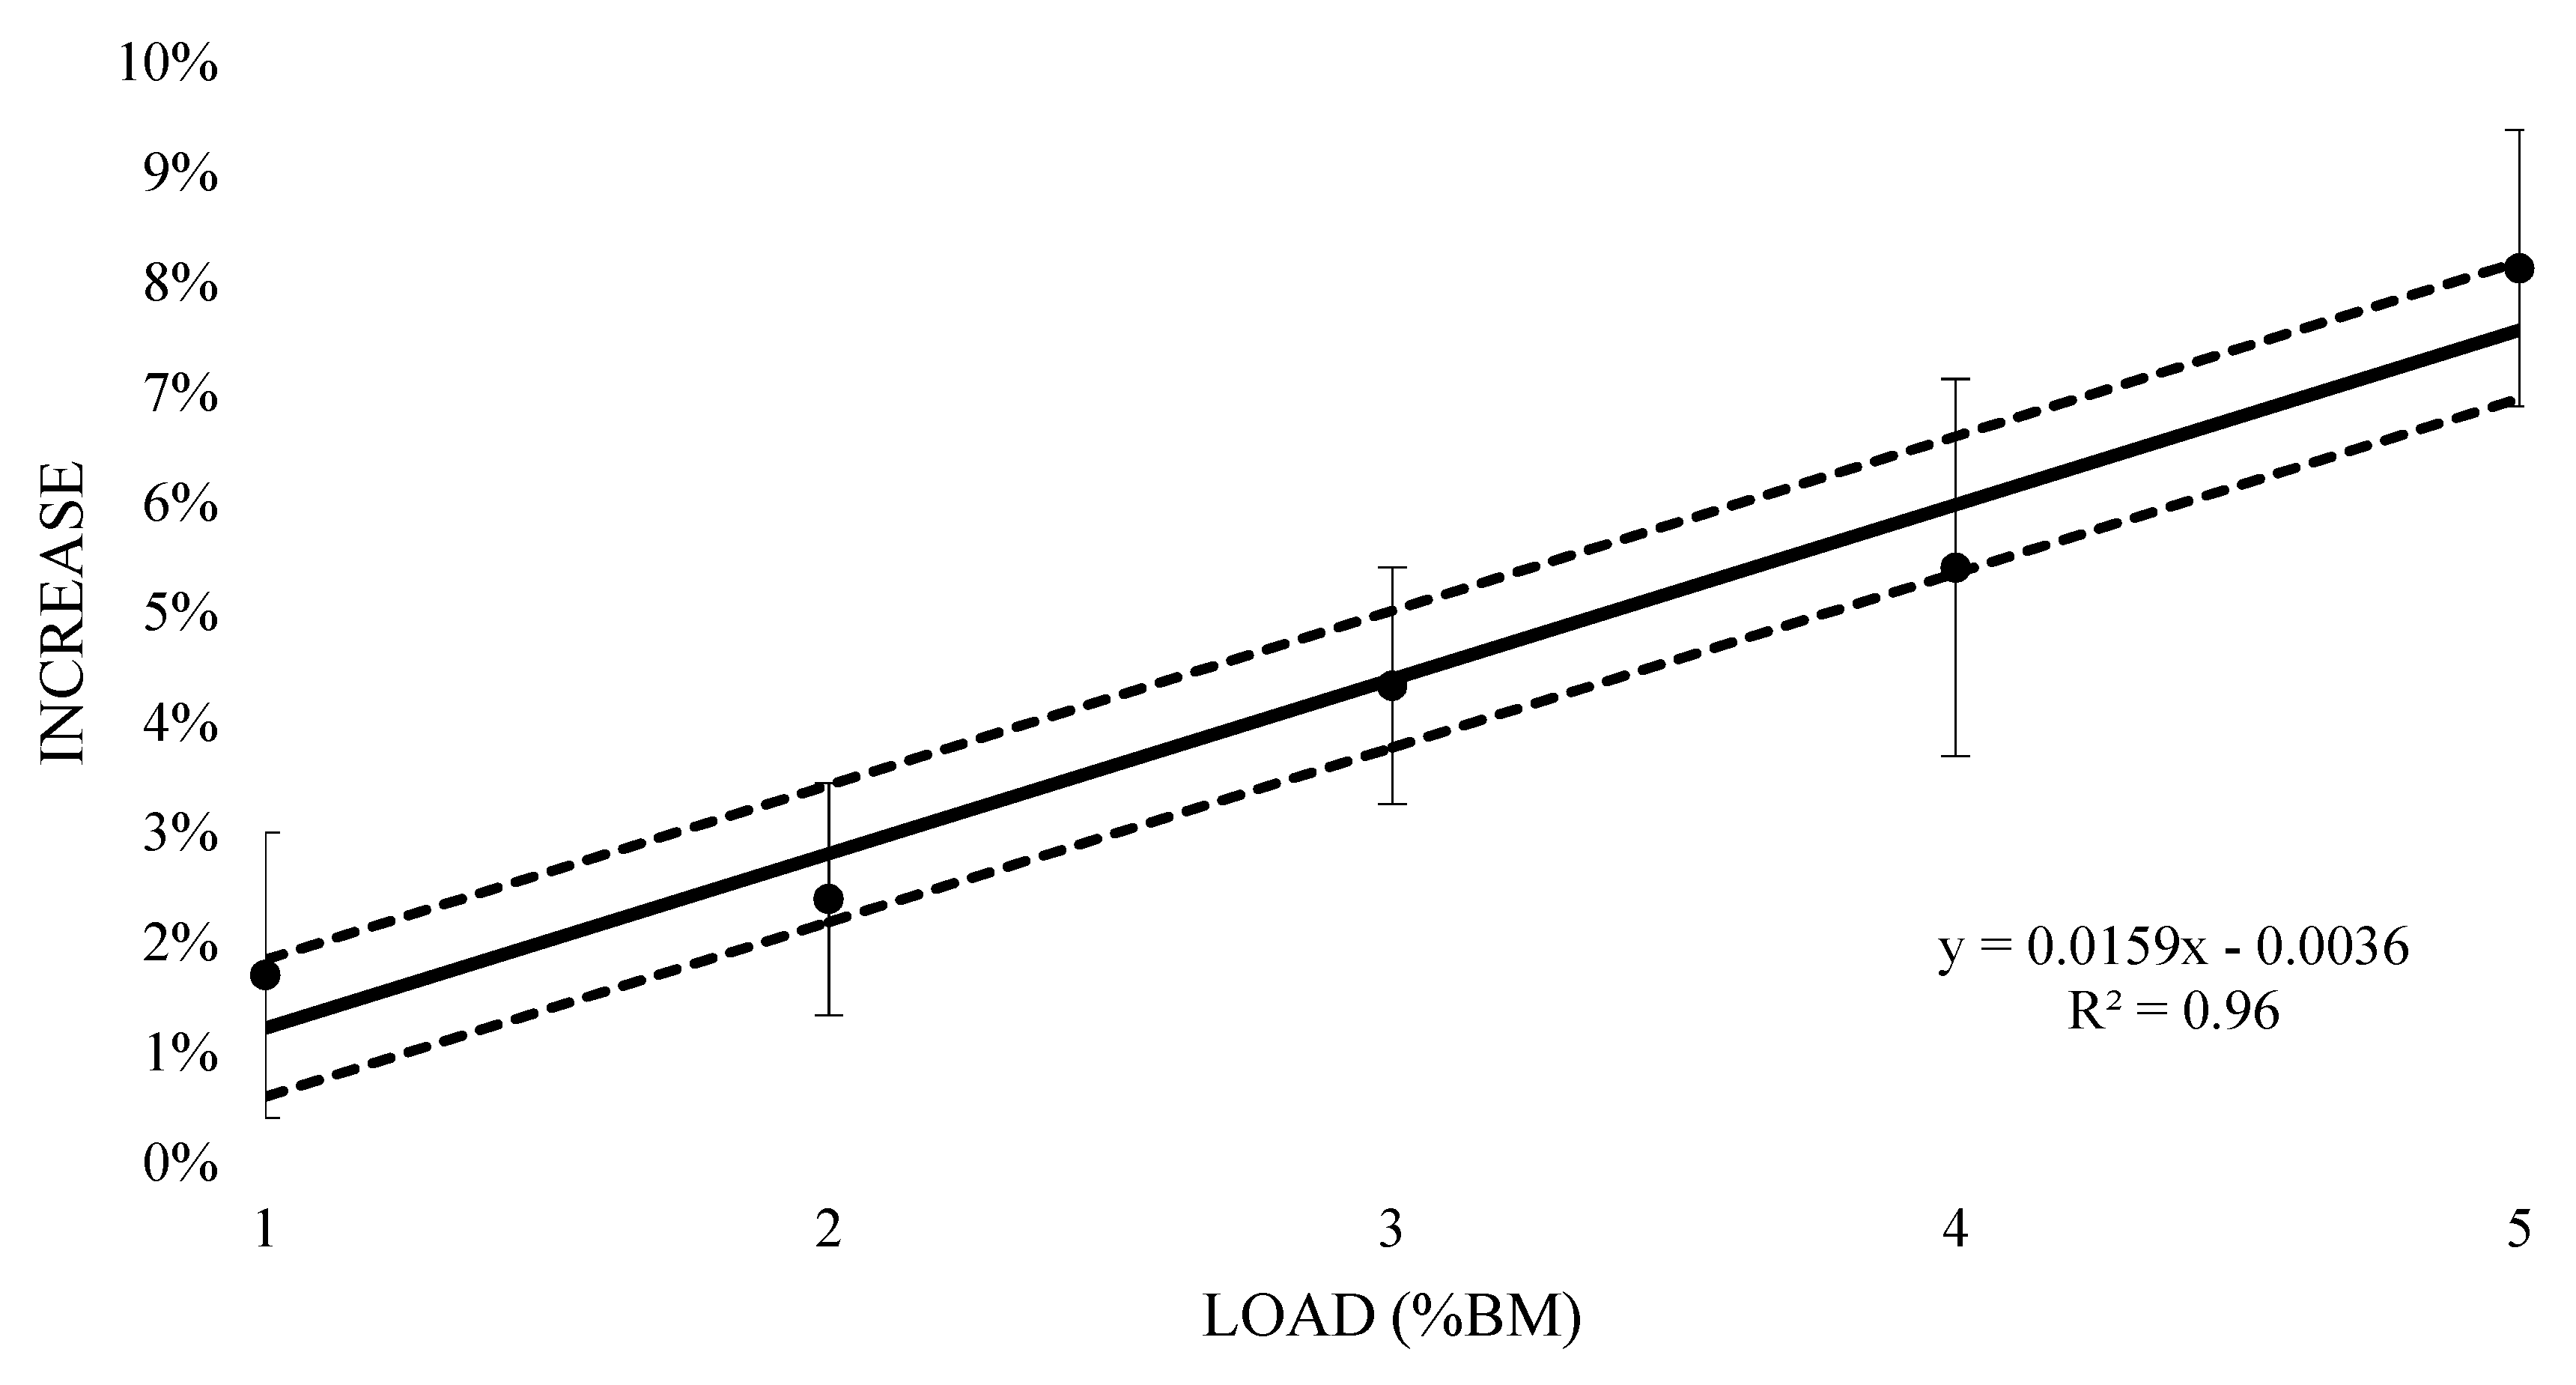
3. Results
4. Discussion
5. Conclusions
Author Contributions
Funding
Conflicts of Interest
References
- Noakes, T.D.; Myburgh, K.H.; Schall, R. Peak treadmill running velocity during the VO2 max test predicts running performance. J. Sports Sci. 1990, 8, 35–45. [Google Scholar] [CrossRef] [PubMed]
- Nicholson, R.M.; Sleivert, G.G. Indices of lactate threshold and their relationship with 10-km running velocity. Med. Sci. Sports Exerc. 2001, 33, 339–342. [Google Scholar] [CrossRef] [PubMed]
- Tjelta, L.I.; Shalfawi, S.A. Physiological factors affecting performance in elite distance runners. Acta Kinesiol. Univ. Tartu. 2016, 22, 7–19. [Google Scholar] [CrossRef]
- Alcaraz-Ibañez, M.; Rodríguez-Pérez, M. Effects of resistance training on performance in previously trained endurance runners: A systematic review. J. Sports Sci. 2018, 36, 613–629. [Google Scholar] [CrossRef] [PubMed]
- Mikkola, J.; Vesterinen, V.; Taipale, R.; Capostagno, B.; Häkkinen, K.; Nummela, A. Effect of resistance training regimens on treadmill running and neuromuscular performance in recreational endurance runners. J. Sports Sci. 2011, 29, 1359–1371. [Google Scholar] [CrossRef] [PubMed]
- Macadam, P.; Cronin, J.B.; Simperingham, K.D. The effects of wearable resistance training on metabolic, kinematic and kinetic variables during walking, running, sprint running and jumping: A systematic review. Sports Med. 2017, 47, 887–906. [Google Scholar] [CrossRef] [PubMed]
- Macadam, P.; Cronin, J.B.; Uthoff, A.M.; Feser, E.H. The effects of different wearable resistance placements on sprint-running performance: A review and practical applications. Strength Cond. J. 2019, 41, 79–96. [Google Scholar] [CrossRef]
- Macadam, P.; Cronin, J.B.; Feser, E.H. Acute and longitudinal effects of weighted vest training on sprint-running performance: A systematic review. Sports Biomech. 2019, 1–16. [Google Scholar] [CrossRef] [PubMed]
- Soule, R.G.; Goldman, R.F. Energy cost of loads carried on the head, hands, or feet. J. Appl. Physiol. 1969, 27, 687–690. [Google Scholar] [CrossRef] [PubMed]
- Jones, B.H.; Toner, M.M.; Daniels, W.L.; Knapik, J.J. The energy cost and heart-rate response of trained and untrained subjects walking and running in shoes and boots. Ergonomics 1984, 27, 895–902. [Google Scholar] [CrossRef] [PubMed]
- Martin, P.E. Mechanical and physiological responses to lower extremity loading during running. Med. Sci. Sports Exerc. 1985, 17, 427–433. [Google Scholar] [CrossRef] [PubMed]
- Jones, A.M.; Doust, J.H. A 1% treadmill grade most accurately reflects the energetic cost of outdoor running. J. Sports Sci. 1996, 14, 321–327. [Google Scholar] [CrossRef]
- Seiler, K.S.; Kjerland, G.Ø. Quantifying training intensity distribution in elite endurance athletes: Is there evidence for an “optimal” distribution? Scand. J. Med. Sci. Sports 2006, 16, 49–56. [Google Scholar] [CrossRef] [PubMed]
- Macadam, P.; Simperingham, K.; Cronin, J. Acute kinematic and kinetic adaptations to wearable resistance during sprint acceleration. J. Strength Cond. Res. 2017, 31, 1297–1304. [Google Scholar] [CrossRef] [PubMed]
- Macadam, P.; Simperingham, K.D.; Cronin, J.B. Forearm wearable resistance effects on sprint kinematics and kinetics. J. Sci. Med. Sport 2019, 22, 348–352. [Google Scholar] [CrossRef] [PubMed]
- Myers, M.; Steudel, K. Effect of limb mass and its distribution on the energetic cost of running. J. Exp. Biol. 1985, 116, 363–373. [Google Scholar] [PubMed]
- Simperingham, K.; Cronin, J. Changes in sprint kinematics and kinetics with upper body loading and lower body loading using exogen exoskeletons: A pilot study. J. Aust. Strength Cond. 2014, 22, 69–72. [Google Scholar]
- Mann, T.N.; Webster, C.; Lamberts, R.P.; Lambert, M.I. Effect of exercise intensity on post-exercise oxygen consumption and heart rate recovery. Eur. J. Appl. Physiol. 2014, 114, 1809–1820. [Google Scholar] [CrossRef] [PubMed]
- Scharhag-Rosenberger, F.; Carlsohn, A.; Cassel, M.; Mayer, F.; Scharhag, J. How to test maximal oxygen uptake: A study on timing and testing procedure of a supramaximal verification test. Appl. Physiol. Nutr. Metab. 2011, 36, 153–160. [Google Scholar] [CrossRef]
- Hopkins, W.G.; Marshall, S.; Batterham, A.; Hanin, J. Progressive statistics for studies in sports medicine and exercise science. Med. Sci. Sports Exerc. 2009, 41, 3. [Google Scholar] [CrossRef]
- Cohen, J. A power primer. Psychol. Bull. 1992, 112, 155. [Google Scholar] [CrossRef] [PubMed]
- Training Peaks. What is TSS? Available online: https://www.trainingpeaks.com/blog/what-is-tss/ (accessed on 2 May 2019).
- Cooke, C.; McDonagh, M.; Nevill, A.; Davies, C. Effects of load on oxygen intake in trained boys and men during treadmill running. J. Appl. Physiol. 1991, 71, 1237–1244. [Google Scholar] [CrossRef] [PubMed]
- Puthoff, M.L.; Darter, B.J.; Nielsen, D.H.; Yack, H.J. The effect of weighted vest walking on metabolic responses and ground reaction forces. Med. Sci. Sports Exerc. 2006, 38, 746–752. [Google Scholar] [CrossRef] [PubMed]


| Training Load (%BM) | Mean VO2 (L) | Effect Size (±90% CI) | Rating |
|---|---|---|---|
| 0% | 3.64 ± 0.57 | - | - |
| 1% | 3.67 ± 0.59 | 0.13 (0.06; 0.21) | (7/93/0) likely trivial increase |
| 2% | 3.73 ± 0.62 | 0.13 (0.07; 0.19) | (3/97/0) very likely trivial increase |
| 3% | 3.80 ± 0.62 | 0.24 (0.17; 0.3) | (84/16/0) likely moderate increase |
| 4% | 3.84 ± 0.64 | 0.29 (0.2; 0.38) | (94/6/0) likely moderate increase |
| 5% | 3.94 ± 0.66 | 0.43 (0.37; 0.5) | (100/0/0) most likely very large increase |
| Training Load (%BM) | Mean Heart Rate (bpm) | Effect Size (±90% CI) | Rating |
|---|---|---|---|
| 0% | 157 ± 12 | - | - |
| 1% | 157 ± 13 | 0.05 (−0.07; 0.16) | (2/98/0) very likely trivial increase |
| 2% | 159 ± 13 | 0.17 (0.02; 0.31) | (36/64/0) possible small increase |
| 3% | 159 ± 12 | 0.2 (0.07; 0.33) | (49/51/0) possible small increase |
| 4% | 161 ± 11 | 0.32 (0.16; 0.47) | (90/10/0) likely moderate increase |
| 5% | 161 ± 11 | 0.33 (0.21; 0.45) | (96/4/0) very likely large increase |
| Training Load (%BM) | Mean LA (mmol/L) | Effect Size (±90% CI) | Rating |
|---|---|---|---|
| 0% | 2.62 ± 1.56 | - | - |
| 1% | 2.77 ± 1.90 | 0.0 (−0.27; 0.28) | (12/77/11) unclear effect |
| 2% | 4.83 ± 2.04 | 0.08 (−0.07; 0.23) | (10/90/0) likely trivial increase |
| 3% | 3.27 ± 1.79 | 0.41 (0.23; 0.60) | (97/3/0) very likely large increase |
| 4% | 3.30 ± 2.03 | 0.42 (0.23; 0.61) | (97/3/0) very likely large increase |
| 5% | 3.52 ± 2.35 | 0.49 (0.34; 0.63) | (100/0/0) most likely very large increase |
| Training Load (%BM) | Mean Rate of Perceived Exertion | Effect Size (±90% CI) | Rating |
|---|---|---|---|
| 0% | 3.08 ± 1.37 | - | - |
| 1% | 3.35 ± 1.16 | 0.28 (0.03; 0.53) | (70/30/0) possible small increase |
| 2% | 3.68 ± 1.44 | 0.43 (0.19; 0.66) | (95/5/0) likely moderate increase |
| 3% | 3.73 ± 1.33 | 0.52 (0.26; 0.78) | (98/2/0) very likely large increase |
| 4% | 4.20 ± 1.26 | 0.82 (0.53; 1.11) | (100/0/0) most likely very large increase |
| 5% | 4.38 ± 1.57 | 0.86 (0.58; 1.14) | (100/0/0) most likely very large increase |
© 2019 by the authors. Licensee MDPI, Basel, Switzerland. This article is an open access article distributed under the terms and conditions of the Creative Commons Attribution (CC BY) license (http://creativecommons.org/licenses/by/4.0/).
Share and Cite
Field, A.P.; Gill, N.; Macadam, P.; Plews, D. Acute Metabolic Changes with Thigh-Positioned Wearable Resistances during Submaximal Running in Endurance-Trained Runners. Sports 2019, 7, 187. https://0-doi-org.brum.beds.ac.uk/10.3390/sports7080187
Field AP, Gill N, Macadam P, Plews D. Acute Metabolic Changes with Thigh-Positioned Wearable Resistances during Submaximal Running in Endurance-Trained Runners. Sports. 2019; 7(8):187. https://0-doi-org.brum.beds.ac.uk/10.3390/sports7080187
Chicago/Turabian StyleField, Allister P., Nicholas Gill, Paul Macadam, and Dan Plews. 2019. "Acute Metabolic Changes with Thigh-Positioned Wearable Resistances during Submaximal Running in Endurance-Trained Runners" Sports 7, no. 8: 187. https://0-doi-org.brum.beds.ac.uk/10.3390/sports7080187