Isokinetic Dynamometry as a Tool to Predict Shoulder Injury in an Overhead Athlete Population: A Systematic Review


 ,
,  and
and 
Abstract
:1. Introduction
2. Materials and Methods
2.1. Study Design
2.2. Search Strategy
2.3. Study Selection
2.4. Eligibility Criteria
2.5. Critical Appraisal/Assessment of Methodological Quality
2.6. Data Extraction
2.7. Data Synthesis/Analysis
- Strong evidence: provided two or more studies with high quality and by generally consistent findings in all studies (≥75% of the studies reported consistent findings).
- Moderate evidence: provided by one study with high quality and/or two or more studies with low quality, and by generally consistent findings in all studies (≥75% of the studies reported consistent findings).
- Limited evidence: only one study with low quality.
- Conflicting evidence: inconsistent findings in multiple studies (<75% of the studies reported consistent findings).
- No evidence: when no studies could be found.
2.8. Assessment of Sample Size
3. Results
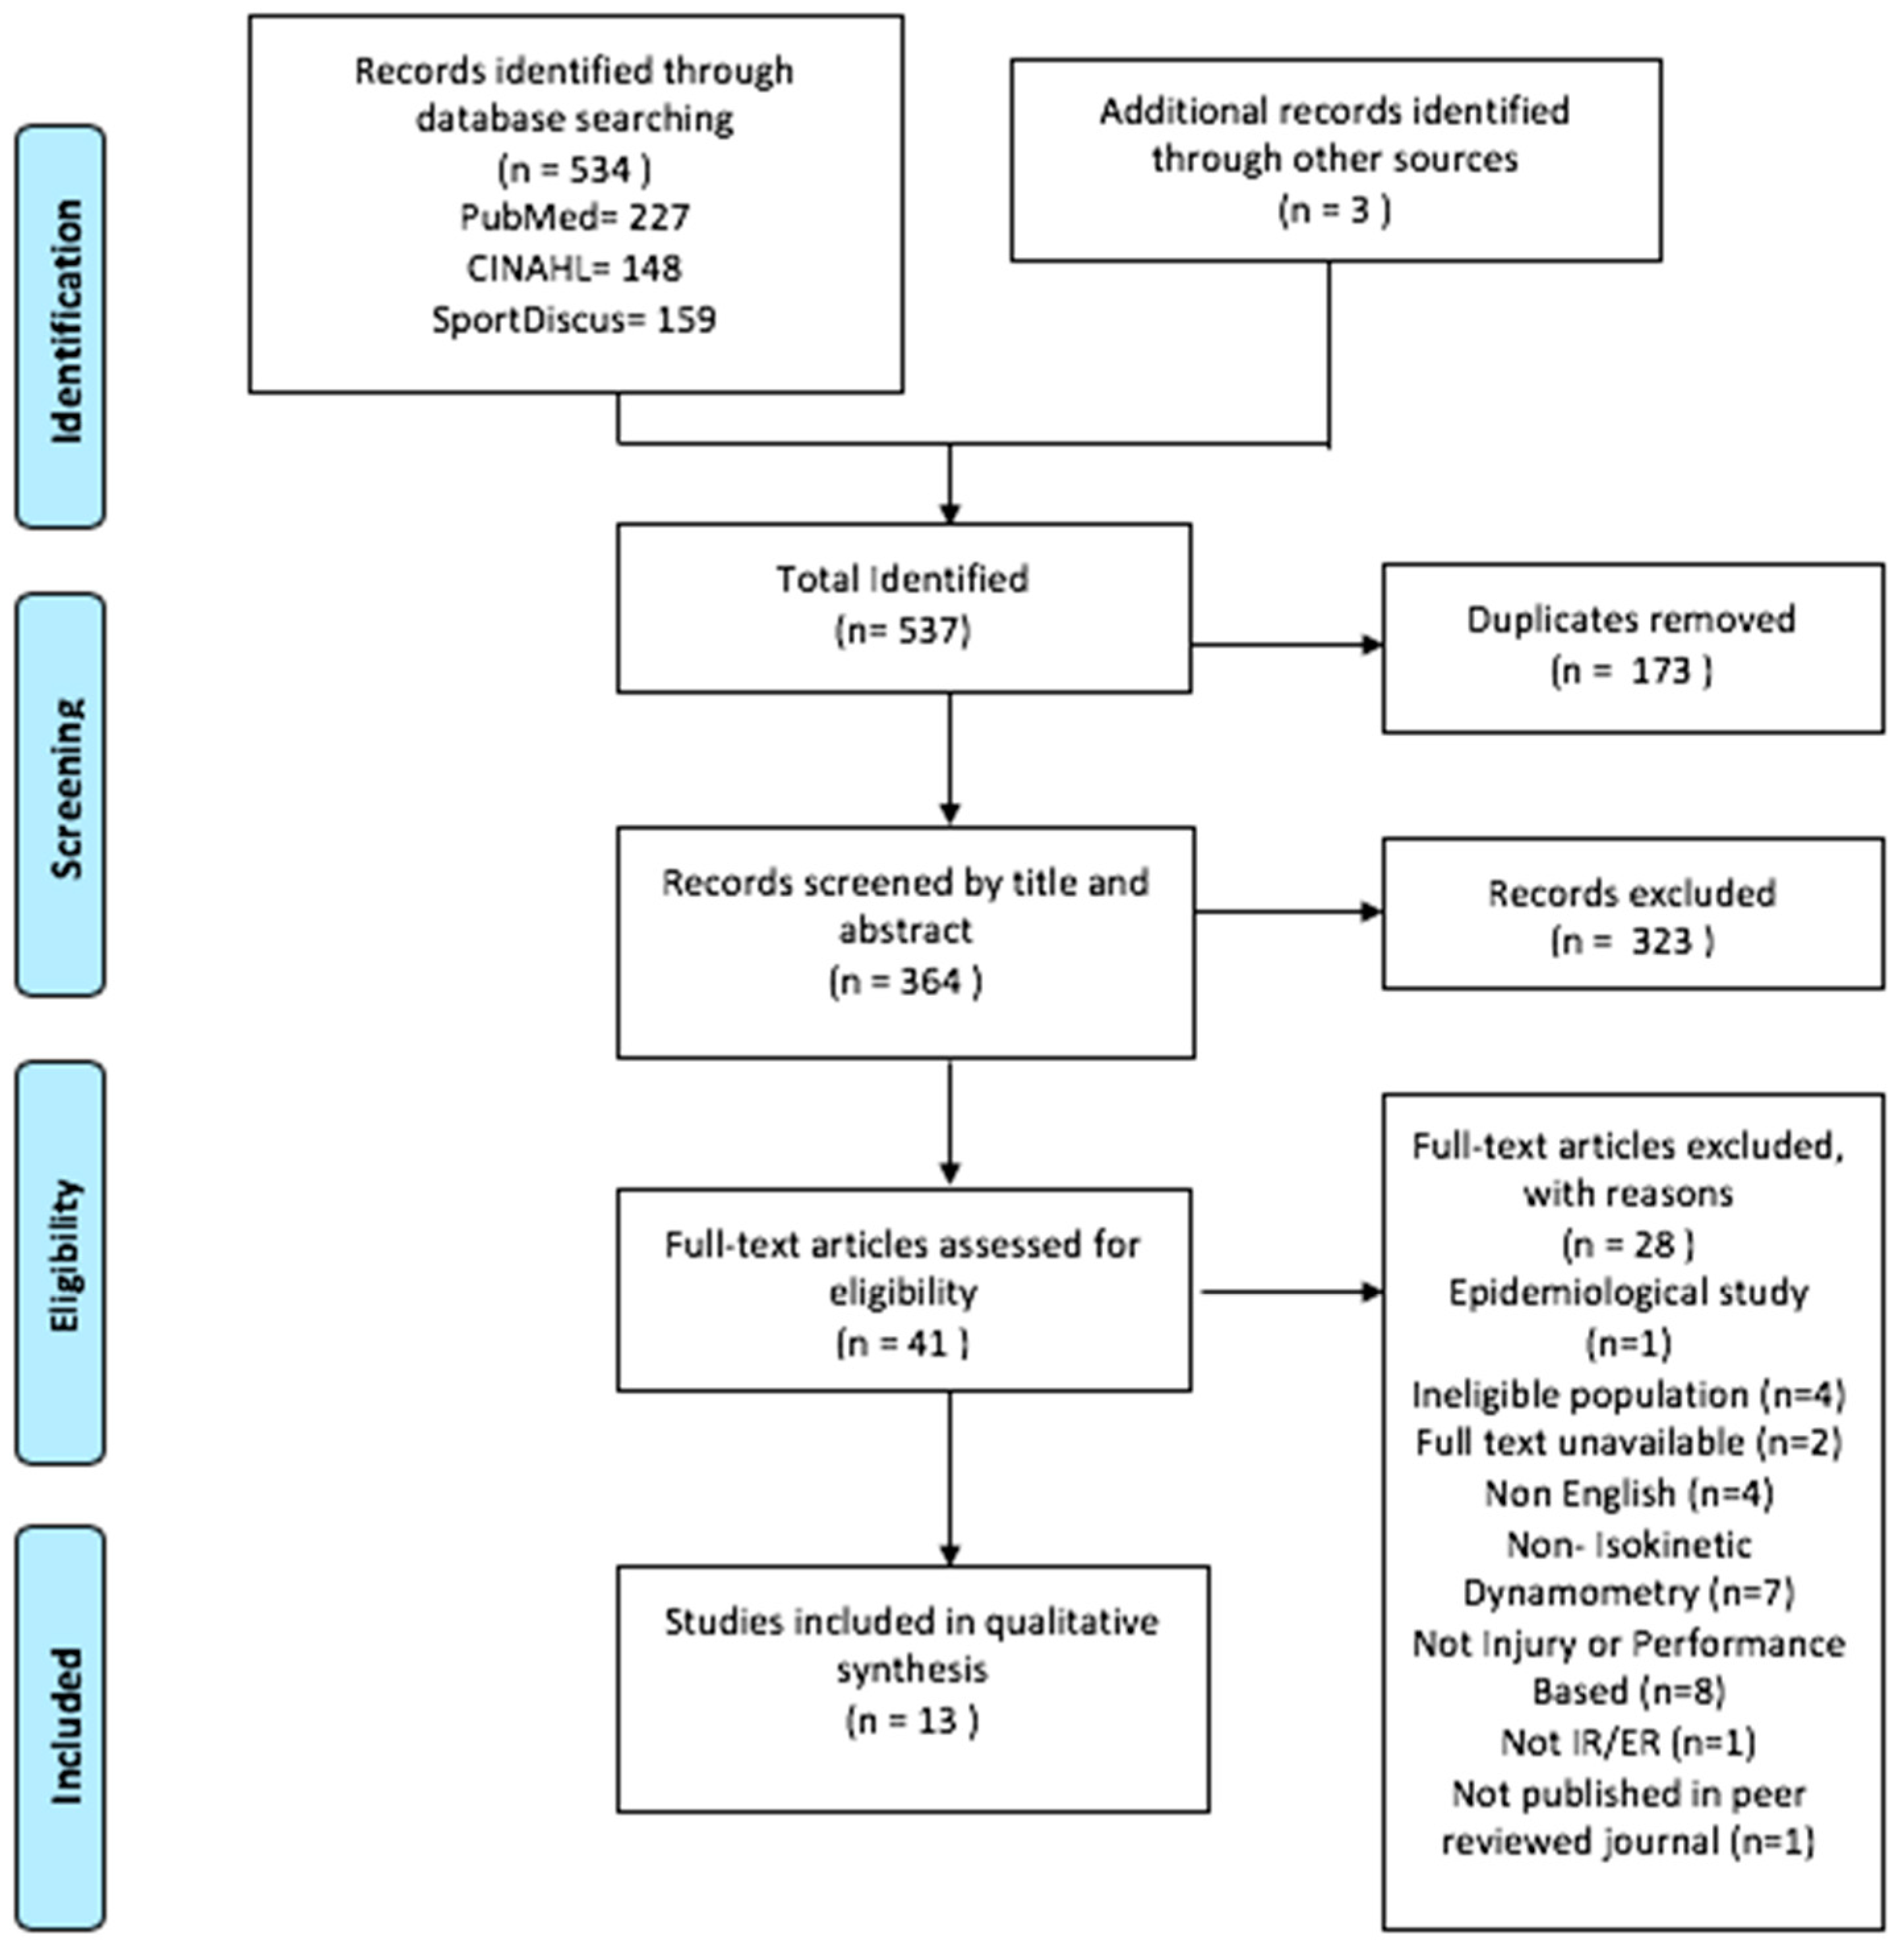
3.1. Search Results
3.2. Critical Appraisal Results
3.3. Key Findings
3.3.1. Characteristics of Included Studies
3.3.2. Participants
3.3.3. Testing Protocol
3.4. Main Findings in Relation to Isokinetic Dynamometry and Its Association with Injury
3.4.1. Cross-Sectional Studies
3.4.2. Prospective Cohort Studies
4. Discussion
4.1. Quality of Included Studies
4.2. Predictive Value of Isokinetic Dynamometry
4.3. Strengths and Limitations
4.4. Implications for Future Research
5. Conclusions
Author Contributions
Funding
Conflicts of Interest
References
- Osternig, L.R. Isokinetic dynamometry: Implications for muscle testing and rehabilitation. Exerc. Sport Sci. Rev. 1986, 14, 45–80. [Google Scholar] [CrossRef] [PubMed]
- Berry, M.J.; Dvir, Z. Isokinetics: Muscle Testing, Interpretation, and Clinical Applications. Med. Sci. Sports Exerc. 1995, 27, 1709. [Google Scholar] [CrossRef]
- Croisier, J.L.; Ganteaume, S.; Binet, J.; Genty, M.; Ferret, J.M. Strength imbalances and prevention of hamstring injury in professional soccer players: A prospective study. Am. J. Sports Med. 2008, 36, 1469–1475. [Google Scholar] [CrossRef] [PubMed]
- Pua, Y.H.; Bryant, A.L.; Steele, J.R.; Newton, R.U.; Wrigley, T.V. Isokinetic dynamometry in anterior cruciate ligament injury and reconstruction. Ann. Acad. Med. Singapore 2008, 37, 330–340. [Google Scholar] [PubMed]
- Zuzgina, O.; Wdowski, M. Asymmetry of dominant and non-dominant shoulders in university level men and women volleyball players. Hum. Mov. 2019, 20, 19–27. [Google Scholar] [CrossRef]
- Zusa, A.; Lanka, J.; Čupriks, L.; Dravniece, I. A Descriptive Profile of Isometric Muscle Strength and Muscle Strength Imbalance in Young Tennis Players. Balt. J. Sport Health Sci. 2015, 4, 54–61. [Google Scholar] [CrossRef]
- Harput, G.; Guney, H.; Toprak, U.; Kaya, T.; Colakoglu, F.F.; Baltaci, G. Shoulder-Rotator Strength, Range of Motion, and Acromiohumeral Distance in Asymptomatic Adolescent Volleyball Attackers. J. Athl. Train. 2016, 51, 733–738. [Google Scholar] [CrossRef] [Green Version]
- Haines, M.R. Differences in Glenohumeral Joint Rotation and Peak Power Output Between Super League and Championship Rugby League Players. J. Strength Cond. Res. 2018, 32, 1685–1691. [Google Scholar] [CrossRef] [Green Version]
- Sliwowski, R.; Grygorowicz, M.; Hojszyk, R.; Jadczak, L. The isokinetic strength profile of elite soccer players according to playing position. PLoS ONE 2017, 12, e0182177. [Google Scholar] [CrossRef] [Green Version]
- Haines, M.R.; Fish, M.; O’Sullivan, D. Seasonal changes in glenohumeral joint isokinetic strength in professional rugby league players. Phys. Sport 2019, 39, 32–37. [Google Scholar] [CrossRef]
- Ebert, J.R.; Webster, K.E.; Edwards, P.K.; Joss, B.K.; D’Alessandro, P.; Janes, G.; Annear, P. Current perspectives of Australian therapists on rehabilitation and return to sport after anterior cruciate ligament reconstruction: A survey. Phys. Sport 2019, 35, 139–145. [Google Scholar] [CrossRef] [PubMed]
- O’Malley, E.; Richter, C.; King, E.; Strike, S.; Moran, K.; Franklyn-Miller, A.; Moran, R. Countermovement Jump and Isokinetic Dynamometry as Measures of Rehabilitation Status After Anterior Cruciate Ligament Reconstruction. J. Athl. Train. 2018, 53, 687–695. [Google Scholar] [CrossRef] [PubMed] [Green Version]
- Hickey, J.T.; Timmins, R.G.; Maniar, N.; Williams, M.D.; Opar, D.A. Criteria for Progressing Rehabilitation and Determining Return-to-Play Clearance Following Hamstring Strain Injury: A Systematic Review. Sports Med. 2017, 47, 1375–1387. [Google Scholar] [CrossRef] [PubMed]
- Thomas, C.; Comfort, P.; Dos’Santos, T.; Jones, P.A. Determining Bilateral Strength Imbalances in Youth Basketball Athletes. Int. J. Sports Med. 2017, 38, 683–690. [Google Scholar] [CrossRef]
- Walker, S.W.; Couch, W.H.; Boester, G.A.; Sprowl, D.W. Isokinetic strength of the shoulder after repair of a torn rotator cuff. J. Bone Jt. Surg. Am. 1987, 69, 1041–1044. [Google Scholar] [CrossRef]
- Bigoni, M.; Gorla, M.; Guerrasio, S.; Brignoli, A.; Cossio, A.; Grillo, P.; Marinoni, E.C. Shoulder evaluation with isokinetic strength testing after arthroscopic rotator cuff repairs. J. Shoulder Elb. Surg. 2009, 18, 178–183. [Google Scholar] [CrossRef]
- Batalha, N.; Paixão, C.; Silva, A.J.; Costa, M.J.; Mullen, J.; Barbosa, T.M. The Effectiveness of a Dry-Land Shoulder Rotators Strength Training Program in Injury Prevention in Competitive Swimmers. J. Hum. Kinet. 2020, 71, 11–20. [Google Scholar] [CrossRef] [Green Version]
- Bahr, R.; Reeser, J.C. Injuries among world-class professional beach volleyball players. The Federation Internationale de Volleyball beach volleyball injury study. Am. J. Sports Med. 2003, 31, 119–125. [Google Scholar] [CrossRef]
- Moller, M.; Attermann, J.; Myklebust, G.; Wedderkopp, N. Injury risk in Danish youth and senior elite handball using a new SMS text messages approach. Br. J. Sports Med. 2012, 46, 531–537. [Google Scholar] [CrossRef] [Green Version]
- Verhagen, E.A.; Van der Beek, A.J.; Bouter, L.M.; Bahr, R.M.; Van Mechelen, W. A one season prospective cohort study of volleyball injuries. Br. J. Sports Med. 2004, 38, 477–481. [Google Scholar] [CrossRef] [Green Version]
- Wolf, B.R.; Ebinger, A.E.; Lawler, M.P.; Britton, C.L. Injury patterns in Division I collegiate swimming. Am. J. Sports Med. 2009, 37, 2037–2042. [Google Scholar] [CrossRef] [PubMed]
- Furness, J.; Hing, W.; Walsh, J.; Abbott, A.; Sheppard, J.M.; Climstein, M. Acute injuries in recreational and competitive surfers: Incidence, severity, location, type, and mechanism. Am. J. Sports Med. 2015, 43, 1246–1254. [Google Scholar] [CrossRef] [PubMed] [Green Version]
- Bonza, J.E.; Fields, S.K.; Yard, E.E.; Dawn Comstock, R. Shoulder injuries among United States high school athletes during the 2005–2006 and 2006–2007 school years. J. Athl. Train. 2009, 44, 76–83. [Google Scholar] [CrossRef] [PubMed] [Green Version]
- Makhni, E.C.; Lee, R.W.; Nwosu, E.O.; Steinhaus, M.E.; Ahmad, C.S. Return to competition, re-injury, and impact on performance of preseason shoulder injuries in Major League Baseball pitchers. Phys. Sports Med. 2015, 43, 300–306. [Google Scholar] [CrossRef]
- Bennell, K.; Wajswelner, H.; Lew, P.; Schall-Riaucour, A.; Leslie, S.; Plant, D.; Cirone, J. Isokinetic strength testing does not predict hamstring injury in Australian Rules footballers. Br. J. Sports Med. 1998, 32, 309–314. [Google Scholar] [CrossRef] [PubMed]
- Aginsky, K. Shoulder injuries in provincial male fast bowlers–predisposing factors. S. Afr. Sports Med. Assoc. 2004, 16, 25. [Google Scholar] [CrossRef]
- Mickevicius, M.; Rutkauskas, S.; Sipaviciene, S.; Skurvydas, A.; Jurimae, J.; Degens, H.; Kamandulis, S. Absence of Bilateral Differences in Child Baseball Players with Throwing-related Pain. Int. J. Sports Med. 2016, 37, 952–957. [Google Scholar] [CrossRef]
- Stickley, C.D.; Hetzler, R.K.; Freemyer, B.G.; Kimura, I.F. Isokinetic peak torque ratios and shoulder injury history in adolescent female volleyball athletes. J. Athl. Train. 2008, 43, 571–577. [Google Scholar] [CrossRef] [Green Version]
- Stuelcken, M.C.; Ginn, K.A.; Sinclair, P.J. Shoulder strength and range of motion in elite female cricket fast bowlers with and without a history of shoulder pain. J. Sci. Med. Sport 2008, 11, 575–580. [Google Scholar] [CrossRef]
- Asker, M.; Brooke, H.L.; Walden, M.; Tranaeus, U.; Johansson, F.; Skillgate, E.; Holm, L.W. Risk factors for, and prevention of, shoulder injuries in overhead sports: A systematic review with best-evidence synthesis. Br. J. Sports Med. 2018, 52, 1312–1319. [Google Scholar] [CrossRef]
- Moher, D.; Liberati, A.; Tetzlaff, J.; Altman, D.G. Preferred reporting items for systematic reviews and meta-analyses: The PRISMA statement. PLoS Med. 2009, 6, e1000097. [Google Scholar] [CrossRef] [PubMed] [Green Version]
- Tricco, A.C.; Tetzlaff, J.; Sampson, M.; Fergusson, D.; Cogo, E.; Horsley, T.; Moher, D. Few systematic reviews exist documenting the extent of bias: A systematic review. J. Clin. Epidemiol. 2008, 61, 422–434. [Google Scholar] [CrossRef] [PubMed]
- CASP. CASP Appraisial Checklist. Available online: https://casp-uk.net/casp-tools-checklists/ (accessed on 9 September 2019).
- Downes, M.J.; Brennan, M.L.; Williams, H.C.; Dean, R.S. Development of a critical appraisal tool to assess the quality of cross-sectional studies (AXIS). BMJ Open 2016, 6, e011458. [Google Scholar] [CrossRef] [PubMed] [Green Version]
- McArthur, K.; Jorgensen, D.; Climstein, M.; Furness, J. Epidemiology of Acute Injuries in Surfing: Type, Location, Mechanism, Severity, and Incidence: A Systematic Review. Sports 2020, 8, 25. [Google Scholar] [CrossRef] [Green Version]
- Matthews, W.; Ellis, R.; Furness, J.; Hing, W. Classification of Tendon Matrix Change Using Ultrasound Imaging: A Systematic Review and Meta-analysis. Ultrasound Med. Biol. 2018, 44, 2059–2080. [Google Scholar] [CrossRef] [PubMed] [Green Version]
- Kennelly, J. Reducing Racial/Ethnic Disparities in Reproductive and Perinatal Outcomes; Springer: Boston, MA, USA, 2011; pp. 7–19. [Google Scholar]
- NHMRC. NHMRC Additional Levels of Evidence and Grades for Recommendations for Developers of Guidelines; Australian Government NHMRD: Canberra, Australia, 2009.
- NHMRC. How to Use the Evidence: Assessment and Application of Scientific Evidence; NHMRC, Ed.; Biotext: Canberra, Australia, 2000. [Google Scholar]
- Van Tulder, M.; Furlan, A.; Bombardier, C.; Bouter, L. Updated method guidelines for systematic reviews in the cochrane collaboration back review group. Spine 2003, 28, 1290–1299. [Google Scholar] [CrossRef] [Green Version]
- Reurink, G.; Goudswaard, G.J.; Tol, J.L.; Verhaar, J.A.; Weir, A.; Moen, M.H. Therapeutic interventions for acute hamstring injuries: A systematic review. Br. J. Sports Med. 2012, 46, 103–109. [Google Scholar] [CrossRef]
- Hsieh, F.Y. Sample size tables for logistic regression. Stat. Med. 1989, 8, 795–802. [Google Scholar] [CrossRef]
- Tonin, K.; Strazar, K.; Burger, H.; Vidmar, G. Adaptive changes in the dominant shoulders of female professional overhead athletes: Mutual association and relation to shoulder injury. Int. J. Rehabil. Res. 2013, 36, 228–235. [Google Scholar] [CrossRef]
- Bak, K.; Magnusson, S.P. Shoulder strength and range of motion in symptomatic and pain-free elite swimmers. Am. J. Sports Med. 1997, 25, 454–459. [Google Scholar] [CrossRef]
- Beach, M.L.; Whitney, S.L.; Dickoff-Hoffman, S. Relationship of shoulder flexibility, strength, and endurance to shoulder pain in competitive swimmers. J. Orthop. Sports Phys. 1992, 16, 262–268. [Google Scholar] [CrossRef] [PubMed]
- Forthomme, B.; Croisier, J.L.; Delvaux, F.; Kaux, J.F.; Crielaard, J.M.; Gleizes-Cervera, S. Preseason Strength Assessment of the Rotator Muscles and Shoulder Injury in Handball Players. J. Athl. Train. 2018, 53, 174–180. [Google Scholar] [CrossRef] [PubMed] [Green Version]
- Forthomme, B.; Wieczorek, V.; Frisch, A.; Crielaard, J.M.; Croisier, J.L. Shoulder pain among high-level volleyball players and preseason features. Med. Sci. Sports Exerc. 2013, 45, 1852–1860. [Google Scholar] [CrossRef] [PubMed]
- McDonough, A.; Funk, L. Can glenohumeral joint isokinetic strength and range of movement predict injury in professional rugby league. Phys. Sport 2014, 15, 91–96. [Google Scholar] [CrossRef]
- Vogelpohl, R.; Kollock, R. Isokinetic Rotator Cuff Functional Ratios and the Development of Shoulder Injury in Collegiate Baseball Pitchers. Int. J. Athl. Ther. Train. 2015, 20, 46–52. [Google Scholar] [CrossRef]
- Edouard, P.; Degache, F.; Oullion, R.; Plessis, J.Y.; Gleizes-Cervera, S.; Calmels, P. Shoulder strength imbalances as injury risk in handball. Int. J. Sports Med. 2013, 34, 654–660. [Google Scholar] [CrossRef]
- Wang, H.K.; Cochrane, T. Mobility impairment, muscle imbalance, muscle weakness, scapular asymmetry and shoulder injury in elite volleyball athletes. J. Sports Med. Phys. Fit. 2001, 41, 403–410. [Google Scholar]
- Veeger, H.E.J.; van der Helm, F.C.T. Shoulder function: The perfect compromise between mobility and stability. J. Biomech. 2007, 40, 2119–2129. [Google Scholar] [CrossRef]
- Cingel, R.V.; Kleinrensink, G.; Stoeckart, R.; Aufdemkampe, G.; Bie, R.D.; Kuipers, H. Strength Values of Shoulder Internal and External Rotators in Elite Volleyball Players. J. Sport Rehabil. 2006, 15, 236. [Google Scholar] [CrossRef] [Green Version]
- Green, B.; Bourne, M.N.; Pizzari, T. Isokinetic strength assessment offers limited predictive validity for detecting risk of future hamstring strain in sport: A systematic review and meta-analysis. Br. J. Sports Med. 2018, 52, 329–336. [Google Scholar] [CrossRef]
- Conn, V.; Valentine, J.; Cooper, H.; Rantz, M. Grey Literature in Meta-Analyses. Nurs. Res. 2003, 52, 256–261. [Google Scholar] [CrossRef] [PubMed]


| Database | Search Terms |
|---|---|
| PubMed, CINAHL & Sport Discus | (Biodex OR Cybex OR isokinetic* OR isotonic OR concentric OR eccentric OR “peak torque” OR dynamomet*) AND (Shoulder* OR Glenohumeral OR “Rotator Cuff” OR “rotator muscles” OR “upper limb” OR “upper extremity”) AND (swim* OR water-based OR surf* OR kayak* OR “water polo” OR “water sport” OR Baseball OR softball OR cricket OR volleyball OR “arm wrestling” OR sport OR sports OR sporting OR athlete* Or player* OR handball or rugby or basketball) AND (Injury OR injuries OR Strength OR “risk factors” OR preseason OR “weakness”) AND (Prospective OR prediction OR prevention OR predictor OR risk) |
| Study (n=13) Author (Year) [Reference] | Scores Assigned by Item Number | ||||||||||||||||||
|---|---|---|---|---|---|---|---|---|---|---|---|---|---|---|---|---|---|---|---|
| AXIS | 1 | 2 | 3 | 4 | 5 | 6 | 8 | 9 | 10 | 11 | 12 | 15 | 16 | 17 | 18 | 19 | 20 | Score | Quality |
| Mickevicius et al. (2016) [27] | 1 | 1 | 0 | 1 | 1 | 1 | 1 | 0 | 0 | 1 | 1 | 1 | 1 | 0 | 1 | 1 | 1 | 76% | Good |
| Stickley et al. (2008) [28] | 1 | 1 | 0 | 1 | 1 | 0 | 1 | 1 | 1 | 1 | 1 | 1 | 1 | 0 | 1 | 1 | 1 | 82% | Good |
| Tonin et al. (2013) [43] | 1 | 1 | 0 | 1 | 1 | 1 | 1 | 0 | 1 | 1 | 1 | 1 | 1 | 1 | 1 | 1 | 1 | 88% | Good |
| Bak et al. (1997) [44] | 1 | 1 | 0 | 1 | 1 | 0 | 1 | 0 | 1 | 1 | 0 | 1 | 1 | 1 | 0 | 1 | 0 | 64% | Fair |
| Aginsky et al. (2004) [26] | 1 | 1 | 0 | 1 | 0 | 0 | 1 | 1 | 1 | 0 | 1 | 1 | 1 | 0 | 0 | 1 | 0 | 58% | Fair |
| Beach et al. (1992) [45] | 1 | 1 | 0 | 1 | 0 | 0 | 1 | 1 | 0 | 1 | 1 | 1 | 1 | 1 | 1 | 1 | 0 | 70% | Good |
| Stuelcken et al. (2008) [29] | 1 | 1 | 0 | 1 | 1 | 0 | 1 | 1 | 0 | 1 | 1 | 1 | 1 | 1 | 1 | 1 | 1 | 82% | Good |
| CASP | 1 | 2 | 3 | 4 | 5a | 5b | 6a | 6b | 7,8,9 | 10 | 11 | 12 | Score | Quality | |||||
| Forthomme et al. (2018) [46] | 1 | 1 | 1 | 1 | 1 | 1 | 1 | 1 | 1 | 1 | 1 | 1 | 100% | Good | |||||
| Forthomme et al. (2013) [47] | 1 | 1 | 1 | 1 | 1 | 1 | 1 | 1 | 1 | 1 | 1 | 1 | 100% | Good | |||||
| McDonough et al. (2016) [48] | 1 | 1 | 1 | 1 | 0 | 0 | 1 | 1 | 0 | 1 | 1 | 1 | 75% | Good | |||||
| Vogelpohl et al. (2015) [49] | 1 | 1 | 1 | 1 | 0 | 0 | 1 | 1 | 1 | 1 | 0 | 1 | 83% | Good | |||||
| Edouard et al. (2013) [50] | 1 | 1 | 1 | 1 | 1 | 1 | 1 | 1 | 1 | 1 | 1 | 1 | 91% | Good | |||||
| Wang et al. (2001) [51] | 1 | 1 | 1 | 1 | 1 | 0 | 1 | 0 | 0 | 0 | 1 | 0 | 58% | Fair | |||||
| Author (Year) and [Reference] | Aim/Objective/Hypothesis | Study Design | CASP/AXIS Score | Level of Evidence |
|---|---|---|---|---|
| Forthomme et al. (2018) [46] | To analyse measurements of maximal rotator muscle strength to identify intrinsic risk factors that could put elite handball players at risk for traumatic and micro-traumatic dominant-shoulder injuries. | Prospective Cohort | CASP, 100% | II |
| Forthomme et al. (2013) [47] | To highlight the intrinsic factors that could potentially put volleyball players at risk for shoulder injury, such as rotator cuff maximal strength, passive glenohumeral mobility, posterior rotator cuff stiffness, scapular resting position, or a forward presenting shoulder. | Prospective Cohort | CASP, 100% | II |
| Edouard et al. (2013) [50] | To analyse whether internal and external rotator shoulder muscles weakness and/or imbalance collected through a pre-season assessment could be predictors of subsequent shoulder injury during a season in handball players. | Prospective Cohort | CASP, 91% | II |
| Vogelpohl et al. (2015) [49] | To investigate the link between preseason shoulder rotator cuff functional strength ratios and the development of shoulder pain and injury. | Prospective Cohort | CASP, 83% | II |
| McDonough et al. (2014) [48] | To associate shoulder isokinetic strength and range of motion variable with subsequent injuries over a rugby league season. | Prospective Cohort | CASP, 75% | II |
| Wang et al. (2001) [51] | To evaluate the relationship between shoulder mobility, rotator muscles strength and scapular symmetry, and shoulder injuries and/or pain in elite volleyball athletes. | Prospective Cohort | CASP, 58% | II |
| Aginsky et al. (2004) [26] | To investigate the relationship between shoulder flexibility and isokinetic strength as possible factors that may predispose provincial fast bowlers to shoulder injuries. | Cross-Sectional | AXIS, 58% | III-3 |
| Beach et al. (1992) [45] | To provide normative data on shoulder flexibility in swimmers, to determine if a correlation exists between flexibility and shoulder pain, and to determine the correlation between strength and endurance ratios to shoulder pain. | Cross-Sectional | AXIS, 70% | III-3 |
| Bak et al. (1997) [44] | To examine shoulder strength and range of motion in two matched groups of swimmers with and without shoulder pain. | Cross-Sectional | AXIS, 64% | III-3 |
| Mickevicius et al. (2016) [27] | To assess whether side-to-side differences in morphology and function of the upper limbs in 11–12-year-old male baseball players with throwing-related pain were more pronounced than that of age-matched healthy untrained subjects. | Cross-Sectional | AXIS, 76% | III-3 |
| Stickley et al. (2008) [28] | To compare medial and lateral isokinetic peak torque of the rotator cuff among skill levels and between athletes with and without a history of shoulder injury. | Cross-Sectional | AXIS, 82% | III-3 |
| Stuelcken et al. (2008) [29] | To determine the prevalence of shoulder pain in female cricket fast bowlers and compare the shoulder rotation range of motion and strength of those bowlers with and without a history of shoulder pain. | Cross-Sectional | AXIS, 82% | III-3 |
| Tonin et al. (2013) [43] | To evaluate adaptive changes in the dominant shoulders of female professional overhead athletes, their mutual association, and relation between adaptive changes and shoulder injury. | Cross-Sectional | AXIS, 88% | III-3 |
| Author | Participant Details | Testing Protocol | Key Findings | |
|---|---|---|---|---|
| Key Points | Measurements of Significant Findings | |||
| Aginsky et al. (2004) [26] | n = 21 M R arm fast bowlers A(y): 17–36, (I) = 9 (C) = 12 | Cybex -GHJ: 90° ABD -Elbow: 90° flexion -ROM: 150° Reps not specified, 90°/s, 180°/s | Strength: (I) had ↑ weight normalised Conc IR PT at 180°/s compared to (C) * -No significant difference between (I) and (C) groups for absolute PT at 90°/s or 180°/s for both IR & ER Ratio: No significant difference between (I) and (C) groups for ER:IR | PT at 180°/s -(I): Nm/kg (10.03) -(C): Nm/kg (10.26) p = 0.009 |
| Beach et al. (1992) [49] | n = 32 (8 M, 24 F) Division 1 swimmers, and 4 club swimmers A(y): | Cybex II -Prone -GHJ: 90° ABD, Elbow: 90° flexion -3 reps of maximum effort at 60°/s, 50 reps at 240°/s | Ratio: Significant correlation to shoulder pain at 240°/s for ER * -Correlation to shoulder pain: L 0.61 R 0.69 p < 0.001 -Very low and nonsignificant correlation between strength ratios and shoulder pain | PT at 240°/s L: 80% (23%) R: 78% (22%) |
| Bak et al. (1997) [50] | n = 15 (6F, 9M) National level swimmers A(y): (I) = 7 (C) = 8 | Kin Com -Seated -GHJ: 80° ABD, 20° forward flexion in transverse plane -Elbow: 90° flexion 30°/s | Strength: No significant difference in PT for ER between (I) side compared to (C) side -No significant difference in PT for ER and IR btw (I) group & (C) group R: Fx ER Ecc: IR Conc at 30°/sec ↑ on (I) side compared to (C) side * -(I) group had significant ↑ Conc and Ecc ER:IR compared to (C) group * | FX ER Ecc:IR Conc -(I) side: 108% (18%) -(C) side: 89% (15%) ER:IR Conc and Ecc –(I) group: 83% (11%) -(C) group: 66% (11%) p = 0.02 |
| Edouard et al. (2013) [43] | n = 30 F Elite handball players (16) and non-athletes (14) A(y): “youth” | Con Trex -Seated -GHJ: 45° ABD in scapular plane -Elbow: 90° flexion -ROM: GHJ, 70°, IR; 15°, ER; 55° -Conc; 3 reps 60°/s, 3 reps 120°/s, 5 reps 240°/s Ecc; 3 reps 60°/s | Strength: No significant relative risk of injury for Conc and Ecc at 60°/s & 120°/s Endurance: No significant relative risk of injury for Conc at 240°/s R: Relative risk of injury was 2.08 for Fx IR Ecc: ER Conc at 60°/s * -Relative risk of injury was 2.57 for conventional ER Conc: IR Conc at 240°/s * | ER Conc:IR Conc at 240°/s -criteria<.69 CI: 1.6–3.54, 95%, p < 0.05 Fx IR Ecc:ER Conc at 60°/s -criteria>1.61 CI: 1.18–2.98; 95%, p < 0.05 |
| Forthomme et al. (2018) [44] | n = 108 M Handball, senior division A(y): (I) = 51 (C) = 57 | Cybex -Supine -GHJ: 90° ABD in frontal plane -Elbow: 90° flexion -ROM: 50° IR to 70° ER -Conc: 3 reps 60°/s, 5 reps 240°/s -Ecc: 4 reps 60°/s | Strength: No significant difference between (I) group and (C) group PT (p > 0.05) Endurance: (I) group had ↓ Conc IR at 240°/s compared to (C) group -Calculated odds ratio showed ↑ Conc IR at 240°/s was a protective factor * Ratio: No sig. diff for Conc ER:IR at 60°/s & 240°/s btw (I) & (C) groups | ↑ conc IR at 240°/s -odds ratio = 0.93 (95%) CI = 0.865, 1.000, p = 0.49 |
| Forthomme et al. (2013) [45] | n = 66 (34 M and 32 F) Competitive volleyball players A(y): (I) = 15 (C) = 51 | Cybex -Supine -GHJ: 90° ABD in frontal plane -Elbow: 90° flexion -ROM: 50° IR to 70° ER -Conc: 3 reps 60°/s, 5 reps 240°/s -Ecc: 4 reps 60°/s | Strength: (C) group had ↑ Ecc ER and IR at 60°/s * -Odds ratio showed Ecc contraction of IR and ER was a protective factor (odds ratio <1), and each ↑ of 1 N.m by IR & ER in the Ecc mode ↓ the risk of shoulder pain by 1% (Respective odds ratios = 0.946, p = 0.01 and 0.940, p = 0.05) * Endurance: No significant difference in IR and ER at 240°/s for both (C) & (I) Ratio: No significant difference in ER:IR for both (C) and (I) | Ecc ER & IR at 60°/s -IR: Ecc 60/s, (C): 51.2 N.m (17.4) (I): 38 N.m (12.3) p < 0.01 * -ER: Ecc 60/s; (C): 41.7 N.m (11) (I): 35.2 N.m (8.6) p < 0.05 |
| McDonough et al. (2014) [47] | n = 20 M Professional/Semi-Professional Rugby League A(y): (I) = 8 (C) = 12 | Biodex -Seated -GHJ: 90° ABD in frontal plane -5 reps-180°/s | Strength: No significant difference in strength diff btw (I) and (C) groups -No predictive value for future injury Large effect for Ecc IR Ratio: No sig diff in IR Ecc:ER Conc | |
| Mickevicius et al. (2016) [27] | n = 30 M Baseball players A(y): 11–12 (I) = 14 baseball players with pain (C) = 16 age matched, healthy, non-athletes | Biodex -Seated -GHJ: 45° ABD, 30° horizontal flexion -Elbow: 90° flexion -ROM: 90° of extension to 180° flexion -3 maximal reps 90°/s | Strength: Ecc ER was ↑ in (C) group p < 0.05 * Ratio: ER Ecc: IR Conc was ↑ in (C) group (p < 0.05) * | Ecc ER (I) group: -Do: 16.8 N.m (5.6) -Ndo: 15.3 N.m (3.8) (C) group: -Do; 19.9 N.m (3.8) -Ndo: 20.3 N.m (6.6) ER Ecc:IR Conc (I): 55% (5%) (C): 64% (1%) |
| Stickley et al. (2008) [28] | n = 38 F Competitive volleyball players A(y): 10–15, (I) = 9 (C) = 29 | Biodex -Seated -GHJ: 30° flexion, 30° ABD -Elbow: 90° flexion -2 sets of 5 maximal repetitions 60°/s, 1st set Conc-2nd set Ecc | Strength: No significant difference between (I) and (C) groups Ratio: (I) group had ↓ IR Ecc: ER Conc compared to (C) group * | IR Ecc:ER Conc (I): 177% (39%) (C): 216% (44%) p = 0.02 |
| Stuelcken et al. (2008) [29] | n = 26 F Elite fast bowlers A(y): (I) = 12 (C) = 14 | Kin Com -Seated -GHJ: 45° ABD, 30° horizontal flexion -Elbow: 90° flexion -90°/s 1 set 5 reps Conc > Ecc cycles | Strength: No bilateral diff in PT for (I) or (C) groups (p > 0.05). Ratio: No significant difference in ER:IR (p > 0.05) | |
| Tonin et al. (2013) [51] | n = 36 F Competitive Volleyball (15) and Handball (21) Unknown Age (I) = 14 (C) = 22 | Biodex -Seated -GHJ: 90° ABD in scapular plane -Elbow: 90° flexion -ROM: 50° ER to 50° IR -20 maximal con reps 60°/s (endurance) -4 maximal reps 60°/s and 150°/s | Strength: (I) group had ↓ ER PT * -(I) group had ↓ Ecc ER PT at 60°/s * Endurance: (I) group had ↑ fatigability of IR and ER * Ratio: No significant difference for Ecc IR:ER Conc at 60°/s | ER PT (I): 120 (6.5), p = 0.021 (C): 129 (13.8) Ecc ER PT deficit at 60°/s (I): 14 (16.7), p = 0.049 (C): 2.8 (10.9) Fatigability (I): IR, 22.1% (10.4) ER; 28% (10.6) p = 0.013 (C): IR, 10.8% (20.5) ER; 16.6% (20.2) p = 0.028 |
| Vogelpohl et al. (2015) [48] | n = 15 M Collegiate Baseball Players A(y): (I) = 6 (C) = 9 | Biodex -Seated -GHJ: 45° ABD, 30° horizontal flexion -Conc and Ecc 4 reps 60°/s, 180°/s, and 300°/s 6 trials total | Strength: No sig. diff btw PT at 60°/s or 180°/s for (I) and (C) groups Endurance: Sig.↓ IR Conc PT at 300°/s in the (I) group (p = 0.003) * Ratio: Sig. ↑ ER Ecc:IR Conc (acceleration phase) at 300°/s in (I) group compared to (C) group. * | IR Conc PT at 300°/s (I): 34.73 N.m (13.71) (C): 55.82 N.m (8.06), p = 0.003 ER Ecc:IR Conc at 300°/s (I): 177% (107%), p = 0.02 (D): 81% (17%) |
| Wang et al. (2001) [46] | n = 16 M National level Volleyball players Unknown Age | Kin Com -Supine -GHJ: 90° ABD Elbow: 90° flexion -ROM: 50° ER to 50° IR -3 maximal contractions 60°/s, and 180°/s | Strength: No significant correlation between injury and muscle weakness Ratio: Significant correlation between muscle imbalance and injury (p = 0.041) Association between shoulder muscle strength imbalance in dominant arm and injury was statistically significant (p < 0.05) * | |
| Outcome Measured | Effect (+/−/=) [Article Reference] | Best Evidence Synthesis * |
|---|---|---|
| Strength (PT) | (+) [27,43,46,47] | Conflicting |
| (−) [26] | ||
| (=) [28,29,44,46,48,49,50,51] | ||
| Endurance | (+) [43,46,49] | Conflicting |
| (=) [47,50] | ||
| Strength (PT) Ratio | (+) [27,28,50,51] | Conflicting |
| (−) [44] | ||
| (=) [26,29,43,45,46,47,48] | ||
| Endurance Ratio | (+) [45,50] | Conflicting |
| (−) [49] | ||
| (=) [46,47] |
| Study | Outcome | |||
|---|---|---|---|---|
| Author (Year) [Reference] | Strength | Endurance | S: Ratio | E: Ratio |
| Cross Sectional | +/− | +/− | +/− | +/− |
| Mickevicius et al. (2016) [27] | + | + | ||
| Stickley et al. (2008) [28] | + | |||
| Tonin et al. (2013) [43] | + | + | ||
| Bak et al. (1997) [44] | − | |||
| Aginsky et al. (2004) [26] | − | |||
| Beach et al. (1992) [45] | + | |||
| Stuelcken et al. (2008) [29] | ||||
| Best Evidence Synthesis * | Conflicting | Limited | Conflicting | Limited |
| Prospective | ||||
| Forthomme et al. (2018) [46] | + | |||
| Forthomme et al. (2013) [47] | + | |||
| McDonough et al. (2016) [48] | ||||
| Vogelpohl et al. (2015) [49] | + | − | ||
| Edouard et al. (2013) [50] | + | + | ||
| Wang et al. (2001) [51] | + | |||
| Best Evidence Synthesis * | Limited | Strong | Strong | Conflicting |
© 2020 by the authors. Licensee MDPI, Basel, Switzerland. This article is an open access article distributed under the terms and conditions of the Creative Commons Attribution (CC BY) license (http://creativecommons.org/licenses/by/4.0/).
Share and Cite
Bagordo, A.; Ciletti, K.; Kemp-Smith, K.; Simas, V.; Climstein, M.; Furness, J. Isokinetic Dynamometry as a Tool to Predict Shoulder Injury in an Overhead Athlete Population: A Systematic Review. Sports 2020, 8, 124. https://0-doi-org.brum.beds.ac.uk/10.3390/sports8090124
Bagordo A, Ciletti K, Kemp-Smith K, Simas V, Climstein M, Furness J. Isokinetic Dynamometry as a Tool to Predict Shoulder Injury in an Overhead Athlete Population: A Systematic Review. Sports. 2020; 8(9):124. https://0-doi-org.brum.beds.ac.uk/10.3390/sports8090124
Chicago/Turabian StyleBagordo, Andrea, Kimberly Ciletti, Kevin Kemp-Smith, Vini Simas, Mike Climstein, and James Furness. 2020. "Isokinetic Dynamometry as a Tool to Predict Shoulder Injury in an Overhead Athlete Population: A Systematic Review" Sports 8, no. 9: 124. https://0-doi-org.brum.beds.ac.uk/10.3390/sports8090124