Exercise Intensity during Olympic-Distance Triathlon in Well-Trained Age-Group Athletes: An Observational Study


1
Graduate School of Comprehensive Human Sciences, University of Tsukuba, 1-1-1 Tennodai, Tsukuba, Ibaraki 305-8574, Japan
2
Faculty of Management, Josai University, 1-1 Keyakidai, Sakado, Saitama 350-0295, Japan
3
Faculty of Health and Sport Sciences, University of Tsukuba, 1-1-1 Tennodai, Tsukuba, Ibaraki 305-8574, Japan
*
Author to whom correspondence should be addressed.
Sports 2021, 9(2), 18; https://0-doi-org.brum.beds.ac.uk/10.3390/sports9020018
Submission received: 20 December 2020
/
Revised: 17 January 2021
/
Accepted: 18 January 2021
/
Published: 21 January 2021
(This article belongs to the Special Issue Maximising Triathlon Health and Performance: the State of the Art)
Abstract
:The aim of this study was to examine the exercise intensity during the swimming, cycling, and running legs of nondraft legal, Olympic-distance triathlons in well-trained, age-group triathletes. Seventeen male triathletes completed incremental swimming, cycling, and running tests to exhaustion. Heart rate (HR) and workload corresponding to aerobic and anaerobic thresholds, maximal workloads, and maximal HR (HRmax) in each exercise mode were analyzed. HR and workload were monitored throughout the race. The intensity distributions in three HR zones for each discipline and five workload zones in cycling and running were quantified. The subjects were then assigned to a fast or slow group based on the total race time (range, 2 h 07 min–2 h 41 min). The mean percentages of HRmax in the swimming, cycling, and running legs were 89.8% ± 3.7%, 91.1% ± 4.4%, and 90.7% ± 5.1%, respectively, for all participants. The mean percentage of HRmax and intensity distributions during the swimming and cycling legs were similar between groups. In the running leg, the faster group spent relatively more time above HR at anaerobic threshold (AnT) and between workload at AnT and maximal workload. In conclusion, well-trained male triathletes performed at very high intensity throughout a nondraft legal, Olympic-distance triathlon race, and sustaining higher intensity during running might play a role in the success of these athletes.
1. Introduction
Triathlon is a multidisciplinary endurance sport consisting of swimming, cycling, and running over a variety of distances [1]. The most common distances include the sprint (25.75 km, ~1 h), half-Ironman (113 km, ~4–5 h), and Ironman (226 km, ~8–17 h), and the most popular is the so-called Olympic distance (OD), consisting of standard distances for swimming (1.5 km), cycling (40 km), and running (10 km), for a total of 51.5 km. Scientific interest in the triathlon has significantly increased since the introduction of the 51.5-km race in the 2000 Summer Olympics, held in Sydney [2]. The total competition time of the OD race ranged from about 1 h 50 min to 2 h 40 min, with swimming accounting for 16%–19% (20–30 min), cycling of about 50%–55% (60–80 min), and running around 29%–31% (30–50 min) [3,4].
It is necessary to discern the physiological response and requirements during competition to optimize training and recovery, and to identify factors associated with performance. The efficient transition between two sequential legs of the triathlon has received considerable attention, e.g., the swim–cycle [5,6] and cycle–run [7,8] transitions have been well studied. Additionally, previous studies have assessed the acute consequences induced by the OD race, which include muscle [9,10] and intestinal damage [9], muscle fatigue [10], dehydration (>2%–4% body mass due to high sweat rates and high core temperatures, i.e., >39 °C) [11,12], systemic inflammation [13], transient immune suppression [14], reduced pulmonary diffusing capacity [15], and decreased aerobic exercise capacity [16,17].
Although a large number of studies have investigated the physiological responses and acute consequences of multidisciplinary and endurance sporting events, relatively few have addressed the sustained exercise intensity encountered during an actual OD race. Oxygen consumption (O2) and blood lactate concentration (BLa) are two of the main parameters used to quantify exercise intensity [18]. However, it is difficult to measure these variables during actual competition. Over the past two decades, heart rate (HR), as a marker of internal load, has been used to estimate exercise intensity [19,20], by relating individual competition HR values measured in the field with those obtained in a laboratory incremental test [20,21,22]. In addition, the combination of internal load (HR) and external load (workload, i.e., speed and power output (PO)) can provide important information about the physiological demands during endurance events [19]. Thus, knowledge of exercise intensity profiles based on internal and external loads can facilitate greater comprehension of the physiological demands of the OD triathlon.
Studies investigating exercise intensity during an actual OD race are sparse. According to Bernard et al. [21], the mean relative HR and workload of elite triathletes during cycling in OD race were 91% ± 4% of the maximal heart rate (HRmax) and 60% ± 8% of the maximal aerobic power (MAP), although these measurements were not reported during the swimming and running legs. A study conducted by Le Meur et al. [22] of the mean relative HR and workload during an OD race in relation to the individual metabolic capacities of elite triathletes assessed at each exercise mode (i.e., swimming, cycling, and running) reported 91%–92% of HRmax for swimming, 90%–91% of HRmax and 61.4%–63.4% of MAP for cycling, and 93%–94% of HRmax for running. However, the cohorts of these studies [21,22] were limited to elite triathletes. While elite triathletes compete in draft legal cycling, in which a competitor is permitted to draft within a sheltered position behind another, nonelite or age-group triathletes usually compete in nondraft legal racing. Drafting directly affects exercise intensity by reducing O2 (−14%) and HR (−7%), as compared to nondraft cycling with the same external load (speed) by triathletes [23]. Hence, it is necessary to distinguish between draft legal and nondraft legal races. To the best of our knowledge, only two studies have reported the exercise intensity sustained during actual nondraft legal OD races [24,25]. However, these were limited by reporting the absolute values of both HR (bpm) and workload (swimming speed, km·h−1; cycling PO, W; and running speed, km·h−1) [24] or the relative HR, but not workload, during cycling and running (not swimming), similar to an OD race (swimming:, 1.0 km; cycling, 30 km; and running, 8 km) [25]. Therefore, no study to date has investigated the relative exercise intensity sustained and the distribution of intensity during the entire duration of an actual nondraft legal OD race.
Furthermore, in other endurance events, there is an obvious tendency toward reduced relative intensity in relation to increased race duration. In ultra-endurance events of more than 8 h, such as the Ironman triathlon [26] and the 65-km run of a mountain ultra-marathon [27], the relative intensity during competition was lower than the ventilatory threshold (VT) and 80% of the HRmax. Hence, these intensities have been proposed as an “ultra-endurance threshold” [6]. In the 42-km marathon (~2.5–5 h), the mean relative HR is reportedly around 80%–90% of HRmax [28,29], which is similar to the HR at VT [30]. During a shorter event, such as a 5–10 km running (~15–55 min), the mean HR values are reportedly higher (~90–96% of HRmax) [28]. On the other hand, the relative intensity that can be sustained during an endurance race may also be related to differences in performance levels [31,32]. Thus, even among triathletes, the relative intensity during an OD triathlon could also differ, depending on the exercise duration and/or performance level.
Therefore, the aim of this study was (i) to estimate, using competition HR and workload data, the relative exercise intensity in all three disciplines during a nondraft legal OD race in well-trained, age-group triathletes, and (ii) to compare the estimated intensity of fast and slow triathletes. We hypothesized that triathletes would maintain a high level of intensity throughout the race, and that faster triathletes could perform the race at higher relative intensity than slower triathletes.
2. Materials and Methods
2.1. Study Design
This study was conducted in two phases consisting of laboratory tests and during-race monitoring. The laboratory tests included an incremental swimming test, an incremental cycling test, and an incremental treadmill running test, which were performed randomly and separated by a minimum of 2 days and maximum of 20 days. Competition measurements of each participant were conducted during the OD race with a nondraft legal cycling leg and were timed as close as possible to all laboratory tests (mean ± standard deviation, 45 ± 26 days).
2.2. Subjects
The study cohort consisted of 17 well-trained, age-group male triathletes (Table 1) who met the following inclusion criteria: (1) regular training of at least five sessions per week for a triathlon competition; (2) not suffering from any present injury, which could have possibly hampered their performance, and nonsmokers; and (3) a minimum of one year of experience competing in triathlons. The median time for completion of the OD race based on pooled data was 2:16:13 h:min:s. The subjects were split into two groups according to the total time of the OD race. Participants with times not less than 2:16:13 were assigned to the faster group and those with times greater than 2:16:13 was assigned to the slower group. The study protocol was approved by the Ethics Committee of the University of Tsukuba (project identification code: Tai 30–24) and conducted in accordance with the ethical principles for medical research involving human subjects as described in the Declaration of Helsinki. All subjects provided written informed consents to participate in the study.
2.3. Laboratory Tests
The subjects were instructed to refrain from consuming caffeine and alcohol and from heavy training on the day before the tests, as well as to consume a light meal at least 3 h before each laboratory test. During the 3-h period preceding the tests, only ad libitum water ingestion was permitted. During all laboratory tests, HR was collected via a HR monitor (HRM-Tri; Garmin Ltd., Olathe, KS, USA) across the chest with sampling at 1 Hz. Body mass was measured with a body fat monitor scale (TBF-102; Tanita, Tokyo, Japan) before the cycling and running tests.
2.3.1. Incremental Swimming Test
The subjects completed a two-part test consisting of a submaximal intermittent test and a maximal incremental test that were performed in a swimming flume at a constant water temperature of 25.8 ± 0.8 °C. The subjects wore their own technical trisuits, standard swimming caps, and goggles throughout the incremental swimming test. The submaximal intermittent test was performed first. The swimming speed of the submaximal intermittent test was individualized according to the average swimming speed of the most recent 1500-m time trial (S1500) of each triathlete. The speed for the initial stage was 70% of S1500 and increased by 5% at each subsequent stage for a total five to seven stages, each consisting of 4 min of exercise and 2 min of rest. Before the test and after each stage, blood samples were obtained from the fingertip and the BLa was measured with a lactate analyzer (Lactate Pro 2; Arkray, Inc., Kyoto, Japan). The submaximal intermittent test was concluded when the BLa exceeded 4.0 mmol·L−1 or the rate of perceived exertion was ≥15. Following a 5-min recovery period after the submaximal intermittent test, the maximal incremental test was performed. The initial speed was set at that of the next to last stage of the submaximal intermittent test and then was increased by 0.03 m·s−1 every minute until volitional exhaustion, which was defined as the point at which the subject could no longer swim at the required speed.
2.3.2. Incremental Cycling Test
The maximal incremental test was performed on an electronically braked, indoor cycle trainer (CompuTrainer Pro; RacerMate Inc., Seattle, WA, USA), which allowed the subjects to use their own bicycles, at a constant room temperature of 25.2 ± 1.2 °C, relative humidity of 40.4% ± 8.3%, and barometric pressure of 755.4 ± 3.5 mmHg with an electric fan ensuring air circulation around the participant. The maximal incremental test was performed following a 5-min warm-up period (100 W) and a 5-min recovery period. The initial workload was set at 100 W and then increased by 20 W·min−1 and cadence was maintained at 80 or 90 rpm in accordance with race cadence of the individual until volitional exhaustion, which was defined as <75 or 85 rpm (i.e., a decrease of 5 rpm as compared with the cadence of the sustained during test) continuously for 5 s. To determine the PO during the test, which was used for analysis, the bicycles were fitted with calibrated power measuring pedals (Garmin Ltd.) at a sampling rate of 1 Hz.
2.3.3. Incremental Treadmill Running Test
The maximal incremental test was performed on a motorized treadmill (ORK-7000; Ohtake-Root Kogyo Co., Ltd., Iwate, Japan) at a grade of 1% to accurately reflect the energetic cost of outdoor running [33] following a 5-min warm-up period (9.0 km·h−1) and a 5-min recovery period. The experimental environmental conditions were similar to those of the incremental cycling test. The initial speed was set at 9.0 km·h−1 and then increased by 0.6 km·h−1 every minute until volitional exhaustion, which was defined as the inability of the subject to continue running at the required speed. The treadmill belt speed, which was used for analysis, was measured with a hand-held tachometer (EE-1B; Nidec-Shimpo Corporation, Kyoto, Japan).
2.4. Gas Analysis
During the incremental cycling and treadmill running tests, O2, carbon dioxide production (CO2), minute ventilation (E), ventilatory equivalent of oxygen (E/O2) and carbon dioxide (E/CO2), end-tidal partial pressure of oxygen (PETO2) and carbon dioxide (PETCO2), and respiratory exchange ratio (RER) were measured on a breath-by-breath basis using a computerized standard open circuit technique with a metabolic gas analyzer (AE-310s; Minato Medical Science Co., Ltd., Osaka, Japan).
Before both tests, the metabolic system was calibrated using known gas concentrations and a 2-L syringe in accordance with the manufacturer’s instructions. Maximal O2 (O2 max), which was defined as the highest 1-min rolling average (20-s × 3), was attained when at least two of the following four criteria were met: (1) a leveling-off of O2 despite an increase in PO or running speed, (2) peak RER ≥ 1.10, (3) peak HR ≥ 90% of age-predicted values, and (4) perceived exertion score at the end of the tests of ≥19. The gross efficiency during cycling was calculated as described in a previous study [34]. The running economy was expressed as the O2 cost (ml·kg−1·km−1) and was calculated based on the last 1-min O2 while running for 5 min (9.0 km·h−1) [35].
2.5. Determination of Aerobic and Anaerobic Thresholds, and Maximal Workload
The predicted swimming speed and HR at both the lactate threshold (LT) and the onset of blood lactate accumulation (OBLA) of 4 mmol·L−1 were calculated using validated software (Lactate-E [36], version 2.0, National University of Galway, Galway, Ireland) based on the BLa, swimming speed, and HR collected during the incremental swimming test.
VT during cycling and running was determined using the criteria of an increase in both E/O2 and PETO2 with no increase in E/CO2, whereas the respiratory compensation point (RCP) was determined using the criteria of an increase in both E/O2 and E/CO2, and a decrease in PETCO2 [37,38]. Two independent observers determined the VT and RCP for cycling and running. Any disagreement was mediated by the opinion of a third investigator [39].
Based on previous studies [40,41], the LT obtained from the swimming test and the VT obtained from the cycling and the treadmill running tests were defined as the “aerobic threshold” (AeT), while the OBLA of 4 mmol·L−1 obtained from the swimming test and the RCP obtained from cycling and running test were defined as the “anaerobic threshold” (AnT).
Maximal swimming speed (SSmax) and maximal running speed (RSmax) were determined by the last stage of the maximal incremental test. When the subject was unable to complete 1 min at the current workload, the maximal workload was determined by adding a fraction of the final workload to the workload of the immediately preceding 1 min [42]. Maximal PO (POmax) was determined as the highest 20-s rolling average attained during the incremental cycling test. These three variables were collectively referred to as the “maximal workload”.
2.6. Competition Measurements
The OD races were nonunified between each individual because of the difficulty of securing a sufficient sample size among the participants of the same race. The distance of each OD race was the same and consisted of swimming for 1.5 km, cycling for 40 km, and running for 10 km. During all races, the subjects wore a HR monitor (HRM-Tri) across the chest with sampling at 1 Hz. Also, the subjects wore waterproofed portable global navigation satellite system (GNSS) units (ForeAthlete 920XT; Garmin Ltd., Olathe, KS, USA) on the wrist with sampling at 1 Hz to determine the speed throughout the race. To determine cycling PO during the race, the bicycles were fitted with calibrated power measuring pedals (Garmin Ltd.) set at a sampling rate of 1 Hz. Following completion of each race, performance times were obtained from official websites of the event. Air temperature, relative humidity, wind speed, and barometric pressure were obtained from the local meteorological agency within 1 h of the start of the race. Water temperature was measured with a water temperature gauge (CTH-1365; Custom Corporation, Tokyo, Japan) before the start of the race. Cumulated positive elevation during cycling and running was obtained from the GNSS units. The elevation to distance ratio was calculated by dividing the cumulated positive elevation by 40 (km, for cycling) or 10 (km, for running).
2.7. Exercise Intensity Zone Settings
Based on the HR measurements, the total time of each leg of the OD race was divided into three intensity zones based on the results of the laboratory tests in the corresponding exercise mode. The percentage of time spent in each zone was calculated as follows: less than AeT (HRzone1), between AeT and AnT (HRzone2), more than AnT (HRzone3) [43,44]. Similar analysis of the PO measurements in the cycling leg [22,45] was also conducted: below 10% of POmax (POzone1), between 10% of POmax and AeT (POzone2), between AeT and AnT (POzone3), between AnT and POmax (POzone4), and above POmax (POzone5). In addition, using the average running speed (RS) at each 100 m in the running leg, an analysis similar to that for PO distribution was conducted based on the incremental running test results, rather than the incremental cycling test results.
2.8. Data Analysis
HR, PO, and speed obtained from the GNSS units were recorded with the GNSS units (Garmin Ltd.). The obtained data were exported to third party, open-source analysis software (Golden Cheetah, version 3.4, http://www.goldencheetah.org/), and further analysis was performed using Microsoft Excel software (version 2019, Microsoft Corporation, Redmond, WA, USA). Expired gas data were averaged across 20-s intervals using internal gas analysis software (version 3STG, AT Windows; Minato Medical Science Co., Ltd., Osaka, Japan), and exported to a.csv file. Further analysis was performed using Microsoft Excel 2019 software.
2.9. Statistical Analysis
All results are presented as the mean ± standard deviation unless otherwise indicated. Normal distribution of the data was tested using the Kolmogorov–Smirnov test. The nonparametric Mann–Whitney U test was used to detect statistically significant differences between groups. The effect size (ES) was evaluated as r (with 0.1 considered to be a small, 0.3 a medium, and 0.5 a large effect [46]). All statistical analyses were conducted using IBM SPSS Statistics version 26 (IBM Japan, Tokyo, Japan). A probability (p) value of ≤0.05 was considered statistically significant.
3. Results
The competition measurement data of the OD race were corrected from 10 races conducted in 2018 or 2019. The environmental conditions during the OD races are shown in Table 2. There were no significant differences observed between the two groups (all, p ≥ 0.16; ES = 0.04–0.35). During the swimming leg of the race, most of the subjects wore their own wetsuits, with the exception one subject in each group who exercised in nonwetsuits.
3.1. Laboratory Tests
The results of the three incremental tests of each exercise mode are summarized in Table 3. The faster group (n = 9) was superior to the slower group (n = 8) in speed at AeT and AnT and SSmax for the swimming test (p < 0.01, respectively, ES = 0.68–0.76), and PO at AeT (p = 0.04, ES = 0.51), POmax (p = 0.03, ES = 0.53), and O2 max (L·min−1 and ml·kg−1·min−1, p = 0.01 and < 0.01, respectively, ES = 0.61, 0.72, respectively) for the cycling test. However, there were no significant differences in the treadmill running test results between groups (all, p ≥ 0.14; ES = 0.00–0.36).
3.2. OD Triathlon Performance
The OD race performance times are shown in Table 1. The mean total performance time of the OD race was 2:19:50 ± 0:09:38 (h:min:s). The faster group had a shorter time than the slower group (2:12:24 ± 0:02:54 vs. 2:28:12 ± 0:07:11, p < 0.01, ES = 0.84). The time of all three legs was shorter for the faster group than the slower group (all, p ≤ 0.02; ES = 0.58–0.82).
3.3. Exercise Intensity of Each Leg
The mean exercise intensity of each leg of the OD race is shown in Table 4. The overall mean absolute workload was 1.03 ± 0.18 m·s−1 for swimming, 209.6 ± 24.3 W for cycling, and 14.1 ± 1.4 km·h−1 for running. The absolute workload was greater in the faster group than the slower group for swimming (1.14 ± 0.18 vs. 0.92 ± 0.09 m·s−1, respectively, p < 0.01, ES = 0.68) and running (14.9 ± 0.8 vs. 13.2 ± 1.4 km·h−1, respectively, p = 0.02, ES = 0.58). The absolute workload for cycling was also greater in the faster group than the slower group, although the difference was not significant (p = 0.06, ES = 0.47). The mean relative HR of all participants was 89.8% ± 3.7% of HRmax for swimming, 91.1% ± 4.4% of HRmax for cycling, and 90.7% ± 5.1% of HRmax for running. There were no differences in mean relative HR between groups for swimming and cycling (p = 0.25 and 0.07, respectively, ES = 0.28, 0.44, respectively). However, the relative HR for running of the faster group was greater than that of the slower group (p < 0.01, ES = 0.65). The relative workloads and absolute HR values of each leg are shown in Table 4.
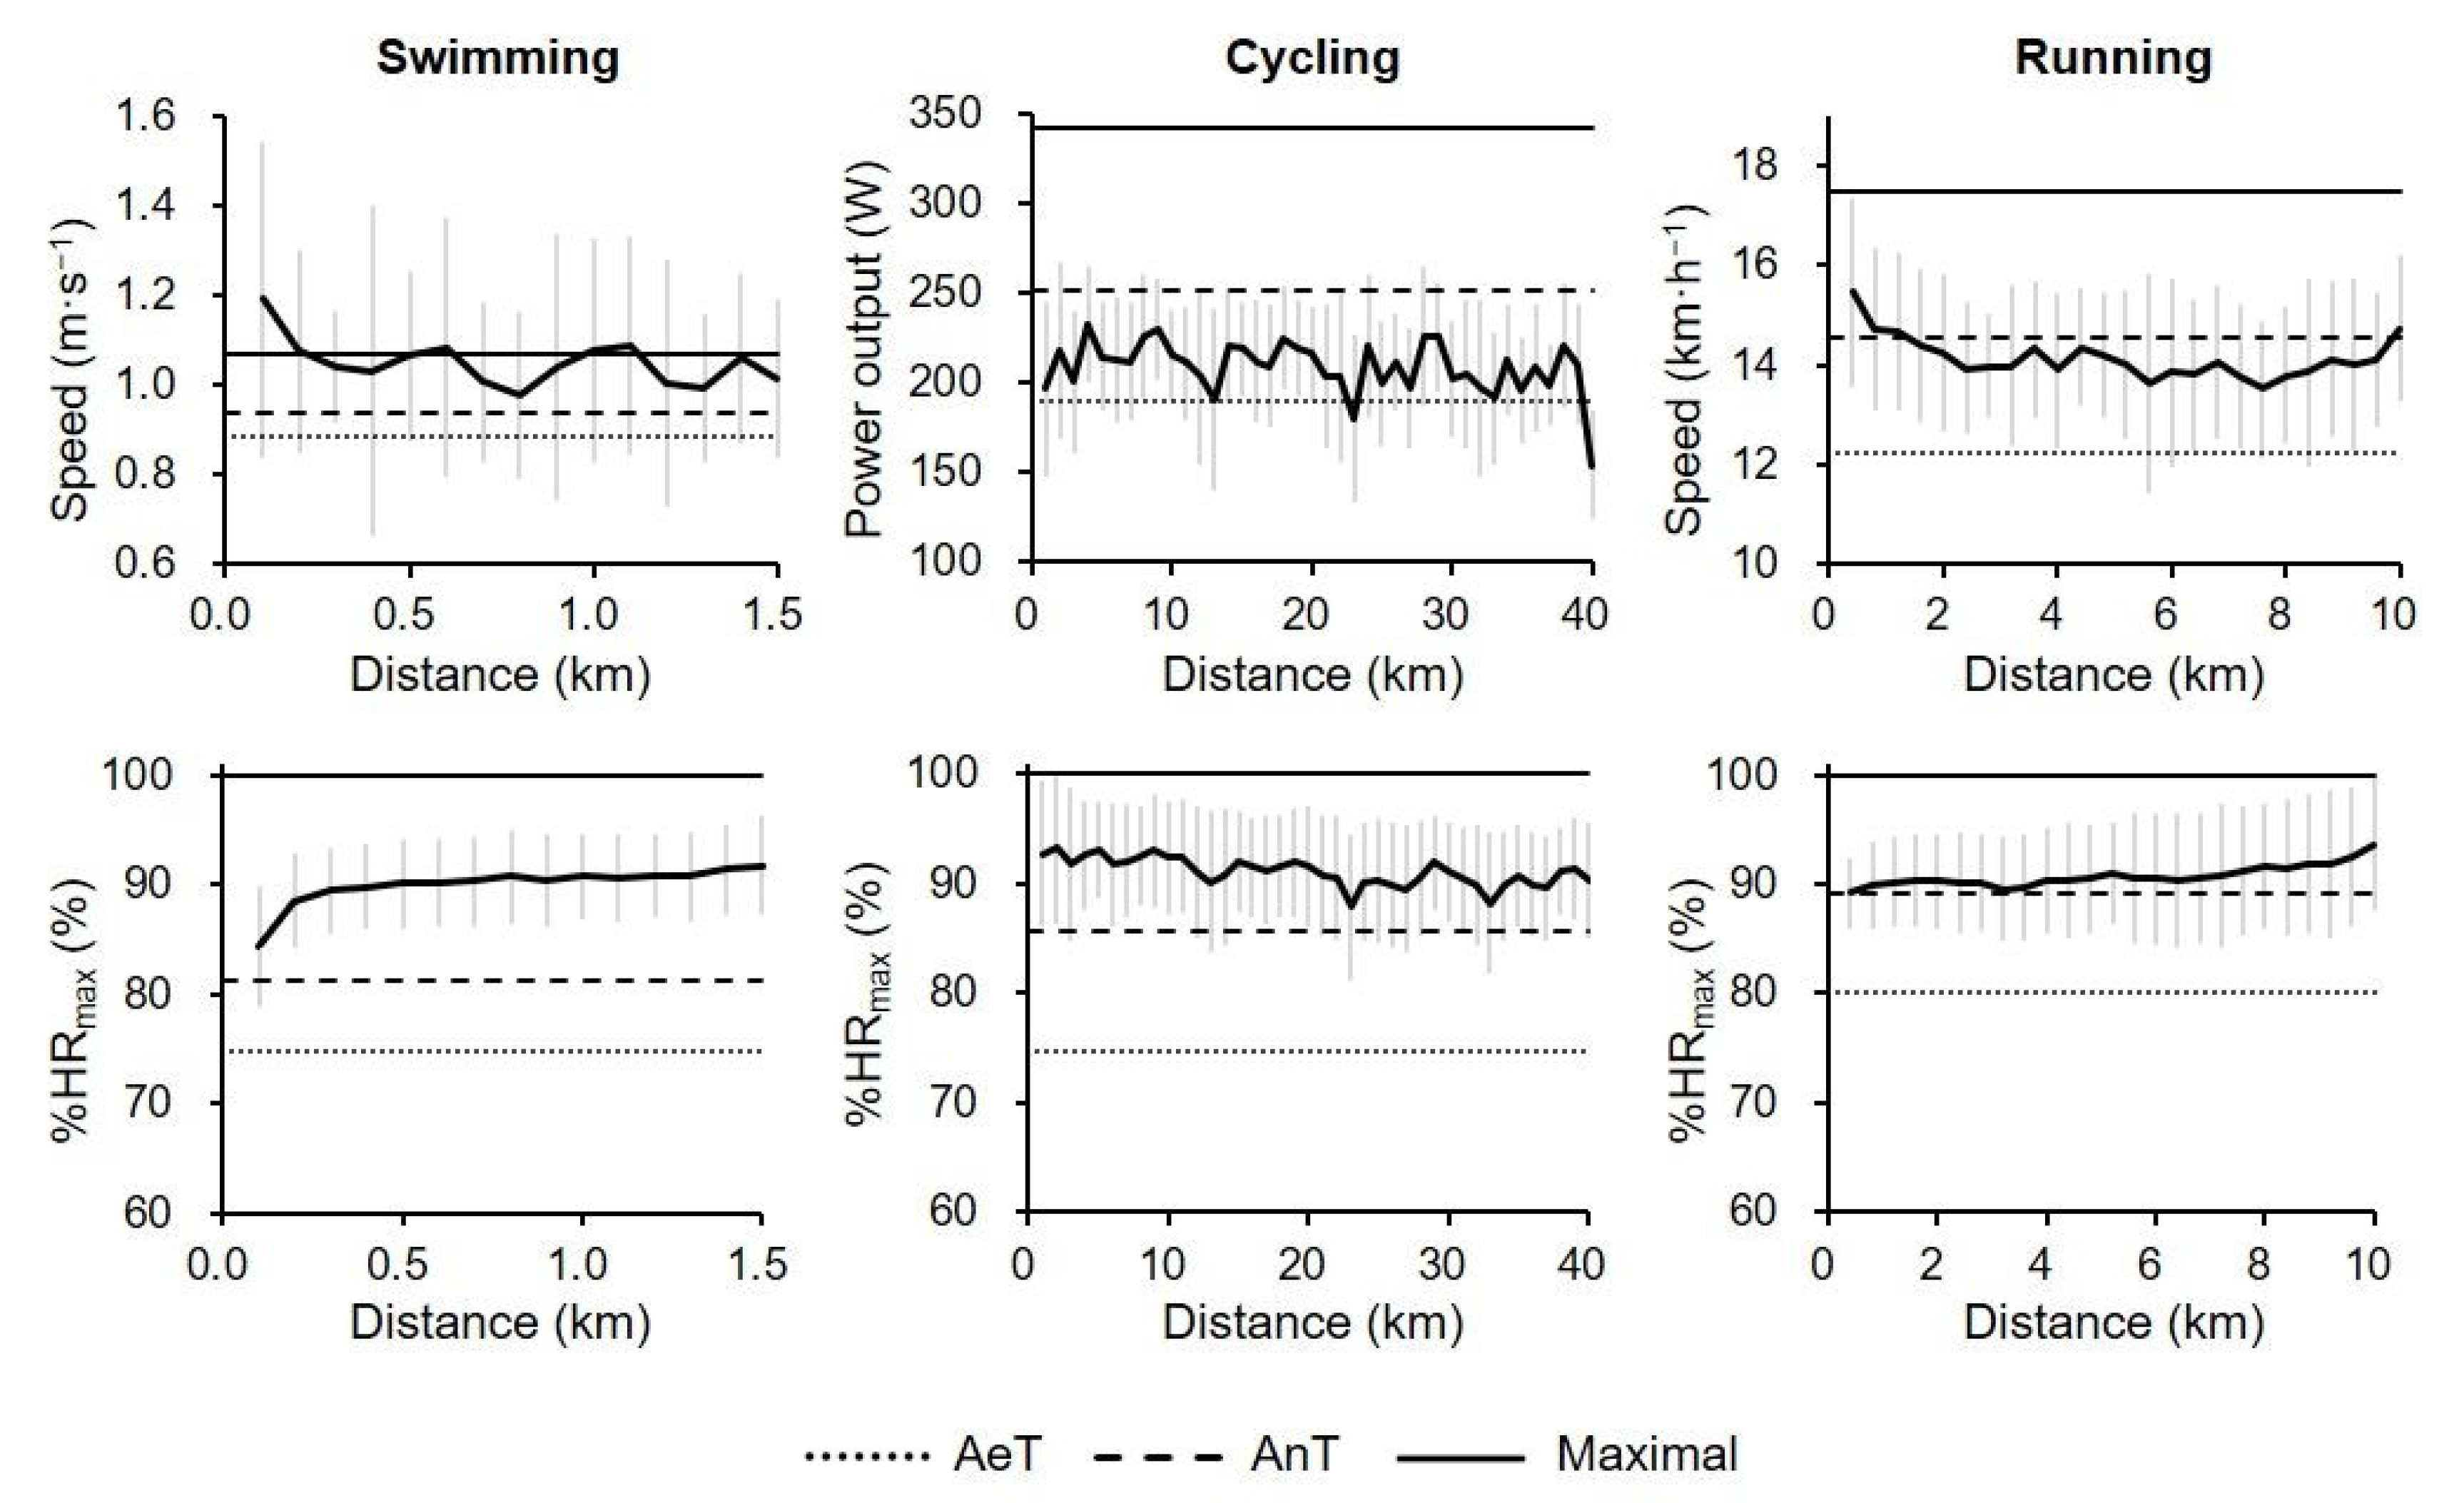
The absolute workloads and relative HR values (i.e., % of HRmax) of each leg during the OD race of all participants are shown in Figure 1. The average AeT, AnT, and maximal values of each laboratory test of each leg are shown for visual reference. The mean workload value shifted above workload at AnT in swimming, between workload at AeT and AnT in cycling, and slightly below workload at AnT, with the exception of the beginning and end of the leg, in running. The mean relative HR value remained above HR at AnT throughout the race.
3.4. Exercise Intensity Distribution during the Race
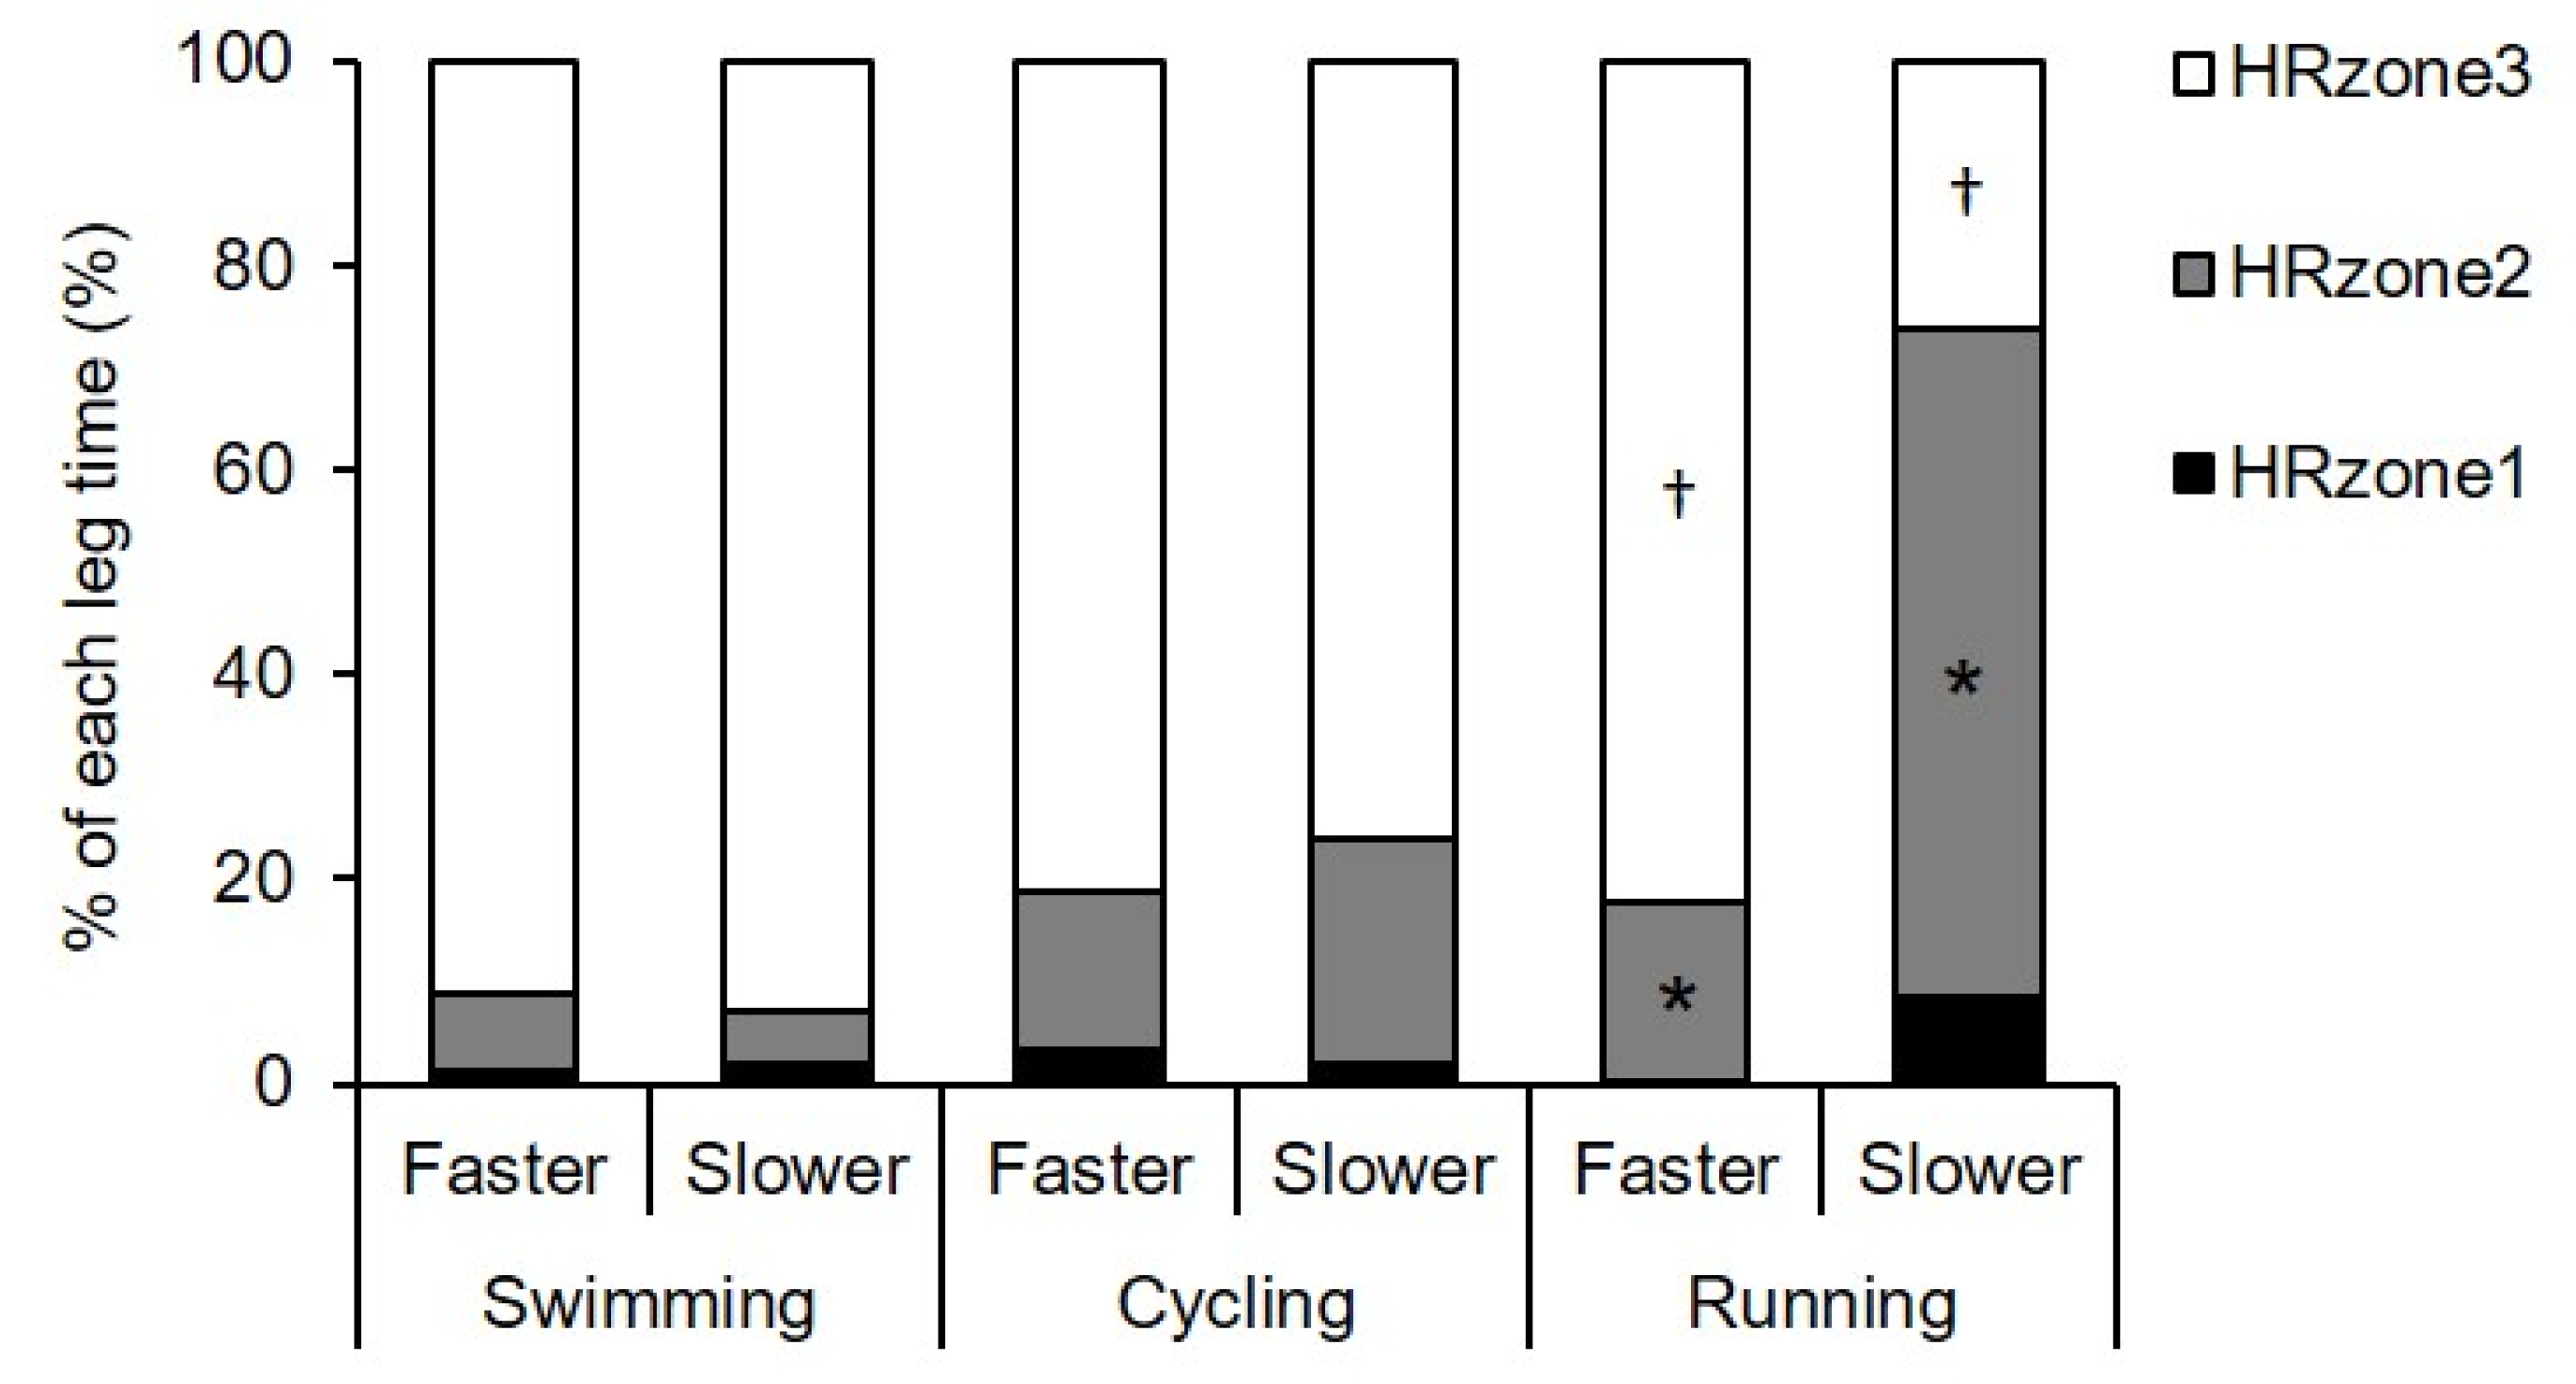
During the swimming, cycling, and running legs of the OD race, the HR distribution of all participants was 1.5% ± 2.3%, 2.8% ± 8.0%, and 4.1% ± 10.6% in HRzone1, 6.6% ± 15.0%, 18.4% ± 24.0%, and 39.9% ± 38.5% in HRzone2, and 91.9% ± 16.3%, 78.8% ± 28.1%, and 56.0% ± 42.1% in HRzone3, respectively. There were no significant differences in HR distribution between groups in the swimming and cycling legs (all, p ≥ 0.20; ES = 0.14–0.32; Figure 2). In running, however, the slower group had a higher percentage in HRzone2 (65.4% ± 35.0% vs. 17.3% ± 25.9%, p = 0.02, ES = 0.58) and a lower percentage in HRzone3 (26.2% ± 36.4% vs. 82.4% ± 26.6%, p = 0.01, ES = 0.60) as compared to the faster group (Figure 2).
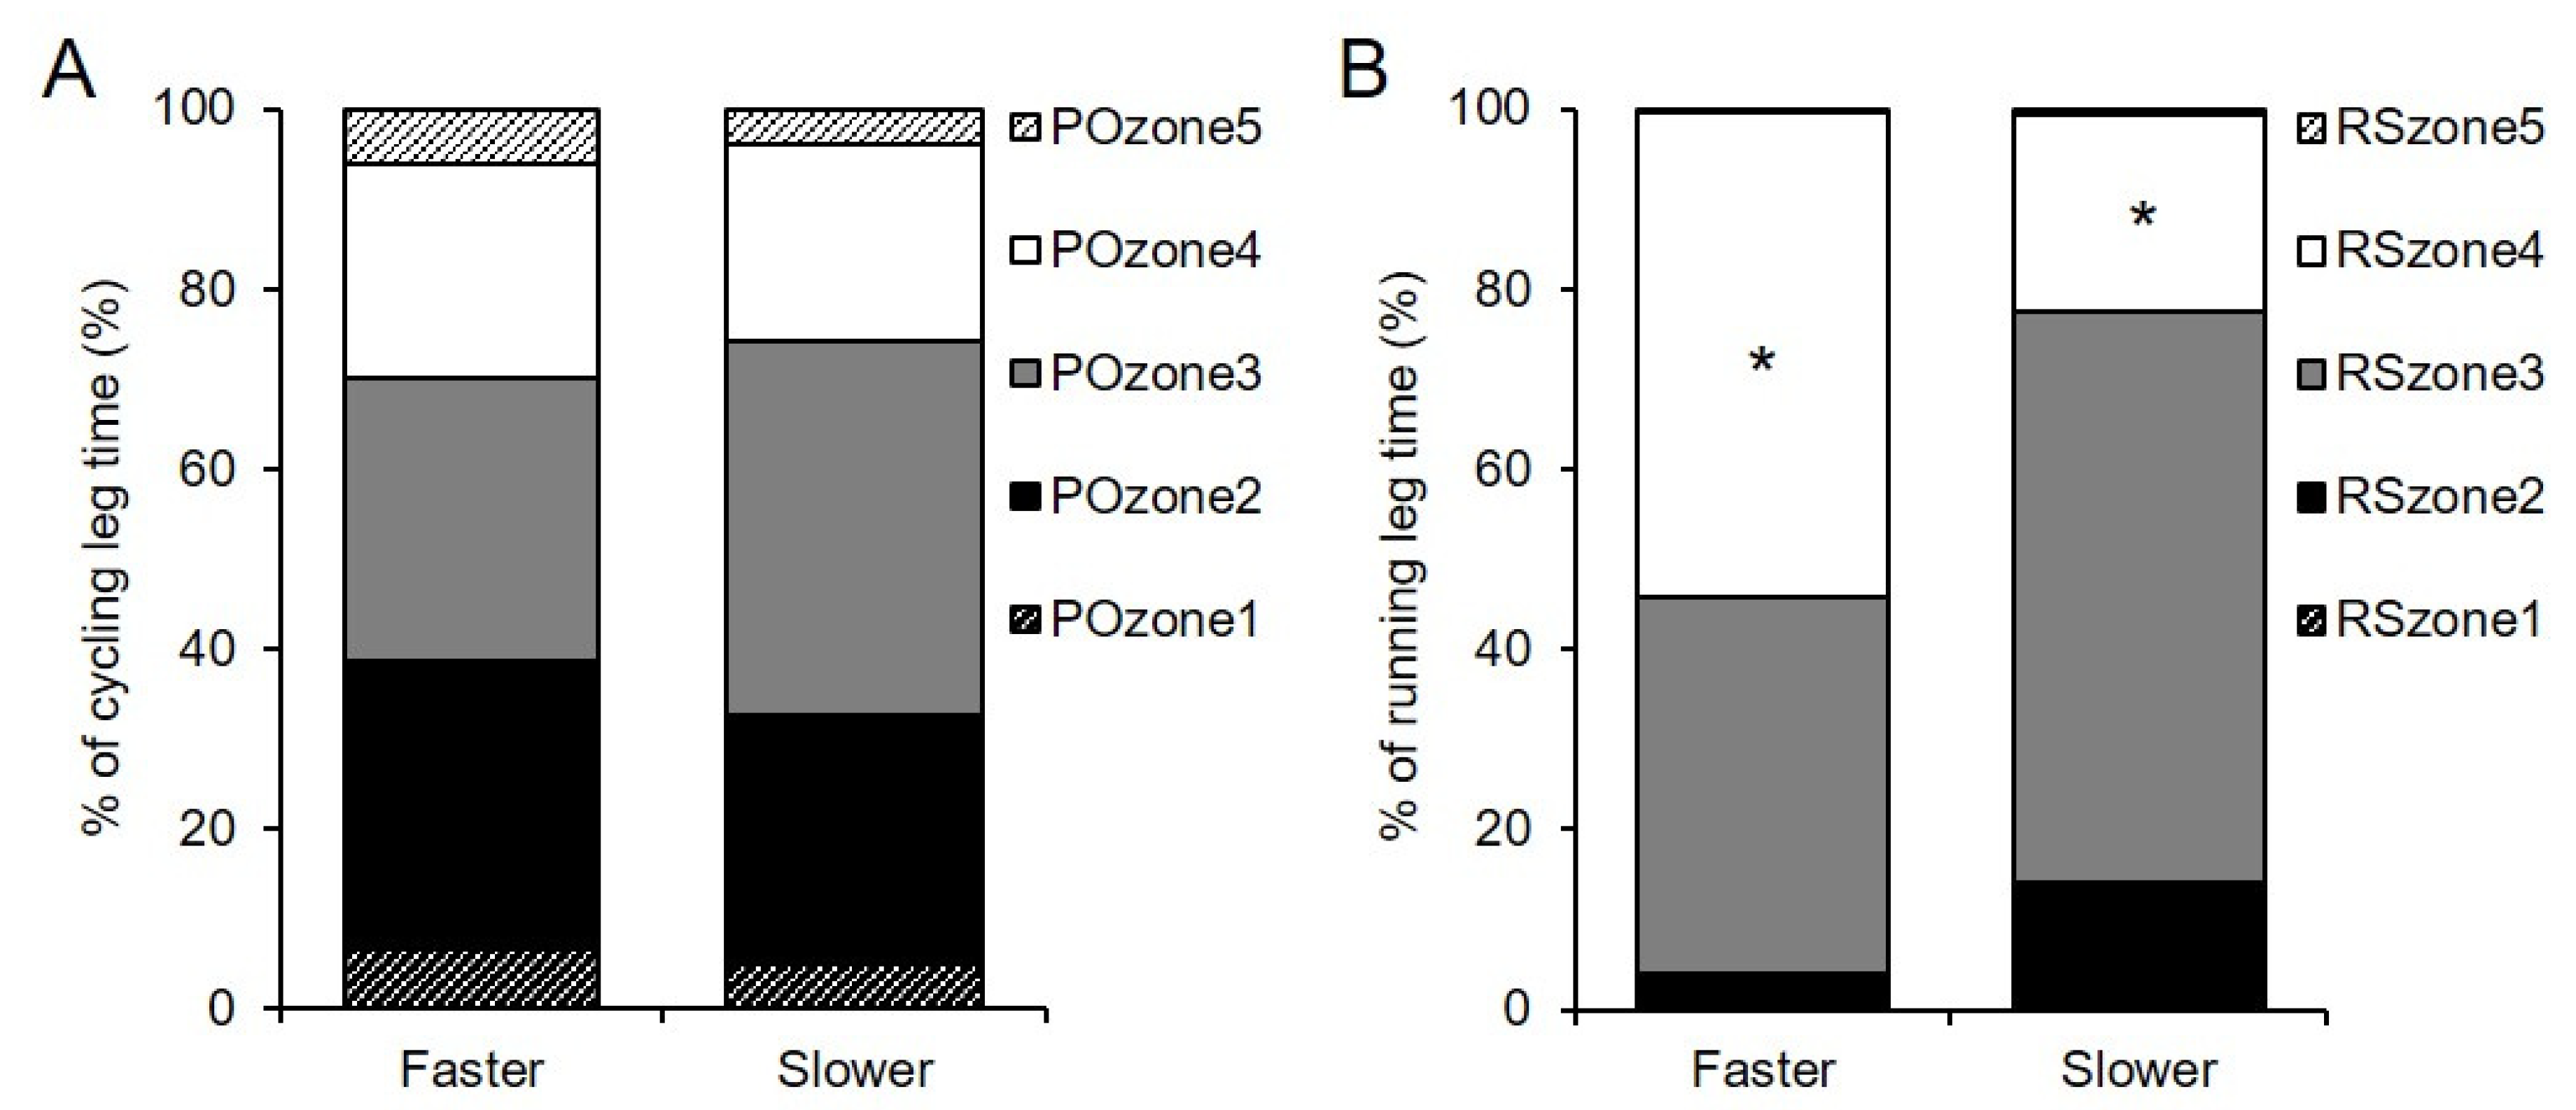
The PO distribution of all participants was 5.8% ± 3.2% in POzone1, 30.0% ± 18.1% in POzone2, 36.3% ± 17.2% in POzone3, 22.8% ± 11.1% in POzone4, and 5.1% ± 2.8% in POzone5, respectively. There were no significant differences in PO distribution between the two groups (all, p ≥ 0.14; ES = 0.09–0.35; Figure 3A). The RS distribution of all participants was 0.0% ± 0.0% in RSzone1, 8.7% ± 12.5% in RSzone2, 52.1% ± 28.9% in RSzone3, 38.8% ± 31.0% in RSzone4, and 0.5% ± 0.7% in RSzone5, respectively. As compared to the slower group, the faster group had a higher percentage only in RSzone4 (53.8% ± 31.7% vs. 21.9% ± 20.6%, p = 0.04, ES = 0.50) (Figure 3B).
4. Discussion
To the best of our knowledge, this study is the first to evaluate the relative exercise intensity of well-trained, age-group male triathletes at two performance levels according to the principle of test specificity in all disciplines during a nondraft legal OD race. The main findings of this study were as follows: (1) Well-trained, age-group male triathletes who completed the nondraft legal OD at a mean time (h:min:s) of 2:19:50 ± 0:09:38 (range, 2:07:16–2:41:07) demonstrated a high percentage of HRmax (87% of HRmax~) throughout all three legs; (2) Faster triathletes had shorter times in all three legs with higher absolute workloads, but differences in relative intensity and intensity distribution were observed only in the running leg, as faster triathletes sustained higher intensity than slower triathletes.
4.1. Laboratory Tests and OD Triathlon Performance
The total performance times of the OD race in this study were close to those obtained in other studies with similar well-trained triathletes [47], but shorter than a study of recreational triathletes [48]. It is well known that successful endurance athletes are characterized by high levels of maximal (O2 max and maximal workload) and submaximal (aerobic/anaerobic threshold and economy/efficiency) measures [49,50]. In the present study, the times to complete the swimming (−20.8%) and cycling (−4.9%) legs in an actual OD race were significantly shorter for the faster group in association with superior maximal and submaximal measures in the incremental swimming and cycling tests, as compared with the slower group. However, the time to complete the running leg was significantly shorter for the faster group (−13.2%), while there was no significant difference in any parameters in the incremental running test between the groups. These results suggest that the differences in swimming and cycling performance between the two groups were highly dependent on aerobic capacities, as assessed by specific incremental tests for each of the exercise modes. However, the difference in running performance between the two groups may have been due to factors other than aerobic capacities, as assessed by the incremental treadmill running test in this study. A review article [7] pointed out that the relationship between aerobic capacity measured separately in each leg and triathlon performance was not as high as in the respective single sports. A possible explanation for this finding may be that prior exercise affected the strength of the correlation between physiological variables specific to one discipline and performance in it under conditions characteristic of a triathlon competition [7,51].
4.2. Exercise Intensity during the Race
In the swimming leg, the mean relative intensities and the distribution of HR within the three intensity zones were similar between groups (Figure 2, Table 4). The mean relative HR of all participants was 89.8% of HRmax, which is comparable to previous reports of elite triathletes (91%–92% of HRmax) [22]. Surprisingly, the same level of relative HR (91.5% of HRmax) was reported in the Ironman swimming leg (3.8 km, ~1 h) [52]. Although there is an obvious tendency toward reduced relative intensity with relation to increased race duration [20,28], this relationship may not necessarily be linear in triathlon swimming. Wu et al. [24] compared absolute exercise intensities across the three triathlon races (sprint, Olympic, and half-Ironman distance) performed by the same triathletes and found no differences in mean speed across the races despite differences in swimming duration (range, approximately 0:11:00–0:30:00 h:min:s). Therefore, relative intensity is considered comparable across the three triathlon races. Taken together, there might be little difference in relative intensities during the swimming leg at different performance levels and different race durations (~1 h). However, it is unclear whether about 90% of HRmax is the upper limit of sustainable intensity during triathlon swimming or if intensity is controlled based on anticipation of the longer duration of exercise following the swimming leg.
A visual inspection of the relative HR profile (Figure 1) suggests that the HR remained above HR at AnT throughout the swimming leg, as most of the leg was performed in HRzone3 (more than AnT), and the time spent in HRzone1 (less than AeT) was negligible (Figure 2), because HRzone1 was held only during the initial phase of the start of the race, when the triathletes began accelerating from the starting line. This is in agreement with a previous study demonstrating the HR distribution during 10-km cross-country skiing [19], during which the exercise duration (mean race time, 0:25:47 h:min:s) was comparable to the swimming leg in the present study (mean swimming time, 0:26:28 h:min:s).
Despite the stability of relative HR, large fluctuations above the AnT line were observed in the relative workload (Figure 1), which could be due to the influence of environmental factors. In open water swimming, the water conditions and tides can considerably affect absolute swimming speed and, therefore, relative swimming speed, even if the same relative HR is maintained.
In the cycling leg, all of the indicators of relative intensity were similar between groups (Figure 2 and Figure 3A, and Table 4). The mean relative HR of all participants was 91.1% of HRmax. This value was nearly equal to those reported for elite triathletes during draft legal races (90%–92% of HRmax) [21,22] and clearly higher than those reported for ironman triathletes (83% of peak HR) [26]. This value was slightly lower than the those reported for nonelite triathletes with comparable O2 max as the subjects in the present study (60.6 vs. 58.7 mL·kg−1·min−1, respectively) during nondraft legal short-course races (94.1% HRmax) [25], which may be partly due to some difference in the race distance of the cycling leg accompanied by differences in exercise duration between studies; i.e., the race distance and exercise duration were 30 km and 50.09 min in the previous study [25] and 40 km and 70.55 min in this study.
The mean relative workload in the cycling leg of all participants was 61.3% of POmax, which was nearly equal to that of elite triathletes during the draft legal race (60%–63% of POmax) [21,22]. However, some differences in the PO distribution evaluated with the same methodology were observed between the draft legal race in a previous study [22] and the nondraft legal race in the present study. In the former study [22], more time was spent in POzone1 (below 10% of POmax) and POzone5 (above POmax), with a comparatively shorter time in POzone3 (between the PO at AeT and AnT) and POzone4 (between the PO at AnT and POmax) in the present study. This discrepancy may be related to drafting, group riding dynamics, and the course profile. Elite triathletes often compete in criterium or circuit courses with frequent technical corners requiring repeated accelerations and decelerations with rotating the position within the same pack. Meanwhile, cycling during nondraft legal events is more similar to that of an individual time trial, as reflected by the stability of PO during flat cycling [53]. Therefore, the difference in the PO distribution may be related to the application rule of drafting and/or the course profile, even though the mean relative PO was similar in both races.
As shown by the relative HR profile in Figure 1, the HR remained above HR at AnT throughout the cycling leg. However, the PO profile (Figure 1) suggests that the PO shifted between PO at AeT and AnT throughout the leg. This discordance might be suggestive of the residual effect of prior swimming and the subsequent physiological responses that differ from performing an isolated exercise, especially in the initial phase [54]. Another explanation might be cardiovascular drift, which is primarily characterized by a progressive decrease in stroke volume and a progressive increase in HR to maintain cardiac output during prolonged exercise [55]. The hyperthermia and dehydration that occur concomitantly with long-duration exercise influence the magnitude of cardiovascular drift in a graded fashion [56]. Glycogen depletion caused by prolonged exercise also affects the workload–HR relationship [57]. Therefore, HR during an OD race may overestimate the PO [58]. Even in the running leg, the relative HR level was higher than the relative workload level.
In the running leg, there were clear differences in relative intensity between the faster and slower groups. The mean relative HR was definitely higher in the faster group than the slower group (94.0% vs. 87.0% of HRmax) and slightly higher than the recreational triathletes (92.3% HRmax) [25], but on a comparable level for elite triathletes (93%–94% of HRmax) [22]. Additionally, the faster group spent more time in the high-intensity zones (i.e., larger values of HRzone3 and RSzone4) as compared to the slower group. The relative workload was also higher in the faster group than the slower group (83.4% vs. 77.2% of RSmax). Therefore, our hypothesis is supported only in the running leg.
It is interesting to note that clear differences in relative intensity between the two groups were observed only in the running leg in this study. In terms of the pacing strategy, it has been demonstrated that the slower, less experienced athletes tended to pace at too high an intensity at the beginning of the race, leading to a continuous decrease in exercise intensity for the remaining duration [32]. However, in the swimming and cycling legs in this study, there were no differences in any indicator of relative intensity or triathlon experience between the two groups. Thus, the effect of the height and distribution of relative intensity until the completion of the cycling leg may have had only a minor impact on the difference in relative intensity during the running leg between the two groups. On the other hand, before the start of the running leg, the slower group was exposed a longer duration of relative intensity (~10 min) at a level comparable to that of the faster group. This difference might have induced greater physiological and metabolic disruptions in the slower group, resulting in premature fatigue and impaired workload in the running leg.
Millet and Vleck [7] stated that the first transition (i.e., swim–cycle transition) is regarded as having a negligible effect on overall performance during the nondraft legal OD race. Meanwhile, a number of studies reported the effects of prior exercise on subsequent running [7,8,59,60,61] and the cycle–run transition is traditionally considered to be more important on performance during an OD race [7,8]. Prior cycling induces physiological/cardiorespiratory and biomechanical changes during subsequent running [8]. Several studies have reported that such changes (usually negative effects) might be related to the performance level of triathletes [62,63,64,65,66]. For example, Boussana et al. [62] observed significantly higher ventilatory responses and significantly greater decreases in respiratory muscle strength and endurance in competition triathletes than in the elite group in running following cycling performed at similar relative intensities, despite similar O2 max and VT [62]. Therefore, in this study, the negative effects of prior exercise on physiological and biomechanical responses during subsequent running might have been larger in the slower group than the faster group, which could be related to the difference in relative intensity between the groups during the running leg. Further studies are required to specifically analyze the mechanisms underlying the difference in relative intensity induced by prior exercise.
From the point of view of exercise intensity throughout the OD race, relative HR remained above HR at AnT until the end of the cycling leg and remained at or above HR at AnT in the running leg in both groups. These values were higher than those previously reported for ultra-endurance events (race durations >8 h) [26,27] and a 42-km marathon (~2.5–5 h), during which intensity was approximated as AeT [30]. A possible explanation for the higher intensity during the OD race as compared to marathon―both with similar estimated energy expenditures (2000–2546 kcal) [67]―may lie in the degree of muscle fatigue derived from peripheral factors. Although the causes of muscle fatigue are complex and not completely understood, exercise-induced muscle damage is a primary cause of muscle fatigue during endurance sports [68]. While no direct comparison is available, expression levels of markers of muscle damage, such as creatine kinase and lactate dehydrogenase, are higher after marathon running [68] than after an OD triathlon [10]. Additionally, a reduction in the height of countermovement jump, which is also higher after a marathon [10,68], suggesting that exercise-induced fatigue of lower extremity muscles is greater while competing in a marathon as compared to an OD triathlon. Swimming and cycling are considered to produce minor damage to the involved muscles, while running―a weight-bearing exercise that includes concentric and eccentric contractions of the leg muscles―may produce more pronounced muscle damage while competing in a 42-km marathon. Another possible explanation could be related to the degree of glycogen depletion, as proposed in a previous report [69]. Glycogen depletion is also related to muscle fatigue during prolonged exercise [70]. Differences in muscle activities among the three exercise modes might be related to higher glycogen reserves in active muscles in each discipline of a triathlon as compared to strictly running in a marathon. However, further investigations are needed to elucidate the specific physiological responses during a triathlon.
4.3. Limitations
There were several methodological limitations to this study that should be acknowledged. First, the competition measurements were carried out in several separate OD races. This disparity may have added some bias to the analysis of the present study. However, there were no significant differences in environmental conditions or course profiles between the two groups (Table 2), and thus, the effects of these disparities were considered minor. Moreover, differences in the swimming conditions between the laboratory tests (i.e., flume swimming) and competition measurements (i.e., open water swimming) could affect the analysis of this study. Also, the air temperature in the laboratory tests (around 25 °C) was higher than that in the OD races (around 21.6 °C). Cardiovascular drift can occur in temperate conditions and greater effects are seen in high heat conditions [71], so the difference mentioned above could impact the O2 or BLa vs. HR relationships. However, an electric fan provided airflow, and overall room ventilation was maintained throughout each test, which minimizes the possibility of a cardiovascular drift. Furthermore, each incremental test was performed at 45 ± 26 days from the competition measurements of the OD race in this study, while most previous similar studies performed incremental tests within 2 to 4 weeks before the OD race [21,22,25,72]. The individual training programs and different season calendars among our subjects made it difficult to arrive at a unified schedule in this study. Although the maximal and submaximal measures of triathletes are reportedly stable throughout the pre-competition to competitive period [73], future research examining exercise intensity during OD triathlon should attempt to use unified race conditions and schedules.
5. Conclusions
Mean exercise intensity during a nondraft legal OD triathlon was above 87% of HRmax derived from each exercise mode throughout all three legs in well-trained, age-group male triathletes. The majority of the swimming and cycling legs was spent at an intensity more than HR at AnT, while the exercise intensity during the running leg differed among individuals. The time to complete the whole OD race showed that the intensity of the faster triathletes was higher than that of the slower triathletes. The results of the present study suggest that sustaining higher intensity during the running leg might be important for success in nondraft legal OD triathlon races. These results may be beneficial for athletes, coaches, and researchers in the sense that they describe the characteristic performance profiles of the multisport nature of triathlon events. As such, the present research may give rise to better plan training and racing strategies.
Author Contributions
Conceptualization, A.A., K.I. and Y.N.; Data curation, A.A.; Formal analysis, A.A.; Funding acquisition, Y.N.; Investigation, A.A.; Methodology, A.A. and K.I.; Project administration, Y.N.; Resources, A.A., K.I. and Y.N.; Supervision, K.I. and Y.N.; Visualization, A.A.; Writing–original draft, A.A.; Writing–review & editing, A.A., K.I. and Y.N. All authors have read and agreed to the published version of the manuscript.
Funding
This research was supported in part by a grant from Advanced Research Initiative for Human High Performance (ARIHHP), University of Tsukuba.
Institutional Review Board Statement
The study was conducted according to the guidelines of the Declaration of Helsinki, and approved by the Ethics Committee of the University of Tsukuba (project identification code: Tai 30–24)
Informed Consent Statement
Informed consent was obtained from all subjects involved in the study.
Data Availability Statement
The data presented in this study are available on request from the corresponding author.
Acknowledgments
We would like to thank all participants for dedicating their time and effort toward this study. We would also like to thank the members of our laboratory for their support in performing this project.
Conflicts of Interest
The authors declare no conflict of interest.
References
- Wu, S.S.; Peiffer, J.J.; Brisswalter, J.; Nosaka, K.; Abbiss, C.R. Factors influencing pacing in triathlon. Open Access J. Sports Med. 2014, 5, 223–234. [Google Scholar] [CrossRef] [PubMed] [Green Version]
- Millet, G.P.; Bentley, D.J.; Vleck, V.E. The relationships between science and sport: Application in triathlon. Int. J. Sports Physiol. Perform. 2007, 2, 315–322. [Google Scholar] [CrossRef] [PubMed]
- Revelles, A.B.F.; Granizo, I.R.; Sánchez, M.C.; Ruz, R.P. Men’s triathlon correlation between stages and final result in the London 2012 Olympic Games. J. Hum. Sport Exerc. 2018, 2, 514–528. [Google Scholar]
- Wu, S.S.X.; Peiffer, J.P.; Brisswalter, J.; Lau, W.Y.; Nosaka, K.; Abbiss, C.R. Influence of race distance and biological sex on age-related declines in triathlon performance: Part A. J. Sci. Cycl. 2014, 3, 42–48. [Google Scholar]
- Bentley, D.; Libicz, S.; Jougla, A.; Coste, O.; Manetta, J.; Chamari, K.; Millet, G. The effects of exercise intensity or drafting during swimming on subsequent cycling performance in triathletes. J. Sci. Med. Sport 2007, 10, 234–243. [Google Scholar] [CrossRef]
- Laursen, P.B.; Rhodes, E.C. Factors affecting performance in an ultraendurance triathlon. Sports Med. 2001, 31, 195–209. [Google Scholar] [CrossRef]
- Millet, G.P.; Vleck, V.E. Physiological and biomechanical adaptations to the cycle to run transition in Olympic triathlon: Review and practical recommendations for training. Br. J. Sports Med. 2000, 34, 384–390. [Google Scholar] [CrossRef] [Green Version]
- Walsh, J.A. The Rise of Elite Short-course triathlon re-emphasises the necessity to transition efficiently from cycling to running. Sports 2019, 7, 99. [Google Scholar] [CrossRef] [Green Version]
- Tota, Ł.; Piotrowska, A.; Pałka, T.; Morawska, M.; Mikuľáková, W.; Mucha, D.; Żmuda-Pałka, M.; Pilch, W. Muscle and intestinal damage in triathletes. PLoS ONE 2019, 14, e0210651. [Google Scholar] [CrossRef] [Green Version]
- Olcina, G.; Timón, R.; Brazo-Sayavera, J.; Martínez-Guardado, I.; Marcos-Serrano, M.; Crespo, C. Changes in physiological and performance variables in non-professional triathletes after taking part in an Olympic distance triathlon. Res. Sports Med. 2018, 26, 323–331. [Google Scholar] [CrossRef]
- Logan-Sprenger, H.M. Fluid balance and thermoregulatory responses of competitive triathletes. J. Therm. Biol. 2019, 79, 69–72. [Google Scholar] [CrossRef]
- Millard-Stafford, M.; Sparling, P.B.; Rosskopf, L.B.; Hinson, B.T.; DiCarlo, L.J. Carbohydrate-electrolyte replacement during a simulated triathlon in the heat. Med. Sci. Sports Exerc. 1990, 22, 621–628. [Google Scholar] [CrossRef] [PubMed] [Green Version]
- Lopes, R.F.; Osiecki, R.; Rama, L.M.P. Biochemical markers during and after an Olympic triathlon race. J. Exerc. Physiol. Online 2011, 14, 87–96. [Google Scholar]
- Park, C.H.; Kim, T.U.; Park, T.G.; Kwak, Y.S. Changes of immunological markers in elite and amateur triathletes. Int. SportMed J. 2008, 9, 116–130. [Google Scholar]
- Caillaud, C.; Serre-Cousiné, O.; Anselme, F.; Capdevilla, X.; Préfaut, C. Computerized tomography and pulmonary diffusing capacity in highly trained athletes after performing a triathlon. J. Appl. Physiol. 1995, 79, 1226–1232. [Google Scholar] [CrossRef]
- Le Gallais, D.; Hayot, M.; Hue, O.; Wouassi, D.; Boussana, A.; Ramonatxo, M.; Préfaut, C. Metabolic and cardioventilatory responses during a graded exercise test before and 24 h after a triathlon. Eur. J. Appl. Physiol. Occup. Physiol. 1999, 79, 176–181. [Google Scholar] [CrossRef]
- Sultana, F.; Abbiss, C.R.; Louis, J.; Bernard, T.; Hausswirth, C.; Brisswalter, J. Age-related changes in cardio-respiratory responses and muscular performance following an Olympic triathlon in well-trained triathletes. Eur. J. Appl. Physiol. 2012, 112, 1549–1556. [Google Scholar] [CrossRef]
- Hopkins, W.G. Quantification of training in competitive sports. Sports Med. 1991, 12, 161–183. [Google Scholar] [CrossRef]
- Formenti, D.; Rossi, A.; Calogiuri, G.; Thomassen, T.O.; Scurati, R.; Weydahl, A. Exercise intensity and pacing strategy of cross-country skiers during a 10 km skating simulated race. Res. Sports Med. 2015, 23, 126–139. [Google Scholar] [CrossRef]
- Padilla, S.; Mujika, I.; Orbañanos, J.; Angulo, F. Exercise intensity during competition time trials in professional road cycling. Med. Sci. Sports Exerc. 2000, 32, 850–856. [Google Scholar] [CrossRef]
- Bernard, T.; Hausswirth, C.; Le Meur, Y.; Bignet, F.; Dorel, S.; Brisswalter, J. Distribution of power output during the cycling stage of a Triathlon World Cup. Med. Sci. Sports Exerc. 2009, 41, 1296–1302. [Google Scholar] [CrossRef] [PubMed] [Green Version]
- Le Meur, Y.; Hausswirth, C.; Dorel, S.; Bignet, F.; Brisswalter, J.; Bernard, T. Influence of gender on pacing adopted by elite triathletes during a competition. Eur. J. Appl. Physiol. 2009, 106, 535–545. [Google Scholar] [CrossRef] [PubMed]
- Hausswirth, C.; Lehénaff, D.; Dréano, P.; Savonen, K. Effects of cycling alone or in a sheltered position on subsequent running performance during a triathlon. Med. Sci. Sports Exerc. 1999, 31, 599–604. [Google Scholar] [CrossRef] [Green Version]
- Wu, S.S.; Peiffer, J.J.; Brisswalter, J.; Nosaka, K.; Lau, W.Y.; Abbiss, C.R. Pacing strategies during the swim, cycle and run disciplines of sprint, Olympic and half-Ironman triathlons. Eur. J. Appl. Physiol. 2015, 115, 1147–1154. [Google Scholar] [CrossRef] [PubMed]
- Zhou, S.; Robson, S.J.; King, M.J.; Davie, A.J. Correlations between short-course triathlon performance and physiological variables determined in laboratory cycle and treadmill tests. J. Sports Med. Phys. Fitness 1997, 37, 122–130. [Google Scholar]
- Laursen, P.B.; Knez, W.L.; Shing, C.M.; Langill, R.H.; Rhodes, E.C.; Jenkins, D.G. Relationship between laboratory-measured variables and heart rate during an ultra-endurance triathlon. J. Sports Sci. 2005, 23, 1111–1120. [Google Scholar] [CrossRef]
- Fornasiero, A.; Savoldelli, A.; Fruet, D.; Boccia, G.; Pellegrini, B.; Schena, F. Physiological intensity profile, exercise load and performance predictors of a 65-km mountain ultra-marathon. J. Sports Sci. 2018, 36, 1287–1295. [Google Scholar] [CrossRef] [Green Version]
- Esteve-Lanao, J.; Lucia, A.; Dekoning, J.J.; Foster, C. How do humans control physiological strain during strenuous endurance exercise? PLoS ONE 2008, 3, e2943. [Google Scholar] [CrossRef]
- Billat, V.L.; Petot, H.; Landrain, M.; Meilland, R.; Koralsztein, J.P.; Mille-Hamard, L. Cardiac output and performance during a marathon race in middle-aged recreational runners. Sci. World J. 2012, 2012, 810859. [Google Scholar] [CrossRef] [Green Version]
- Shimazu, W.; Takayama, F.; Tanji, F.; Nabekura, Y. Relationship between cardiovascular drift and performance in marathon running. Int. J. Sport Health Sci. 2020, 202036. [Google Scholar] [CrossRef]
- Lima-Silva, A.E.; Bertuzzi, R.C.; Pires, F.O.; Barros, R.V.; Gagliardi, J.F.; Hammond, J.; Kiss, M.A.; Bishop, D.J. Effect of performance level on pacing strategy during a 10-km running race. Eur. J. Appl. Physiol. 2010, 108, 1045–1053. [Google Scholar] [CrossRef] [PubMed]
- Stöggl, T.L.; Hertlein, M.; Brunauer, R.; Welde, B.; Andersson, E.P.; Swarén, M. Pacing, exercise intensity, and technique by performance level in long-distance cross-country skiing. Front. Physiol. 2020, 11, 17. [Google Scholar] [CrossRef] [Green Version]
- Jones, A.M.; Doust, J.H. A 1% treadmill grade most accurately reflects the energetic cost of outdoor running. J. Sports Sci. 1996, 14, 321–327. [Google Scholar] [CrossRef] [PubMed]
- Moseley, L.; Jeukendrup, A.E. The reliability of cycling efficiency. Med. Sci. Sports Exerc. 2001, 33, 621–627. [Google Scholar] [CrossRef] [PubMed]
- Takayama, F.; Aoyagi, A.; Takahashi, K.; Nabekura, Y. Relationship between oxygen cost and C-reactive protein response to marathon running in college recreational runners. Open Access J. Sports Med. 2018, 9, 261–268. [Google Scholar] [CrossRef] [PubMed] [Green Version]
- Newell, J.; Higgins, D.; Madden, N.; Cruickshank, J.; Einbeck, J.; McMillan, K.; McDonald, R. Software for calculating blood lactate endurance markers. J. Sports Sci. 2007, 25, 1403–1409. [Google Scholar] [CrossRef]
- Buchfuhrer, M.J.; Hansen, J.E.; Robinson, T.E.; Sue, D.Y.; Wasserman, K.; Whipp, B.J. Optimizing the exercise protocol for cardiopulmonary assessment. J. Appl. Physiol. Respir. Environ. Exerc. Physiol. 1983, 55, 1558–1564. [Google Scholar] [CrossRef]
- Pallares, J.G.; Moran-Navarro, R.; Ortega, J.F.; Fernandez-Elias, V.E.; Mora-Rodriguez, R. Validity and reliability of ventilatory and blood lactate thresholds in well-trained cyclists. PLoS ONE 2016, 11, e0163389. [Google Scholar] [CrossRef]
- Esteve-Lanao, J.; San Juan, A.; Earnest, C.P.; Foster, C.; Lucia, A. How do endurance runners actually train? Relationship with competition performance. Med. Sci. Sports Exerc. 2005, 37, 496–504. [Google Scholar] [CrossRef] [Green Version]
- Binder, R.K.; Wonisch, M.; Corra, U.; Cohen-Solal, A.; Vanhees, L.; Saner, H.; Schmid, J.-P. Methodological approach to the first and second lactate threshold in incremental cardiopulmonary exercise testing. Eur. J. Cardiovasc. Prev. Rehabil. 2008, 15, 726–734. [Google Scholar] [CrossRef]
- Cejuela-Anta, R.; Esteve-Lanao, J. Training load quantification in triathlon. J. Hum. Sport Exerc. 2011. [Google Scholar] [CrossRef] [Green Version]
- Kuipers, H.; Verstappen, F.T.; Keizer, H.A.; Geurten, P.; van Kranenburg, G. Variability of aerobic performance in the laboratory and its physiologic correlates. Int. J. Sports Med. 1985, 6, 197–201. [Google Scholar] [CrossRef]
- Esteve-Lanao, J.; Foster, C.; Seiler, S.; Lucia, A. Impact of training intensity distribution on performance in endurance athletes. J. Strength Cond. Res. 2007, 21, 943–949. [Google Scholar] [CrossRef] [PubMed]
- Seiler, S.; Tønnessen, E. Intervals, thresholds, and long slow distance: The role of intensity and duration in endurance training. Sportscience 2009, 13, 32–53. [Google Scholar]
- Granier, C.; Abbiss, C.R.; Aubry, A.; Vauchez, Y.; Dorel, S.; Hausswirth, C.; Le Meur, Y. Power output and pacing during international cross-country mountain bike cycling. Int. J. Sports Physiol. Perform. 2018, 13, 1243–1249. [Google Scholar] [CrossRef]
- Fritz, C.O.; Morris, P.E.; Richler, J.J. Effect size estimates: Current use, calculations, and interpretation. J. Exp. Psychol. Gen. 2012, 141, 2. [Google Scholar] [CrossRef] [Green Version]
- Hausswirth, C.; Bigard, A.X.; Guezennec, C.Y. Relationships between running mechanics and energy cost of running at the end of a triathlon and a marathon. Int. J. Sports Med. 1997, 18, 330–339. [Google Scholar] [CrossRef]
- Butts, N.K.; Henry, B.A.; McLean, D. Correlations between VO2 max and performance times of recreational triathletes. J. Sports Med. Phys. Fitness 1991, 31, 339–344. [Google Scholar]
- Suriano, R.; Bishop, D. Physiological attributes of triathletes. J. Sci. Med. Sport 2010, 13, 340–347. [Google Scholar] [CrossRef]
- Millet, G.P.; Vleck, V.E.; Bentley, D.J. Physiological requirements in triathlon. J. Hum. Sport Exerc. 2011, 6, 184–204. [Google Scholar] [CrossRef] [Green Version]
- Aoyagi, A.; Ishikura, K.; Shirai, Y.; Nabekura, Y. The relationship between running performance in the Olympic-distance triathlon and aerobic physiological variables, focusing on the three factors of the classic model. Japan J. Phys. Educ. Health Sport Sci. 2020, 65, 815–830. (In Japanese) [Google Scholar] [CrossRef]
- Barrero, A.; Chaverri, D.; Erola, P.; Iglesias, X.; Rodríguez, F.A. Intensity profile during an ultra-endurance triathlon in relation to testing and performance. Int. J. Sports Med. 2014, 35, 1170–1178. [Google Scholar] [CrossRef] [PubMed]
- Abbiss, C.R.; Quod, M.J.; Martin, D.T.; Netto, K.J.; Nosaka, K.; Lee, H.; Surriano, R.; Bishop, D.; Laursen, P.B. Dynamic pacing strategies during the cycle phase of an Ironman triathlon. Med. Sci. Sports Exerc. 2006, 38, 726–734. [Google Scholar] [CrossRef] [PubMed] [Green Version]
- Delextrat, A.; Brisswalter, J.; Hausswirth, C.; Bernard, T.; Vallier, J.M. Does prior 1500-m swimming affect cycling energy expenditure in well-trained triathletes? Can. J. Appl. Physiol. 2005, 30, 392–403. [Google Scholar] [CrossRef]
- Coyle, E.F. Cardiovascular drift during prolonged exercise and the effects of dehydration. Int. J. Sports Med. 1998, 19 (Suppl. 2), S121–S124. [Google Scholar] [CrossRef]
- Ganio, M.S.; Wingo, J.E.; Carrolll, C.E.; Thomas, M.K.; Cureton, K.J. Fluid ingestion attenuates the decline in VO2peak associated with cardiovascular drift. Med. Sci. Sports Exerc. 2006, 38, 901–909. [Google Scholar] [CrossRef]
- Hargreaves, M.; Dillo, P.; Angus, D.; Febbraio, M. Effect of fluid ingestion on muscle metabolism during prolonged exercise. J. Appl. Physiol. 1996, 80, 363–366. [Google Scholar] [CrossRef]
- O’Toole, M.; Douglas, P.; Hiller, W. Lactate, oxygen uptake, and cycling performance in triathletes. Int. J. Sports Med. 1989, 10, 413–418. [Google Scholar] [CrossRef]
- Etxebarria, N.; Hunt, J.; Ingham, S.; Ferguson, R. Physiological assessment of isolated running does not directly replicate running capacity after triathlon-specific cycling. J. Sports Sci. 2014, 32, 229–238. [Google Scholar] [CrossRef]
- Berry, N.T.; Wideman, L.; Shields, E.W.; Battaglini, C.L. The Effects of a duathlon simulation on ventilatory threshold and running economy. J. Sports Sci. Med. 2016, 15, 247–253. [Google Scholar]
- De Vito, G.; Bernardi, M.; Sproviero, E.; Figura, F. Decrease of endurance performance during Olympic triathlon. Int. J. Sports Med. 1995, 16, 24–28. [Google Scholar] [CrossRef] [PubMed]
- Boussana, A.; Hue, O.; Matecki, S.; Galy, O.; Ramonatxo, M.; Varray, A.; Le Gallais, D. The effect of cycling followed by running on respiratory muscle performance in elite and competition triathletes. Eur. J. Appl. Physiol. 2002, 87, 441–447. [Google Scholar] [PubMed] [Green Version]
- Hue, O.; Le Gallais, D.; Boussana, A.; Chollet, D.; Prefaut, C. Performance level and cardiopulmonary responses during a cycle-run trial. Int. J. Sports Med. 2000, 21, 250–255. [Google Scholar] [CrossRef] [PubMed]
- Hue, O.; Galy, O.; Le Gallais, D.; Préfaut, C. Pulmonary responses during the cycle-run succession in elite and competitive triathletes. Can. J. Appl. Physiol. 2001, 26, 559–573. [Google Scholar] [CrossRef] [PubMed]
- Millet, G.P.; Millet, G.Y.; Hofmann, M.D.; Candau, R.B. Alterations in running economy and mechanics after maximal cycling in triathletes: Influence of performance level. Int. J. Sports Med. 2000, 21, 127–132. [Google Scholar] [CrossRef] [PubMed]
- Millet, G.; Millet, G.; Candau, R. Duration and seriousness of running mechanices alterations after maximal cycling in triathlets: Influence of the performance level. J. Sports Med. Phys. Fitness 2001, 41, 147. [Google Scholar] [PubMed]
- Kreider, R.B. Physiological considerations of ultraendurance performance. Int. J. Sport Nutr. Exerc. Metab. 1991, 1, 3–27. [Google Scholar] [CrossRef]
- Del Coso, J.; Fernández de Velasco, D.; Fernández, D.; Abián-Vicen, J.; Salinero, J.J.; González-Millán, C.; Areces, F.; Ruiz, D.; Gallo, C.; Calleja-González, J.; et al. Running pace decrease during a marathon is positively related to blood markers of muscle damage. PLoS ONE 2013, 8, e57602. [Google Scholar] [CrossRef]
- Hausswirth, C.; Bigard, A.X.; Berthelot, M.; Thomaïdis, M.; Guezennec, C.Y. Variability in energy cost of running at the end of a triathlon and a marathon. Int. J. Sports Med. 1996, 17, 572–579. [Google Scholar] [CrossRef]
- Hermansen, L.; Hultman, E.; Saltin, B. Muscle glycogen during prolonged severe exercise. Acta Physiol. Scand. 1967, 71, 129–139. [Google Scholar] [CrossRef]
- Wingo, J.E. Exercise intensity prescription during heat stress: A brief review. Scand. J. Med. Sci. Sports 2015, 25 (Suppl. 1), 90–95. [Google Scholar] [CrossRef]
- Hue, O.; Galy, O.; Le Gallais, D. Exercise intensity during repeated days of racing in professional triathletes. Appl. Physiol. Nutr. Metab. 2006, 31, 250–256. [Google Scholar] [CrossRef] [PubMed]
- Galy, O.; Manetta, J.; Coste, O.; Maimoun, L.; Chamari, K.; Hue, O. Maximal oxygen uptake and power of lower limbs during a competitive season in triathletes. Scand. J. Med. Sci. Sports 2003, 13, 185–193. [Google Scholar] [CrossRef] [PubMed] [Green Version]
Figure 1.
Profile of the percentage of maximal heart rate (%HRmax) and absolute workload (swimming speed, cycling power output, and running speed) in each leg during Olympic-distance races (N = 17). Upper figures: mean %HRmax at AeT (dotted line), %HRmax at AnT (dashed line), and HRmax (solid line). Lower figures: mean workload at AeT (dotted line), workload at AnT (dashed line), and maximal workload (solid line). See text for explanations of AeT, AnT, and maximal workload in each exercise mode.

Figure 2.
Time percentage in three intensity zones based on heart rate (HR) in each leg during Olympic-distance races in the faster (n = 9) and slower (n = 8) groups. * p < 0.05 in HRzone2 in running leg. † p < 0.05 in HRzone3 in running leg. Standard deviations have been eliminated to improve clarity. See text for explanations of HRzone1, 2, and 3.

Figure 3.
Time percentage in five intensity zones based on power output (PO, A) in the cycling leg and running speed (RS, B) in the running leg during Olympic-distance races in the faster (n = 9) and slower (n = 8) groups. No significant differences were observed between the groups in each POzone in the cycling leg (p > 0.05). * p < 0.05 in RSzone4 in the running leg. Standard deviations have been eliminated to improve clarity. See text for explanations of each POzone and RSzone.


Table 1.
Characteristics and Olympic-distance race times of the faster and slower groups.
| All (N = 17) | Faster (n = 9) | Slower (n = 8) | |
|---|---|---|---|
| Subject characteristics | |||
| Age (yr) | 23.1 ± 6.7 | 24.3 ± 8.4 | 21.6 ± 4.2 |
| Height (cm) | 173.8 ± 5.9 | 174.2 ± 5.2 | 173.4 ± 7.0 |
| Mass (kg) | 65.1 ± 5.5 | 64.9 ± 6.1 | 65.3 ± 5.2 |
| Body Fat (%) | 10.3 ± 1.7 | 9.8 ± 1.4 | 10.9 ± 1.9 |
| BMI | 21.5 ± 1.1 | 21.4 ± 1.5 | 21.7 ± 0.3 |
| Triathlon experience (yr) | 4.1 ± 6.1 | 5.4 ± 8.1 | 2.6 ± 2.4 |
| Olympic-distance race times | |||
| Swimming (h:min:s) | 0:26:28 ± 0:04:01 | 0:23:34 ± 0:01:49 | 0:29:45 ± 0:03:10 ** |
| Cycling (h:min:s) | 1:10:33 ± 0:02:53 | 1:08:54 ± 0:02:19 | 1:12:25 ± 0:02:19 * |
| Running (h:min:s) | 0:42:49 ± 0:04:39 | 0:39:57 ± 0:02:14 | 0:46:02 ± 0:04:37 ** |
| Total (h:min:s) | 2:19:50 ± 0:09:38 | 2:12:24 ± 0:02:54 | 2:28:12 ± 0:07:11 ** |
Values are means ± SD. N, number of subjects; BMI, body mass index. The nonparametric Mann–Whitney U test was used to detect statistically significant differences between the groups. * p < 0.05; ** p < 0.01.
Table 2.
Environmental conditions during the Olympic-distance race of the faster and slower groups.
| All (N = 17) | Faster (n = 9) | Slower (n = 8) | |
|---|---|---|---|
| Overall | |||
| Air temperature (°C) | 21.6 ± 3.7 | 20.9 ± 3.6 | 22.3 ± 3.9 |
| Relative humidity (%) | 64.3 ± 17.0 | 58.6 ± 15.2 | 70.0 ± 17.7 |
| Wind speed (m·s−1) | 3.5 ± 1.0 | 3.4 ± 0.9 | 3.6 ± 1.1 |
| Barometric pressure (mmHg) | 759.1 ± 7.1 | 760.8 ± 6.1 | 757.4 ± 8.1 |
| Swimming | |||
| Water temperature (°C) | 20.3 ± 3.3 | 21.3 ± 3.1 | 20.1 ± 3.7 |
| Cycling | |||
| Cumulated positive elevation (m) | 173.7 ± 115.6 | 147.8 ± 134.2 | 202.8 ± 90.3 |
| Elevation to distance ratio (m·km−1) | 4.3 ± 2.9 | 3.7 ± 3.4 | 5.1 ± 2.3 |
| Running | |||
| Cumulated positive elevation (m) | 37.7 ± 31.3 | 28.7 ± 20.6 | 47.8 ± 39.2 |
| Elevation to distance ratio (m·km−1) | 3.8 ± 3.1 | 2.9 ± 2.1 | 4.8 ± 3.9 |
Values are means ± SD. N, number of subjects. No significant differences were observed between the groups (p < 0.05).
Table 3.
Laboratory measurements of swimming, cycle ergometry, and treadmill running of the faster and slower groups.
Table 3.
Laboratory measurements of swimming, cycle ergometry, and treadmill running of the faster and slower groups.
| All (N = 17) | Faster (n = 9) | Slower (n = 8) | |
|---|---|---|---|
| Swimming | |||
| Speed at AeT (m·s−1) | 0.88 ± 0.14 | 0.98 ± 0.10 | 0.78 ± 0.10 ** |
| Speed at AnT (m·s−1) | 0.93 ± 0.13 | 1.02 ± 0.10 | 0.84 ± 0.09 ** |
| SSmax (m·s−1) | 1.07 ± 0.13 | 1.16 ± 0.09 | 0.96 ± 0.08 ** |
| HR at AeT (bpm) | 138 ± 17 | 142 ± 15 | 135 ± 19 |
| HR at AnT (bpm) | 150 ± 13 | 149 ± 10 | 151 ± 18 |
| HRmax (bpm) | 185 ± 9 | 186 ± 9 | 182 ± 10 |
| %HRmax at AeT (%) | 74.8 ± 6.7 | 76.0 ± 6.8 | 73.6 ± 6.7 |
| %HRmax at AnT (%) | 81.2 ± 6.0 | 80.0 ± 4.8 | 82.5 ± 7.2 |
| Cycling | |||
| PO at AeT (W) | 190 ± 32 | 203 ± 28 | 176 ± 33 * |
| PO at AnT (W) | 252 ± 33 | 263 ± 32 | 239 ± 31 |
| POmax (W) | 343 ± 34 | 359 ± 34 | 325 ± 24 * |
| HR at AeT (bpm) | 136 ± 15 | 140 ± 16 | 132 ± 14 |
| HR at AnT (bpm) | 156 ± 13 | 158 ± 16 | 154 ± 10 |
| HRmax (bpm) | 183 ± 8 | 183 ± 9 | 182 ± 7 |
| %HRmax at AeT (%) | 74.7 ± 6.5 | 76.6 ± 6.3 | 72.6 ± 6.5 |
| %HRmax at AnT (%) | 85.6 ± 5.0 | 86.5 ± 6.2 | 84.6 ± 3.4 |
| O2 max (L·min−1) | 3.8 ± 0.4 | 4.0 ± 0.3 | 3.6 ± 0.3 * |
| O2 max (ml·kg−1·min−1) | 58.7 ± 5.9 | 62.4 ± 4.7 | 54.5 ± 3.9 ** |
| % O2 max at AeT (%) | 63.7 ± 7.9 | 64.7 ± 5.5 | 62.6 ± 10.2 |
| % O2 max at AnT (%) | 80.8 ± 6.2 | 81.2 ± 7.5 | 80.3 ± 4.8 |
| GE (%) | 21.3 ± 1.4 | 21.3 ± 1.2 | 21.3 ± 1.6 |
| Running | |||
| Speed at AeT (km·h−1) | 12.2 ± 1.2 | 12.6 ± 1.0 | 11.9 ± 1.3 |
| Speed at AnT (km·h−1) | 14.5 ± 1.5 | 14.9 ± 0.9 | 14.1 ± 2.0 |
| RSmax (km·h−1) | 17.5 ± 1.0 | 17.8 ± 0.7 | 17.1 ± 1.2 |
| HR at AeT (bpm) | 154 ± 10 | 153 ± 13 | 155 ± 8 |
| HR at AnT (bpm) | 171 ± 13 | 171 ± 13 | 172 ± 12 |
| HRmax (bpm) | 192 ± 9 | 190 ± 9 | 194 ± 9 |
| %HRmax at AeT (%) | 80.1 ± 4.0 | 80.3 ± 4.6 | 79.8 ± 3.5 |
| %HRmax at AnT (%) | 89.1 ± 4.4 | 89.6 ± 3.9 | 88.5 ± 5.1 |
| O2 max (L·min−1) | 3.9 ± 0.4 | 4.0 ± 0.4 | 3.8 ± 0.4 |
| O2 max (ml·kg−1·min−1) | 60.4 ± 4.4 | 62.2 ± 2.8 | 58.5 ± 5.3 |
| % O2 max at AeT (%) | 72.2 ± 6.1 | 71.8 ± 5.5 | 72.8 ± 7.0 |
| % O2 max at AnT (%) | 86.9 ± 6.2 | 86.2 ± 3.9 | 87.6 ± 8.3 |
| Running economy (ml·kg−1·km−1) | 217 ± 14 | 217 ± 9 | 216 ± 18 |
Values are means ± SD. N, number of subjects; AeT, aerobic threshold; AnT, anaerobic threshold; SSmax, Maximal swimming speed; HR, heart rate; HRmax, maximal heart rate; PO, power output; POmax, Maximal power output, O2 max, maximal oxygen uptake; GE, gross efficiency; RSmax, Maximal running speed. * p < 0.05; ** p < 0.01. See text for explanations of AnT and AeT in each exercise mode.
Table 4.
Mean absolute HR, mean relative HR, mean absolute workload, and mean relative workload of the faster (n = 9) and slower (n = 8) groups.
Table 4.
Mean absolute HR, mean relative HR, mean absolute workload, and mean relative workload of the faster (n = 9) and slower (n = 8) groups.
| Group | Swimming | Cycling | Running | |
|---|---|---|---|---|
| Absolute workload a | All (N = 17) | 1.03 ± 0.18 | 210 ± 24 | 14.1 ± 1.4 |
| Faster (n = 9) | 1.14 ± 0.18 | 221 ± 26 | 14.9 ± 0.8 | |
| Slower (n = 8) | 0.92 ± 0.09 ** | 197 ± 15 | 13.2 ± 1.4 * | |
| Relative workload (%maximal workload) | All (N = 17) | 96.6 ± 8.8 | 61.3 ± 5.2 | 80.5 ± 4.9 |
| Faster (n = 9) | 97.8 ± 10.0 | 61.5 ± 5.5 | 83.4 ± 2.9 | |
| Slower (n = 8) | 95.2 ± 7.7 | 61.0 ± 5.2 | 77.2 ± 4.5 * | |
| Absolute HR (bpm) | All (N = 17) | 166 ± 12 | 166 ± 9 | 174 ± 9 |
| Faster (n = 9) | 170 ± 13 | 170 ± 7 | 179 ± 7 | |
| Slower (n = 8) | 162 ± 11 | 162 ± 8 | 169 ± 9 * | |
| Relative HR (%HRmax) | All (N = 17) | 89.8 ± 3.7 | 91.1 ± 4.4 | 90.7 ± 5.1 |
| Faster (n = 9) | 90.9 ± 3.1 | 93.1 ± 4.3 | 94.0 ± 2.2 | |
| Slower (n = 8) | 88.6 ± 4.1 | 89.0 ± 3.7 | 87.0 ± 5.1 ** |
Values are means ± SD. N, number of subjects; HR, heart rate; HRmax, maximal heart rate. * p < 0.05; ** p < 0.01. a Swimming, speed (m·s−1); Cycling, power output (W); Running, speed (km·h−1).
Publisher’s Note: MDPI stays neutral with regard to jurisdictional claims in published maps and institutional affiliations. |
© 2021 by the authors. Licensee MDPI, Basel, Switzerland. This article is an open access article distributed under the terms and conditions of the Creative Commons Attribution (CC BY) license (http://creativecommons.org/licenses/by/4.0/).
Share and Cite
MDPI and ACS Style
Aoyagi, A.; Ishikura, K.; Nabekura, Y. Exercise Intensity during Olympic-Distance Triathlon in Well-Trained Age-Group Athletes: An Observational Study. Sports 2021, 9, 18. https://0-doi-org.brum.beds.ac.uk/10.3390/sports9020018
AMA Style
Aoyagi A, Ishikura K, Nabekura Y. Exercise Intensity during Olympic-Distance Triathlon in Well-Trained Age-Group Athletes: An Observational Study. Sports. 2021; 9(2):18. https://0-doi-org.brum.beds.ac.uk/10.3390/sports9020018
Chicago/Turabian StyleAoyagi, Atsushi, Keisuke Ishikura, and Yoshiharu Nabekura. 2021. "Exercise Intensity during Olympic-Distance Triathlon in Well-Trained Age-Group Athletes: An Observational Study" Sports 9, no. 2: 18. https://0-doi-org.brum.beds.ac.uk/10.3390/sports9020018
Note that from the first issue of 2016, this journal uses article numbers instead of page numbers. See further details here.