
Assessment of Factors Impacting the Perception of Online Content Trustworthiness by Age, Education and Gender


1
Department of Computer Science, North Dakota State University, Fargo, ND 58105, USA
2
Department of Mathematics and Applied Sciences, University of Michigan-Flint, Flint, MI 48502, USA
*
Author to whom correspondence should be addressed.
Societies 2022, 12(2), 61; https://0-doi-org.brum.beds.ac.uk/10.3390/soc12020061
Submission received: 1 February 2022
/
Revised: 23 March 2022
/
Accepted: 24 March 2022
/
Published: 31 March 2022
(This article belongs to the Special Issue Fighting Fake News: A Generational Approach)
Abstract
:Online content trustworthiness has become a topic of significant interest due to the growth of so-called ‘fake news’ and other deceptive online content. Deceptive content has been responsible for an armed standoff, caused mistrust surrounding elections and reduced the trust in media, generally. Modern society, though, depends on the ability to share information to function. Citizens may be injured if they don’t heed medical, weather and other emergency warnings. Distrust for educational information impedes the transfer of knowledge of innovations and societal growth. To function properly, societal trust in shared in information is critical. This article seeks to understand the problem and possible solutions. It assesses the impact of the characteristics of online articles and their authors, publishers and sponsors on perceived trustworthiness to ascertain how Americans make online article trust decisions. This analysis is conducted with a focus on how the impact of these factors on trustworthiness varies based on individuals’ age, education and gender.
1. Introduction
In 2004, Keyes posited that the modern era was one of “post-truth” [1]. He noted, referring to interpersonal activities, that “deception has become commonplace at all levels of contemporary life” and highlighted the numerous lies that are told frequently in society [1].
Twelve years later, in 2016, the British referendum on European Union membership (see [2]) and the U.S. presidential election brought the concept of deceptive online content into the public consciousness. In the UK, Brexit was fueled by an army of Twitterbots [3], illegal profiling using online data [4], foreign online content influence [4] and “hyperpartisan” content [3]. In the U.S., so-called “fake news” stories circulated on Facebook and other social media [5]. Grinberg, et al. say that approximately 6% of all news, during this period, was fake (which they identified based on the journalistic practices, or lack thereof, of the distributing site)—however, less than 1% of the population received 80% of the fake news content [6]. On Twitter, Bovet and Makse [7] found that 25% of tweets, during this period, were “fake or extremely biased news”, based on linking to websites that they identified as “fake and extremely biased”.
Over the intervening five years, the term “fake news” grew in usage [8] and changed in meaning [9]. Initially, the term was used for “describing the threat of disinformation online”; however, this shifted “to a more normalized and broad usage of the term in relation to attacks on legacy news media” [9]. Despite the change in meaning being temporally connected to the 2016 U.S. presidential election, Cunha, et al. [8] have shown that this change was prevalent in at least 20 countries. In some cases, modern uses of the term have little to do with a story’s accuracy and instead seek to “discount and discredit ideologically uncongenial media sources” [10]. Tong, et al. [11] showed that a “weaponization of fake news” had occurred.
Lee [12] argues that “fake news” is a “sinister force” that presents a threat to democracy itself. Given the concern that deceptive content has raised, a variety of techniques for mitigating and responding to it have been proposed. These have ranged from filtering content [13], to content detection and removal [14], to limiting access to the internet [15], to content labeling [16]. Labeling is perhaps the most democratic of these proposals, as it leaves the decision to read or not to the information consumer. It also benefits from not limiting speech in a way that may run afoul of the United States’ First Amendment, which (in addition to its free speech benefits) may make its implementation more feasible. Other approaches, though, may be more effective at preventing the problems caused by fake news, albeit at the considerable expense of impairing speech freedom.
To assess the prospective impact of different forms of solutions and what solutions may be effective, understanding how individuals make content trustworthiness decisions is critical. This article focuses on intentionally deceptive online news content presented in textual form (potentially with supporting media, such as pictures), in particular. This is content that purports to be a news article via using the presentation typically used for news articles, but which has goals other than the accurate presentation of the information, as it is understood by the author (mirroring the definition presented in [17]). This work seeks to determine which characteristics individuals rely upon in assessing news-style article trustworthiness and whether the weight given to these characteristics varies by the age, educational level or gender of the individual. The characteristics studied in this paper were first proposed by Fuhr, et al. [18]. This content is of particular interest due to its prominence and ability to rapidly spread via social media and other channels. The data analyzed herein will inform analysis regarding whether content labeling can be effective (or not) or if alternate solutions are better to pursue.
This paper continues with a review, in Section 2, of prior work that this work builds on. Section 3 describes the study that was carried out. Next, in Section 4, the impact of an article’s title, article, publisher and other related details on trustworthiness is assessed. Following this, Section 5 assesses the trustworthiness impact of other article characteristics, such as the number of opinion statements present and reading level. In Section 6, the implications of the analysis presented in Section 4 and Section 5 are discussed. Finally, Section 7 discusses key conclusions and needed future work.
2. Background
This section provides an overview of prior work in several areas that provide a foundation for the work presented herein. In Section 2.1, the evolving and varied definitions of the term “fake news” over the last two decades are discussed. In Section 2.2, prior work on fake news and deceptive online content is presented. In Section 2.3, methods for identifying and classifying fake news are discussed. Finally, in Section 2.4, the problem created by fake news is reviewed.
2.1. Defining Fake News from 1475 to 2022
According to Higdon [19], fake news traces its lineage back at least as far as 1475 when “the Christian city of Trent was so outraged by the false story of a Jewish man killing a two-year-old boy that they imprisoned and tortured the local Jewish population as punishment”. However, the term fake news has not always meant factually inaccurate content. At least as early as 2005, the term “fake news” was used to describe satirical works such as “The Daily Show” and “The Onion” which are designed to inform the public on current events while providing a humorous slant [20]. This definition of the term continued to be in popular use as late as 2014, with work in this decade devoted to comparison of the value of real news versus its satirical counterparts with regards to keeping up with current events [20,21]. During this era, from approximately 2005–2014, “fake news” referred almost exclusively to “satirical news.” That is, media designed to inform the public through a humorous or satirical take. The viewer was always intended to be in on the joke in this form of entertainment news. Some media such as Saturday Night Live’s “Weekend Update” would go so far as to describe themselves directly as “fake” in the introduction of the material, opening with the phrase “and now for the fake news” [22]. Other media such as “The Onion,” self-described as “America’s Finest News Source,” would instead present themselves with the conceit of being real news [23]. This phenomenon is similar to kayfabe in professional wrestling, where the actors, writers and audience are aware that what is happening is fake but continue to treat it seriously to better appreciate the presentation [24]. Yet, in all these cases, there is an understanding that the audience does know that what is being presented is satirical and now to be read as fact.
By 2014, a new form of usage of the term “fake news” was appearing in research works [25]. In this form, users of social media platforms such as Twitter and Facebook would intentionally share images and memes describing fake, often politically charged information, to win political debates using misinformation. While “satirical news” such as the Daily Show would attempt to ensure that the audience was in on the joke, this new variant of “fake news meme” was designed to be believable enough to be accepted as fact while also being difficult to either verify or debunk. The humorous or outrageous design of the fake news meme helped it to spread more rapidly than it could be fact-checked. It could be spread intentionally by users who knew the information was false but wanted to use this misinformation to shift political opinions. It could also be spread unintentionally by users who were not “in on the joke” and truly believed the misinformation to be legitimate. There was little means by which to distinguish between these two behaviors, given that the distinction seemed only to be the spreader’s intention.
By 2015, the term “fake news” had extended to include entire “fake news articles” written to appear even more legitimate than the “fake news memes” [26]. By 2016, the meaning of the term began to blur as it entered the public vernacular. It became necessary to describe works as “so-called fake news” in cases where there were differences of opinion as to whether a particular source was fake or legitimate. This led to what was described as a “narrative battle” between competing organizations attempting to selectively provide legitimate news while “spinning” its meaning and how the public ought to react to the facts [27]. This form of “opinion-based news” draws a line by not presenting false information but instead providing a non-objective viewpoint meant to elicit a certain type of reaction.
With this blurring definition, by 2016 the term “fake news” began to find use as a pejorative to be directed at any news media which the speaker simply disliked [28]. This misuse of the term created an even greater level of disinformation, where even speaking about the concept of “fake news” could be misconstrued as speaking about “news I do not like.” Higdon [19] suggests that the term “became an omnipresent idiom in American discourse” due to an exchange between U.S. president Donald Trump and CNN reporter Jim Acosta in January 2017. During this exchange Trump stated, in response to a request from Acosta, “I’m not going to give you a question. You are fake news” [19].
Even as recently as 2022, it is not uncommon for the term “fake news” to be written with caveats, quotations and question marks or described as “potential ‘fake’ news” [29]. It remains a politically charged term which, nonetheless, is used to have a shared discourse on the topic.
In response to this division over the definition of “fake news”, Tanocc, Lim, and Ling [30] conducted a review of 34 prior academic articles that used the term “fake news” between 2003 and 2017. Categories included news satire and parody, advertising and public relations works (made to appear as though they were neutral news reports on a product, person, company or service, news fabrication containing no factual basis—also called disinformation) and photo and video manipulations ranging from simple (modification of color saturation on the image) to complex (making a politician appear to be at an event when that was not the case). The authors proposed a four-quadrant model for the typology of fake news categories based upon the level of “facticity” (how accurate the article is) and the “intention to deceive.” For example, advertisement of a product may have high facticity but also a high intention to deceive. This is a form of mal-information which is based upon fact but used in a manner to manipulate the consumer (convincing them to purchase a product). While both news satire and news parody share a low intention to deceive, news satire is distinct in having a high level of facticity (making humorous reports about the facts) while news parody’s facticity is low (reporting humorous invented “facts”).
Higdon [19] notes that scholars have had difficulty arriving at a consensus on the meaning of the term “fake news” with some basing the classification on form and intent to deceive others, while others suggest that the term implies propaganda content. Both of these definitions, though, have gaps, such as ignoring oral news transmission, legitimate errors, fabrications for career advancements and prank news [19]. A commonly accepted definition of fake news, which will be used herein, is “fabricated information that mimics news media content in form but not in organizational process or intent” [17]. There is observed overlap of this classification with “misinformation” which is either false or misleading and “disinformation” which is purposely spread to deceive people. “Fake news memes” would fall into these later two categories, while “fake news” would require that the source actively mimic the appearance of a legitimate news source while acting to the purpose of misinforming or disinforming the public.
2.2. Fake News and Deceptive Online Content
The Pew Research Center has tracked Americans’ news usage on social media since 2013 [31,32,33,34]. As of 2020, approximately 71% of adults in the USA get at least some of their news (a term which the study didn’t define for respondents) from social media platforms, with 23% reporting they do so “often.” This percentage is up from 68% in 2018 and 62% in 2016. Of adults in the USA who get news on social media, most use only a single source (65% in 2013 and 64% in 2016) and relatively few use more than two sources (9% in 2013 and 10% in 2016). The percentage of each social networking site’s users who get their news on the site has increased across multiple platforms from 2013 to 2018, as shown in Figure 1. This shows that most users of Reddit, Twitter and Facebook, since at least 2016, sometimes get their news from their social media site of choice. In a related survey question from the 2020 study, 59% of Twitter users, 54% of Facebook users, and 42% of Reddit users stated that they “regularly” get their news from their respective social media platform rather than simply “sometimes.”
Despite these trends, a majority of social media news consumers (57% in 2018 and 59% in 2020) say they expect the news they see on social media to be “largely inaccurate.” Almost half of respondents (48% in 2018 and 47% in 2020) state that social media has “not made much of a difference” in their understanding of current events, with an increasing number of users (15% in 2018 up to 23% in 2020) stating that social media has instead made them more confused about current events. Yet, increasingly, adults in the USA use social media—and usually only a single social media site—as a news source. The lack of perceived accuracy does not appear to be a sufficient deterrent from using these sources, with 21% of 2018 respondents citing “the convenience” as the thing they like most about using social media as a news source.
2.3. Identification and Classification of Fake News
Identifying fake news can be key to combatting it. This section discusses prior work on this topic.
Zhang, et al. [35] described three key characteristics of fake news which increase its negative impact. The first is its volume, as fake news is easily written, revised, and circulated by anyone interested in producing such content [35]. Second, the variety of formats which fake news can take (such as fake news articles versus fake news memes) makes it difficult to identify with a precise and predictable definition [35]. The third is the “velocity” of fake news, as fake news sites may be created, distributed, consumed, affect change in a population’s beliefs, and subsequently be deleted entirely before detection is performed [5]. Fake news frequently targets current events, meaning that real-time detection and removal must occur in parallel with real-time creation, consumption, and distribution. With such a vast supply, the numerous moving targets can have a great impact on public perception. By the time fact-checkers have time to respond, the fake news cycle may have moved on to a new interaction, either promoting a different story or even calling into question the fact-checkers themselves.
Four major components to consider were identified by Zhang, et al. [35] when classifying content as “fake news.” These were the creator/spreader, the target victims, the news content, and the social context. Creators can be human or non-human agents, either working independently or through a centralized network. The intent of the creator can vary from either producing intentional misinformation to simply doing a poor job of investigating the facts before creating the content. Victims may be targeted based upon their purchasing habits, voting habits, age, nationality, or other socio-economic or demographic factors which could make them either particularly vulnerable or necessary to the underlying agenda of the creator. The news content is broken down between its “physical” and “non-physical” aspects. Physical aspects of news content include the title, the body of text, images, videos, audio clips and other physical media. Non-physical aspects include its emotional content, opinions, sentiments of the author and artistic choices in formatting of the media. Social context is determined based upon the social system within which distribution takes place. Fake news spread via Facebook will mostly be shared with and communicated about amongst friends and family members, while fake news spread via Twitter is more likely to reach an audience extending to followers-of-followers. As such, the type of communication of content will vary. A creator may selectively develop fake news of differing constructions to target at different social spaces.
Fact checking attempts to combat misinformation with correct information. Multiple online fact-checking resources exist, including Factcheck.org, Factmata.com, PolitFact.com and Snopes.com. Additionally, Wikipedia maintains a database (https://en.wikipedia.org/wiki/Wikipedia:Reliable_sources/Perennial_sources) of news sources rated by their reliability, with some earning a “generally unreliable” or even “blacklisted” rating. This listing includes summary details for why the given rating exists. It is managed by volunteer contributors. Research-based approaches to fake news detection include user analysis (identification of creators, spreaders and likely victims) [36,37], content and sentiment analysis (identification of physical and non-physical aspects of fake news content) [35] and social context analysis (identification of anomalous social behavior surrounding fake news) [35,38]. Once analysis is conducted, a second question is how to best preset it to users.
2.4. The Fake News Problem
Even with an understanding of what it is and how to potentially combat it, fake news is a problem. Monsees [39] characterizes the fake news problem as “a war against truth” and notes that it has expanded from being “a very specific concern regarding the spread of information via social media” to a broader “security concern”. Its impacts are pronounced, ranging from election impact [6,7] to reducing trust in traditional media [40]—especially among the young [41]—to physical violence, such as the Pizzagate incident in the United States [42] and an assault based on a fake kidnapping incident in Mexico [43].
Fake news has been shown to have a disproportionate impact on a small group of individuals and to be associated with “confirmation bias, selective exposure, and lack of analytical thinking” [43]. Youth have also been shown to have difficulty identifying fake news. A US-based study found that only 11% of children could correctly identify a hoax website and a similar study in the Netherlands found that only 7% could correctly identify a hoax website [44]. College students evidenced another related issue: the indicated that they expected news content on social media to be inaccurate [33]. Despite this, though, those in the 18 to 29 age group were shown to use social media with greater frequency and trust those sources more than other age groups [33,45].
Other studies suggest that the media literacy of youth may be somewhat higher. While early work identified young people as having a low level of media literacy, potentially leaving them susceptible to fake news (see for example [46] and [47]), empirical evidence suggests that young people may be less likely to click on fake news links [48].
In some cases, fact checking—presenting those influenced by fake news with accurate information—has even been shown to be ineffective [43]. For the general public, in the United States, the exposure to fake news content is limited. Allen, et al. suggest that it comprises only 0.15% of Americans’ daily media consumption, based on the proportion of time spent on visits to websites that have been identified as providing “fake, deceptive, low-quality, or hyperpartisan news” [49]. Notably, all news, a term broadly defined by Nielsen to include traditional news programming, entertainment news and even “late-night comedy shows”, is approximately 14.2% American’s media consumption [49].
While this article focuses on online intentionally deceptive content, fake news is not just an online phenomena. The term has been widely applied to traditional media sources, as well; however, this labeling is problematic as it includes content classified as “fake” by those that seek to discredit content that they do not like. Richardson notes that the term fake news is an “existential challenge to journalists dealing with an audience losing its faith” [50]. Those that seek to discredit traditional media purport that “’truth’ and ‘accuracy’ are pliable concepts in the hands of the mainstream media” [50]. Lees goes even further, contending that the term is used to “plant mistrust in the media, stop stories being published, and even imprison journalists” [51]. However, traditional media is not without its inaccurate and, in some cases, deceptive news. A 1972 study showed that while 7.2% of television time (including both news and non-news content, including advertising) was devoted to “health-related content”, 70% of the content “was inaccurate or misleading or both” [52]. Benkler, Faris and Roberts [53] explain how another traditional news venue, radio, has led to news consumer confusion through “talk radio” programs, which are still ongoing. Faris, et al. [54] also demonstrate traditional media’s role in the dissemination of misinformation in a study specifically surrounding COVID-19. Beyond potential bias and other issues of traditional media sources, themselves, traditional media also can spread online misinformation via reporting on social media trends and embedding [55] social media within an article. Zucker [56] explains how problematic false news information is—applying equally to traditional and online media—as “even after individuals learn that a piece of information is false, they still tend to believe it, at least to some extent, because of the difficulty of removing information once it has been encoded in memory.”
In considering the scope of the fake news problem, it is important to note that most news content is consumed from television—not online (approximately five times as much) [49]. There is a notable exception: while the youngest age groups assessed (18 to 24 and 25 to 34) consume the least amount of news, more of their consumption occurs online. Individuals who are 18 to 24 consume slightly under 10 min of television news per day and approximately 5 min of online news per day.
Both categories of consumption go up by approximately 50% for the 25 to 34 age group. Those in the 45 to 54 age group, alternately, consume approximately 50 min of television news and just over 10 min of online news each day and those in the 55+ group consume over 80 min of television news each day and approximately 13 min of online news. The percentage of online news that is ‘fake’, based on coming from sites that have been identified to be “sources of fake, deceptive, low-quality, or hyperpartisan news”, is small: less than 10% across all age groups.
Dentith [57] contends that the fake news problem is a symptom of a “polite society” where topics are “ignored or glossed over”, suggesting that allegations of content inaccuracy and deception must be taken more seriously even if it causes individuals to be upset. Greg [58] contends, somewhat conversely, that it is a “symptom of a deeper problem”—namely of a current “negative cycle in politics” caused by an ideological conflict. Savino [59] notes that the lack of liability for the content is also problematic, as it removes incentive to reign in content by those posting or publishing it.
A variety of solutions for fake news have been proposed including filtering content [13], content removal [14], limiting internet access [15], and content labeling [16]. Higdon [19] suggests that none of these will necessarily be effective and that media literacy education is lacking and severely needed in the United States. A study by Guo [60] furthers this conclusion by suggesting that most of the non-educational solutions may be ineffective by demonstrating the spread of ‘fake news’ on China’s government news media sites. Bernal [61] proffers that while social media is used “there is little that can be done to reduce the impact of fake news and misinformation” and questions whether “the benefits to freedom of expression that social media brings mean that this is a price worth paying”.
Informed by the considerable challenges presented by fake news and deceptive online content, this paper seeks to understand how individuals make news consumption decisions. This knowledge will be key to understanding which techniques may be effective at combatting the negative impacts of fake news while seeking to maintain individuals’ rights to speak freely and read the content of their choosing.
3. Survey, Data Collection Process, Respondents and Methodology
To understand individuals’ news consumption decision-making, a survey was conducted. This section discusses the survey instrument and data collection process that was used to collect the data presented herein. First, the survey instrument is discussed. Then, the data collection process is reviewed. Finally, analysis of the respondents’ demographic characteristics is presented.
3.1. Survey Instrument
The survey instrument that was used for this data collection was based on and modified from the survey utilized in [62]. It was edited for brevity (to meet a target response time of 15 min or less) and combined content from the three surveys that were administered independently to collect the data analyzed in [62]. While most editing focused on the removal of questions (those that were redundant between the combined surveys or selected for removal to meet response time goals), the surveys were reviewed again by the authors and Qualtrics survey staff before use. A limited pilot study phase was also used to validate the instrument before the large study commenced. As no issues were detected with the pilot study, these responses were applied to relevant demographic quotas and included in the dataset, in line with Qualtrics’ standard survey administration practices.
Questions on the survey instrument related to multiple perceptual filters. They asked respondents about their own perceptions, their perceptions of others, and their perceptions of the ideal. This was performed via asking questions in the following forms (the example of article title is used):
- How much of an impact does the title of an article have on your personal perceptions of trustworthiness and or credibility of an article?
- How much of an impact do you believe the title of an article has on other people’s perception of the trustworthiness and or credibility of an article?
- If you were acting in an ideal manner, to what extent should the title of an article impact your perception of the trustworthiness and or credibility of an article?
For each question of this type, respondents were given a choice of five responses on a Likert-like scale:
| ● A great deal | ● A lot | ● A moderate amount | ● A little | ● None at all |
By asking respondents about these three perceptual filters, analysis is able to compare respondents’ perceptions of their own actions and beliefs as well as what they perceive others as doing and what they believe they and others should be doing. Comparing respondents to others is indicative of how they perceive their own actions and beliefs as fitting in with those that they regularly interact with. The comparison of self and others’ actions and beliefs to ideal ones is particularly interesting as it may aid in the understanding of areas where respondents may be readily open to changing their behaviors, as they already believe that they should be different than they are. All of these comparisons can be helpful in assessing the likelihood of label use adoption and identifying barriers and pathways to label use adoption.
3.2. Data Collection
The data that is analyzed in this paper was collected using a quota-based stratified sampling technique. It was collected by Qualtrics International Inc. using the survey instrument described in the previous section. Respondents were recruited based on seeking population proportionate representation of gender, age, income level and political affiliation. Approximately 550 responses to the survey were collected in October of 2021, of which 500 were part of the population representative sample. Respondents were given an incentive based on the submission of a complete survey, so most responses were complete. This paper analyzes all responses which include an answer to the relevant demographic and response questions being analyzed.
3.3. Respondent Demographics
Respondents are well distributed across numerous demographic groups. Approximately 49% were male and 51% were female. Non-binary gender respondents made up less than 1% of responses and, thus, couldn’t be further analyzed due to the small sample size.
Respondents’ ages are presented in Table 1. Approximately 11% of respondents were 18–24, 25–29 and 30–34 (each). Respondents aged 35-39 comprised 10% of the responses. There were 9% of respondents who were aged 40–44, 7% who were aged 45–49, 6% who were aged 50–54 and 14% who were aged 55–59. Those aged 60–64 made up 12% of respondents and 11% of respondents were 65 and older.
Most respondents fell into three groups, with regards to educational attainment. Respondent educational attainment levels are presented in Table 2. Approximately a quarter have only graduated high school and another quarter had completed some college but not a degree. An additional 22% had completed a bachelor’s degree. Only 3% of respondents had a Ph.D., 5% had not completed high school, 10% had a master’s degree and 12% had completed an associate’s degree.
3.4. Methodology
Data was analyzed in Qualtrics and Microsoft Excel. Responses for each question were analyzed to identify the comparative impact of each assessed demographic characteristic on key metrics including respondents’ perceptions of their own attitudes, beliefs and predicted actions, respondents’ perceptions of others’ attitudes, beliefs and actions and respondents’ perceptions of ideal attitudes, beliefs and actions.
To evaluate the results of the survey, the implications of the responses to each of these three questions is considered. Through their choices, a respondent may indicate that they believe that their own behavior needs to change—either that they use a metric more than what is ideal or less than what is ideal. A respondent may additionally express that the behavior of others should change to either use a particular metric more or less than they currently do. When these beliefs are not common between self-perception and the perception of others, the respondent may either believe themselves to be better or worse than other people in their use of that metric. These paradigms may indicate different levels of buy-in for possible change. These paradigms are summarized in Table 3.
When respondents believe that a current status of high matches the ideal, or that self-usage is not ideal and the metric should be used, label mechanisms and educational initiatives may be more likely to achieve buy-in from the public. For example, if respondents believe that they should be more concerned about the sponsors of an article, it is likely that they would be receptive to labeling news media with sponsor information. By contrast, if users indicate that they use a metric too much or the problem (deviation from ideal) is only others’ usage levels, this can indicate a potential problem area where usage is not perceived as ideal, but there may be little incentive to change. For example, a problem with only others’ usage may mean that most individuals consider themselves to be an exception and not in need of labels’ assistance. Using these responses, thus, the categories of labels that could be implemented most immediately with positive reception can be identified. Categories that would not be well received, and those which may require educational support to build public understanding of the metric and how it can be used are also apparent.
For each question, the hypothesis that a logical correlation between the demographic characteristic and responses being measured existed was tested against a null hypothesis of no correlation existing. Each hypothesis was based on a particular type of information about the article, such as it’s the identity of its creator, publisher or sponsors. The characteristics which were selected were based on their availability to news article consumers for decision-making and were selected as part of a prior study [62].
The data from each metric for each demographic are presented in Section 4 and Section 5 and trends present in the data are assessed. In this trend analysis, a positive correlation means that the metric increased along with an increase in the demographic (e.g., more support with older age) and a negative correlation means that the metric decreases with an increase in the demographic (e.g., less support with older age). Qualifiers such as ‘minimal’ are used to indicate the magnitude of the trend and thus identify trends that may exist but not have practical significance.
4. Analysis of the Impact of Article Title, Author, Publisher and Metadata on Perceptions of Content Trustworthiness
This section analyzes the impact of several article characteristics and metadata elements on Americans’ perception of content trustworthiness. These perceptions are integral to decisions that Americans make when consuming and otherwise using (e.g., posting or sharing) news content.
4.1. Article Title
The assessment in this section begins with article titles. The article title is, arguably, the most prominent feature of many articles (a lead picture may be more prominent in some cases). It tells the prospective reader what they may be reading about, should they choose to read the article, and is typically one of the first things the reader sees about the article—in many cases, seeing the title on a page that links to the actual article.
Given this, respondents were asked about the impact of an article’s title on their perceptions of its trustworthiness. This data is shown in Appendix A in Figure A1. The vast majority of respondents felt that it was important, with a minimal number of respondents indicating that it had no impact at all. The impact of the title is the greatest for the 40–44 age group. The 18–24, 25–29 and 30–34 age groups also show high interest in this aspect of the article, with over 50% of respondents in these three groups indicating that they place a “great deal” or “a lot” of importance on this characteristic.
The impact of the article’s title shows a negative correlation with educational level. Excepting a small resurgence for master’s degree holders, the number of individuals indicating that it matters “a great deal” declines steadily with additional education. The pattern, when considering the “a lot” responses is less clear, with this second group reaching a similar level (when combined with the “great deal” responses across educational levels).
The impact of gender on the article title’s impact on perceptions of trustworthiness is minimal. Male and female respondents both indicated placing “a great deal” and “a lot” of focus on the title with similar frequency. Males were more likely to place no weight on the title altogether, while females were more likely to place “a moderate amount” of focus on it than males.
Respondents were also asked how they believed the title impacted the trustworthiness perceptions of others. A demonstrable trend again exists between the 18–24 age groups and the 50–59 age groups with the number of respondents indicating “a great deal” consistently falling (with a slight resurgence in the 30–34 age group) throughout this range. This general trend, albeit with more fluctuations, also exists for the combined number of “great deal” and “a lot” respondents.
Comparing the results from Figure A1a and Figure A2a, it is notable that, in most cases, more individuals indicated that others give “a great deal” of focus to the title than said that they themselves did. In all instances but one, the 25–29 age group, more individuals indicated that others gave either “a great deal” or “a lot” of focus to the title than indicated that they themselves did.
The educational level data, presented in Figure A2b, shows a minor trend amongst the some high school, completed high school and some college levels, with growth in the number of individuals indicating that others place both “a great deal” and “a lot” of focus on the title. Beyond this, there is a notable decline.
Comparing the self-perception and the perception of others, at most levels more respondents indicated that others placed either “a great deal” or “a lot’ of focus on the title than they did themselves, with some exceptions. For example, the some high school level had nearly three times as many respondents indicating that they placed “a great deal” of focus on the title themselves, as opposed to others. Generally, though, respondents indicated that others paid more focus to the title than they themselves did.
Like with respondents’ self-perceptions, there is minimal difference between male and female respondents regarding the level of focus others placed on the article title.
Respondents were asked what the ideal level of focus to place on the title would be. These results are presented in Figure A3. Notably, there is a very different trend present with this data than either the self-focus or perceptions of others’ focus. The age group data shows (with the exception of the 35–39 age group) a gradual incline, up to the exception at the 35–39 level, and then a decline for the combined “great deal” and “a lot” responses. This is notably different than the trends visible in either Figure A1a or Figure A2a.
At many of the levels, more respondents indicated self-belief (considering “great deal” and “a lot” responses) in the title’s importance than indicated it ideally being important. In all age groups except one (55–59), more respondents indicated others having a “great deal” or “a lot” of focus on the title than ideally would. The level of difference was particularly pronounced in the 18–24 age group, where 25% more respondents indicated others having focus on this (at the “great deal” or “a lot” levels) than ideally would.
No clear pattern is present between ideal title focus and educational level. There is also not a clear pattern between self-perception and ideal perception, with three educational levels having more self-perception than ideal, two having similar levels and two having less self than ideal perception of the importance of the article title. There is also minimal difference between male and females, with regards to ideal levels of focus on article title.
4.2. Article Publisher
The next characteristic assessed was the importance of the article’s publisher. This data is presented in Figure A4, Figure A5 and Figure A6. In terms of age-related data, there is a notable drop in the level of importance of the publisher at the “great deal” level between the 18–24 and 35–39 age groups. It is also present in the combined “great deal” and “a lot” levels between the 18–24 and 30–34 age groups.
Comparing this to the data in Figure A4b is of particular interest as there is a demonstrable increase, at both the “great deal” and combined “great deal” and “a lot” levels between the some high school, high school completion and some college levels. This is the opposite of what might be expected, based on the age-related data. Of course, these levels also include individuals who reached that status sometime ago and are now older. Thus, these two trends—when juxtaposed—are of interest as they show that the age-associated trend is not attributable to education but instead to other factors and (similarly) that the education level-associated trend is not age-attributable but instead attributable to other factors.
While the gender data, in previous figures, has shown minimal difference, Figure A4c shows a notable difference between the two genders. While the “great deal” level is similar, males’ “a lot” level is notably higher (40% as opposed to 30%). Thus, males seem to place more weight on the publisher of an article than females. Females also indicated no focus on the article publisher approximately twice as often as males.
Data regarding the respondents’ perceptions of the importance that others place on the article’s publisher is presented in Figure A5. No obvious trends are present in the age group data. The education level data shows a notable increase in publisher importance between the some high school, high school complete and some college respondents at both the “great deal” and “a lot” levels. This mirrors the trend shown in the self-perception data. The gender data shows that males have a perception of others’ importance of the publisher of an article that is similar to the importance they place on it themselves. More males indicated a “great deal” and “a lot” of importance than females. There are, also again, about twice as many females indicating attributing no importance to an article’s publisher, as compared to males.
Next, the respondents indicated the ideal level of focus to place on the publisher of an article. The decrease in focus with increasing age at the youngest age levels, that was present in the self-perception data, was also present in the ideal data, with a notable decrease in importance between the 18–24 and 30–34 levels, at both the “great deal” and “a lot” levels.
Comparing Figure A4a, Figure A5a and Figure A6a, it is notable that, in most cases, respondents feel that they and others are placing too much focus on the publisher. More respondents indicated placing personal focus at the “great deal” and “a lot” levels on the publisher than indicated these levels of ideal focus in seven of the ten age groups. Similarly, more respondents indicated believing others focused on the publisher, at the “great deal” and “a lot” levels, then indicated this as being ideal. Again, seven of the ten age groups indicated more focus than ideal.
4.3. Publication Date
Next, focus turns to the publication date of the article. Data related to the level of focus paid to the publication date is presented in Figure A7, Figure A8 and Figure A9. A trend of declining importance being placed on the publication date with advancing age is present in the youngest age groups and starting at the 25–29 age group and continuing through the 65 and older group.
Looking at the education level data, there is a notable increase between the some high school and bachelor’s degree focus at the combined “great deal” and “a lot” levels. The most educated individuals (master’s and doctoral degree holders), though, placed less importance on the publication date (but not as little as the some high school group).
Comparing the genders, males tend to place less importance on the publication date than females, with more females reporting placing a “great deal” or “a lot” of importance on the publication date than males.
With regards to the perceptions of respondents regarding others’ perceived importance of the publication date, what is perhaps most notable (in Figure A8a) is the significant fluctuation between age groups. While gradual shifts and trends were present in the self-perception data, the perception of others data lacks a notable trend at the “great deal” and “a lot” levels. There is not a notable pattern between the self-perception and others-perception data.
Comparing the self-perception and others-perception data by educational level finds similarities. The four middle education levels all have a similar level of perception of others’ publication date importance to each other. They also are similar to the reported levels of self-importance, both at the “great deal” and “a lot” combined level. Both the self- and others-perception data also show a decline in perceived importance at the master’s and doctoral degree levels at the “great deal” and “a lot” combined level. The some high school group is notably different, with no respondents reporting a “great deal” of importance to others, but having more “a lot” of importance responses than the combined “great deal” and “a lot” for the self-perception question.
Finally, the gender data shows more interest in the publication date at the combined “a lot” and “great deal” and combined “a lot”, “great deal” and “moderate” levels, despite being similar at the “great deal” alone level. Similar to the self-perception data, it appears that females also perceive the publication date as being more important to others than males do.
In the perceived ideal levels of focus on the publication date of the article (shown in Figure A9), a general decline in importance is seen from the 25–29 age group and older at the combined “great deal” and “a lot” levels. This trend is similar to the decline in importance of the publication date seen in the self-importance and others-importance data presented in Figure A7a and Figure A8a.
Similar trends are also present in the educational level and gender data. A similar level of perceived ideal importance is seen at the middle education levels, with lower importance being placed on the publication date by the some high school level and masters and doctoral degree holders. Females also place more importance on the publication date, mirroring the self- and others-importance data.
4.4. Article Author
Focus now turns to the perceived importance of the article’s author. Data regarding this is presented in Figure A10, Figure A11 and Figure A12. The youngest age groups place the highest weight on the author. The 18–24 to 30–34 age groups have the highest levels of “great deal” and “a lot” responses (though the 40–44 age group has more combined “great deal” and “a lot” but not “great deal” responses alone). A related trend exists of giving more weight to authors at higher educational levels. This trend is present throughout all educational levels, with limited fluctuation, for “great deal” responses and up to the master’s level for the combined “great deal” and “a lot” levels. No major differences are notable in the gender data.
The data in Figure A11 depicts respondents perception of others’ focus on the importance of articles’ authors. Few patterns in this data are notable. The age level data shows fluctuation and no clear trends. The education-level data largely mirrors the self-perception data. Interestingly, associate’s degree holders reported higher concern for an article’s author than those that have completed high school and those with some college completed and bachelor’s degrees; however, they reported others having less interest in it. Like the self-perception data, females had less “a lot” responses and more “moderate” responses for others-perception and a slightly higher level of reporting no focus on the article’s author.
Figure A12 presents respondents’ perception of the ideal level of focus to place on articles’ authors in assessing their trustworthiness. The age group data shows a gradual rise in the combined “great deal” and “a lot” responses from the 18–24 to 55–59 age groups. Notably, the inverse of this pattern appears to be present in the “great deal” responses, meaning that the middle age groups have the highest “a lot” levels while the younger and older age groups have the highest “great deal” levels (40–44 is an exception to this).
A similar pattern exists with regards to the educational level data, with a gradual rise and then fall. Notably, the two ends (some high school and doctorate holders) both have no individuals giving no focus to the author and thus have the highest combined “great deal”/“a lot”/”moderate”/”little” combined responses. They both also have the highest “great deal”/“a lot”/”moderate” response levels. No notable differences are present in the gender data.
4.5. Article Sponsors
Next, focus turns to the impact of article sponsors on respondents’ perception of article trustworthiness and credibility. Figure A13, Figure A14 and Figure A15 present data related to this topic.
In assessing the age range data, no clear pattern or trends are present. In assessing the educational level data, there is a general growing weight given to articles’ sponsors with increasing educational level, for the “great deal” and “a lot” levels, starting at the some high school educational level and reaching the master’s degree level. This trend is also present with the combined “great deal”, “a lot” and “moderate” response levels through all educational levels. The gender data is relatively close to parity.
Figure A14 shows respondents’ perception of the weight that others place on the article sponsor. Similar to the self-perception data, the others-perception data shows no clear pattern related to age groups. The pattern of growing interest in article sponsors with advanced education level is apparent at both the combined “great deal” and “a lot” level and the combined “great deal” / “a lot” / “moderate” level. Only slight differences again exist between the male and female respondents, in Figure A14c.
Finally, Figure A15 presents respondents’ perception of the ideal level of focus to place on article sponsors. Again, no clear pattern exists in the age group data. The pattern of growing interest with advanced education is again present and most notable at the combined “great deal” and “a lot” level. Once again, the genders are close to parity.
4.6. Author’s Political Alignment
Now, focus turns to the impact of the author’s political alignment on respondents’ perception of article credibility. Data related to this topic is presented in Figure A16, Figure A17 and Figure A18.
Figure A16a shows a general trend where the level of weight placed on the author’s political alignment increases from the 18–24 age group, peaking at the 40–44 age group, before declining until the 55–59 age group, for the combined “great deal” and “a lot” levels. It climbs again at the 60–64 and 64 and older groups. A trend of growth in focus with higher education level is shown between the some high school and master’s degree levels for the combined “great deal” and “lot levels”. The doctorate holders have a lower level of focus than the master’s degree holders. Males also, notably, give more credence to the author’s political alignment than females.
Figure A17 shows respondents’ perceptions of others’ focus on the author of an article’s political alignment. The age series data shows two general upward growth trends in the combined “great deal” and “lot data”. The first trend starts in the 18–24 age group and ends at 44. The second starts in the 45–49 age group and continues to the 65 and older group, with a demonstrable drop between the 40–44 and 45–49 age groups. The educational level trend present in the self-perception data is also present in the others-perception data, in the combined “great deal” and “a lot” level data, with growth from the some high school level up through the doctorate holder levels. In the gender data, the greater self-perception of males’ focus on authors’ political alignment has a corresponding believed greater focus of others, at the “great deal” and “a lot” levels. However, the gender difference is corrected in the “moderate” level and the two genders have similar “little” and “none” response levels.
Figure A18 presents respondents’ perspectives of the ideal level of focus to pay to articles’ authors’ political alignment. Two growth trends, with a decline between them, are present. A less pronounced trend is also present of growing ideal focus on authors’ political affiliations with increasing educational level, from the some high school educational level up until the master’s degree level. There is marginally more ideal focus on author’s political affiliations amongst males at the combined “great deal” and “a lot” level; however, the “moderate” level has slightly less male responses and the “little” and “none” levels are the same for both genders.
4.7. Publisher’s Political Alignment
Next, the perception of the publisher’s political alignment’s impact on article trustworthiness is considered. Figure A19, Figure A20 and Figure A21 present data related to this topic.
Figure A19a shows two growth trends, where older age correlates with more focus on publisher’s political alignment. A growth trend is also present, associated with increasing educational level. It starts at the some high school level and continues up to the master’s degree level for the “great deal” and “a lot” levels. There is also a notably higher level of focus on article publishers’ political alignment amongst male respondents at all levels.
Figure A20 presents respondents’ beliefs about the level of focus that others place on article publishers’ political alignment. Here, only a trend between the 55–59 and 65 and above age groups is notable. A trend of increasing focus is present in the educational level data from the some high school level to master’s degree level. Doctoral degree holders have a notably lower level of focus than master’s level respondents (and the second lowest overall). Finally, the greater focus amongst males self-perception is also present amongst males perceptions of other’s focus on article publishers’ political alignment; however, it is not as pronounced of a difference.
Figure A21 presents respondents’ perspectives regarding the ideal level of focus to place on the publisher’s political alignment. No clear trend is present in the age group data. A less pronounced version of the education level-associated trend is present. It is notable that, across most educational attainment levels for the “great deal” and “a lot” of focus levels, the ideal level of focus is less than the focus reported for self-perception and others-perception, with two exceptions. Notably, more focus is desired by the some high school group and the doctorate holders group has approximately same level of focus as ideal in both their self- and others-perception responses. Finally, the gender data shows that more males than females see a “great deal” of focus as ideal. However, the difference becomes less notable at lower levels of concern.
4.8. Sponsor’s Political Alginment
Focus now turns to the impact of articles’ sponsors’ political alignment. Data related to this topic is presented in Figure A22, Figure A23 and Figure A24.
The age group data presented in Figure A22a shows no clear trends. The educational level data shows a general increase in the level of focus placed on articles’ sponsors’ political alignment along with education level, from some high school to doctoral degree holders at the combined “great deal” and “a lot” levels. The gender-based data shows a greater focus among male respondents on articles’ sponsors’ political alignment, as compared to female respondents.
Figure A23 presents the respondents’ beliefs regarding others’ perspectives as to the importance of articles’ sponsors’ political alignment in assessing article trustworthiness. Like with the self-perspective data, no clear trends are present in the age group data. There is a positive correlation between higher levels of education and additional focus on articles’ sponsors’ political alignment. There is, also similarly, a greater level of focus on articles’ sponsors’ political alignment attributed to others by male respondents.
Figure A24 presents what respondents believe to be the ideal level of impact of articles’ sponsors’ political alignment on perceptions of article trustworthiness. Like with the self-perception and others-perception data, no clear trends are present in the age group data. There is a similar trend of a positive correlation between higher level of education and higher ideal levels of focus on articles’ sponsors’ political alignment. The trend of males having more focus on articles’ sponsors’ political alignment is also present in the ideal data.
5. Analysis of the Impact of Article Characteristics on Perceptions of Content Trustworthiness
This section analyzes the impact of four article characteristics on Americans’ perceptions of online article trustworthiness. The impact of the quantity of opinion statements, article virality, article controversy level and article reading level are considered.
5.1. Opinion Statement Quantity
In analyzing the data regarding opinion quantity (in Figure A25a), no clear patterns are visible. Conversely, the education level analysis shows much less variability and a slight positive correlation between additional education and focus on opinion statements when assessing content trustworthiness. Figure A25c shows that there is slightly more interest amongst females, than males, in the quantity of opinion statements when assessing trustworthiness.
Figure A26 presents Americans’ perceptions of others’ focus on the quantity of opinion statements in an article when assessing its credibility. A small downward trend is visible in the age group data, albeit with fluctuations, where older age groups are less concerned about the quantity of opinion statements than those in younger groups. No significant trends are notable in the education associated data. There is also no pronounced difference in males versus females.
Figure A27 presents data regarding what Americans think the ideal level of focus on the number of opinion statements in an article should be for assessing article credibility. Again, in the age group data, no clear pattern is present. In comparing Figure A25a, Figure A26a and Figure A27a, the age groups have appreciable correlation across the three types of responses. The correlation (being higher or lower, as compared to adjacent groups) is present across most levels for the self-perception and others-perception data. However, it is only prevalent across the higher age groups, when comparing the self- and others-perception data to the ideal-perception data.
There is, again, no notable trend across educational levels for the ideal data. The ideal level of focus on opinion statements, across educational levels, seems to be closer to the self-perception than the others-perception data. Notably, many age groups indicate more others-perception than ideal perception. Finally, the differences between the genders are minimal, with slightly more females using opinion statement quantity when assessing news trustworthiness.
5.2. Virality
Now, focus turns to the impact of article virality. Data related to this topic is presented in Figure A28, Figure A29 and Figure A30.
Figure A28 shows the impact of the virality of an article on its perceived trustworthiness. There are no clear correlations between focus on virality in trustworthiness assessment and age. There is a notable negative correlation between focus on this factor and educational attainment, with 50% of some high school respondents indicating a “great deal” or “a lot” of focus on this and under 30% of doctorate holder indicating similar focus. There is also significantly more interest among females in article virality as an assessment criteria.
Figure A29 indicates the level of focus that Americans think others place on article virality in assessing credibility. Two peaks (at 25–29 and 60–64) are visible with a depression between them. The educational attainment data shows a positive correlation between educational attainment and focus on virality on the lower-education end of the spectrum. A second positive correlation is shown in the range between associates, bachelors and master’s degree holders, when considering the combined “great deal” and “a lot” data. Females believe others have moderately more interest in article virality than males, with only about two-thirds of the level of “none” responses of male respondents.
Finally, Figure A30 shows the Americans’ believed-ideal level of virality impact on article credibility assessment. Like with the self-perception data, the ideal-perception data for age groups has no clear patterns. The educational attainment data shows a negative correlation between higher education level and interest in using article virality for assessment purposes. This mirrors the self-perception data and is significantly different than the others-perception data. Like with the self- and other-perception data, females evidence greater interest in article virality in assessing its credibility. Notably, 30% of males indicate that virality should have no impact on this assessment, which is higher than the self-perception and others-perception data, showing that some males feel that they and others are giving an undesirable level of focus to this criteria.
5.3. Controversy Level
Next, focus turns to the impact of the controversy level of the article on its perceived trustworthiness. Data related to this is presented in Figure A31, Figure A32 and Figure A33.
No clear association is visible between the article trustworthiness and age, beyond the 35–39 age group. Between the 18-24 and 35-39 age groups, the level of “great deal” responses consistently declines with age; however, the number of “a lot” responses nearly perfectly compensates for this drop, making the combined “great deal” and “a lot” response levels similar through these age groups. There is minimal variation between the impact of controversy level on article trustworthiness across education levels. Males and females have very close response levels; however, slightly more interest about controversy level in article assessment is shown by females in Figure A31c.
Figure A32 shows the perceptions of Americans about the importance that others place on an article’s level of controversy in assessing its trustworthiness. A small decline in controversy level importance is shown, for the “great deal” and “a lot” levels between 24–29 and 55–59 age groups. Notably, the 60–64 and 65 and older groups are both higher than the 55–59 group and the 18–24 group has one of the lowest levels of focus on article controversy level.
Among the lower educational attainment levels there is an association between greater education and greater focus on article controversy level in determining trustworthiness. Comparing male and female responses, in Figure A32c, no notable gender differences are apparent.
Finally, Figure A33 shows the perceived ideal level of focus on article controversy as part of article trustworthiness assessment. In the age level data, there are (again) minimal patterns. A positive correlation between age and increased ideal focus is shown between the 18–24 and 30–34 age groups and, separately, between the 35–39 and 45–49 age groups. The data related to educational attainment also does not paint a clear picture, with a slight upward trend amongst the some high school and associates degree educational levels, at the “great deal” and combined “great deal” and “a lot” levels. However, this is also a downward trend, at the “moderate” level between these same educational levels. The data also shows more ideal interest in controversy level amongst female respondents.
5.4. Reading Level
Finally, focus turns to the impact of the article’s reading level on respondents’ perception of article trust. This data is presented in Figure A34, Figure A35 and Figure A36.
Figure A34a shows significant variability by age level and no clear trends. Figure A34b shows two positive correlating trends between greater education and greater focus on reading level. No significant difference exists between male and females, with regards to responses to this question, as shown by Figure A34c.
Figure A35 shows Americans’ perceptions of others’ focus on article reading level in assessing article trustworthiness. Again, with the age group data, significant variation and no clear trends are present. There are also no notable trends in the education level data other than a decline shown in the combined “great deal”, “a lot” and “moderate” level between bachelor’s, master’s and doctoral degree holders. Once again, no notable difference exists between male and female responses for this question.
Finally, Figure A36 shows the perceived ideal levels of focus on article reading level as part of trustworthiness assessment. The age data, again, shows no clear trends. The educational level data shows a positive association between additional education and focus between the some high school and some college levels. This is present at the combined “great deal” and “a lot” as well as the combined “great deal”, “a lot” and “moderate” levels. Finally, there is again no notable difference between gender responses for this question, as was the case with Figure A33c and Figure A34c.
6. Implications of Analysis
The data presented in Section 4 and Section 5 contains numerous trends that illustrate how individuals from different demographic backgrounds make their news content consumption decisions. These trends may inform the construction of effective labeling mechanisms for news content. All three variables of analysis (age, education and gender) were shown to have multiple correlations with added or reduced emphasis for different article characteristics. For the data presented in Section 4 (and which is summarized in Table 4), twelve characteristics show differences in perceived importance based on respondents’ age, twenty-three show differences in based on respondents’ education level and fifteen show differences based on respondents’ gender.
While the implications of all of these comparisons are potentially important to determining how to best serve their respective demographic groups, a few serve as notable examples. The data showed, as illustrated in Figure 2, that males place more weight on the publisher than do females. Conversely, as shown in Figure 3, females were shown to place more weight on the date of publication than did males. These differences would potentially inform what details would be most relevant to different users (if their own personal preferences were not known) and may inform what information is presented, as well as the order that it is presented in. Similarly, the importance of the publication date was shown (in the data presented in Figure 4) to decline with respondents’ age, while the importance of an author’s and publisher’s political alignment were shown to increase with education level (see Figure 5 and Figure 6). It is also notable that both the self (Figure 6) and ideal (shown in Figure 7) levels for author’s political alignment show the same pattern, indicating that respondents’ aspirations and actual actions are aligned. This pattern is present for several article characteristics.
It is also notable that the trends present are not all the same. For example, factors that increase and decrease with age and education were both identified. Some factors were shown to be similar between males and females, while others were shown to be given additional weight by males or females. Given this, it is critical to incorporate demographic-specific article information when labeling online content for combatting fake news. Furthermore, it is also key to understand that the information that will be best to present may not be a combination of key information identified for each demographic group considered. Rather, it would be prudent to provide the most relevant subset of information to each individual, which can be partially determined by their demographic group memberships.
Table 5 presents similar data as Table 4 for the four article characteristics (quantity of opinion statements, virality, controversy level and reading level). Again, age, education and gender-correlated levels of focus were present. Four characteristics showed an interest level correlation with age. Eight showed an interest level correlation with education and seven showed an interest level correlation with gender. Even within this smaller number of factors, those with both positive and negative correlations were demonstrated. This further emphasizes the potential benefits of providing demographically-targeted information to combat the spread of fake news. This data also facilitates, the comparison of respondents’ perceptions of their and others’ actions and their aspirations. Figure 8 and Figure 9 illustrate, for example, how females evidence higher interest in article virality and also consider this metric to be ideally focused on, to a greater extent than males.
The differences between individuals’ self-perception of focus, perception of others’ focus and perception of the ideal level of focus on article characteristics and attributes were also considered and are presented in Table 6 and Table 7. Once again, considerable demographic differences were shown. For the article attribute data (summarized in Table 6), twenty-two of the comparisons (between self and others, self and ideal and others and ideal) had an age-correlated trend. Thirteen had an education level correlated difference and twenty-two had a gender-correlated difference. The attribute data, shown in Table 7, had ten age-correlated differences, seven education level correlated ones and 11 gender-correlated differences.
Two examples are illustrative. Figure 10 and Figure 11 show how respondents have a lower aspiration to consider authors than actually do. This indicates that Americans, collectively, believe that they don’t give enough weight to article authors. Conversely, more respondents indicated focus (as shown in Figure 12 and Figure 13) to an article’s publisher’s political alignment, indicating that Americans believe that they give—collectively—too much focus to this article attribute.
These comparisons are of particular interest as respondents’ perspective regarding what is ideal and their comparative practices may indicate areas where they have motivation to change. Similarly, perceived differences between respondents own perceptions and their perceptions of others’ beliefs is informative both as to how others may react to data as well as to understanding where respondents see themselves relative to others in their social circles. Comparing respondents’ perceptions of others’ focuses on different characteristics and what they perceive as an ideal level of focus can be similarly insightful.
7. Conclusions and Future Work
This paper has discussed the difficulties and dangers presented by deceptive online content which is commonly known as “fake news”. To attempt to understand why deceptive content spreads and what can be done to prevent its spread, without requiring a solution such as government censorship of content, it has analyzed the different factors that individuals consider when making news consumption decisions. Specifically, it has considered the impact of different online article characteristics and qualities on trustworthiness perception. Questions have targeted three different perceptual filters: perception of self, perception of others, and perception of the ideal. This allows for comparison of perceptions of “what is” and “what ought to be.”
As different individuals may give different levels of weight to different characteristics and qualities, this paper has evaluated the impact of the different characteristics and qualities in terms of the key demographics of age, education level and gender. In doing so, it has shown that, while some characteristics and qualities do not correlate with one or more of these demographics, this is not typical. For every article trait discussed, at least one demographic correlation was identified with these three demographics.
Understanding what individuals from different backgrounds perceive as important to their news consumption trust decision making is key to ensuring that they are presented with the information that is most relevant to them. This data and analysis, thus, informs efforts to provide online news content consumers, and those that may seek to further share or otherwise use online content, with information that will help them identify deceptive content and take appropriate action, based upon knowledge of what is valued for these purposes by those with similar traits to them.
Identifying the most important information to present to users may be key to developing effective content labeling systems. This knowledge can be used to maximize the use of the available screen space and the potential effectiveness of the label. By developing and evaluating the most effective labels, the efficacy of the labeling paradigm itself can be effectively evaluated to determine if labels in general and specific types of labels are effective at preventing the spread and unintended consumption of fake news content.
Notably, a key limitation of this study is that it is based on respondents predictions of how they would behave in the future, recollections of how they have behaved in the past and perceptions of others’ behaviors. Because of this, actual actions that individuals take may differ from these predictions, recollections and perceptions.
Given the foregoing, future work will seek to explore how to best present the demographically-identified relevant information to users. It will also seek to understand if combinations of these and other demographics can be used to better identify what trustworthiness decision information is most valued by users and, thus, provide them with the information that they find most relevant presented in a manner that focuses on the information that the user will find most important. Assessing individuals’ actual decisions when making content consumption and label use decisions is also a planned area of future work.
More broadly, this data and analysis also serves to inform a societal conversation regarding preparing individuals to be alert to deceptive content to prevent negative outcomes, such as those discussed in Section 2. Understanding the differences between how individuals of different ages, genders and education levels value different factors in this decision-making helps understand how societal changes over time, education and other socialization factors impact fake news awareness and decision-making. This can be used to drive targeted education initiatives and to define future research efforts.
Author Contributions
Conceptualization, J.S. and M.S.; methodology, J.S. and M.S.; resources, J.S.; writing—original draft preparation, J.S. and M.S.; writing—review and editing, J.S., M.S. and B.F.; project administration, J.S.; funding acquisition, J.S.; visualization, B.F. All authors have read and agreed to the published version of the manuscript.
Funding
Partial support for this work was provided by the NDSU Challey Institute for Global Innovation and Growth. Funding for the article publication charge was provided by the Hayek Fund for Scholars at the Institute for Human Studies at George Mason University.
Institutional Review Board Statement
The study was conducted according to the guidelines of the Declaration of Helsinki, and approved by the Institutional Review Board of North Dakota State University (protocol IRB0003884, approved 23 September 2021).
Informed Consent Statement
Informed consent was obtained from all subjects involved in the study.
Data Availability Statement
A data release, via a data journal publication, is planned once initial analysis of all data is complete.
Acknowledgments
Thanks are given to Jade Kanemitsu from Qualtrics International Inc. for the management of the data collection process. Thanks are also given to Ryan Suttle, Scott Hogan and Rachel Aumaugher who developed many of the questions that were used in this study during their earlier work (which was presented in [62]).
Conflicts of Interest
The authors declare no conflict of interest. The funders had no role in the design of the study; in the collection, analyses, or interpretation of data; in the writing of the manuscript, or in the decision to publish the results.
Appendix A
This appendix includes 36 figures (numbered Figure A1, Figure A2, Figure A3, Figure A4, Figure A5, Figure A6, Figure A7, Figure A8, Figure A9, Figure A10, Figure A11, Figure A12, Figure A13, Figure A14, Figure A15, Figure A16, Figure A17, Figure A18, Figure A19, Figure A20, Figure A21, Figure A22, Figure A23, Figure A24, Figure A25, Figure A26, Figure A27, Figure A28, Figure A29, Figure A30, Figure A31, Figure A32, Figure A33, Figure A34, Figure A35 and Figure A36) which present data which is discussed in Section 4 and Section 5 of this paper. Each figure includes the data presented by age, educational level and gender. Figures for each metric are included that characterize respondents’ own actions and beliefs, their perception of others’ actions and beliefs and what they consider to be ideal.
Figure A1.
Impact of article title on respondents’ perspective of article trustworthiness and credibility by: (a) age (top), (b) educational level (middle) and (c) gender (bottom).
Figure A1.
Impact of article title on respondents’ perspective of article trustworthiness and credibility by: (a) age (top), (b) educational level (middle) and (c) gender (bottom).

Figure A2.
Impact of article title on others’ perspective of article trustworthiness and credibility by: (a) age (top), (b) educational level (middle) and (c) gender (bottom).
Figure A2.
Impact of article title on others’ perspective of article trustworthiness and credibility by: (a) age (top), (b) educational level (middle) and (c) gender (bottom).

Figure A3.
Ideal impact of article title on peoples’ perspective of article trustworthiness and credibility by: (a) age (top), (b) educational level (middle) and (c) gender (bottom).
Figure A3.
Ideal impact of article title on peoples’ perspective of article trustworthiness and credibility by: (a) age (top), (b) educational level (middle) and (c) gender (bottom).

Figure A4.
Impact of publisher on respondents’ perspective of article trustworthiness and credibility by: (a) age (top), (b) educational level (middle) and (c) gender (bottom).
Figure A4.
Impact of publisher on respondents’ perspective of article trustworthiness and credibility by: (a) age (top), (b) educational level (middle) and (c) gender (bottom).

Figure A5.
Impact of publisher on others’ perspective of article trustworthiness and credibility by: (a) age (top), (b) educational level (middle) and (c) gender (bottom).
Figure A5.
Impact of publisher on others’ perspective of article trustworthiness and credibility by: (a) age (top), (b) educational level (middle) and (c) gender (bottom).

Figure A6.
Ideal impact of publisher on peoples’ perspective of article trustworthiness and credibility by: (a) age (top), (b) educational level (middle) and (c) gender (bottom).
Figure A6.
Ideal impact of publisher on peoples’ perspective of article trustworthiness and credibility by: (a) age (top), (b) educational level (middle) and (c) gender (bottom).

Figure A7.
Impact of publication date on respondents’ perspective of article trustworthiness and credibility by: (a) age (top), (b) educational level (middle) and (c) gender (bottom).
Figure A7.
Impact of publication date on respondents’ perspective of article trustworthiness and credibility by: (a) age (top), (b) educational level (middle) and (c) gender (bottom).

Figure A8.
Impact of publication date on others’ perspective of article trustworthiness and credibility by: (a) age (top), (b) educational level (middle) and (c) gender (bottom).
Figure A8.
Impact of publication date on others’ perspective of article trustworthiness and credibility by: (a) age (top), (b) educational level (middle) and (c) gender (bottom).

Figure A9.
Ideal impact of publication date on peoples’ perspective of article trustworthiness and credibility by: (a) age (top), (b) educational level (middle) and (c) gender (bottom).
Figure A9.
Ideal impact of publication date on peoples’ perspective of article trustworthiness and credibility by: (a) age (top), (b) educational level (middle) and (c) gender (bottom).

Figure A10.
Impact of article author on respondents’ perspective of article trustworthiness and credibility by: (a) age (top), (b) educational level (middle) and (c) gender (bottom).
Figure A10.
Impact of article author on respondents’ perspective of article trustworthiness and credibility by: (a) age (top), (b) educational level (middle) and (c) gender (bottom).

Figure A11.
Impact of article author on others’ perspective of article trustworthiness and credibility by: (a) age (top), (b) educational level (middle) and (c) gender (bottom).
Figure A11.
Impact of article author on others’ perspective of article trustworthiness and credibility by: (a) age (top), (b) educational level (middle) and (c) gender (bottom).

Figure A12.
Ideal impact of article author on peoples’ perspective of article trustworthiness and credibility by: (a) age (top), (b) educational level (middle) and (c) gender (bottom).
Figure A12.
Ideal impact of article author on peoples’ perspective of article trustworthiness and credibility by: (a) age (top), (b) educational level (middle) and (c) gender (bottom).

Figure A13.
Impact of article sponsors on respondents’ perspective of article trustworthiness and credibility by: (a) age (top), (b) educational level (middle) and (c) gender (bottom).
Figure A13.
Impact of article sponsors on respondents’ perspective of article trustworthiness and credibility by: (a) age (top), (b) educational level (middle) and (c) gender (bottom).

Figure A14.
Impact of article sponsors on others’ perspective of article trustworthiness and credibility by: (a) age (top), (b) educational level (middle) and (c) gender (bottom).
Figure A14.
Impact of article sponsors on others’ perspective of article trustworthiness and credibility by: (a) age (top), (b) educational level (middle) and (c) gender (bottom).

Figure A15.
Ideal impact of article sponsors on peoples’ perspective of article trustworthiness and credibility by: (a) age (top), (b) educational level (middle) and (c) gender (bottom).
Figure A15.
Ideal impact of article sponsors on peoples’ perspective of article trustworthiness and credibility by: (a) age (top), (b) educational level (middle) and (c) gender (bottom).

Figure A16.
Impact of author’s political alignment on respondents’ perspective of article trustworthiness and credibility by: (a) age (top), (b) educational level (middle) and (c) gender (bottom).
Figure A16.
Impact of author’s political alignment on respondents’ perspective of article trustworthiness and credibility by: (a) age (top), (b) educational level (middle) and (c) gender (bottom).

Figure A17.
Impact of author’s political alignment on others’ perspective of article trustworthiness and credibility by: (a) age (top), (b) educational level (middle) and (c) gender (bottom).
Figure A17.
Impact of author’s political alignment on others’ perspective of article trustworthiness and credibility by: (a) age (top), (b) educational level (middle) and (c) gender (bottom).

Figure A18.
Ideal impact of author’s political alignment on peoples’ perspective of article trustworthiness and credibility by: (a) age (top), (b) educational level (middle) and (c) gender (bottom).
Figure A18.
Ideal impact of author’s political alignment on peoples’ perspective of article trustworthiness and credibility by: (a) age (top), (b) educational level (middle) and (c) gender (bottom).

Figure A19.
Impact of publisher’s political alignment on respondents’ perspective of article trustworthiness and credibility by: (a) age (top), (b) educational level (middle) and (c) gender (bottom).
Figure A19.
Impact of publisher’s political alignment on respondents’ perspective of article trustworthiness and credibility by: (a) age (top), (b) educational level (middle) and (c) gender (bottom).

Figure A20.
Impact of publisher’s political alignment on others’ perspective of article trustworthiness and credibility by: (a) age (top), (b) educational level (middle) and (c) gender (bottom).
Figure A20.
Impact of publisher’s political alignment on others’ perspective of article trustworthiness and credibility by: (a) age (top), (b) educational level (middle) and (c) gender (bottom).

Figure A21.
Ideal impact of publisher’s political alignment on peoples’ perspective of article trustworthiness and credibility by: (a) age (top), (b) educational level (middle) and (c) gender (bottom).
Figure A21.
Ideal impact of publisher’s political alignment on peoples’ perspective of article trustworthiness and credibility by: (a) age (top), (b) educational level (middle) and (c) gender (bottom).

Figure A22.
Impact of sponsor’s political alignment on respondents’ perspective of article trustworthiness and credibility by: (a) age (top), (b) educational level (middle) and (c) gender (bottom).
Figure A22.
Impact of sponsor’s political alignment on respondents’ perspective of article trustworthiness and credibility by: (a) age (top), (b) educational level (middle) and (c) gender (bottom).

Figure A23.
Impact of sponsor’s political alignment on others’ perspective of article trustworthiness and credibility by: (a) age (top), (b) educational level (middle) and (c) gender (bottom).
Figure A23.
Impact of sponsor’s political alignment on others’ perspective of article trustworthiness and credibility by: (a) age (top), (b) educational level (middle) and (c) gender (bottom).

Figure A24.
Ideal impact of sponsor’s political alignment on peoples’ perspective of article trustworthiness and credibility by: (a) age (top), (b) educational level (middle) and (c) gender (bottom).
Figure A24.
Ideal impact of sponsor’s political alignment on peoples’ perspective of article trustworthiness and credibility by: (a) age (top), (b) educational level (middle) and (c) gender (bottom).

Figure A25.
Impact of opinion statement quantity on respondents’ perspective of article trustworthiness and credibility by: (a) age (top), (b) educational level (middle) and (c) gender (bottom).
Figure A25.
Impact of opinion statement quantity on respondents’ perspective of article trustworthiness and credibility by: (a) age (top), (b) educational level (middle) and (c) gender (bottom).

Figure A26.
Impact of opinion statement quantity on others’ perspective of article trustworthiness and credibility by: (a) age (top), (b) educational level (middle) and (c) gender (bottom).
Figure A26.
Impact of opinion statement quantity on others’ perspective of article trustworthiness and credibility by: (a) age (top), (b) educational level (middle) and (c) gender (bottom).

Figure A27.
Ideal impact of opinion statement quantity on peoples’ perspective of article trustworthiness and credibility by: (a) age (top), (b) educational level (middle) and (c) gender (bottom).
Figure A27.
Ideal impact of opinion statement quantity on peoples’ perspective of article trustworthiness and credibility by: (a) age (top), (b) educational level (middle) and (c) gender (bottom).

Figure A28.
Impact of article virality on respondents’ perspective of article trustworthiness and credibility by: (a) age (top), (b) educational level (middle) and (c) gender (bottom).
Figure A28.
Impact of article virality on respondents’ perspective of article trustworthiness and credibility by: (a) age (top), (b) educational level (middle) and (c) gender (bottom).

Figure A29.
Impact of article virality on others’ perspective of article trustworthiness and credibility by: (a) age (top), (b) educational level (middle) and (c) gender (bottom).
Figure A29.
Impact of article virality on others’ perspective of article trustworthiness and credibility by: (a) age (top), (b) educational level (middle) and (c) gender (bottom).

Figure A30.
Ideal impact of article virality on peoples’ perspective of article trustworthiness and credibility by: (a) age (top), (b) educational level (middle) and (c) gender (bottom).
Figure A30.
Ideal impact of article virality on peoples’ perspective of article trustworthiness and credibility by: (a) age (top), (b) educational level (middle) and (c) gender (bottom).

Figure A31.
Impact of article controversy level on respondents’ perspective of article trustworthiness and credibility by: (a) age (top), (b) educational level (middle) and (c) gender (bottom).
Figure A31.
Impact of article controversy level on respondents’ perspective of article trustworthiness and credibility by: (a) age (top), (b) educational level (middle) and (c) gender (bottom).

Figure A32.
Impact of article controversy level on others’ perspective of article trustworthiness and credibility by: (a) age (top), (b) educational level (middle) and (c) gender (bottom).
Figure A32.
Impact of article controversy level on others’ perspective of article trustworthiness and credibility by: (a) age (top), (b) educational level (middle) and (c) gender (bottom).

Figure A33.
Ideal impact of article controversy level on peoples’ perspective of article trustworthiness and credibility by: (a) age (top), (b) educational level (middle) and (c) gender (bottom).
Figure A33.
Ideal impact of article controversy level on peoples’ perspective of article trustworthiness and credibility by: (a) age (top), (b) educational level (middle) and (c) gender (bottom).

Figure A34.
Impact of article reading level on respondents’ perspective of article trustworthiness and credibility by: (a) age (top), (b) educational level (middle) and (c) gender (bottom).
Figure A34.
Impact of article reading level on respondents’ perspective of article trustworthiness and credibility by: (a) age (top), (b) educational level (middle) and (c) gender (bottom).

Figure A35.
Impact of article reading level on others’ perspective of article trustworthiness and credibility by: (a) age (top), (b) educational level (middle) and (c) gender (bottom).
Figure A35.
Impact of article reading level on others’ perspective of article trustworthiness and credibility by: (a) age (top), (b) educational level (middle) and (c) gender (bottom).

Figure A36.
Ideal impact of article reading level on peoples’ perspective of article trustworthiness and credibility by: (a) age (top), (b) educational level (middle) and (c) gender (bottom).
Figure A36.
Ideal impact of article reading level on peoples’ perspective of article trustworthiness and credibility by: (a) age (top), (b) educational level (middle) and (c) gender (bottom).

References
- Keyes, R. The Post-Truth Era: Dishonesty and Deception in Contemporary Life; St. Martin’s Press: New York, NY, USA, 2004. [Google Scholar]
- Dorling, D. Brexit: The decision of a divided country. BMJ 2016, 354, i3697. [Google Scholar] [CrossRef] [PubMed] [Green Version]
- Bastos, M.T.; Mercea, D. The Brexit Botnet and User-Generated Hyperpartisan News. Soc. Sci. Comput. Rev. 2017, 37, 38–54. [Google Scholar] [CrossRef] [Green Version]
- McGaughey, E. Could Brexit be Void? King’s Law J. 2018, 29, 331–343. [Google Scholar] [CrossRef]
- Allcott, H.; Gentzkow, M. Social Media and Fake News in the 2016 Election. J. Econ. Perspect. 2017, 31, 211–236. [Google Scholar] [CrossRef] [Green Version]
- Grinberg, N.; Joseph, K.; Friedland, L.; Swire-Thompson, B.; Lazer, D. Fake news on Twitter during the 2016 U.S. presidential election. Science 2019, 363, 374–378. [Google Scholar] [CrossRef] [PubMed]
- Bovet, A.; Makse, H.A. Influence of fake news in Twitter during the 2016 US presidential election. Nat. Commun. 2019, 10, 7. [Google Scholar] [CrossRef]
- Cunha, E.; Magno, G.; Caetano, J.; Teixeira, D.; Almeida, V. Fake News as We Feel It: Perception and Conceptualization of the Term “Fake News” in the Media. Int. Conf. Soc. Inform. 2018, 11185, 151–166. [Google Scholar] [CrossRef] [Green Version]
- Egelhofer, J.L.; Aaldering, L.; Eberl, J.M.; Galyga, S.; Lecheler, S. From Novelty to Normalization? How Journalists Use the Term “Fake News” in their Reporting. J. Stud. 2020, 21, 1323–1343. [Google Scholar] [CrossRef]
- van der Linden, S.; Panagopoulos, C.; Roozenbeek, J. You are fake news: Political bias in perceptions of fake news. Media Cult. Soc. 2020, 42, 460–470. [Google Scholar] [CrossRef]
- Tong, C.; Gill, H.; Li, J.; Valenzuela, S.; Rojas, H. “Fake News Is Anything They Say!”—Conceptualization and Weaponization of Fake News among the American Public. Mass Commun. Soc. 2020, 23, 755–778. [Google Scholar] [CrossRef]
- Lee, T. The global rise of “fake news” and the threat to democratic elections in the USA. Public Adm. Policy 2019, 22, 15–24. [Google Scholar] [CrossRef] [Green Version]
- Silva, R.M.; Santos, R.L.S.; Almeida, T.A.; Pardo, T.A.S. Towards automatically filtering fake news in Portuguese. Expert Syst. Appl. 2020, 146, 113199. [Google Scholar] [CrossRef]
- Collins, B.; Hoang, D.T.; Nguyen, N.T.; Hwang, D. Trends in combating fake news on social media—A survey. J. Inf. Telecommun. 2020, 5, 247–266. [Google Scholar] [CrossRef]
- Griffiths, J. The Great Firewall of China: How to Build and Control an Alternative Version of the Internet, 2nd ed.; Zed Books: London, UK, 2021. [Google Scholar]
- Spradling, M.; Straub, J.; Strong, J. Protection from ‘Fake News’: The Need for Descriptive Factual Labeling for Online Content. Futur. Internet 2021, 13, 142. [Google Scholar] [CrossRef]
- Lazer, D.M.J.; Baum, M.A.; Benkler, Y.; Berinsky, A.J.; Greenhill, K.M.; Menczer, F.; Metzger, M.J.; Nyhan, B.; Pennycook, G.; Rothschild, D.; et al. The science of fake news. Science 2018, 359, 1094–1096. [Google Scholar] [CrossRef] [PubMed]
- Fuhr, N.; Giachanou, A.; Grefenstette, G.; Gurevych, I.; Hanselowski, A.; Jarvelin, K.; Jones, R.; Liu, Y.; Mothe, J.; Nejdl, W.; et al. An Information Nutritional Label for Online Documents. ACM SIGIR Forum 2018, 51, 46–66. [Google Scholar] [CrossRef] [Green Version]
- Higdon, N. Anatomy of Fake News; University of California Press: Berkeley, CA, USA, 2020. [Google Scholar]
- Ott, B. Some Good News about the News: 5 Reasons Why ‘Fake’ News is Better than Fox ‘News’. Flow 2005, 2, 7. [Google Scholar]
- Balmas, M. When Fake News Becomes Real: Combined Exposure to Multiple News Sources and Political Attitudes of Inefficacy, Alienation, and Cynicism. Communic. Res. 2014, 41, 430–454. [Google Scholar] [CrossRef]
- Clark, L.S.; Dierberg, J. Late-Night Comedy as a Source of Religion News. In The Oxford Handbook of Religion and the American News Media; Oxford Press: New York, NY, USA, 2012. [Google Scholar]
- Marimon, N. Shutting Down the Turbine: How the News Industry and News Aggregators can Coexist in a Post-Barclays v. theflyonthewall.com World. Fordham Intellect. Prop. Media Entertain. Law J. 2012, 23, 1441. [Google Scholar]
- Jones, L. All caught up in the kayfabe: Understanding and appreciating pro-wrestling. J. Philos. Sport 2019, 46, 276–291. [Google Scholar] [CrossRef]
- Saez-Trumper, D. Fake Tweet Buster: A Webtool to Identify Users Promoting Fake News on Twitter. In Proceedings of the HT’14, Santiago, Chile, 1–4 September 2014. [Google Scholar]
- Conroy, N.J.; Rubin, V.L.; Chen, Y. Automatic Deception Detection: Methods for Finding Fake News. In Proceedings of the ASIST, St. Louis, MO, USA, 6–10 October 2015. [Google Scholar]
- Khaldarova, I.; Pantti, M. Fake News: The narrative battle over the Ukrainian conflict. J. Pract. 2016, 10, 891–901. [Google Scholar] [CrossRef] [Green Version]
- Peters, J.W. Wielding Claims of ‘Fake News,’ Conservatives Take Aim at Mainstream Media; New York Times: New York, NY, USA, 2016. [Google Scholar]
- Momsen, K.; Ohndorf, M. Information avoidance, selective exposure, and fake (?) news: Theory and experimental evidence on green consumption. J. Econ. Psychol. 2022, 88, 102457. [Google Scholar] [CrossRef]
- Tandoc, E.C.; Lim, W.; Ling, R. Defining “Fake News” A typology of scholarly definitions. Digit. J. 2017, 6, 137–153. [Google Scholar] [CrossRef]
- Holcomb, J.; Gottfried, J.; Mitchell, A. News Use Across Social Media Platforms; Pew Research Center: Washington, DC, USA, 2013; Available online: https://www.pewresearch.org/journalism/2013/11/14/news-use-across-social-media-platforms/ (accessed on 23 March 2022).
- Gottfried, J.; Shearer, E. News Use Across Social Media Platforms 2016; Pew Research Center: Washington, DC, USA, 2016; Available online: https://www.pewresearch.org/journalism/2016/05/26/news-use-across-social-media-platforms-2016/ (accessed on 23 March 2022).
- Shearer, E.; Matsa, K.E. News Use Across Social Media Platforms 2018; Pew Research Center: Washington, DC, USA, 2018; Available online: https://www.pewresearch.org/journalism/2018/09/10/news-use-across-social-media-platforms-2018/ (accessed on 23 March 2022).
- Shearer, E.; Mitchell, A. News Use Across Social Media Platforms in 2020; Pew Research Center: Washington, DC, USA, 2020; Available online: https://www.pewresearch.org/journalism/2021/01/12/news-use-across-social-media-platforms-in-2020/ (accessed on 23 March 2022).
- Zhang, X.; Ghorbani, A.A. An overview of online fake news: Characterization, detection, and discussion. Inf. Process. Manag. 2020, 57, 102025. [Google Scholar] [CrossRef]
- Zhao, J.; Cao, N.; Wen, Z.; Song, Y.; Lin, Y.R.; Collins, C. #FluxFlow: Visual analysis of anomalous information spreading on social media. IEEE Trans. Vis. Comput. Graph. 2014, 20, 1773–1782. [Google Scholar] [CrossRef]
- Davis, C.A.; Varol, O.; Ferrara, E.; Flammini, A.; Menczer, F. BotOrNot: A System to Evaluate Social Bots. Available online: https://0-dl-acm-org.brum.beds.ac.uk/doi/abs/10.1145/2872518.2889302 (accessed on 29 January 2022).
- Shu, K.; Sliva, A.; Wang, S.; Tang, J.; Liu, H. Fake News Detection on Social Media: A Data Mining Perspective. ACM SIGKDD Explor. Newsl. 2017, 19, 22–36. [Google Scholar] [CrossRef]
- Monsees, L. ‘A war against truth’—Understanding the fake news controversy. Crit. Stud. Secur. 2020, 8, 116–129. [Google Scholar] [CrossRef]
- Albright, J. Welcome to the Era of Fake News. Media Commun. 2017, 5, 87–89. [Google Scholar] [CrossRef]
- Marchi, R. With Facebook, Blogs, and Fake News, Teens Reject Journalistic “Objectivity”. J. Commun. Inq. 2012, 36, 246–262. [Google Scholar] [CrossRef]
- Gillin, J. How Pizzagate Went from Fake News to a Real Problem for a D.C. Business. PolitiFact. 2016. Available online: https://www.politifact.com/article/2016/dec/05/how-pizzagate-went-fake-news-real-problem-dc-busin/ (accessed on 23 March 2022).
- Tandoc, E.C. The facts of fake news: A research review. Sociol. Compass 2019, 13, e12724. [Google Scholar] [CrossRef]
- Loos, E.; Ivan, L.; Leu, D. “Save the Pacific Northwest tree octopus”: A hoax revisited. Or: How vulnerable are school children to fake news? Inf. Learn. Sci. 2018, 119, 514–528. [Google Scholar] [CrossRef]
- Fatilua, J. Who trusts social media? Comput. Human Behav. 2018, 81, 303–315. [Google Scholar] [CrossRef]
- Wineburg, S.; McGrew, S. Why Students Can’t Google Their Way to the Truth. Available online: https://www.edweek.org/teaching-learning/opinion-why-students-cant-google-their-way-to-the-truth/2016/11 (accessed on 23 March 2022).
- Wineburg, S.; McGrew, S.; Breakstone, J.; Ortega, T. Evaluating Information: The Cornerstone of Civic Online Reasoning; Stanford Digital Repository: Stanford, CA, USA, 2016. [Google Scholar]
- Loos, E.; Nijenhuis, J. Consuming Fake News: A Matter of Age? The Perception of Political Fake News Stories in Facebook Ads. Int. Conf. Hum. Comput. Interact. 2020, 12209, 69–88. [Google Scholar] [CrossRef]
- Allen, J.; Howland, B.; Mobius, M.; Rothschild, D.; Watts, D.J. Evaluating the fake news problem at the scale of the information ecosystem. Sci. Adv. 2020, 6, eaay3539. [Google Scholar] [CrossRef] [PubMed] [Green Version]
- Richardson, N. Fake News and Journalism Education. Asia Pac. Media Educ. 2017, 27, 1–9. [Google Scholar] [CrossRef]
- Lees, C. Fake news: The global silencer. Index Censorsh. 2018, 47, 88–91. [Google Scholar] [CrossRef]
- Smith, F.A.; Trivax, G.; Zuehlke, D.A.; Lowinger, P.; Nghiem, T.L. Health Information during a Week of Television. N. Engl. J. Med. 1972, 286, 516–520. [Google Scholar] [CrossRef]
- Benkler, Y.; Faris, R.; Roberts, H. Network Propaganda: Manipulation, Disinformation, and Radicalization in American Politics; Oxford University Press: Oxford, UK, 2018. [Google Scholar]
- Faris, R.; Clark, J.; Etling, B.; Kaiser, J.; Roberts, H.; Schmitt, C.; Tilton, C.; Benkler, Y. Polarization and the Pandemic: American Political Discourse, March–May 2020; Berkman Klein Center Research Publication: Cambridge, MA, USA, 2020. [Google Scholar] [CrossRef]
- Marshall, S. Five News Sites Can Now Embed Public Facebook Posts. Available online: https://www.journalism.co.uk/news/five-news-sites-can-now-embed-public-facebook-posts/s2/a553700/ (accessed on 27 February 2022).
- Zucker, H.A. Tackling Online Misinformation: A Critical Component of Effective Public Health Response in the 21st Century. Am. J. Public Health 2020, 110, S269. [Google Scholar] [CrossRef]
- Dentith, M.R.X. The Problem of Fake News. Public Reason 2016, 8, 65–79. [Google Scholar]
- Greg, S. Fake News: As the Problem or a Symptom of a Deeper Problem? Соціокомунікативне Середовище Теорія та Історія 2017, 4, 44. [Google Scholar]
- Savino, E.M. Fake News: No One Is Liable, and That Is a Problem. Buffalo Law Rev. 2017, 65, 1101. [Google Scholar]
- Guo, L. China’s “Fake News” Problem: Exploring the Spread of Online Rumors in the Government-Controlled News Media. Digit. J. 2020, 8, 992–1010. [Google Scholar] [CrossRef]
- Bernal, P. Facebook: Why Facebook Makes the Fake News Problem Inevitable. North. Irel. Leg. Q. 2018, 69, 513. [Google Scholar] [CrossRef]
- Suttle, R.; Hogan, S.; Aumaugher, R.; Spradling, M.; Merrigan, Z.; Straub, J. University Community Members’ Perceptions of Labels for Online Media. Future Internet 2021, 13, 281. [Google Scholar] [CrossRef]
- Straub, J.; Spradling, M. Americans’ Perspectives on Online Media Warning Labels. Behav. Sci. 2022, 12, 59. [Google Scholar] [CrossRef] [PubMed]
Figure 1.
Percentage of each social networking sites’ users who get news on the site in 2013, 2016, and 2018 (data from [31,32,33]).

Figure 2.
Showing that males place more weight (at combined “great deal” and “a lot” levels) on the publisher than do females.
Figure 2.
Showing that males place more weight (at combined “great deal” and “a lot” levels) on the publisher than do females.

Figure 3.
Showing that females place more weight (particularly at the combined “great deal” and “a lot” levels) on publication date than do males.
Figure 3.
Showing that females place more weight (particularly at the combined “great deal” and “a lot” levels) on publication date than do males.

Figure 4.
Showing that the ideal level of focus on publication date declines with age.

Figure 5.
Showing that the weight placed on author’s political alignment increases with education level.
Figure 5.
Showing that the weight placed on author’s political alignment increases with education level.

Figure 6.
Showing that the weight placed on publisher’s political alignment increases with education level.
Figure 6.
Showing that the weight placed on publisher’s political alignment increases with education level.

Figure 7.
Showing that the ideal weight that is placed on author’s political alignment increases with education level.
Figure 7.
Showing that the ideal weight that is placed on author’s political alignment increases with education level.

Figure 8.
Showing greater interest article virality by females (self-perception).

Figure 9.
Showing greater ideal interest in article virality by females.

Figure 10.
Showing the level of focus given by respondents to articles’ authors.

Figure 11.
Showing the level of focus that should, ideally, be given to articles’ authors.

Figure 12.
Showing the level of focus given by respondents to articles’ publishers’ political alignment.
Figure 12.
Showing the level of focus given by respondents to articles’ publishers’ political alignment.

Figure 13.
Showing the level of focus that should, ideally, be given to articles’ publishers’ political alignment.
Figure 13.
Showing the level of focus that should, ideally, be given to articles’ publishers’ political alignment.


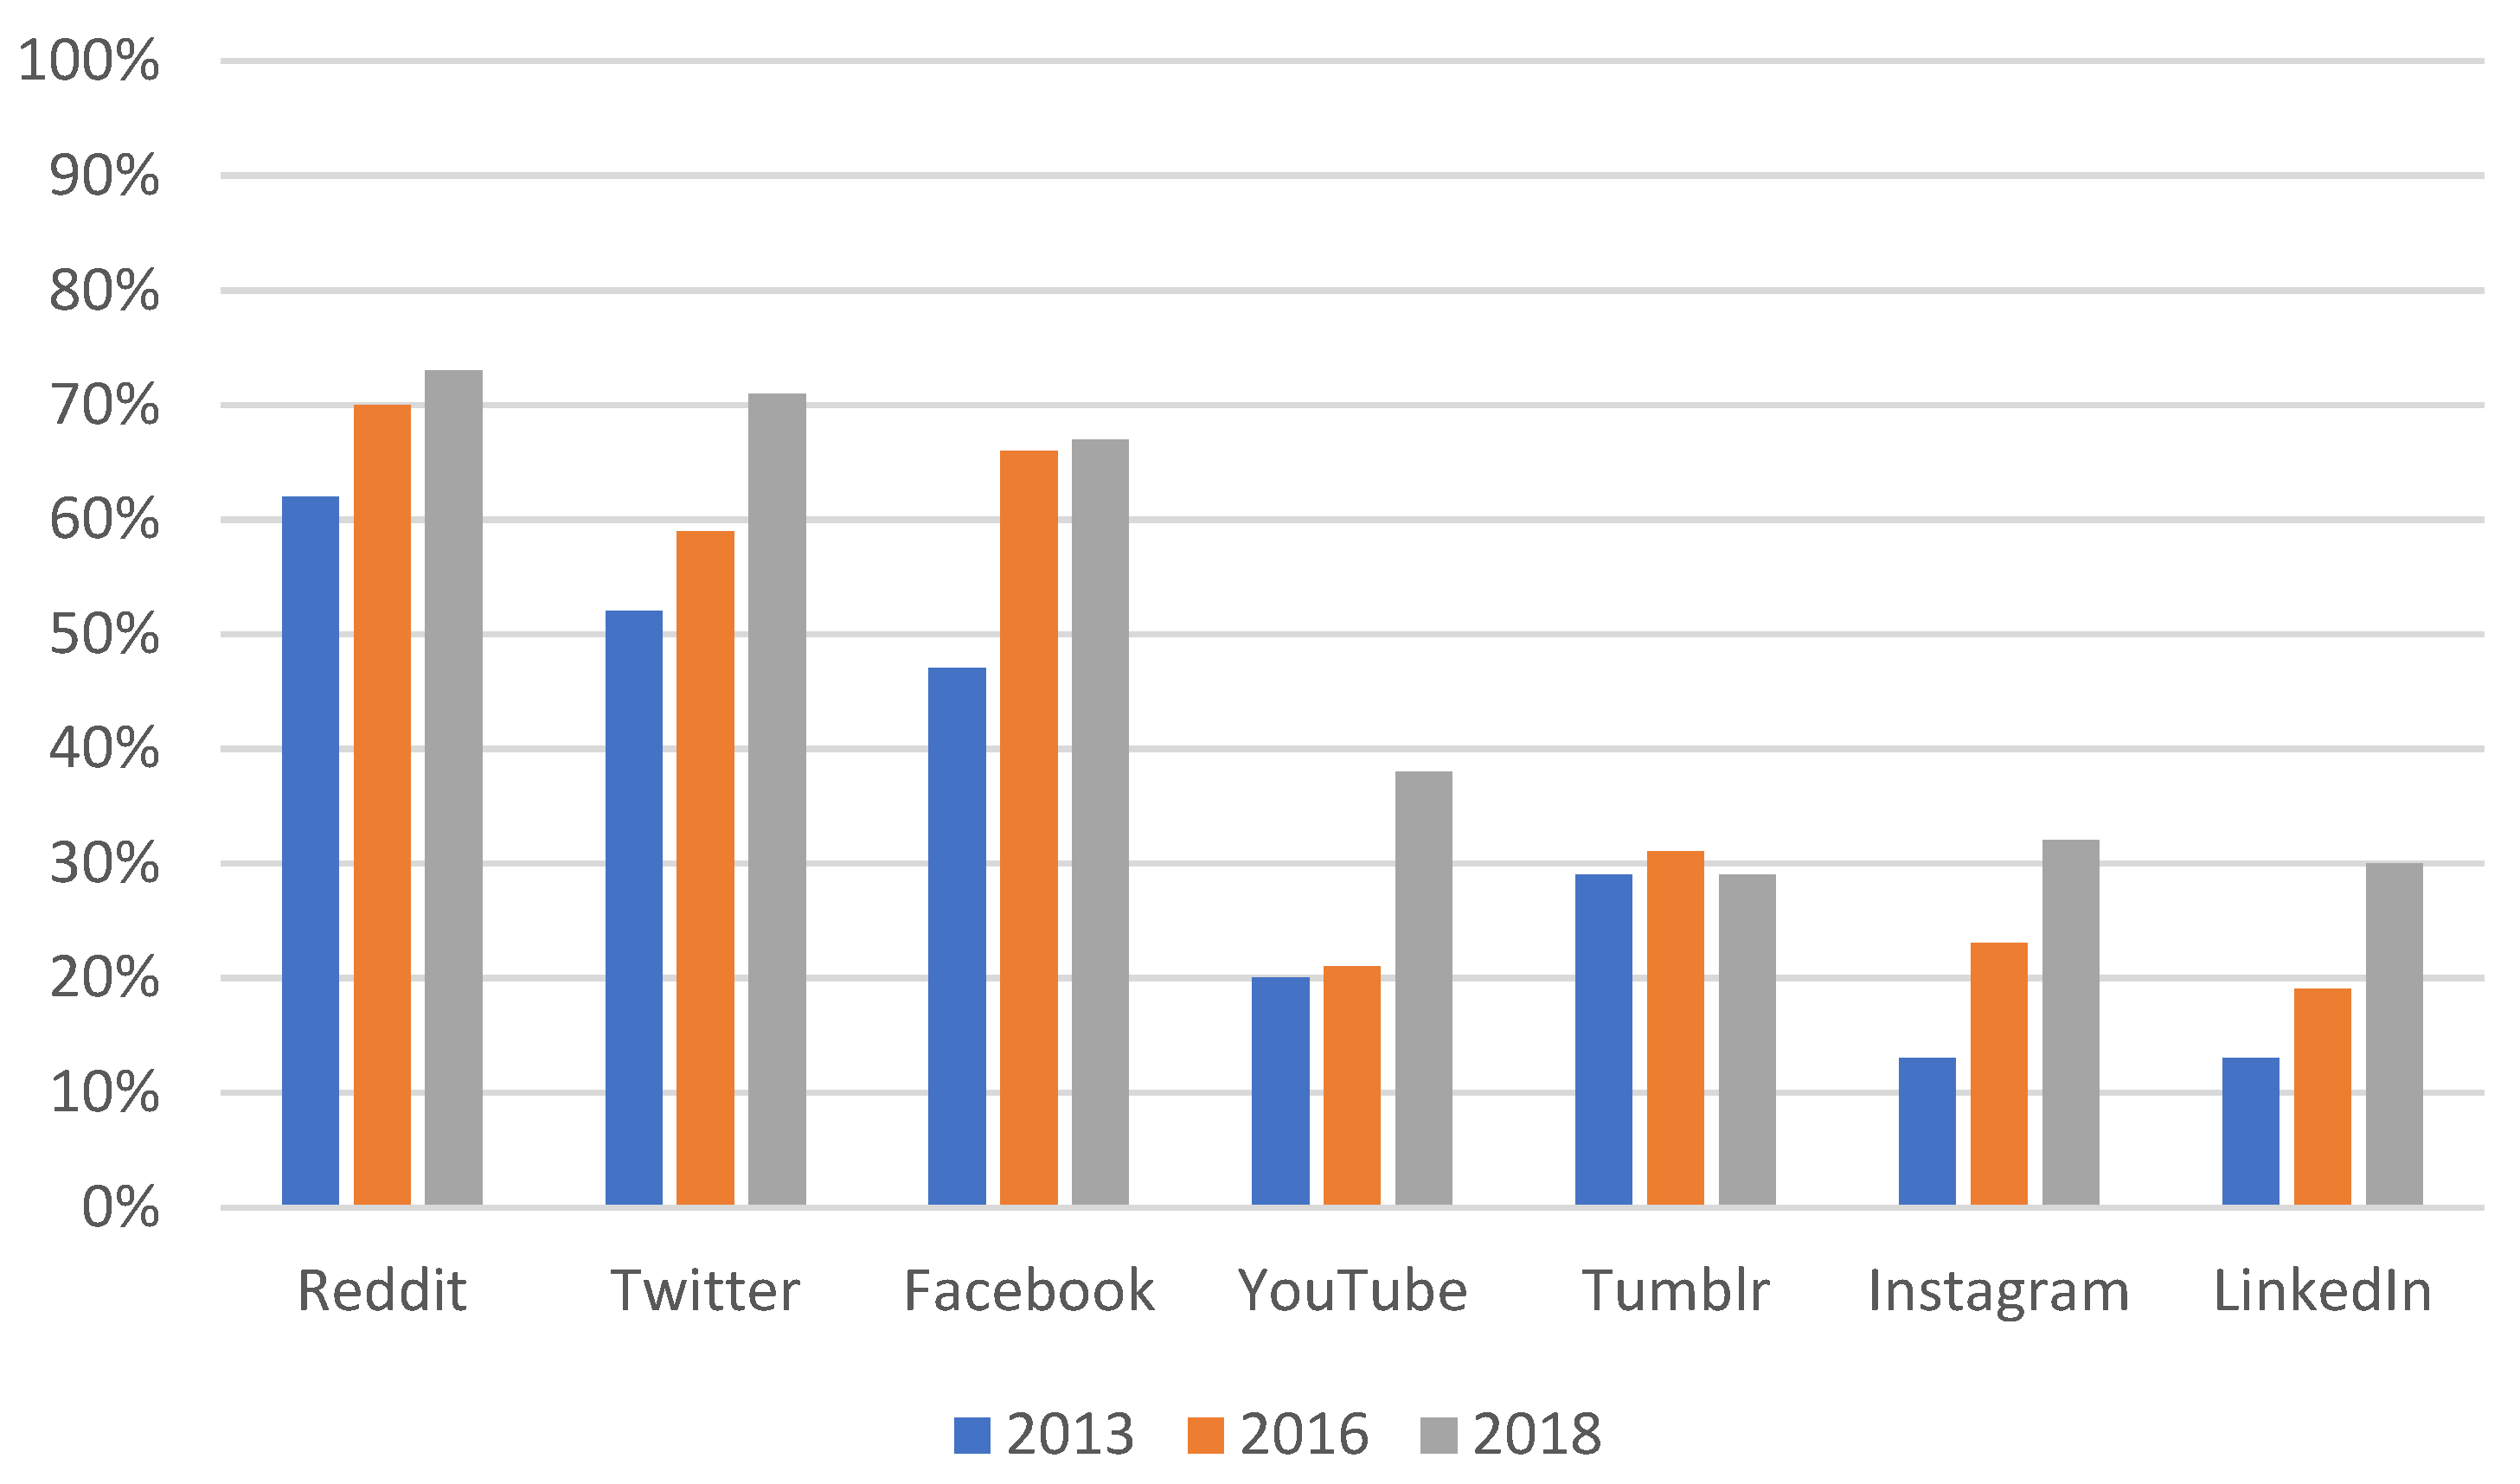
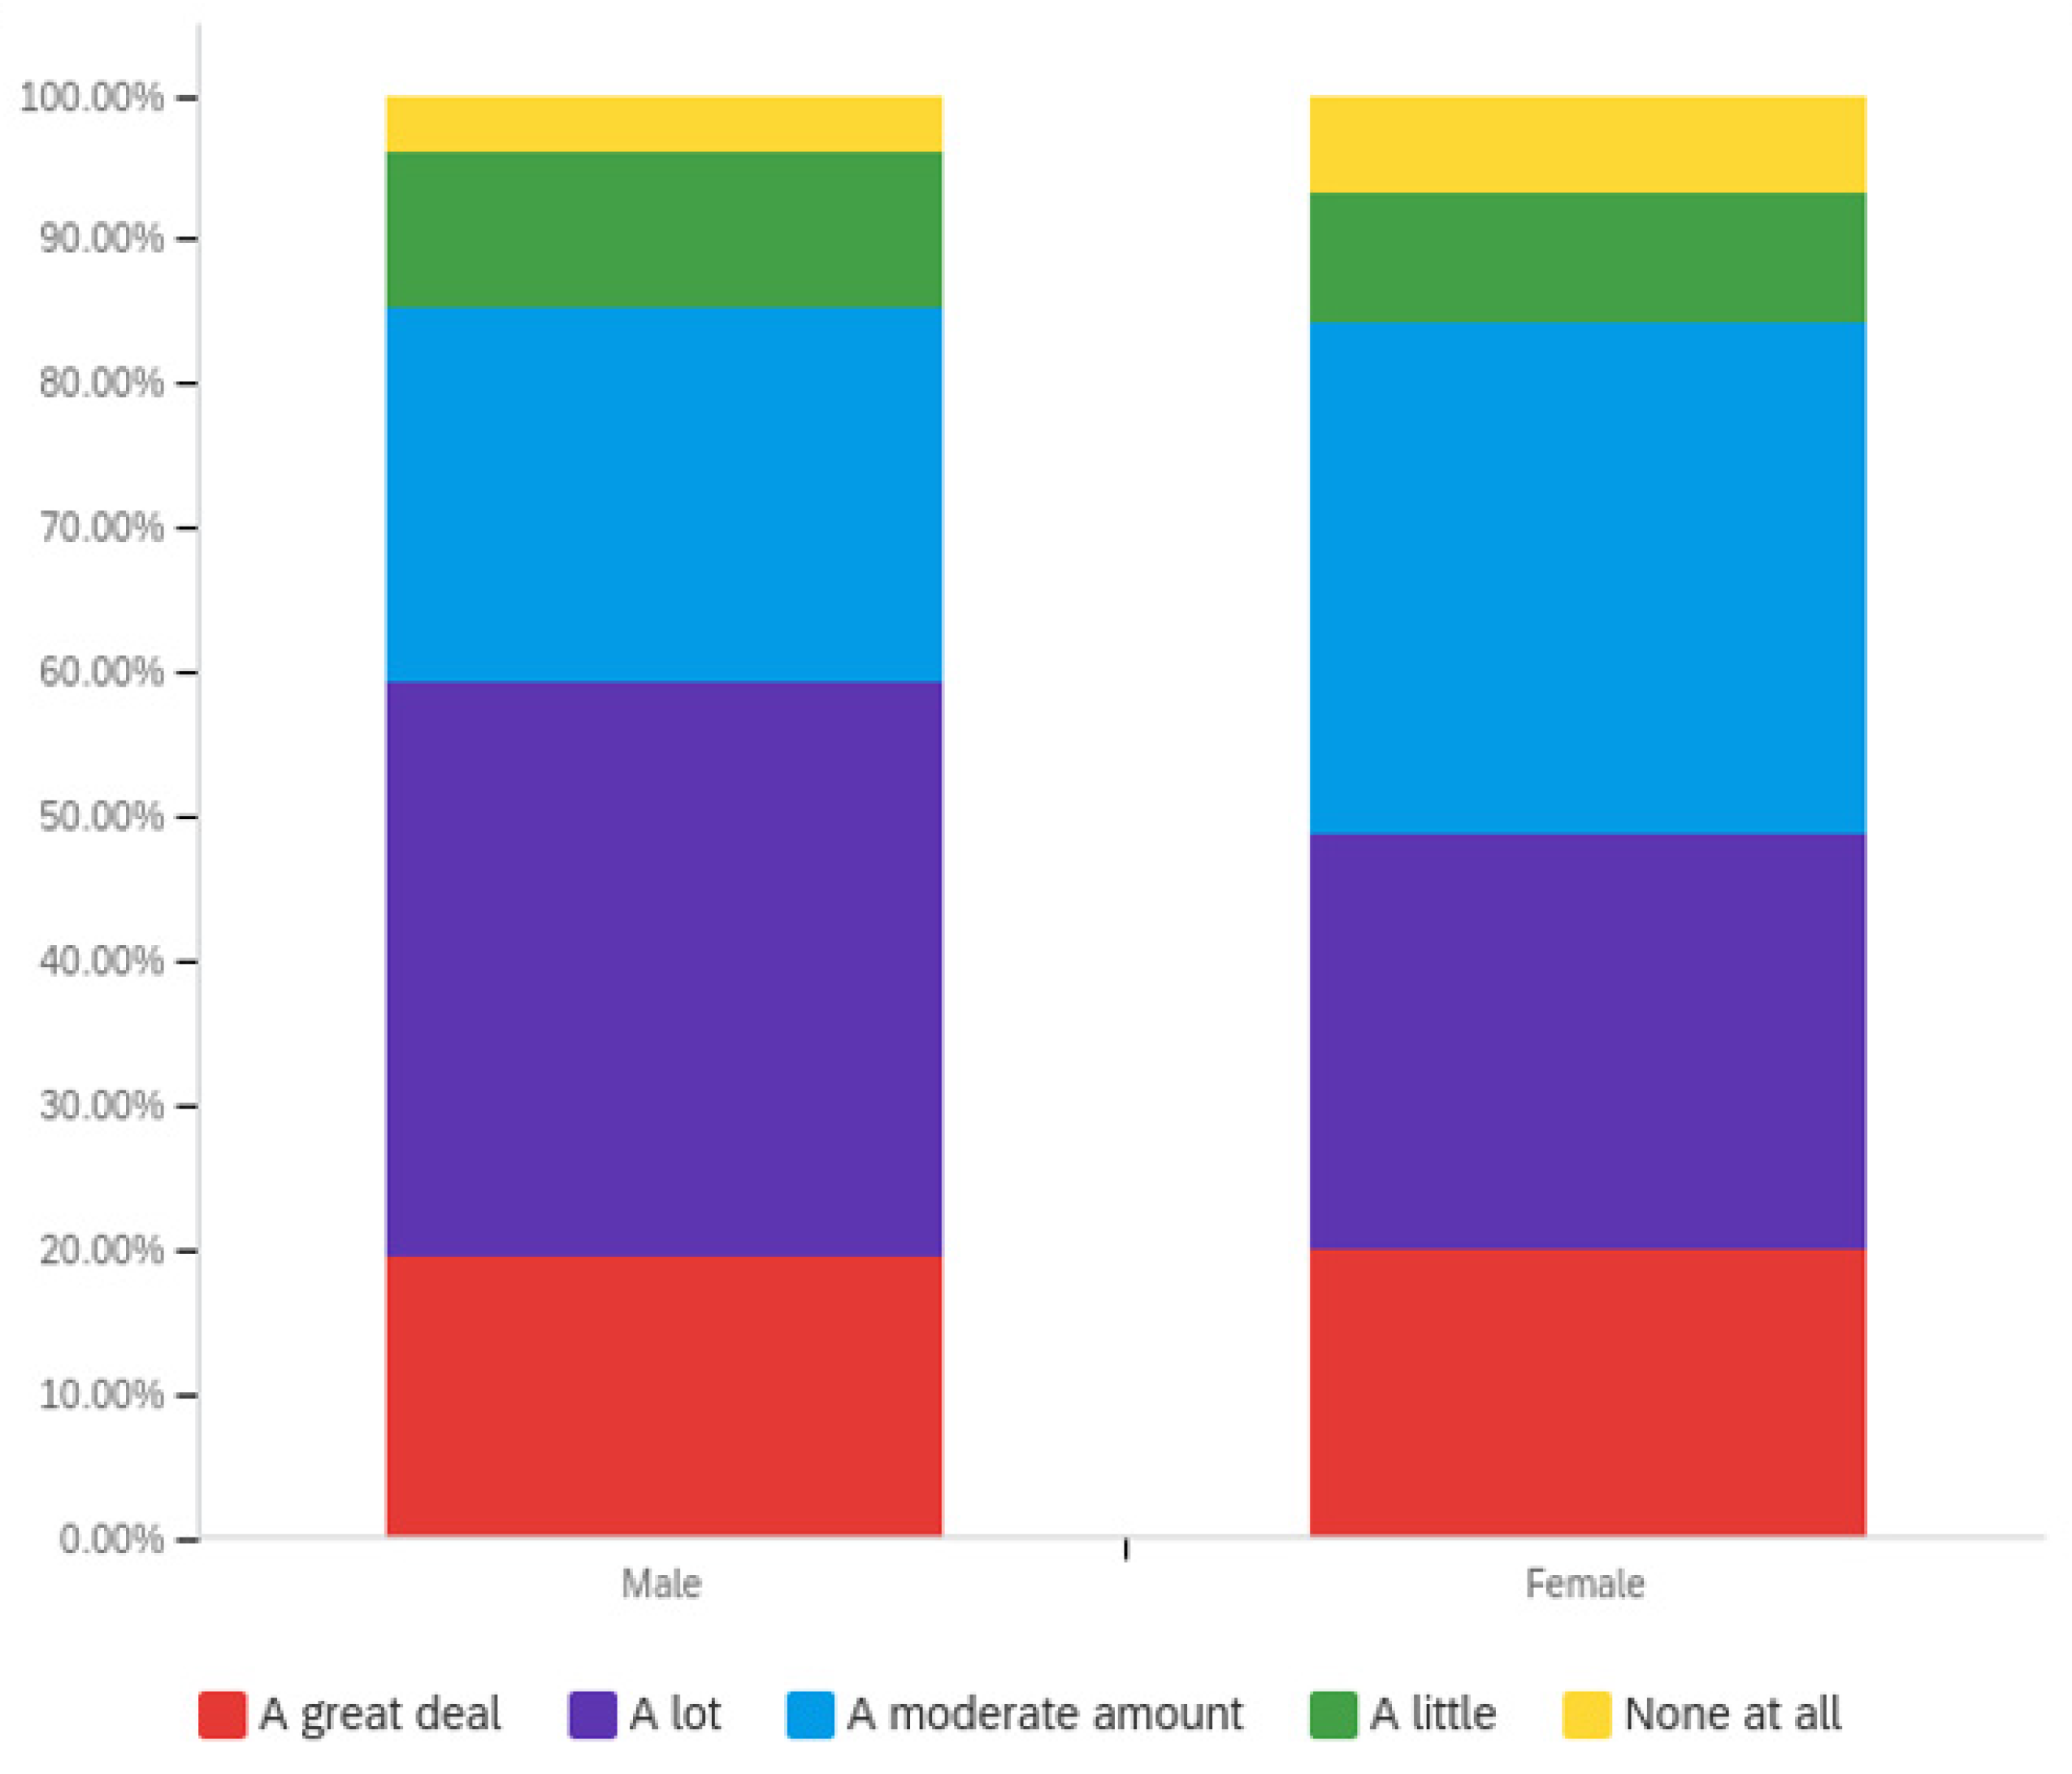
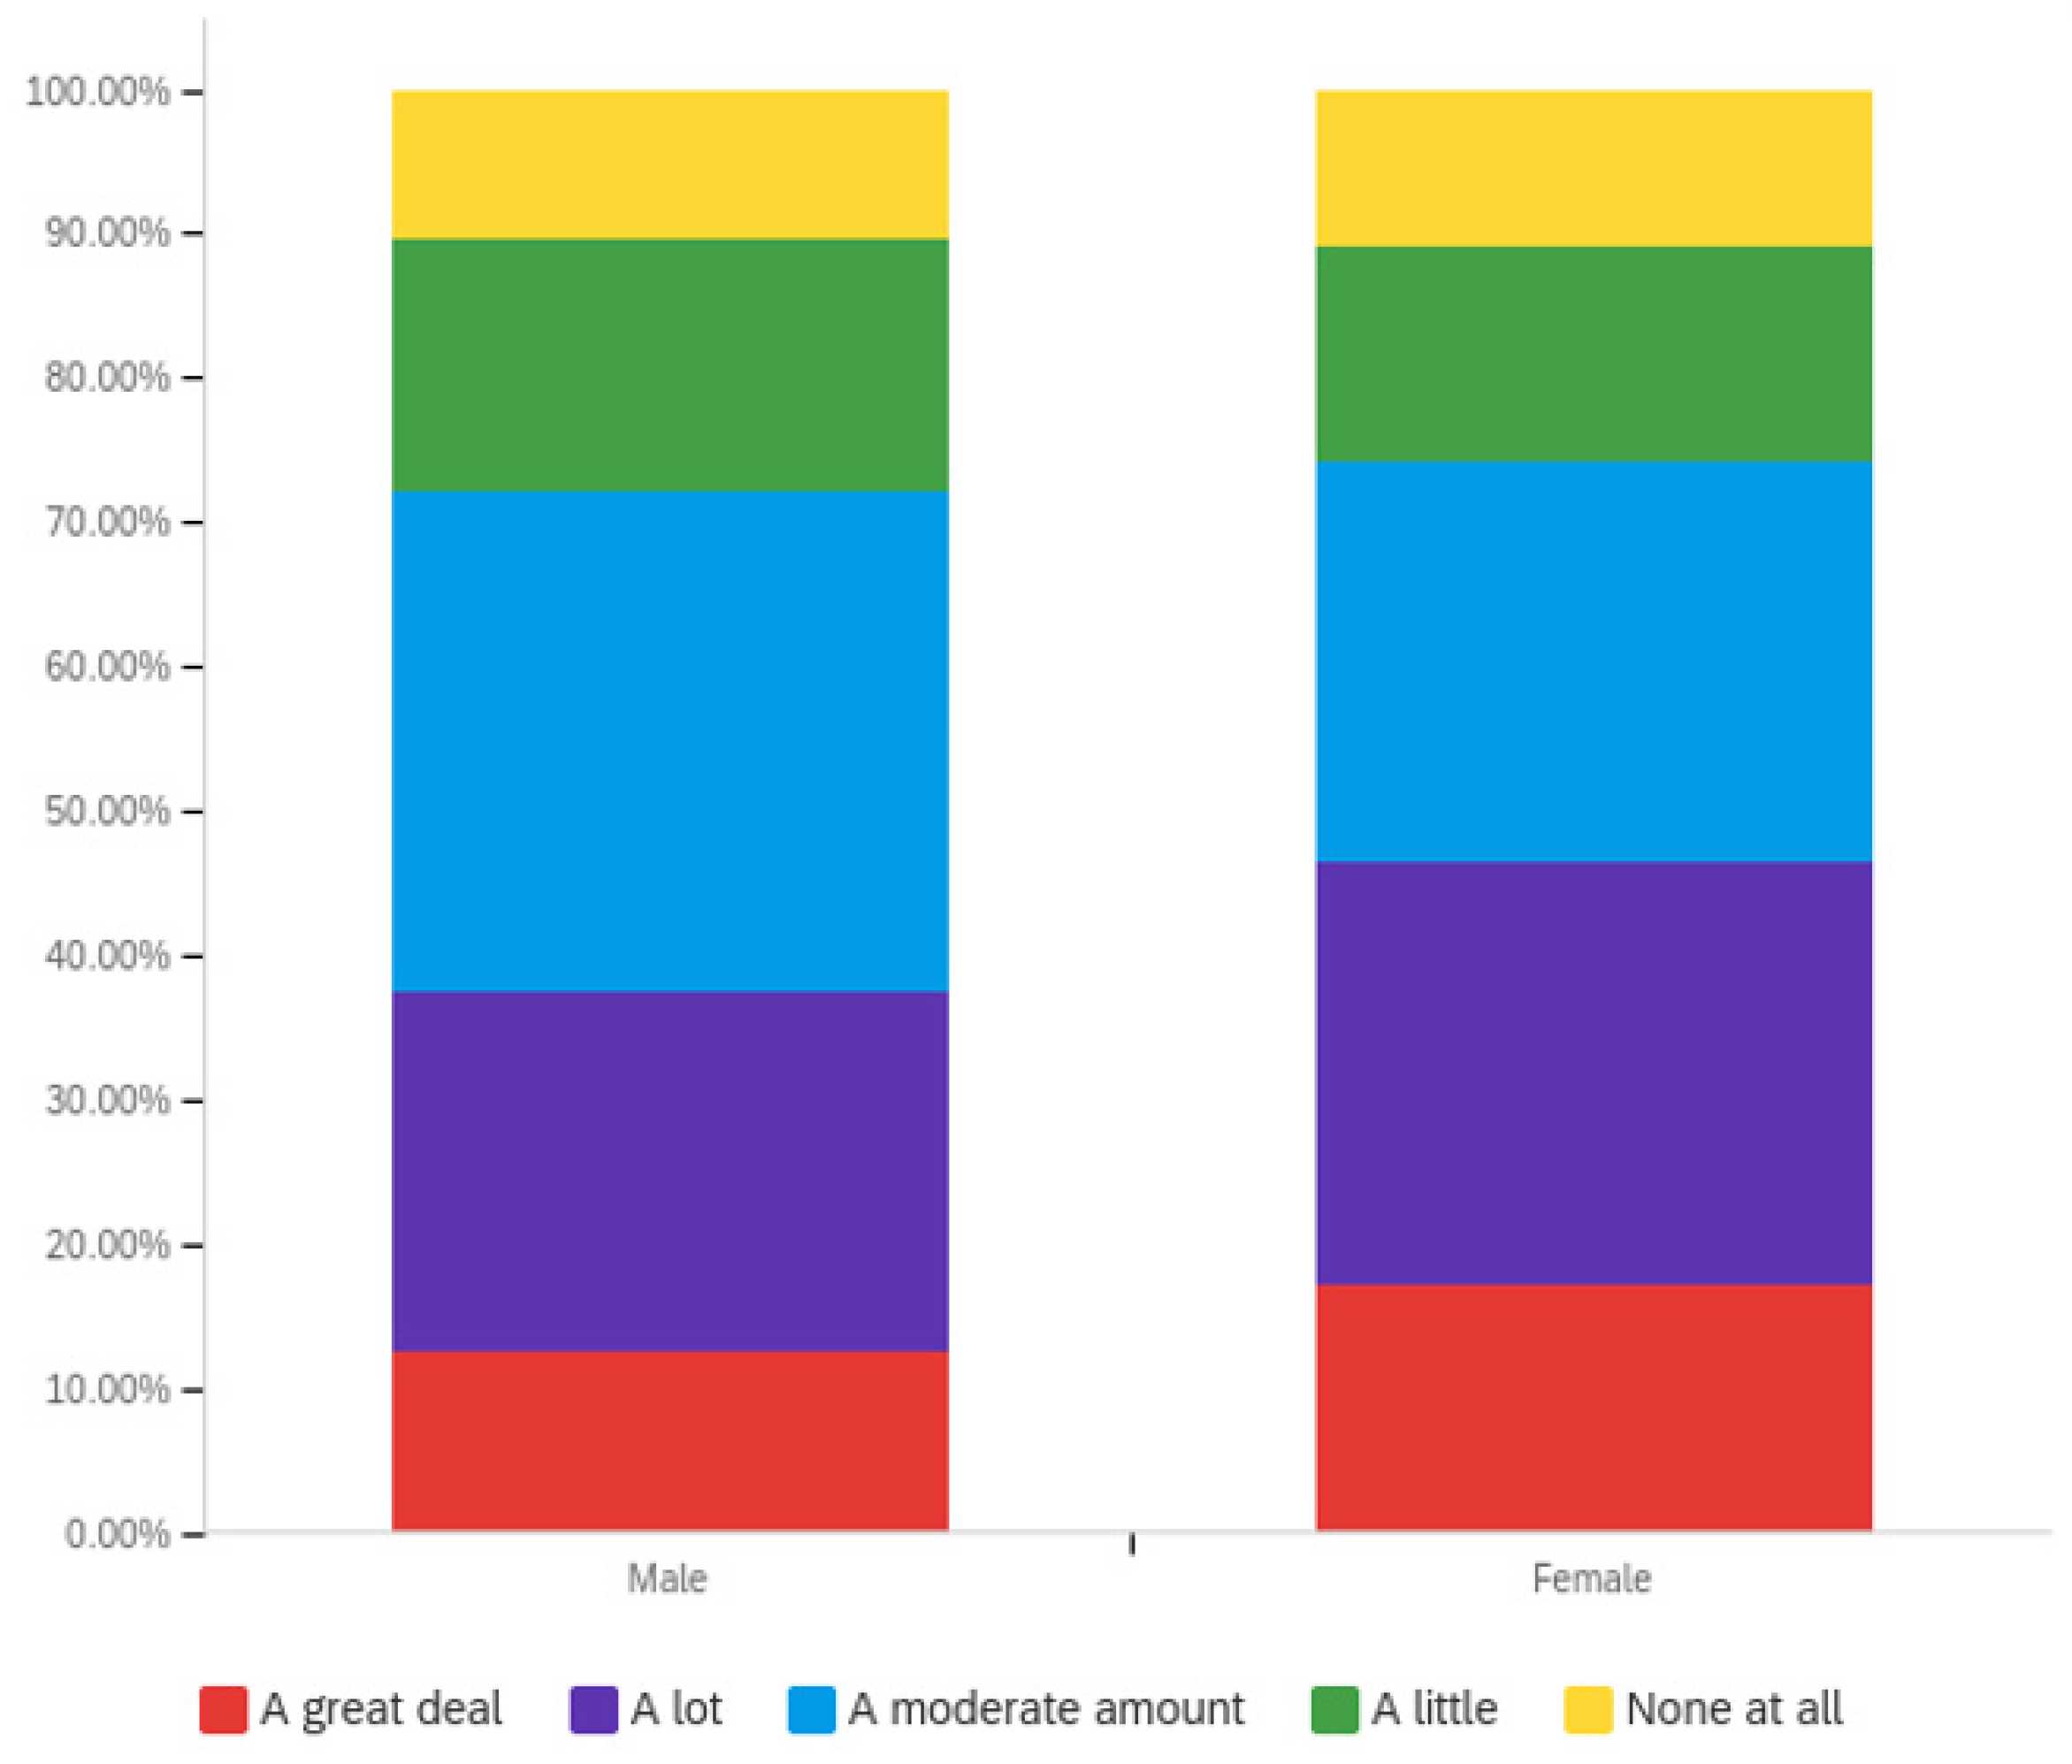
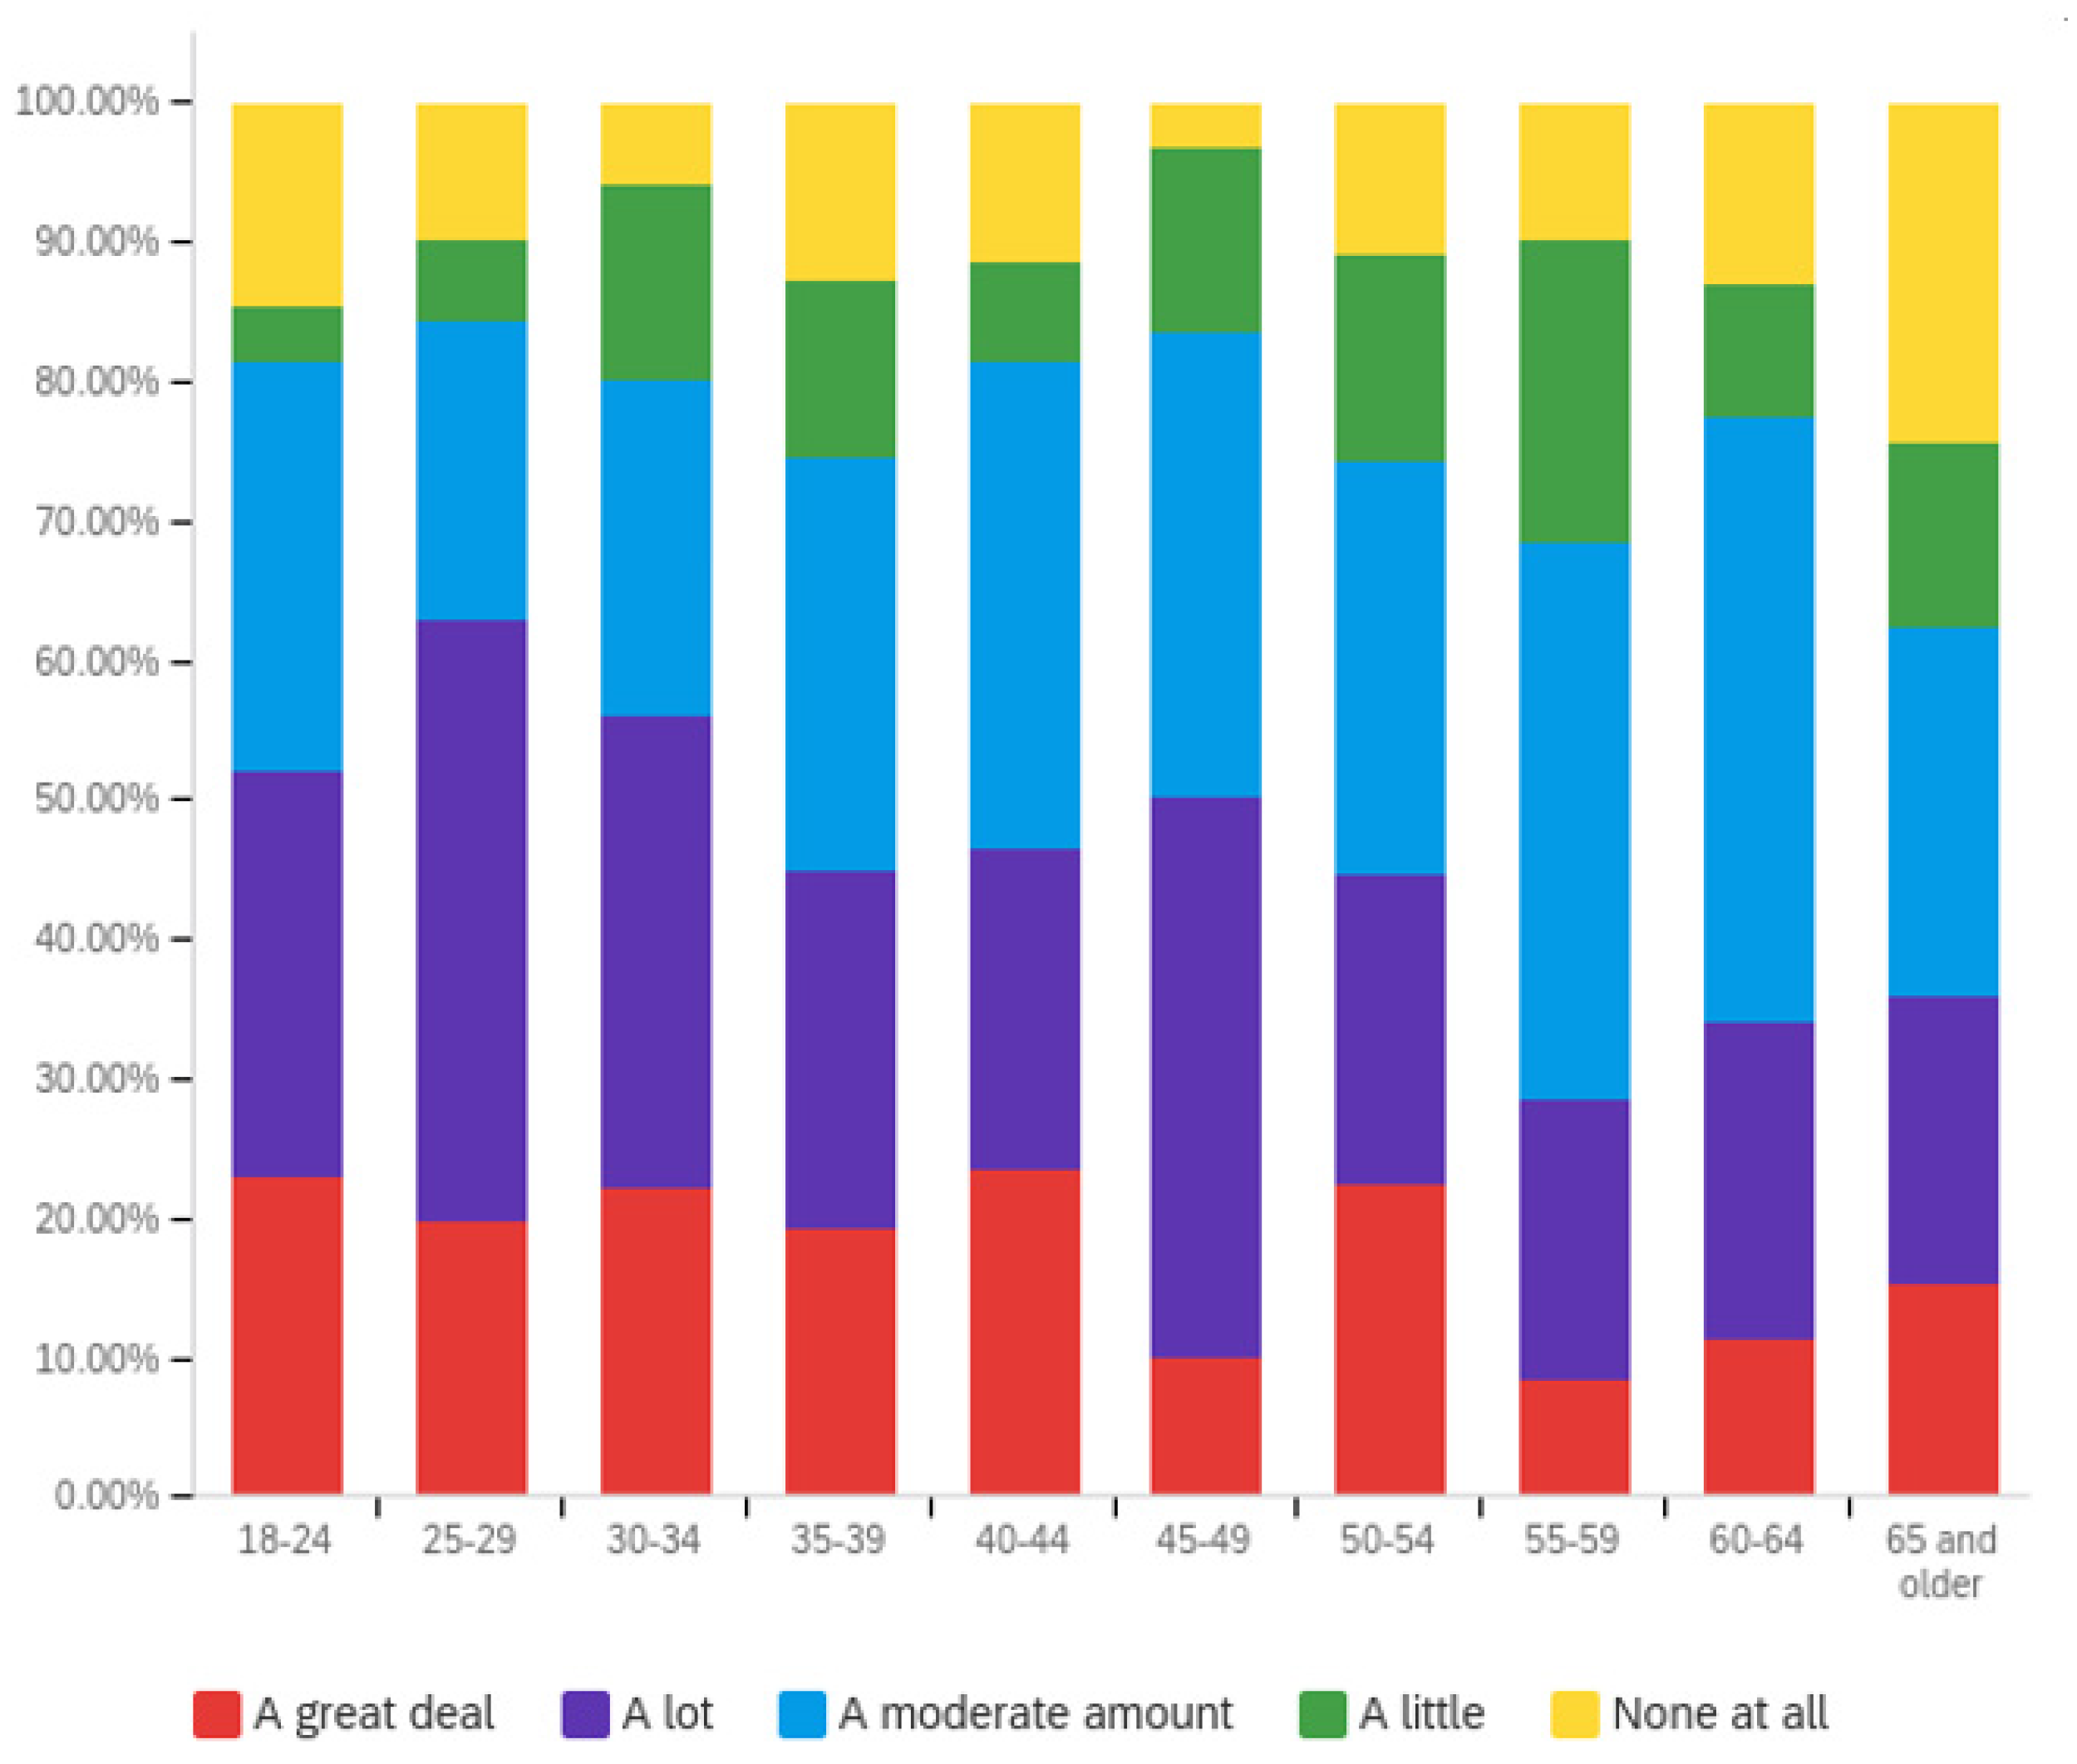
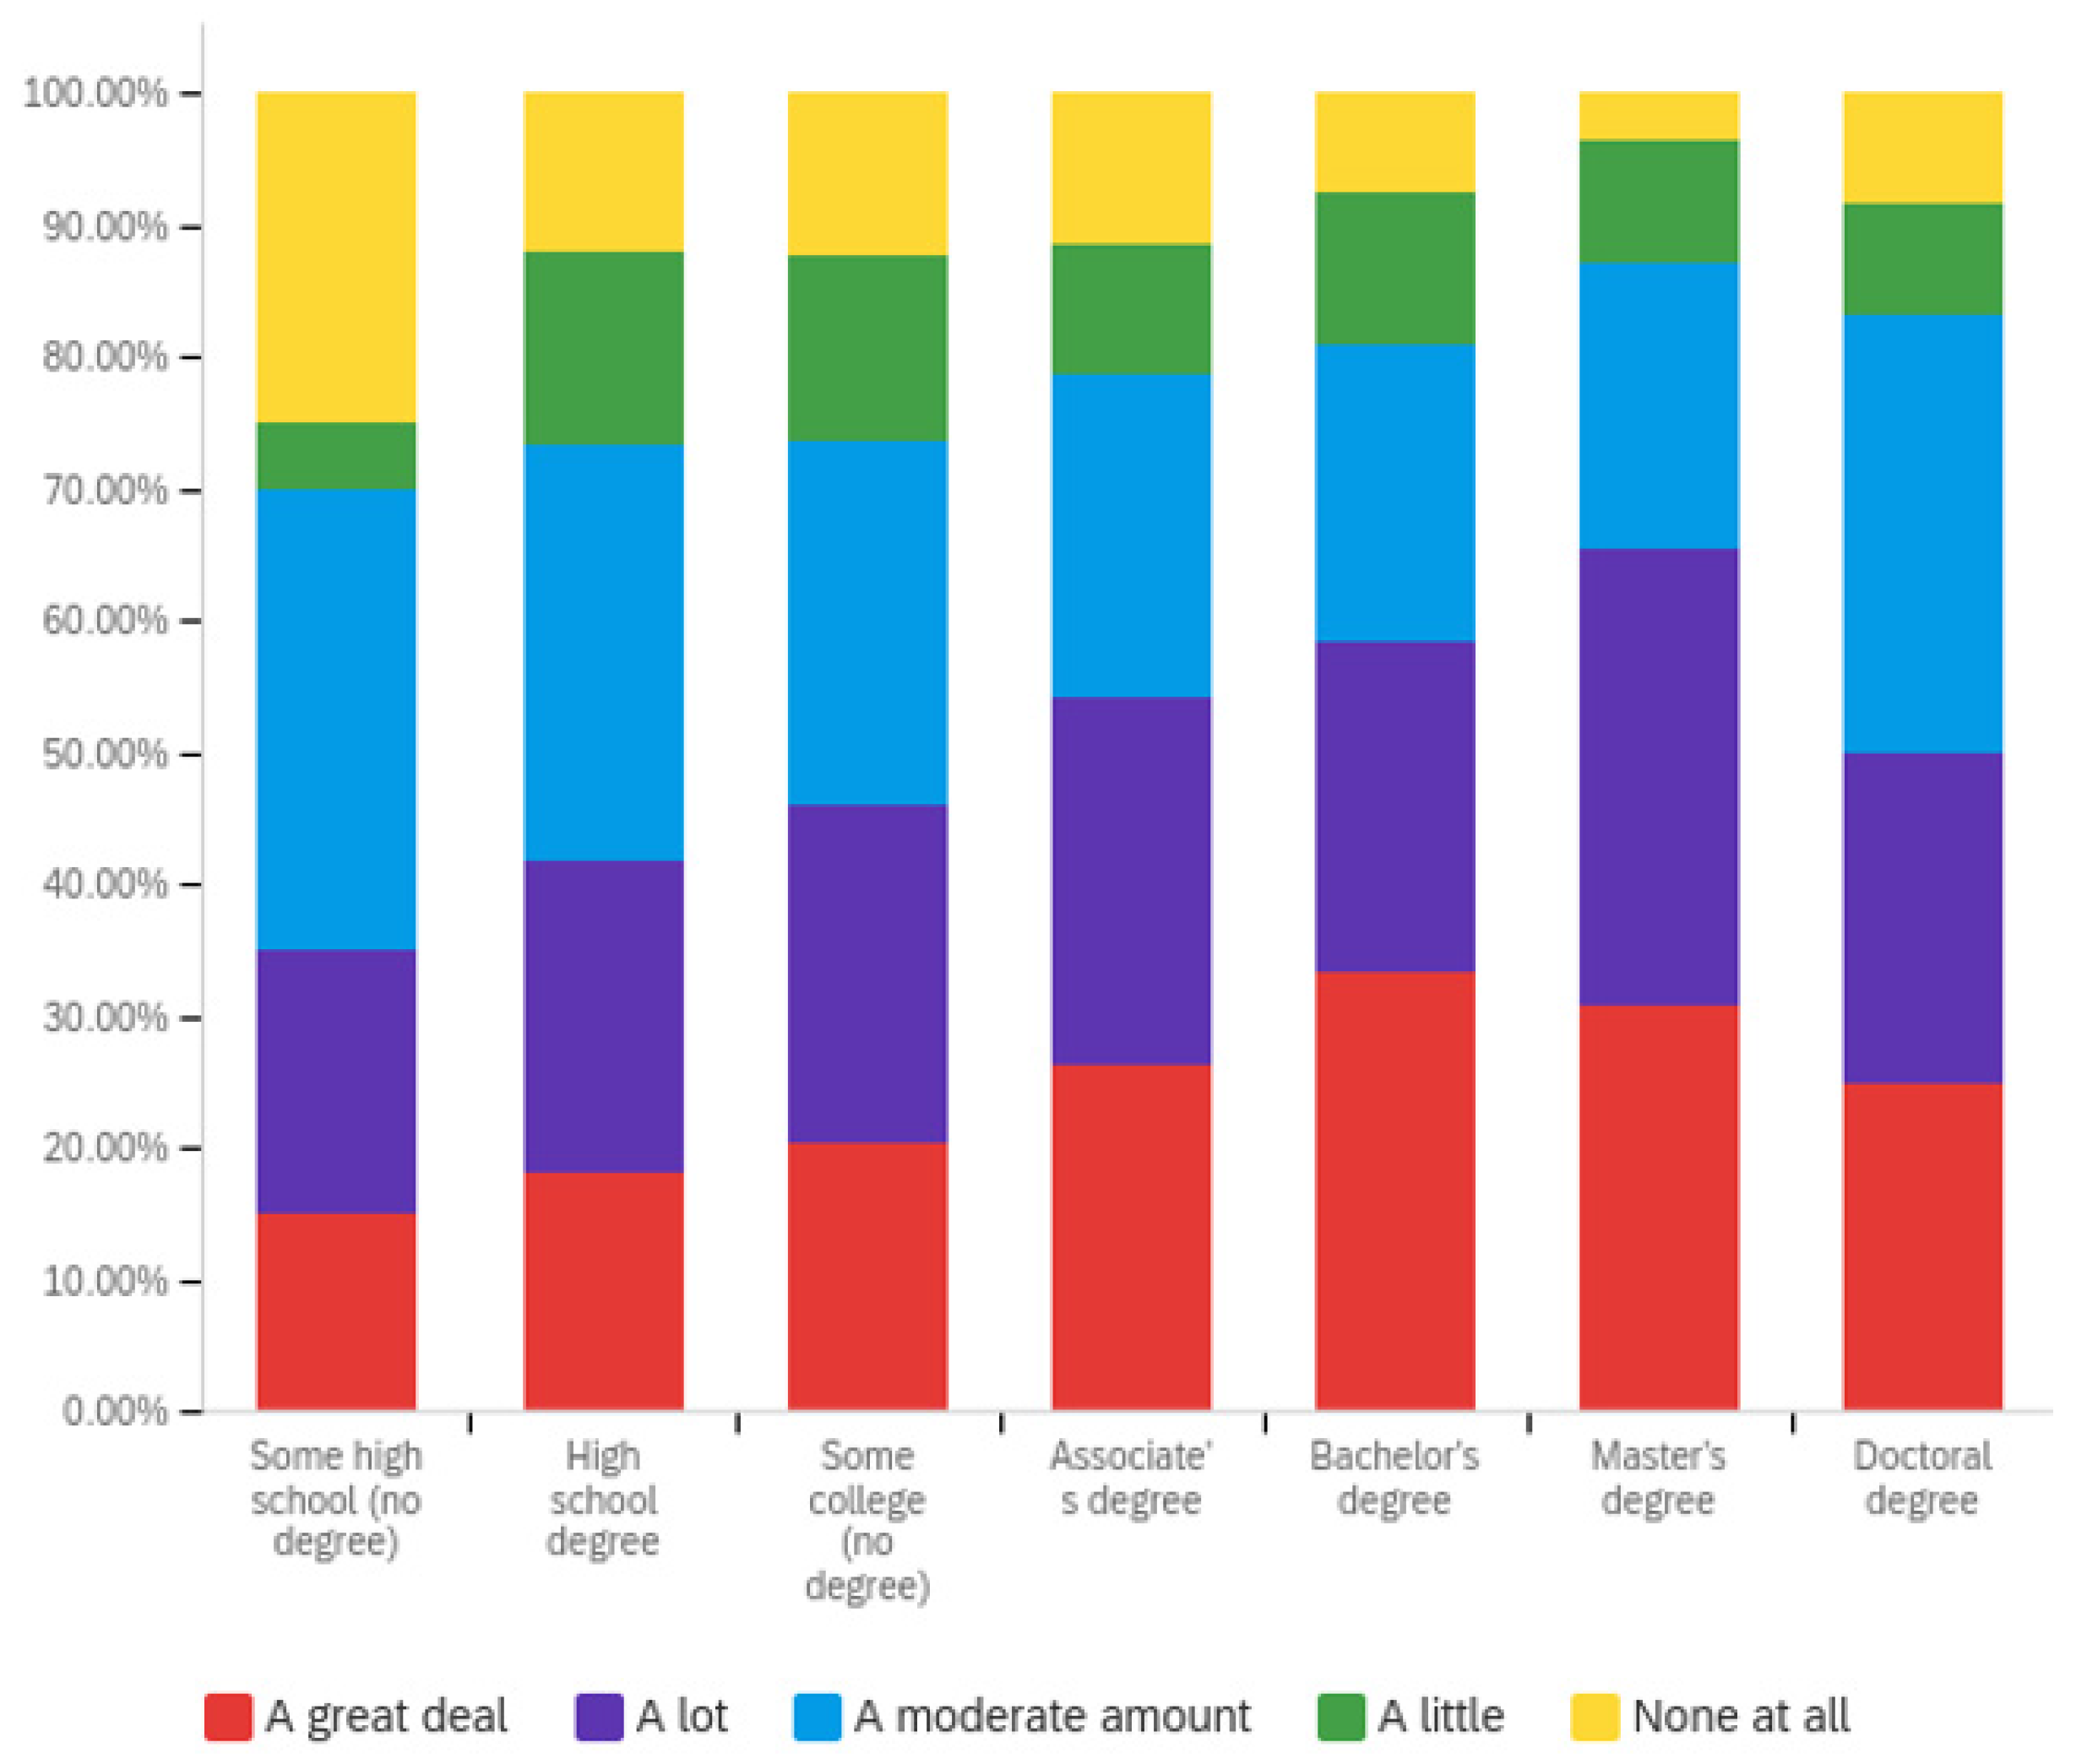
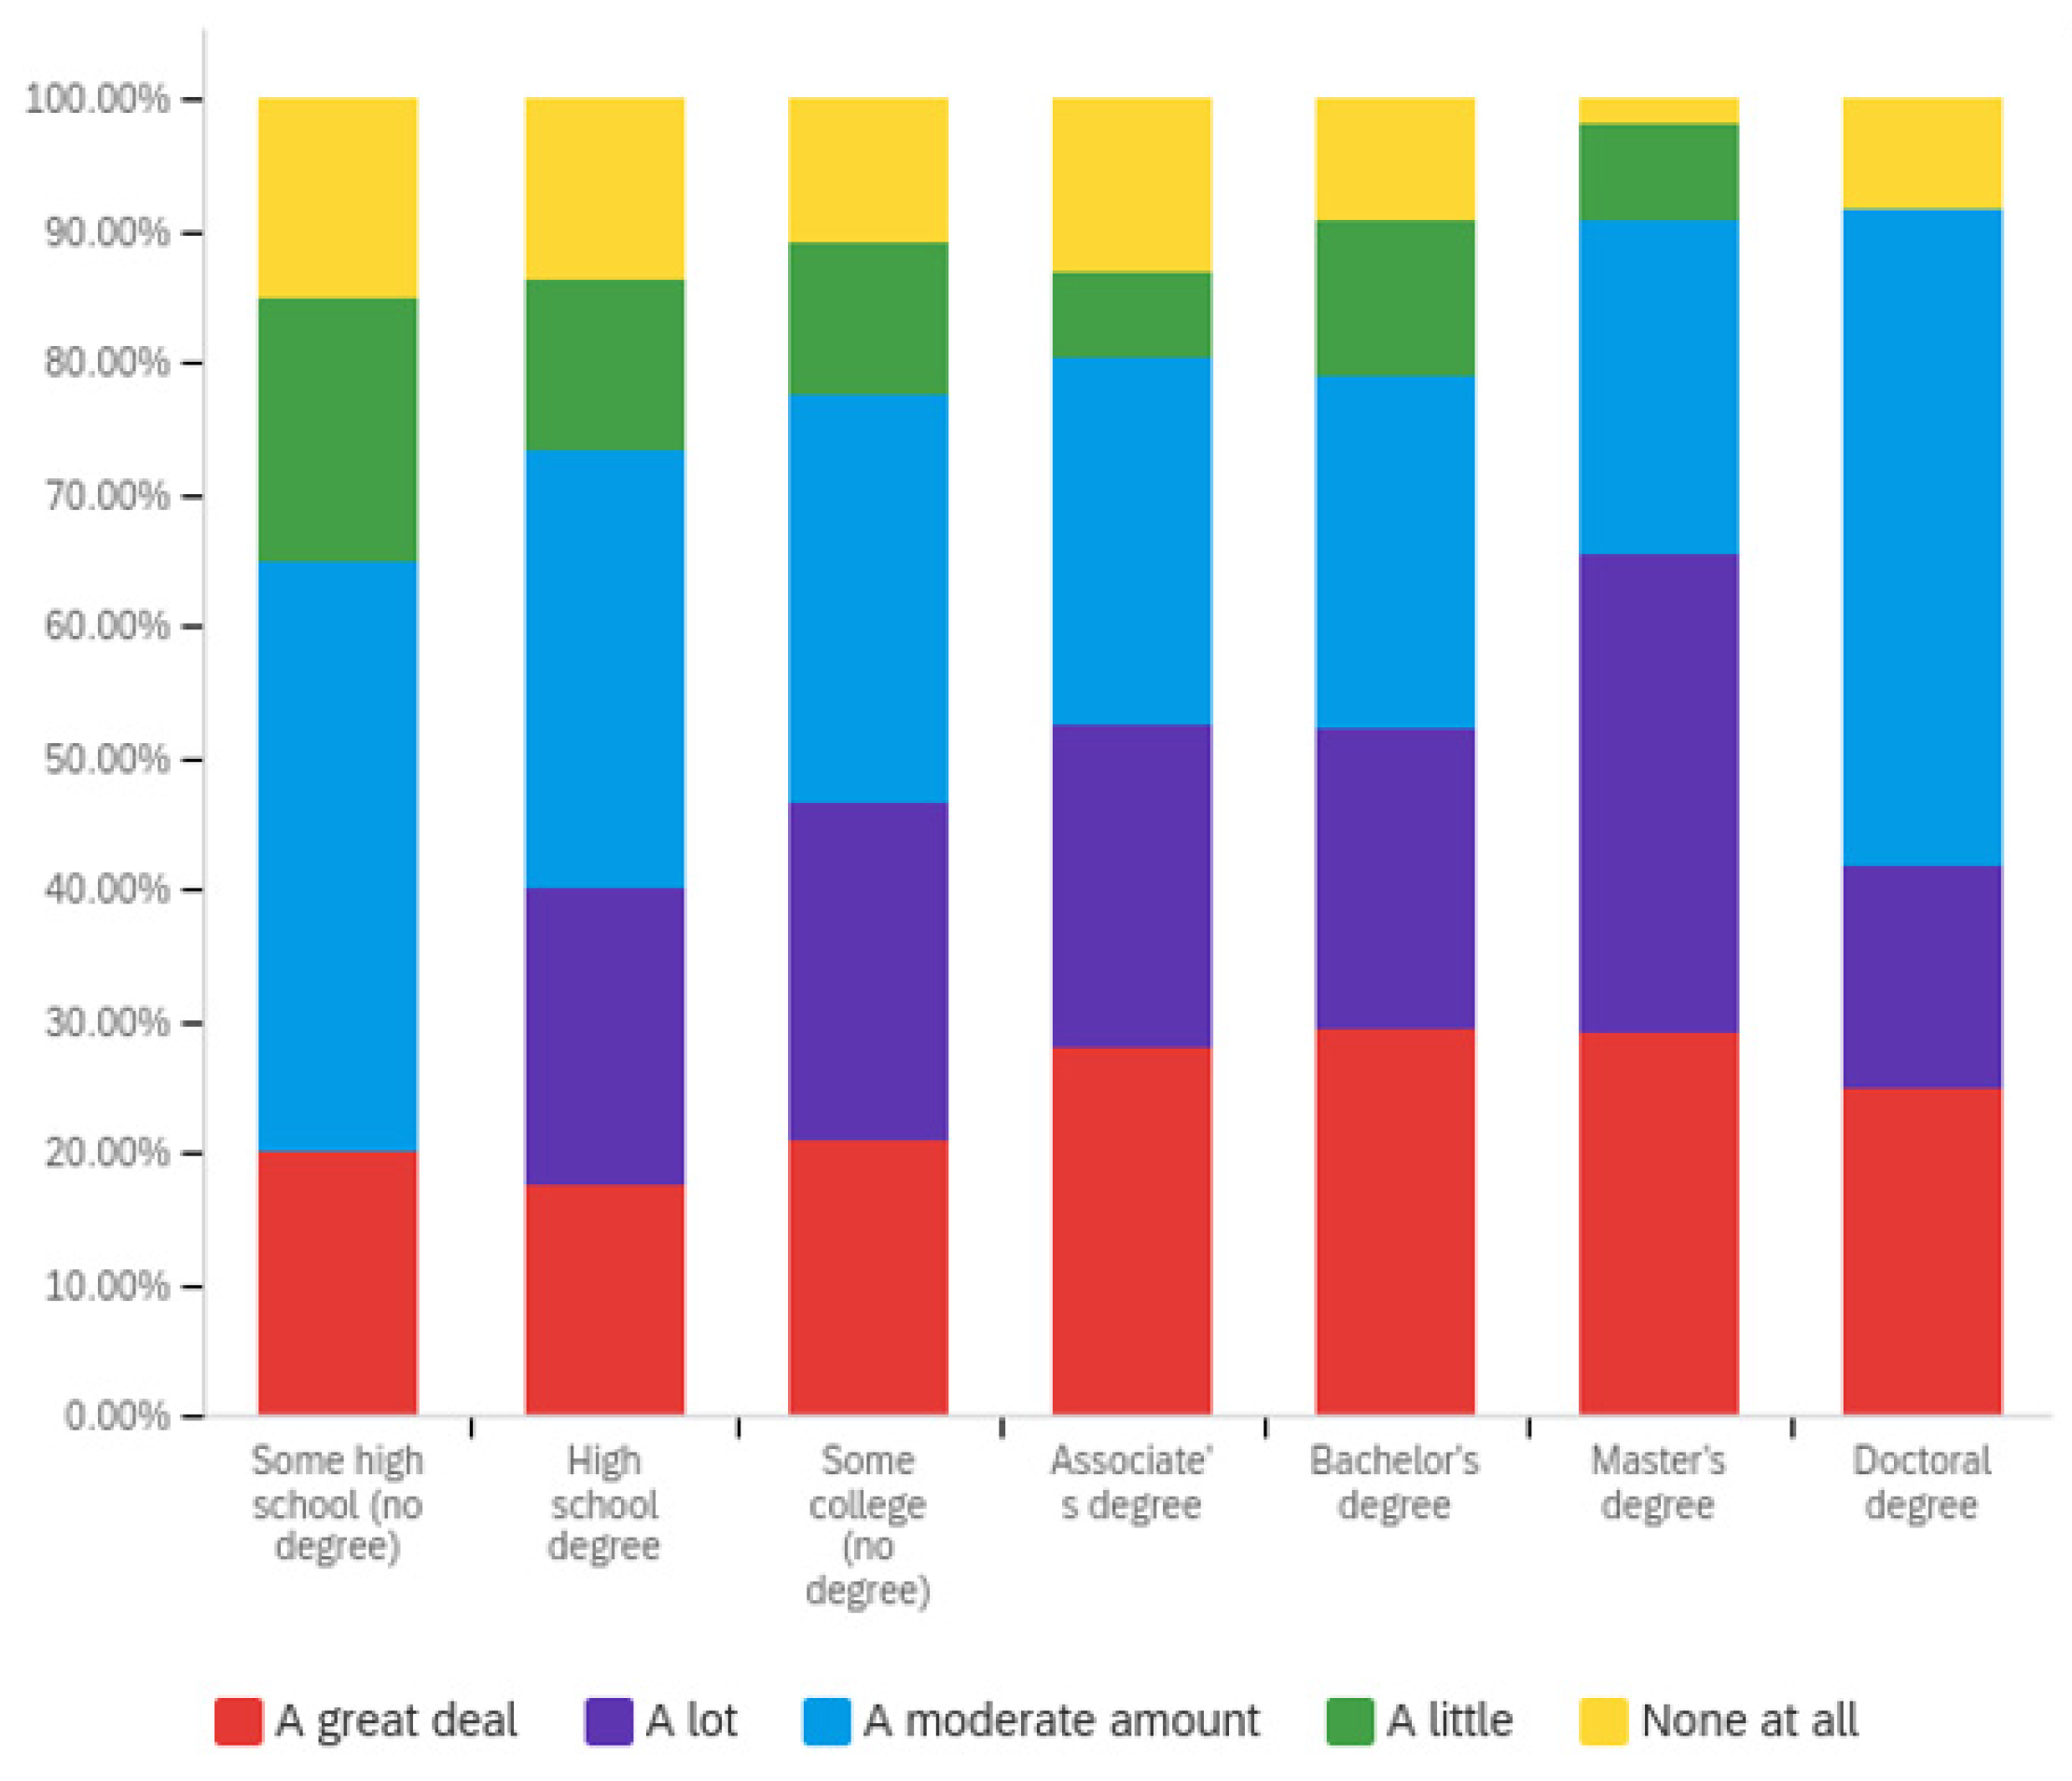
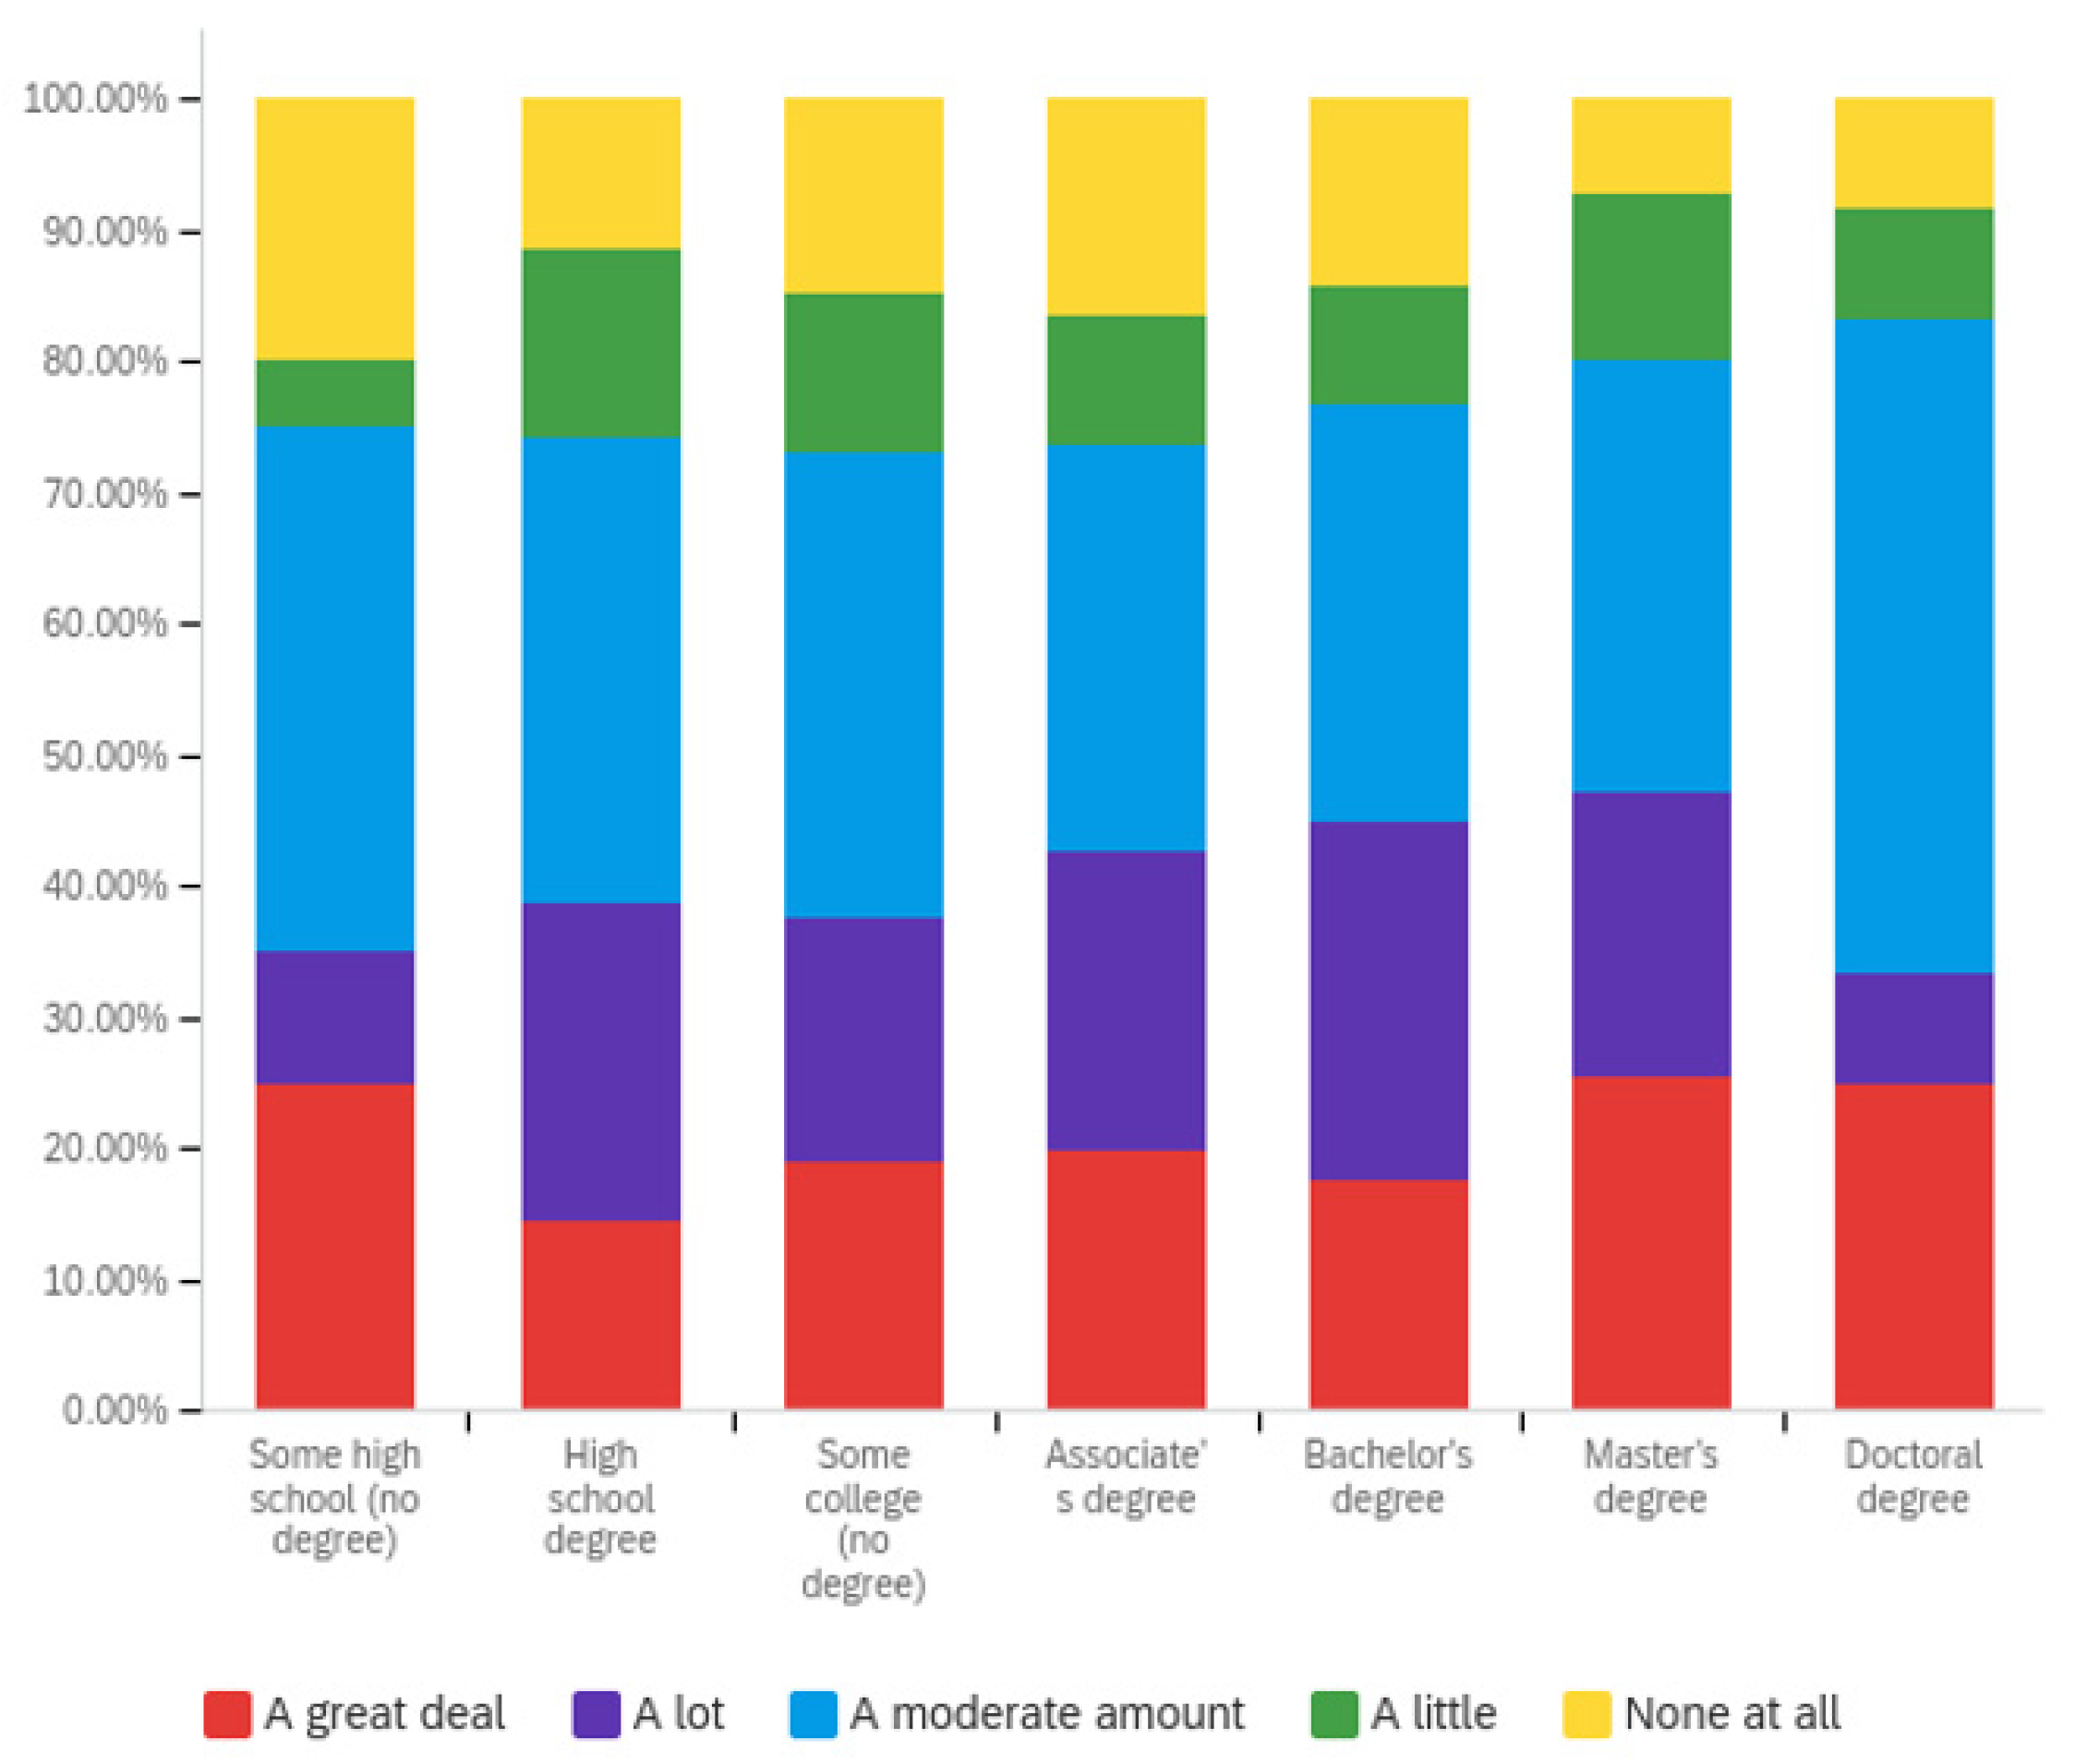
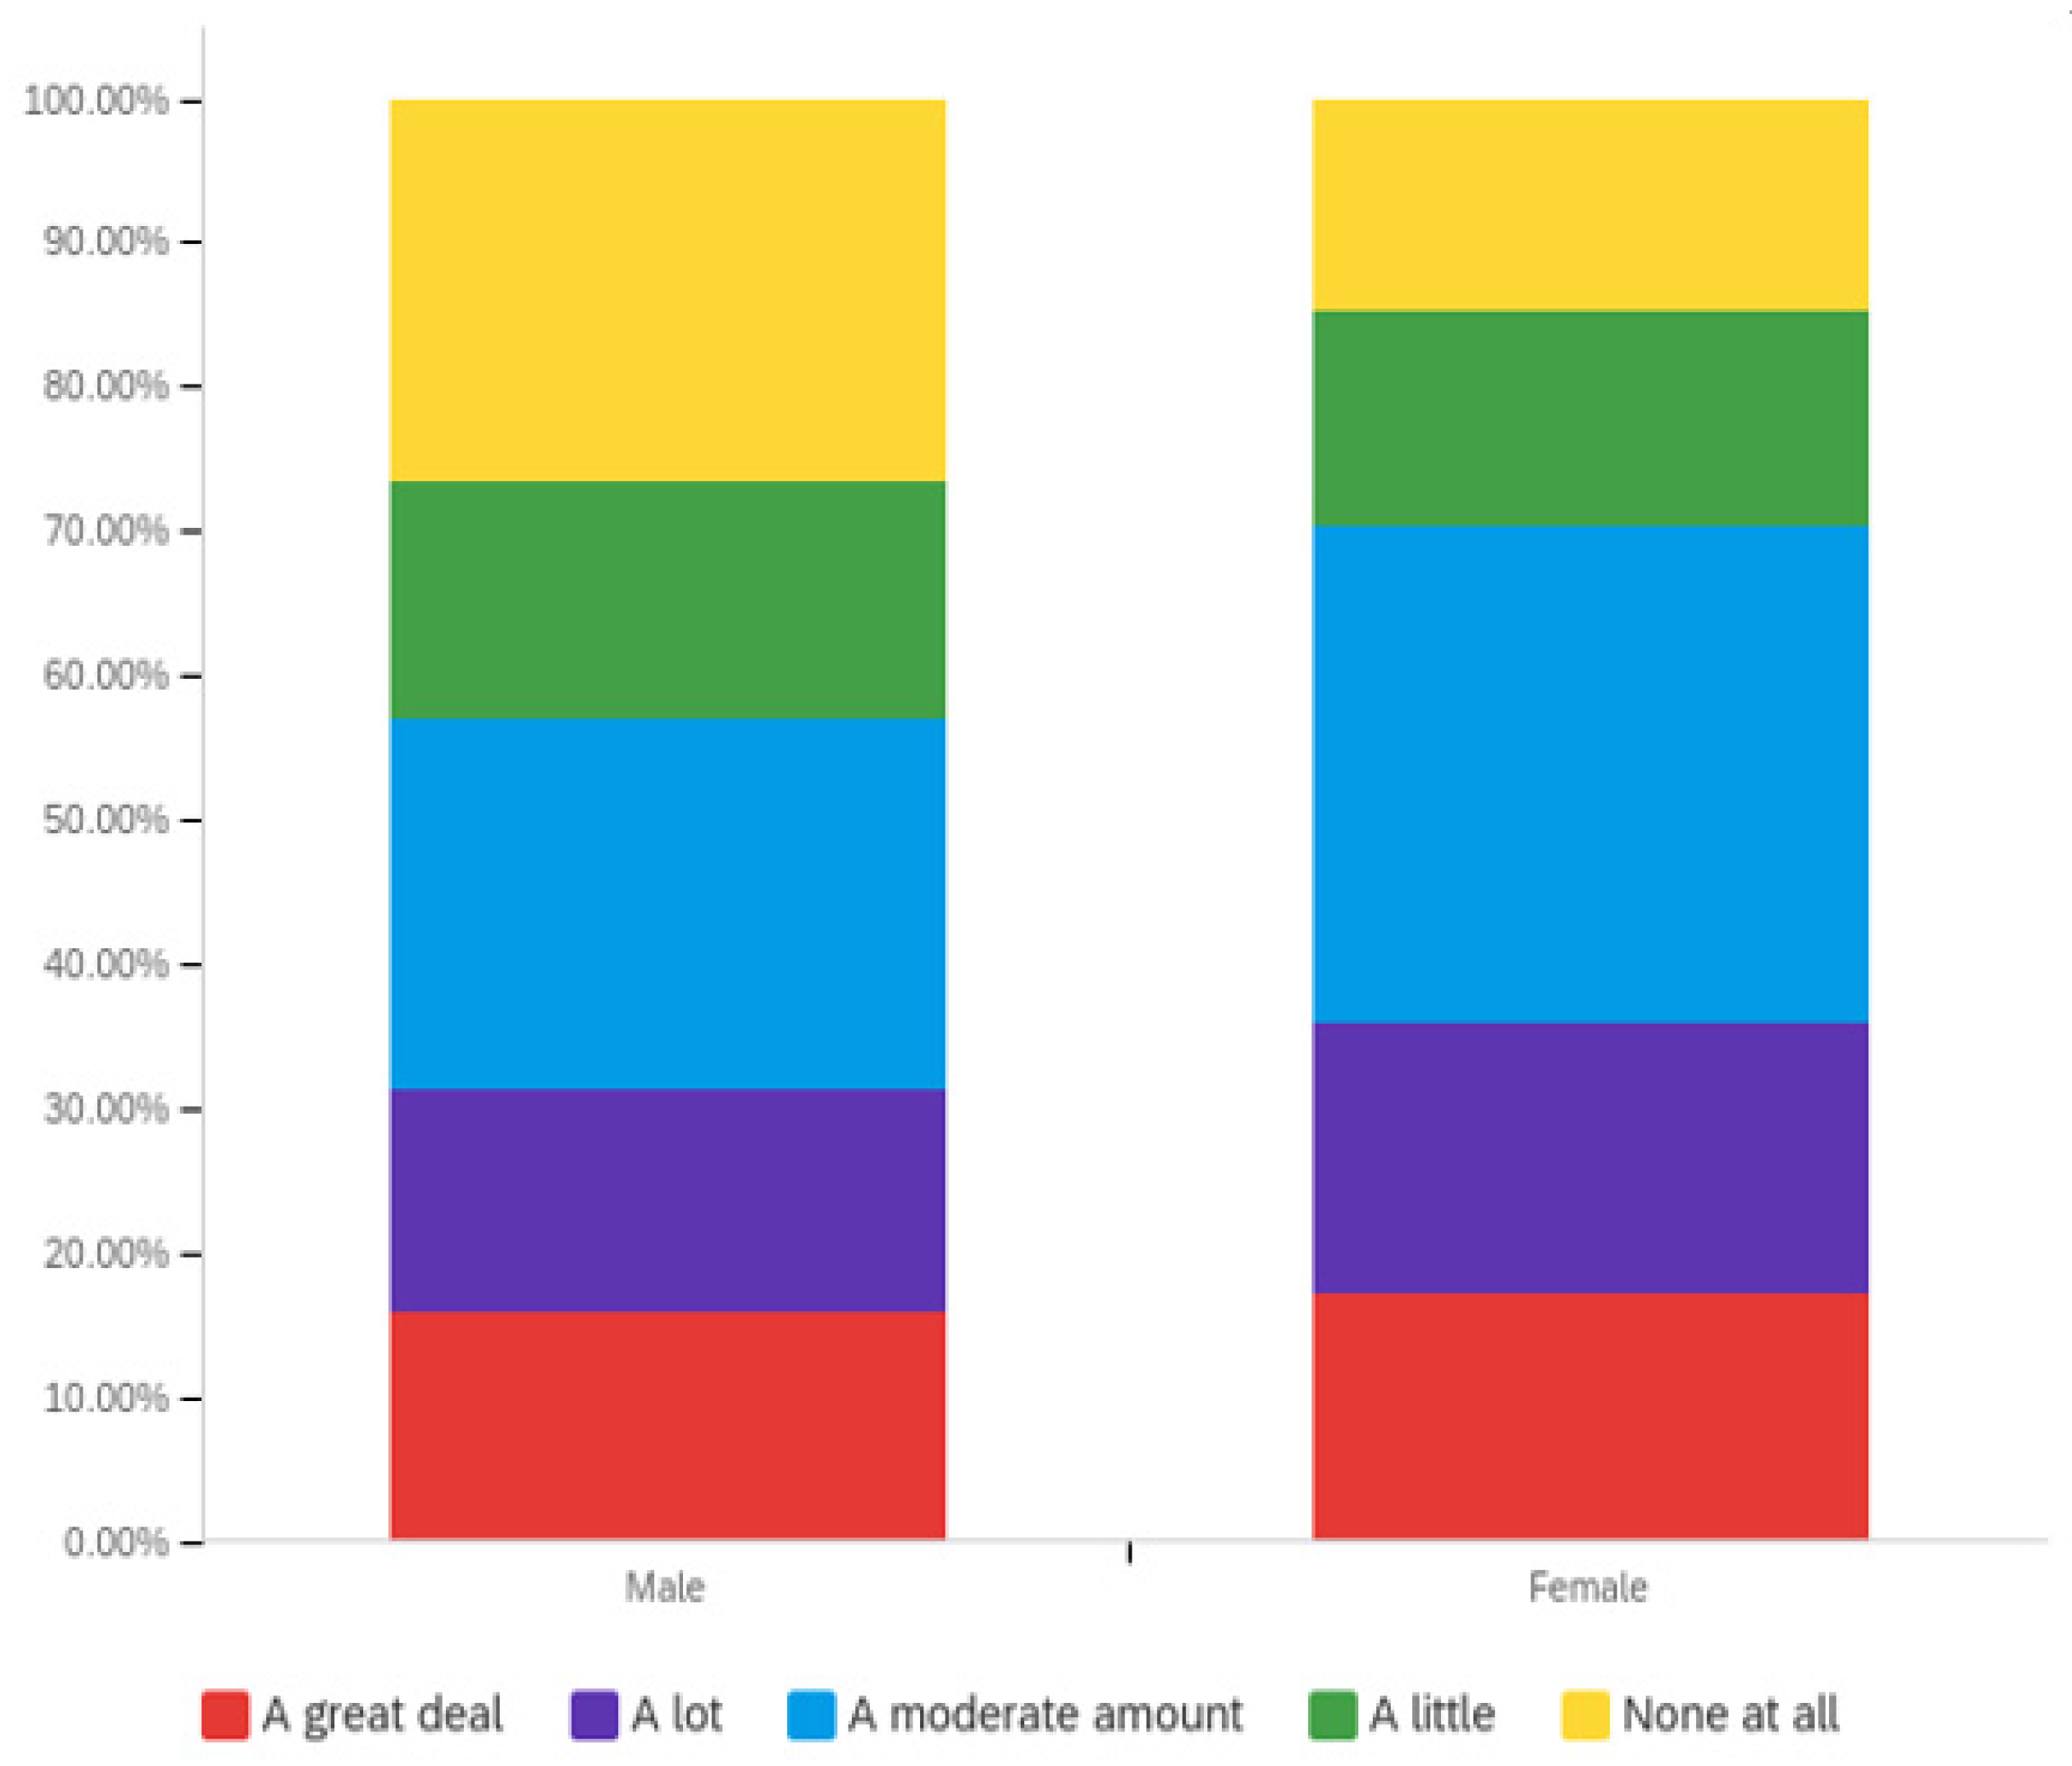
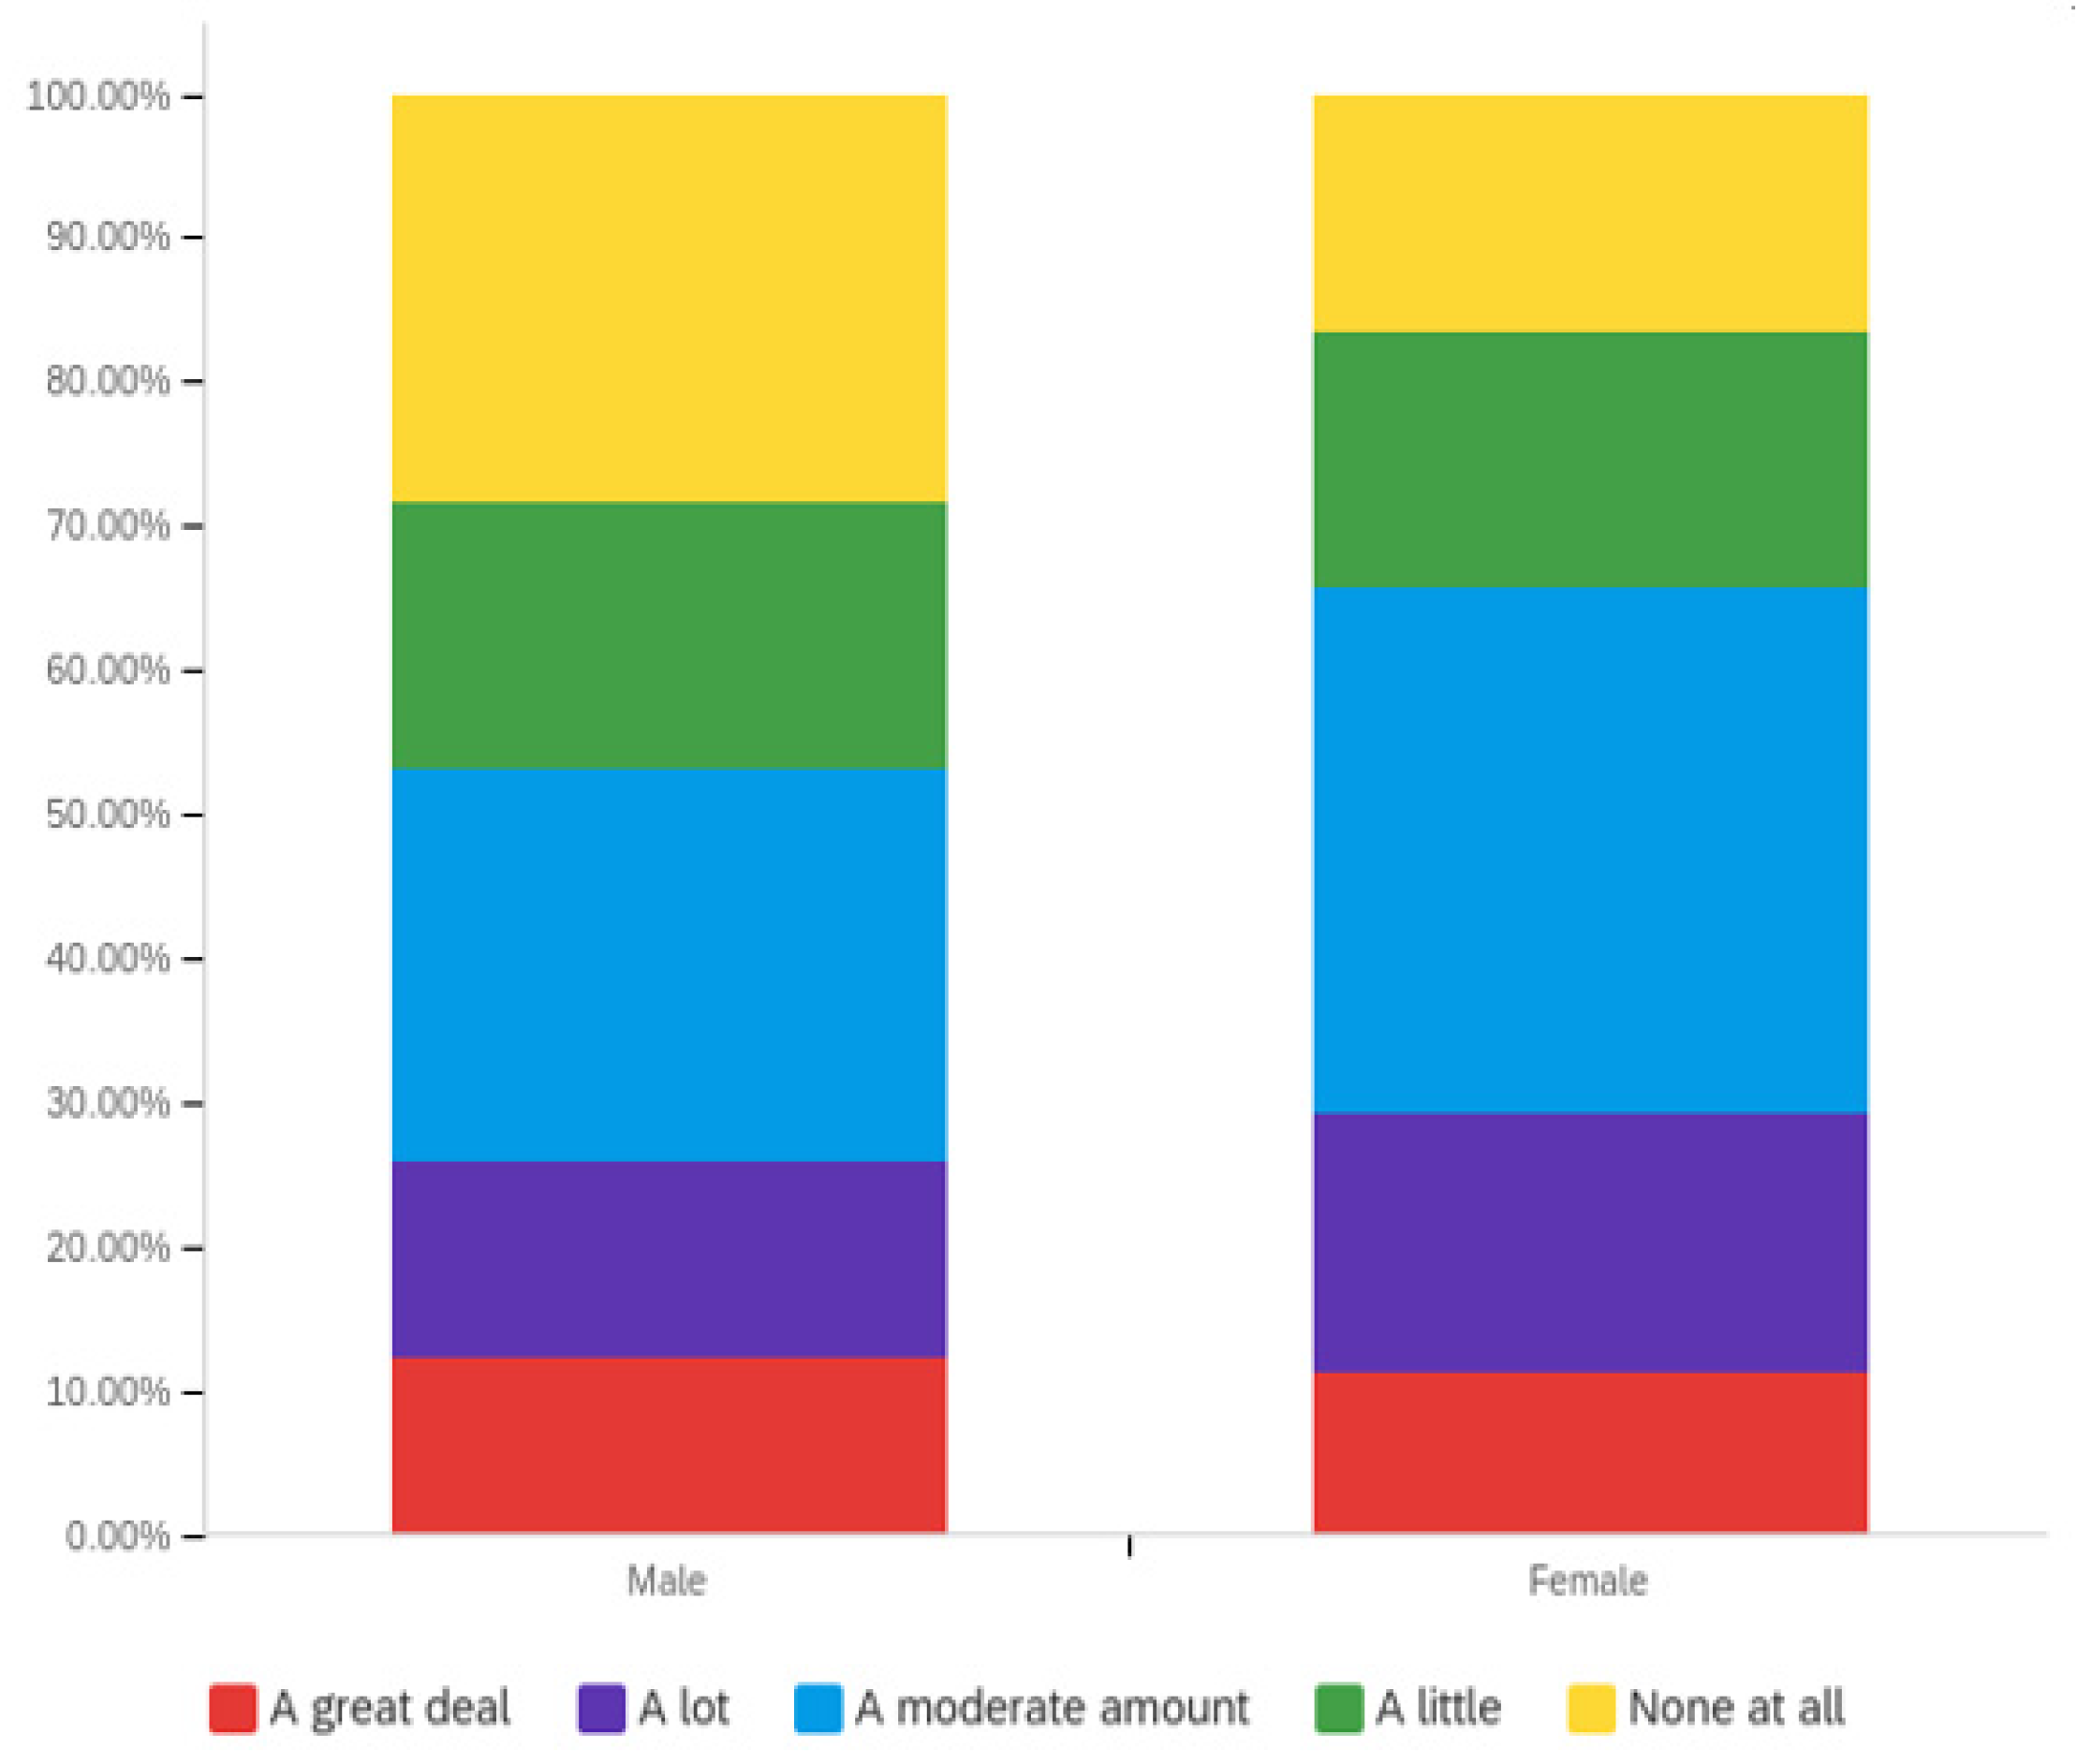
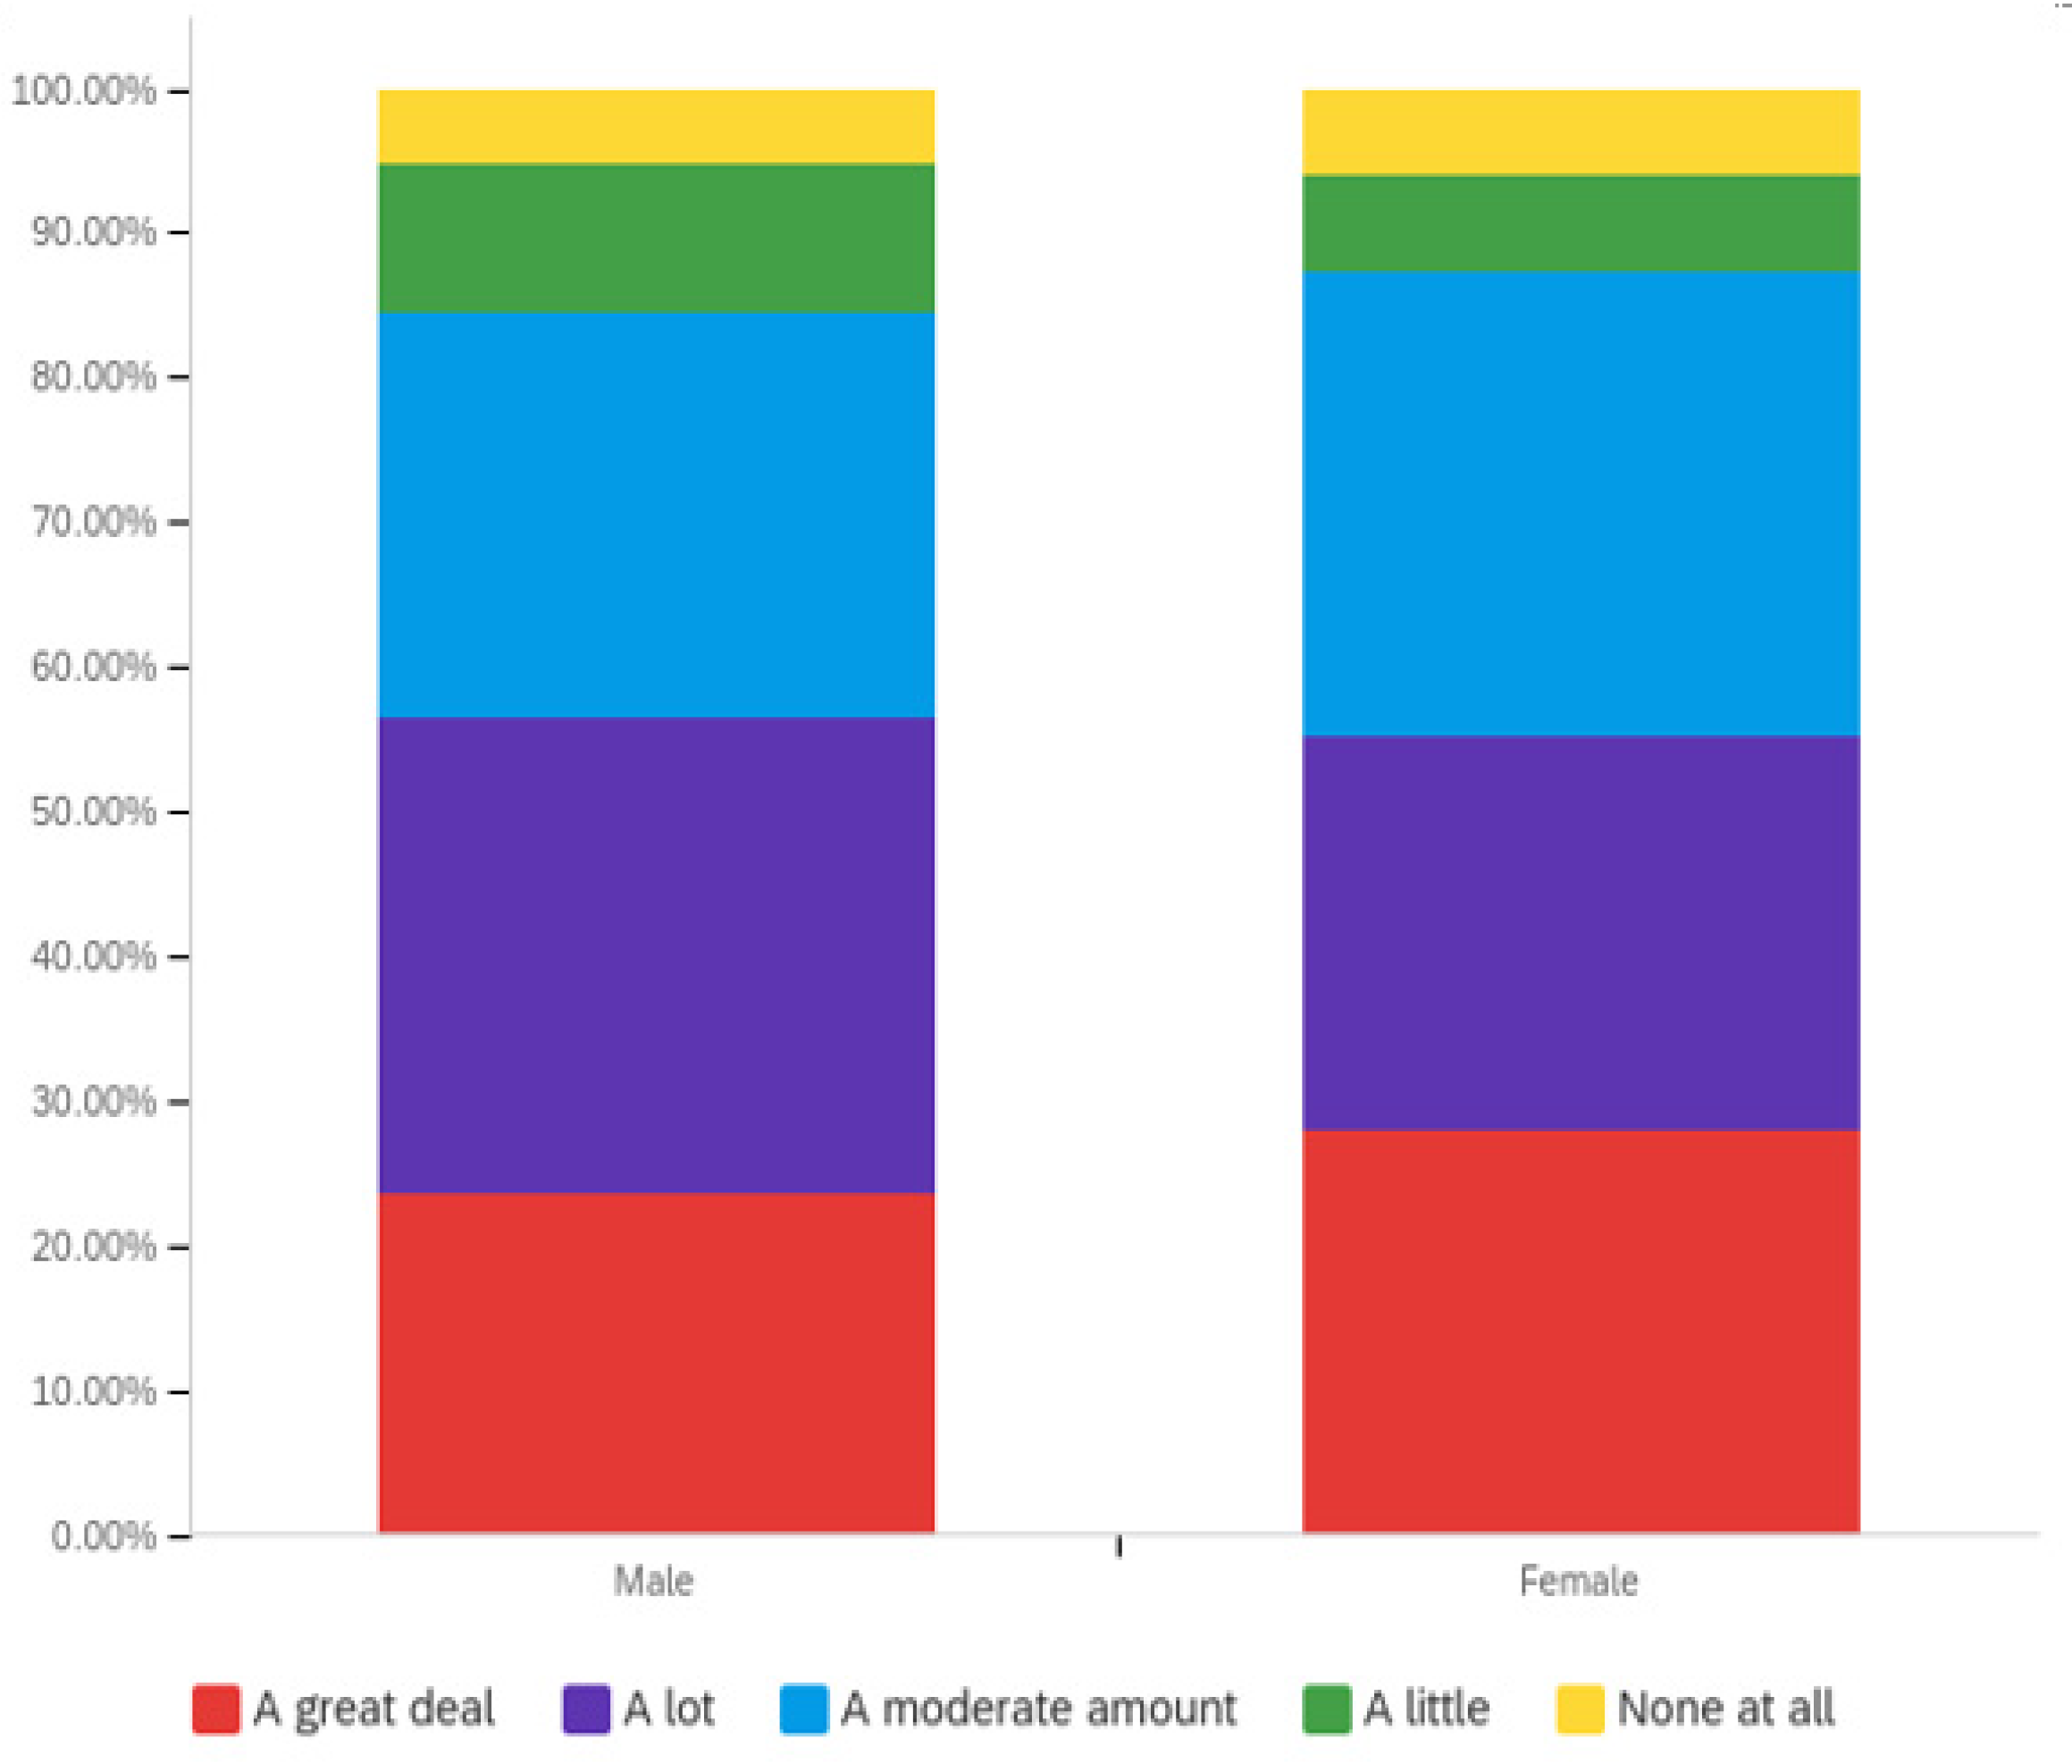
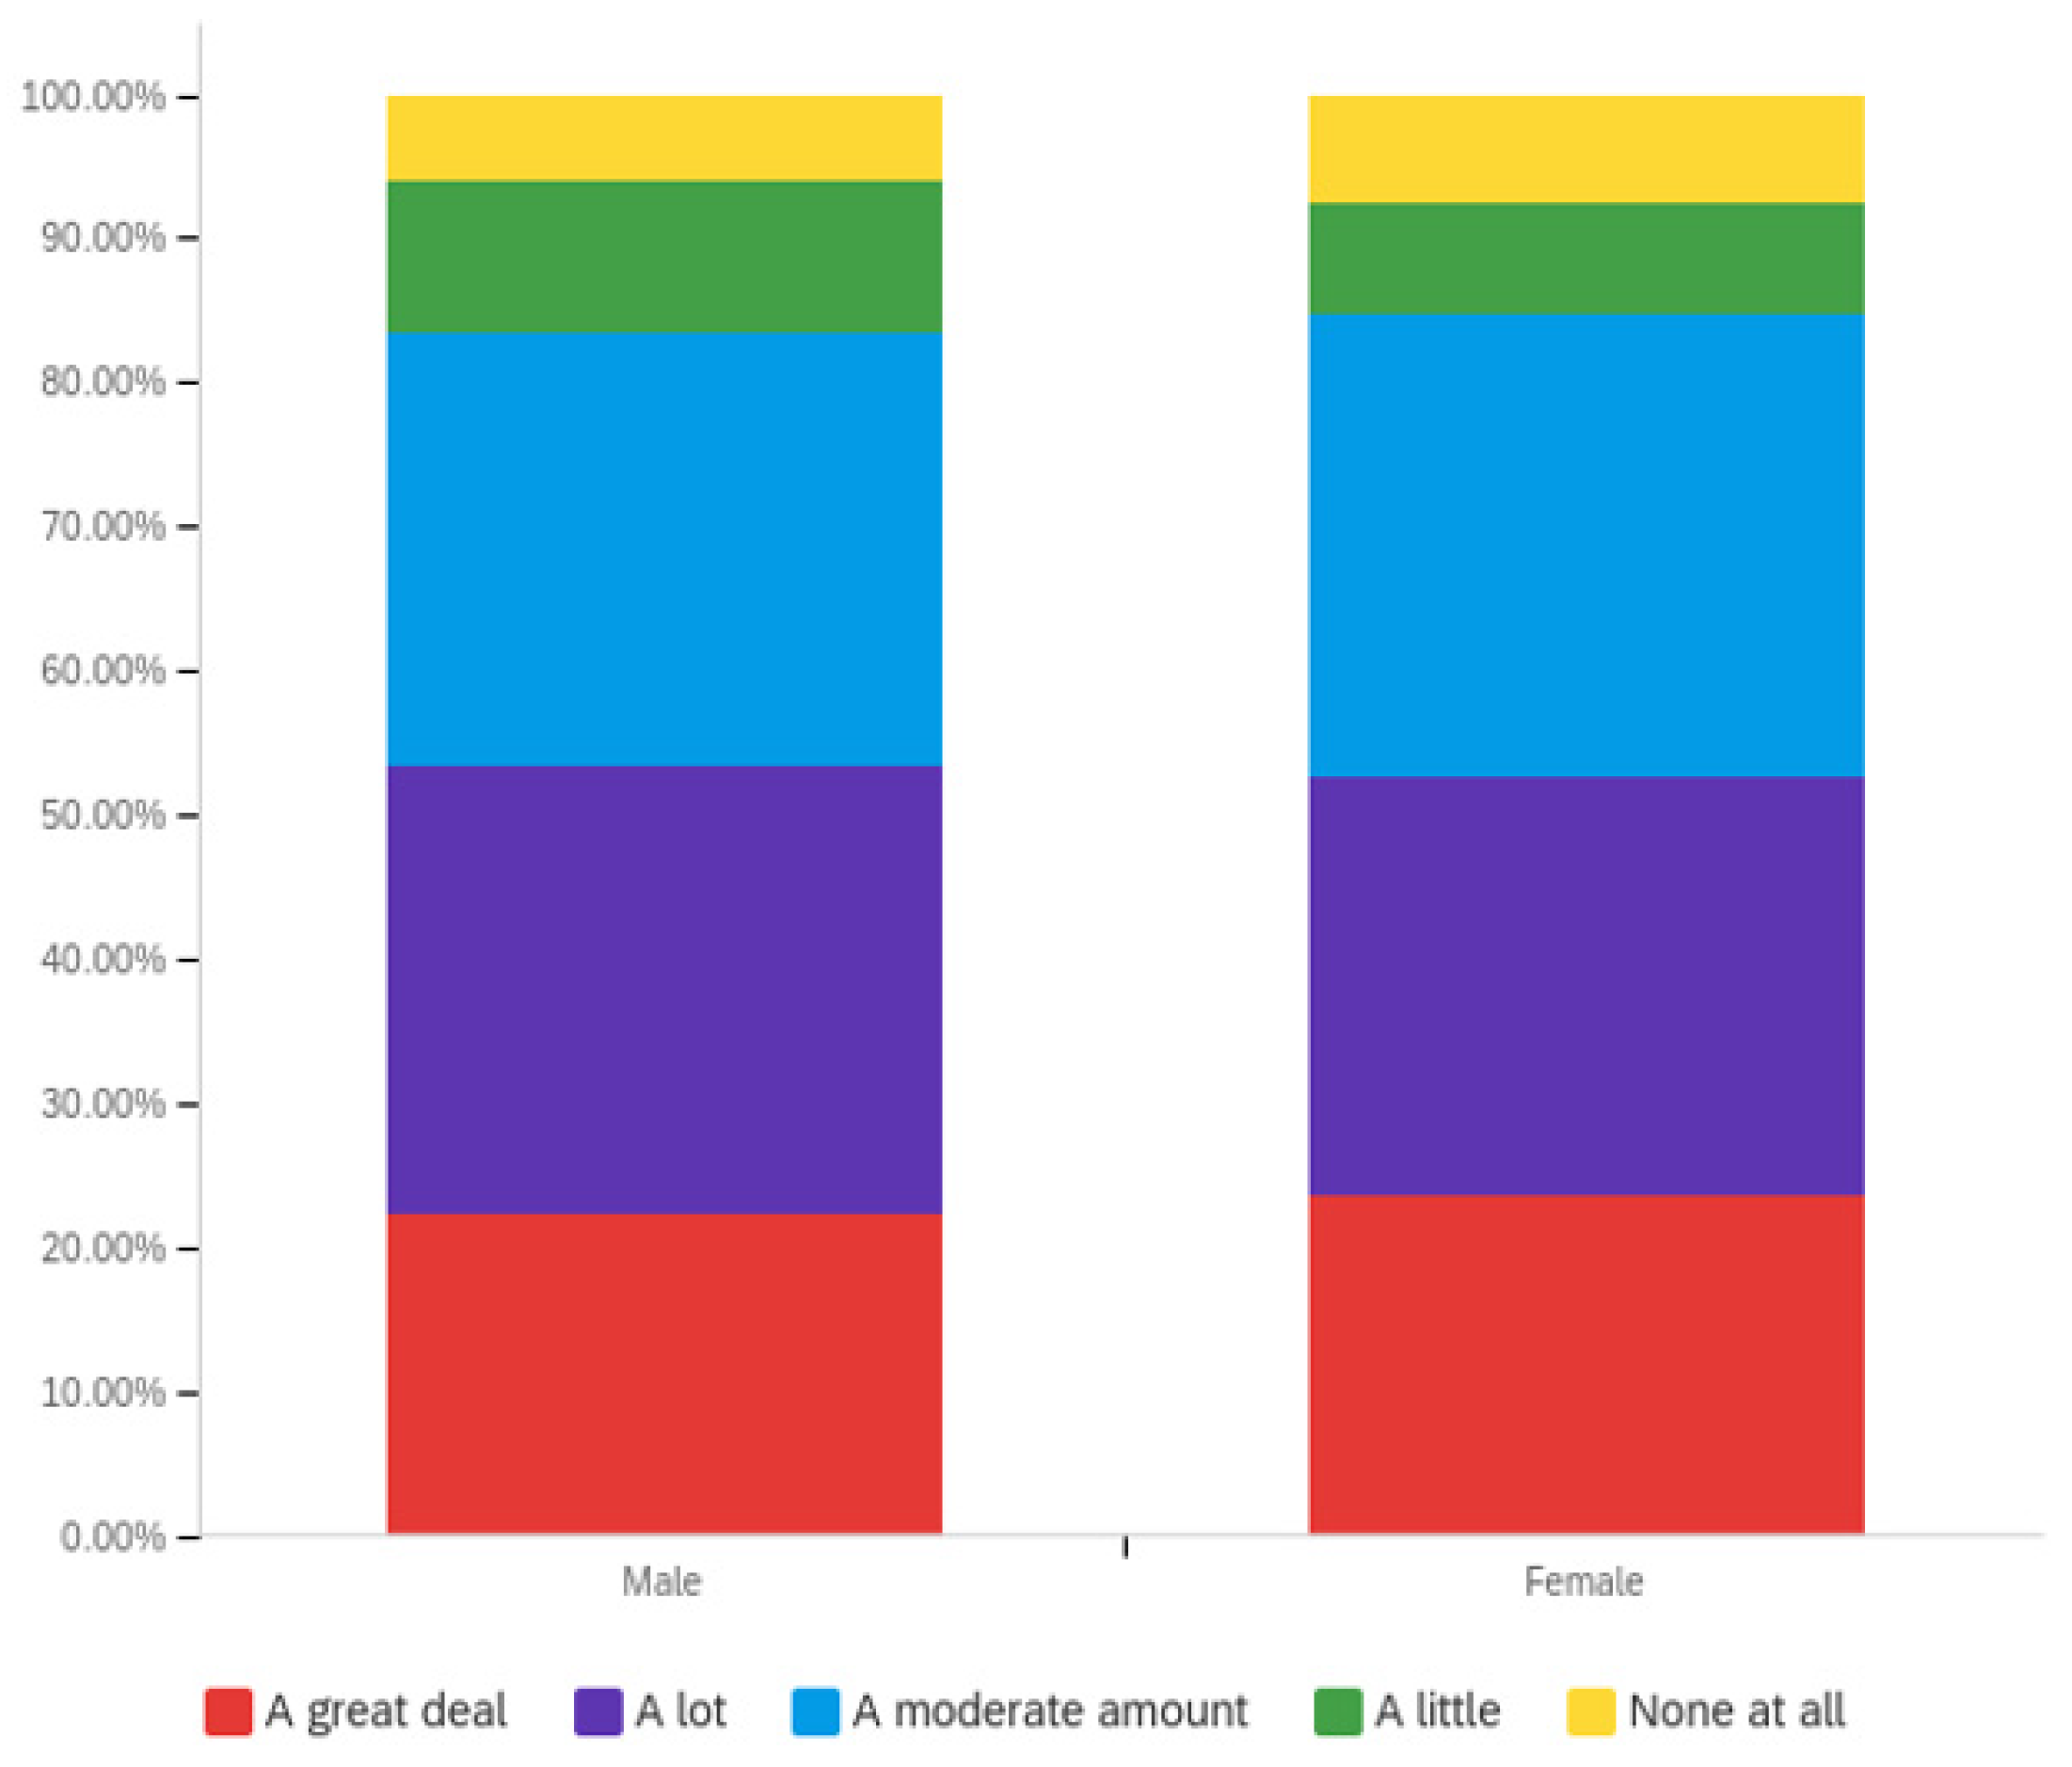
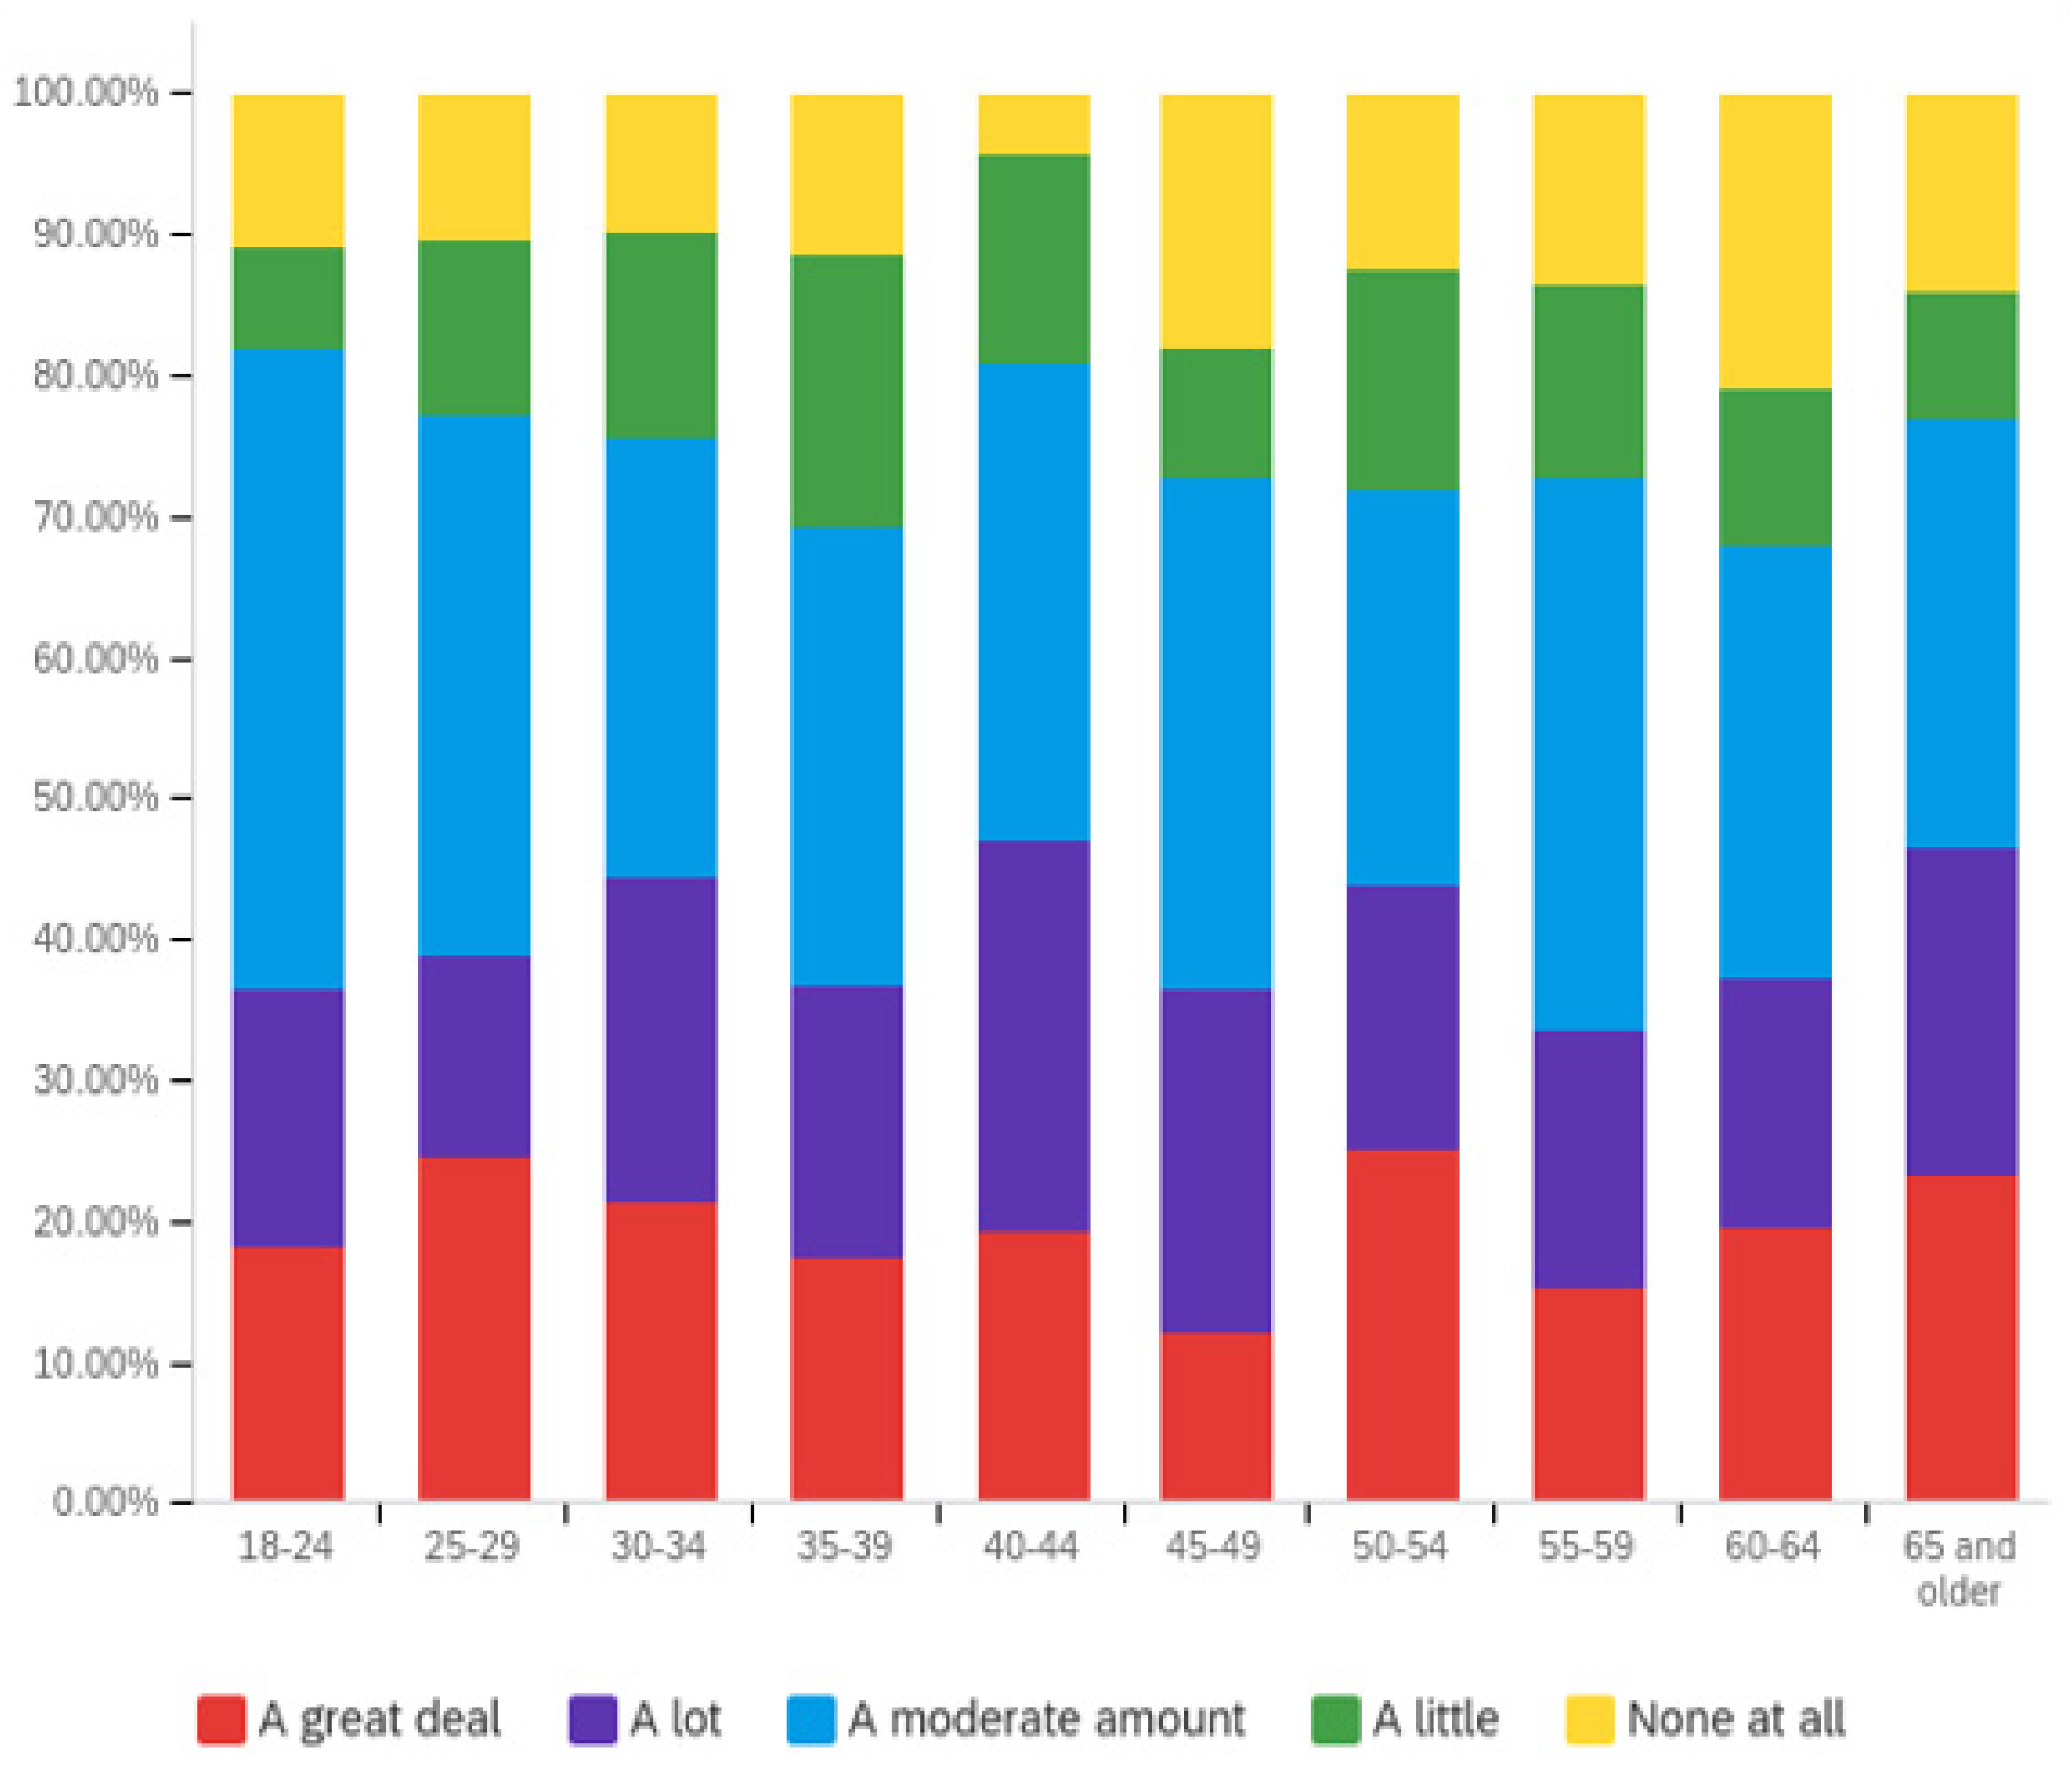
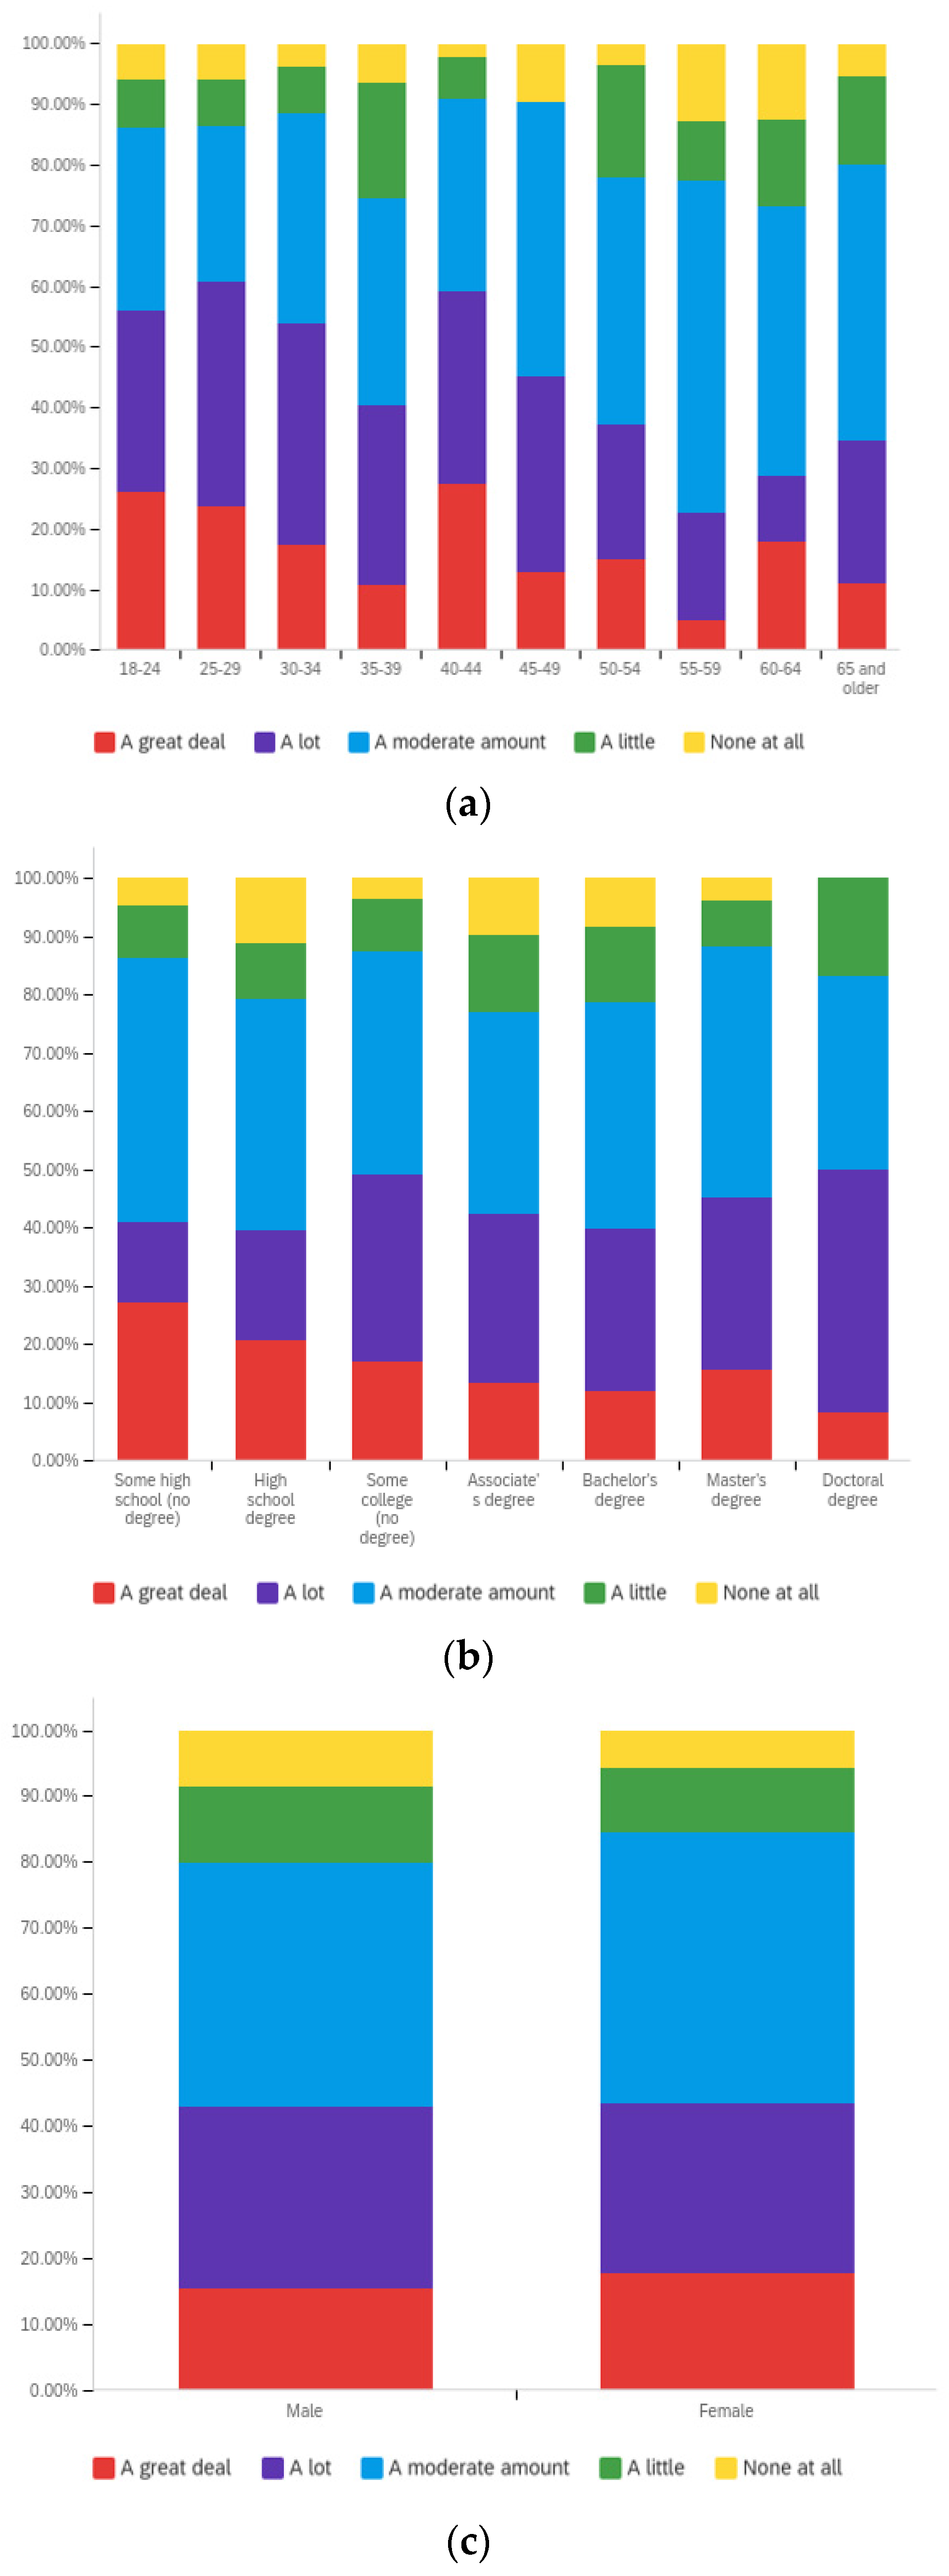
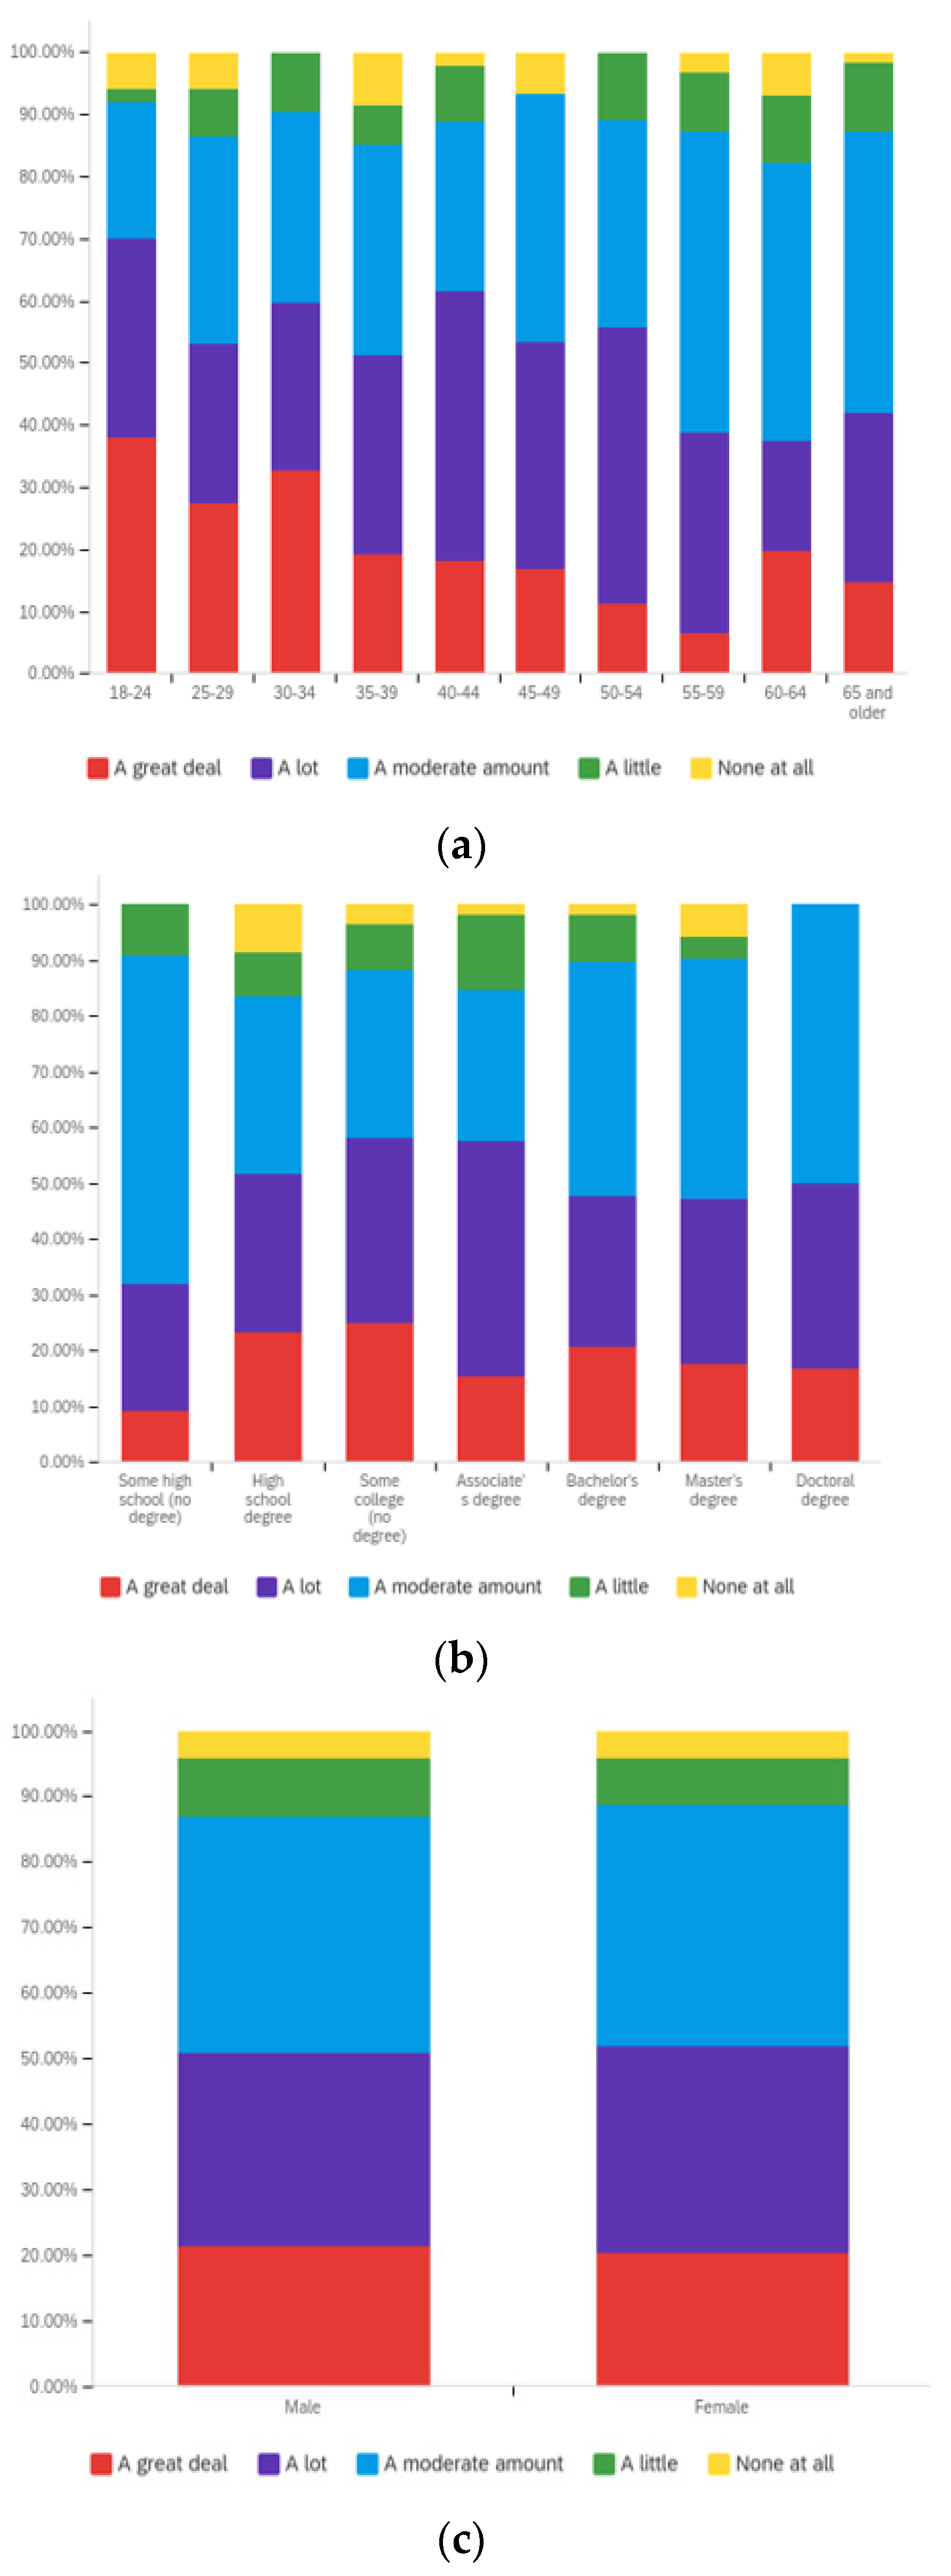
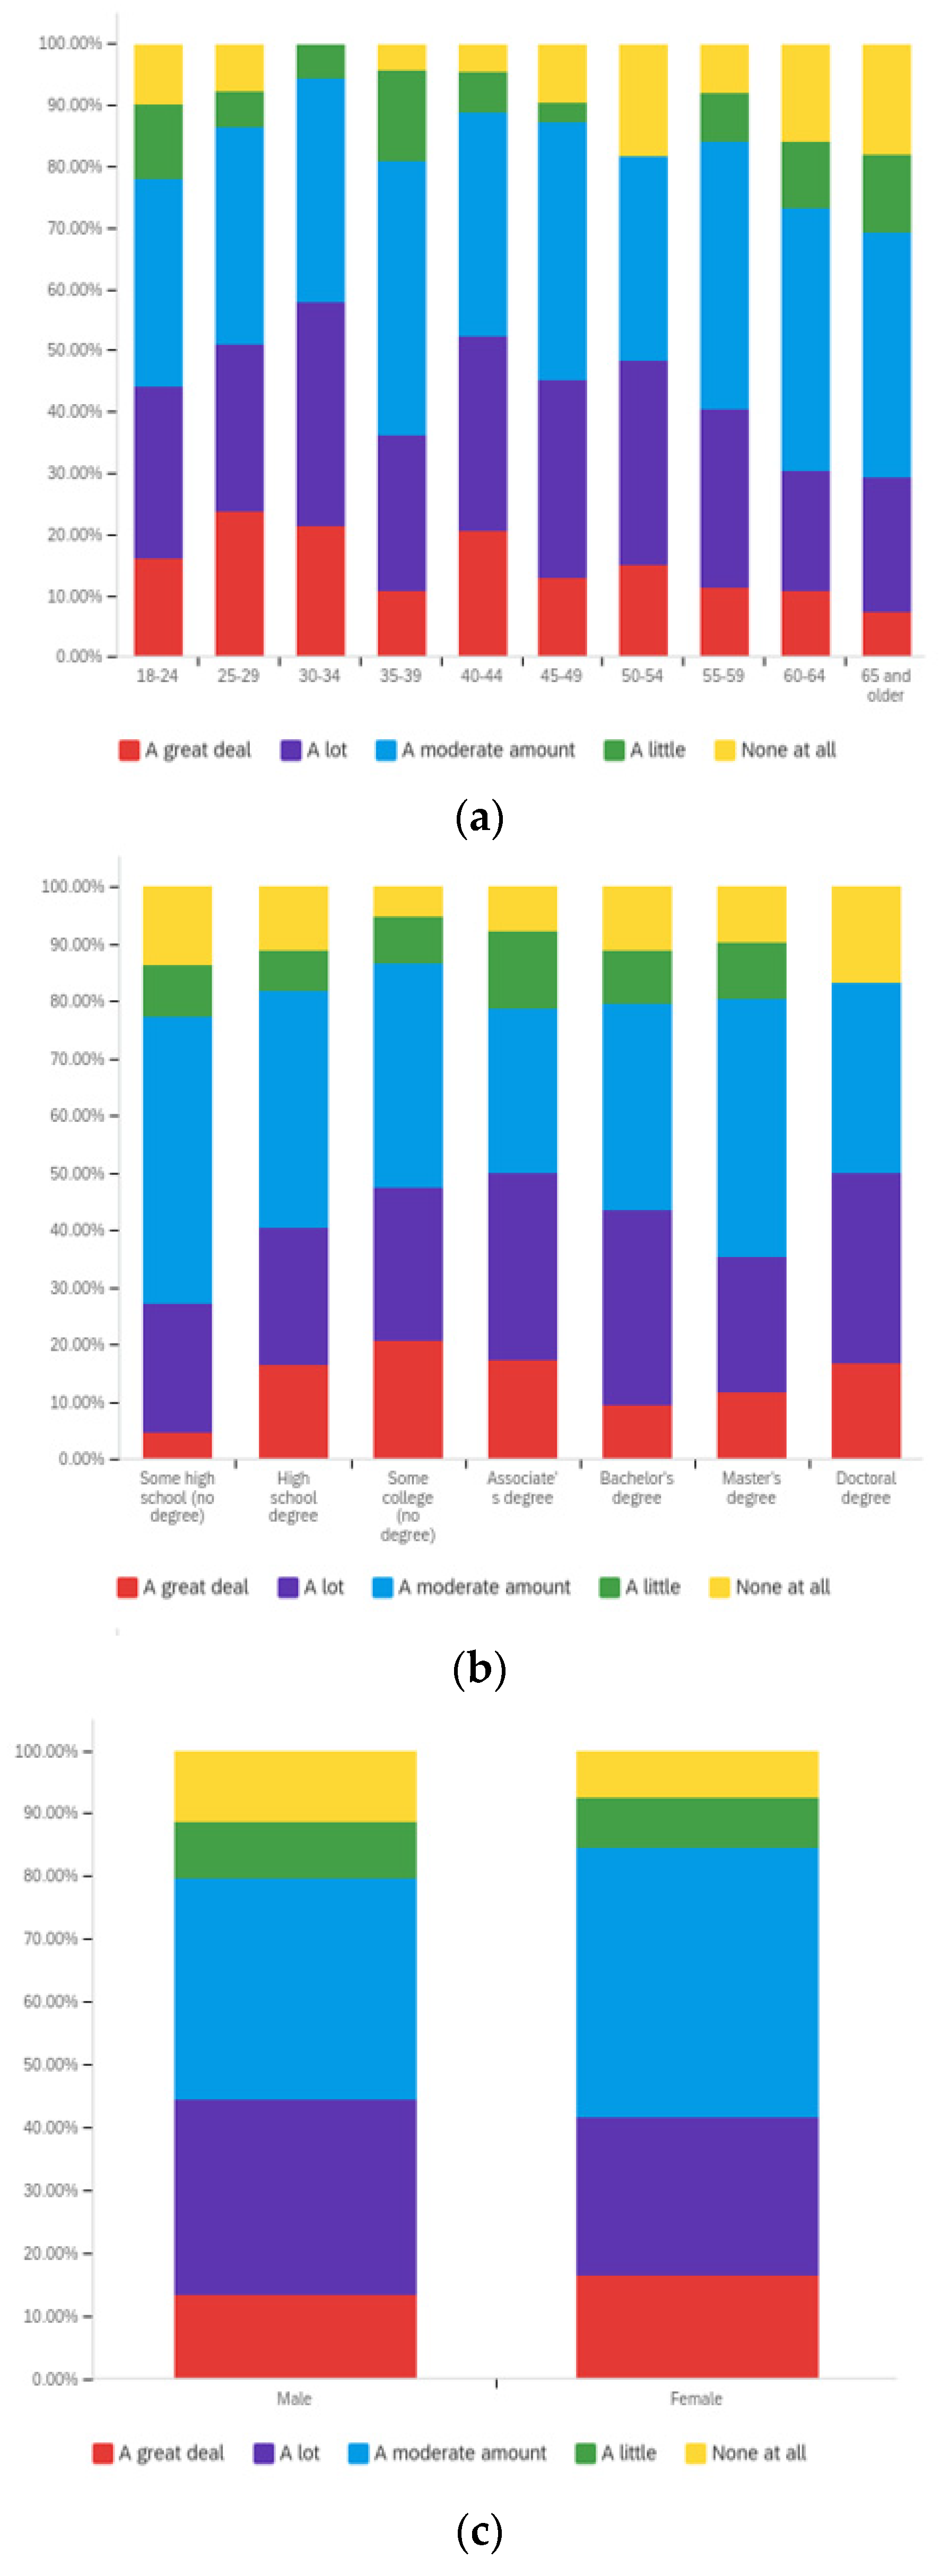
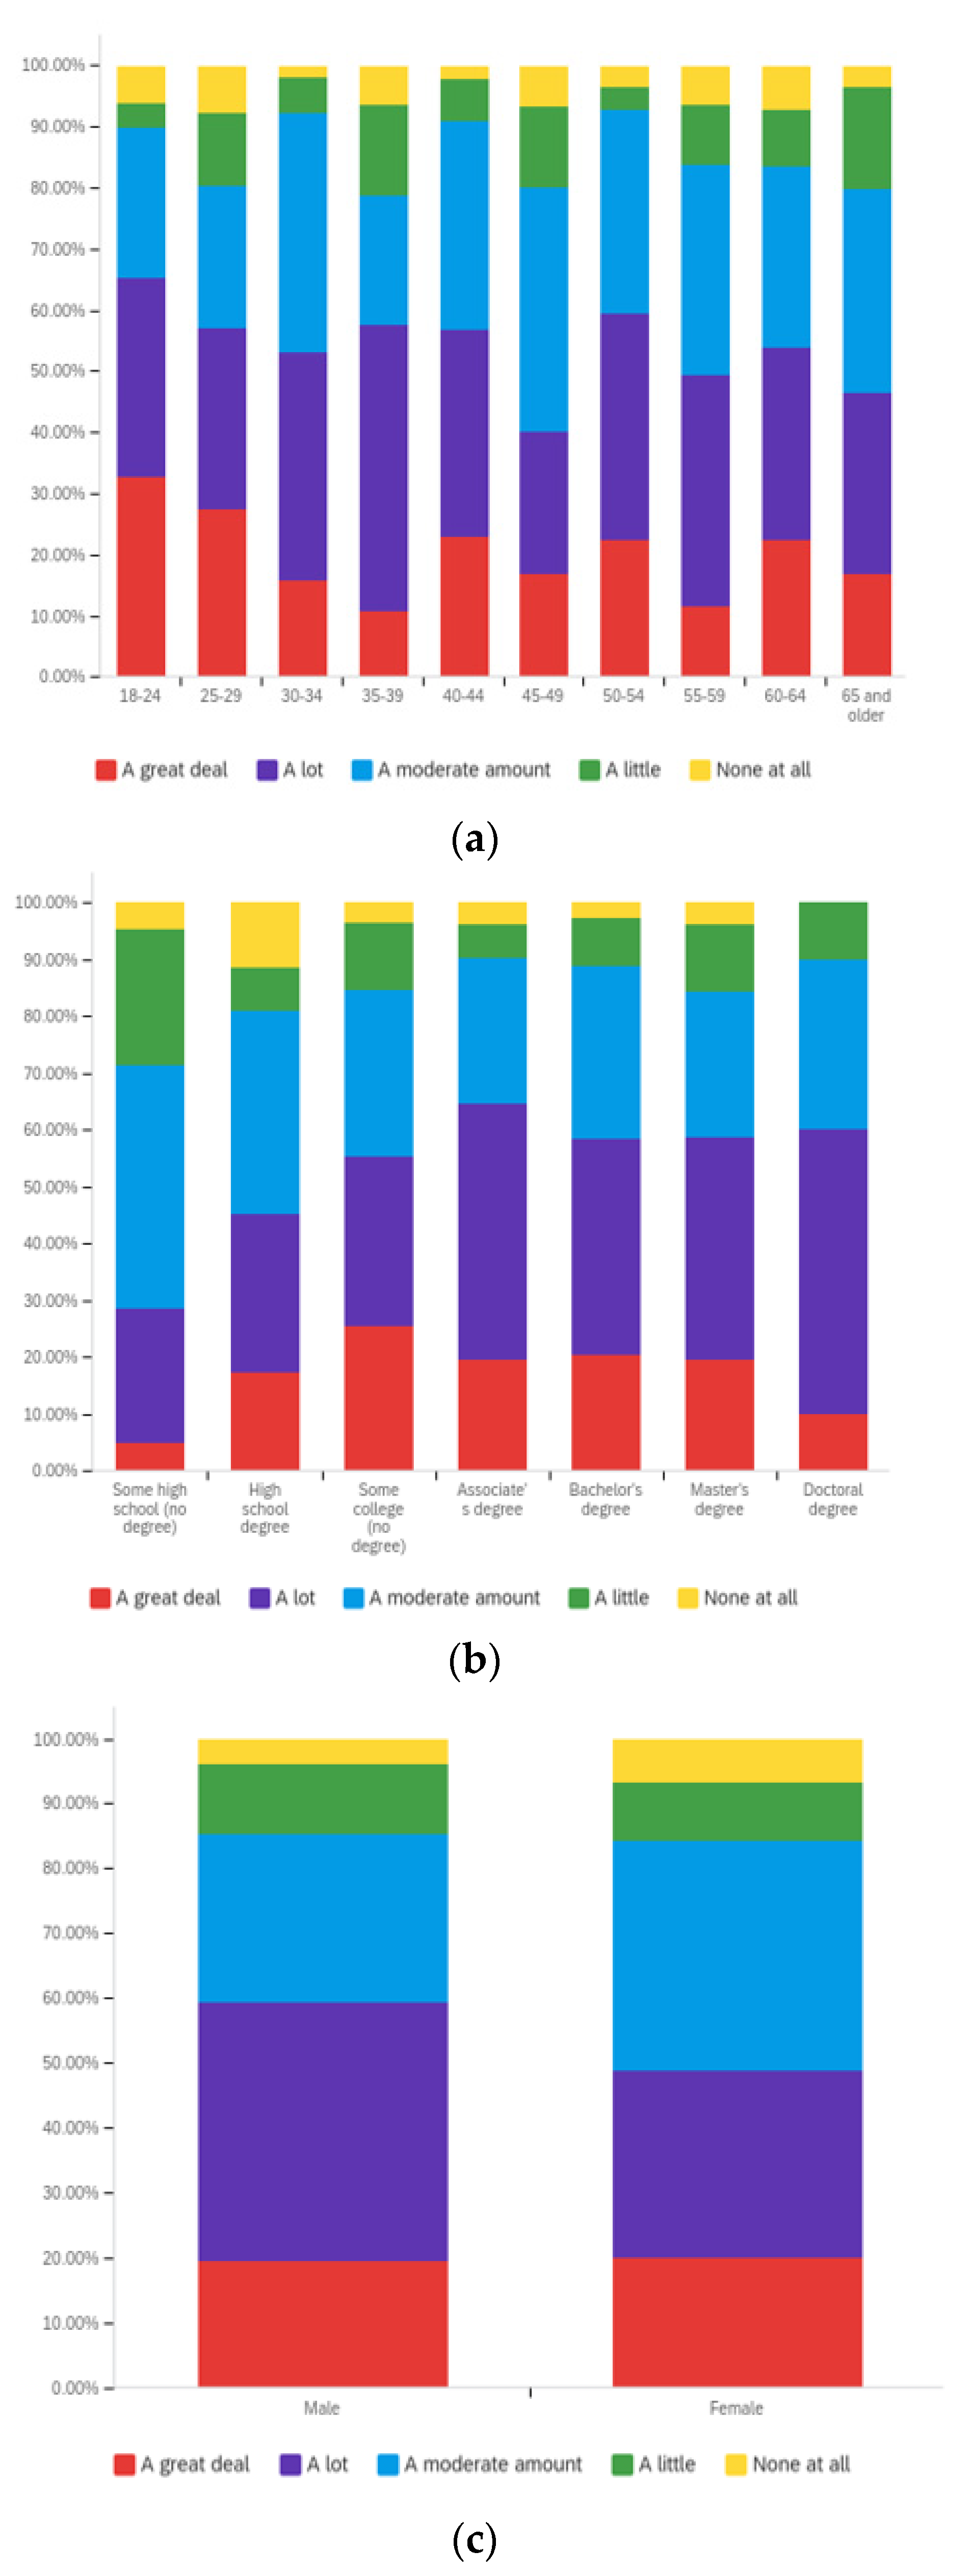
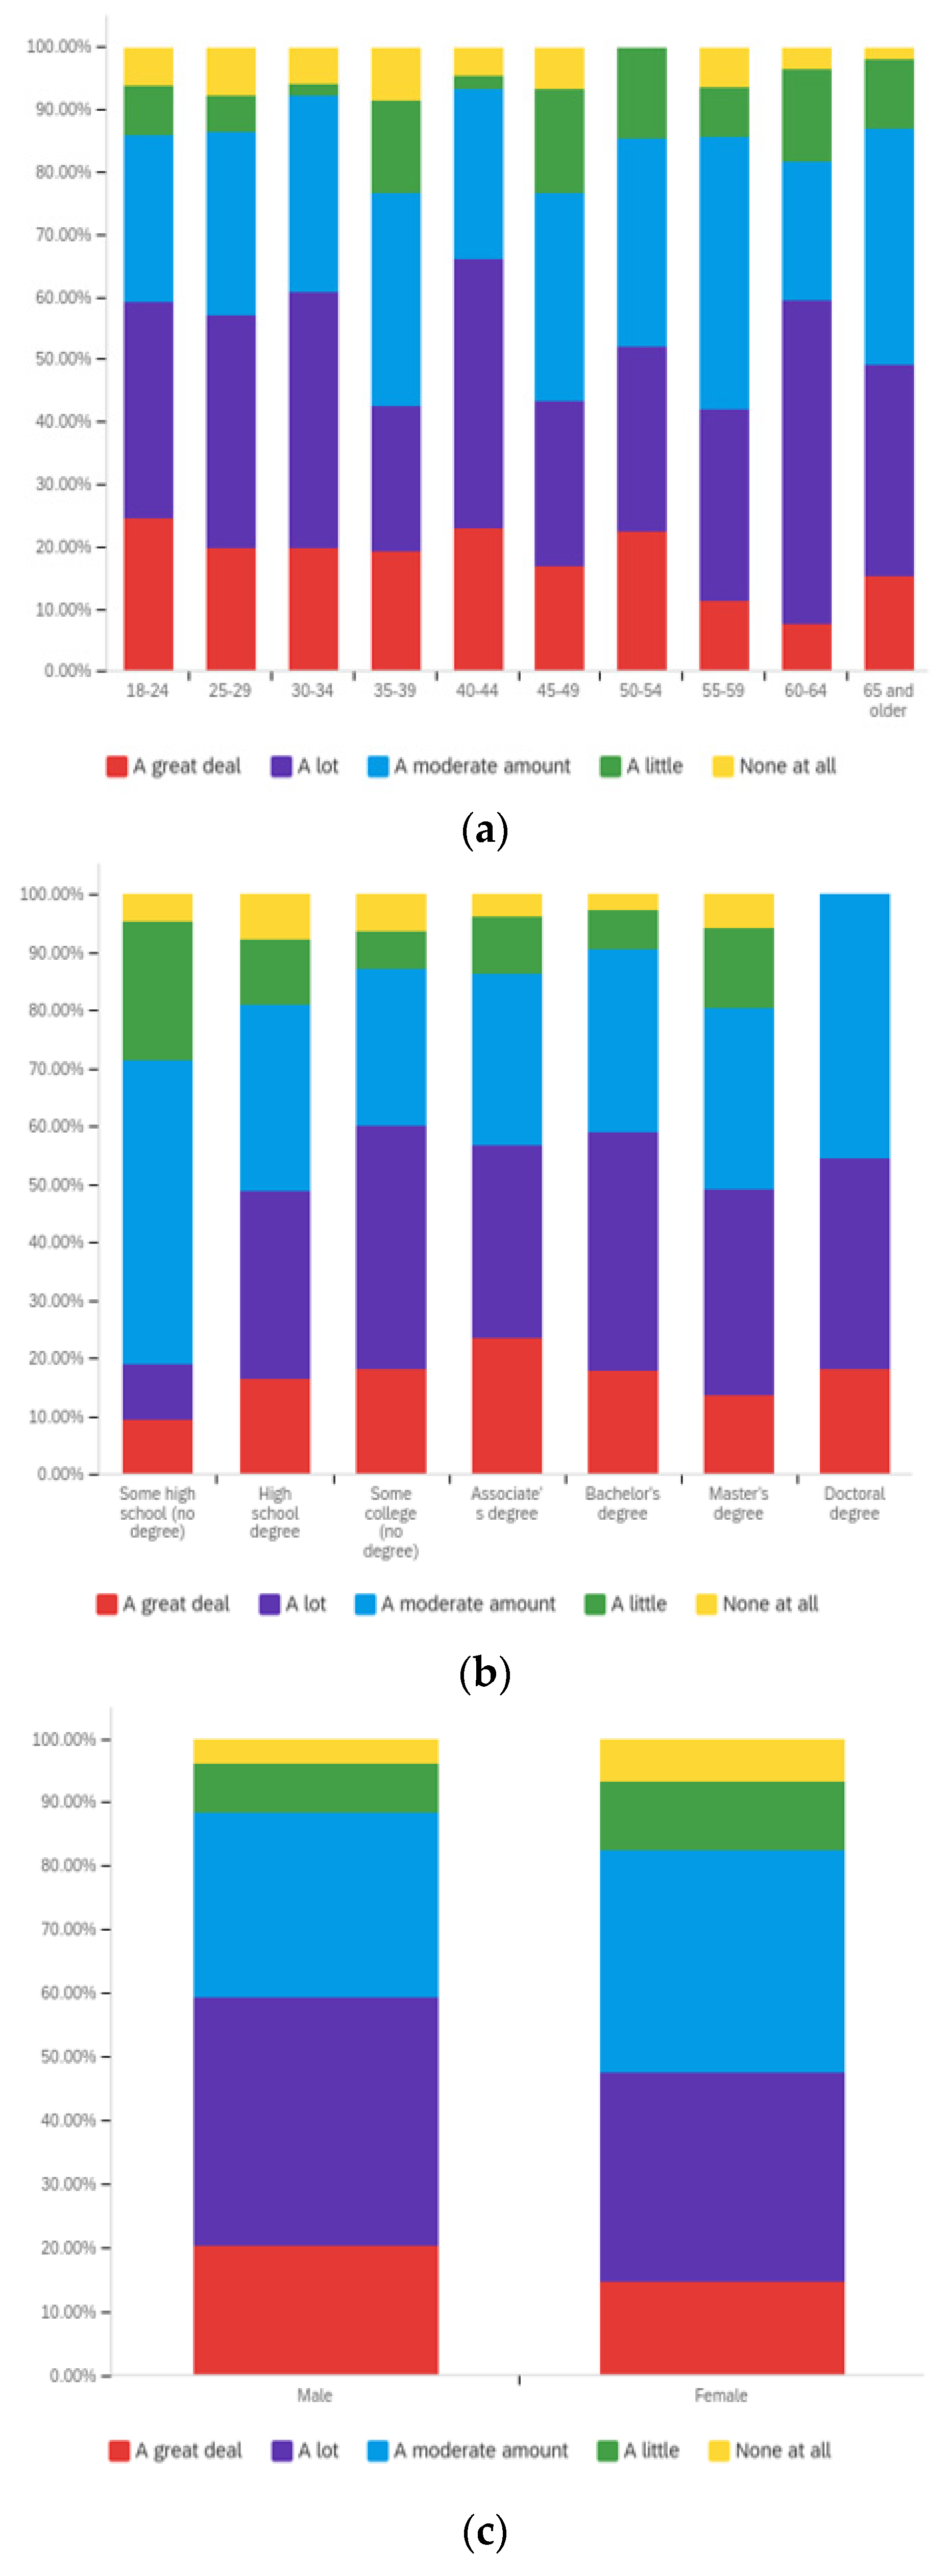
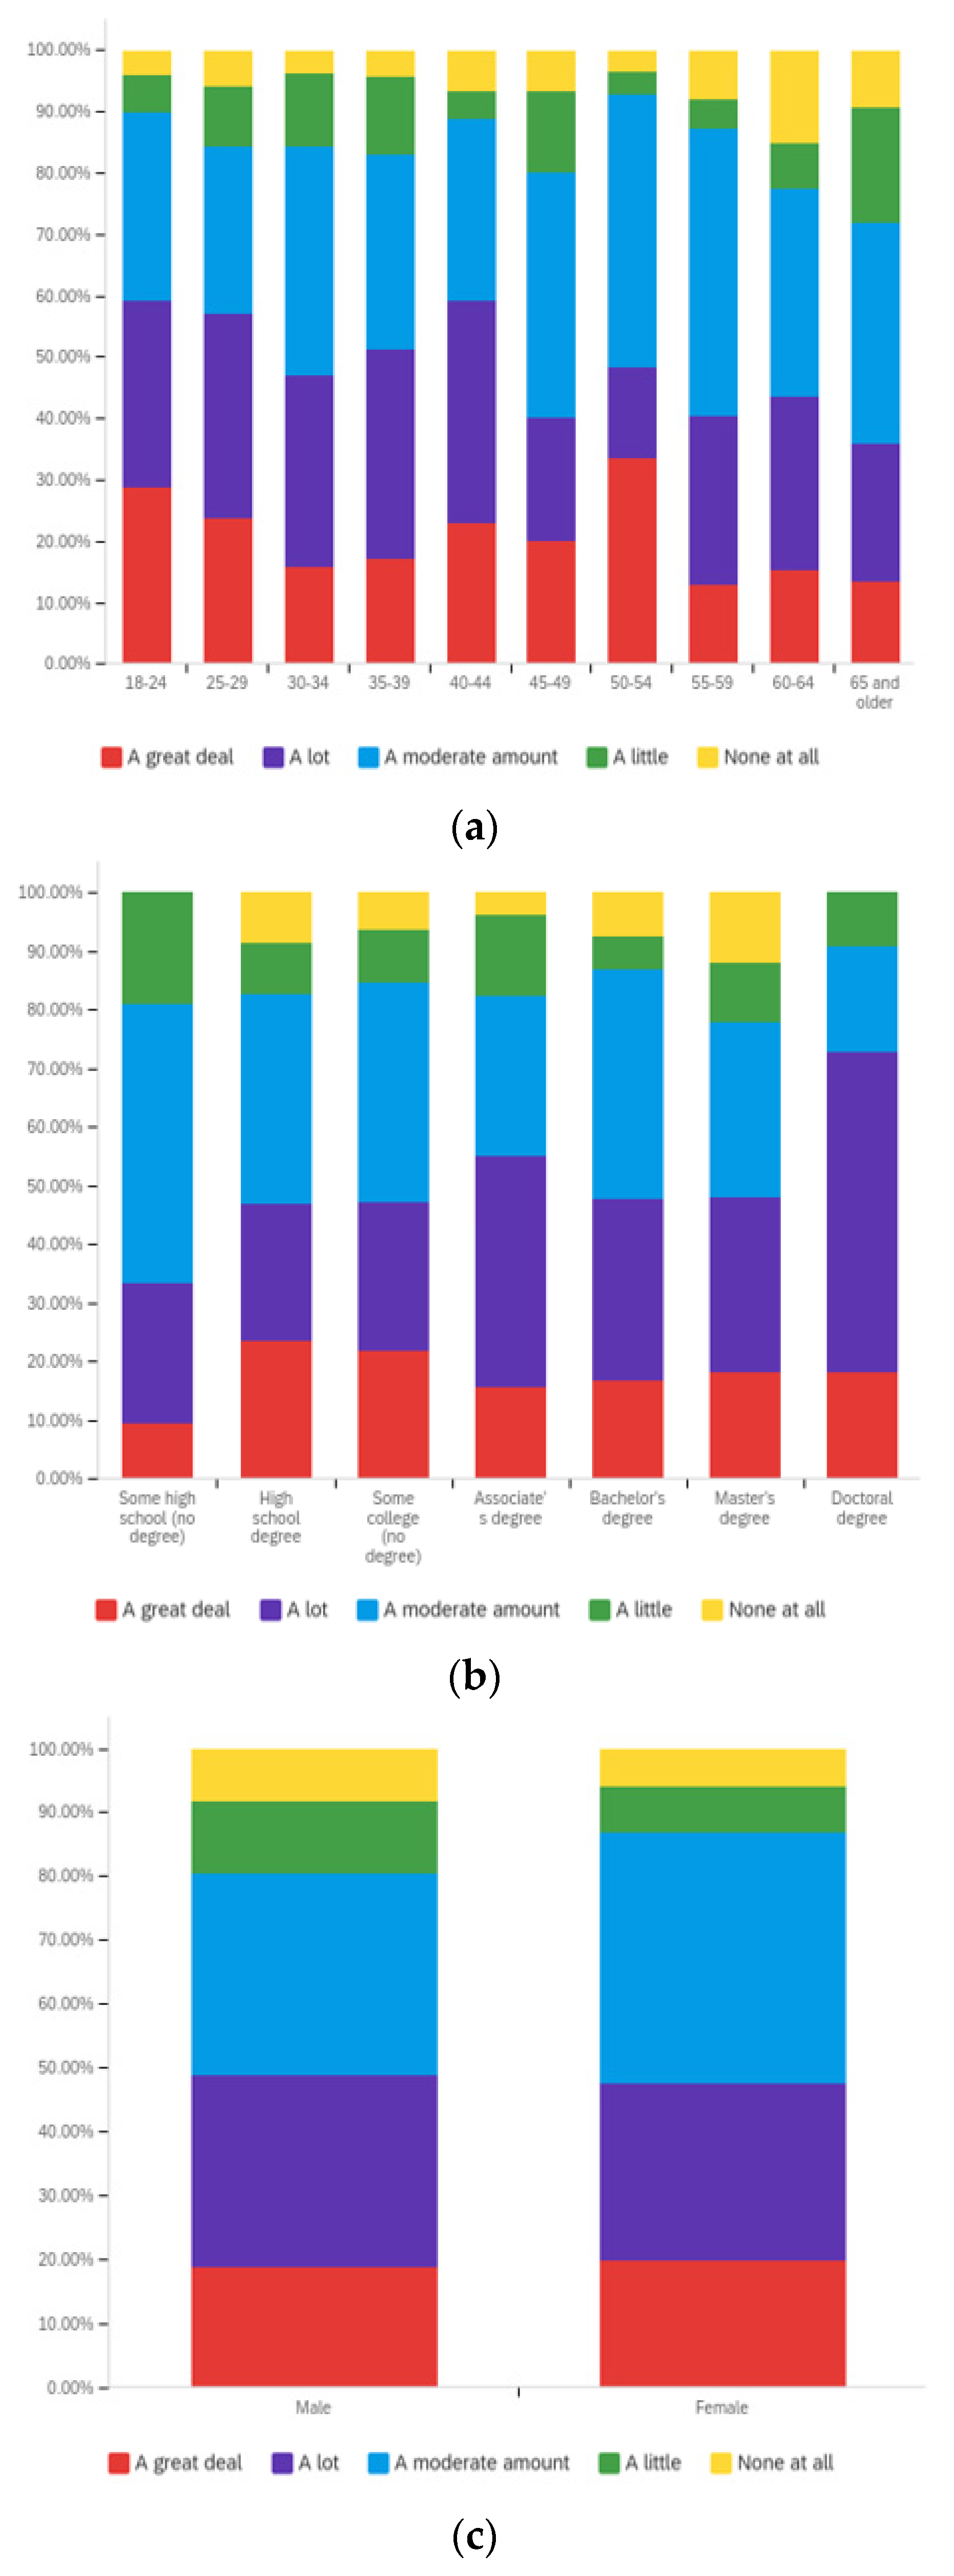
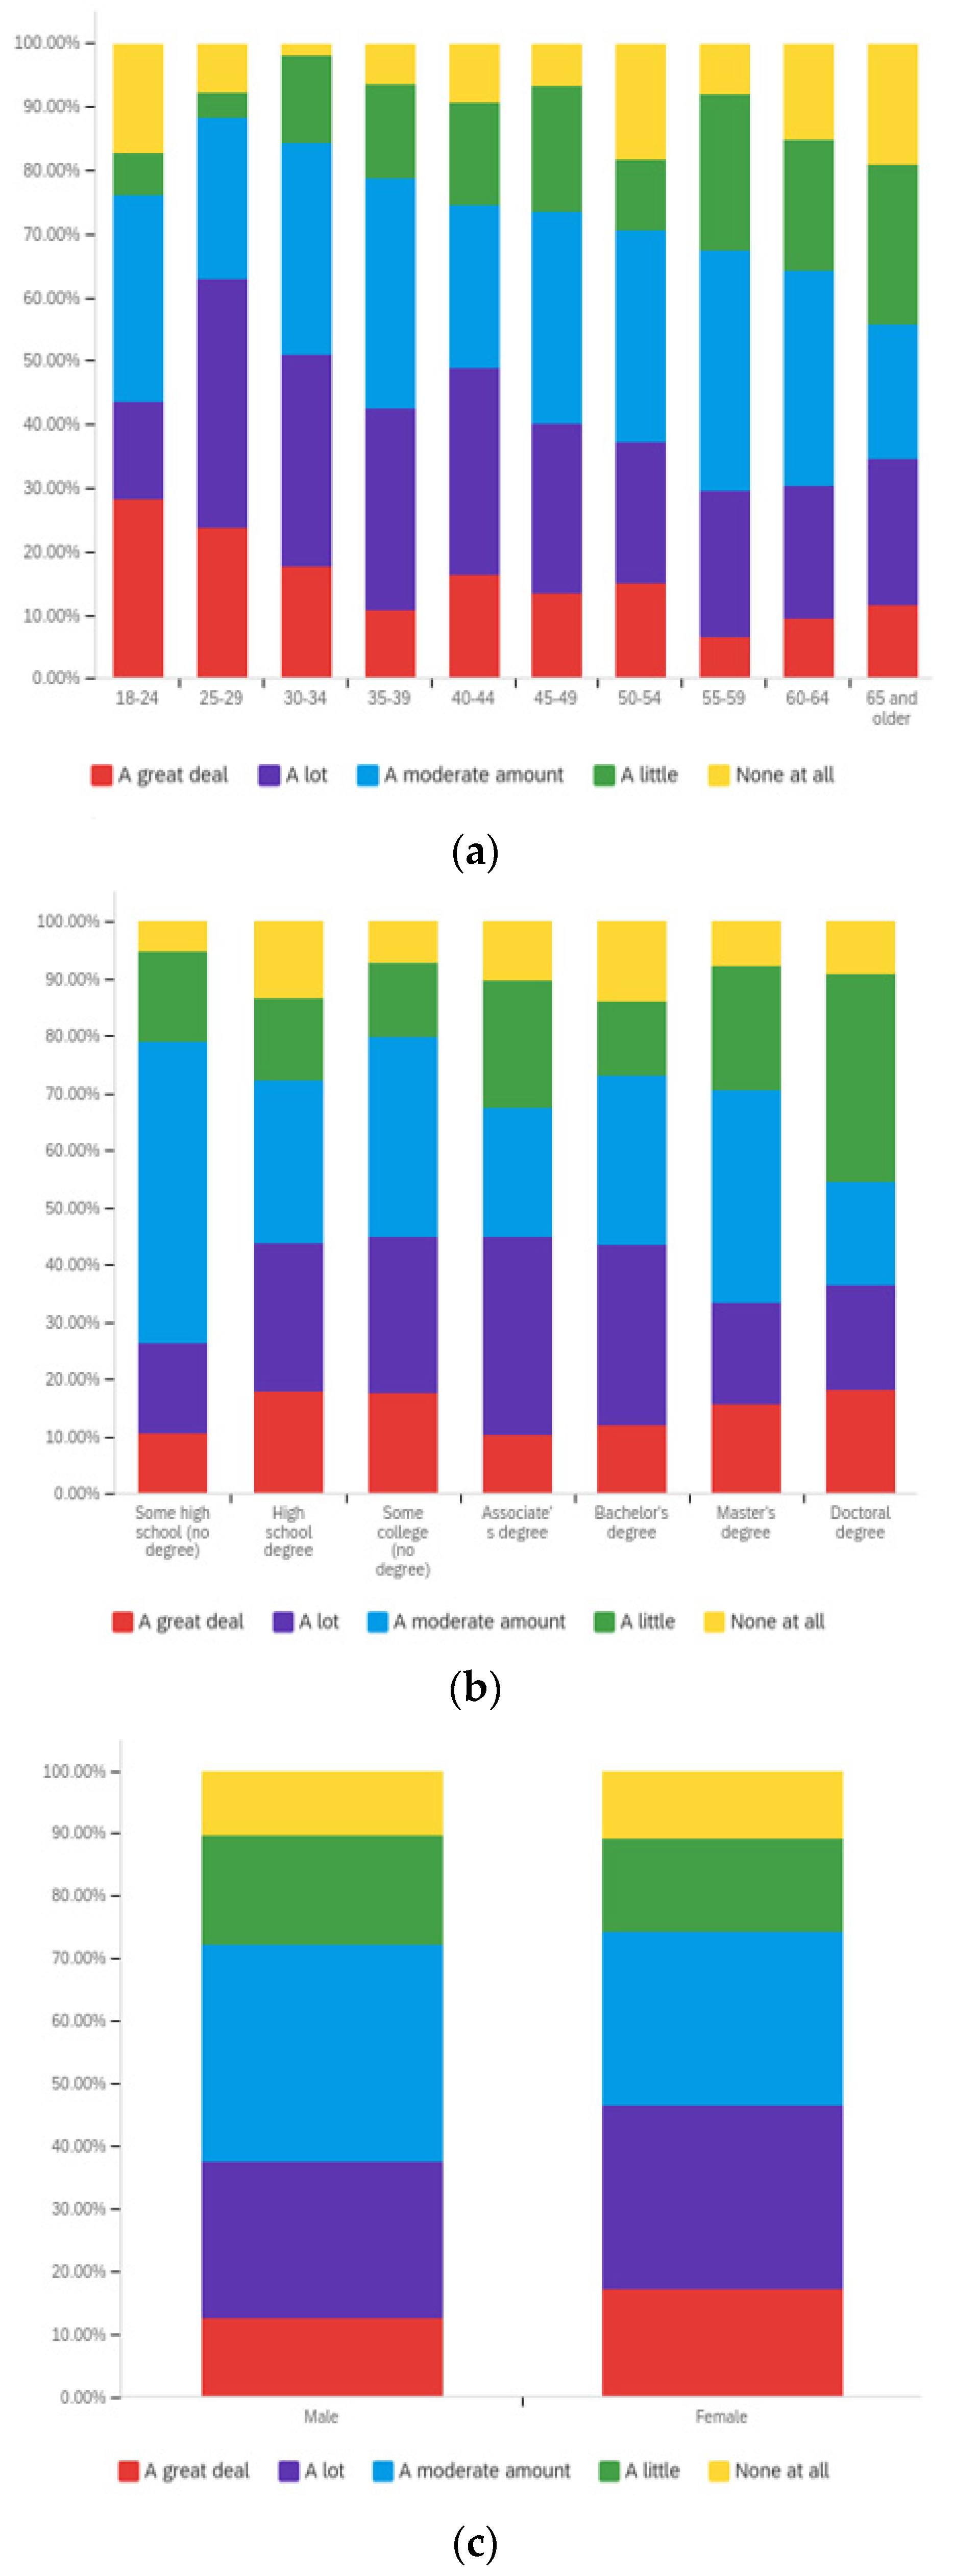
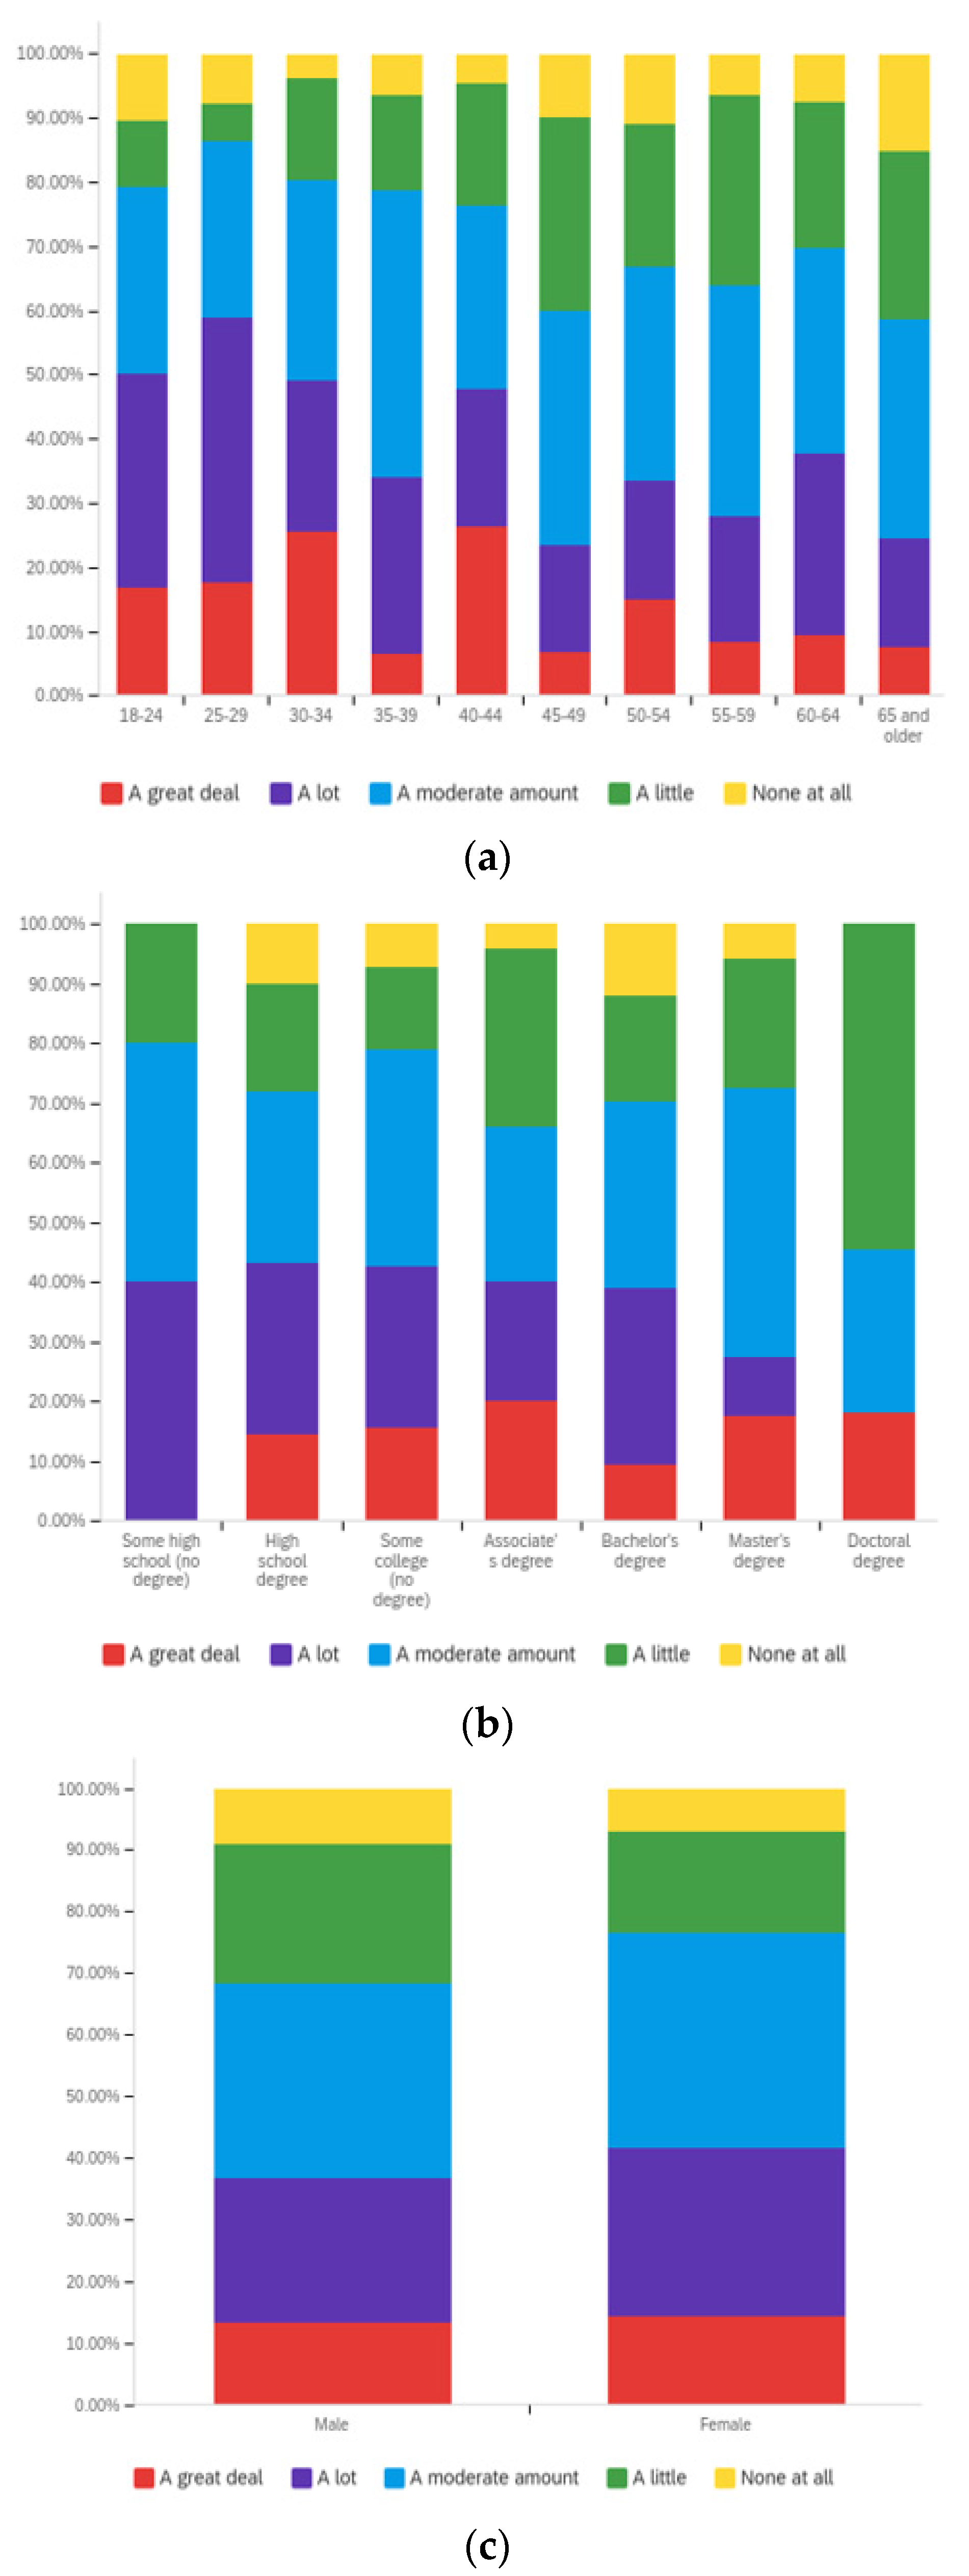
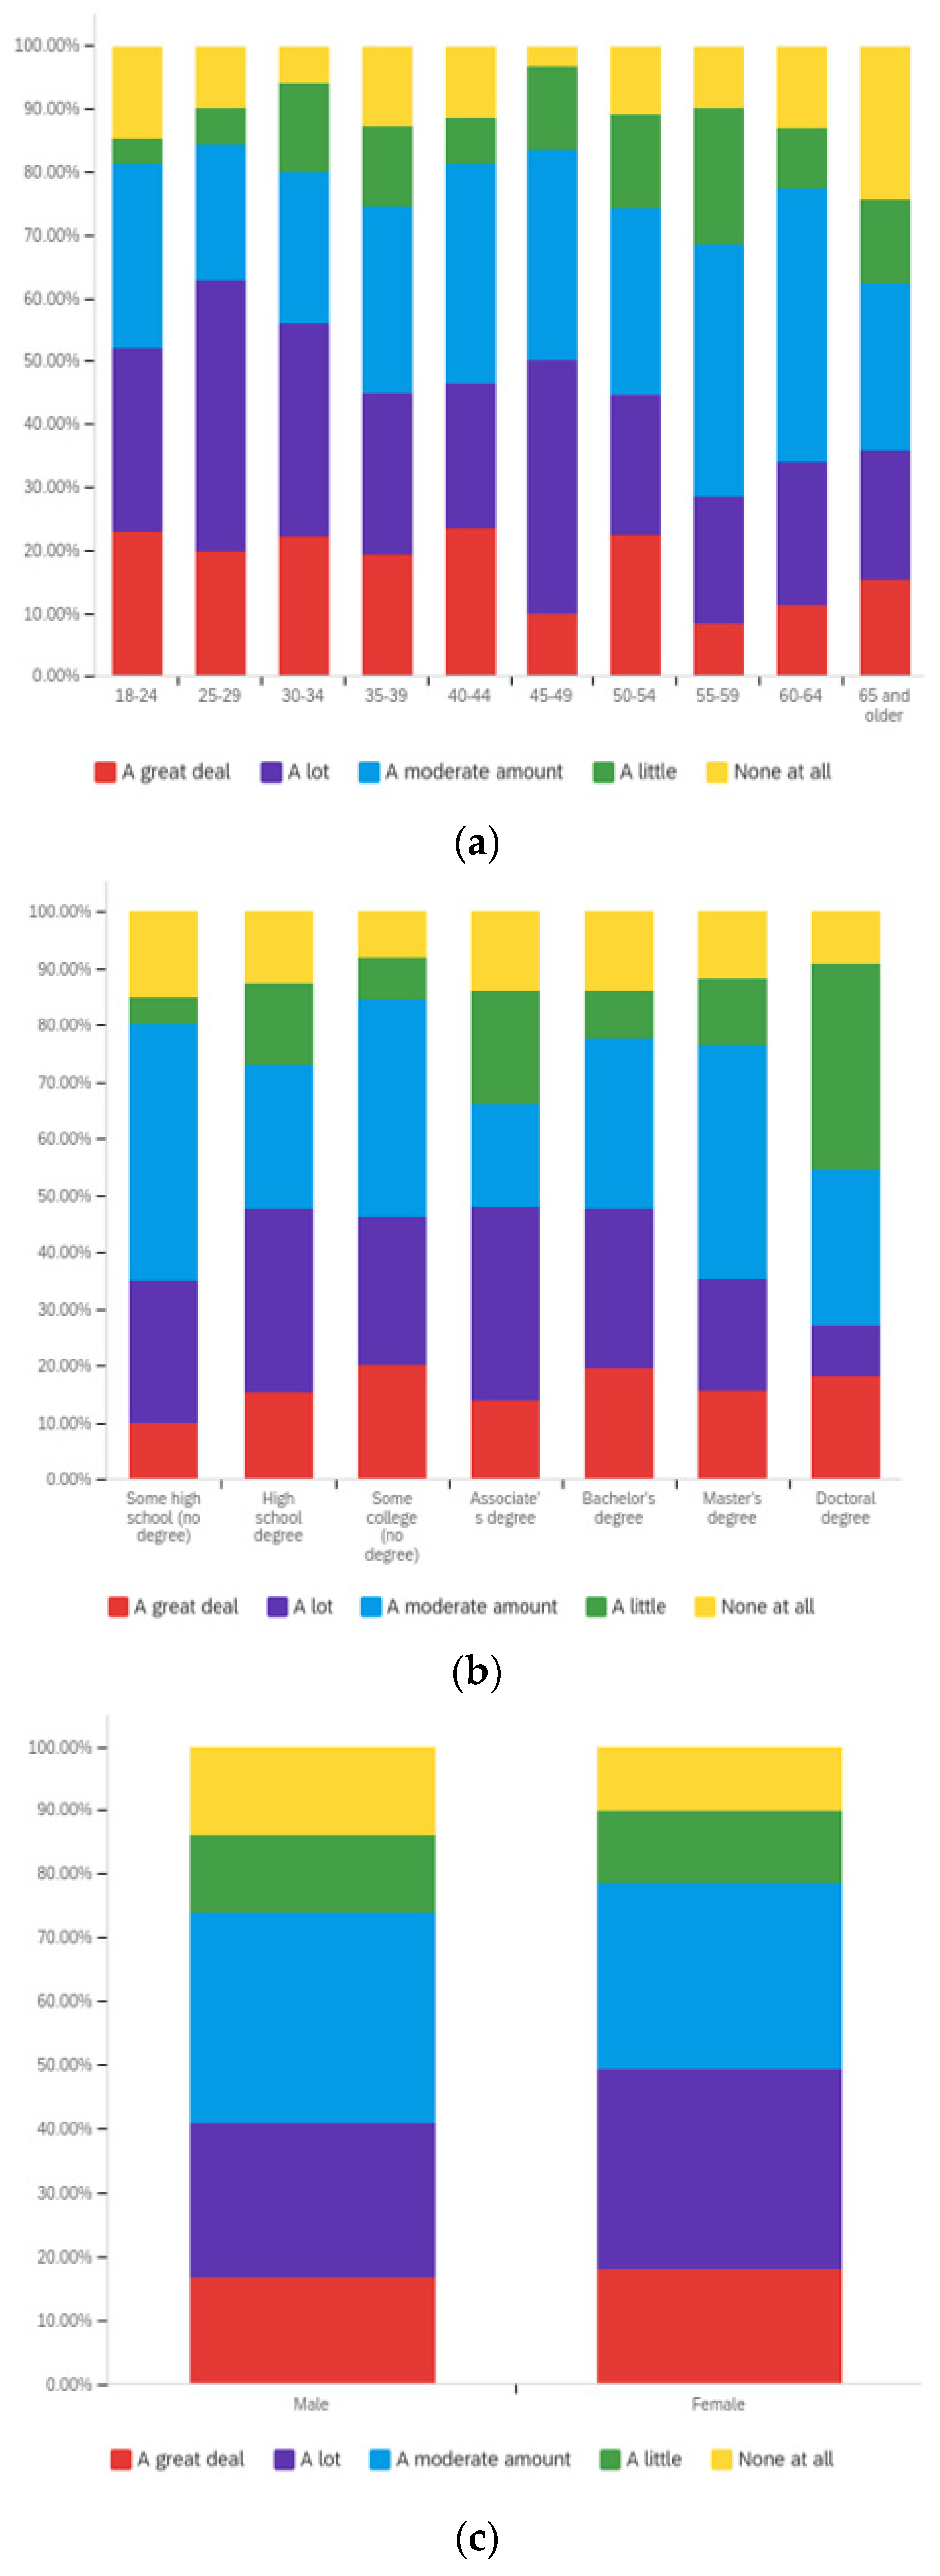
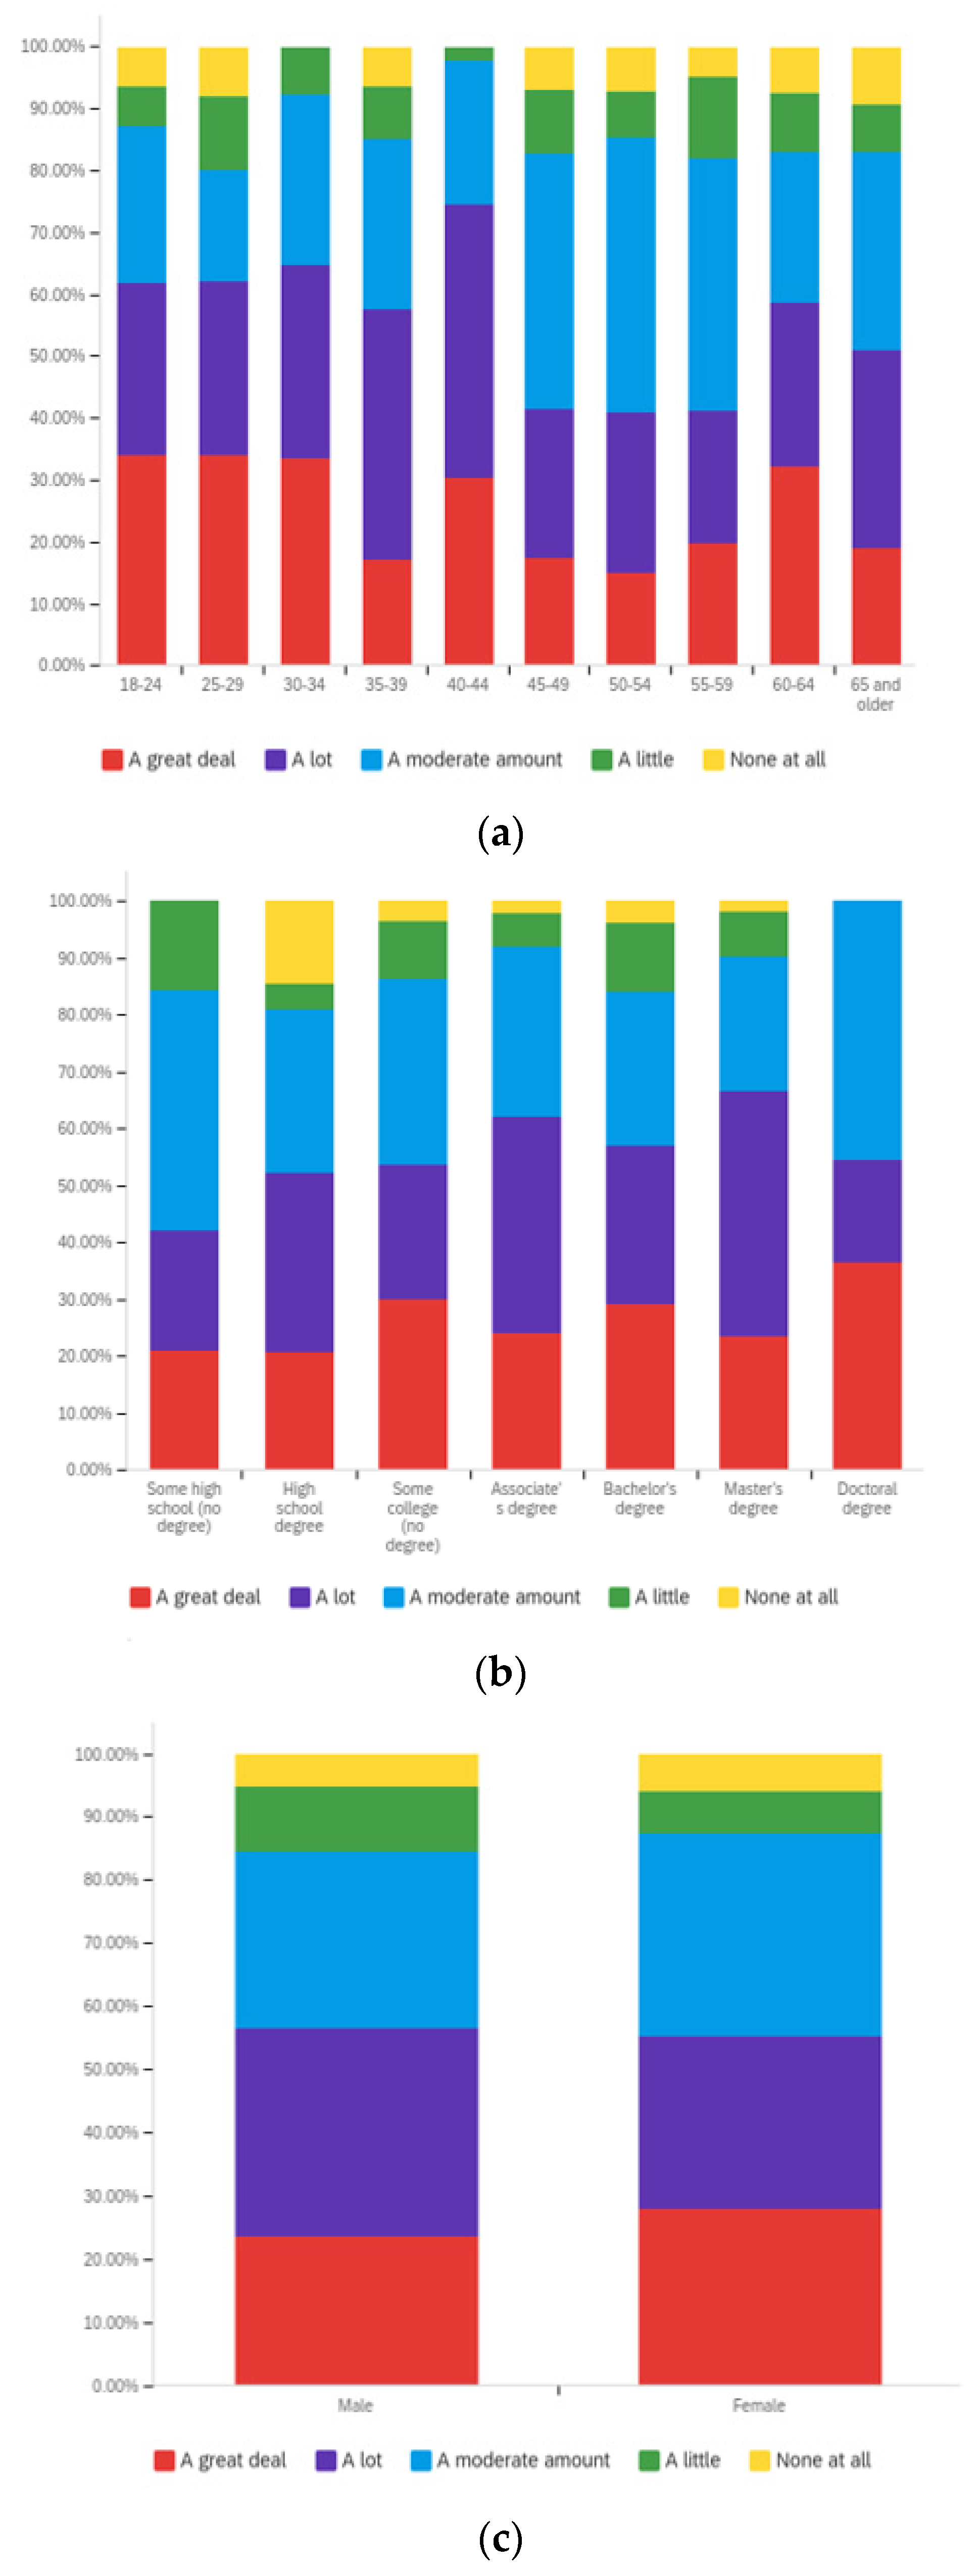
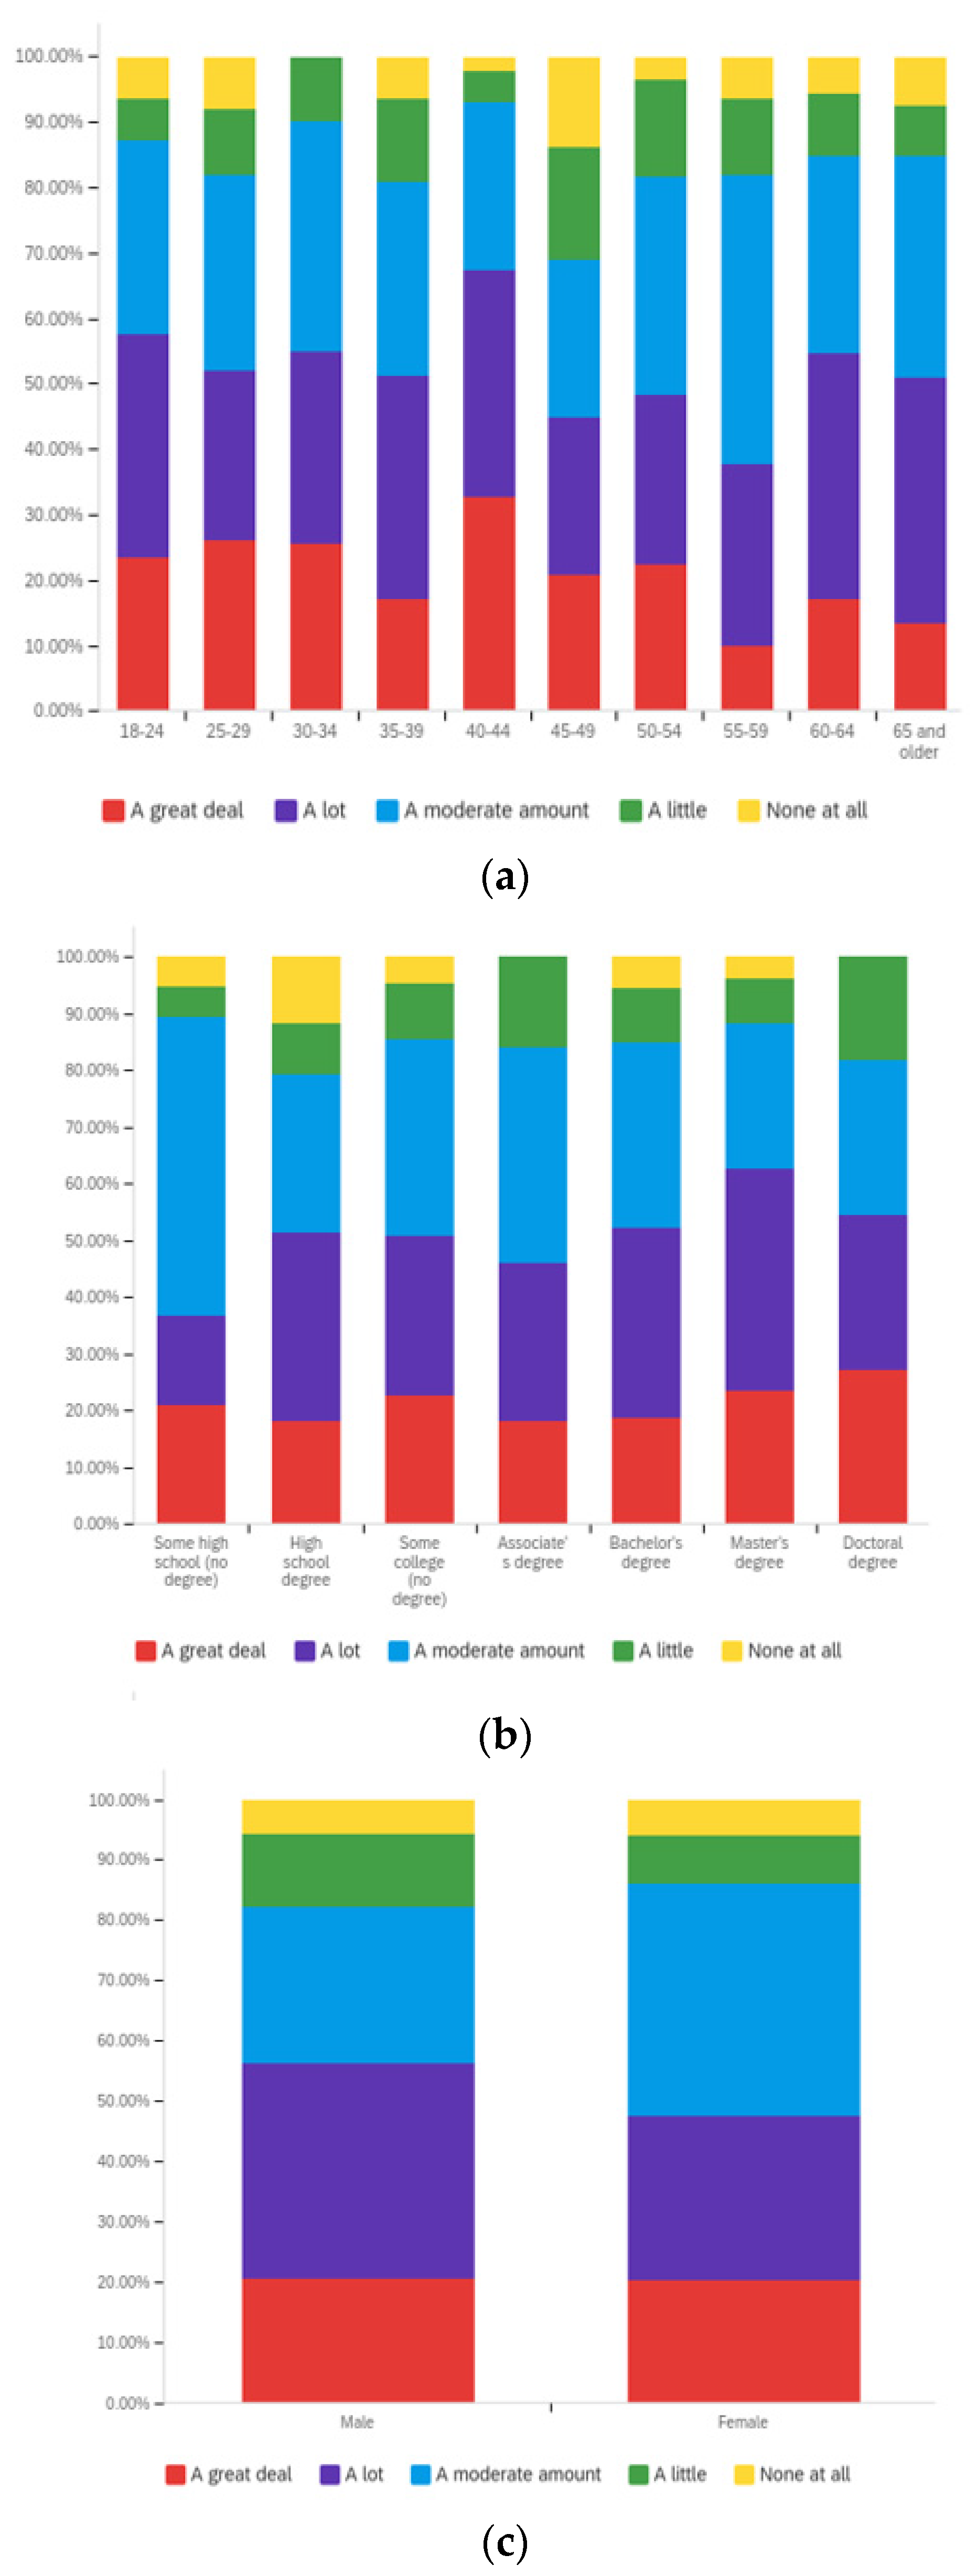
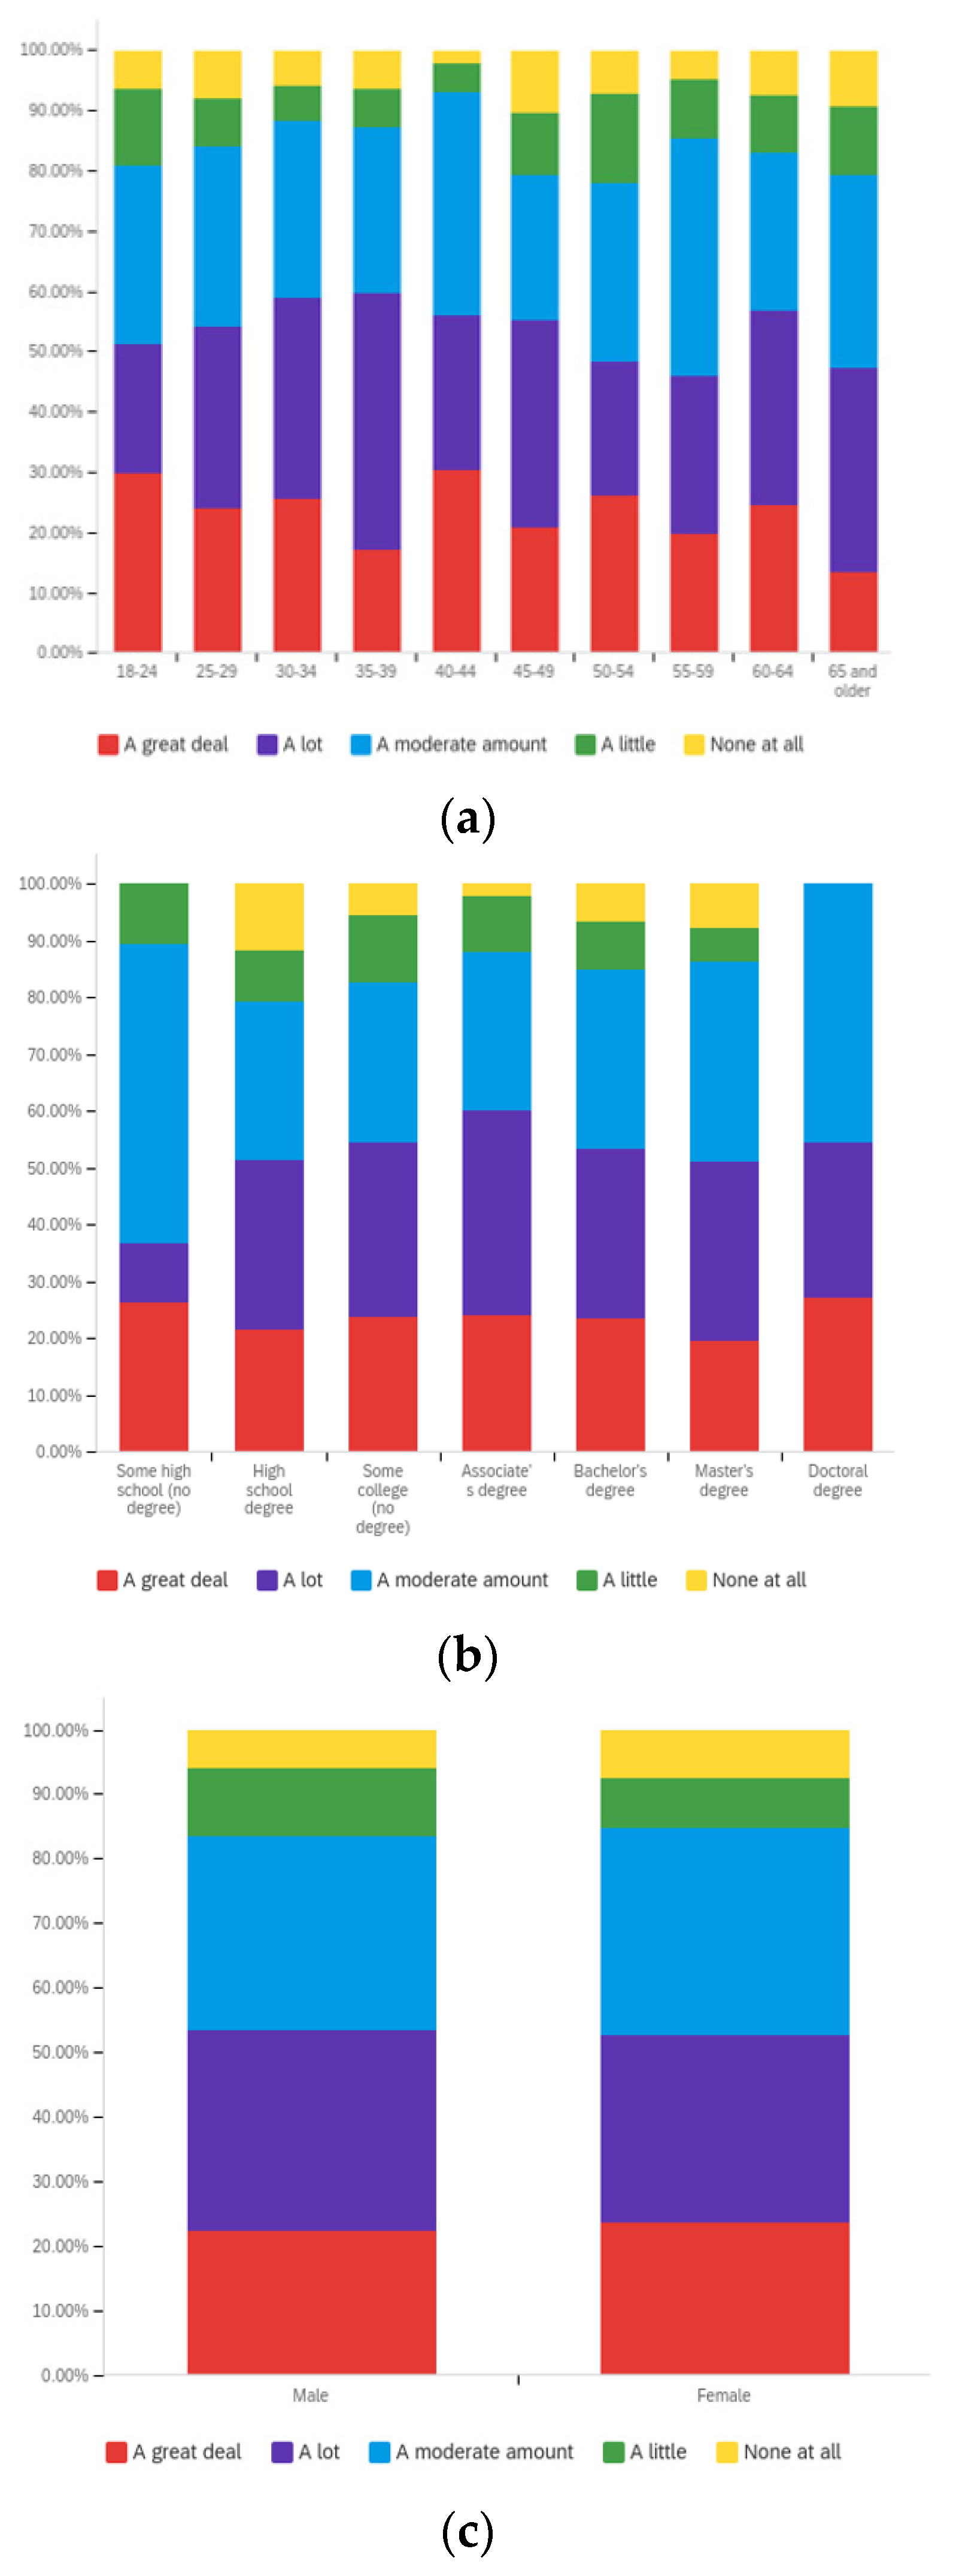
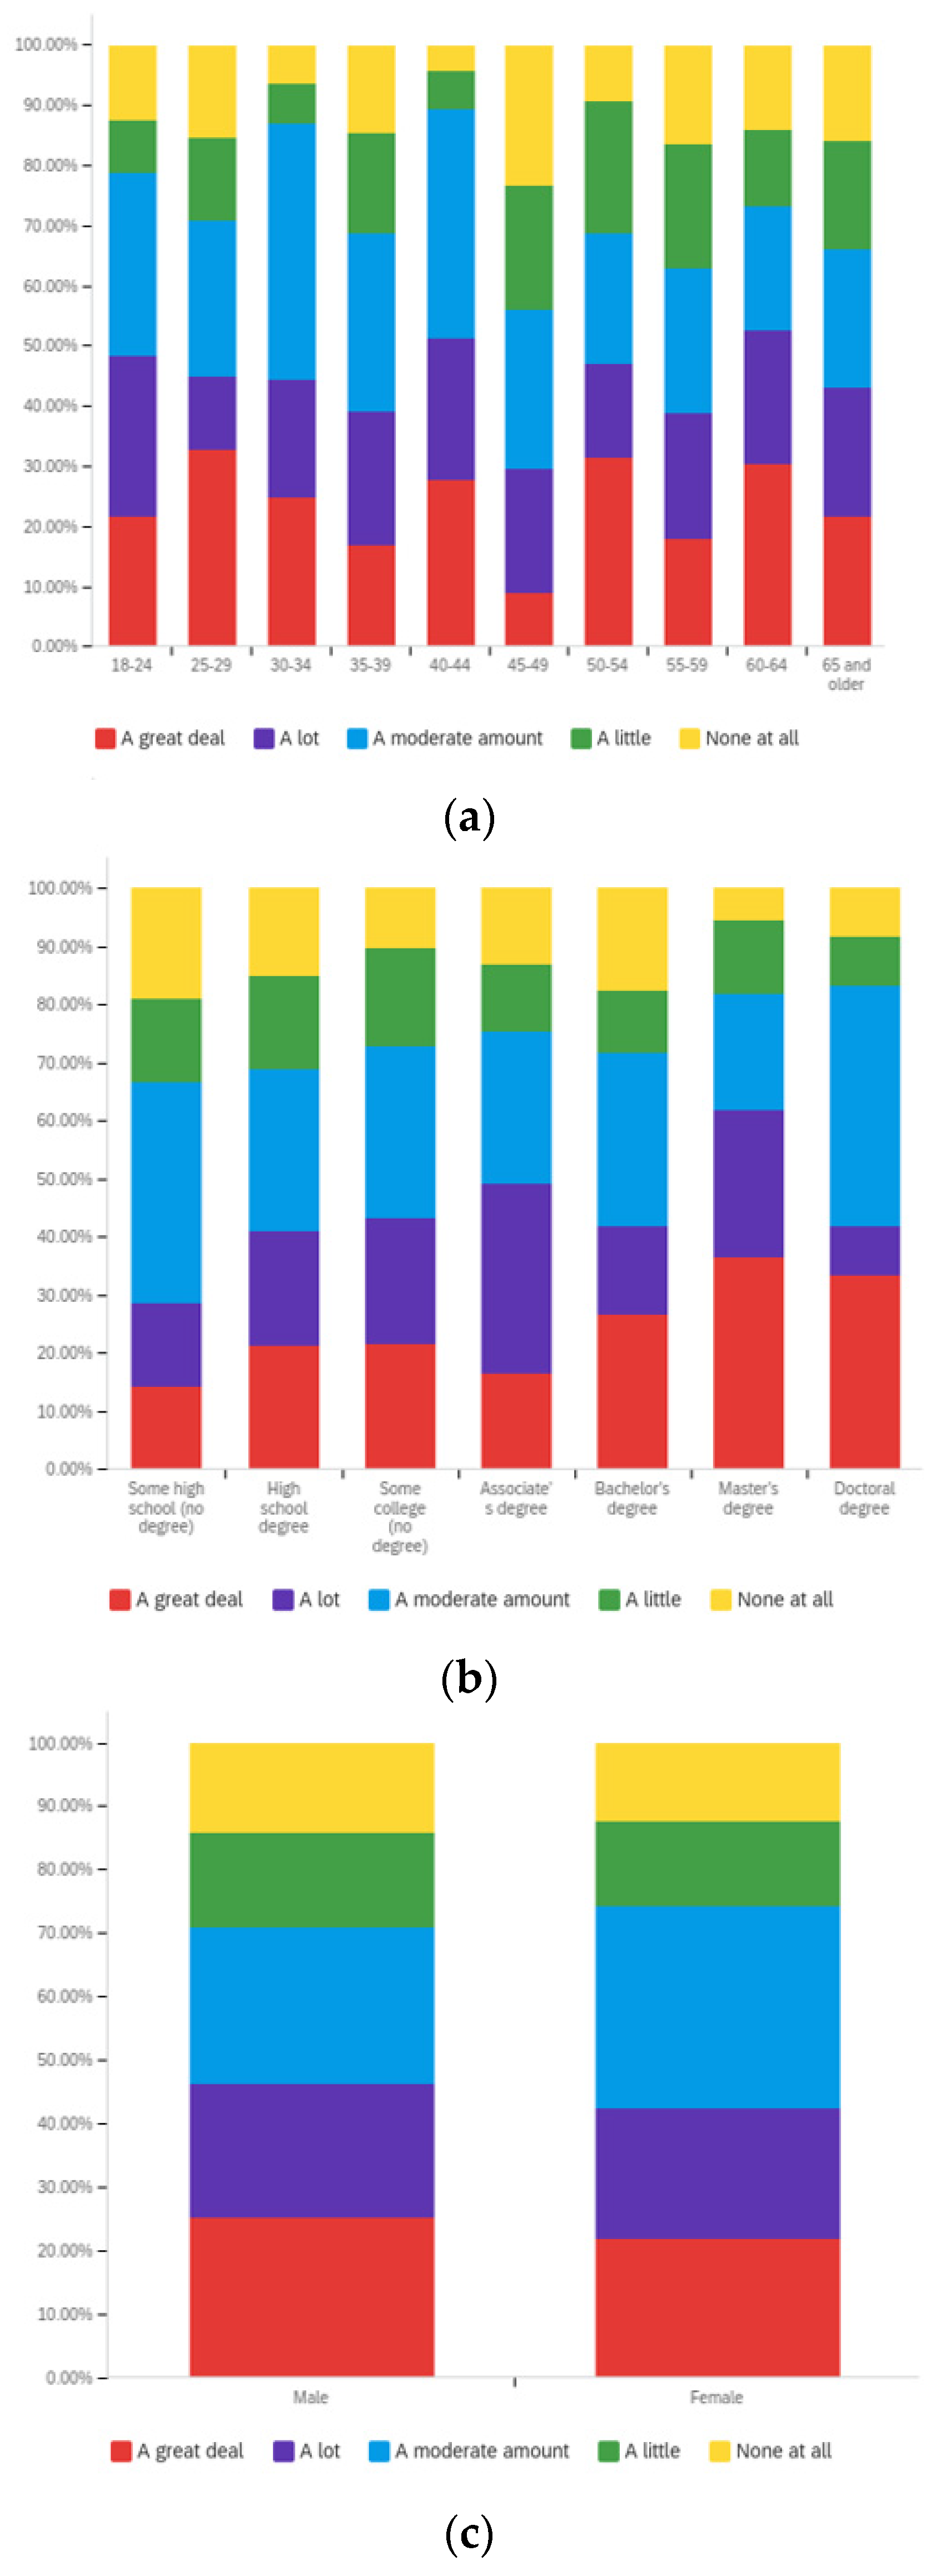
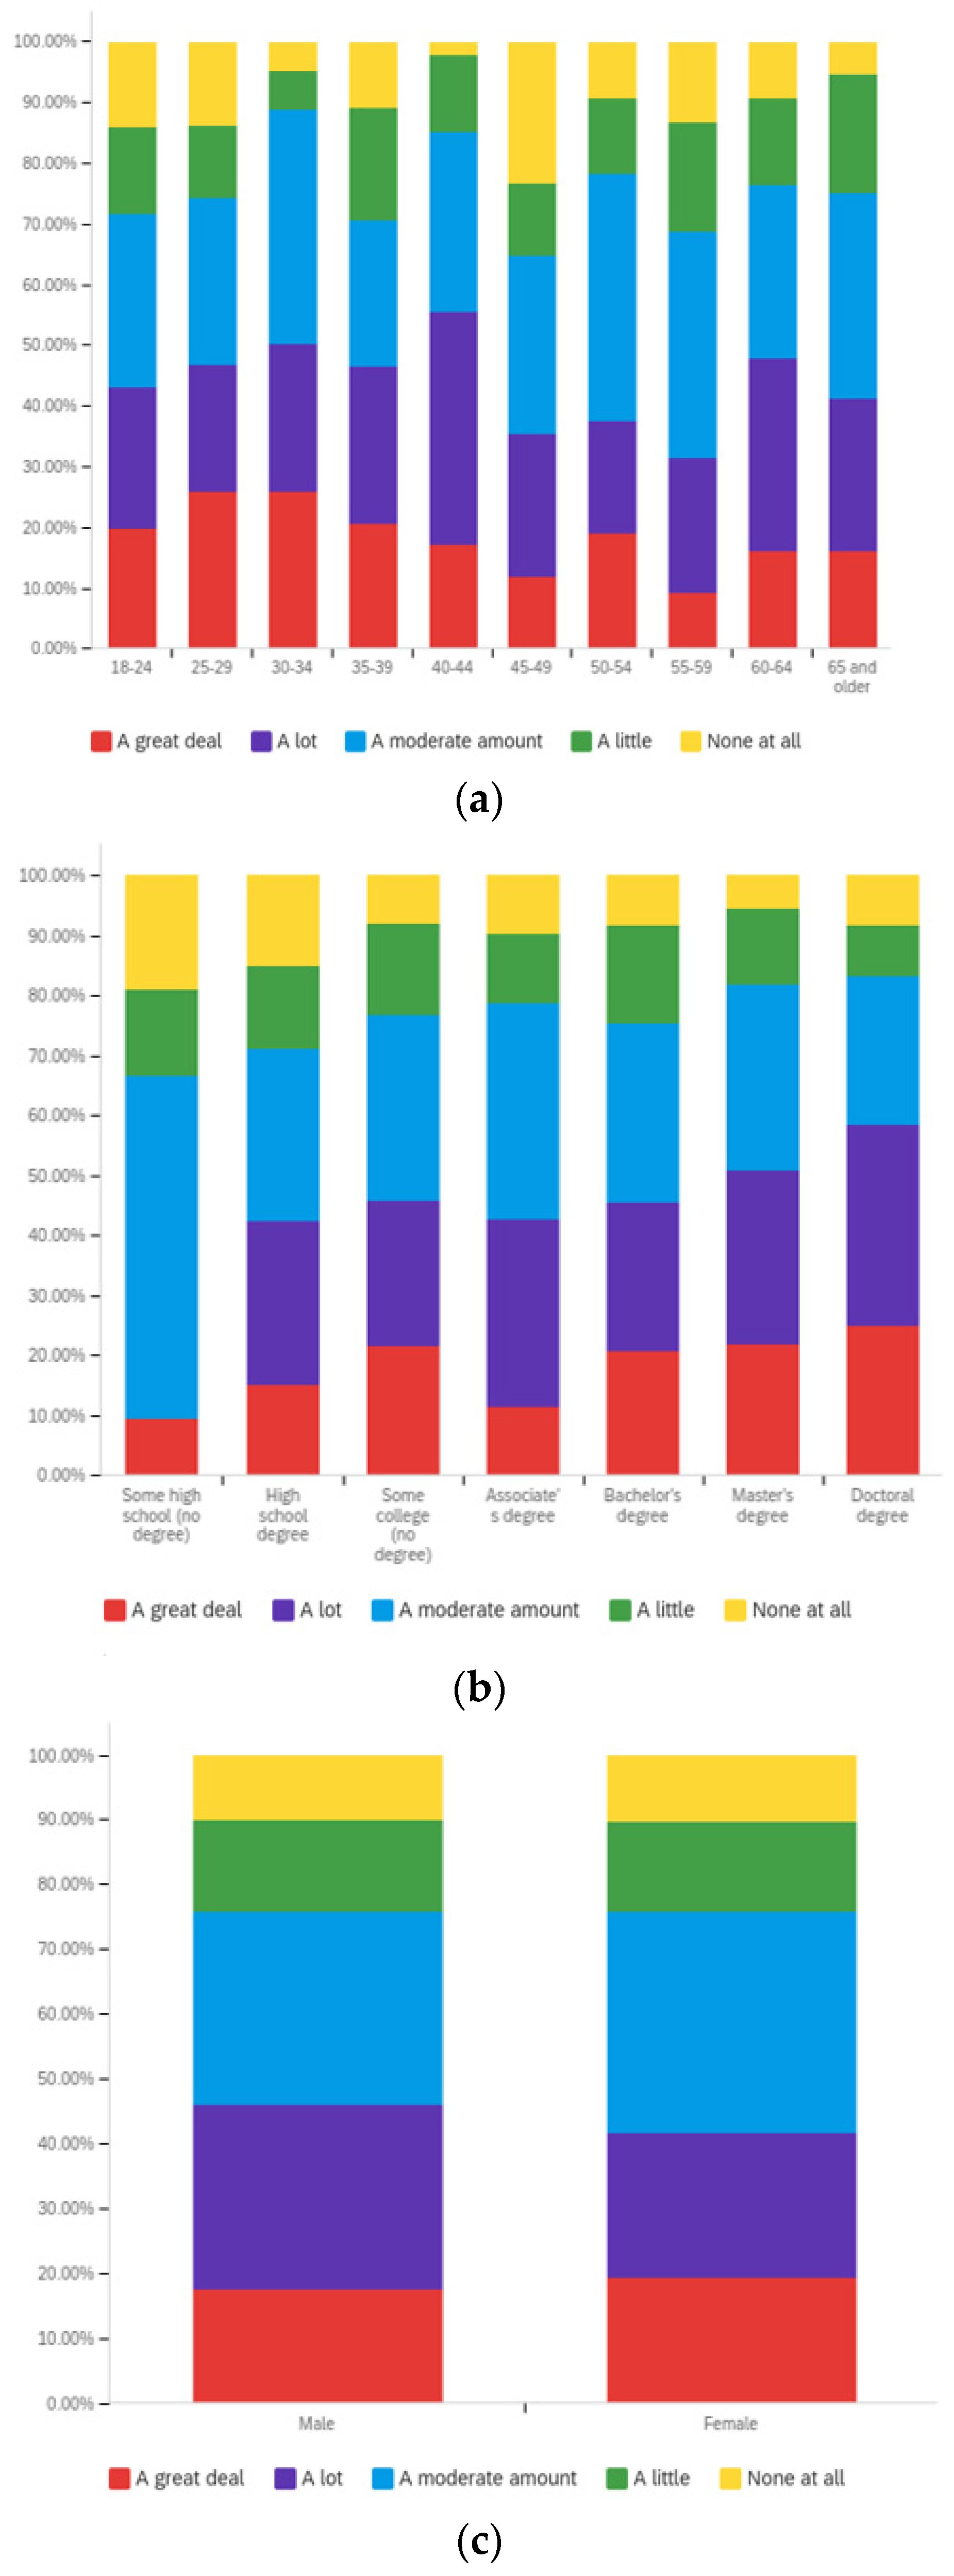
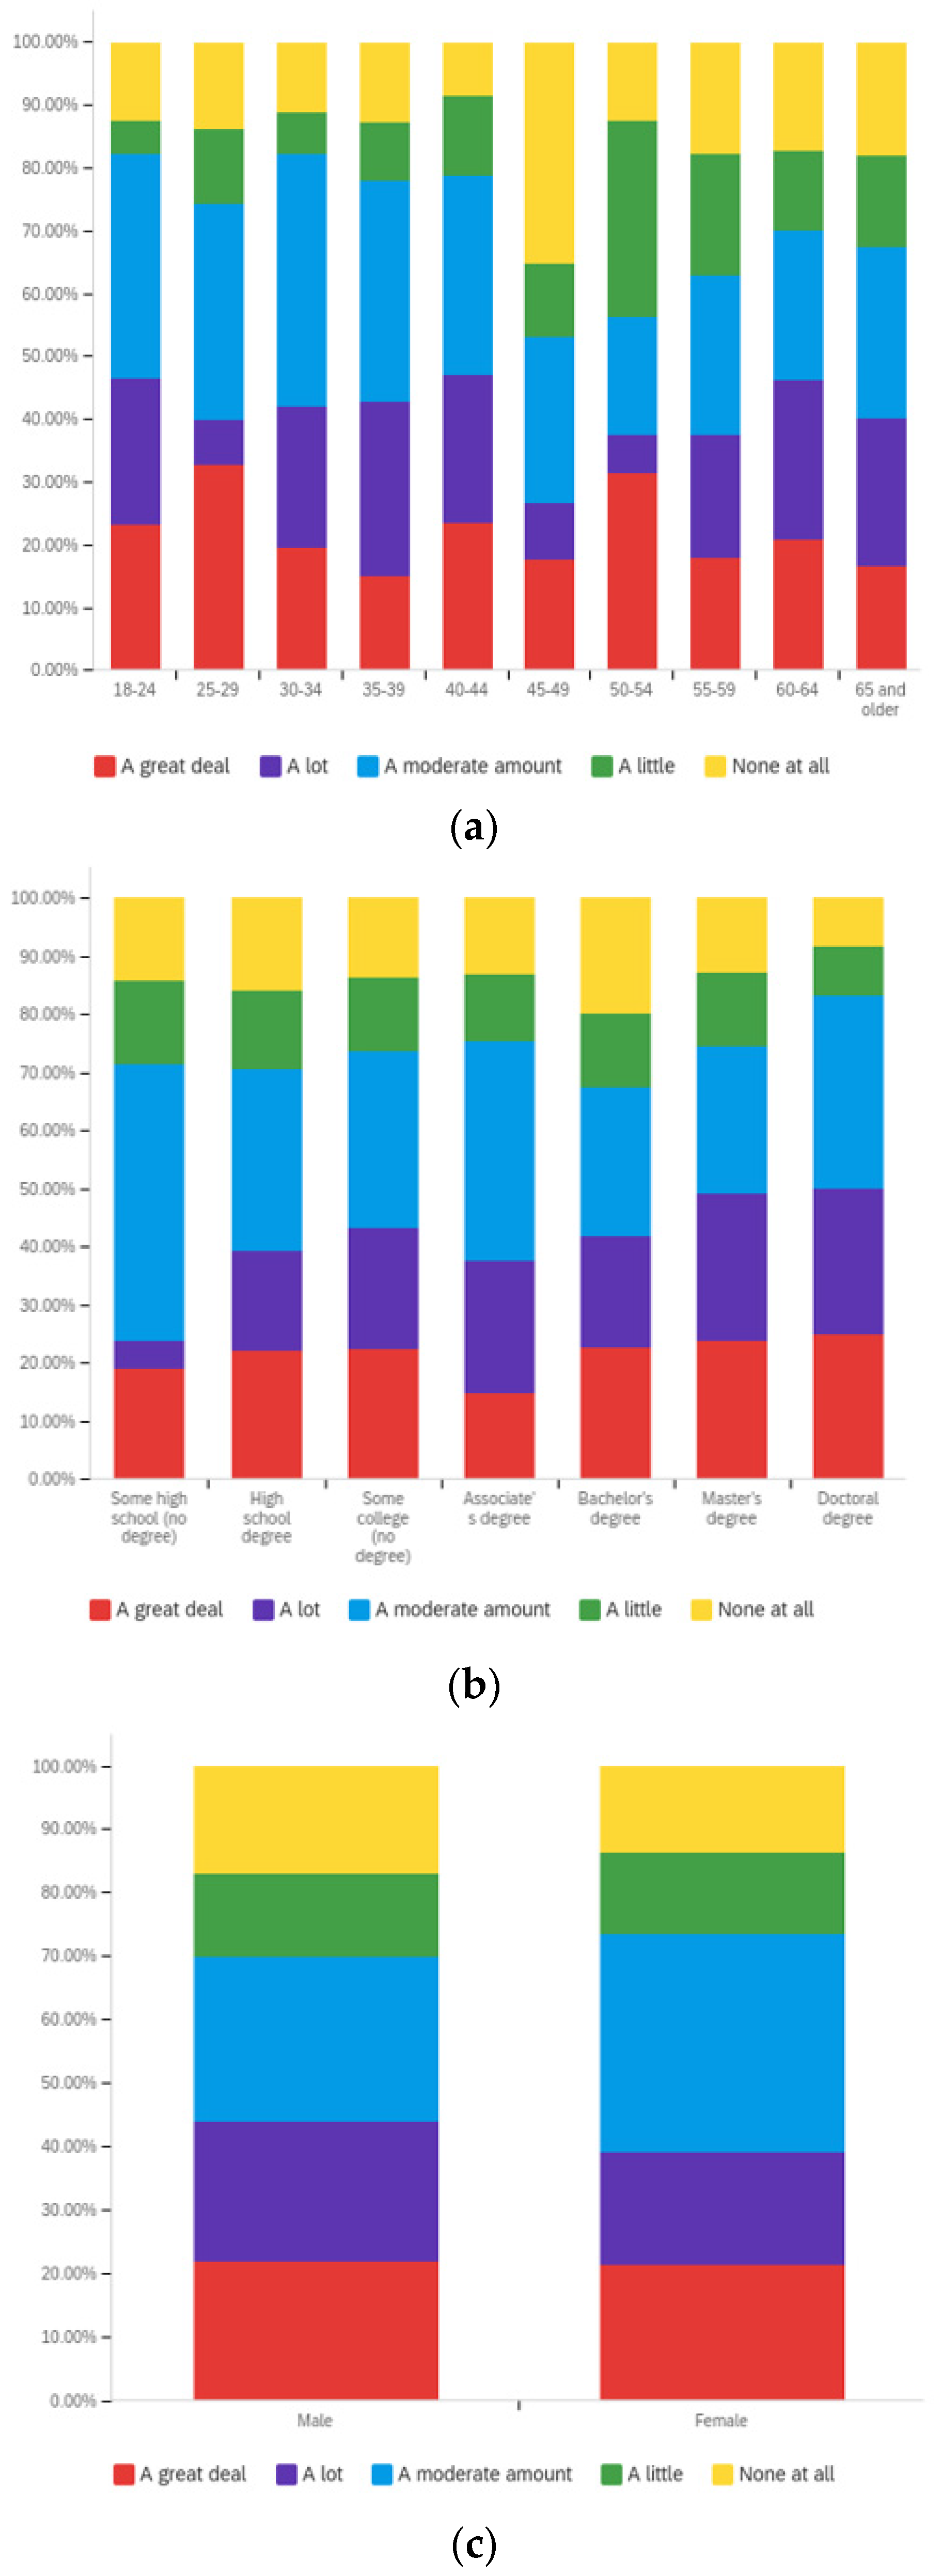
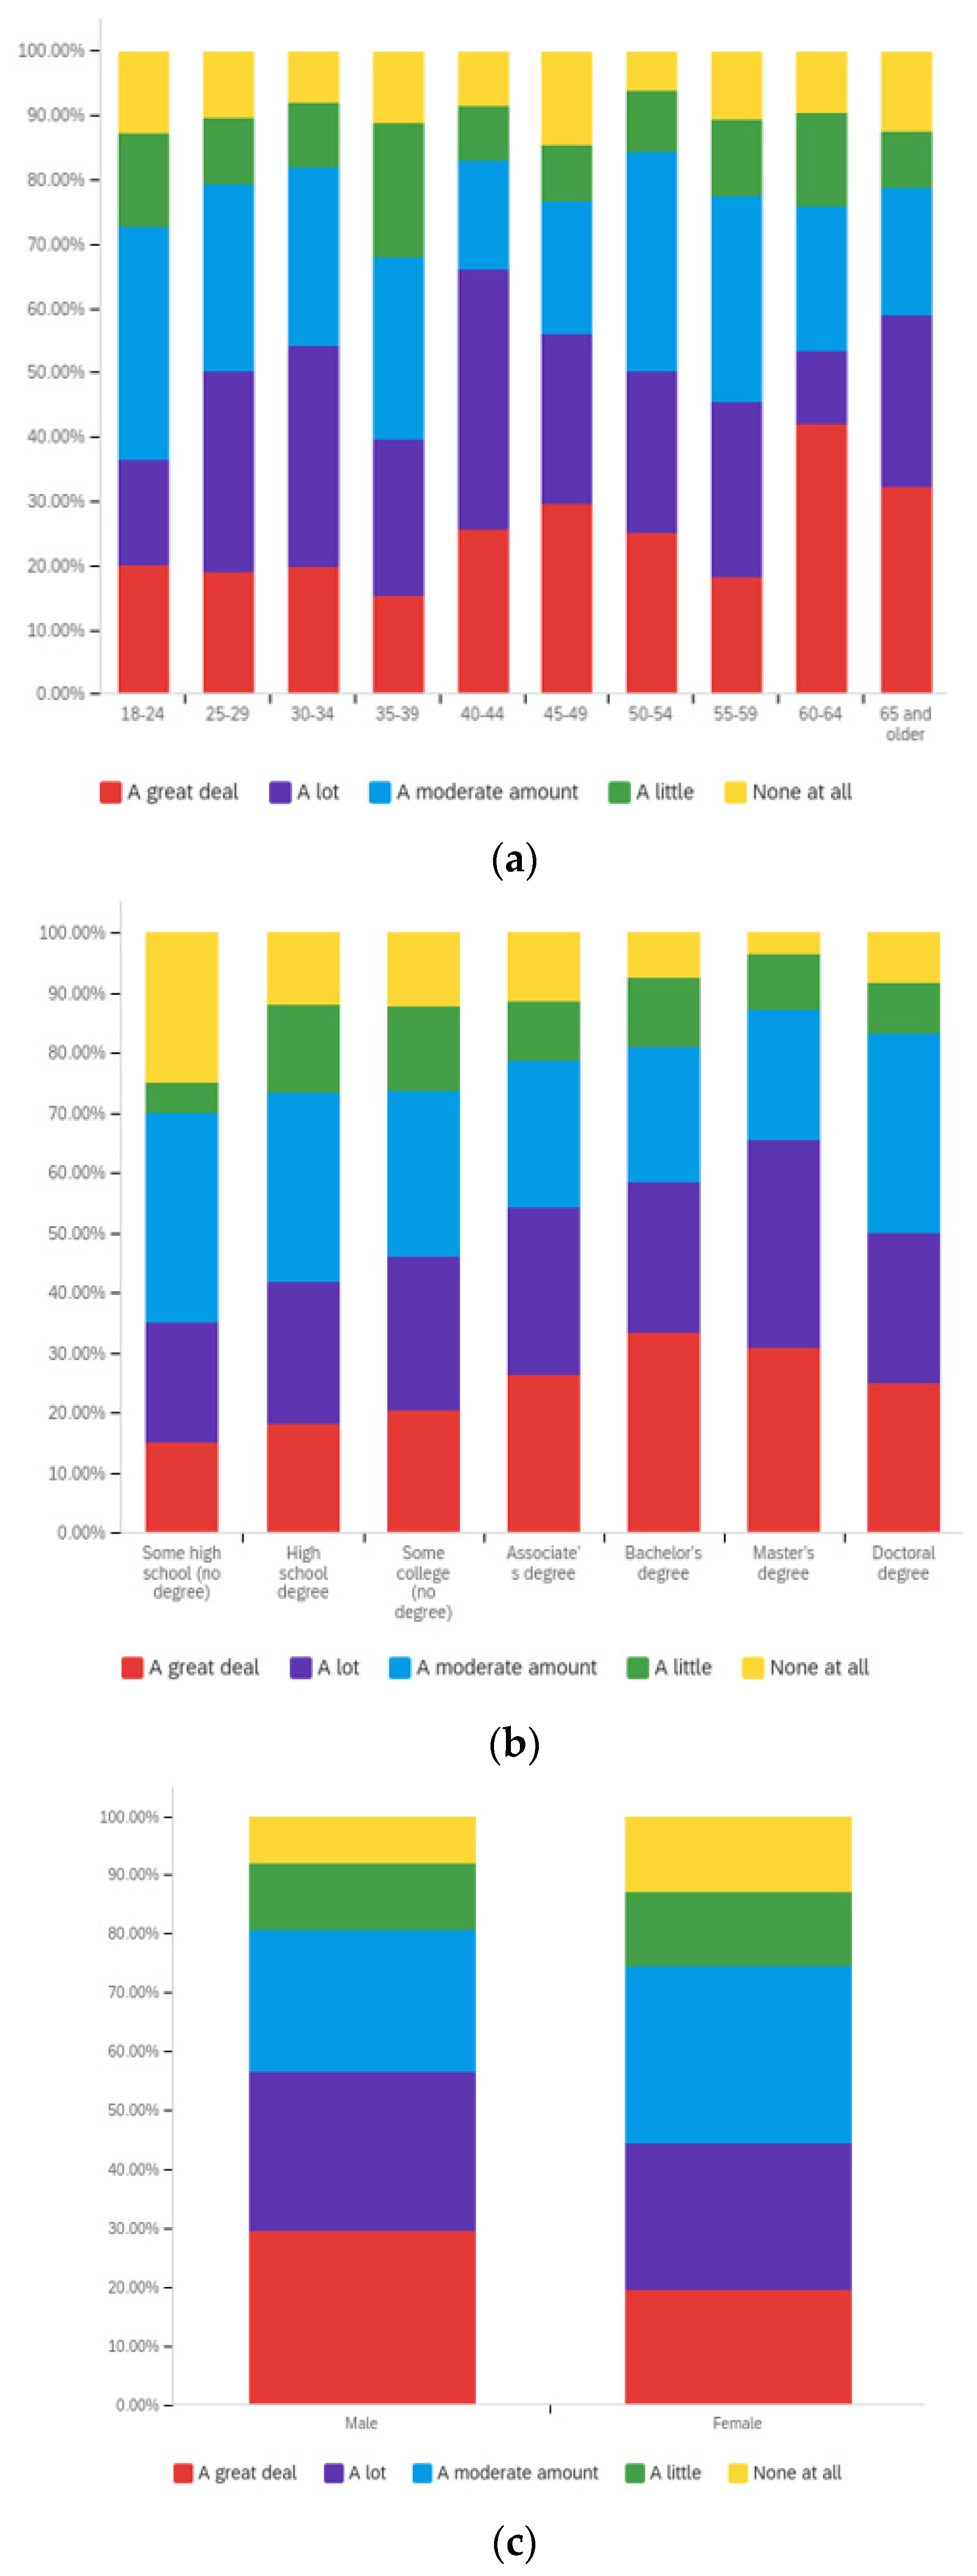
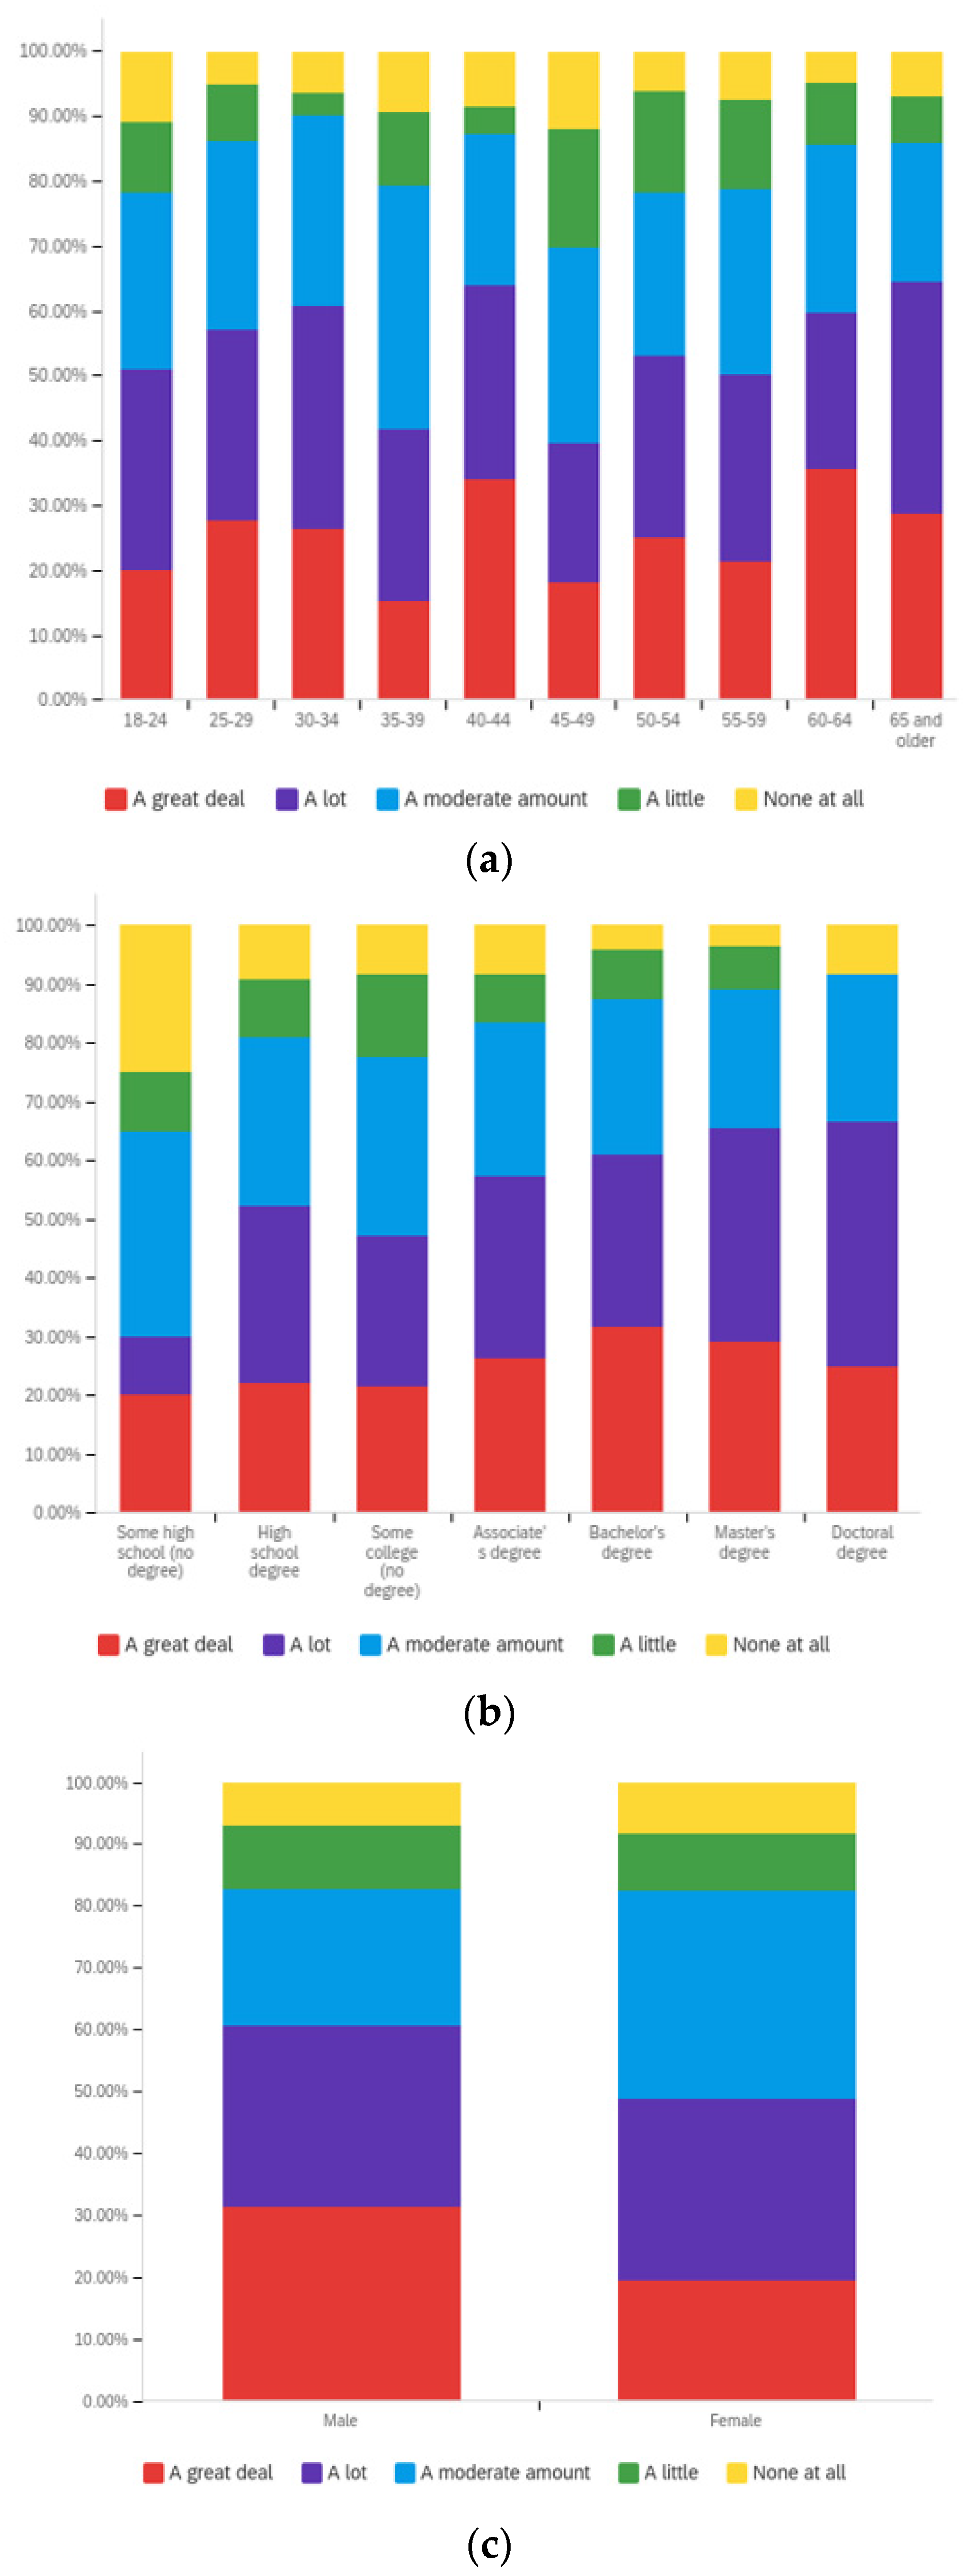
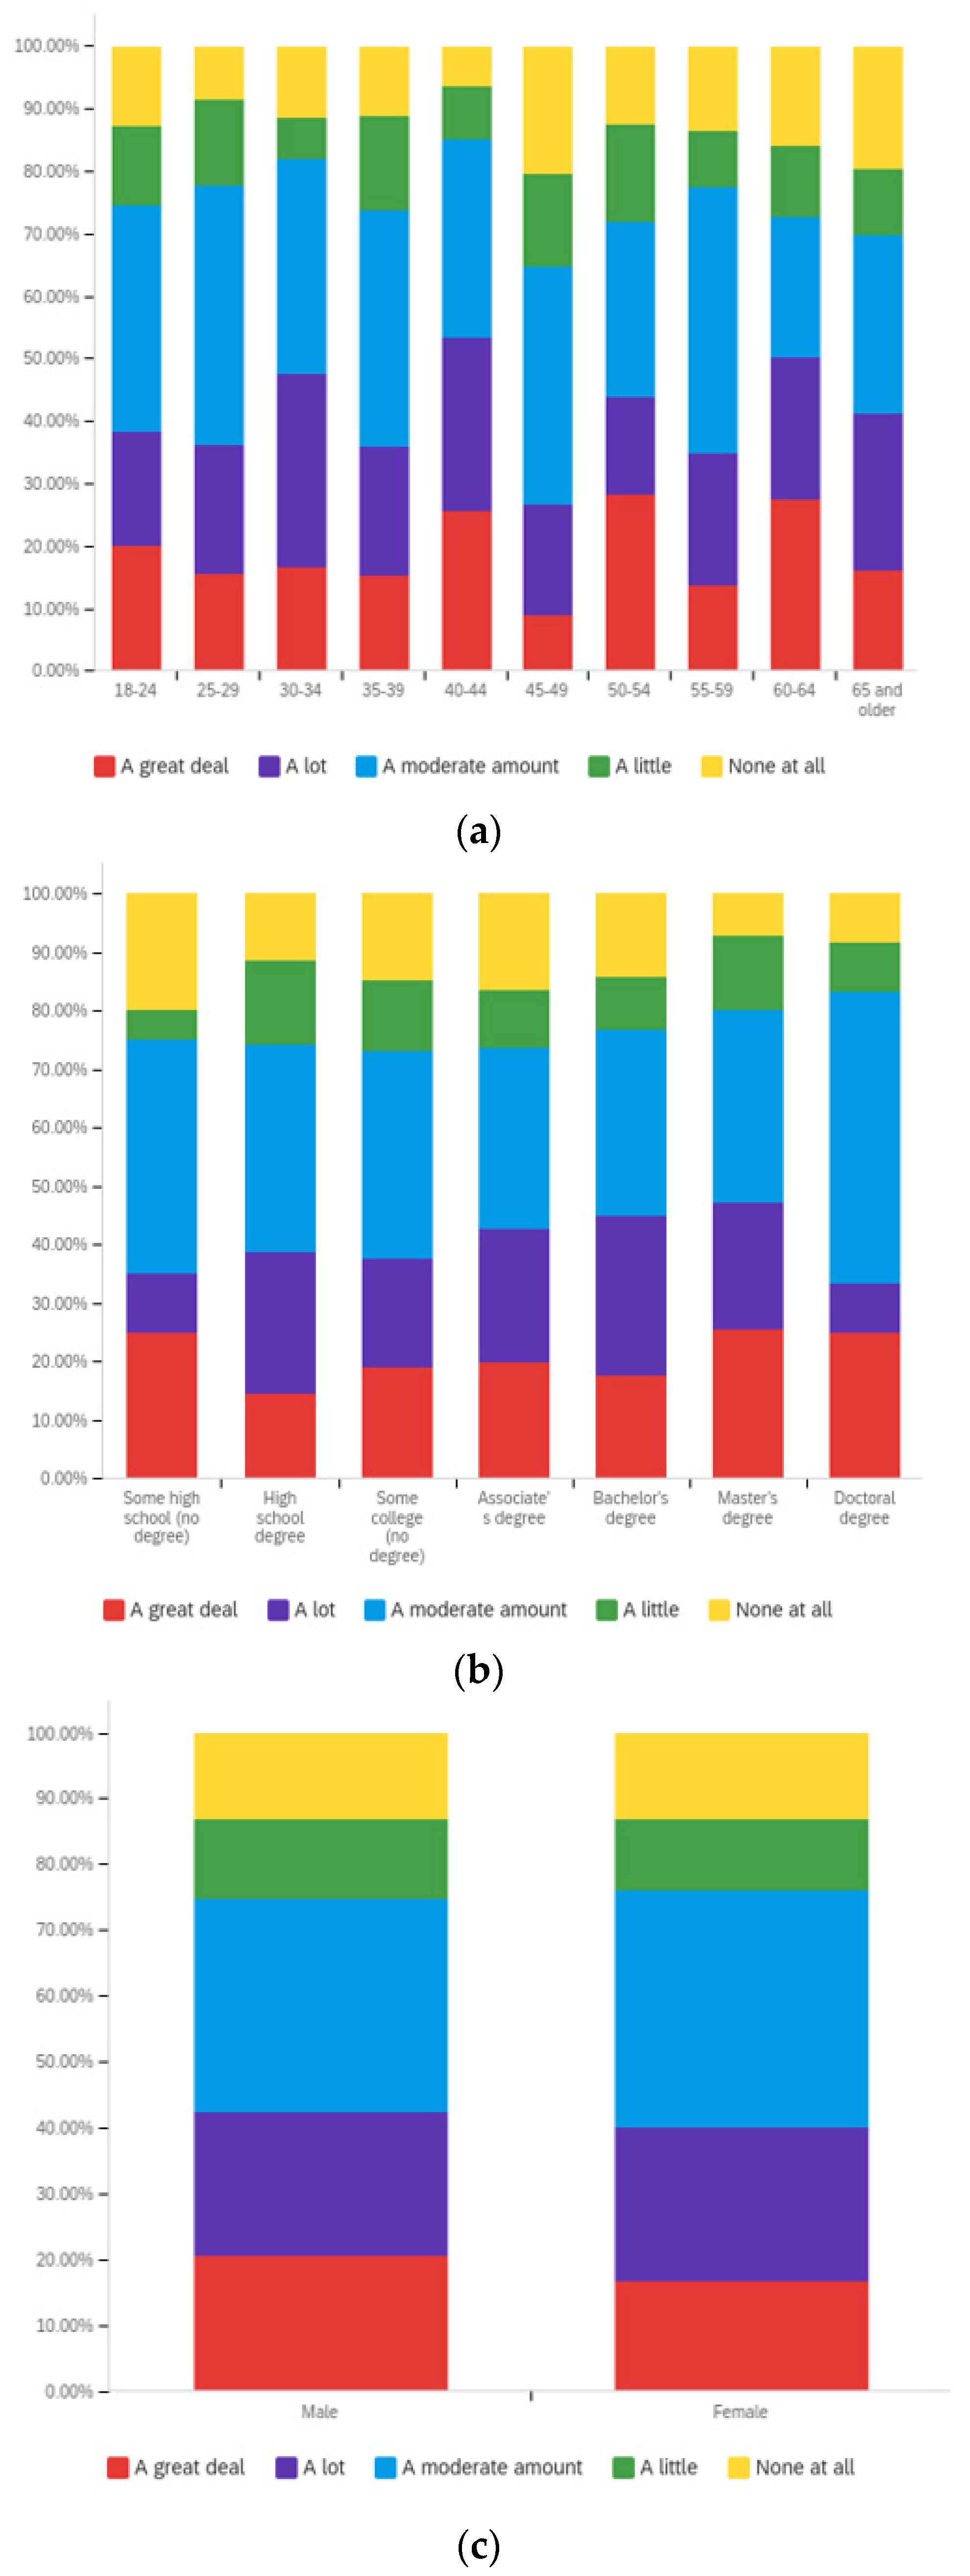
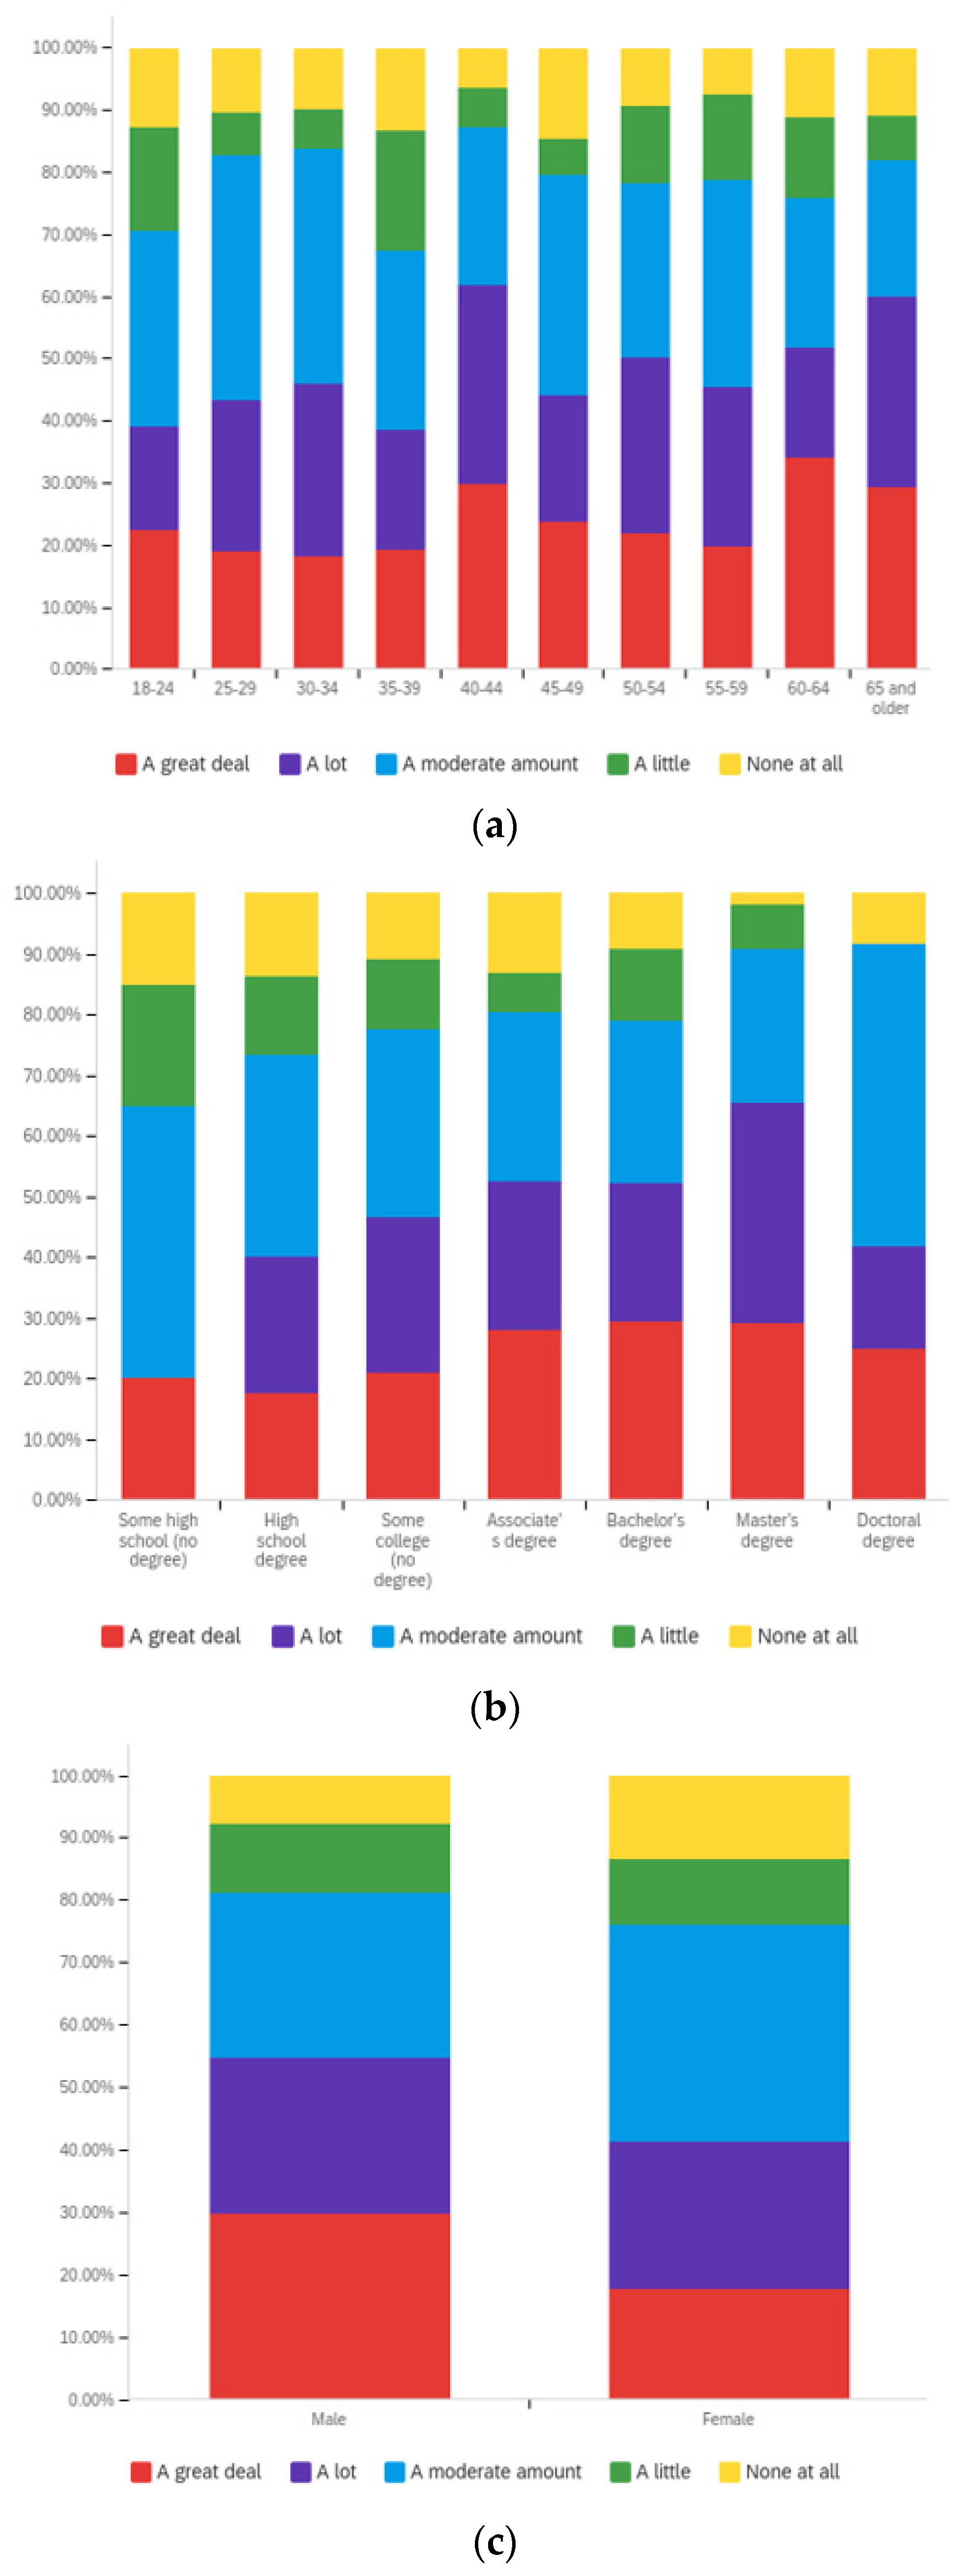
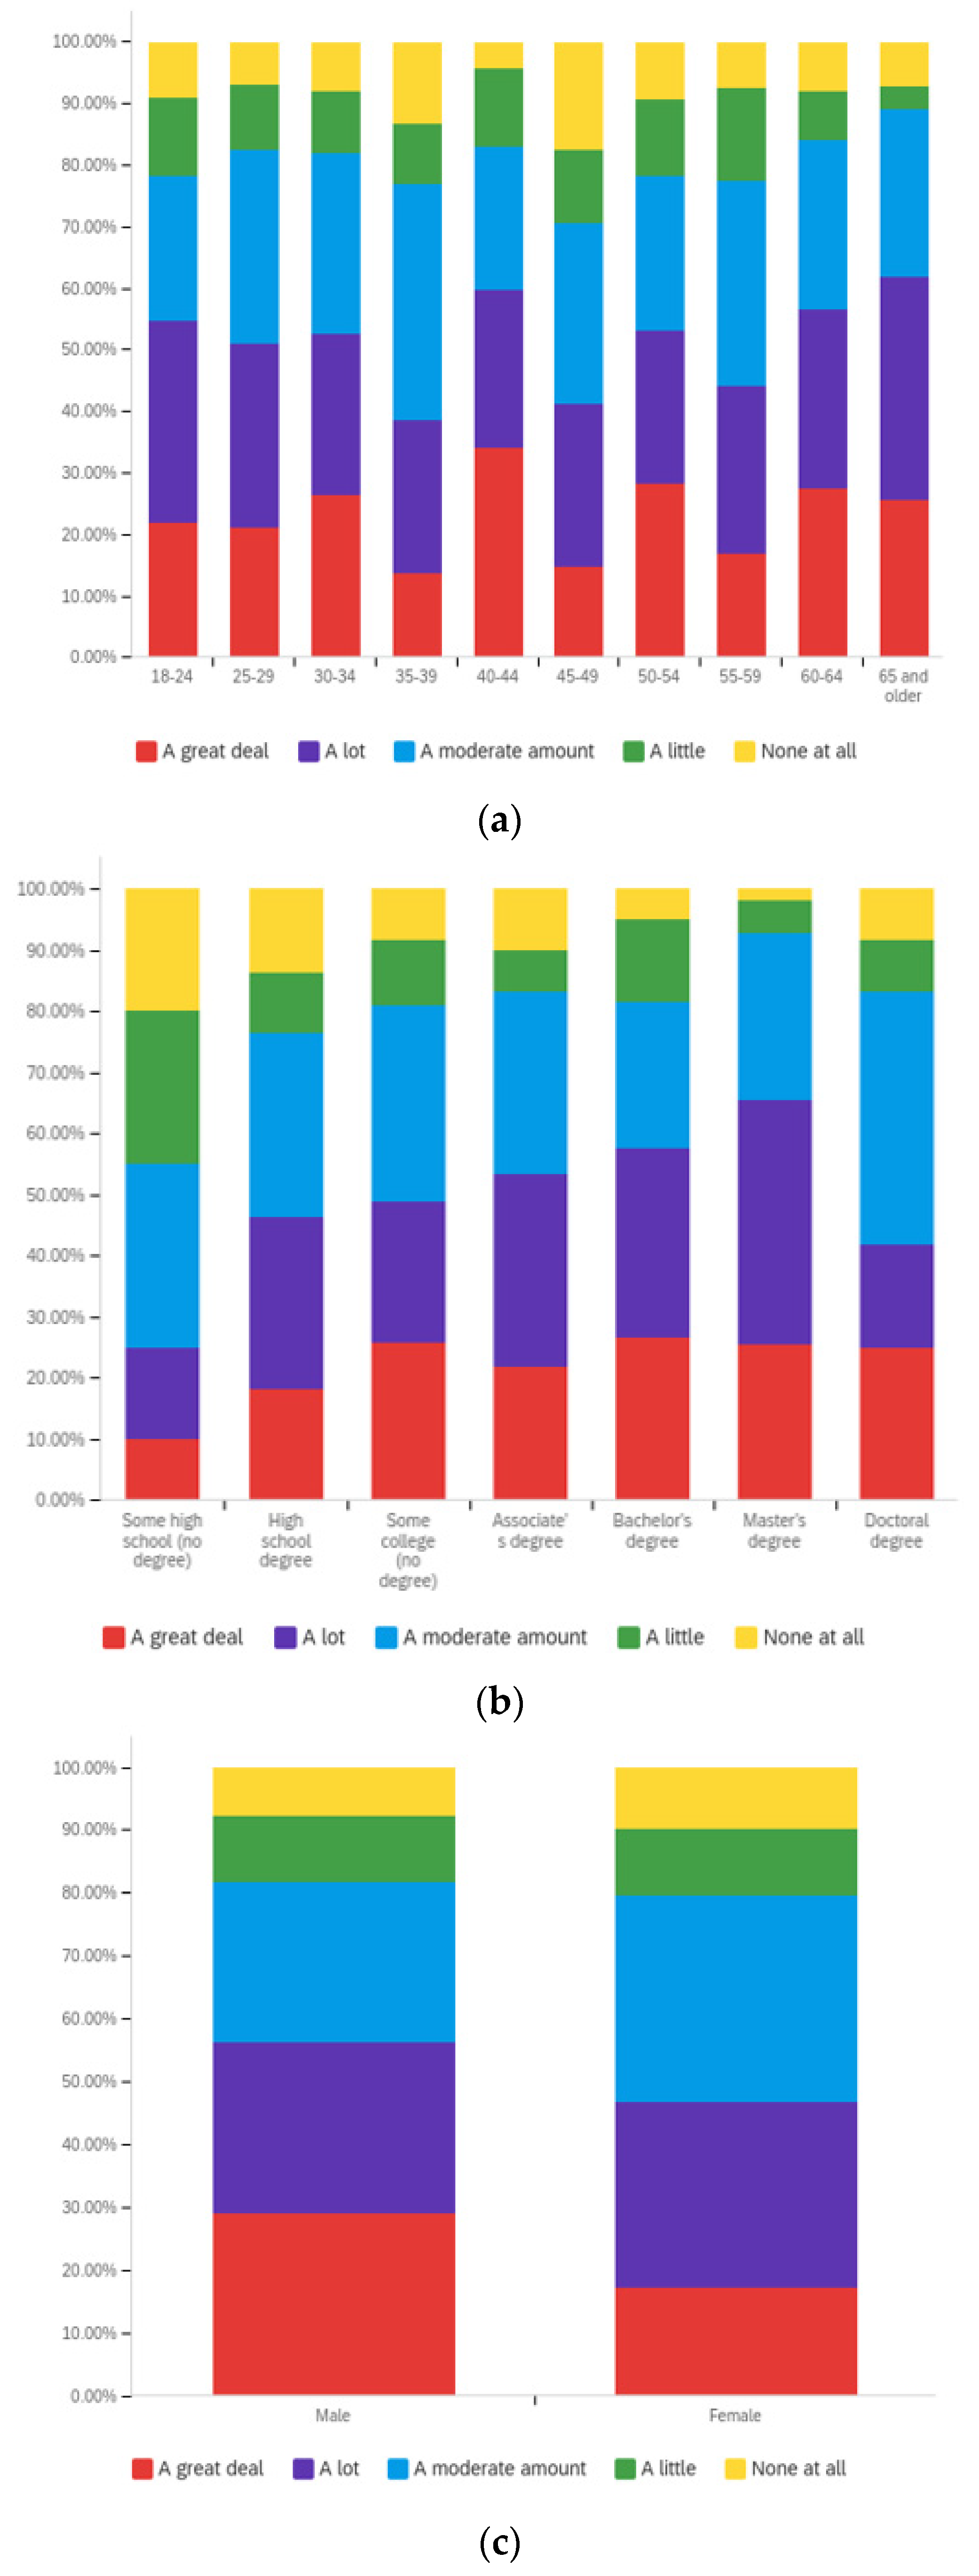
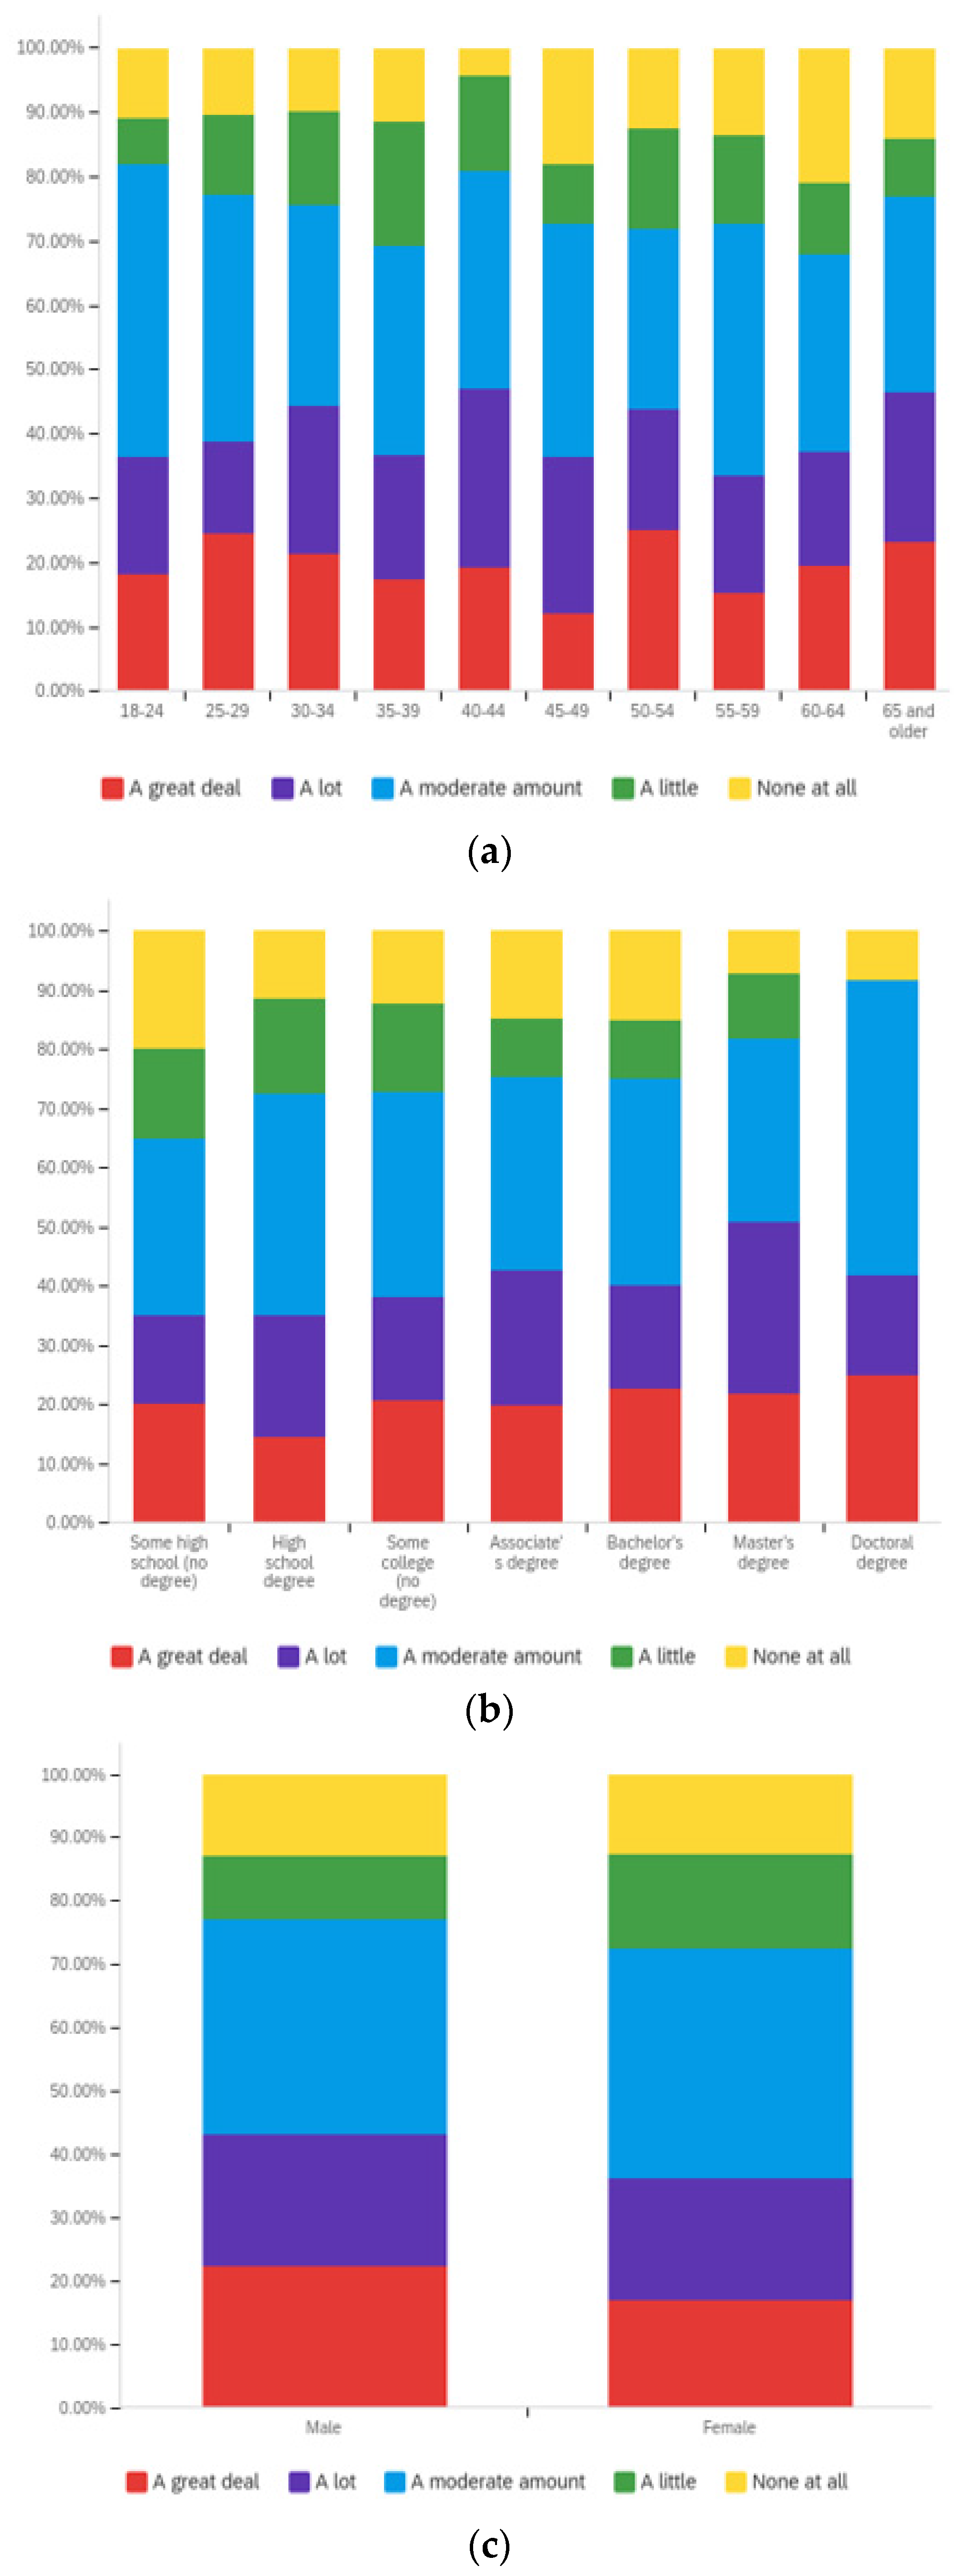
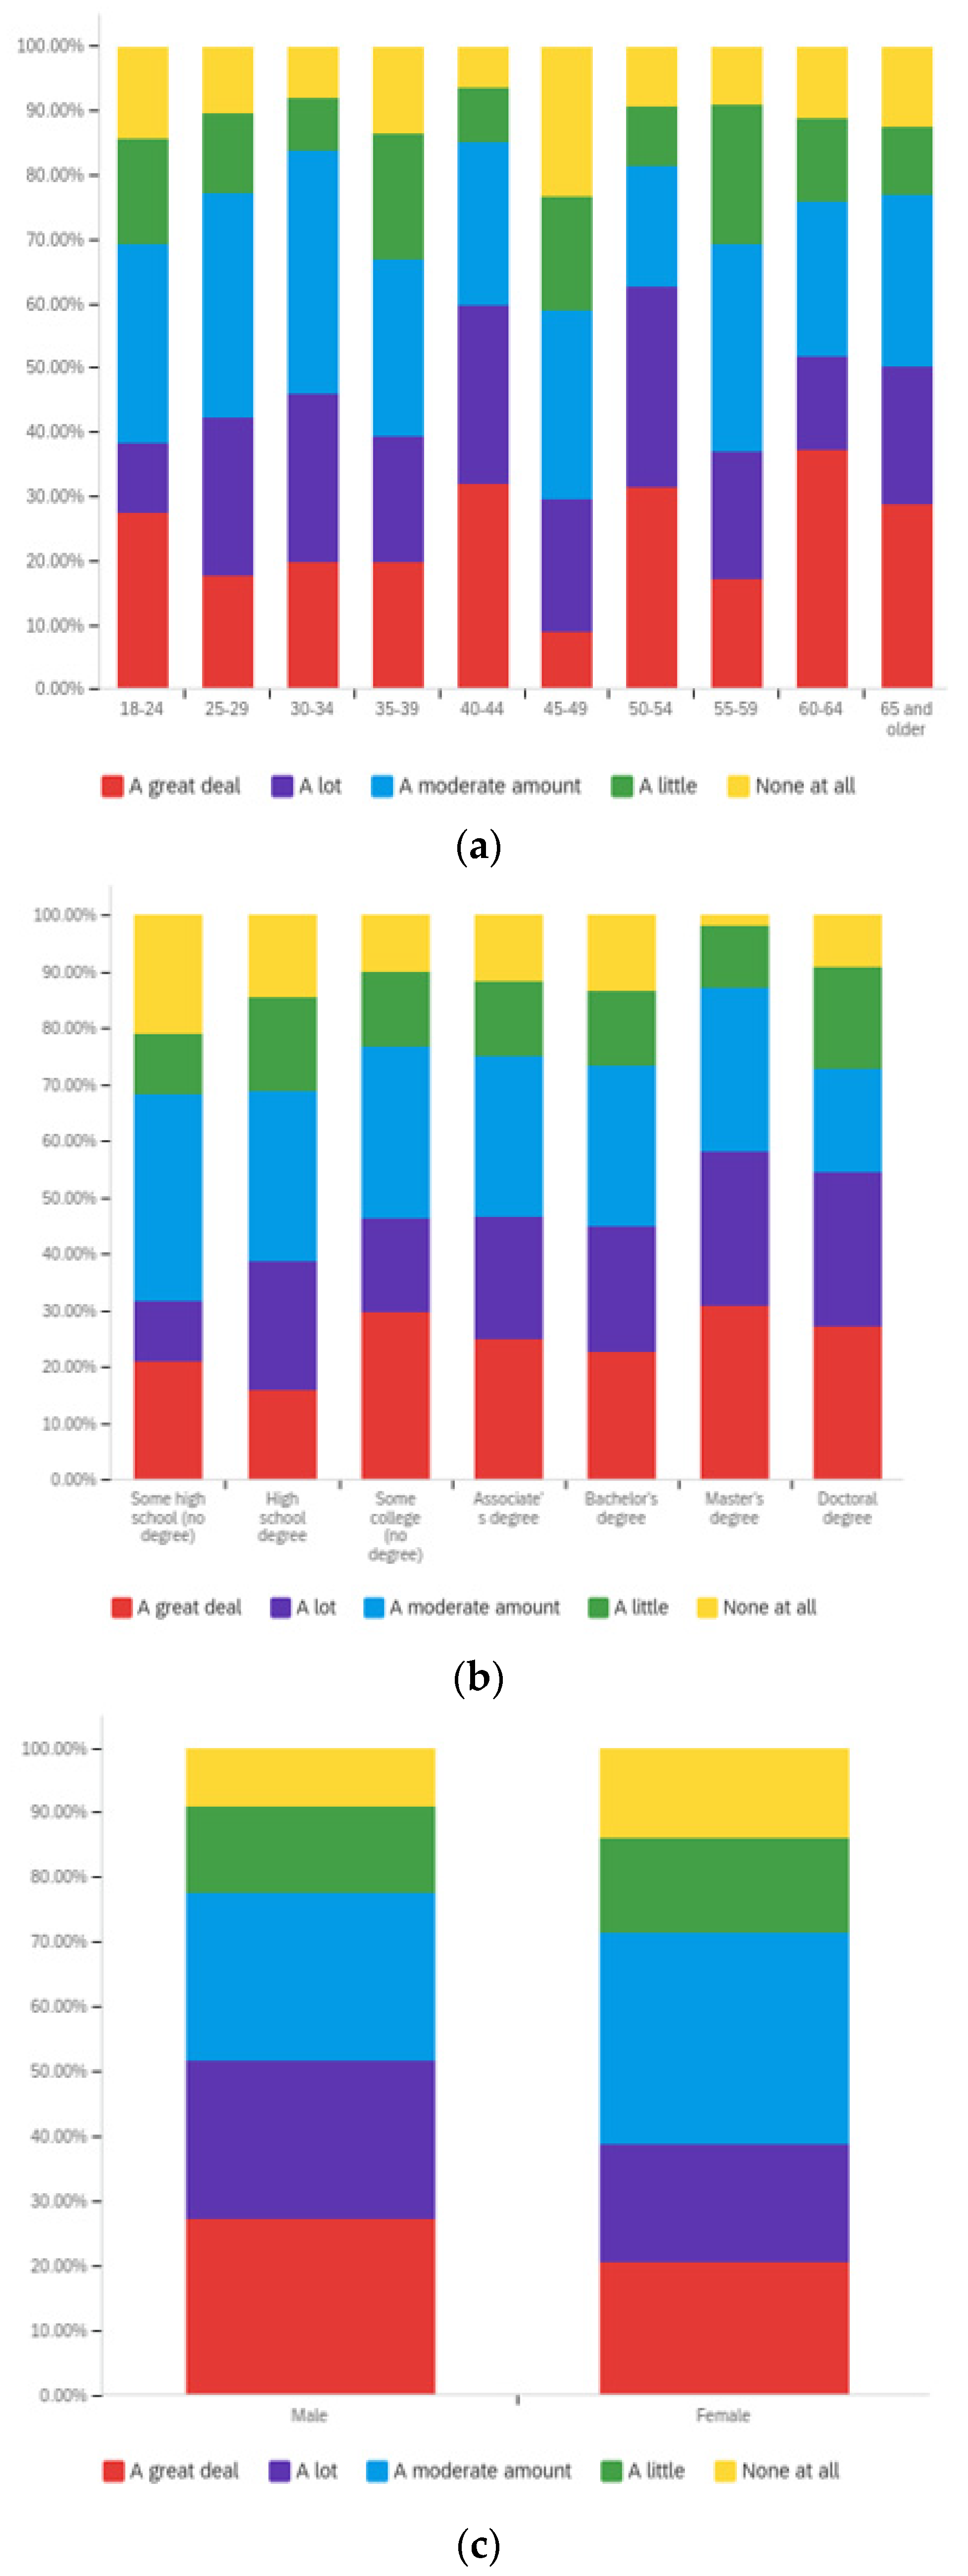
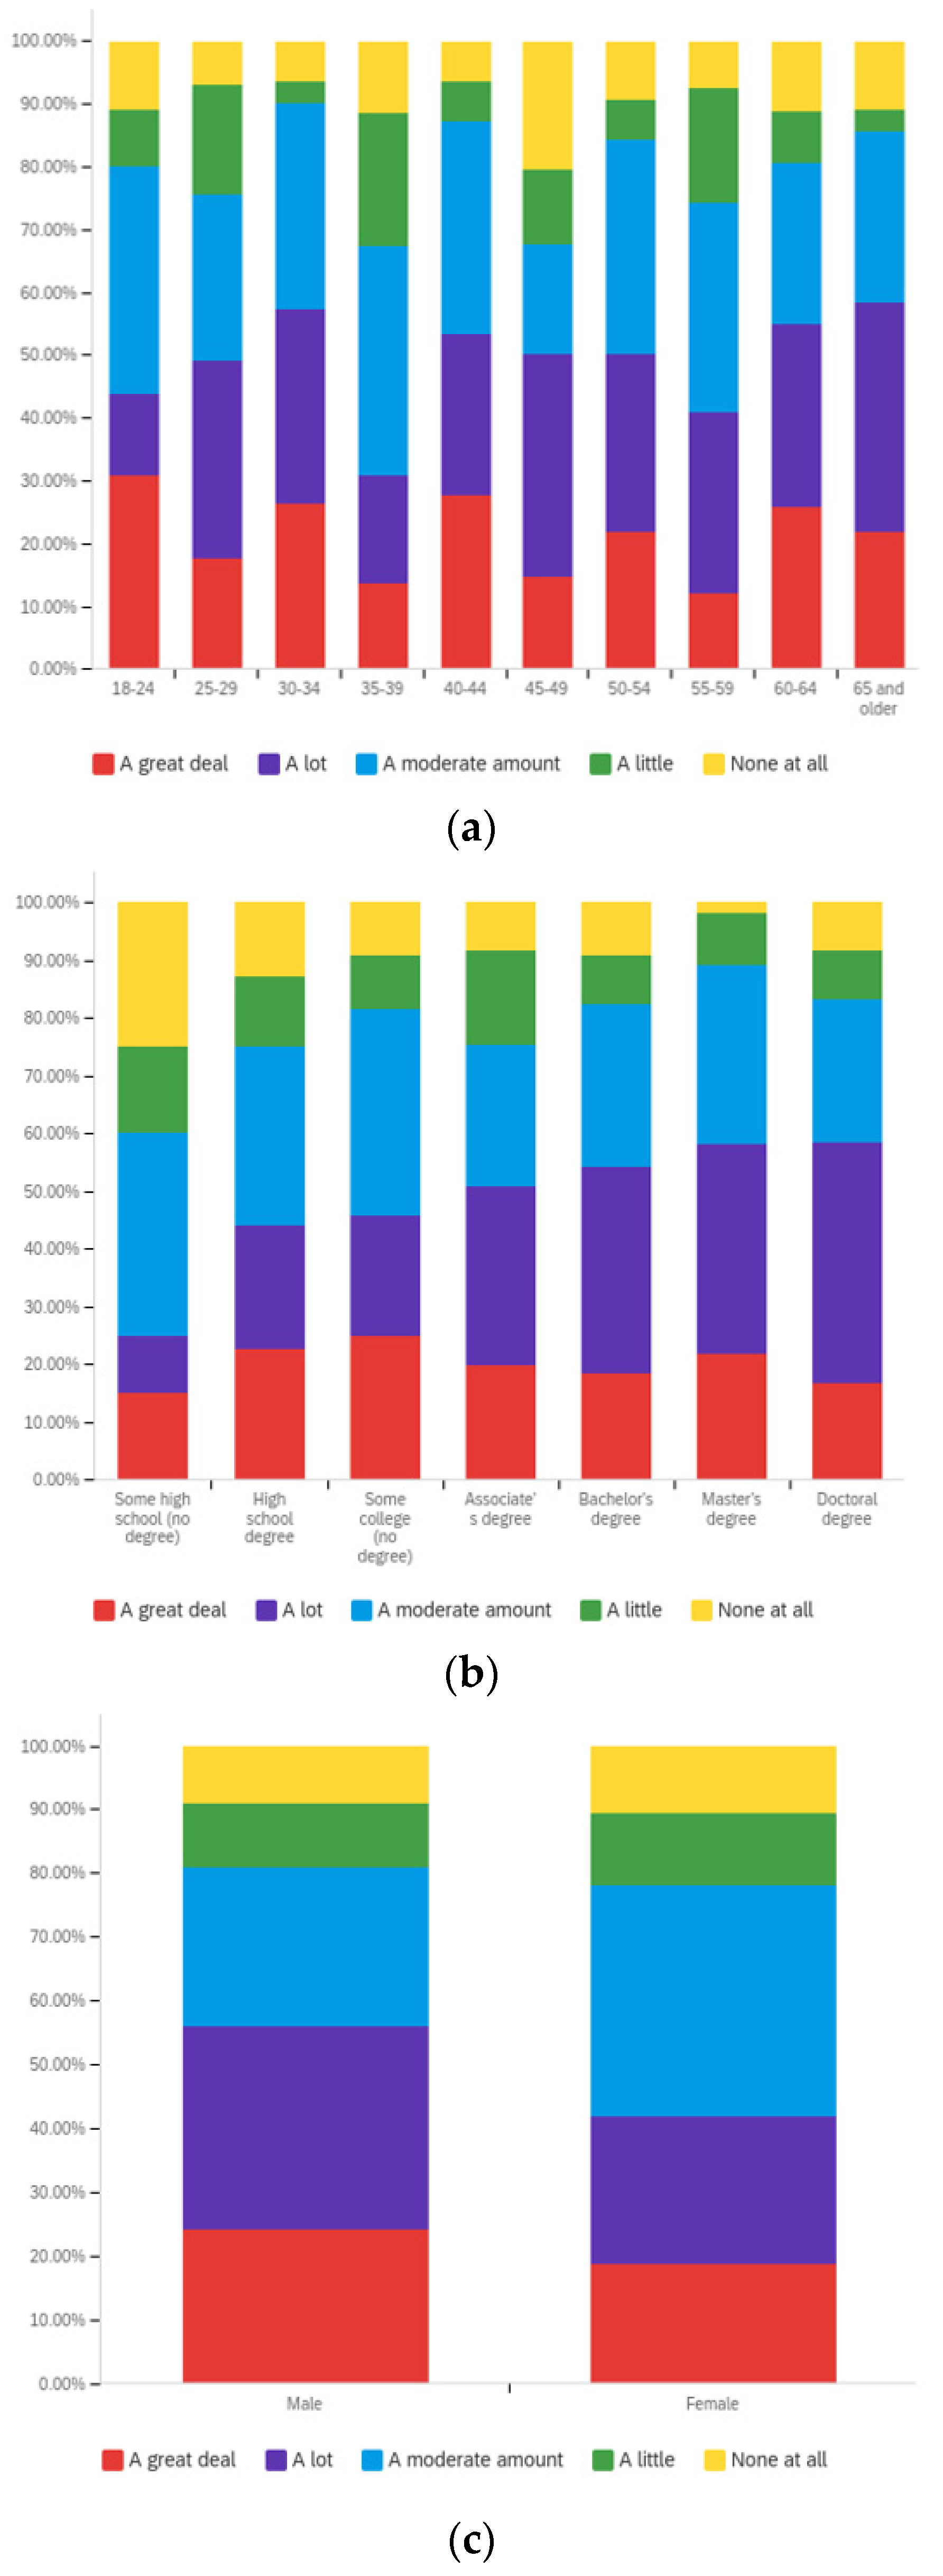
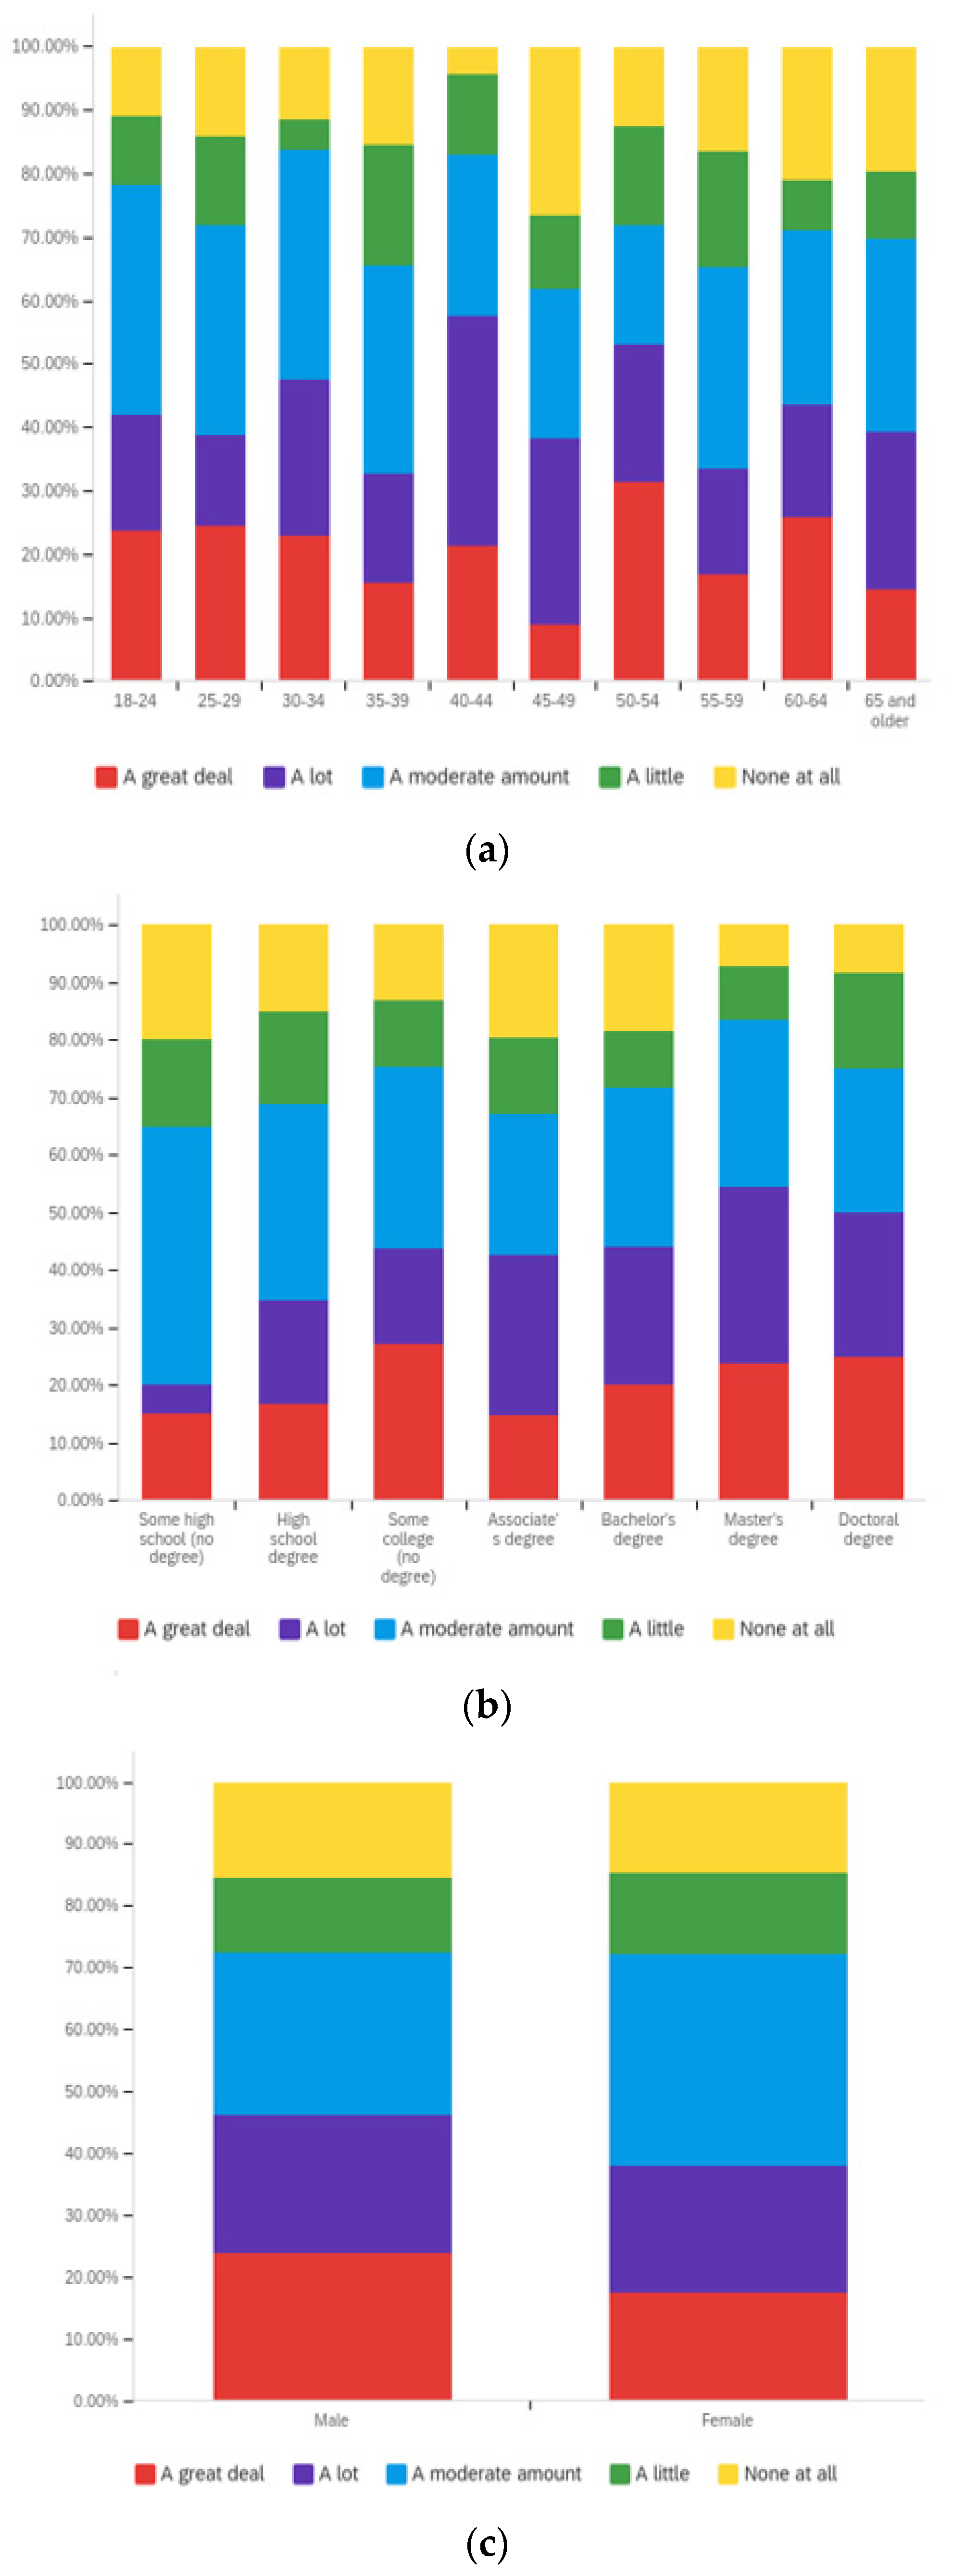
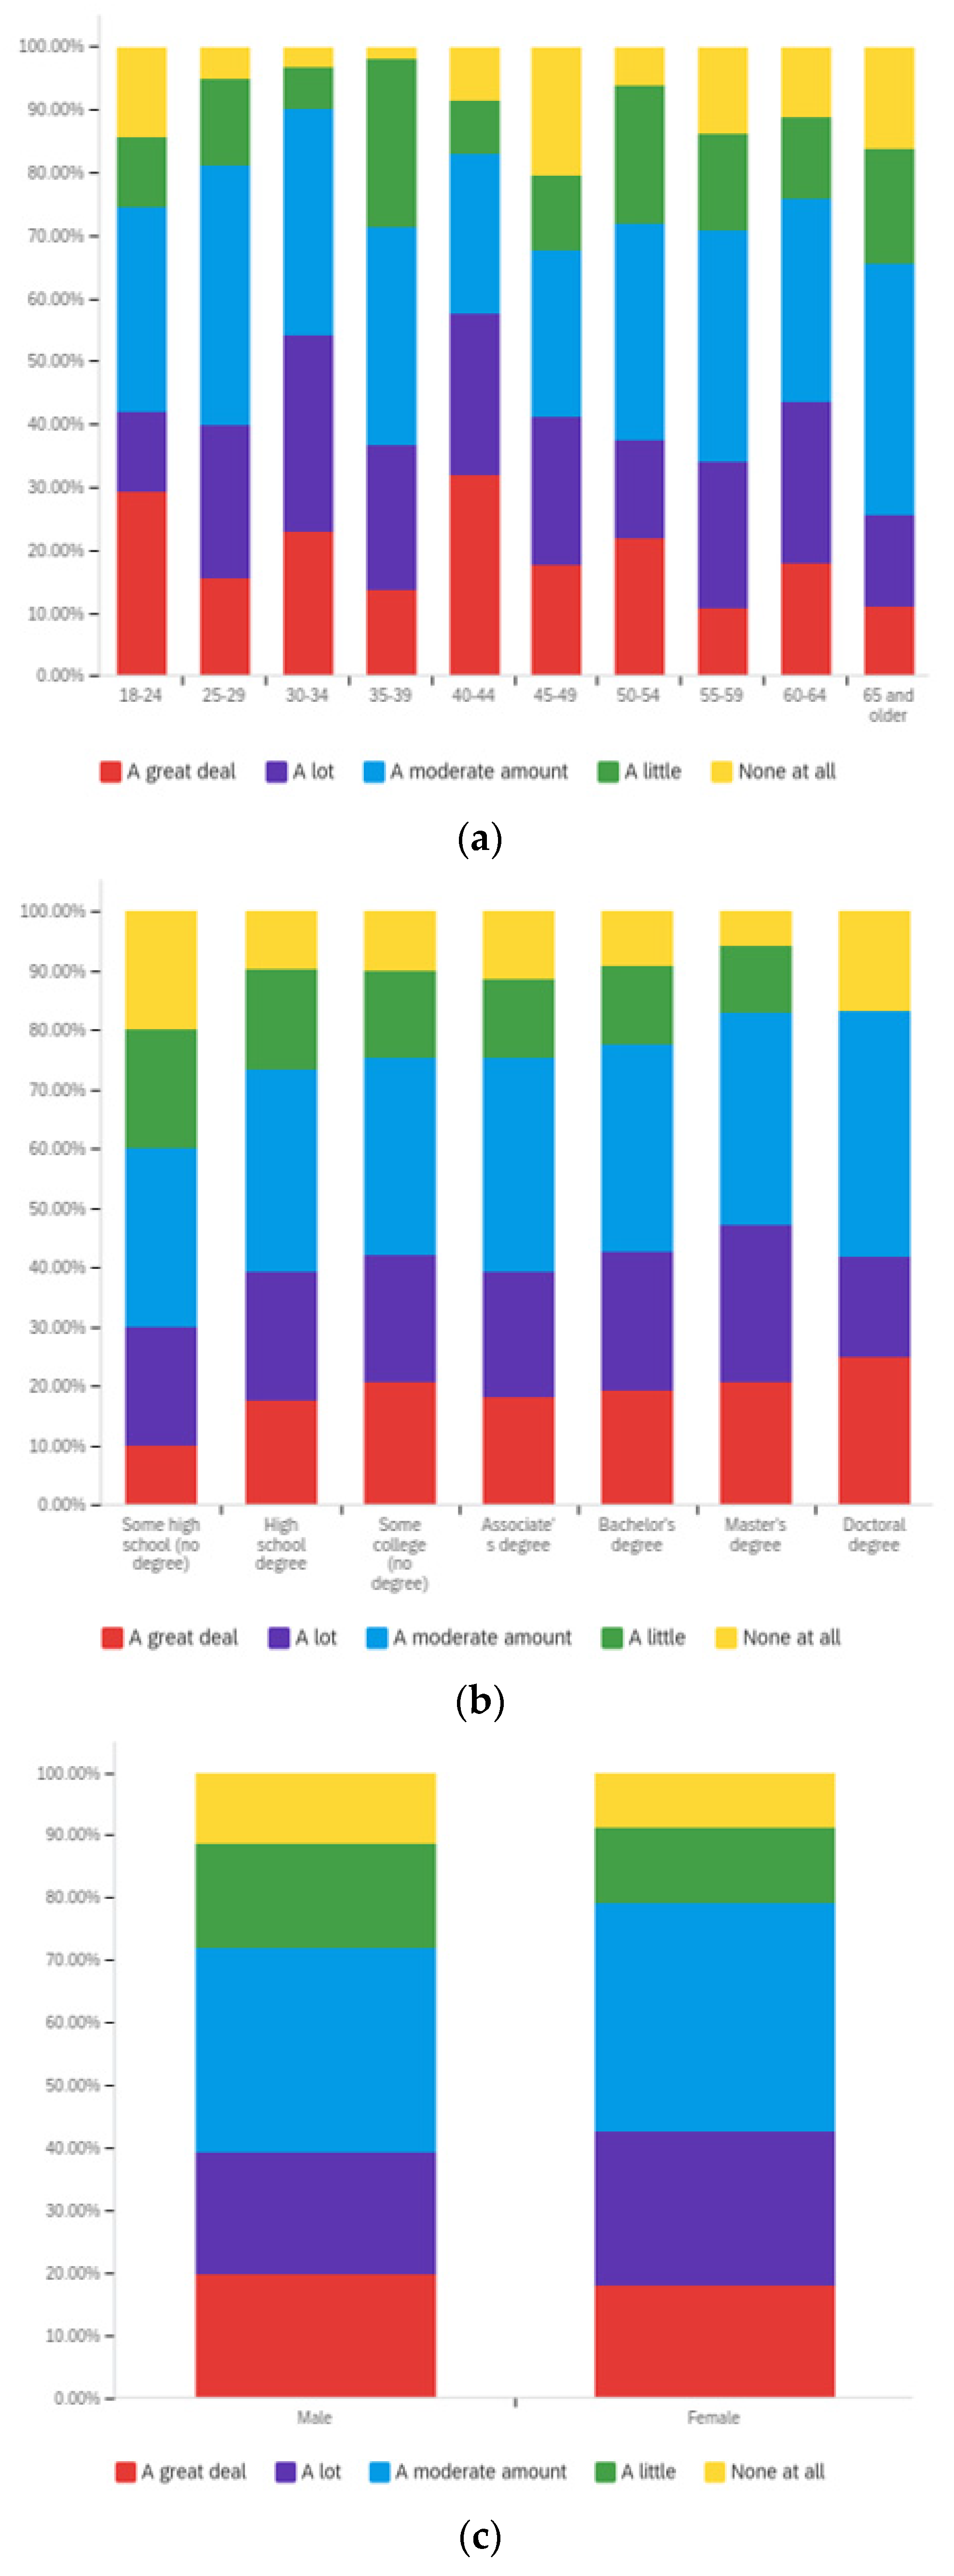
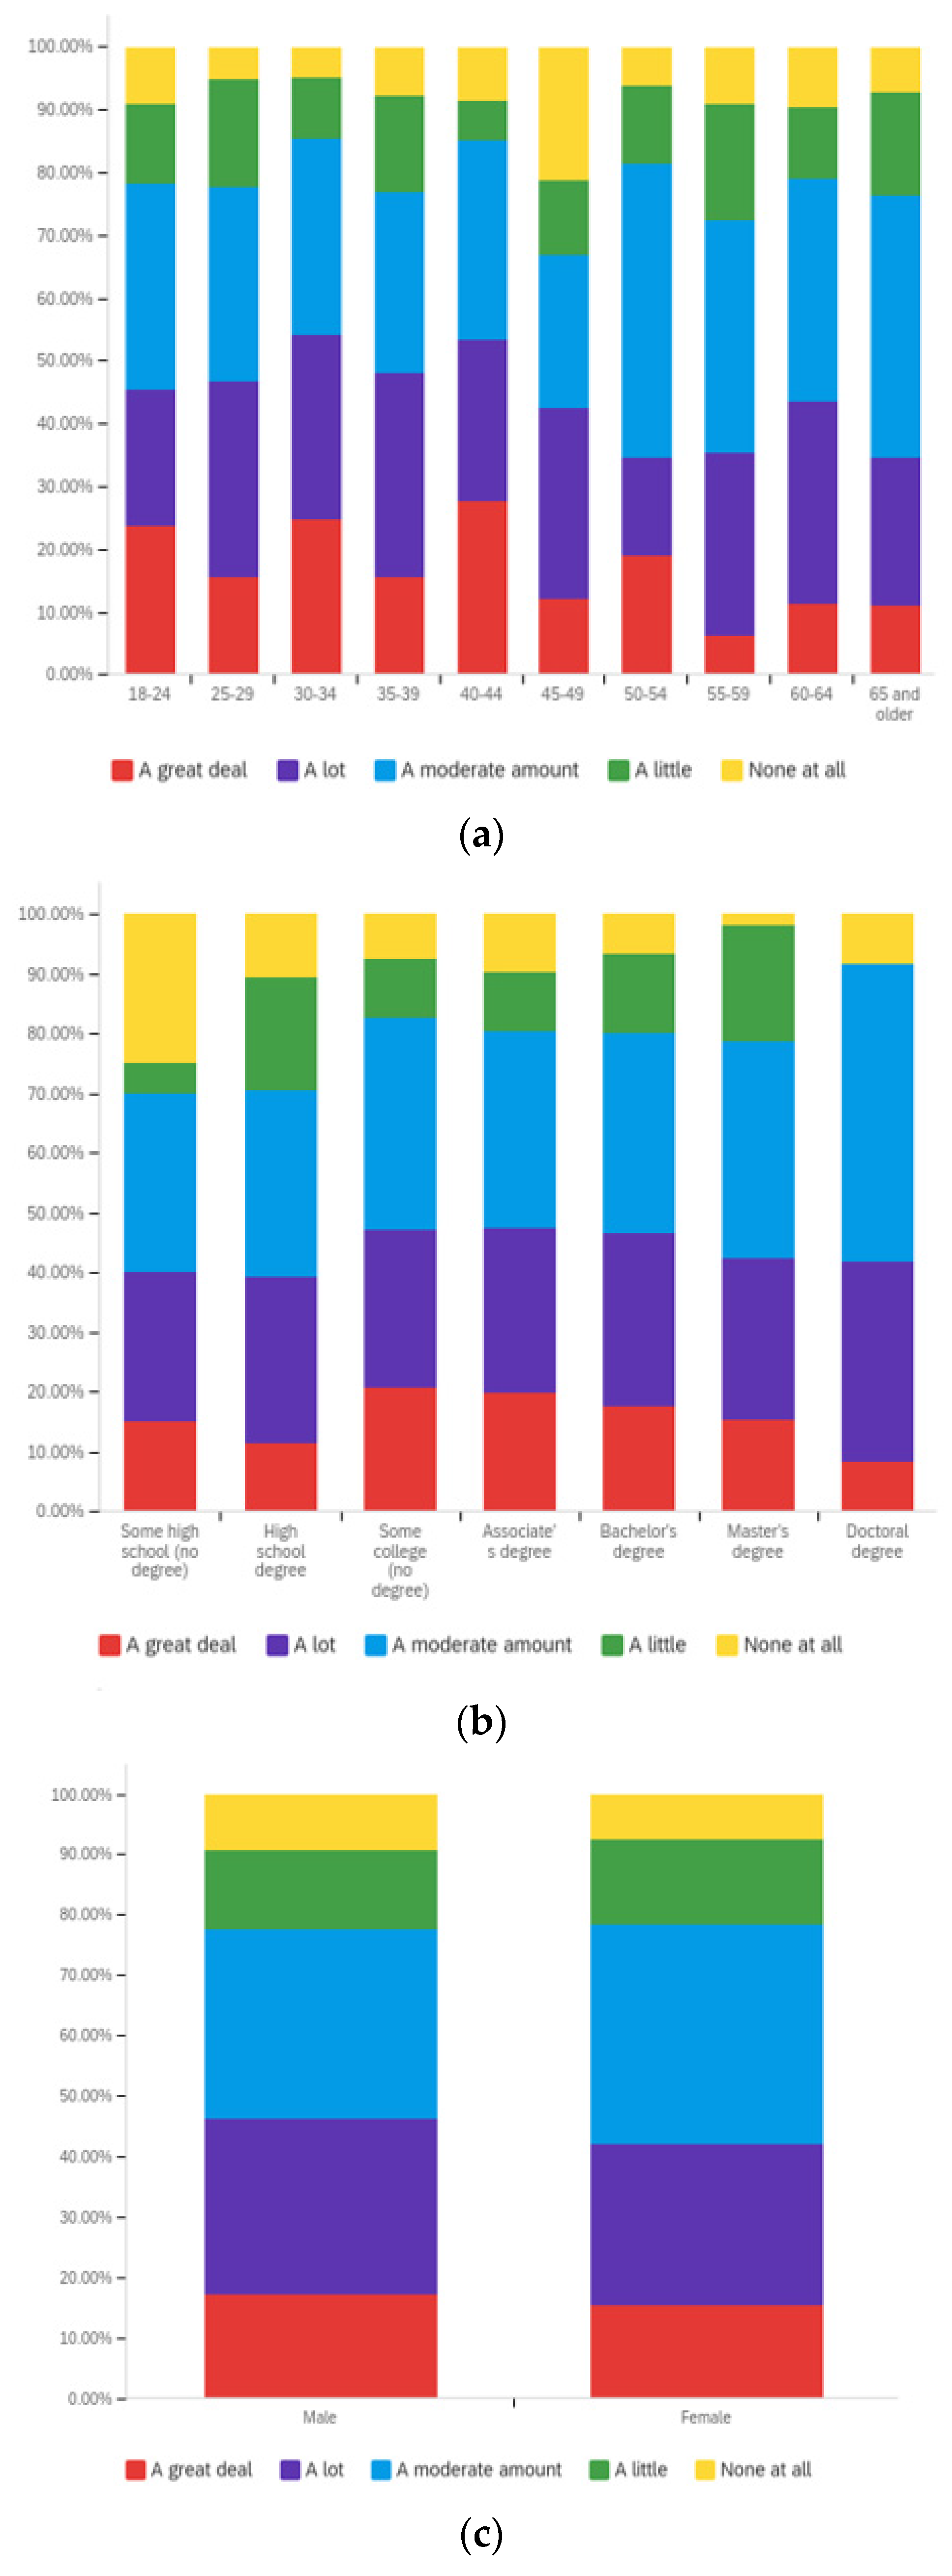
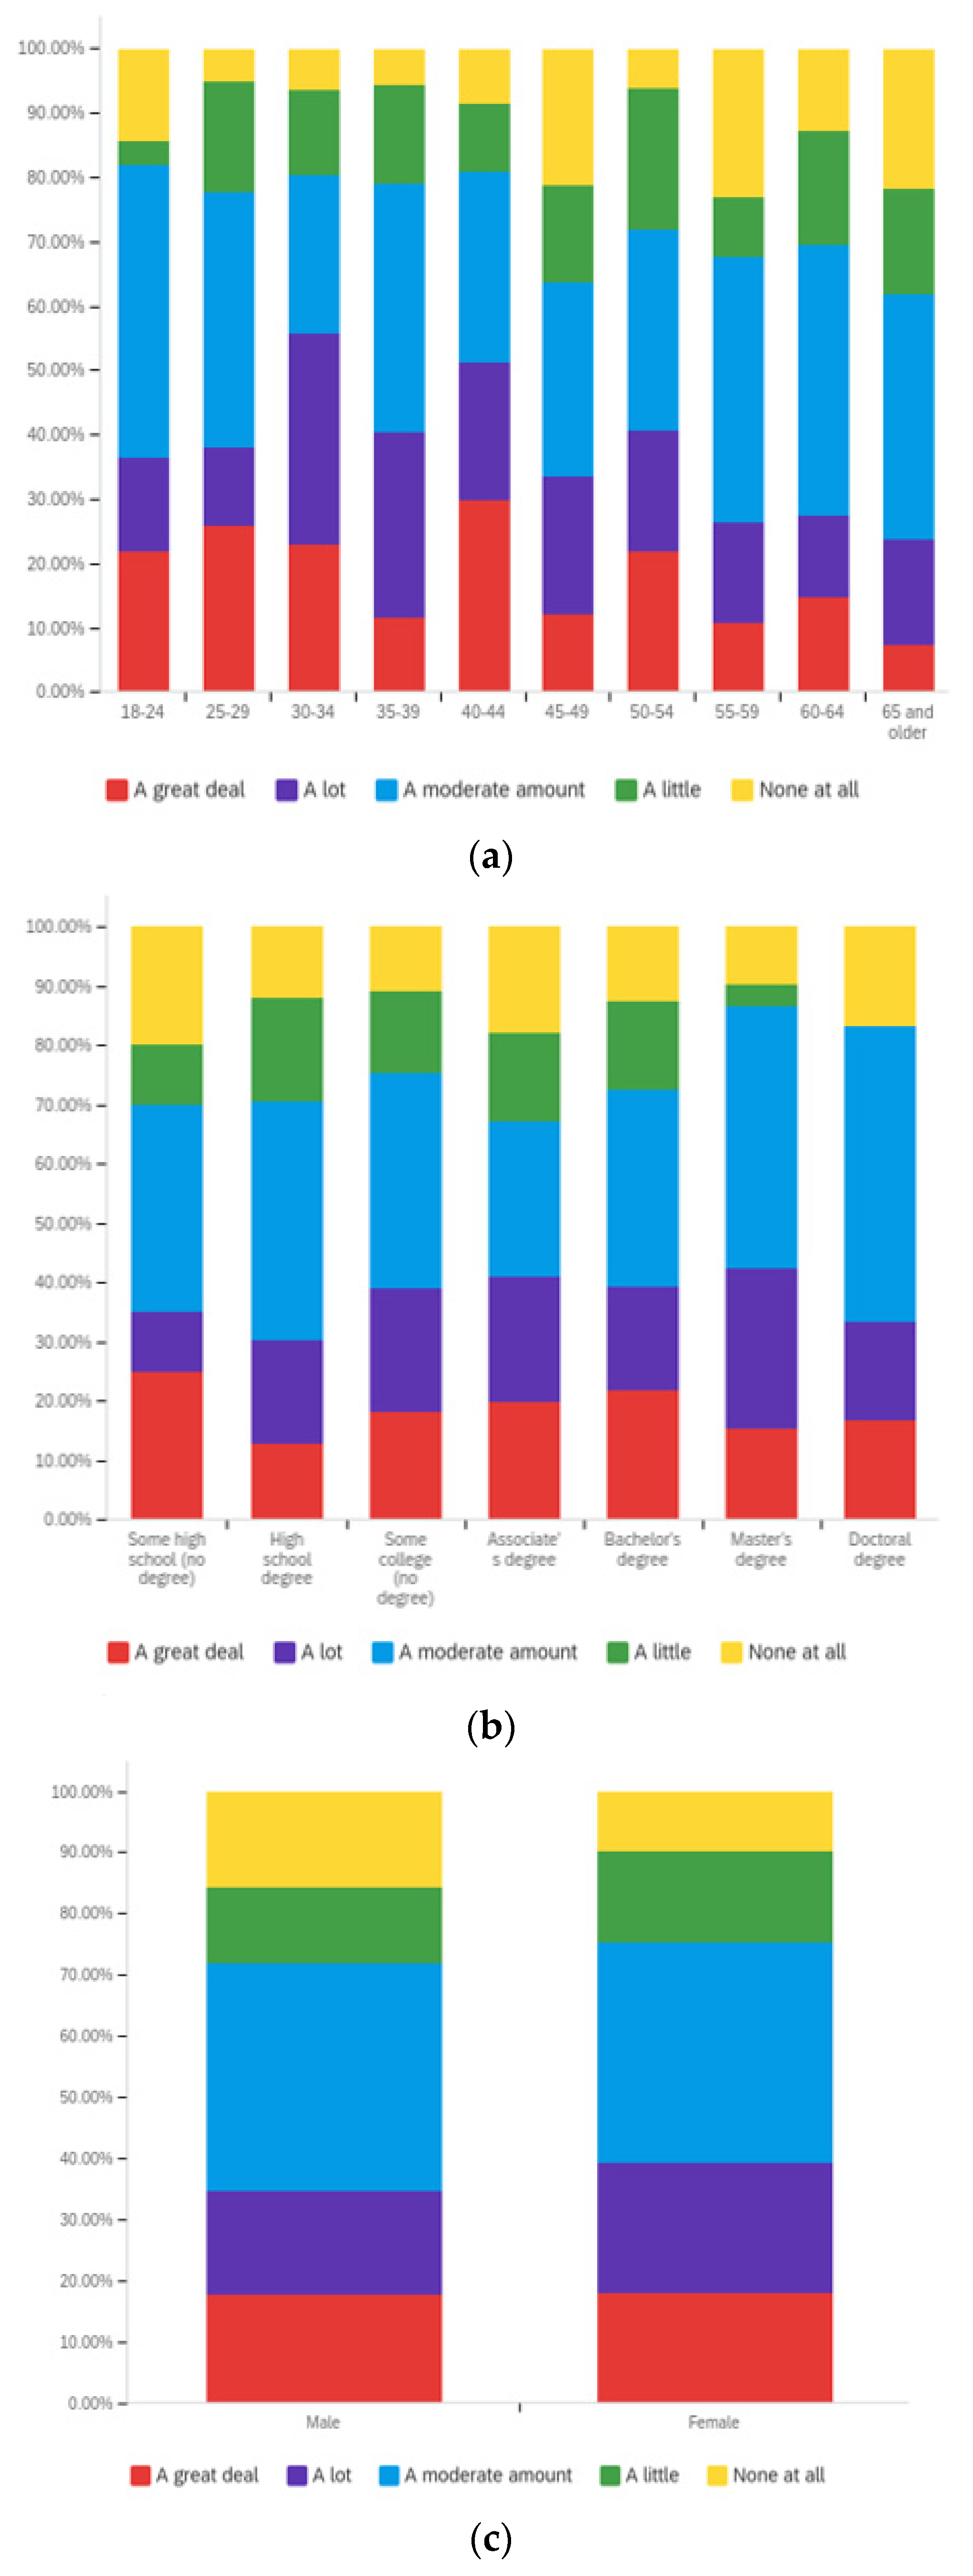
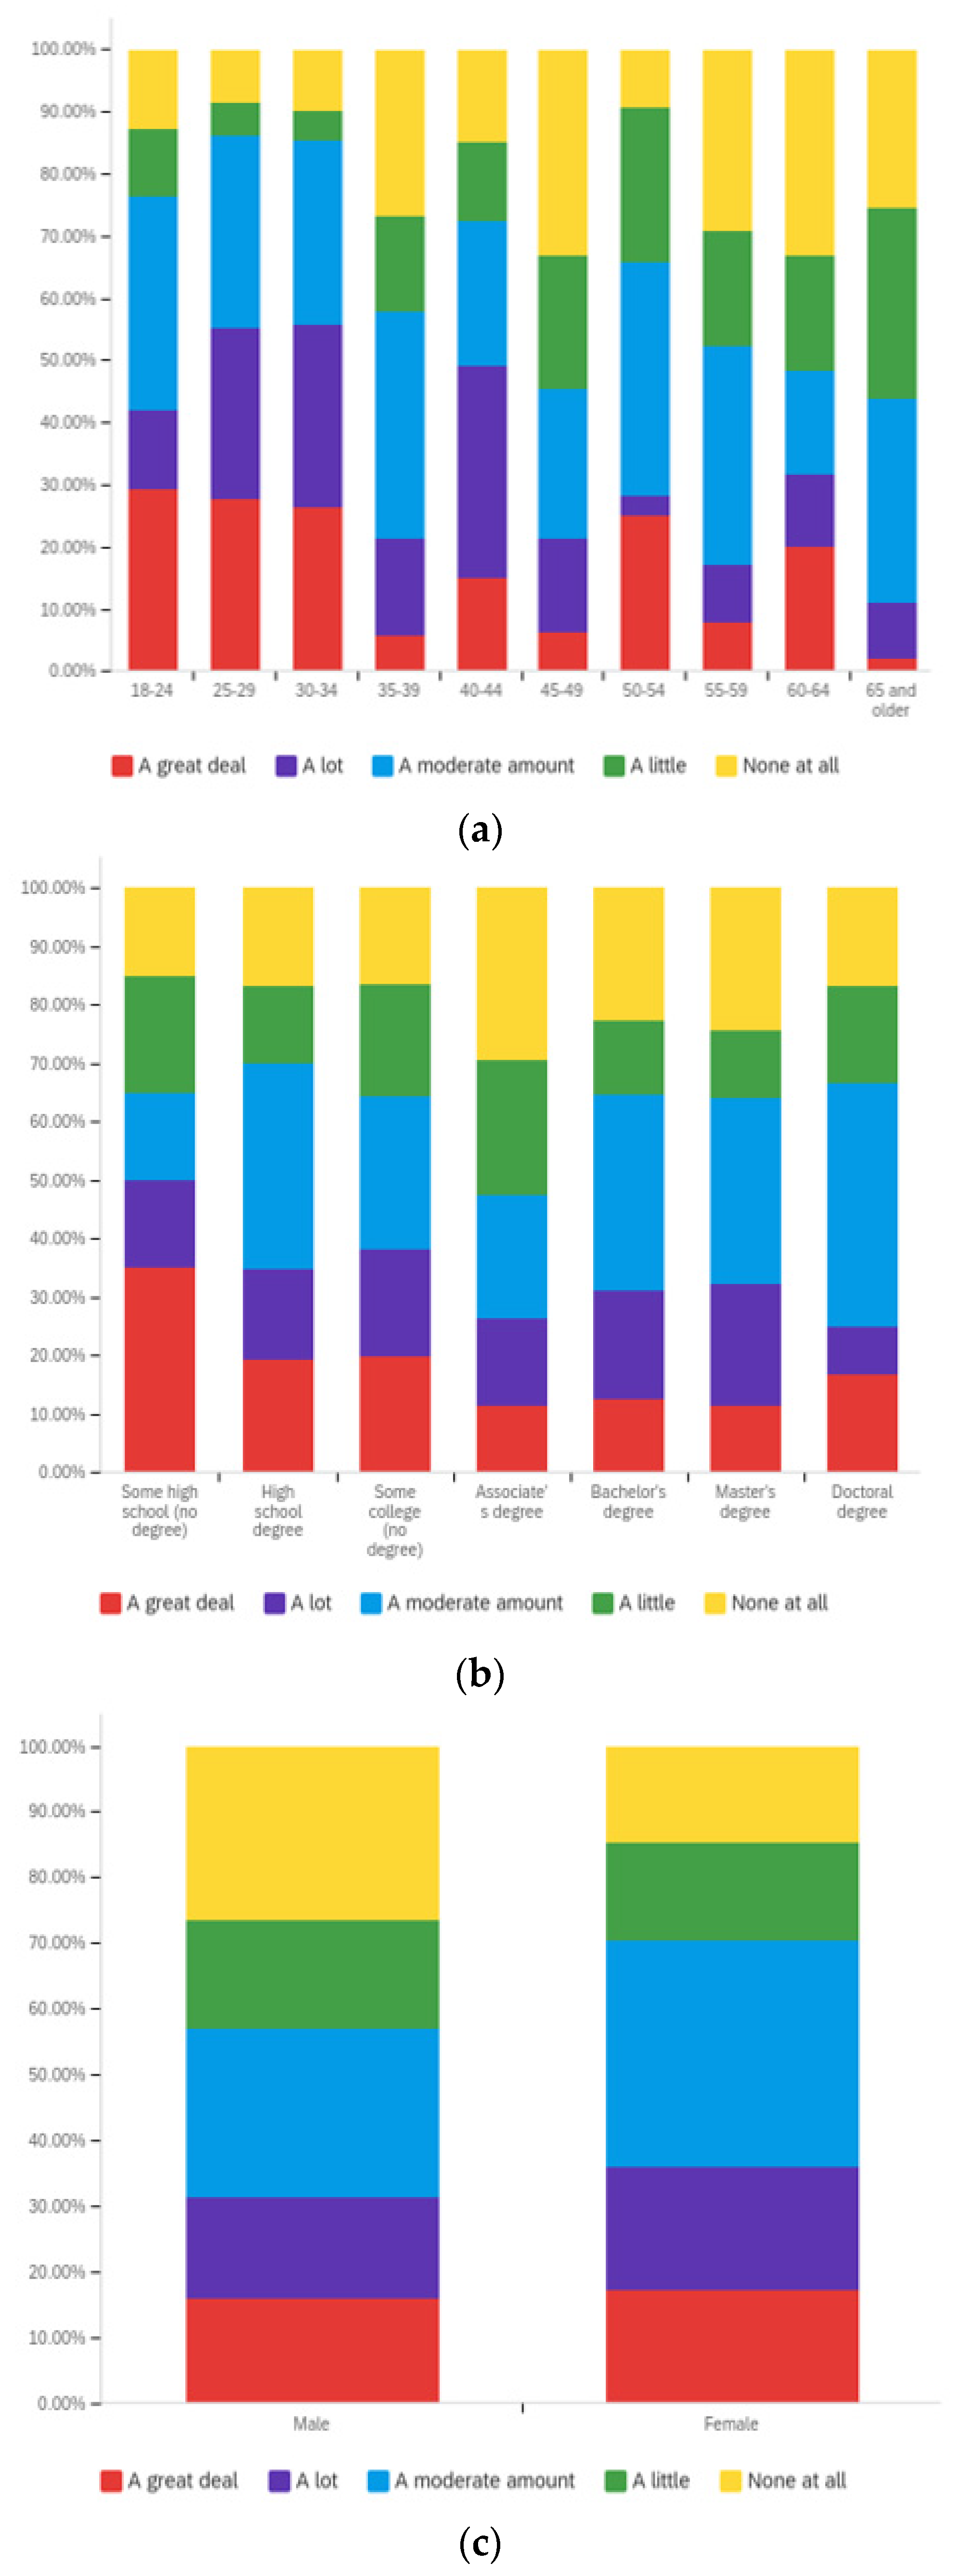
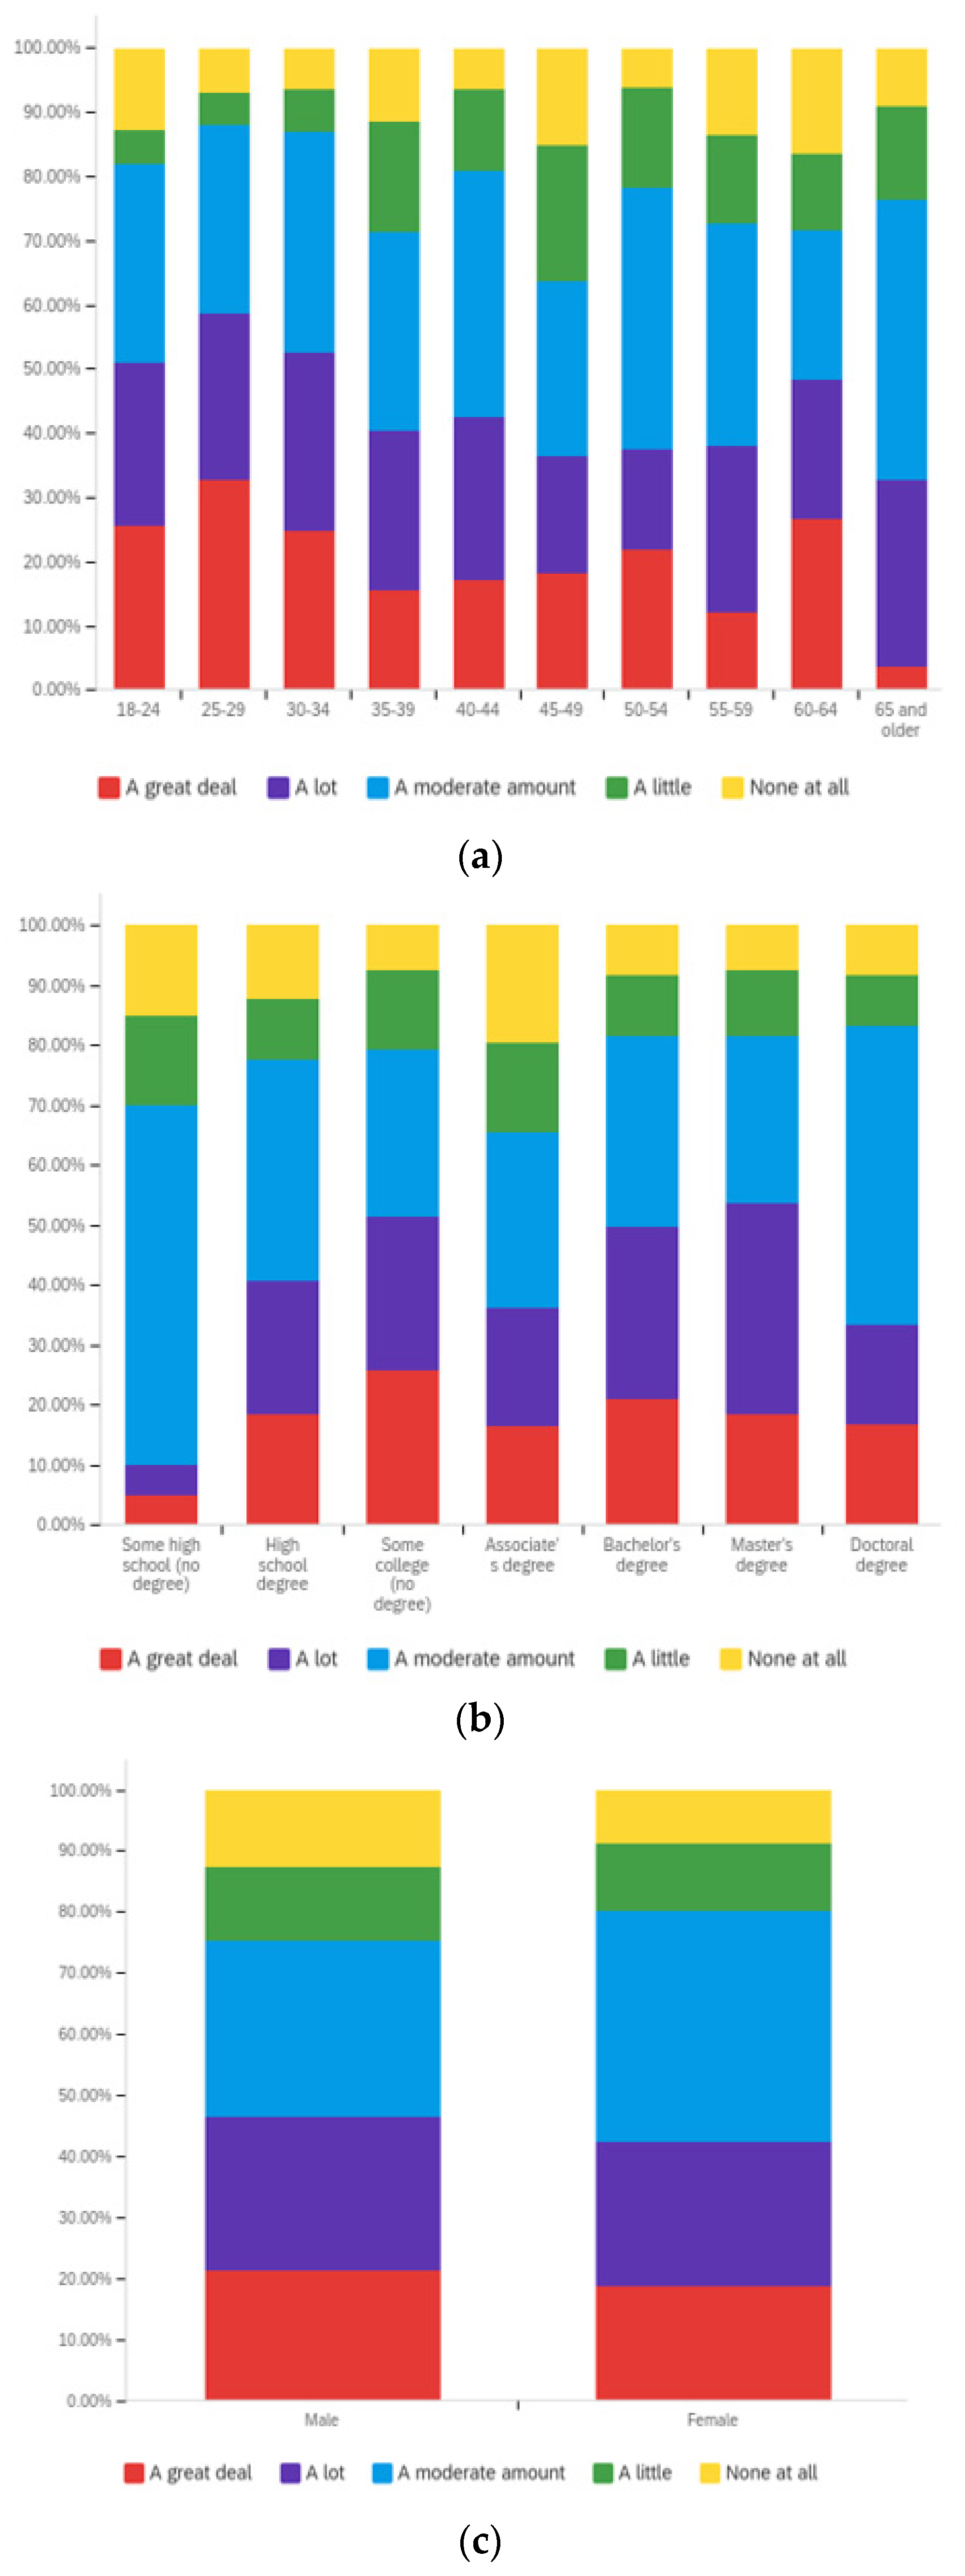
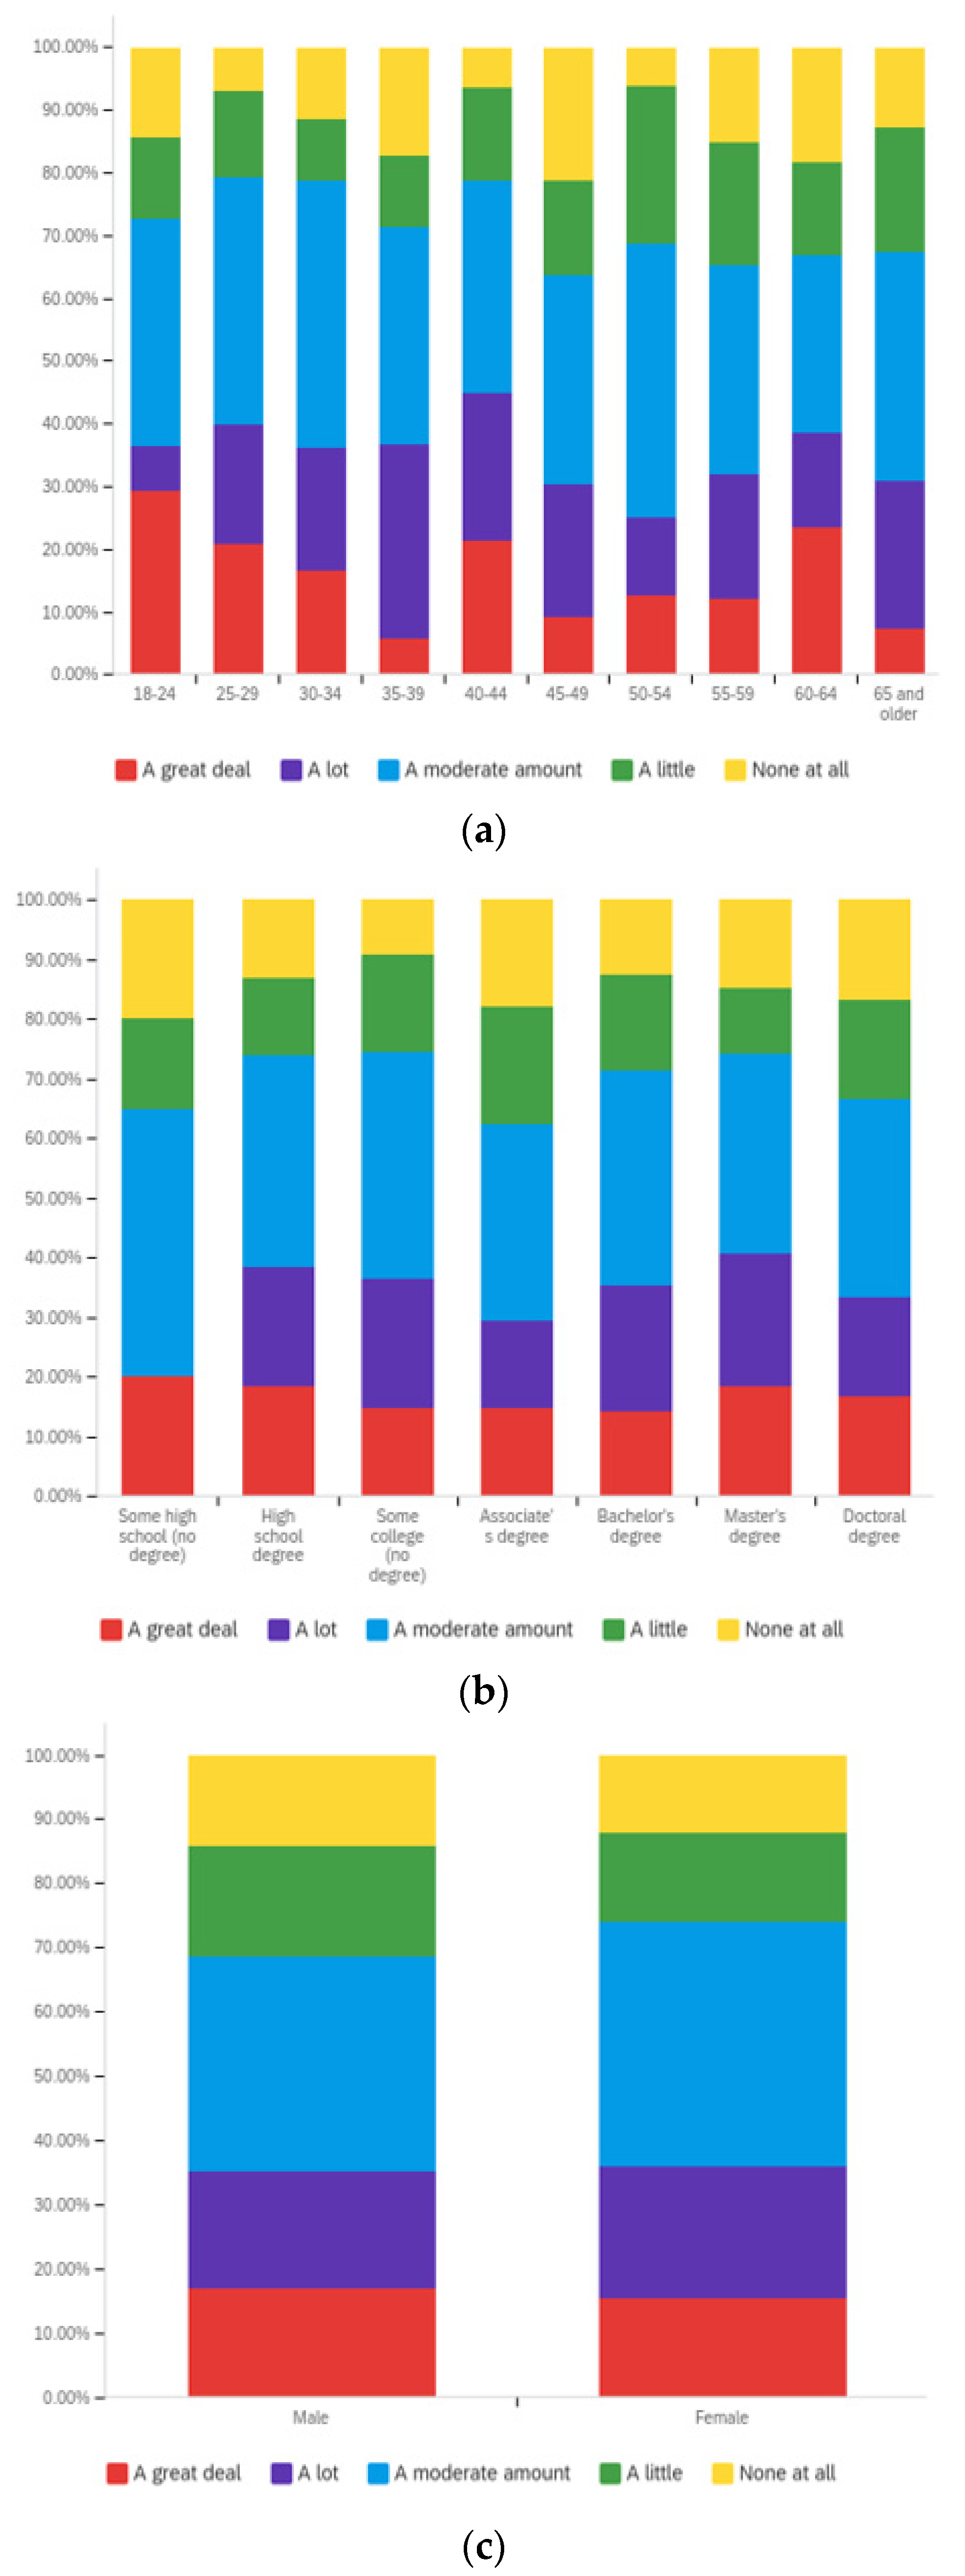
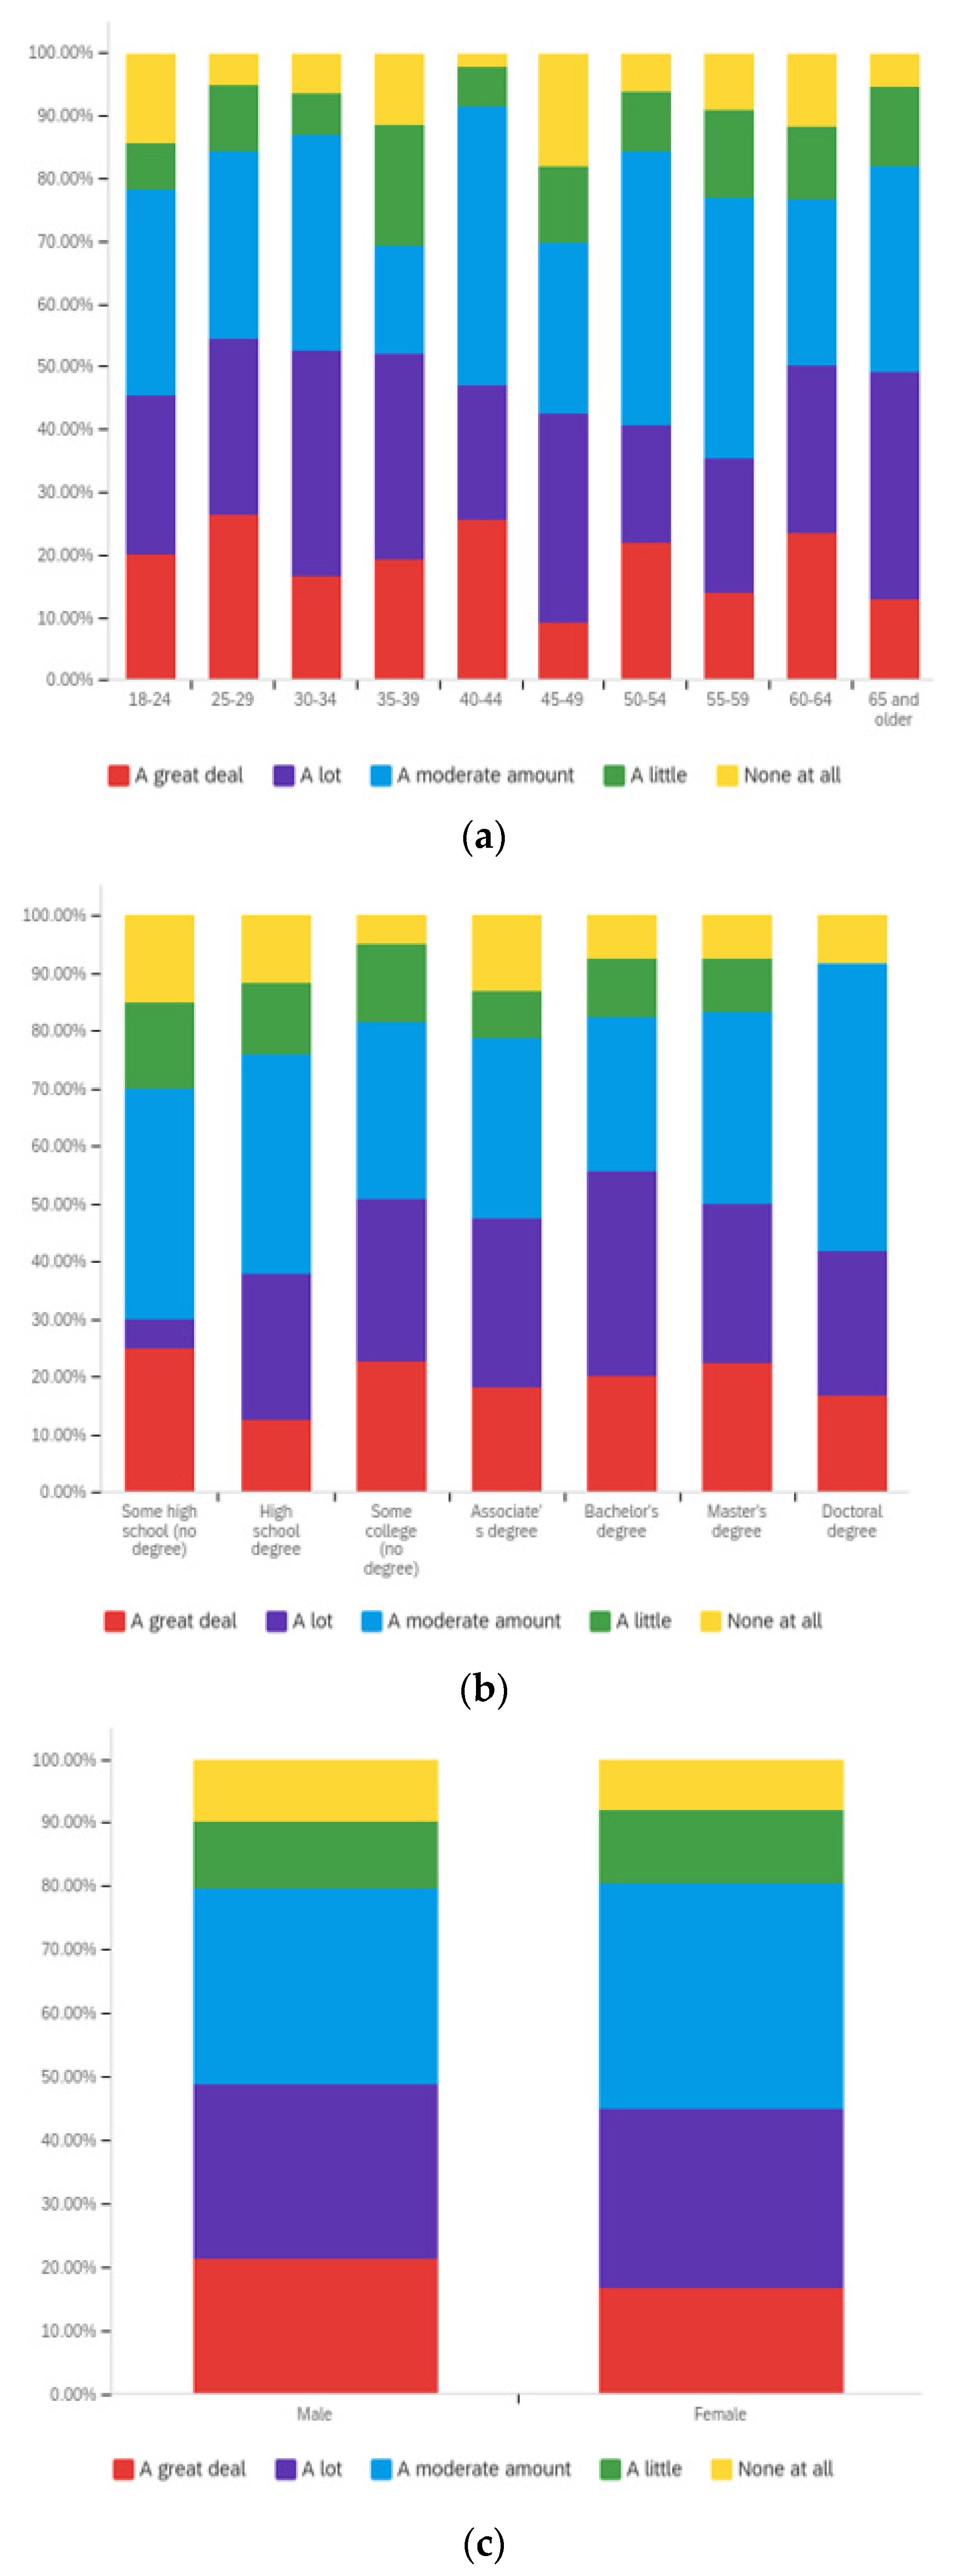
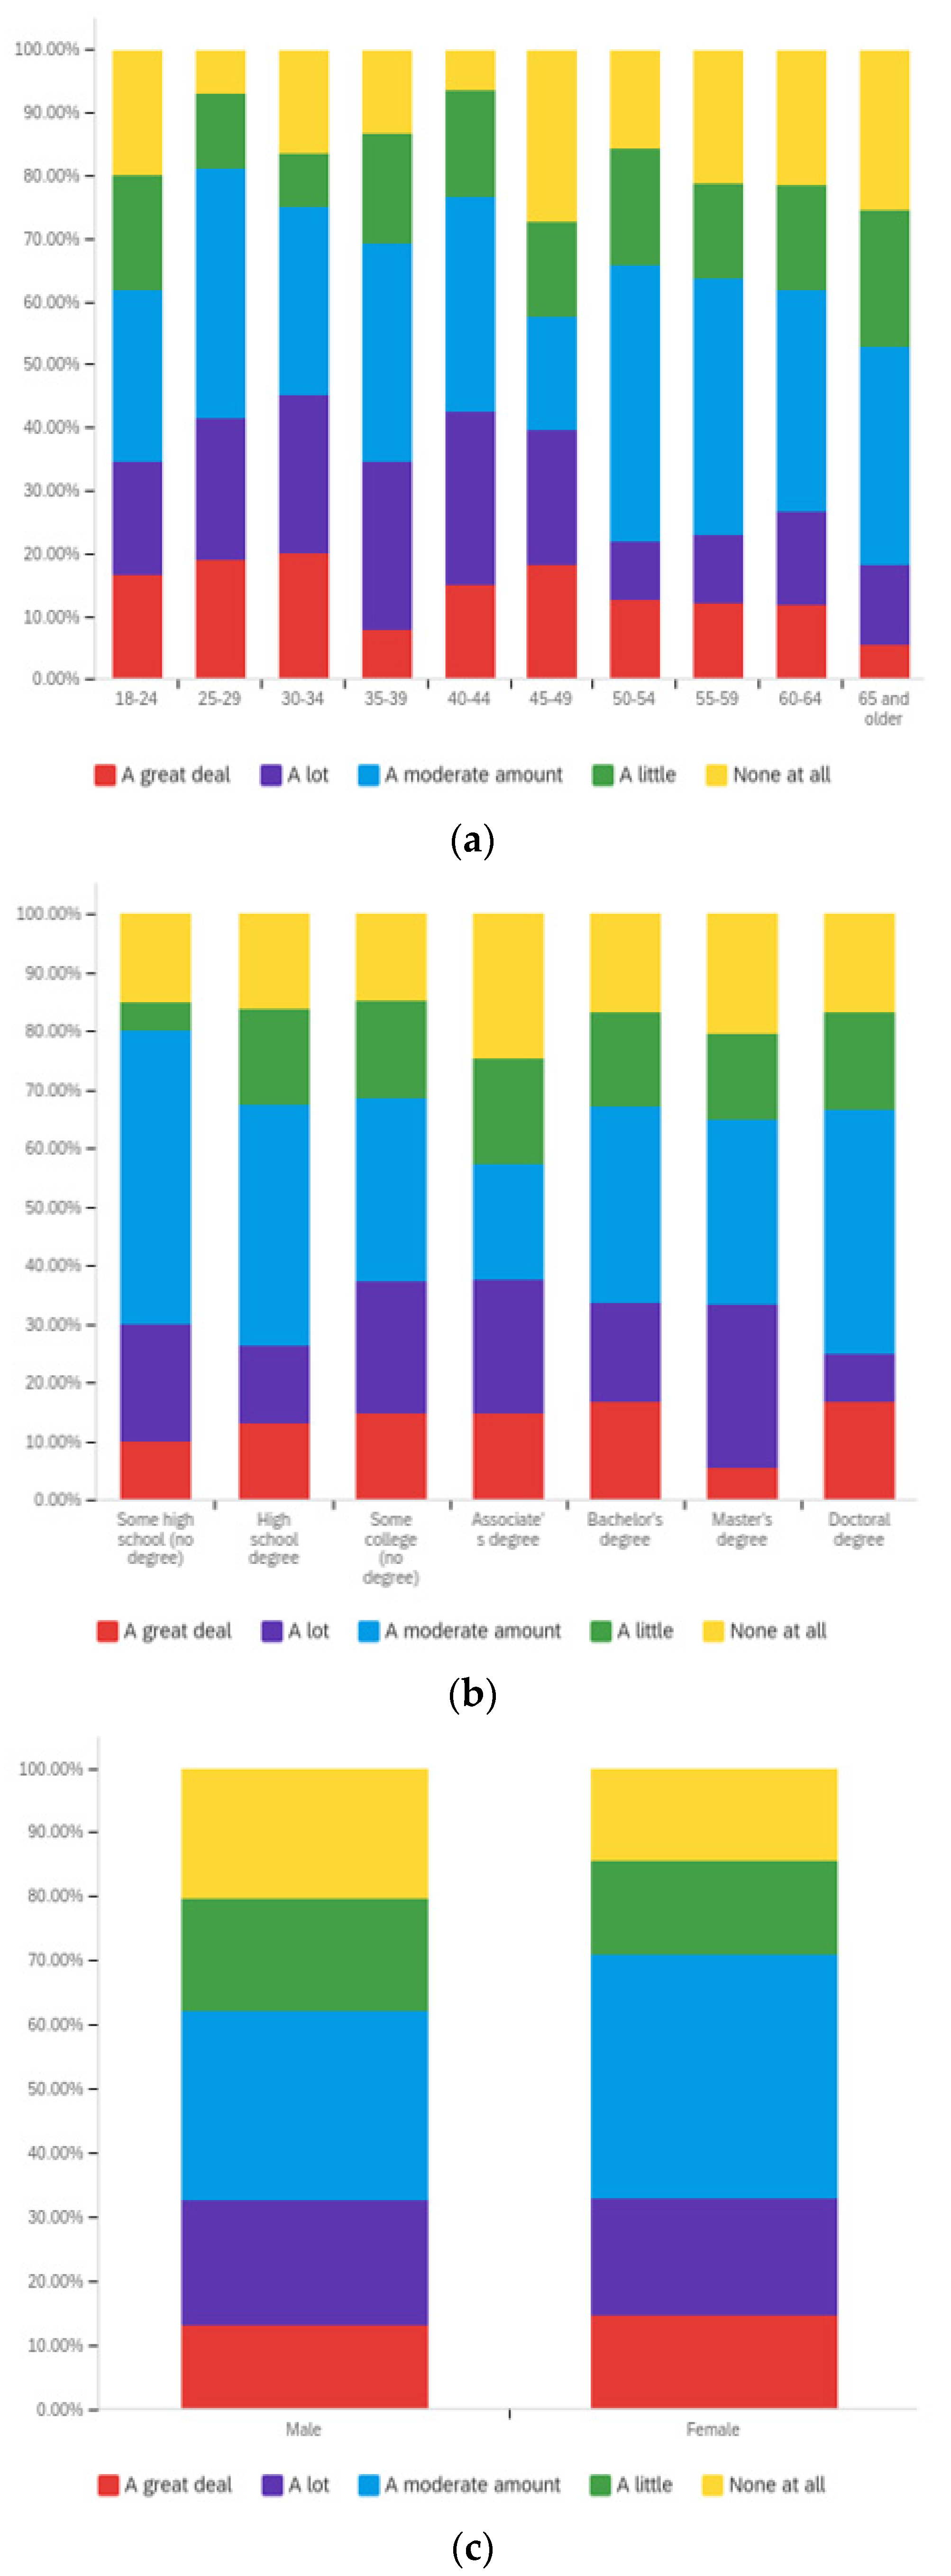
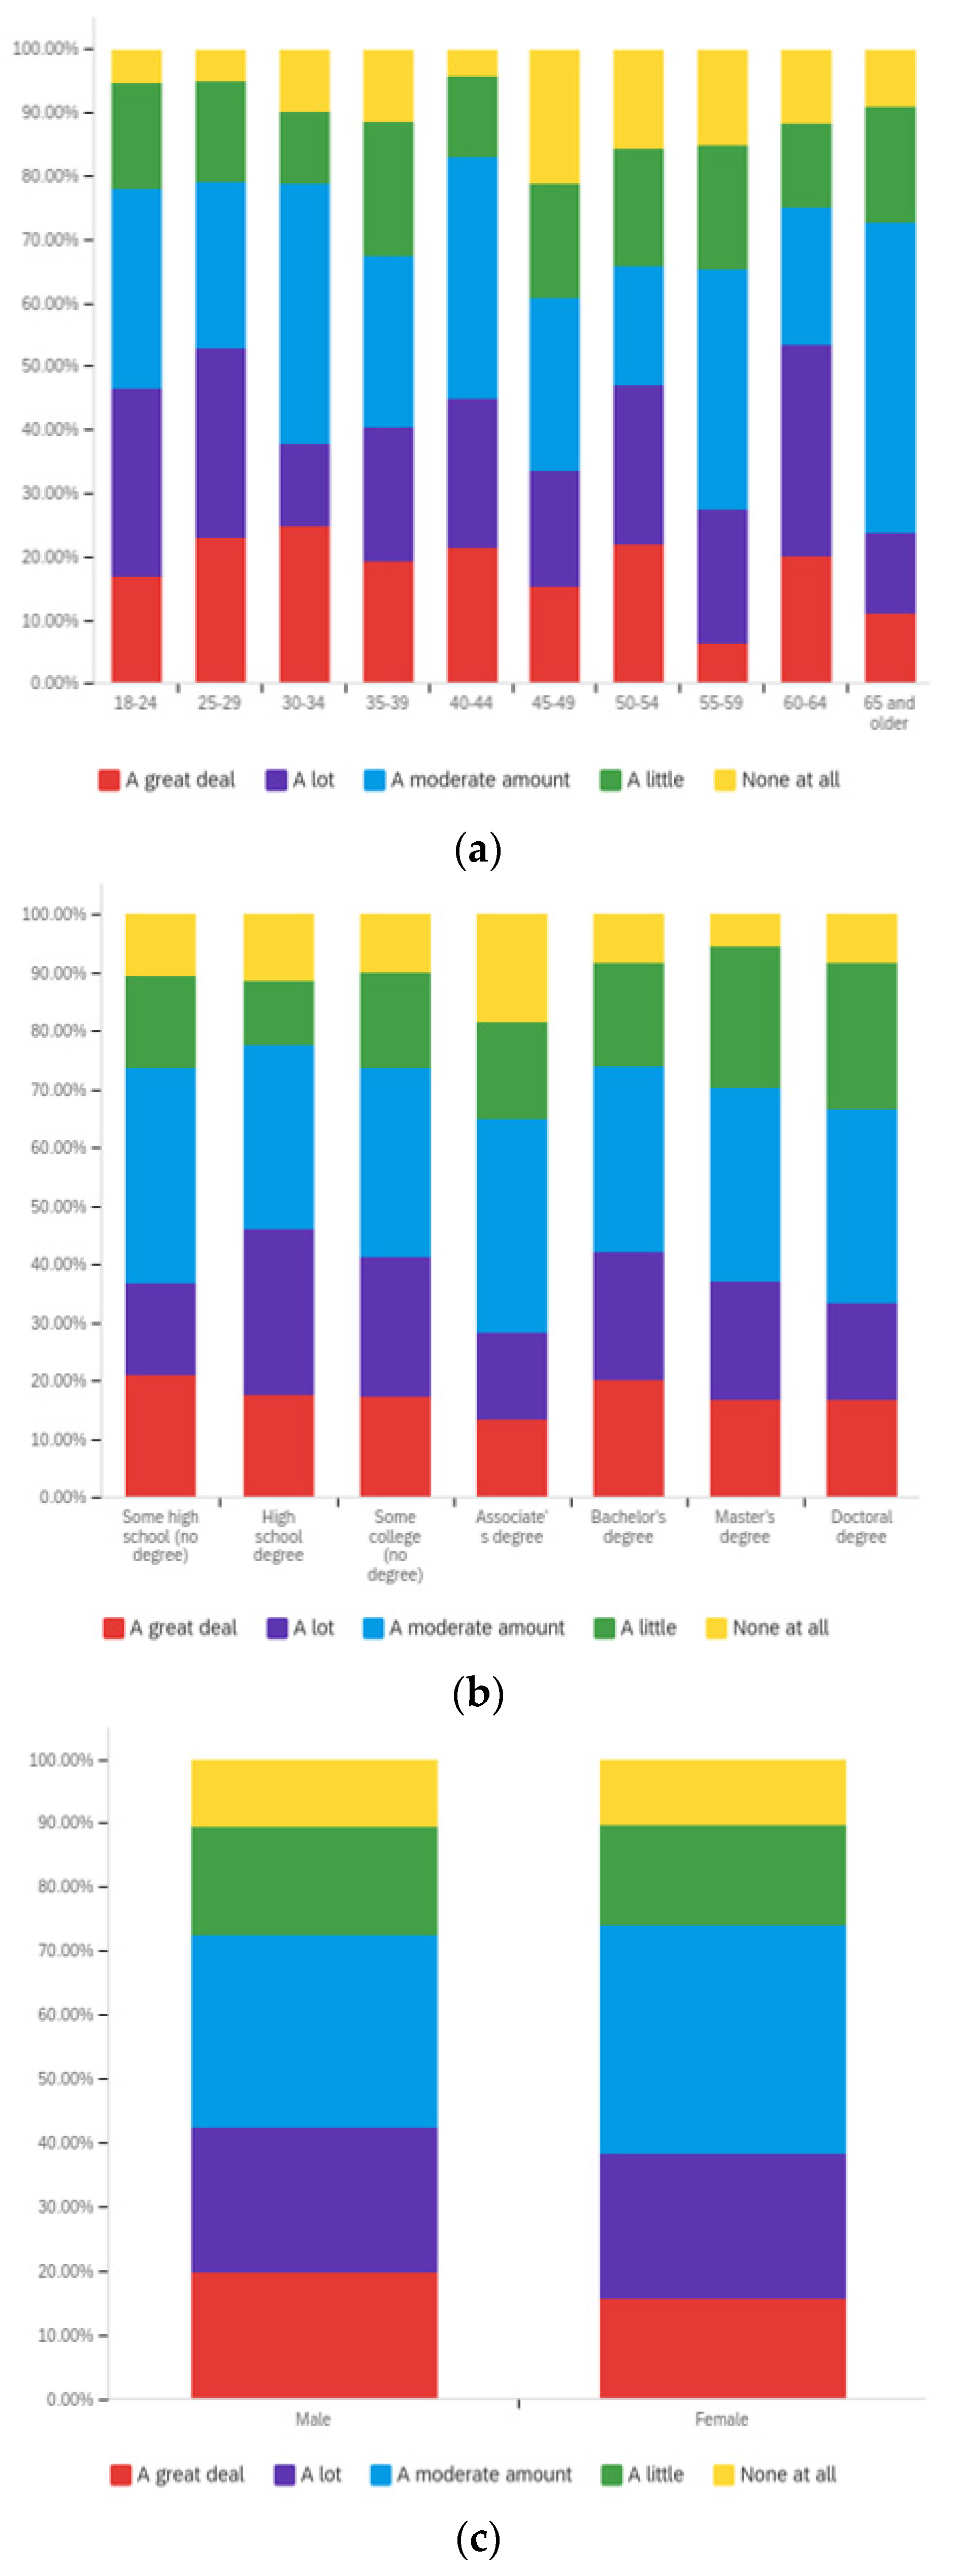
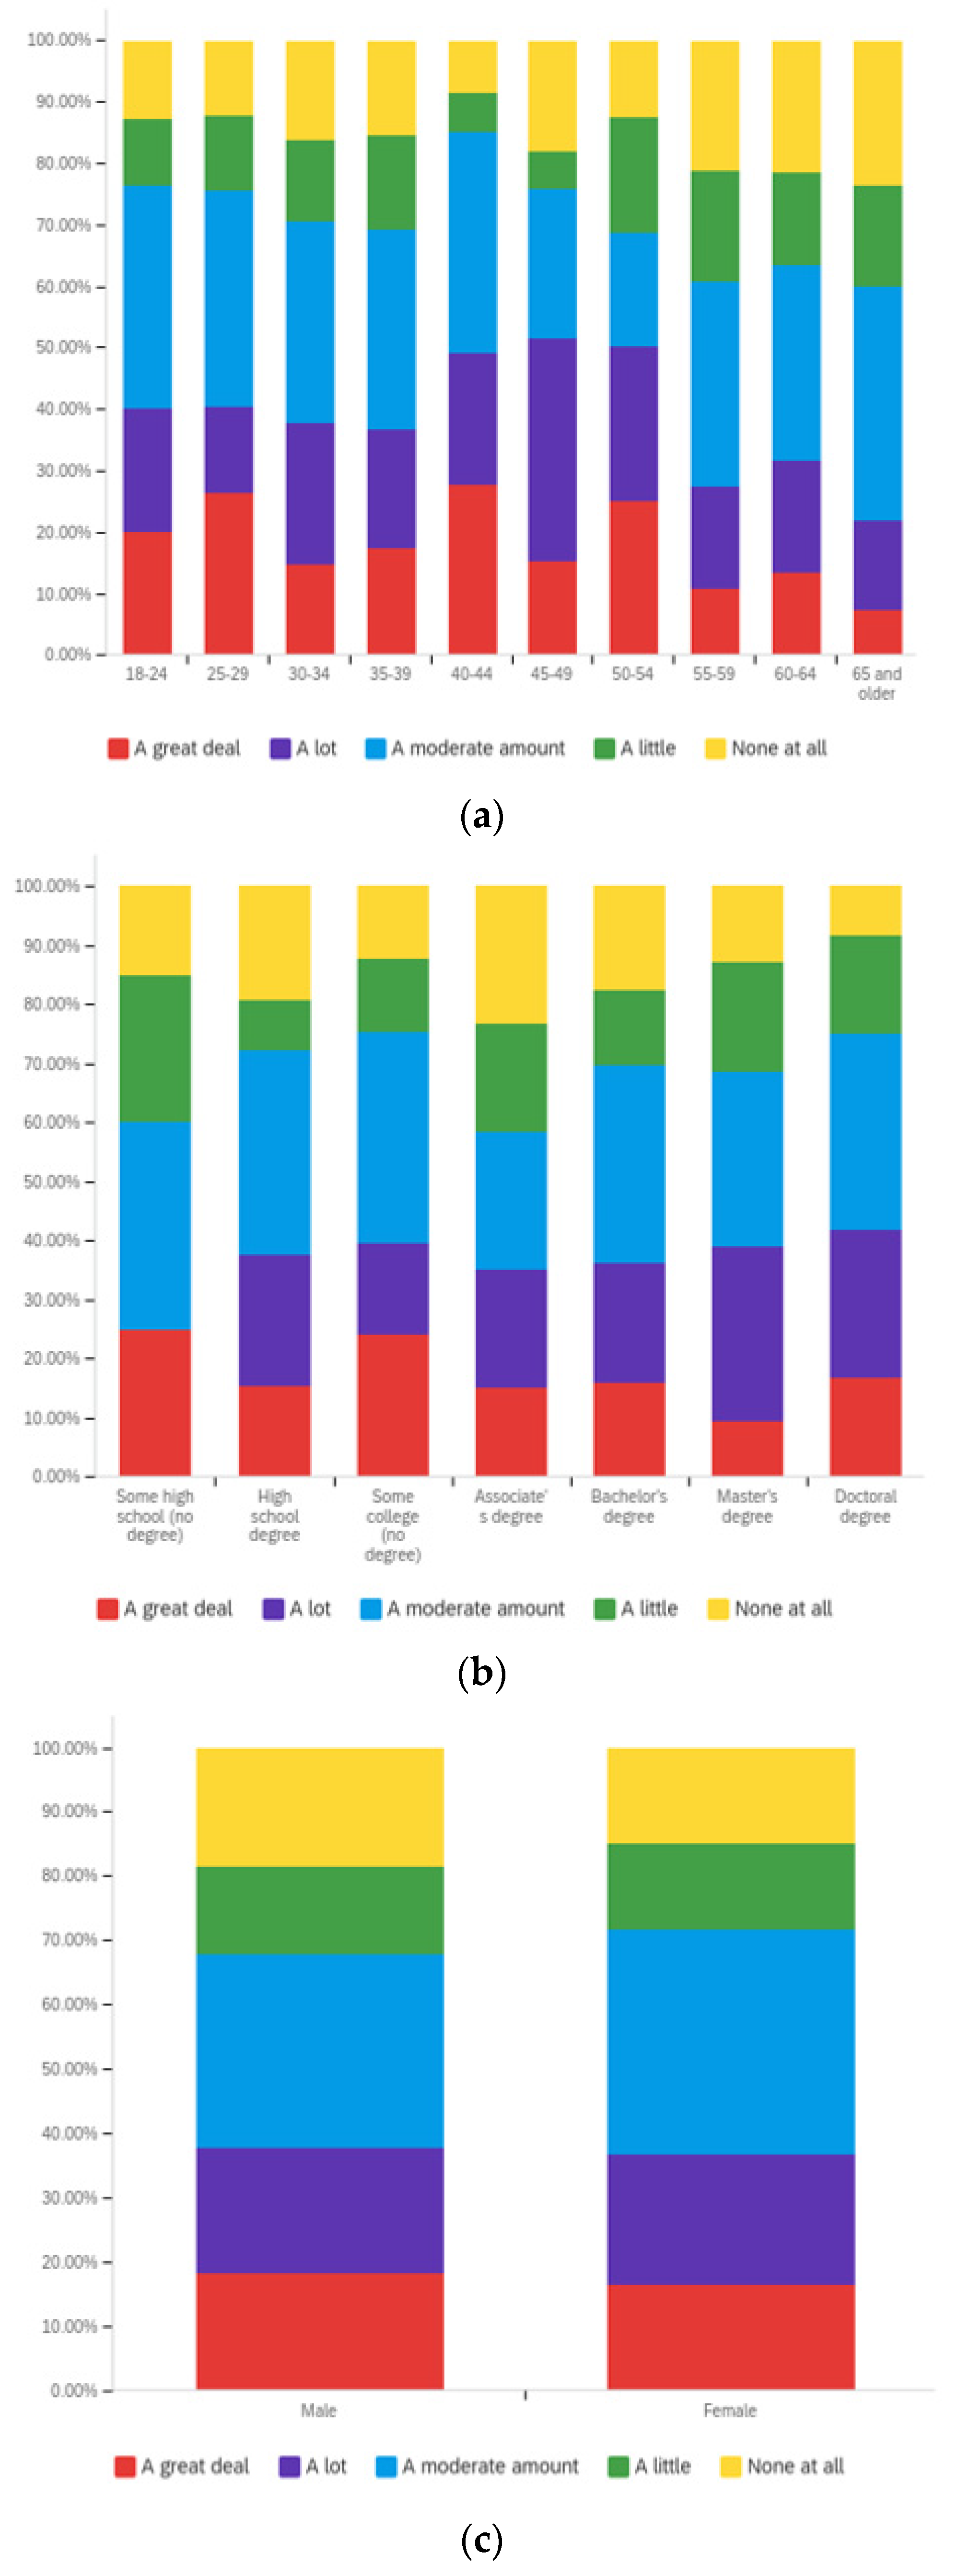
Table 1.
Respondents’ age distribution [63].
Table 1.
Respondents’ age distribution [63].
| 18–24 | 25–29 | 30–34 | 35–39 | 40–44 | 45–49 | 50–54 | 55–59 | 60–64 | 65 and Older |
|---|---|---|---|---|---|---|---|---|---|
| 10.57% | 10.93% | 11.29% | 10.04% | 8.96% | 6.63% | 6.09% | 12.54% | 12.19% | 10.75% |
| 59 | 61 | 63 | 56 | 50 | 37 | 34 | 70 | 68 | 60 |
Table 2.
Respondents’ education distribution [63].
Table 2.
Respondents’ education distribution [63].
| Some High School (No Degree) | High School Degree | Some College (No Degree) | Associate’s Degree | Bachelor’s Degree | Master’s Degree | Doctoral Degree |
|---|---|---|---|---|---|---|
| 4.68% | 25.72% | 23.20% | 11.51% | 22.12% | 10.25% | 2.52% |
| 26 | 143 | 129 | 64 | 123 | 57 | 14 |
Table 3.
Paradigms of survey respondents’ beliefs based on the level of self-usage, others’ usage, and ideal usage reported for each metric.
Table 3.
Paradigms of survey respondents’ beliefs based on the level of self-usage, others’ usage, and ideal usage reported for each metric.
| Self-Usage | Others’ Usage | Ideal Usage | Belief Paradigm |
|---|---|---|---|
| Low | Low | Low | Metric should not be used, and it is not |
| Low | High | Low | Metric should not be used, but others do |
| Low | Low | High | Metric should be used, but no one does |
| Low | High | High | Metric should be used, but I do not |
| High | Low | Low | Metric should not be used, but I do |
| High | High | Low | Metric should not be used, but we all do |
| High | Low | High | Metric should be used, but others do not |
| High | High | High | Metric should be used, and we all do |
Table 4.
Summary of trends and differences by age, education and gender for article title, publication date, publisher, author, sponsor and political alignments.
Table 4.
Summary of trends and differences by age, education and gender for article title, publication date, publisher, author, sponsor and political alignments.
| Age | Education | Gender | ||
|---|---|---|---|---|
| Title | Self | Declines from 18–24 to 35–39; resurgence at 40–44 | Negative correlation | Minimal variation |
| Others | Negative correlation 18–24 to 40–49 | Increasing importance from some high school to some college, declines after this point | Minimal variation | |
| Ideal | Increased weight from 18–24 to 30–34, decline afterwards | No clear pattern | Minimal difference | |
| Publisher | Self | Declines with age in younger age groups | Increases with education level at lower education levels | Males place more weight on publisher than females |
| Others | No obvious trend | Increases with education level at lower education levels | Males indicate that others place more weight on publisher than females | |
| Ideal | Declines with age in younger age groups | Increases with education level at combined “great deal” and “a lot” levels | Same at “great deal” and “a lot” levels; females place more weight at “moderate” level | |
| Publication Date | Self | Declines with age at younger age groups; increases with age in oldest groups | Increases with education | Females place more weight on publication date |
| Others | No clear overall pattern | Increases with education at lower education levels, then decreases at higher ones | Females place more weight on publication date | |
| Ideal | Declines with age across most age groups | Increases with education at lower education levels, then decreases at higher ones | Females place more weight on publication date | |
| Author | Self | No clear trend | Increased weight with education level | No major difference |
| Others | No clear trend | Increased weight with education level | No major difference | |
| Ideal | Conflicting trends by level | Rises with education level at lower levels and then falls with increased education level at higher levels | No major difference | |
| Article Sponsors | Self | No clear trend | Increased weight with education level | No major difference |
| Others | No clear trend | Increased weight with education level | No major difference | |
| Ideal | No clear trend | Increased weight with education level | No major difference | |
| Author’s Political Alignment | Self | Increased weight with age, with decline between 40-44 and 55-59 age groups | Increased weight with education level | Males give more weight to this than females |
| Others | Increases with age - two trends with reversal between them | Increased weight with education level | Males give more weight to this than females at “great deal” and “a lot” levels | |
| Ideal | Increases with age—two trends with reversal between them | Increased weight with education level | Males give more weight to this than females at “great deal” and “a lot” levels | |
| Publisher’s Political Alignment | Self | Two growth in focus with increased age trends present | Increased weight with education level | Males give more weight to this than females at “great deal” and “a lot” levels |
| Others | Growth with higher age in older respondents only | Increased weight with education level | Males give more weight to this than females at “great deal” and “a lot” levels | |
| Ideal | No clear trend | Increased weight with education level | Males give more weight to this than females at “great deal” level | |
| Article Sponsors’ Political Alignment | Self | No clear trend | Increased weight with education level | Males give more weight to this than females |
| Others | No clear trend | Increased weight with education level | Males give more weight to this than females | |
| Ideal | No clear trend | Increased weight with education level | Males give more weight to this than females at “great deal” and “a lot” levels |
Table 5.
Summary of trends and differences by age, education and gender for article quantity of opinion statements, virality and controversy and reading levels.
Table 5.
Summary of trends and differences by age, education and gender for article quantity of opinion statements, virality and controversy and reading levels.
| Age | Education | Gender | ||
|---|---|---|---|---|
| Quantity of Opinion Statements | Self | No clear trend | Small correlation between higher education level and weight | Higher female interest |
| Others | Slight decrease in interest with increased age | No notable trend | No notable trend | |
| Ideal | No clear trend | No notable trend | Slightly higher female interest | |
| Virality | Self | No clear trend | Negative correlation between focus and educational level | Notably higher female interest |
| Others | Slight decrease in focus with increased age | Two positive correlation trends with gap | Moderately higher female interest | |
| Ideal | No clear trend | Negative correlation between focus and educational level | Notably higher female interest | |
| Controversy Level | Self | No clear trend | No clear trend | Slightly higher female interest |
| Others | Range with negative correlation | Range with positive correlation | No notable difference | |
| Ideal | Two ranges with positive correlation | No clear trend | Higher female interest | |
| Reading Level | Self | No clear trend | Two ranges with positive correlation | No notable difference |
| Others | No clear trend | Range with negative correlation | No notable difference | |
| Ideal | No clear trend | Range with positive correlation | No notable difference |
Table 6.
Comparison of self-perception to perception of others, self-perception to ideal-perception and perception of others to ideal-perception for the impact of article title, publisher, author, publication date, sponsors and political alignments.
Table 6.
Comparison of self-perception to perception of others, self-perception to ideal-perception and perception of others to ideal-perception for the impact of article title, publisher, author, publication date, sponsors and political alignments.
| Age | Education | Gender | ||
|---|---|---|---|---|
| Title | Self-Others | Others give more weight to title | Others place more focus than they do, at most levels | 25% of both genders say others place more weight on than them |
| Self-Ideal | At many levels, more indicated self-belief than importance | No clear pattern | No notable difference | |
| Others-Ideal | Others less across ages | Others less at all levels except Ph.D. (same) | Others less for both genders, females have slightly higher comparative others importance at “great deal” level | |
| Publisher | Self-Others | Similar | Similar | Similar; less females reporting “great deal” |
| Self-Ideal | More focus placed on publisher than ideal in 7 of 10 age groups | No clear trend | Similar; males have greater focus at “a lot” level | |
| Others-Ideal | Others place more focus on publisher than ideal in 7 of 10 age groups | Others place more focus than ideal in 5 of 7 categories | Males perceive others having more focus than ideal; females perceive others having similar to ideal focus level | |
| Publication Date | Self-Others | No clear pattern | Mostly similar | Greater importance to others reported among both genders; females similarly place greater importance |
| Self-Ideal | More ideal focus than reported self-focus at most levels | No clear pattern | More ideal focus than self-focus for both genders at “great deal”, “a lot” and “moderate” levels | |
| Others-Ideal | More ideal focus than reported others focus at all but one level | More ideal focus than reported others focus at all but one level | More ideal focus than reported others focus at “great deal”, “a lot” and “moderate” levels | |
| Author | Self-Others | Seven of ten have higher self than others at combined “great deal” and “a lot” levels | All but Ph.D. level report higher for self than others | Similar for males; lower level of females reporting importance for others at combined “great deal” and “a lot” levels |
| Self-Ideal | Six of ten report higher self than ideal focus level | No clear trend | Lower ideal than self for both genders | |
| Others-Ideal | Six of ten report lower others than ideal focus | No clear trend | No clear trend for males; females report others less than ideal at “great deal” and “a lot” levels | |
| Article Sponsors | Self-Others | Younger age groups report less focus than others; older age groups report more | No clear trend | Males have notably more “great deal” respondents for self than others; females have marginally more. |
| Self-Ideal | Nine out of 10 report more focus than ideal | No clear trend | Males and females report more focus than ideal at “great deal” and “a lot” levels | |
| Others-Ideal | Seven of 10 age groups report others have more focus than ideal | All but one education level, respondents report others have more than ideal focus | Both males and females say others have less “great deal” interest than ideal and more “a lot” interest than ideal | |
| Author’s Political Alignment | Self-Others | Eight of 10 ages indicate greater others focus than self-focus | Five of 7 education levels report greater others focus than self-focus | Both males and females report greater others’ focus than self-focus |
| Self-Ideal | Nine of 10 ages report more self-focus than ideal focus. | Six of 7 report more self-focus than ideal focus | Males and females report more self-focus than ideal focus; more significant difference for males | |
| Others-Ideal | More others’ focus than ideal at all age levels | Six of 7 education levels report more others’ focus than ideal focus | Males and females report more others’ focus than ideal focus; more significant difference for males | |
| Publisher’s Political Alignment | Self-Others | Six of ten report higher self than others’ focus level | No clear trend | No clear trend; females see more focus for others than self-focus |
| Self-Ideal | More focus than ideal at all levels | Five of seven education levels have more self-focus than ideal | Both males and females report more self-focus than ideal | |
| Others-Ideal | More focus by others than ideal at all levels | Five of seven education levels have more others’ focus than ideal | Both males and females report more others’ focus than ideal | |
| Article Sponsors’ Political Alignment | Self-Others | Seven of 10 report more self than others’ focus | Similar - no clear trend | Similar - no clear trend |
| Self-Ideal | Seven of 10 report more self than ideal focus | All education levels report more self-focus than ideal | Males report more self-focus than ideal; females report close to the same level | |
| Others-Ideal | Seven of 10 report more others’ than ideal focus | All education levels report more others’ focus than ideal | Both males and females report more others’ focus than ideal; more pronounced difference for males |
Table 7.
Comparison of self-perception to perception of others, self-perception to ideal-perception and perception of others to ideal-perception for the impact of article quantity of opinion statements, virality and controversy and reading levels.
Table 7.
Comparison of self-perception to perception of others, self-perception to ideal-perception and perception of others to ideal-perception for the impact of article quantity of opinion statements, virality and controversy and reading levels.
| Age | Education | Gender | ||
|---|---|---|---|---|
| Quantity of Opinion Statements | Self-Others | Six of ten report lower self than others’ focus level | No notable trend | No notable trend |
| Self-Ideal | Seven of ten report higher self than ideal focus level | Five of seven report higher self than ideal focus level | Both genders have higher self-focus than ideal focus | |
| Others-Ideal | Eight of ten report higher other’s than ideal focus level | Six of seven report higher others’ than ideal focus level | Both genders have higher other’s focus than ideal; more pronounced difference for males. | |
| Virality | Self-Others | Notably uncorrelated; eight of 10 age groups have lower self-focus than others’ focus | Notable difference at some high school level; six of seven have higher others’ interest than self-focus | Notably higher others’ interest than self-interest for both genders; larger difference for males |
| Self-Ideal | Significant variations; Eight of ten groups have greater self-focus than ideal focus | All seven education levels have less ideal focus than self-focus | Both have higher self-interest than ideal interest; similar difference levels | |
| Others-Ideal | Nine of ten report higher other’s than ideal focus level | Six of seven educational levels report higher other’s than ideal focus level | Both genders have higher other’s focus than ideal focus | |
| Controversy Level | Self-Others | All 10 have higher others’ interest than self interest | Six of seven groups have higher others’ interest than self interest | Both genders have higher others’ interest than self-interest; more pronounced difference for males |
| Self-Ideal | No clear trend | No clear trend | Slightly more self-interest than ideal interest | |
| Others-Ideal | All 10 have higher others’ interest than ideal interest | Six of seven groups have higher others’ interest than ideal interest | Both genders have higher others’ interest than ideal interest; more pronounced difference for males | |
| Reading Level | Self-Others | Seven of ten report higher self than others’ focus level | No clear trend | Males similar; females have greater self than others’ interest |
| Self-Ideal | Nine of ten have more self-interest than ideal interest | No clear trend | Both genders have higher self-interest than ideal interest; larger difference for females | |
| Others-Ideal | No clear trend | No clear trend | Both genders have higher others’ interest than ideal interest |
Publisher’s Note: MDPI stays neutral with regard to jurisdictional claims in published maps and institutional affiliations. |
© 2022 by the authors. Licensee MDPI, Basel, Switzerland. This article is an open access article distributed under the terms and conditions of the Creative Commons Attribution (CC BY) license (https://creativecommons.org/licenses/by/4.0/).
Share and Cite
MDPI and ACS Style
Straub, J.; Spradling, M.; Fedor, B. Assessment of Factors Impacting the Perception of Online Content Trustworthiness by Age, Education and Gender. Societies 2022, 12, 61. https://0-doi-org.brum.beds.ac.uk/10.3390/soc12020061
AMA Style
Straub J, Spradling M, Fedor B. Assessment of Factors Impacting the Perception of Online Content Trustworthiness by Age, Education and Gender. Societies. 2022; 12(2):61. https://0-doi-org.brum.beds.ac.uk/10.3390/soc12020061
Chicago/Turabian StyleStraub, Jeremy, Matthew Spradling, and Bob Fedor. 2022. "Assessment of Factors Impacting the Perception of Online Content Trustworthiness by Age, Education and Gender" Societies 12, no. 2: 61. https://0-doi-org.brum.beds.ac.uk/10.3390/soc12020061
Note that from the first issue of 2016, this journal uses article numbers instead of page numbers. See further details here.