Sustainability-Based Optimization of the Rotary Turning of the Hardened Steel


1
Institute of Research and Development, Duy Tan University, 03 Quang Trung, Da Nang 550000, Vietnam
2
Department of Manufacturing Technology, Le Quy Don Technical University, 236 Hoang Quoc Viet, Ha Noi 100000, Vietnam
3
Faculty of Mechanical Engineering, Le Quy Don Technical University, 236 Hoang Quoc Viet, Ha Noi 100000, Vietnam
4
Department of Mechanical Engineering, Imperial College London, Exhibition Road, South Kensington, London SW7 2AZ, UK
*
Author to whom correspondence should be addressed.
Metals 2020, 10(7), 939; https://0-doi-org.brum.beds.ac.uk/10.3390/met10070939
Submission received: 24 June 2020
/
Revised: 8 July 2020
/
Accepted: 10 July 2020
/
Published: 12 July 2020
(This article belongs to the Special Issue Optimization and Analysis of Metal Cutting Processes)
Abstract
:The rotary turning is an effective manufacturing method to machine hardened metals due to longer tool life, higher production rate, and acceptable quality. However, sustainability-based optimization of the rotary turning has not been thoroughly considered because of the huge efforts. This study presents an optimization to enhance the energy efficiency (EFR), turning cost (CT), average roughness (Ra), and the operational safety (POS) for the rotary turning of the hardened steel. Four key process parameters considered are the inclined angle (α), depth of cut (ap), feed rate (f), and cutting speed (vc). The improved Kriging (IK) models were used to construct the relations between the parameters and performances. The optimum varied factors were obtained utilizing the neighborhood cultivation genetic algorithm (NCGA). The findings revealed that the performance models are primarily affected by the feed rate, depth of cut, speed, and inclined angle, respectively. The optimal values of the α, ap, f, and vc are 26°, 0.44 mm, 0.37 mm/rev, and 200 mm/min, respectively. The improvements in energy efficiency, average roughness, and cost are 8.91%, 20.00%, and 14.75%, as compared to the initial values. Moreover, the NCGA may perform an efficient operation to obtain the optimal outcomes, as compared to conventional algorithms.
1. Introduction
The rotary turning is an alternative solution to machine hardened metals, in which the round insert rotates continuously about its axis in the cutting period. The rotary turning can be divided into two primary methods, including the actively driven (ADRT) and self-propelled rotary tool (SPRT) cutting operations. In the ADRT machining, the rotational speed of the insert is controlled using an external motor, while the rotary motion is produced by the interaction with the workpiece in the SPRT turning. The rotary motion of the insert provides the rest period, which results in minimizing the cutting temperatures, longer tool life, and higher production rate [1]. Moreover, the fresh insert in the turning time has a significant contribution to increased surface quality. The rotary turning operation possesses various advantages, including cost-effectiveness, less machining time, and ensuring machined quality, as compared to the traditional approaches, such as grinding and polishing operations.
The parameter-based optimizations of rotary turning operations have been performed by former investigators. Kishawy and Wilcox analyzed the impacts of the process parameters (cutting speed and depth of cut) and different materials on the wear and the morphology of the turned chip [2]. Several materials were considered like carbide, coated carbide, and ceramics. The authors emphasized that longer tool life was obtained during machining with rotary tools and only the flank wear was observed. The lower cutting temperature at the chip-tool interface was obtained and the cutting speed range could be increased. The temperature distribution of the SPRT turning of the hardened 52100 steel was analyzed using a simulation model and confirmatory experiments [3]. A set of experiments under different machining conditions, including the cutting speed, feed rate, and depth of cut was performed in both of the rotary and fixed turnings. The small errors between simulation and experimental results indicated that the designed model can be used to predict the turning temperature in the rotary turning. The SPRT turning could provide a lower temperature (around 50 °C), as compared to the conventional tool.
Kishawy et al. analyzed the performance of the SPRT and machined quality of the rotary turning of the aerospace materials under the variety of machining parameters [4]. The evaluation indicators were the tool wear and roughness as well as topography of the turned surface. The findings revealed that the flank wear was evenly distributed in the circular insert and lower cutting force was obtained. The predictive models of the thrust force, radial force, and main cutting force were developed in terms of the cutting speed, depth, feed, and inclined angle [5]. A neural network using the back-propagation and genetic algorithm algorithms was employed to enhance the model accuracy. The efficiency of the model was tested with the aid of different experiments. The author presented that the accuracy of the designed model was fairly satisfactory. The empirical model of the turning force of the rotary turning was developed using the Oxley algorithm [6]. A set of cutting tests was used to verify the proposed model. The impacts of the varied factors on the machining friction coefficient along the tool–chip interface and tool rake face were thoroughly explored. The small errors between the predicted and experimental values indicated that the accuracy of the model was acceptable.
An overview of the developments, the principles, and the structural design of the SPRT was presented by Ezugwu [7]. Moreover, the processing parameters affecting the tool life, failure modes, and wear mechanisms were recognized. The author stated that that the rotary turning could bring dominated advantages, such as longer tool life, lower machining forces, and higher material removal rate for machining of aero-engine alloys. The analytical model of the flank wear was developed based on the interactive behavior of the tool and the workpiece and the empirical function [8]. The experimental data of the turning trails on the hardened AISI 4340 steel were employed to construct the model. The coefficients were selected using the genetic algorithm. The outcomes revealed that the designed models could be effectively employed to forecast the tool wear.
The response surface method (RSM) was used to develop the predictive models of the roughness and material removal rate for the SPRT turning of the hardened steel [9]. Analysis of variance (ANOVA) was employed to check the adequacy of the model. Non-dominated sorting genetic algorithm-II (NSGA-II) was applied to derive the set of Pareto-optimal solutions and select the optimal outcomes. The findings revealed that the roughness was decreased to 1.49 µm and the material removal rate (MRR) did not improve at the optimal solution. Similarly, the empirical models of the cutting force and roughness in terms of the cutting velocity, tool rotary speed, and feed rate in the ultrasonic vibration assisted-rotary turning (UART) of the aluminum alloy were proposed [10]. ANOVA results were used to check the significances of the developed models and parameters. The desirability function approach was utilized to find optimal parameters. For the rotary turning, the optimal values of the velocity, tool rotary speed, and feed rate are 5.94 m/min, 214.9 RPM, and 0.08 m/min. For the UART, the optimal values of the velocity, tool rotary speed, and feed rate are 9.71 m/min, 98.63 RPM, and 0.08 m/min. Thee vibration significantly contributed to a reduction of turning forces and roughness.
A simulation model was developed to predict tool wear and temperature distribution on tool faces in conventional, rotary, and UART methods [11]. The impacts of the vibratory-rotary motion on the tool wear, heat generation, surface roughness, and cutting force were explored. The experiments were conducted to validate the simulation results. The authors stated that the roughness and turning force were decreased by 50%, as compared to the conventional method. The heat concentration in the contact zone was suppressed with the aid of the rotational motion. The UART operation had a significant contribution to a reduction in the tool wear. The impacts of the oil mist on the turning temperature and tool wear in the ADRT turning of the stainless steel at various cutting speeds were explored by Shasahara et al. [12]. The findings indicated that the oil mist helped to decrease the cutting temperature and flank wear. The cutting temperature and tool wear of the ADRT turning were lower than that of the fixed tool. The range of the cutting speed could be increased in the rotary turning.
A novel method was developed to predict the machining position and feed direction-dependent tool point frequency response functions (FRFs) based on the modal theory, matrix transformation, the backpropagation neural network, and particle swarm optimization algorithm. The feasibility of the proposed approach was checked by case studies on a vertical machining center. The authors stated that the developed approach can contribute to select the optimal process planning based on actual milling conditions at the design stage [13]. Additionally, a reacceptance coupling-based approach was developed to describe the dynamic properties of the machine–tool-workpiece system [14]. The experimental validation was used to check the fidelity of the proposed procedure. The outcomes revealed that the knowledge could be employed to select the technological parameter, such as the spindle speed for the computerized numerical control lathe. The author stated that the proposed method could be applied in both old and new machine tools to avoid expensive hardware implementations. Lin et al. developed the predictive models of the surface roughness and machining vibration in terms of the cutting parameters using the multiple regression analysis (MRA) and artificial neural network (ANN) methods [15]. The authors concluded that the ANN model could provide higher prediction accuracy, as compared to the MRA one. The developed correlations could be applied in an online roughness monitoring system for the surface milling test. The proposed models considering the machining stability could be used to enhance the machining accuracy in milling processes.
As a result, the cutting speed, depth, feed, inclined angle, and lubrication characteristics are considered as the optimized parameters. The machining performances are turning forces, roughness, tool wear, cutting temperature, and the formation of the chip were analyzed. Different optimization approaches, such as RSM, neural network, and simulation method were employed to propose the performance models and select the optimal factors. However, the selection of appropriate parameters to enhance energy efficiency and reduce the roughness, as well as costs, has not been presented in the aforementioned works. To achieve sustainable production, the optimal varied factors have to be selected to satisfy the environmental, economic, and social aspects.
To overcome the analyzed gaps, a parameter-based optimization of the rotary turning using SPRT has been investigated and presented to improve the economic, social, and environmental performances. The energy efficiency (EFR) is an important indicator of the environmental impact. The average roughness (Ra) and turning cost (CT) are the primary indicators of social and economic metrics. In this work, the self-propelled rotary tool has been designed and fabricated. The improved Kriging models are applied to render nonlinear relationships between the process parameters and turning responses [16,17]. The neighborhood cultivation genetic algorithm (NCGA) is employed to select the optimal values of the inputs and objectives [18].
2. Materials and Methods
2.1. Objective Functions
In this work, four turning responses, including energy efficiency, average roughness, turning cost, and the index of the personal health and operational safety are optimized simultaneously.
The energy efficiency of the rotary turning (EFR) is defined as the ratio of the turning energy consumed (TEC) to the machined energy consumed (MEC) during turning. The value of the EFR is calculated using Equation (1):
where: ATP—the active turning power; MPC—the machine power consumed; tc—the turning time.
The average roughness (Ra) is calculated as:
where: Rai—the value of average roughness at the ith position; n—the number of measured points.
The turning cost model under dry condition (CT) is expressed as follow:
where: CTM—the turning cost; CE—the energy cost; CCH—the tool changing cost; CT—the tool costs.
The total rotary turning time is calculated as:
where: to—the start-up time; tst—the set-up time; tair—the air-turning; tch—the tool change time.
The turning cost (CTM), the energy cost (CE), the tool changing cost (CCH), and the tool cost (CT) are calculated using Equations (5)–(9):
where: x—the total cost for labor, machine, and management (VND/s); xe—the energy cost (VND/kWh); yc—the tooling cost (VND/piece); MRR—the material removal rate (mm3/min); k—the specific energy requirement in machining operations (kJ/cm3); Po—the consumed power in the start-up time; Pst—the consumed power in the set-up time; Pair—the consumed power in the air-turning; Pch—the consumed power in the tool change time; T—the tool life; c—the coefficient related to the turning conditions; α and β—the positive constant parameters depending on tool material and workpieces.
The index of the personal health and operational safety (POS) can be divided into five primary components, which are expressed as follows:
- The operational safety index (POStc) is used to exhibit the toxic chemicals exposure during cutting fluid preparation or cutting process itself. The value of the POStc can be 1, 2, or 3 depending on its harmful impacts due to the type and concentration.
- The operational safety index (POShts) is used to exhibit the high-temperature surface exposure during the cutting processes. The value of the POShts is expressed as:where To denotes the cutting temperature.
- The operational safety index (POShss) is used to exhibit the high-speed surface exposure during the cutting processes. The value of the POShss is expressed as:where nmax presents the maximum spindle speed.
- The personal health index (POSwes) is used to exhibit the working environment noise level during the cutting processes. The value of the POSwes is expressed as:where NI presents the measured noise level.
- The personal health index (POSwea) is used to exhibit the working environment atmospheric conditions during the cutting processes. The value of the POSwea is expressed as:where WBGT presents the wet-bulb globe temperature.
- The personal health index (POSwei) is used to exhibit the working environment illumination level during the cutting processes. The value of the POSwei is expressed as:where IL presents the measured illumination level.
Therefore, the total index of personal health and operational safety is computed as:
2.2. Varied Parameters of the Rotary Turning
For the rotary turning, the inputs considered are the process parameters (depth of cut, inclined angle, speed, and feed rate), the insert characteristics (geometry, dimensions, and materials), lubrication properties (type and lubrication method), and the workpiece materials.
In the current work, the characteristics of the turning insert and machining specimen are considered as constants. All experiments are performed under the dry condition; hence, the influences of the lubrication are neglected. Therefore, the inclined angle, cutting speed, depth of cut, feed rate, and nose radius are listed as the primary variables that intensively influence the machining performances of the rotary turning.
Four key factors having the ranges, including the inclined angle, cutting speed, depth of cut, and feed rate are exhibited in Table 1. The parameter levels are identified based on the recommendations of the insert manufacturer, the characteristics of the fabricated rotary tool, and material properties. These values are validated using the mechanical handbooks and aforementioned publications.
2.3. Optimization Framework
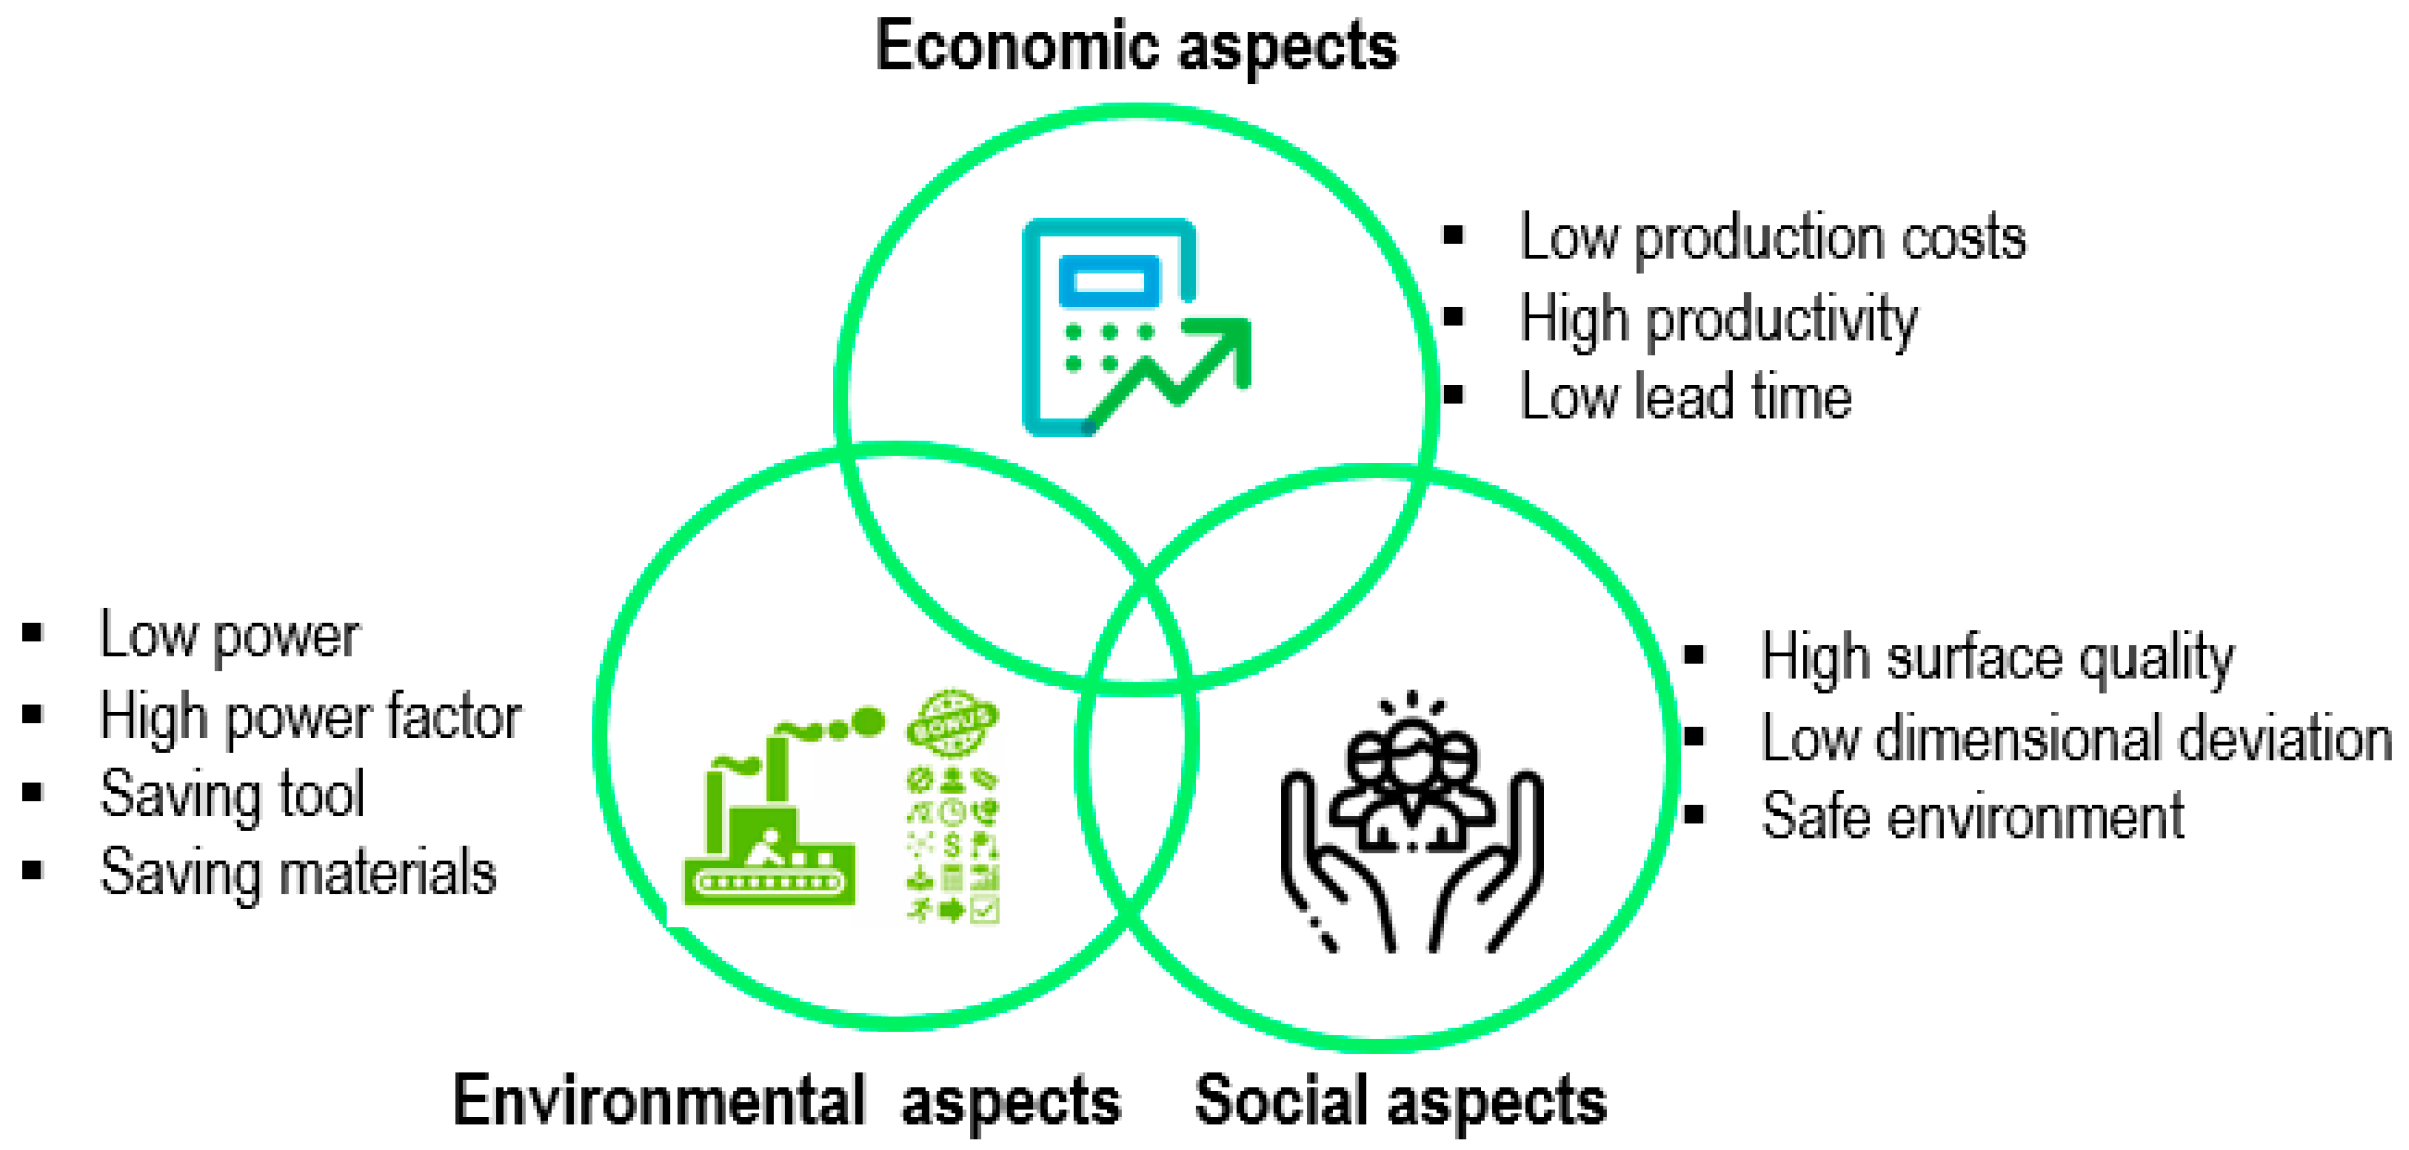
Sustainable production has become the top priority for industrial manufacturers due to an increase in energy costs and environmental legislation. Three primary aspects of sustainable production in terms of the environment, economy, and society are depicted in Figure 1. The environmental aspects of the turning process are lower power consumed (maximizing energy efficiency or minimizing carbon emissions), higher power factor, reduced tool as well as workpiece consumption, and elimination of the hazardous materials. The economic aspects are achieved through the reduction of production costs, higher productivity, and reduced lead time. The social aspects include higher surface quality, lower-dimensional deviation, and operational safety. Different cooling–lubrication techniques [19,20] were reported to exhibit superior performance and cleaner machining system with enhanced productivity, product quality and temperature. However, that was not enough to promote complete sustainability which inspired the optimization of the machining system [21].
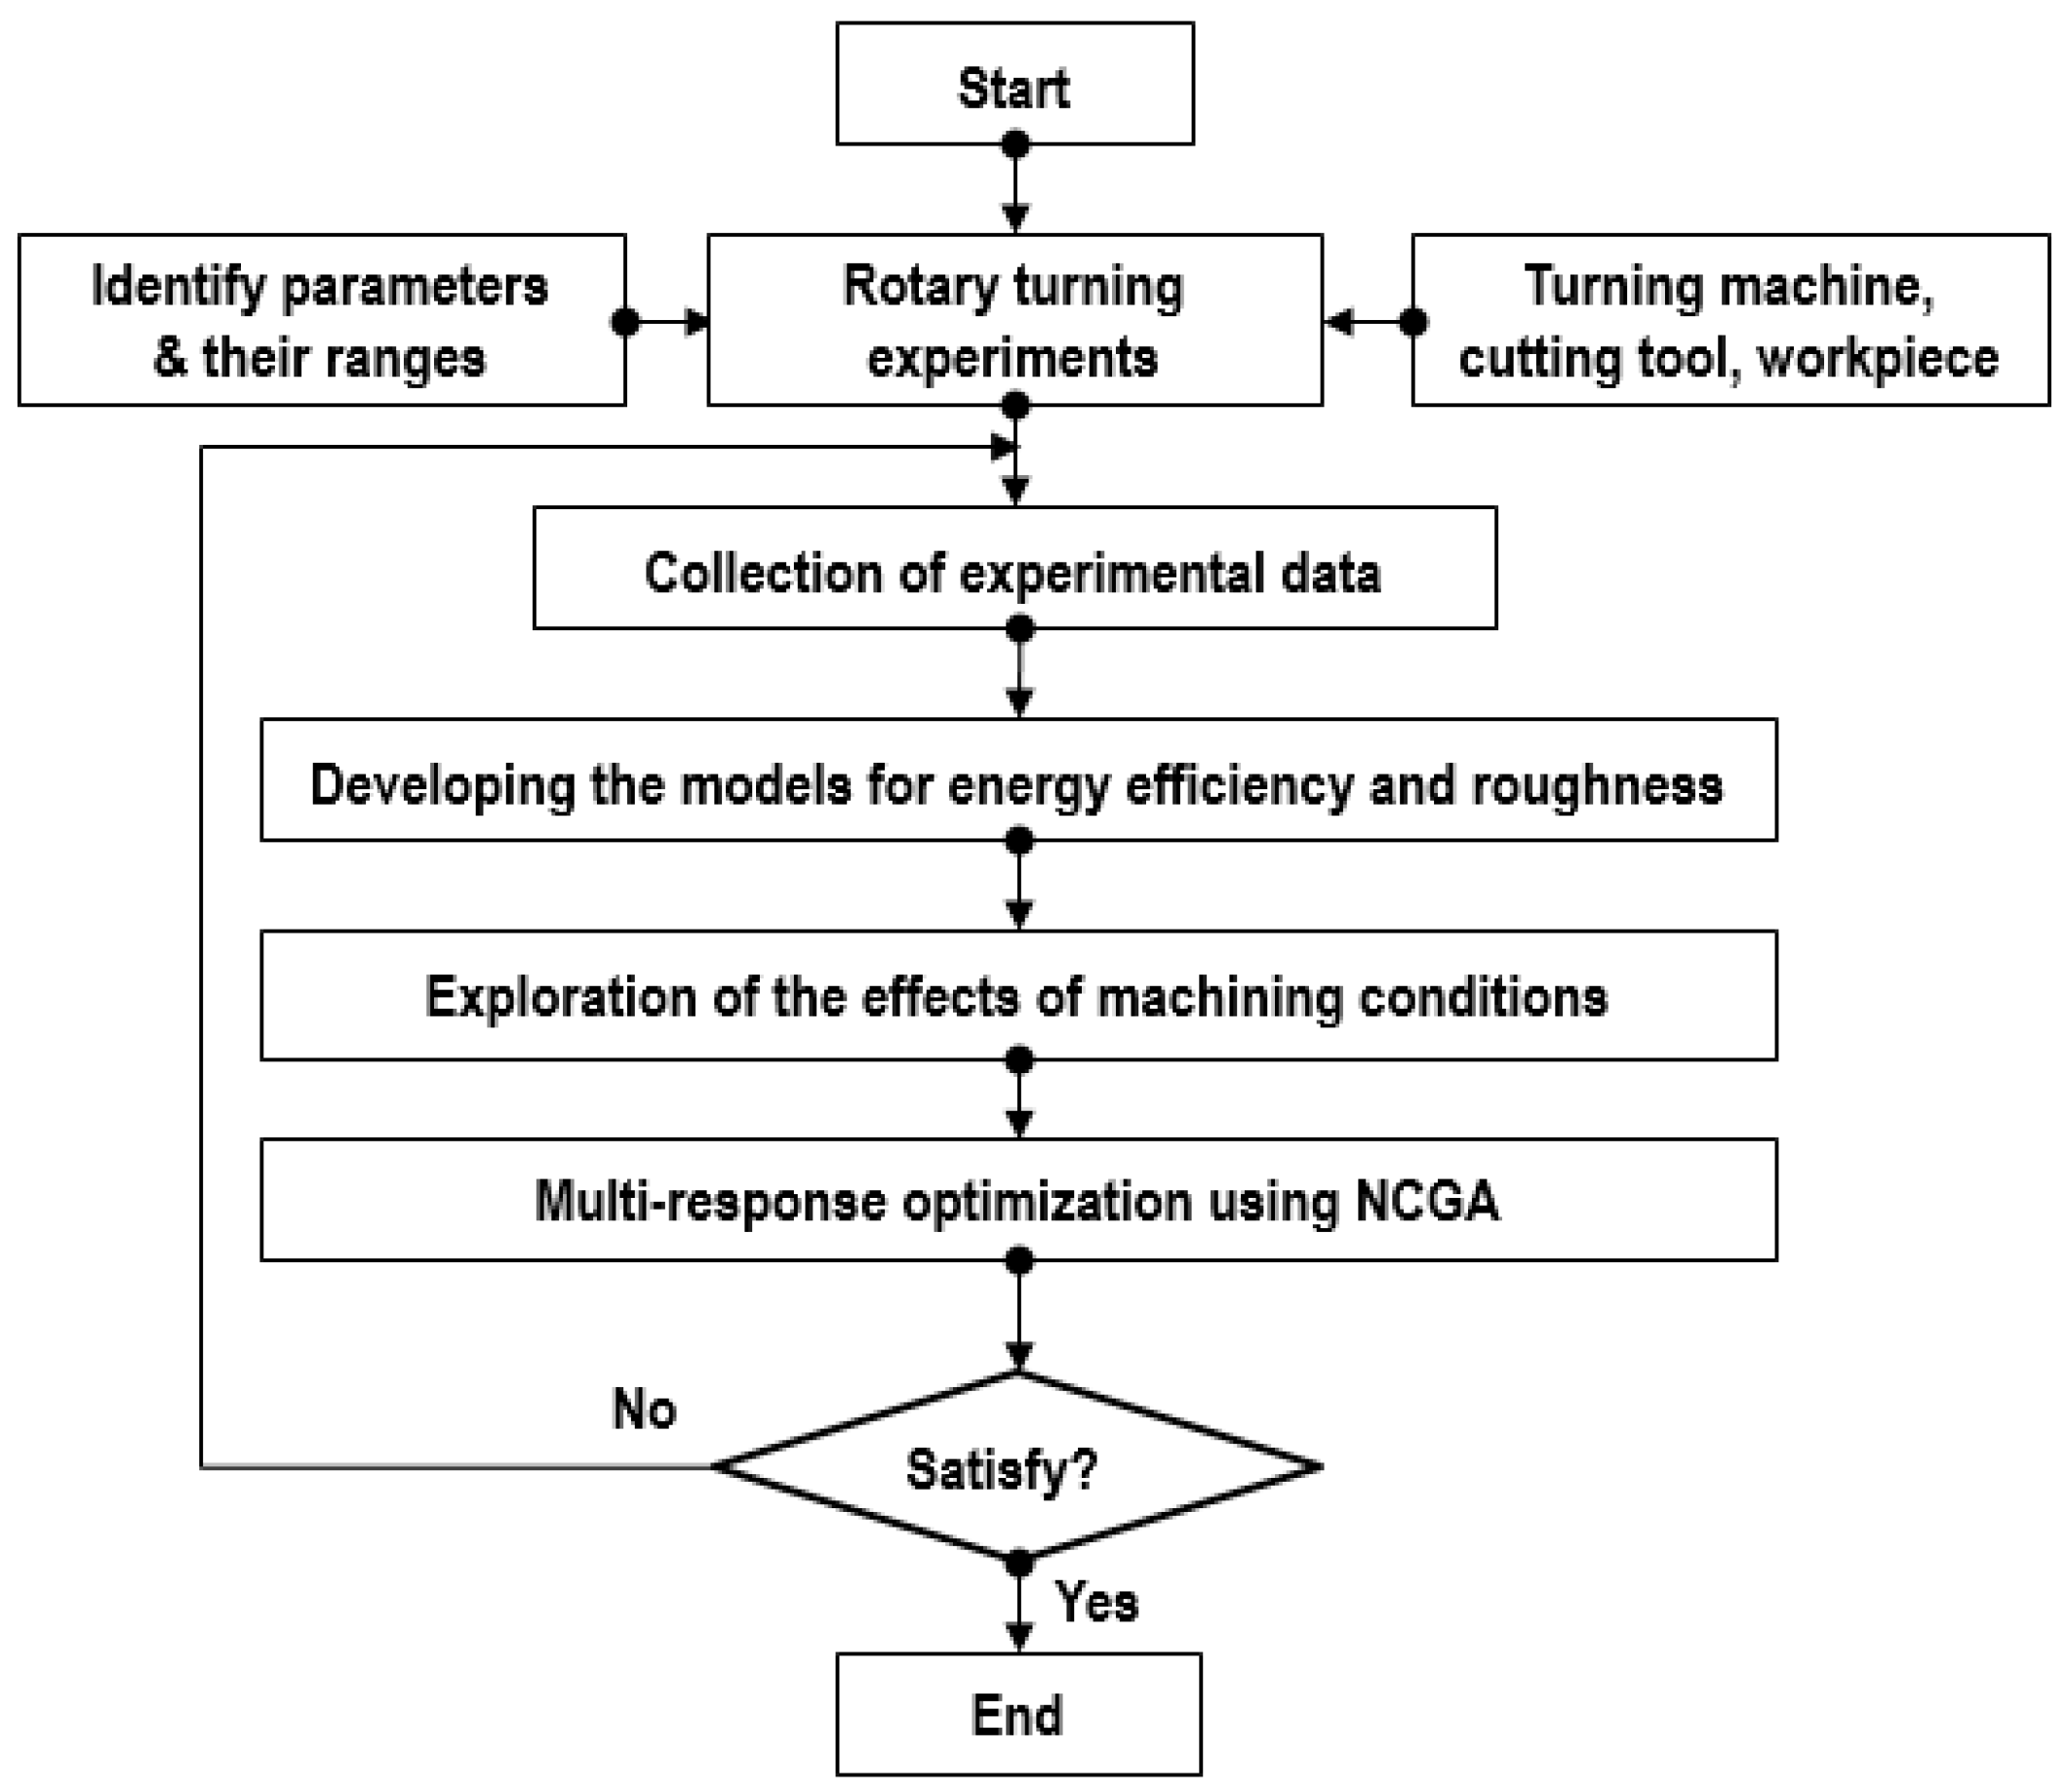
The research approach depicted in Figure 2 includes the following steps.
Step 2: The predictive models of the EFR and Ra are then established in terms of the inputs using the improved Kriging models. The Kriging model is an interpolation-based correlation using the Gaussian function, which is expressed as a function of the global model u and local deviation Z(x) [25]:
The distance between the xi and xj is calculated as:
where θk is the correlative factor of the kth element.
The correlation between the Z(xi) and Z(xj) is calculated as:
The Kriging predictor at a specific value of x is calculated by:
where f = [f(x(1)), f(x(2)), …, f(x(N))]T. R is the correlation matrix. is the estimated value of μ. r′ is the vector of the ith element.
The correlation factor is estimated as:
The values of the and at the specific θk are defined as:
In order to improve the predictive accuracy, the additional points distributed in the interesting region (e.g., Pareto set) are used to learn and rebuild the Kriging models. The additional data for generating the Kriging models are selected by the possibility of existing in this region. The convergence tolerance ε without considering the magnitudes of outputs is determined using the following constraint:
where MAEr is the relatively max absolute error. and present the experimental and predicted values.
The adequacy of the developed models can be evaluated using the normalized root mean squared error (NRSME). The value of NRSME is calculated as:
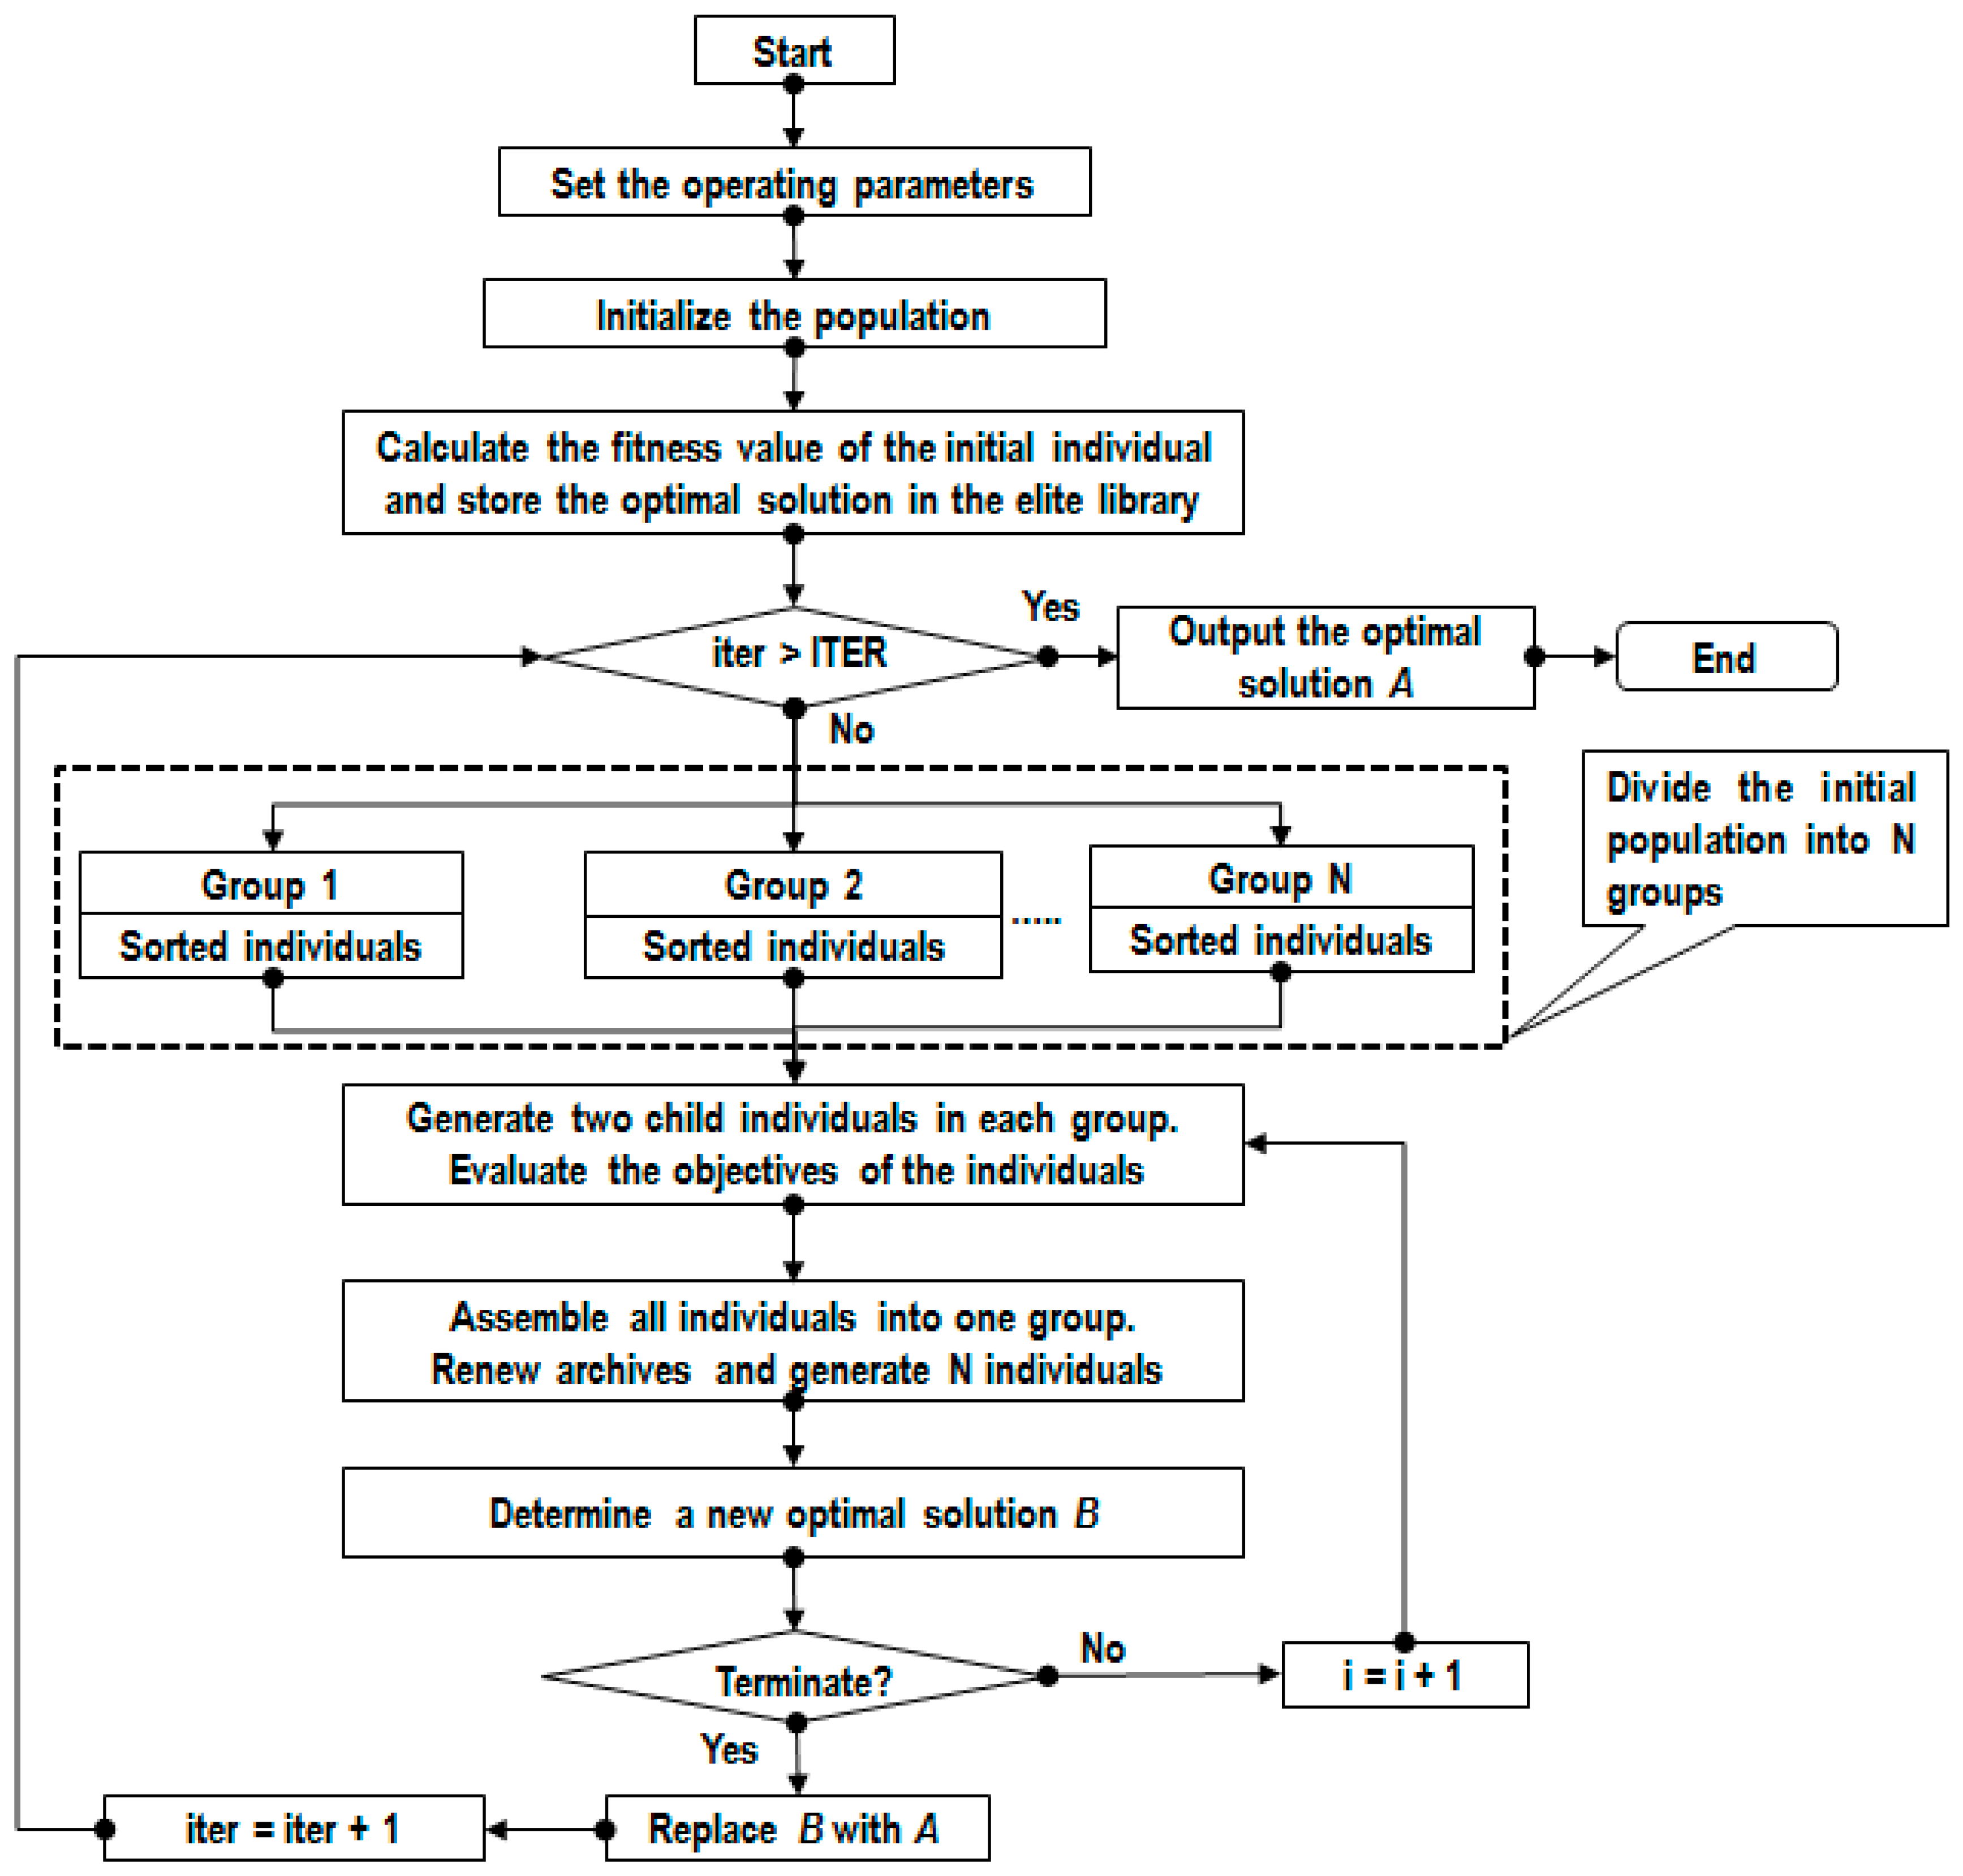
Step 3: An evolutionary algorithm labeled neighborhood cultivation genetic algorithm (NCGA) is employed to identify the optimal values of process parameters and responses. The NCGA is an efficient technique to select the optimal solution in the highly non-linear design space. The primary principle of the NCGA is to add a neighborhood crossover operation into the working mechanism. The together individuals are sorted into groups generated by the population. The genetic operations are performed in a group that is consisted of the two individuals. The operating algorithm of the NCGA is listed as bellows (Figure 3):
- -
- Initialization: Generating an initial population (P0) having N size. Set t = 0. Calculate the fitness value of initial individuals in P0. Copy P0 into A0.
- -
- Generation of a new population (Pt). Set t = t + 1.
- -
- Sorting: Individuals of Pt are sorted based on the values of the targeted response.
- -
- Grouping: A new population (Pt) is divided into groups that consist of two individuals, which are selected from the sorted individuals.
- -
- Crossover and Mutation: The child individuals are generated from two-parent individuals. The parent individuals are then eliminated.
- -
- Evaluation: All of the objectives of individuals are derived.
- -
- Assembling: All individuals are assembled into one group and this becomes a new population (Pt).
- -
- Renewing archives: The Pt is assembled with the At−1 and N individuals are selected from 2N individuals.
- -
- Termination: If the terminal condition is satisfied, the simulation is terminated. If it is not satisfied, the simulation returns to step 2.
2.4. Experimental Details
The steel bars labeled 40XC (diameter 40 mm and length 260 mm) are used as specimens in this work. The hardness of the hardened workpiece is around 45 HRC. The material is chosen due to extensive applications in the automotive, molding, and marine industries. The workpiece is divided into different machining segments. Each workpiece is machined in a length of 26 mm. Its chemical composition is shown in Table 2.
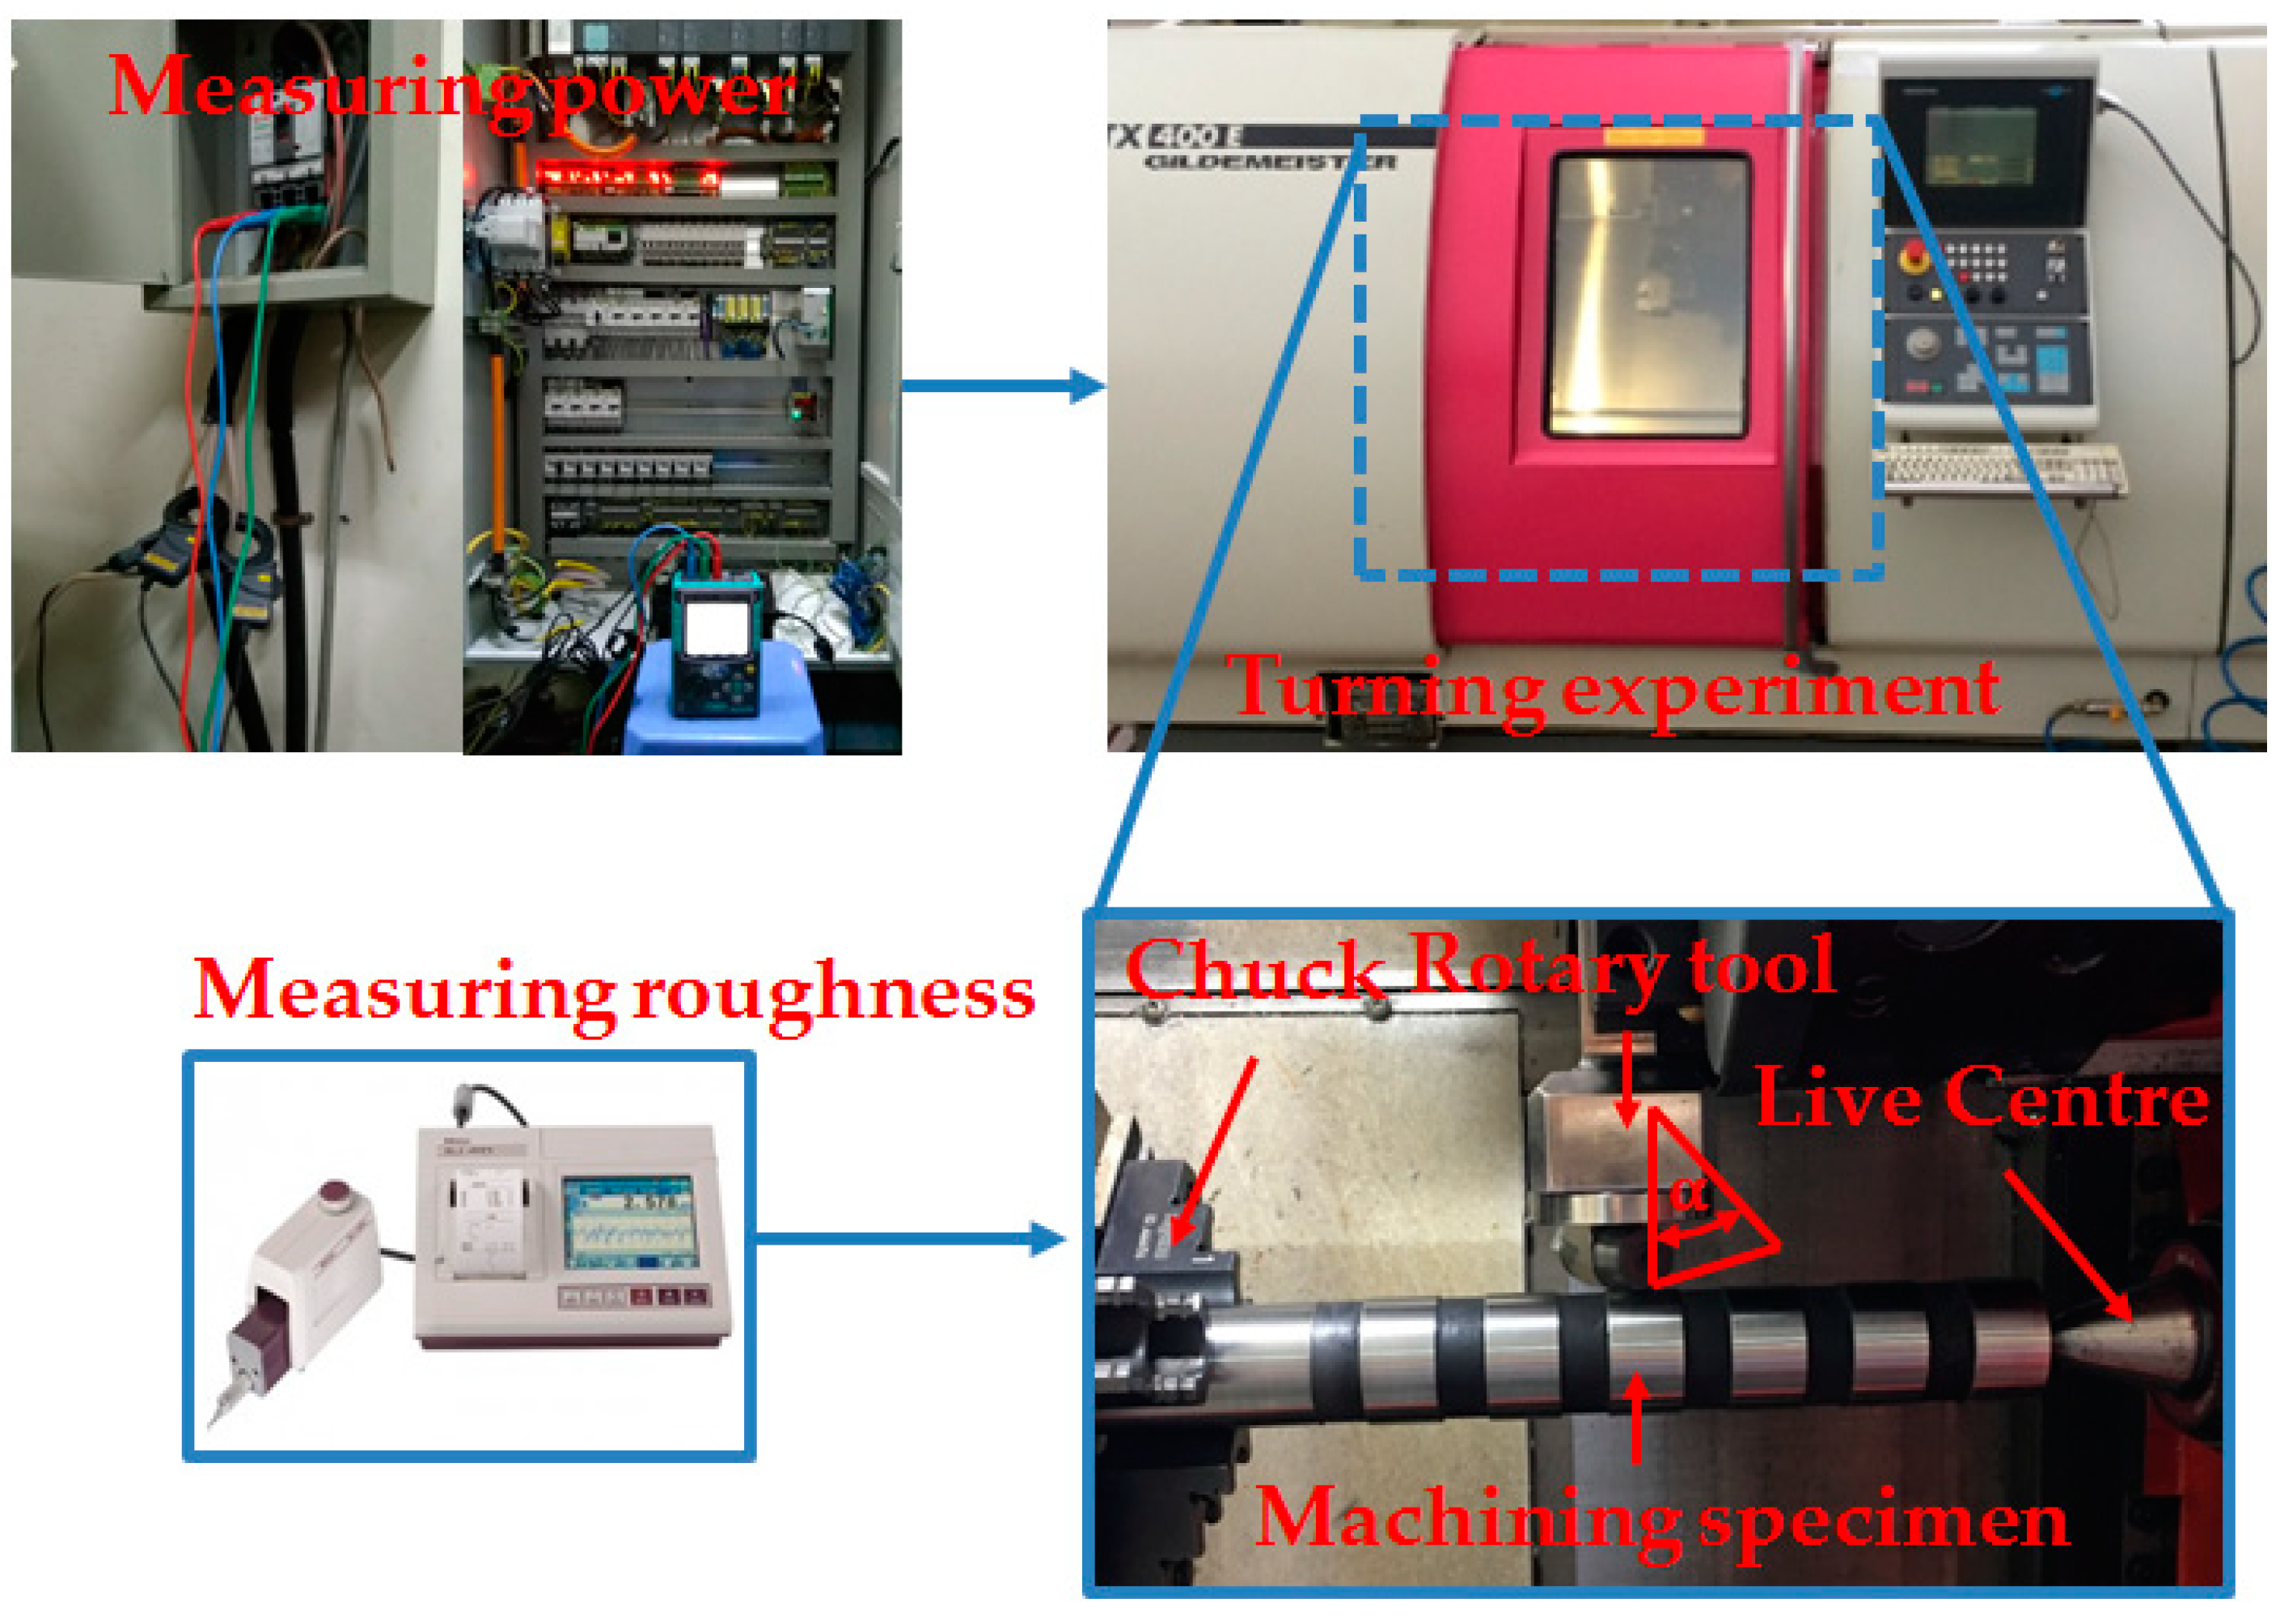
The turning trials are conducted under dry conditions using the TiAN coated rotary insert (RHHW 1605MOTN IN 2005) with 15° rake angle provided by INGERSOLL (Figure 4). The outside diameter, inside diameter, and thickness of the round insert are 16, 5.2, and 5.2 mm, respectively. The hardness of the employed insert is around 78 HRC. The mold steel labeled 2311 is used to fabricate the tool shank.
All the turning trials are performed on a CNC lathe labeled CTX 400E manufactured by GILDEMEISTER (Bielefeld, Germany). The controller namely HEIDENHAIN CNC-PILOT is employed to perform all machining operations. The machine used had a power spindle of 15 kW and a maximum of 4500 rpm. The turning experiments are repeated two times to ensure the data repeatability and a new insert is employed in each run.
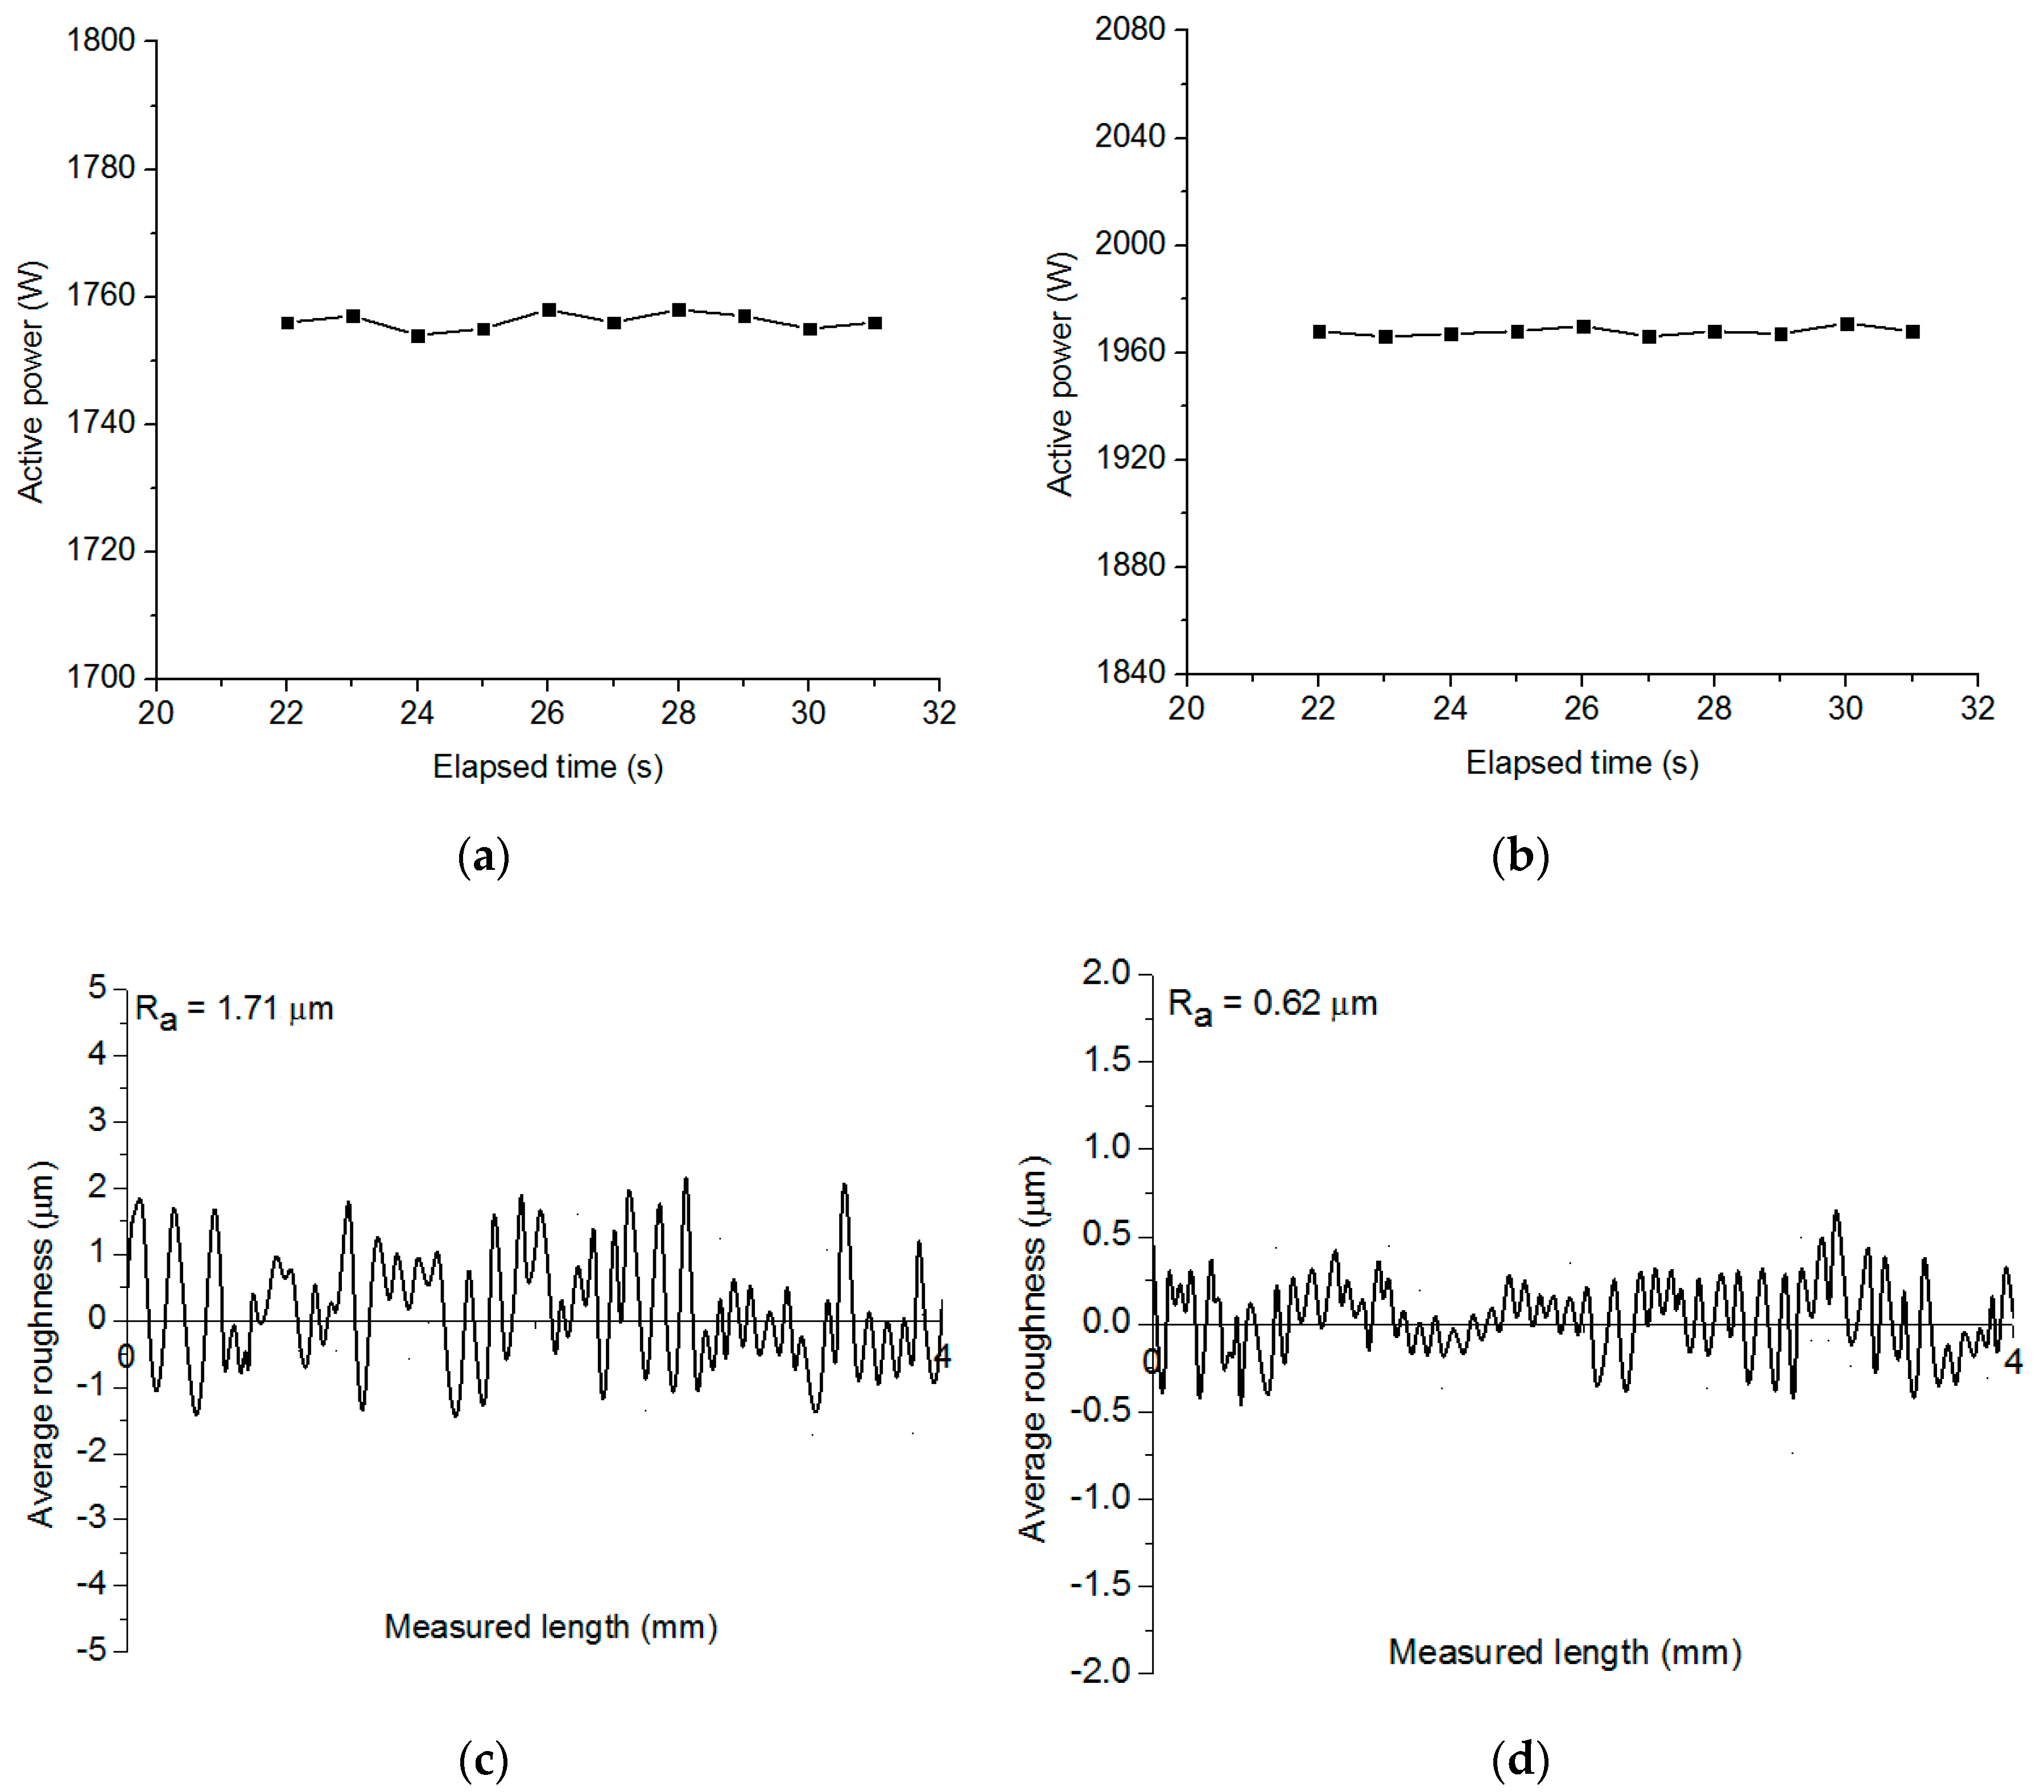
A power meter labeled KEW6305 is employed to capture power components during the rotary turning. Three clamp sensors are connected to the three-phase power lines of CNC lathe with correct direction. The power meter is turned on after the appropriate connection. When the rotary turning is conducted, power components are automatically recorded. The experimental data is stored on a flashcard and analyzed with the aid of the KEW6305 software. An interval of 0.1 sec. is used to improve the accuracy of the measured data. A roughness tester labeled Mitutoyo SJ-301 is used to measure the roughness in five investigated points. The sampling length of 4 mm is used to ensure the measuring precision.
The obtained values of total power consumption and average roughness are exhibited in Figure 5.
3. Results and Discussions
3.1. Development of Improved Kriging Models
The coefficients for the cost models are exhibited in Table 3. Experimental results are shown in Table 4. The experimental data from 1 to 27 were used to construct improved Kriging models. The trials from 28 to 33 were adopted in order to explore the precision of the models proposed.
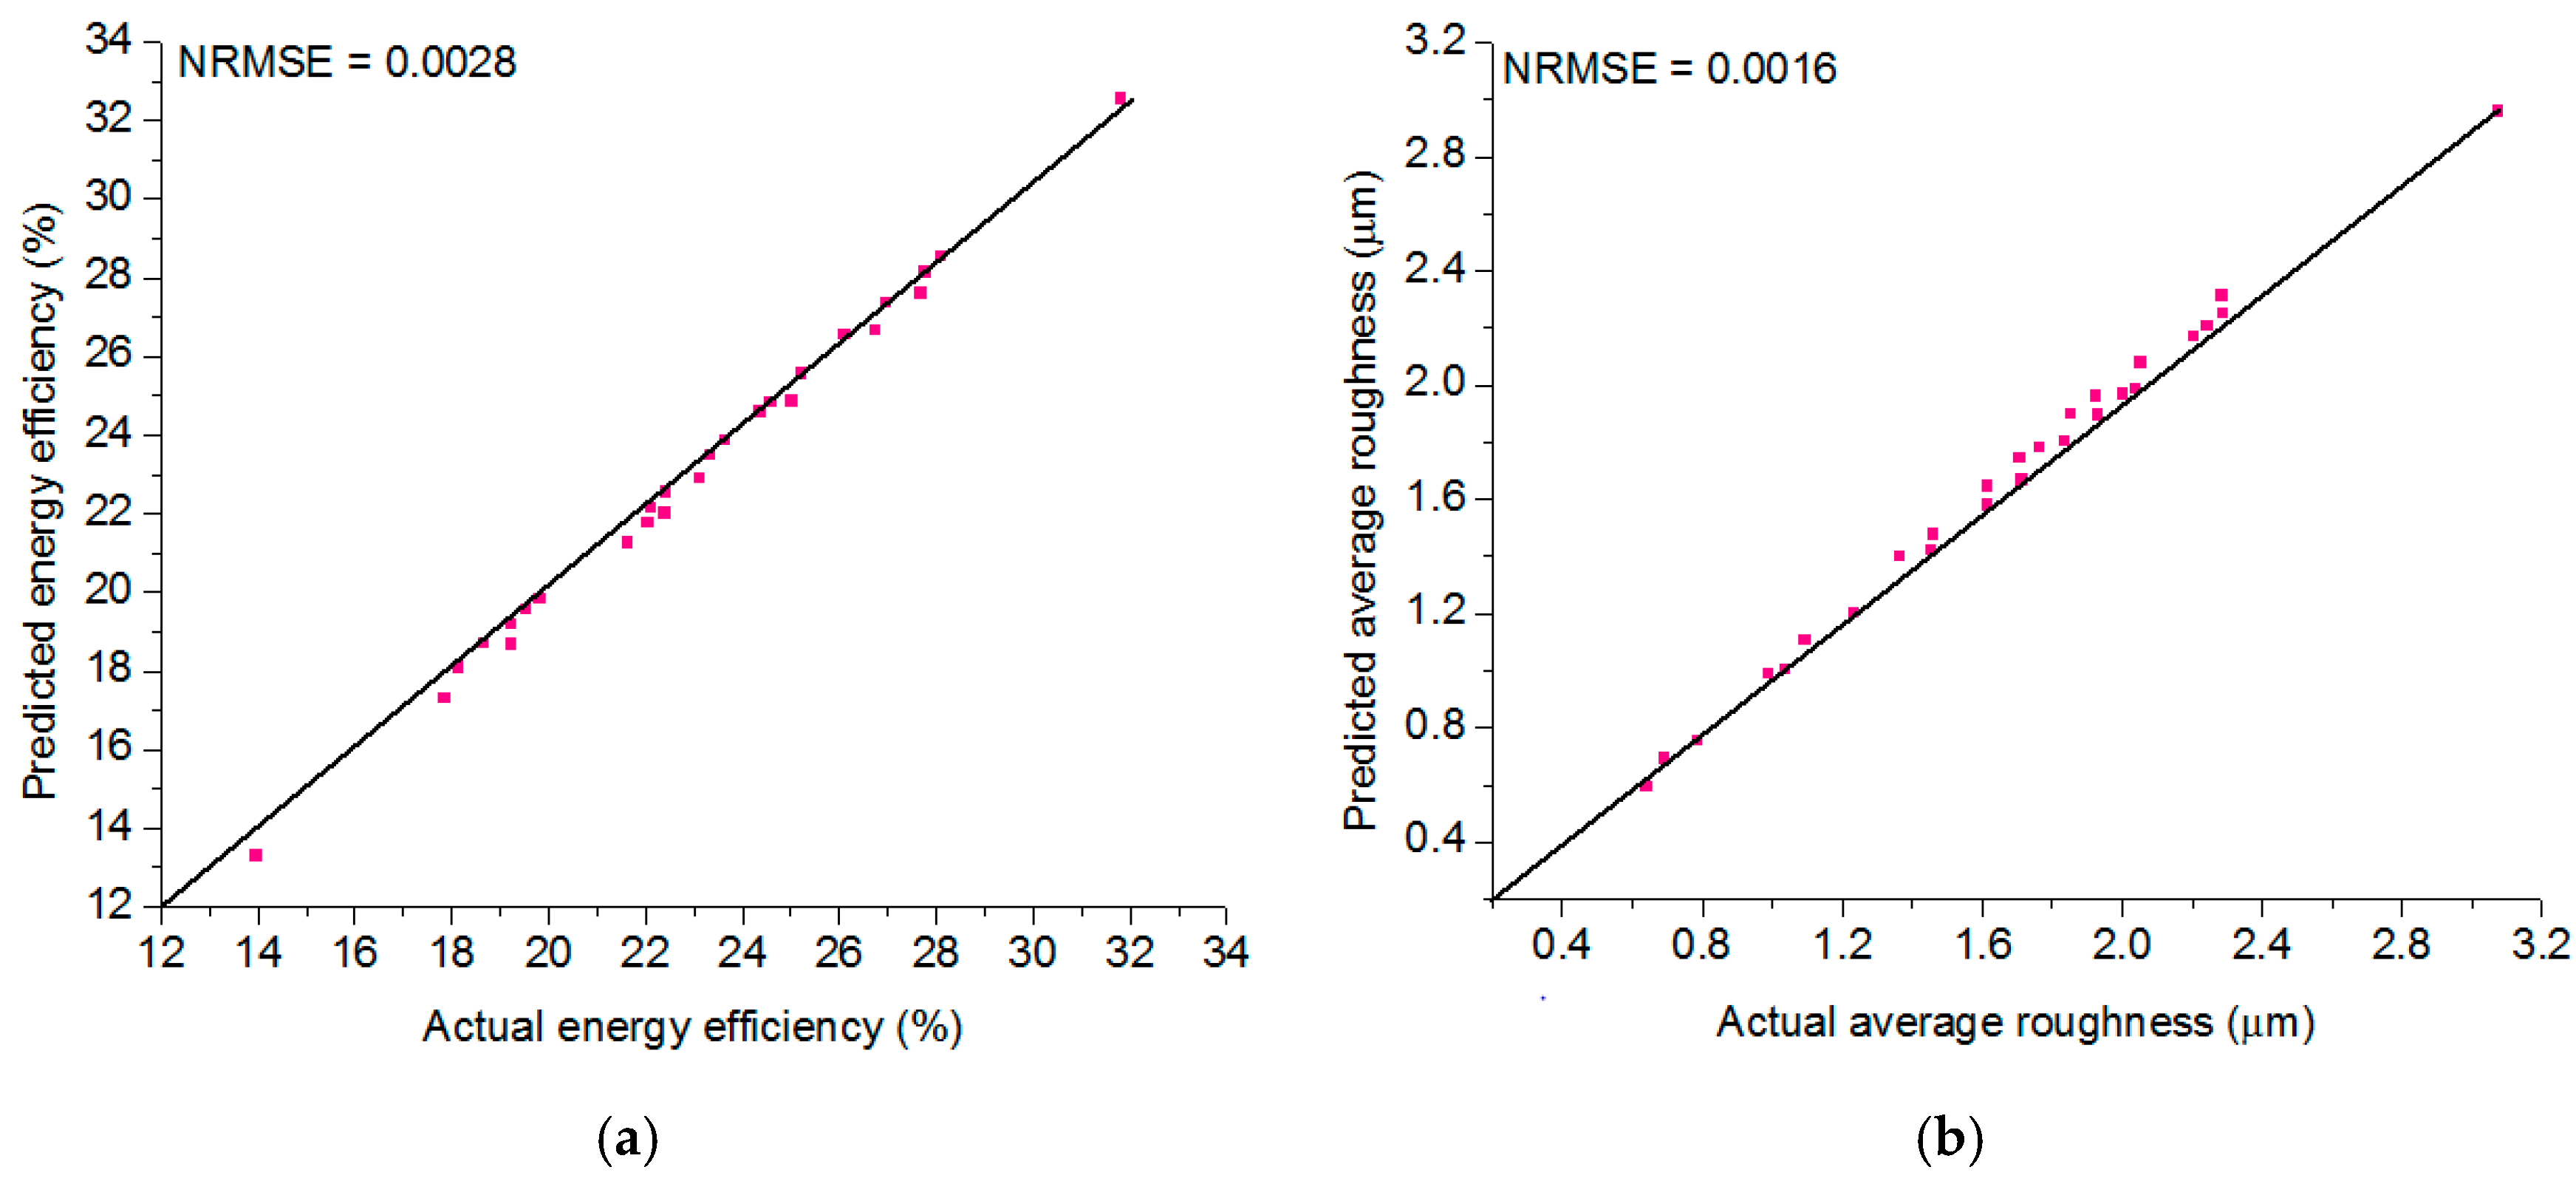
The normalized root mean squared error (NRMSE) is used to evaluate the soundness of the improved Kriging models. The NRMSE values of the EFR and Ra are 0.0018 and 0.0011, respectively (Figure 6). It can be stated that the fidelity of the improved Kriging models is acceptable.
ANOVA analysis having 95% confidence is employed to check the adequacy of the developed models [27]. The factors having p-value less than 0.05 are significant. ANOVA results of the energy efficiency model are shown in Table 5. The R2 value of 0.9812 indicated that the energy efficiency model presented 98.12% of the total variety of the experimental data. The adjusted R2 value of 0.9632 indicated that the proposed model exhibited a variation of 96.32% with significant factors. Moreover, the predicted R2 value of 0.9526 indicated that the proposed model exhibited a variation of 9526% with any new data. The significant factors are the single terms (α, ap, f, and vc), interaction term (αap and apvc), and quadratic terms (ap2, f2, α2, and vc2). Other terms having p-value higher than 0.05 are insignificant factors.
ANOVA results of the average roughness model are shown in Table 6. The R2 value of 0.9834 indicated that the average roughness model presented 98.34% of the total variety of the experimental data. The adjusted R2 value of 0.9664 indicated that the proposed model exhibited a variation of 96.64% with significant factors. Moreover, the predicted R2 value of 0.9552 indicated that the proposed model exhibited a variation of 95.52% with any new data. The significant factors are the single terms (α, ap, f, and vc), interaction term (apvc), and quadratic terms (ap2, f2, α2, and vc2). Other terms having p-value higher than 0.05 are insignificant factors.
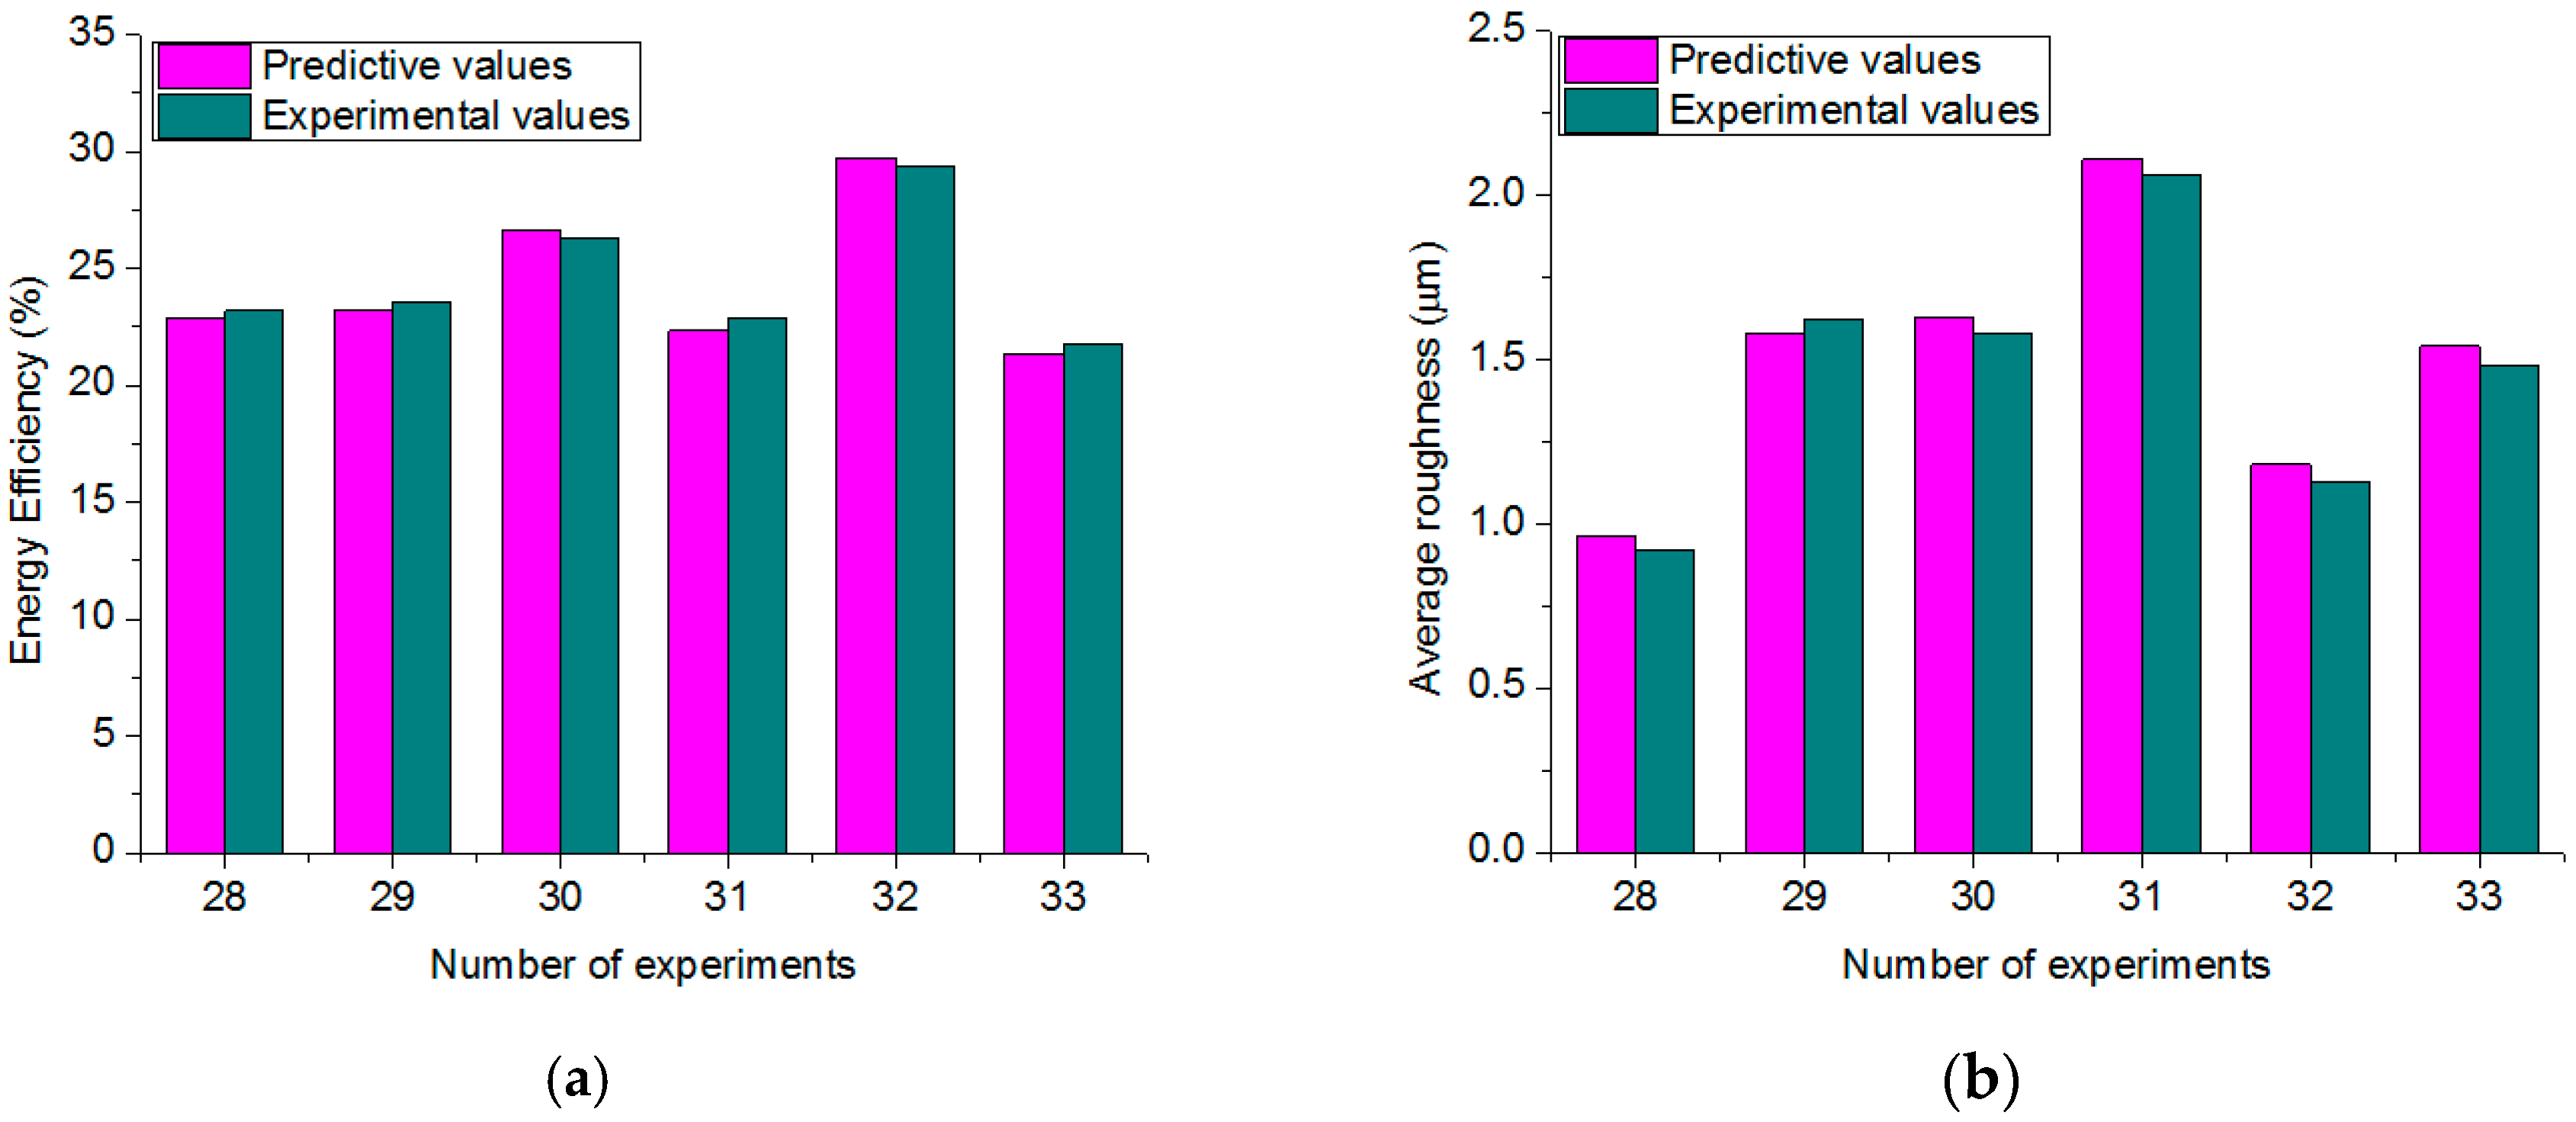
To confirm the accuracy of the developed models, the experimental outcomes are compared with the predictive values. Figure 7 depicts the comparisons between the predicted and experimental values. The small errors indicated that the models have high consistency and the models can be employed to predict the response values.
3.2. Parametric Effects
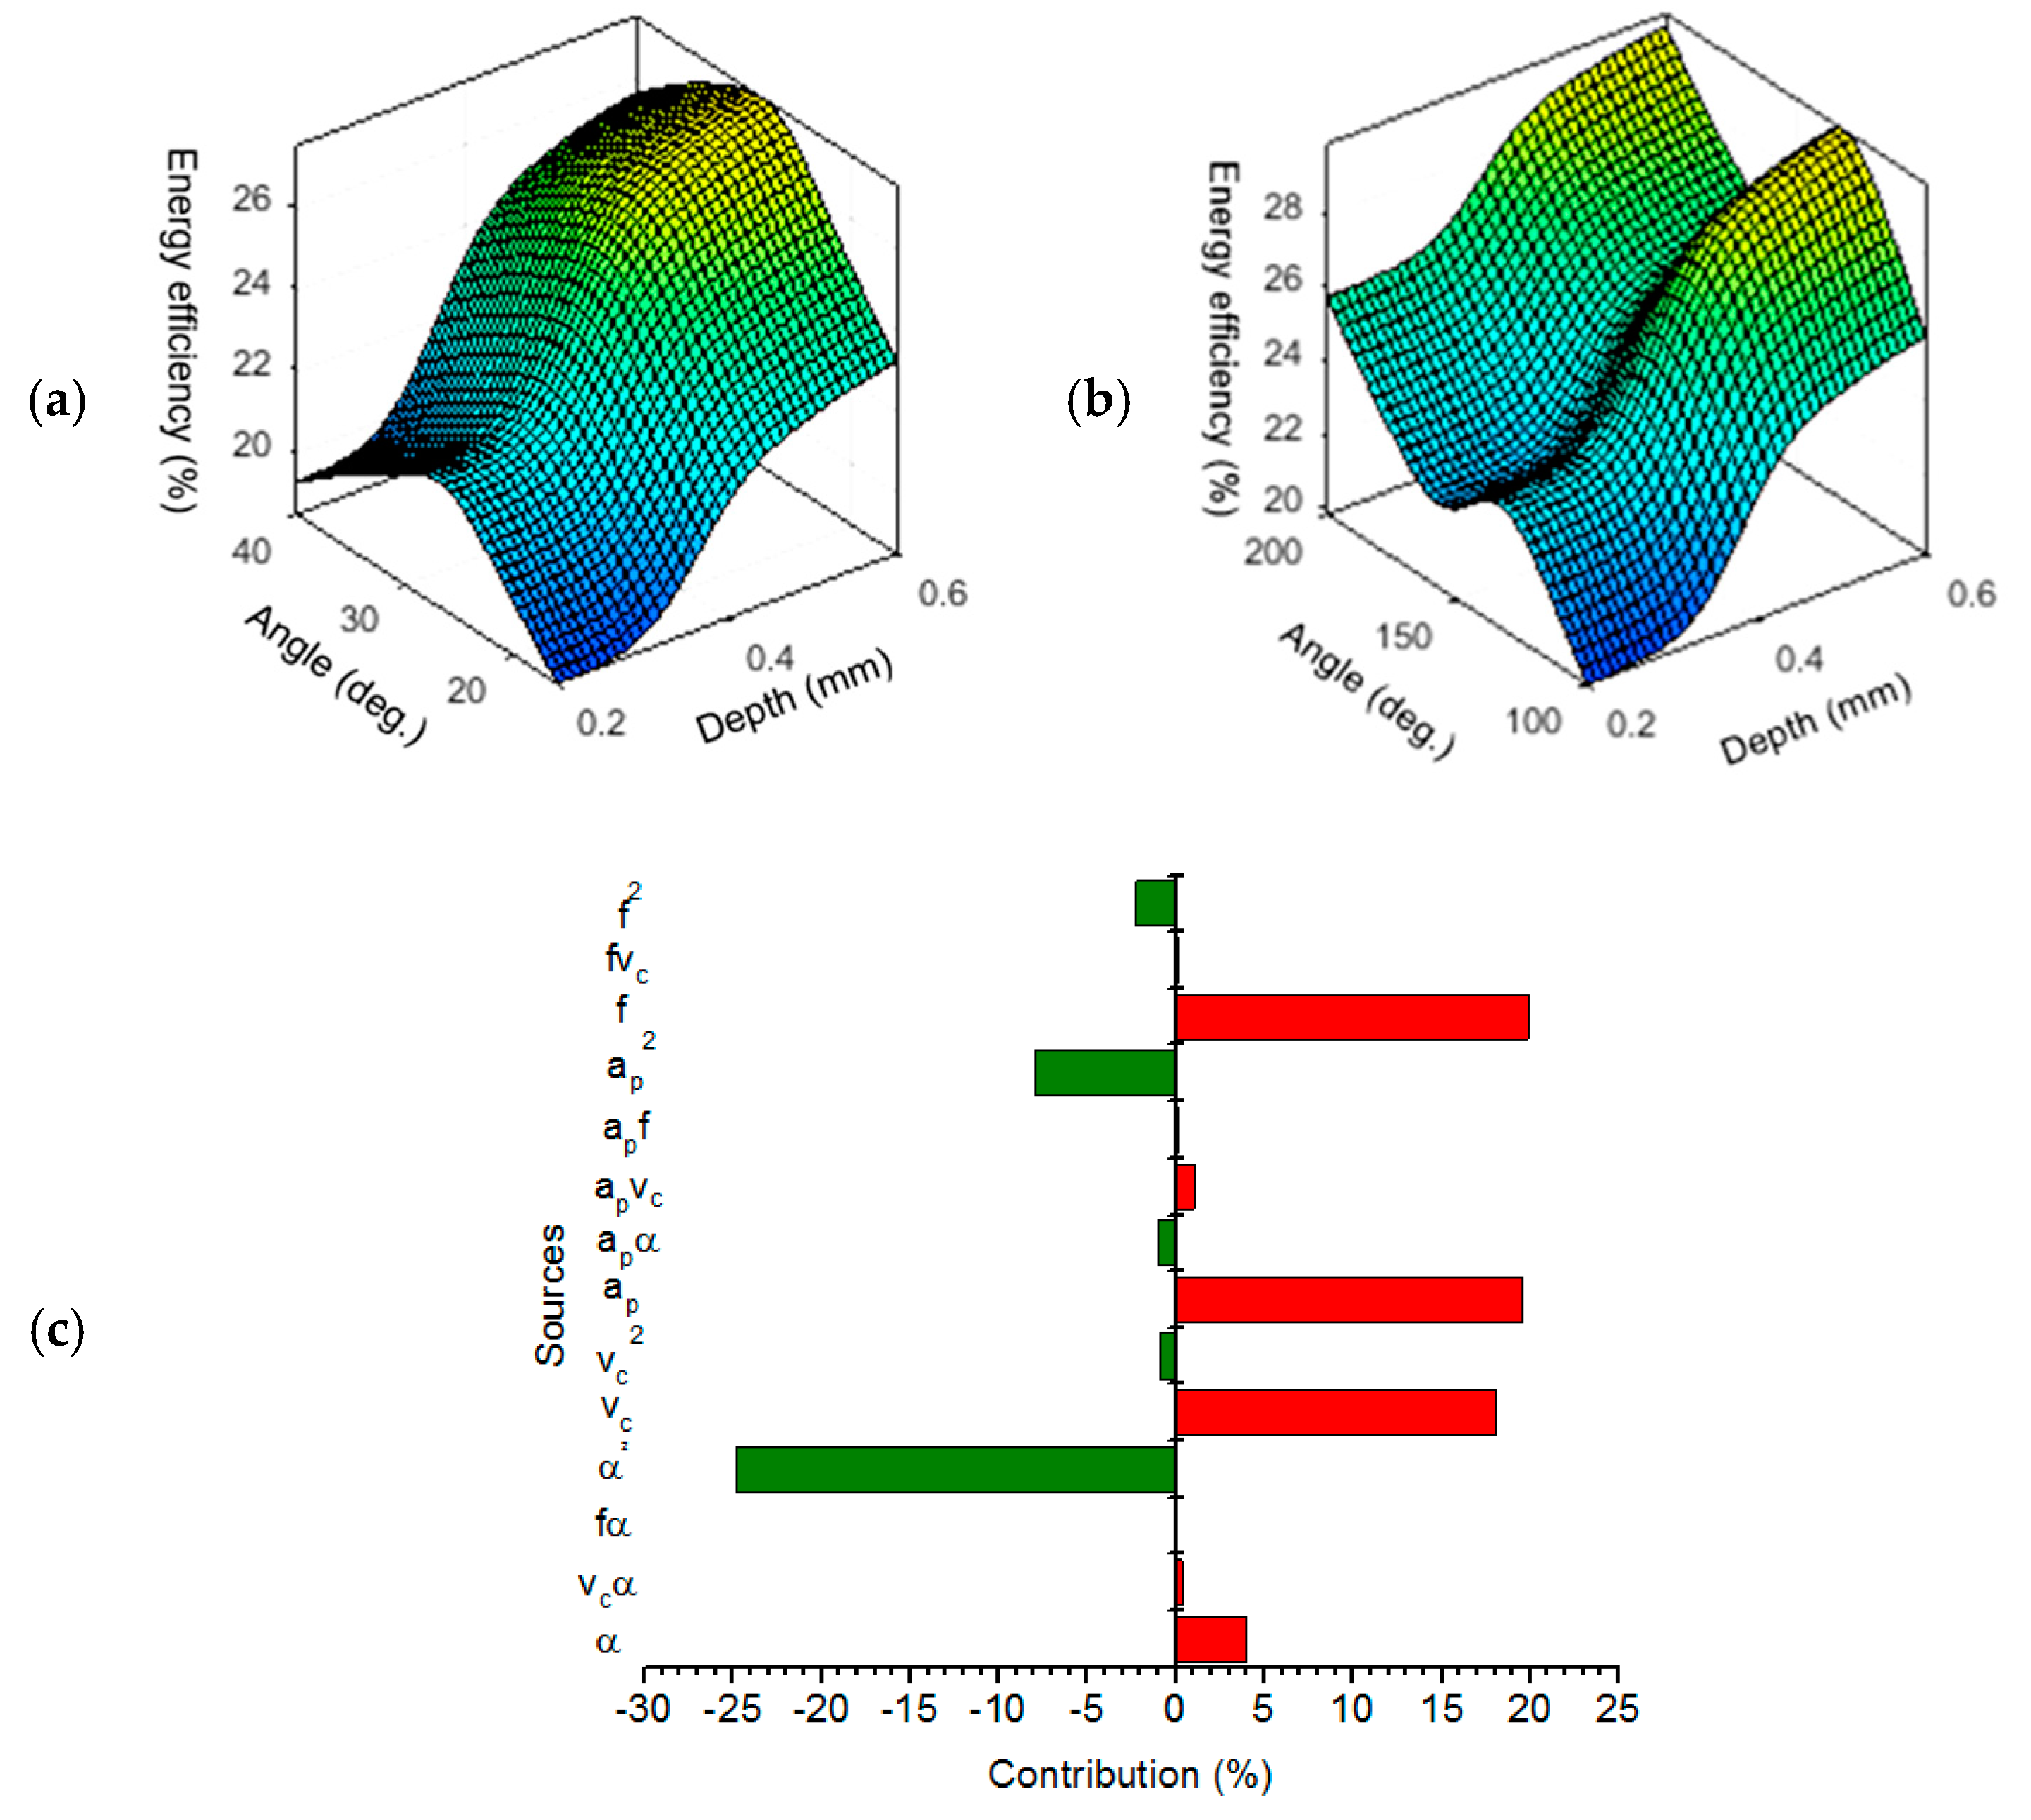
Energy efficiency is a significant indicator to evaluate the environmental impact of the dry turning process and high energy efficiency is desirable. The impacts of the varied factors on the energy efficiency of the rotary turning process are shown in Figure 8.
Figure 8a exhibits the effects of the depth of cut and inclined angle on energy efficiency. It can be stated that higher efficiency is associated with an increment in the depth and/or inclined angle. Additionally, a further value of the inclined angle leads to a reduction in energy efficiency. The phenomena can be explained as follows.
The thickness of the chip increases with an increment in the depth of cut, which causes higher contact region between the rotary insert and workpiece. A higher amount of the material is turned, which leads to an increase in the degree of plastic deformation. Higher frictional resistance is produced. As a result, a higher active power is required to overcome friction, and energy efficiency increases [28]. An increase in the inclined angle leads to a lower contact area between the workpiece and the turning insert. A lower value of the total power consumption is employed to turn the material, hence, energy efficiency is improved. In contrast, a further value of the inclined angle causes a higher turning area due to the perpendicular between the rotary insert and the workpiece. A higher amount of the material is processed and a higher degree of plastic deformation is obtained. Greater resistance causes higher the total power consumed in the CNC lathe, hence, energy efficiency decreases. Consequently, the highest depth of cut can be employed to enhance energy efficiency, while the middle angle is recommended to use.
Figure 8b exhibits the effects of the feed rate and speed on energy efficiency. It can be stated that increased speed and/or feed leads to an increment in energy efficiency. A higher power of the spindle motor is required with an increment in the speed. The turning momentum also increases to satisfy a higher setting of the cutting speed. As a result, higher active turning power is obtained, hence, energy efficiency improves. Additionally, the strength and hardness of the machined specimen may decrease due to an increment in the temperature at the turning region, which causes a softer material. A lower value of the total power consumed is then obtained and energy efficiency increases.
According to Figure 8b, when the feed rate increases, the reaction force on the spindle system increases. Therefore, the active cutting power of the spindle system increases. Additionally, a higher value of the feed rate leads to an increment in the machining temperature and may cause the work-hardening on the workpiece surface. This results in an increase in the turning force due to a greater resistance, hence, higher active cutting power is consumed. Moreover, an increment in the feed causes higher contact region between the tool and workpiece. Obviously, higher active cutting power is required to process material and remove the chip. Therefore, increased feed causes higher energy efficiency.
The parametric contributions of the varied factors on the energy efficiency model are exhibited in Figure 8c. The blue and red bars denote the negative and positive impacts, respectively. The feed rate is the most effective factor (19.87%), followed by the depth (19.57%), speed (18.05%), and inclined angle (3.93%), respectively. The contribution of the α2, ap2, f2, and vc2 are 24.80%, 7.90%, 2.25%, and 0.88%, respectively.
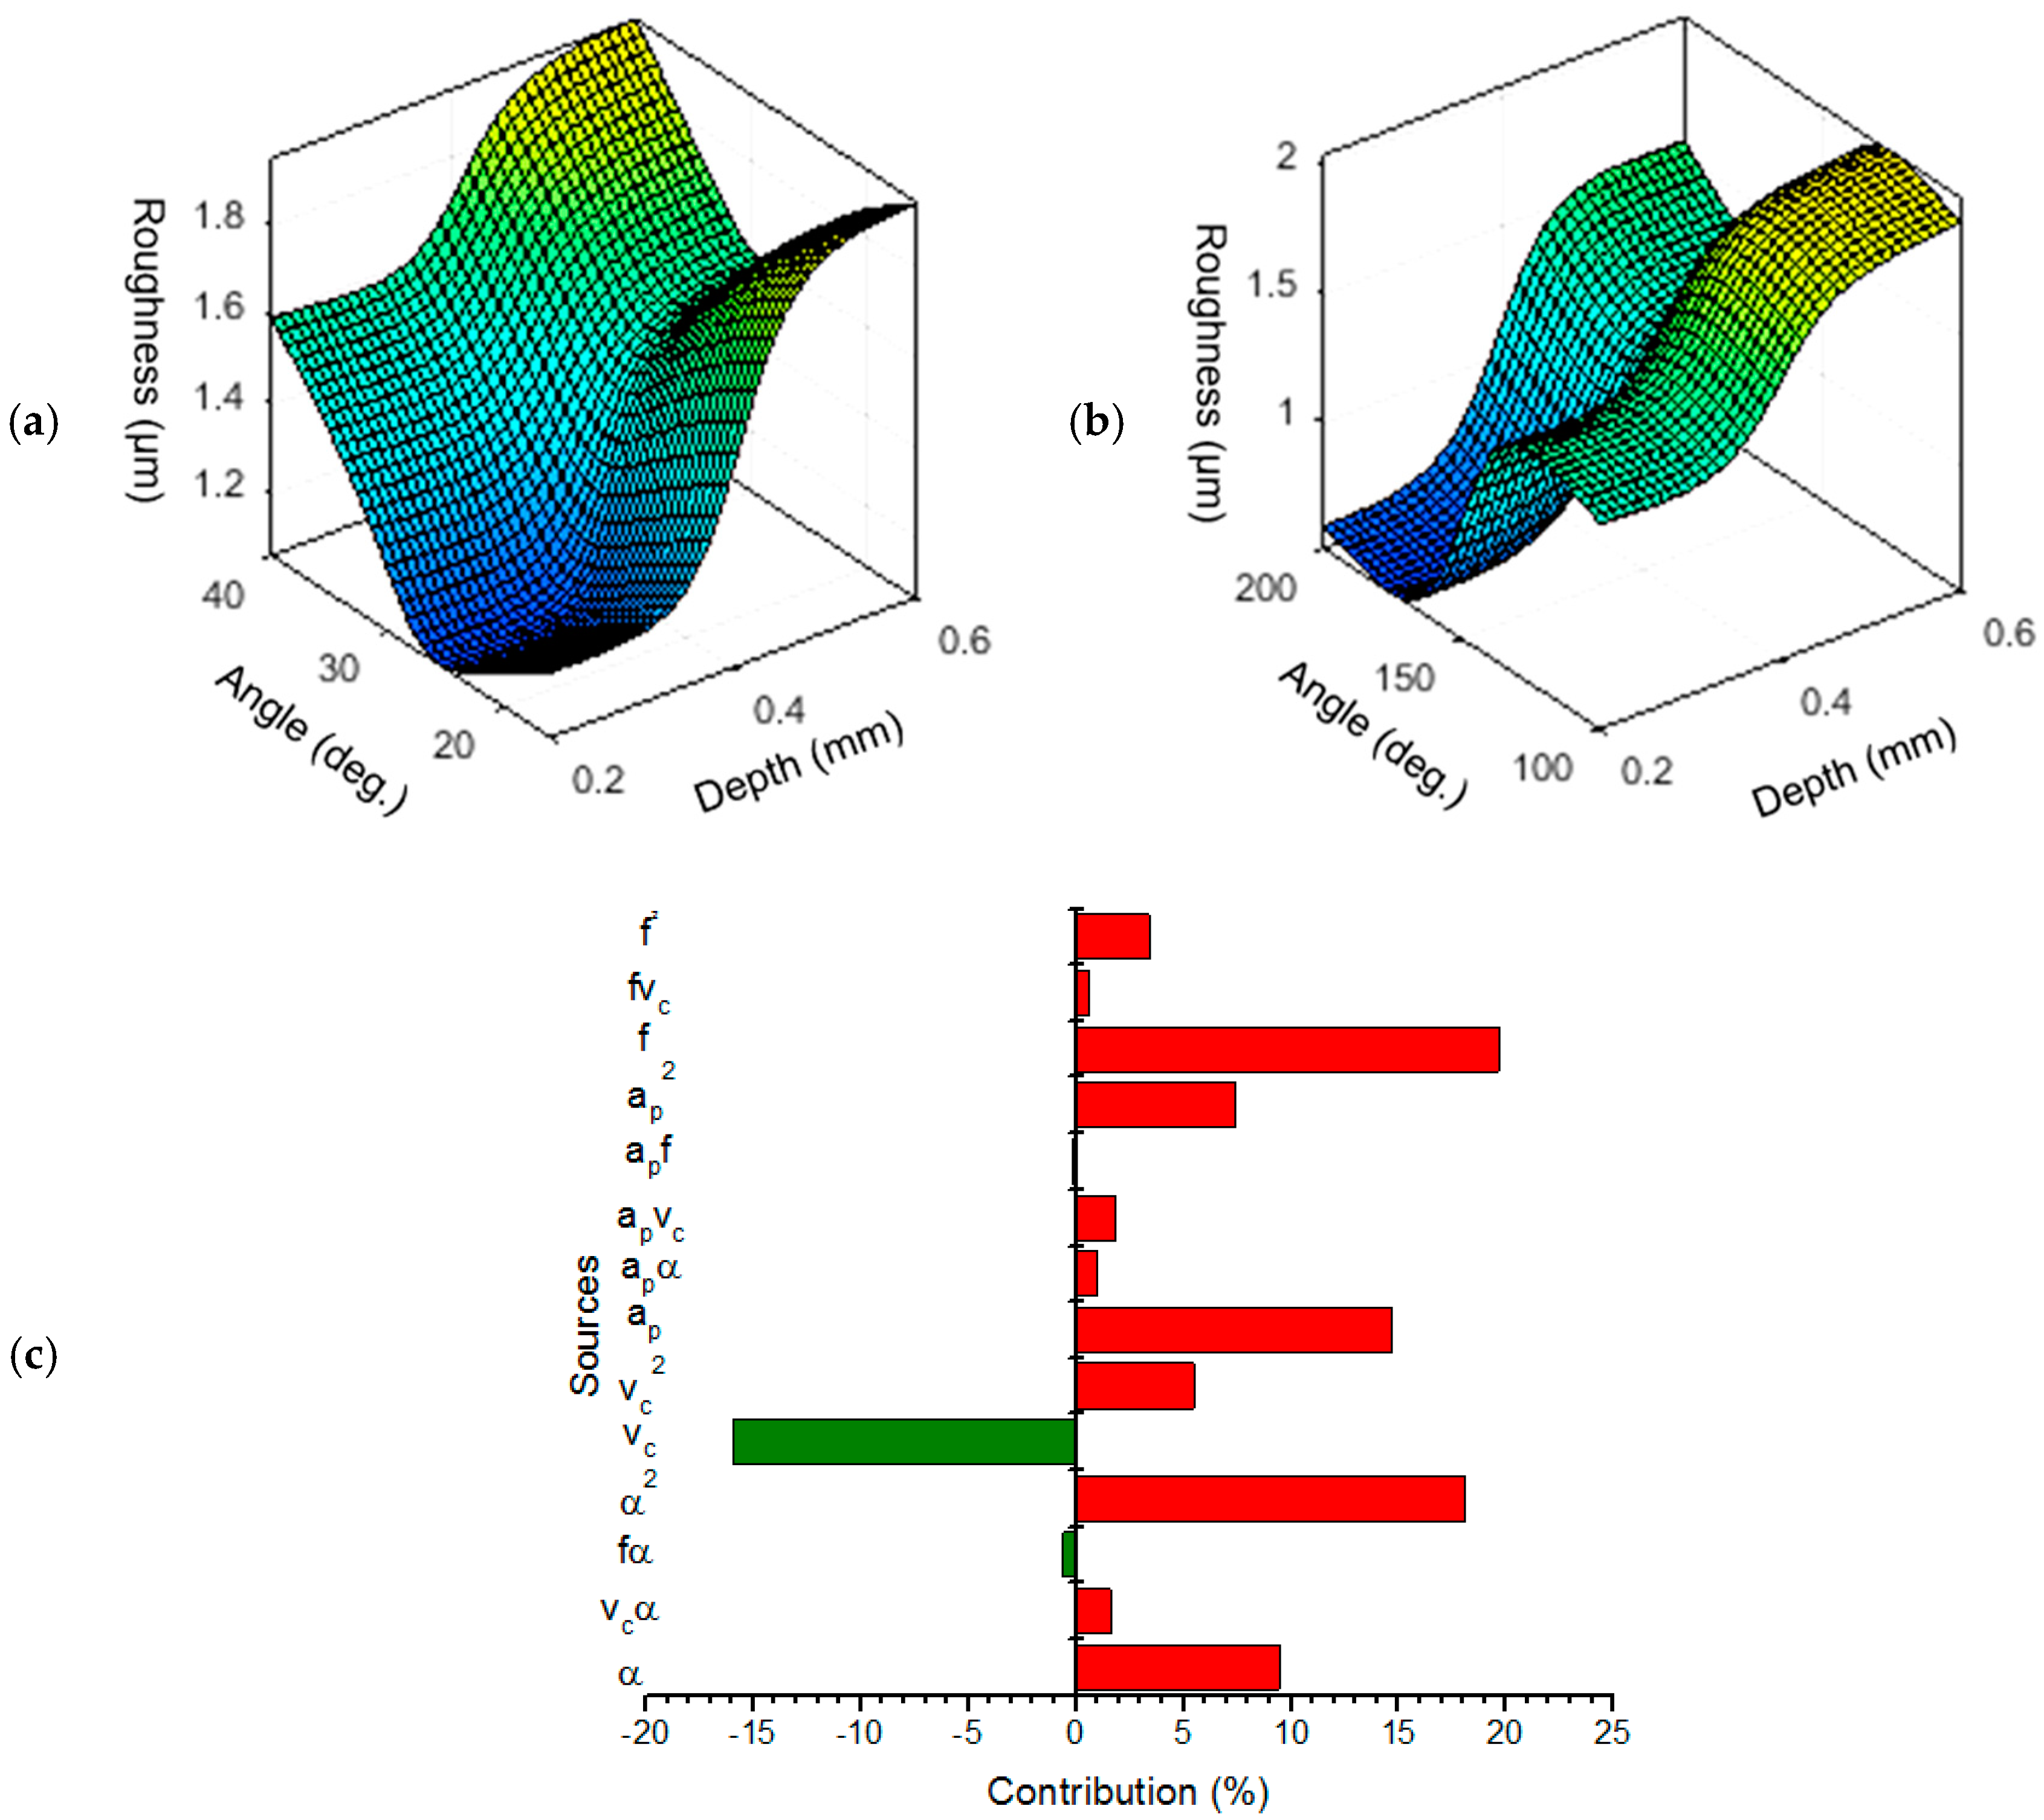
The surface roughness is an important evaluator to explore the social impact of the dry turning process and a low roughness is preferred. Figure 9 depicted the influences of the varied parameters on the average roughness.
Figure 9a exhibits the effects of the depth of cut and inclined angle on the roughness. It can be stated that higher roughness is associated with an increment in the depth. A reduction in the roughness is associated with an increased inclined angle. Unfortunately, a further value of the inclined angle leads to an increase in the roughness. The turning area between the tool and the specimen is increased with a higher depth of cut. The tuned chip is heavily removed from the machined surface, which causes an increase in the roughness. The turned material volume is decreased with a larger inclined angle and material is easily processed. Lower roughness is obtained [29]. When the inclined angle increases from the middle to the highest levels, the turned material volume is increased due to the perpendicular between the cutting tool and the workpiece. A higher amount of material is processed and higher roughness is produced.
The impacts of the feed rate and cutting speed on the average roughness are shown in Figure 9b. The roughness is significantly decreased at the highest value of the cutting speed. Additionally, a higher feed rate leads to an increase in the roughness. The phenomena can be explained as follows. Higher speed results in increased temperature at the turning region, which causes a reduction in the hardness and strength of the workpiece. The chip is smoothly removed from the turned surface, hence, roughness is decreased. Low feed rate leads to a small distance between the turned peaks, which causes a low roughness. Higher distance between the turned peaks is produced at higher feed, hence, higher feed mark is generated on the machined surface.
The parametric contributions of the varied factors on the roughness model are exhibited in Figure 9c. The feed rate is the most effective factor (19.66%), followed by the speed (15.97%), depth (14.70%), and inclined angle (9.44%), respectively. The contribution of the α2, ap2, vc2, and f2 are 18.12%, 7.41%, 5.50%, and 3.41%, respectively.
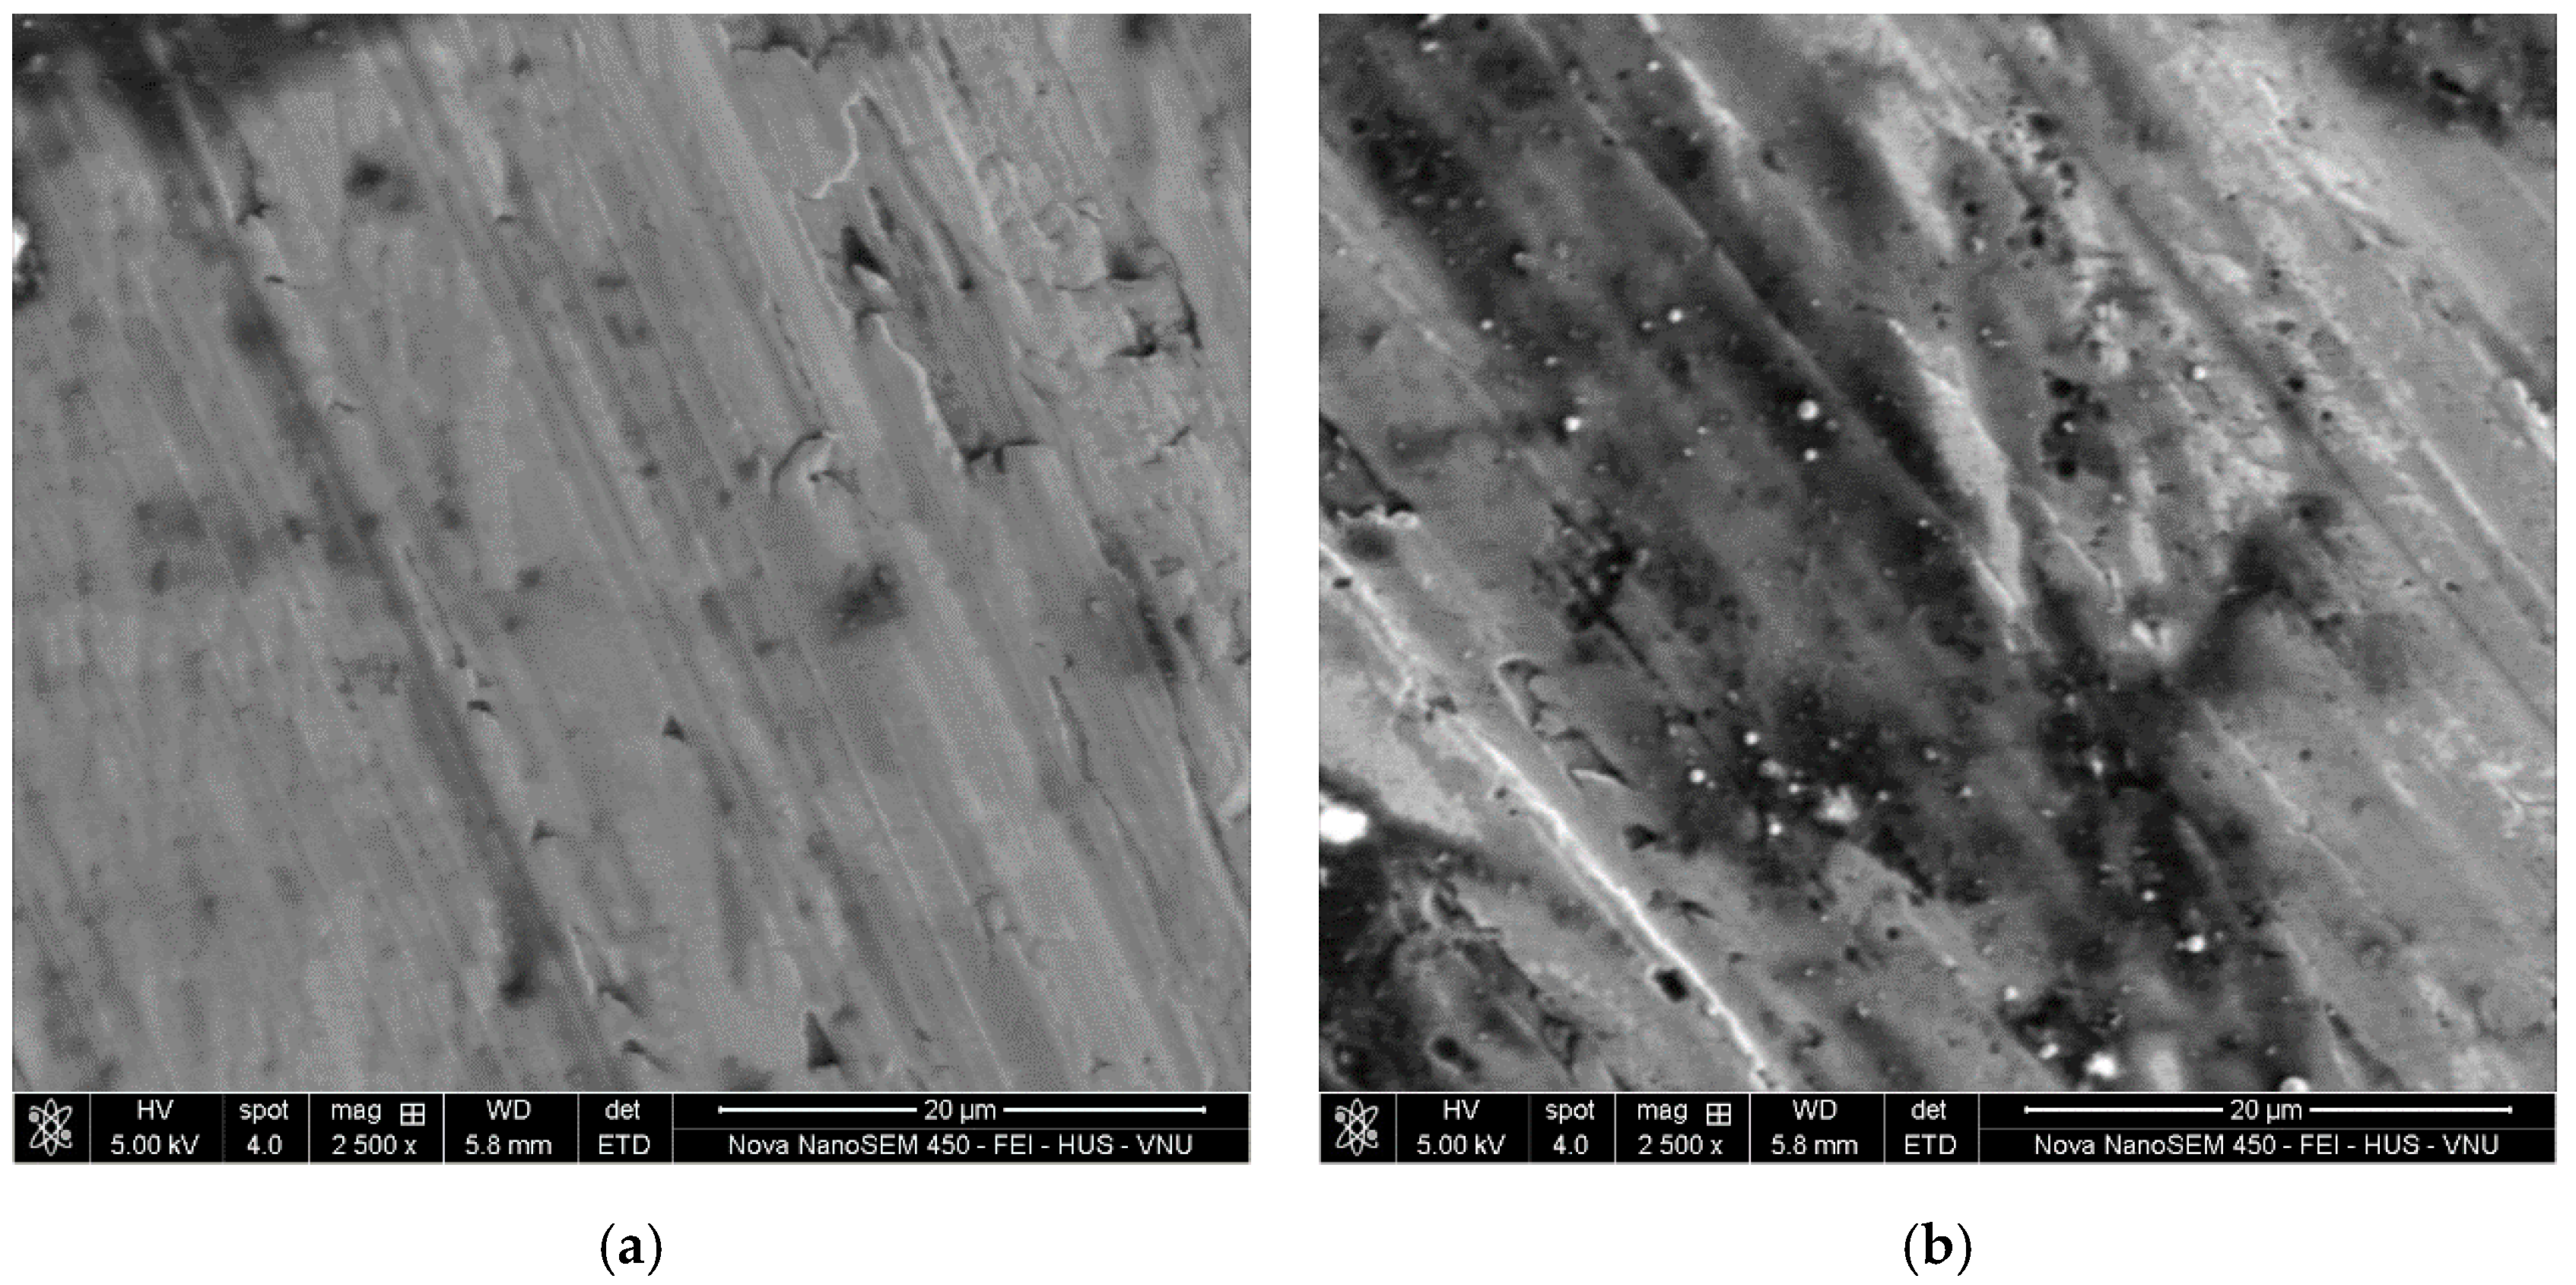
The turned images at different process inputs are depicted in Figure 10. As a result, a low roughness is obtained at low values of the depth of cut as well as feed and the middle value of the inclined angle, in which the smooth cut, small grooves, and small pits are produced (Figure 10a). A higher roughness is produced at high values of the depth of cut as well as feed rate and the lowest inclined angle, in which the bigger grooves and larger pits as well as voids are observed (Figure 10b).
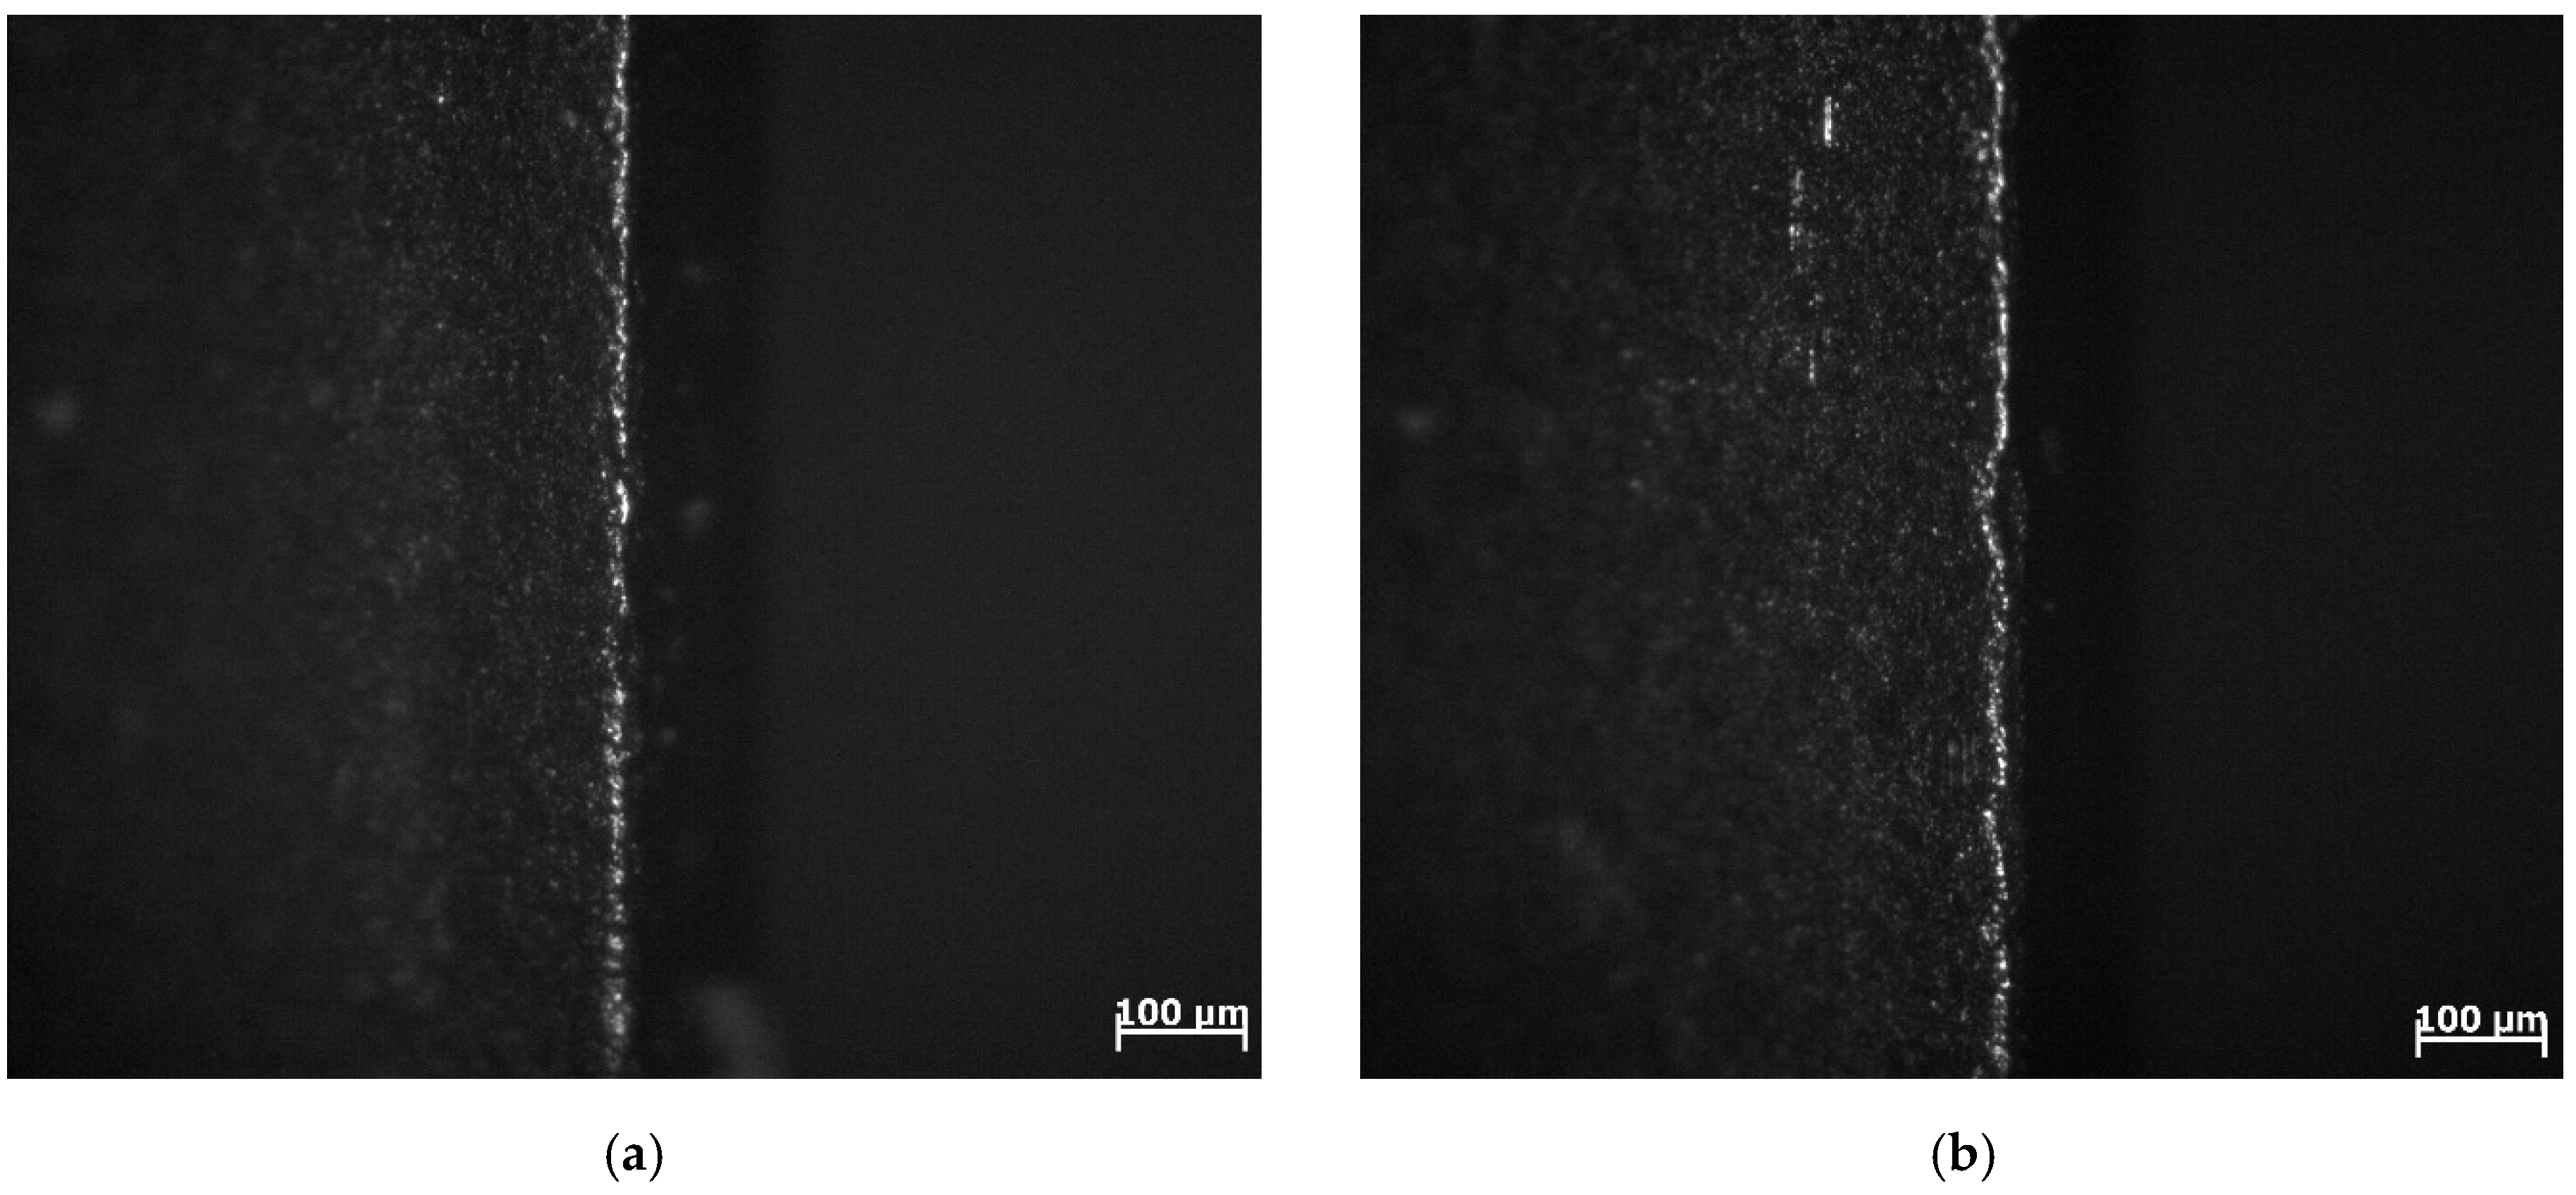
The SEM images of the round insert at various machining conditions are depicted in Figure 11. As depicted in Figure 11a, the wear is not much prominent without grooves or fracture at the low values of the depth of cut and feed rate. An increment in the depth and/or feed leads to bigger grooves and fractures on the rake face. Higher machining conditions may cause excessive pressure and stress, which decreases the hardness of the rotary insert (Figure 11b).
3.3. Optimization Results
In the current work, the proposed models can be adopted to obtain the optimal inputs for improvements in energy efficiency, roughness, and turning cost. Table 7 presents the setting parameter of the NCGA algorithm.
The 3D plots generated by NCGA are depicted in Figure 12. When higher operator safety is selected, the POS of 6 is chosen. On the contrary, the POS of 5 is selected with a lower impact on operational safety. In this study case, a CNC late having a protecting cover is used to separate the operator from the turning process, hence, the lower curve (POS = 5) should be selected.
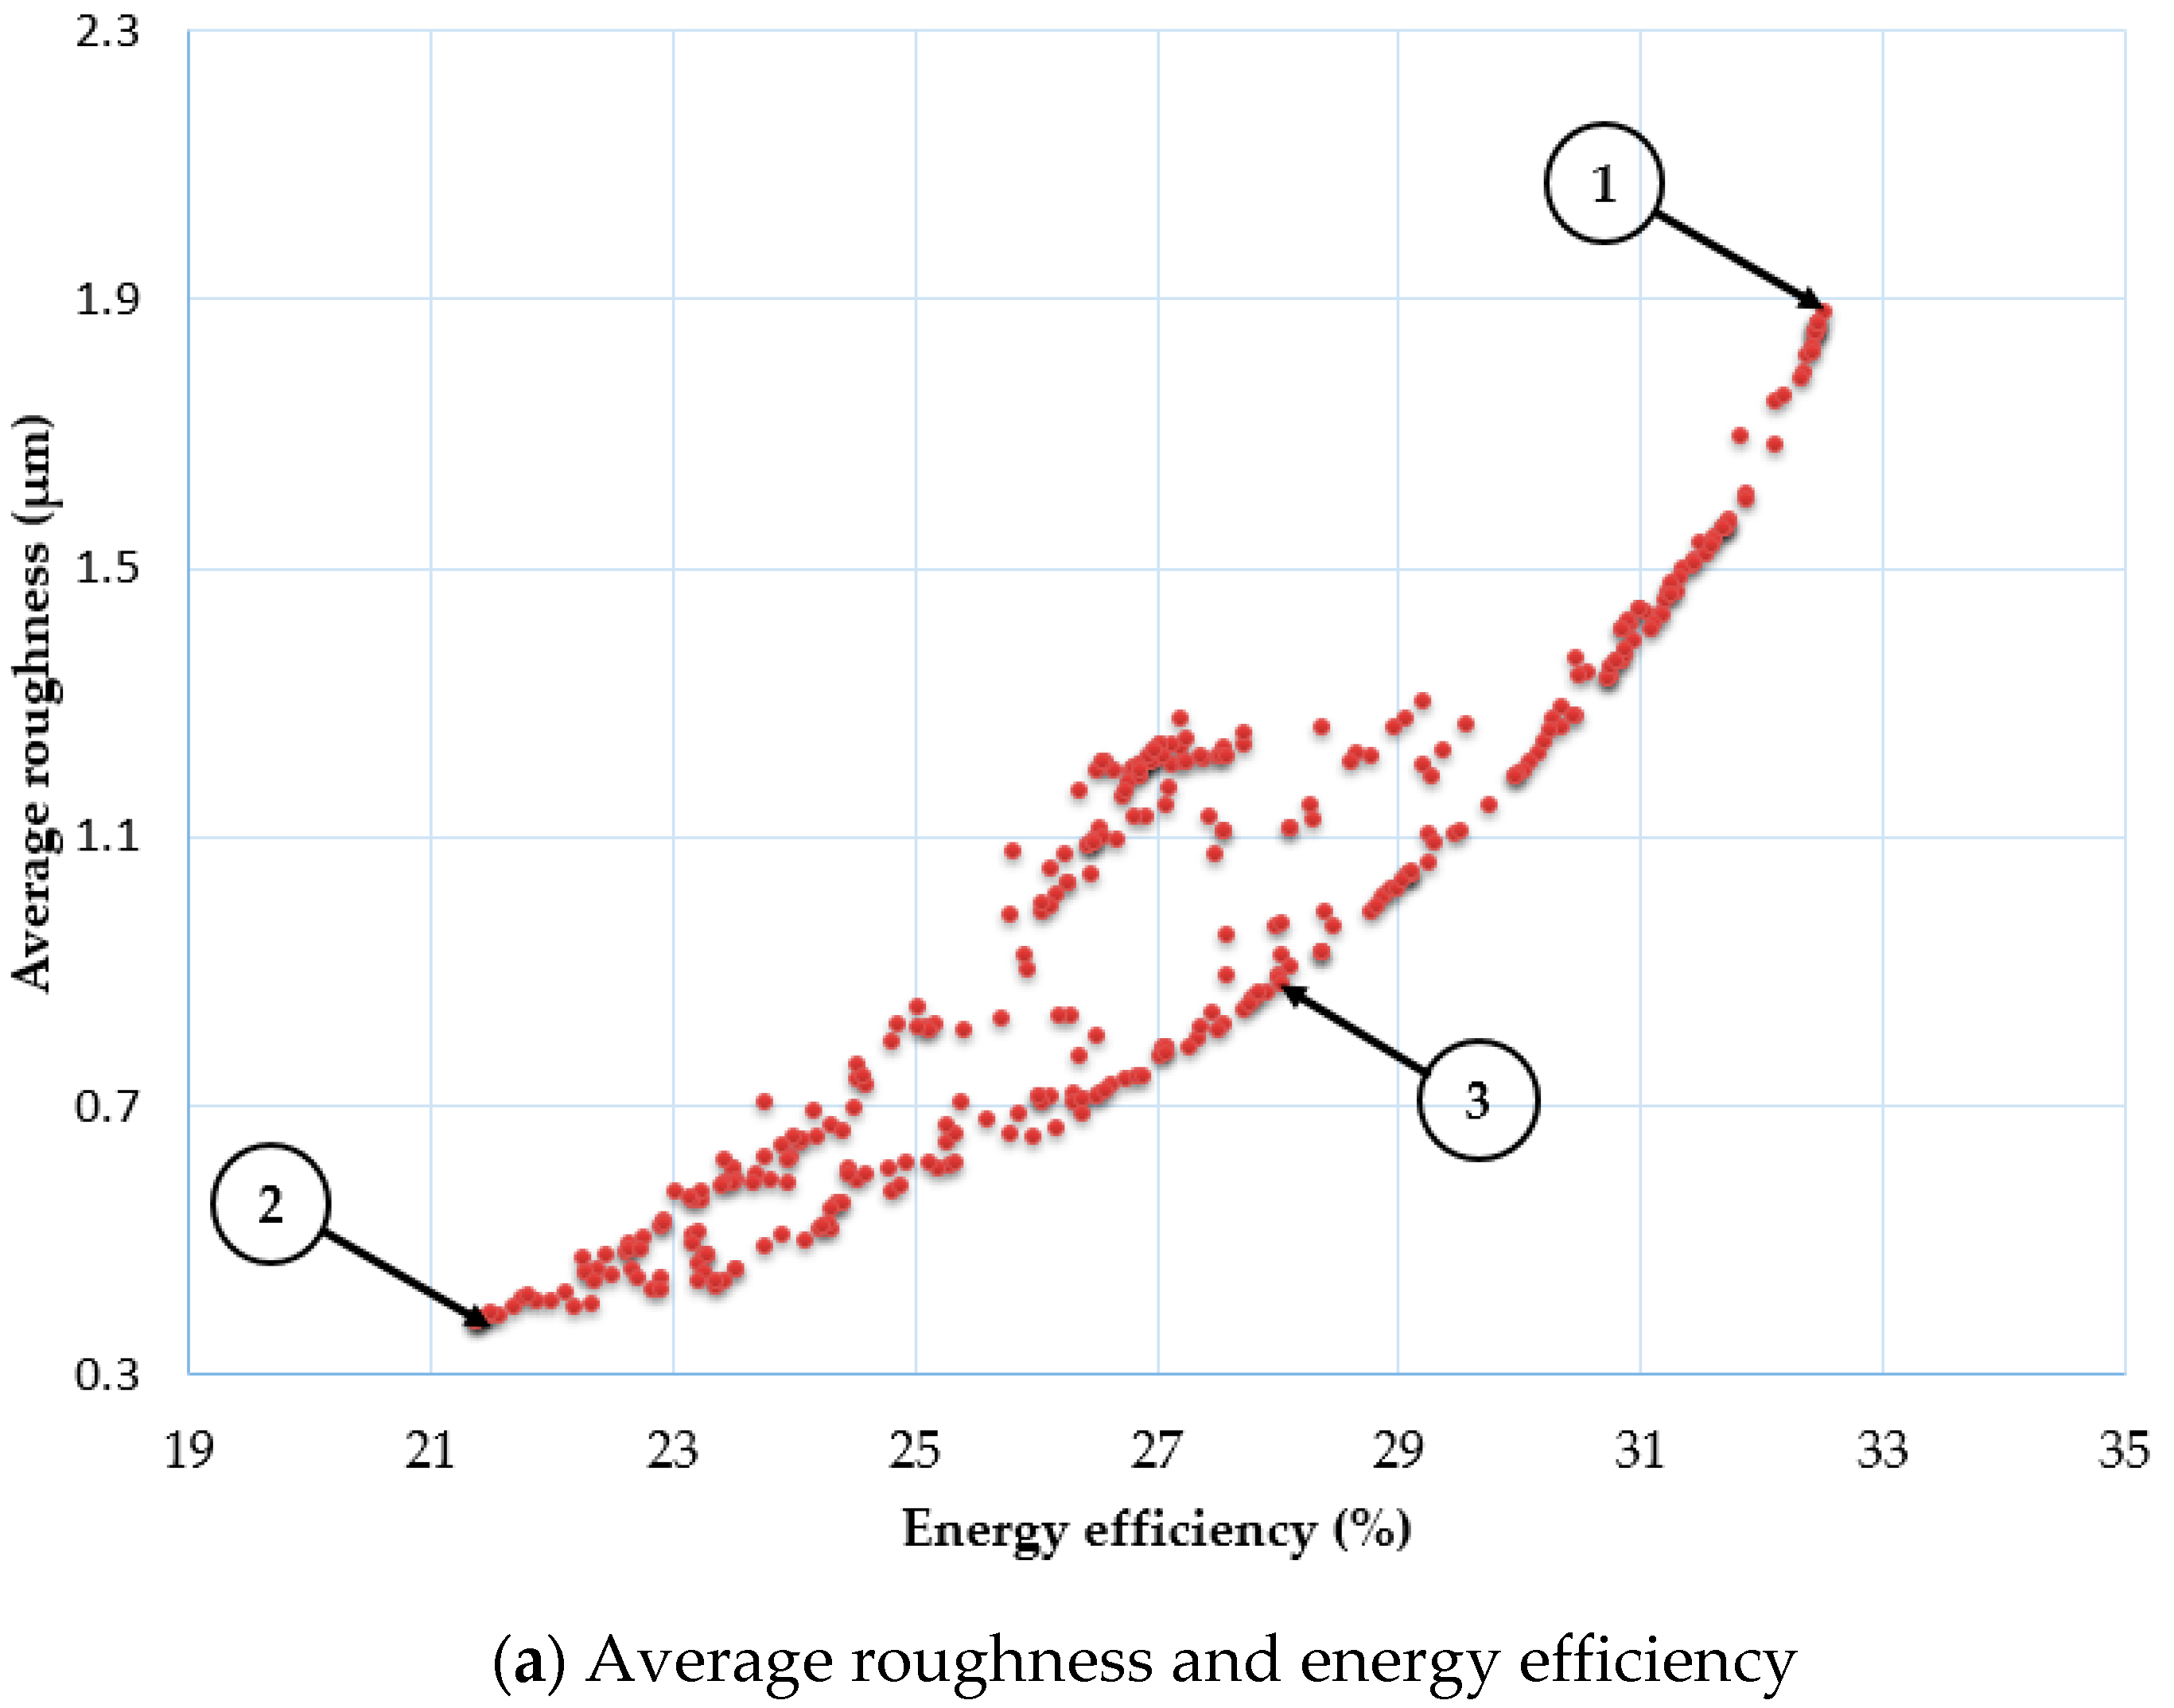
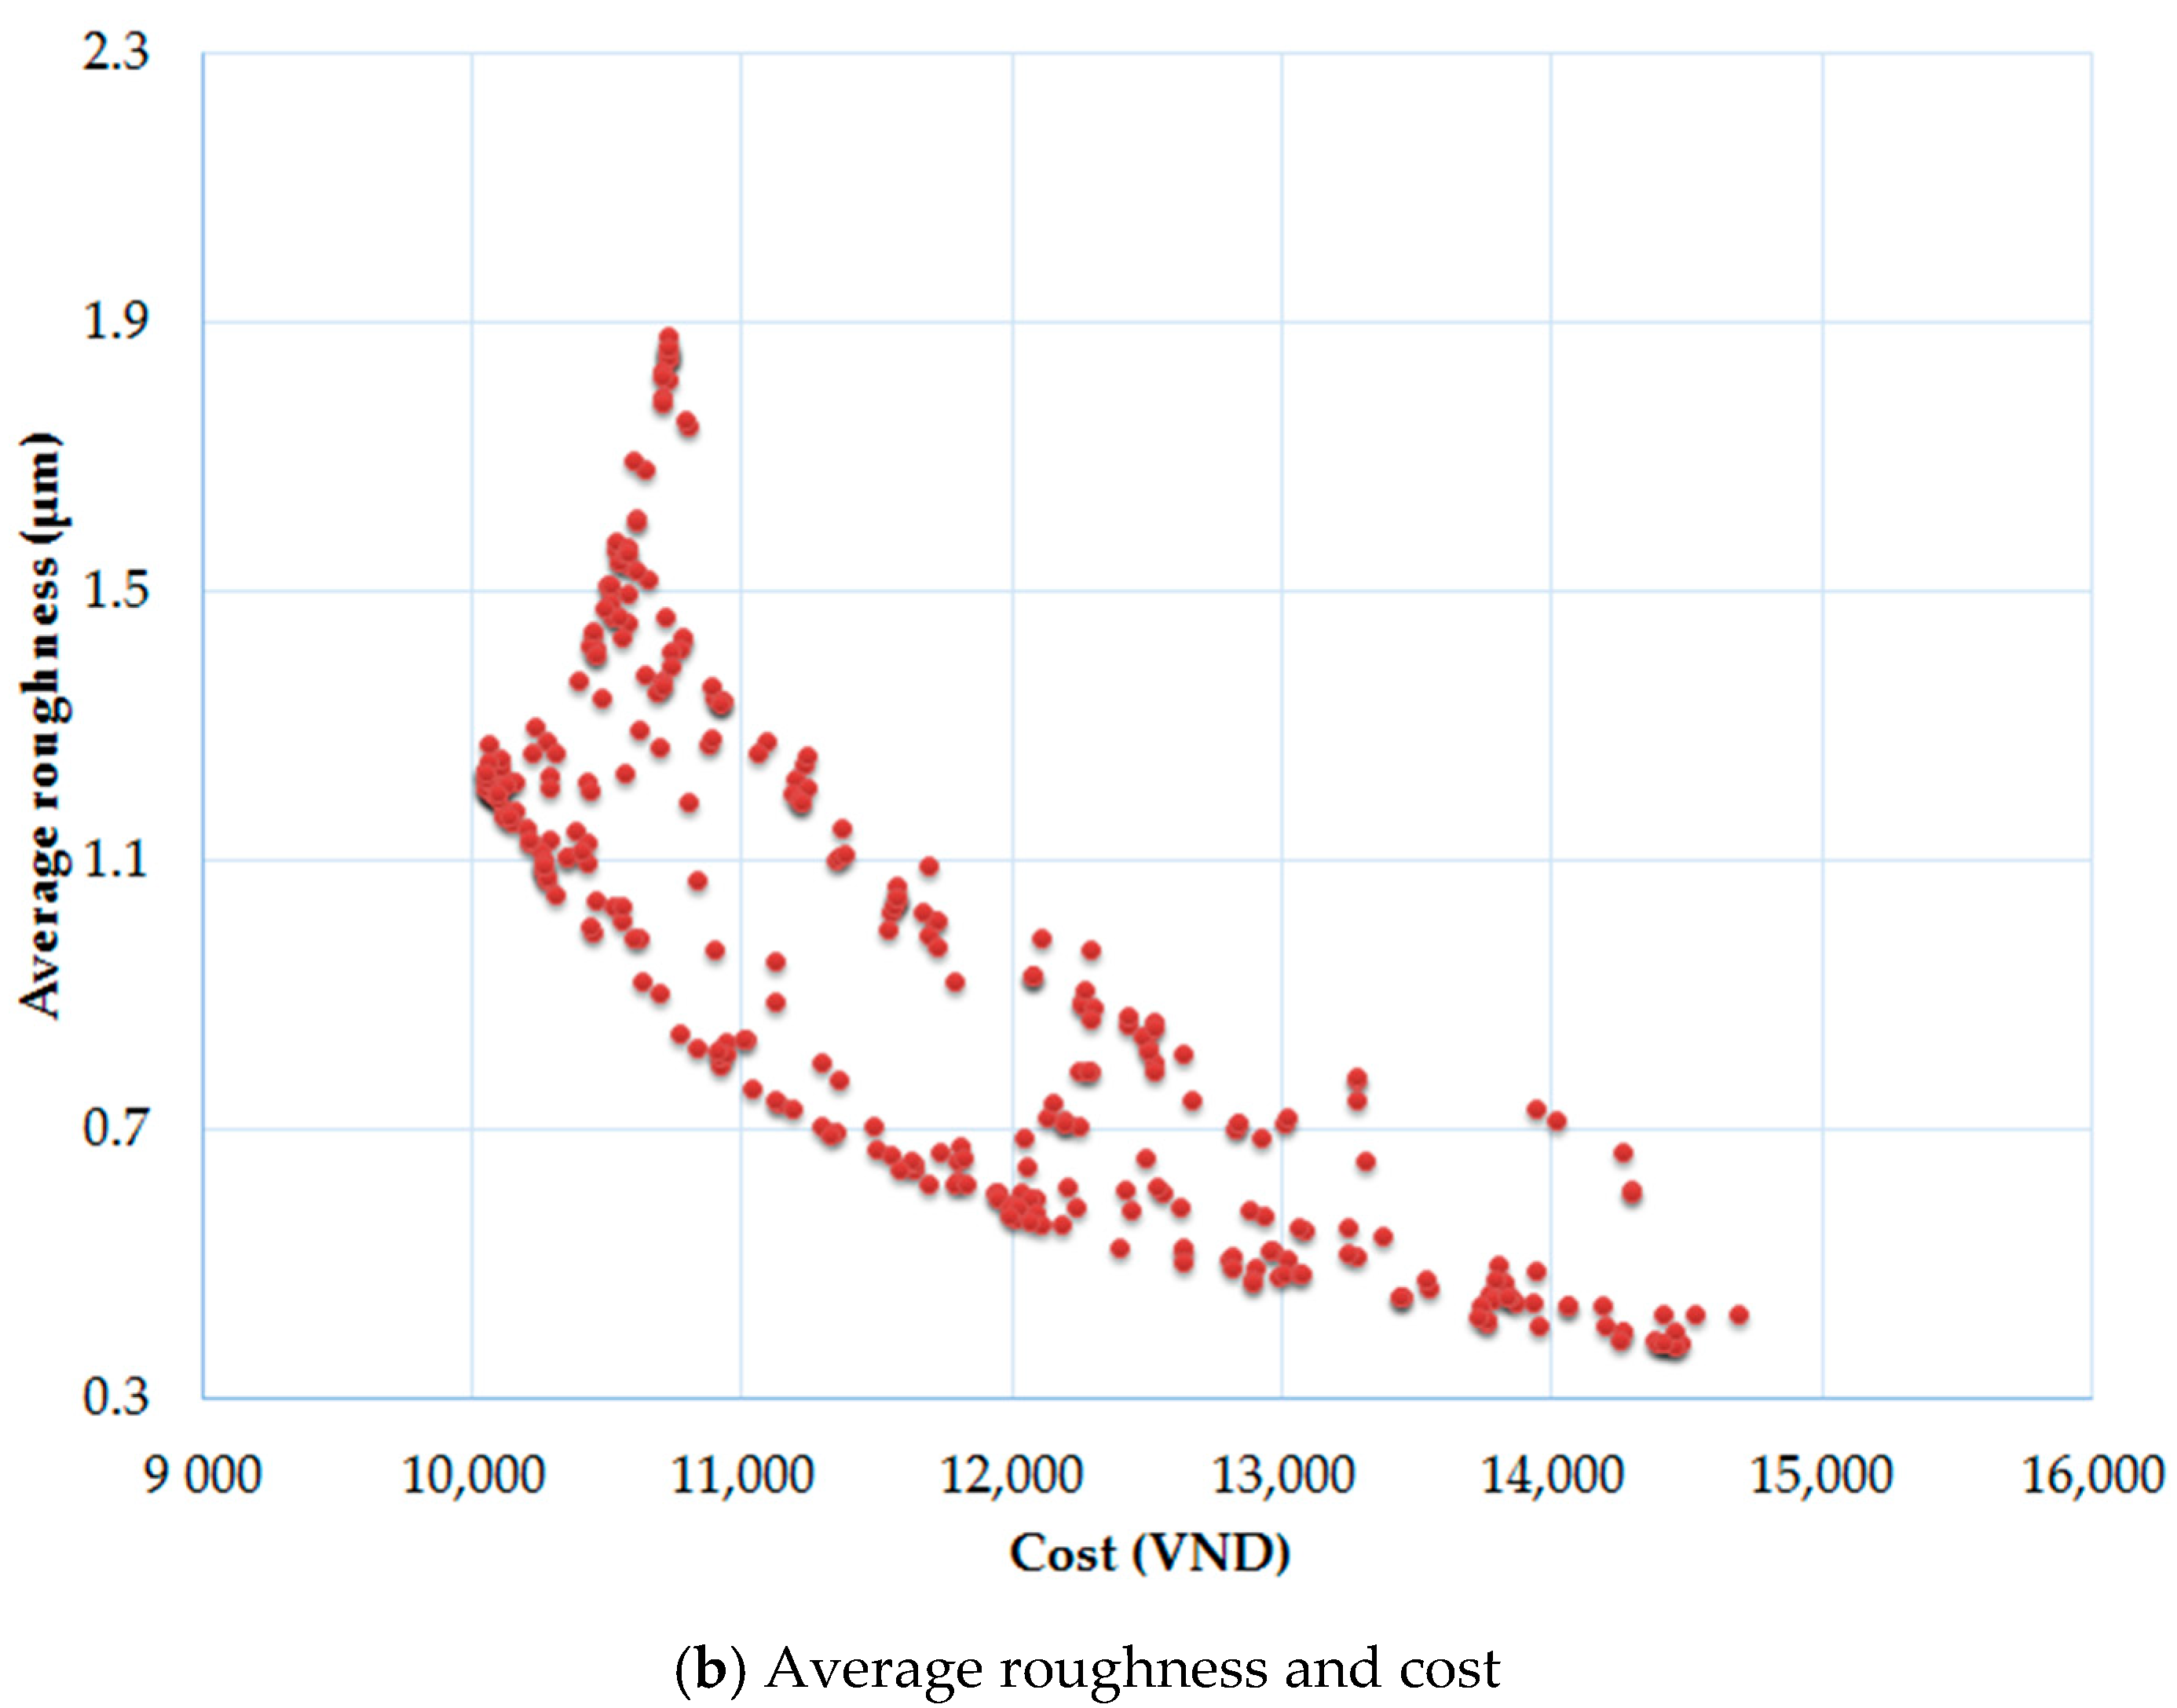
The Pareto fronts are shown in Figure 13. As a result, it is difficult to select the optimal solution, which can satisfy the optimization requirement. An increment in the energy efficiency leads to an increase in the average roughness. To decrease the average roughness, higher machining cost is required. Various optimal solutions are exhibited on the Pareto fronts, which can be used to satisfy different turning purposes. Three typical points, including points 1, 2, and 3 are selected to evaluate the turning performances and to compare with the initial values. As shown in Table 8, the average roughness increases at the first solution, which does not satisfy the optimization requirement. For the second point, the energy efficiency decreases, which cannot consider as a technical solution. For the third solution, the roughness and cost decrease while the energy efficiency improves. Consequently, the third point can be selected as a potential solution to enhance turning performances.
To evaluate the effectiveness of the NCGA, common optimization algorithms, including the Non dominated sorting genetic algorithm II (NSGA II) and Multiple objective particle swarm optimization (MOPSO) are adopted to select the optimal varied factors. As shown in Table 9, the optimal results generated by the NCGA are better than the MOPOSO and NSGA II. It can be stated that the NCGA can provide reliable outcomes when dealing with multi-objective optimization, as compared to the traditional ones.
The optimal values of the inclined angle, depth, feed, and speed are 26°, 0.44 mm, 0.37 mm/rev, and 200 m/min, respectively. Consequently, the improvements in energy efficiency, average roughness, and turning cots are 16.11% and 24.35%, and 17.45%, respectively.
4. Conclusions
This paper presented a machining parameter-based optimization for the rotary turning operation to achieve the improvements in energy efficiency, average roughness, turning costs, and operational safety. The predictive correlations were proposed in terms of the depth of cut, inclined angle, feed rate, and cutting speed with the aid of the improved Kriging models. ANOVA results were employed to identify the significances of the proposed models and parameters. The NCGA was used to obtain the optimal factors. The main conclusions are listed as follows:
- The highest values of the depth of cut, cutting speed, and feed rate can be used to enhance energy efficiency. The lowest values of the depth of cut and feed rate are recommended to decrease the roughness. The highest level of the cutting speed can be used to get a smoother surface. The middle values of the inclined angle can be applied to improve energy efficiency and roughness.
- The improved Kriging models have been constructed for different machining characteristics of the rotary turning operation. The statistical outcomes indicate that the established models for the machining responses have been found soundness and reliable. The improved Kriging correlations of the measured performances have shown an acceptable precision for the predictive purpose. The modeling technique can be considered as a powerful solution to depict the highly nonlinear approximations of the turning responses.
- For the energy efficiency model, the primary affecting factors are the feed, depth of cut, cutting speed, and inclined angle, respectively. For the average roughness model, the feed rate is the most effective parameter, followed by the speed, depth, and inclined angle.
- The optimum factors setting are the cutting speed of 200 m/min, a feed rate of 0.37 mm/rev, a depth of cut of 0.44 mm, and the inclined angle of 26°, respectively, which leads to the improvements in the turning responses. Energy efficiency is enhanced by 8.91%, while the average roughness and turning cost are decreased by 20.00% and 17.45%, respectively, as compared to the initial values.
- The NCGA may perform a better performance to select reliable results, as compared to the traditional algorithms, such as NSGA-II and MOPSO.
- The hybrid approach comprising the Taguchi method, improved Kriging model, and NCGA can widely apply for the optimization of the turning process instead of using the human experience and manual guide. The proposed method is easy to implement without a high computational effort.
- In this work, three technical performances, including energy efficiency, average roughness, and turning cost have been addressed. However, the impacts of the varied factors on the tool wear, reactive power, self-excited vibrations, and material removal rate have not been considered. A holistic approach of the rotary turning operation considering more objective will be analyzed on future works.
Author Contributions
Conceptualization, T.-T.N. and Q.-D.D.; methodology, T.-T.N. and M.M.; software, T.-T.N. and Q.-D.D.; validation, T.-T.N., Q.-D.D., and M.M.; data curation, T.-T.N. and Q.-D.D.; writing—original draft preparation, T.-T.N., Q.-D.D., and M.M.; writing—review and editing, T.-T.N., Q.-D.D., and M.M.; funding acquisition, T.-T.N. All authors have read and agreed to the published version of the manuscript.
Funding
This research is funded by Vietnam National Foundation for Science and Technology Development (NAFOSTED) under grant number 107.04-2020.02.
Conflicts of Interest
The authors declare no conflict of interest.
References
- Armarego, E.J.A.; Karri, V.; Smith, A.J.R. Fundamental studies of driven and self-propelled rotary tool cutting processes-I. Theoretical Investigation. Int. J. Mach. Tools Manuf. 1994, 34, 785–801. [Google Scholar] [CrossRef]
- Kishawy, H.A.; Wilcox, J. Tool wear and chip formation during hard turning with self-propelled rotary tools. Int. J. Mach. Tools Manuf. 2003, 43, 433–439. [Google Scholar] [CrossRef]
- Dessoly, V.; Melkote, S.N.; Lescalier, C. Modeling and verification of cutting tool temperatures in rotary tool turning of hardened steel. Int. J. Mach. Tools Manuf. 2004, 44, 1463–1470. [Google Scholar] [CrossRef]
- Kishawy, H.A.; Becze, C.E.; McIntosh, D.G. Tool performance and attainable surface quality during the machining of aerospace alloys using self-propelled rotary tools. J. Mater. Process. Technol. 2004, 152, 266–271. [Google Scholar] [CrossRef]
- Wang, S.H.; Zhu, X.; Li, X.; Turyagyenda, G. Prediction of cutting force for self-propelled rotary tool using artificial neural networks. J. Mater. Process. Technol. 2006, 180, 23–29. [Google Scholar]
- Li, L.; Kishawy, H.A. A model for cutting forces generated during machining with self-propelled rotary tools. Int. J. Mach. Tools. Manuf. 2006, 46, 1388–1394. [Google Scholar] [CrossRef]
- Ezugwu, E.O. Improvements in the machining of aero-engine alloys using self-propelled rotary tooling technique. J. Mater. Process. Technol. 2007, 185, 60–71. [Google Scholar] [CrossRef]
- Kishawy, H.A.; Pang, L.; Balazinski, M. Modeling of tool wear during hard turning with self-propelled rotary tools. Int. J. Mech. Sci. 2011, 53, 1015–1021. [Google Scholar] [CrossRef]
- Rao, T.B.; Krishna, A.G.; Katta, R.K.; Krishna, K.R. Modeling and multi-response optimization of machining performance while turning hardened steel with self-propelled rotary tool. Adv. Manuf. 2015, 3, 84–95. [Google Scholar] [CrossRef]
- Teimouri, R.; Amini, S.; Mohagheghian, N. Experimental study and empirical analysis on effect of ultrasonic vibration during rotary turning of aluminum 7075 aerospace alloy. J. Manuf. Process. 2017, 26, 1–2. [Google Scholar] [CrossRef]
- Lotfi, M.; Amini, S.; Aghaei, M. 3D FEM simulation of tool wear in ultrasonic assisted rotary turning. Ultrasonics 2018, 88, 106–114. [Google Scholar] [CrossRef]
- Sasahara, H.; Satake, K.; Takahashi, W.; Goto, W.; Yamamoto, H. The Effect of oil Mist Supply on Cutting Point Temperature and Tool Wear in Driven Rotary Cutting. Precis. Eng. 2017, 48, 158–163. [Google Scholar] [CrossRef]
- Deng, C.; Feng, Y.; Shu, J.; Huang, Z.; Tang, Q. Prediction of Tool Point Frequency Response Functions Within Machine Tool Work Volume Considering the Position and Feed Direction Dependence. Symmetry 2020, 12, 1073. [Google Scholar] [CrossRef]
- Jasiewicz, M.; Miądlicki, K. Implementation of an Algorithm to Prevent Chatter Vibration in a CNC System. Materials 2019, 12, 3193. [Google Scholar] [CrossRef] [Green Version]
- Lin, Y.-C.; Wu, K.-D.; Shih, W.-C.; Hsu, P.-K.; Hung, J.-P. Prediction of Surface Roughness Based on Cutting Parameters and Machining Vibration in End Milling Using Regression Method and Artificial Neural Network. Appl. Sci. 2020, 10, 3941. [Google Scholar] [CrossRef]
- Nguyen, T.-T.; Le, X.-B. Optimization of roller burnishing process using Kriging model to improve surface properties. Proceedings of the Institution of Mechanical Engineers. Part B J. Eng. Manuf. 2019, 233, 2264–2282. [Google Scholar] [CrossRef]
- Nguyen, T.; Duong, Q. Optimization of WEDM process of mould material using Kriging model to improve technological performances. Sādhanā 2019, 44, 154. [Google Scholar] [CrossRef] [Green Version]
- Nguyen, T.-T.; Tran, V.-T.; Mia, M. Multi-Response Optimization of Electrical Discharge Drilling Process of SS304 for Energy Efficiency, Product Quality, and Productivity. Materials 2020, 13, 2897. [Google Scholar] [CrossRef]
- Mia, M.; Gupta, M.K.; Dhar, N.R. Evolution of tool flank wear and its influence on machining characteristics in pressurized-oil jet assisted hard turning. J. Prod. Syst. Manuf. Sci. 2020, 1, 2. [Google Scholar]
- Kumar, S. Multi-response optimization of Ti-6Al-4V milling using AlCrN/TiAlN coated tool under cryogenic cooling. J. Prod. Syst. Manuf. Sci. 2020, 1, 4. [Google Scholar]
- Mia, M.; Gupta, M.K.; Pruncu, C.I.; Sen, B.; Khan, A.M.; Jamil, M.; Faraz, S.; Asef, F.; Imran, G.S.; Rahman, M.A. Six sigma optimization of multiple machining characteristics in hard turning under dry, flood, MQL and solid lubrication. J. Prod. Syst. Manuf. Sci. 2020, 1, 6. [Google Scholar]
- Khanna, N.; Airao, J.; Gupta, M.K.; Song, Q.; Liu, Z.; Mia, M.; Maruda, R.; Krolczyk, G. Optimization of Power Consumption Associated with Surface Roughness in Ultrasonic Assisted Turning of Nimonic-90 Using Hybrid Particle Swarm-Simplex Method. Materials 2019, 12, 3418. [Google Scholar] [CrossRef] [PubMed] [Green Version]
- Dhanalakshmi, S.; Rameshbabu, T. Multi-Aspects Optimization of Process Parameters in CNC Turning of LM 25 Alloy Using the Taguchi-Grey Approach. Metals 2020, 10, 453. [Google Scholar] [CrossRef] [Green Version]
- Su, Y.; Zhao, G.; Zhao, Y.; Meng, J.; Li, C. Multi-Objective Optimization of Cutting Parameters in Turning AISI 304 Austenitic Stainless Steel. Metals 2020, 10, 217. [Google Scholar] [CrossRef] [Green Version]
- Yim, J.W.; Lee, B.J.; Kim, C. Exploring multi-stage shape optimization strategy of multi-body geometries using Kriging-based model and adjoint method. Comput. Fluids 2017, 65, 71–87. [Google Scholar] [CrossRef]
- Wang, Z.; Sun, N.; Cao, L.; Yin, Z.; Wang, Y.; Yuan, J. Cutting performance and wear mechanism of spark plasma–sintered silicon nitride ceramics tool in dry turning of 41Cr4 hardened steel. Int. J. Adv. Manuf. Technol. 2020, 107, 3415–3424. [Google Scholar] [CrossRef]
- Nguyen, T.T.; Cao, L.H.; Dang, X.P.; Nguyen, T.A.; Trinh, Q.H. Multi-objective optimization of the flat burnishing process for energy efficiency and surface characteristics. Mater. Manuf. Process. 2019, 34, 1888–1901. [Google Scholar] [CrossRef]
- Nguyen, T.T.; Mia, M.; Dang, X.P.; Le, C.H.; Packianather, M.S. Green machining for the dry milling process of stainless steel 304. Proc. Inst. Mech. Eng. Part B J. Eng. Manuf. 2020, 234, 881–899. [Google Scholar] [CrossRef]
- Nguyen, T.T. Prediction and Optimization of Machining Energy, Surface roughness, and Production Rate in SKD61 Milling. Measurement 2019, 136, 525–544. [Google Scholar] [CrossRef]
Figure 1.
Sustainable aspects of the turning process.

Figure 2.
Systematic optimizing procedure.

Figure 3.
Operating procedure of the neighborhood cultivation genetic algorithm (NCGA).

Figure 4.
Experiments of the rotary turning.

Figure 5.
Measured responses at various experiments: (a) Power consumed at turning conditions: α = 16°, ap = 0.20 mm, f = 0.40 mm/rev, and vc = 150 m/min; (b) Power consumed at turning conditions: α = 40°, ap = 0.20 mm, f = 0.20 mm/rev, and vc = 200 m/min; (c) Average roughness at turning conditions: α = 28°, ap = 0.60 mm, f = 0.20 mm/rev, and vc = 100 m/min (replication 2); (d) Average roughness at turning conditions: α = 28°, ap = 0.40 mm, f = 0.20 mm/rev, and vc = 200 m/min (replication 2).

Figure 6.
Exploration of the adequacy of the improved Kriging models: (a) For energy efficiency model and (b) for average roughness model.
Figure 6.
Exploration of the adequacy of the improved Kriging models: (a) For energy efficiency model and (b) for average roughness model.

Figure 7.
Comparisons between the predicted and experimental values: (a) For energy efficiency model and (b) for average roughness model.
Figure 7.
Comparisons between the predicted and experimental values: (a) For energy efficiency model and (b) for average roughness model.

Figure 8.
The effects of the parameters on energy efficiency: (a) Energy efficiency versus the depth and angle; (b) Energy efficiency versus the feed and speed; and (c) Parametric contributions for energy efficiency model.
Figure 8.
The effects of the parameters on energy efficiency: (a) Energy efficiency versus the depth and angle; (b) Energy efficiency versus the feed and speed; and (c) Parametric contributions for energy efficiency model.

Figure 9.
The effects of the parameters on the average roughness: (a) The average roughness versus the depth and angle; (b) The average roughness versus the feed and speed; and (c) Parametric contributions for the average roughness model.
Figure 9.
The effects of the parameters on the average roughness: (a) The average roughness versus the depth and angle; (b) The average roughness versus the feed and speed; and (c) Parametric contributions for the average roughness model.

Figure 10.
SEM images at different process inputs: (a) Machined surface at turning conditions: α = 28°, ap = 0.20 mm, f = 0.20 mm/rev, and vc = 150 m/min and (b) Machined surface at turning conditions: α = 16°, ap = 0.40 mm, f = 0.40 mm/rev, and vc = 200 m/min.
Figure 10.
SEM images at different process inputs: (a) Machined surface at turning conditions: α = 28°, ap = 0.20 mm, f = 0.20 mm/rev, and vc = 150 m/min and (b) Machined surface at turning conditions: α = 16°, ap = 0.40 mm, f = 0.40 mm/rev, and vc = 200 m/min.

Figure 11.
SEM images at different process inputs: (a) SEM images of the round insert at turning conditions: α = 40°, ap = 0.40 mm, f = 0.40 mm/rev, and vc = 200 m/min and (b) SEM images of the round insert at turning conditions: α = 28°, ap = 0.60 mm, f = 0.60 mm/rev, and vc = 200 m/min.
Figure 11.
SEM images at different process inputs: (a) SEM images of the round insert at turning conditions: α = 40°, ap = 0.40 mm, f = 0.40 mm/rev, and vc = 200 m/min and (b) SEM images of the round insert at turning conditions: α = 28°, ap = 0.60 mm, f = 0.60 mm/rev, and vc = 200 m/min.

Figure 12.
3D plots between the turning performances: (a) 3D plot between average roughness, energy efficiency, and operational safety and (b) 3D plot between the average roughness, cost, and operational safety.
Figure 12.
3D plots between the turning performances: (a) 3D plot between average roughness, energy efficiency, and operational safety and (b) 3D plot between the average roughness, cost, and operational safety.

Figure 13.
Pareto fronts generated by NCGA: (a) Average roughness and energy efficiency and (b) Average roughness and cost.
Figure 13.
Pareto fronts generated by NCGA: (a) Average roughness and energy efficiency and (b) Average roughness and cost.


Table 1.
Process parameters and their ranges.
| Inclined Angle α (°) | Depth of Cut ap (mm) | Feed Rate f (mm/rev) | Cutting Speed vc (m/min) |
|---|---|---|---|
| 16 | 0.2 | 0.2 | 100 |
| 28 | 0.4 | 0.4 | 150 |
| 40 | 0.6 | 0.6 | 200 |
Table 2.
Chemical compositions of hardened 40XC [26].
Table 2.
Chemical compositions of hardened 40XC [26].
| C (%) | Mn (%) | P (%) | S (%) | Si (%) | Cr (%) |
|---|---|---|---|---|---|
| 0.41 | 0.6 | 0.035 | 0.035 | 0.26 | 0.9 |
Table 3.
Coefficients for the cost model.
| L | x | xe | Po | Pst | Pair | To | Tst | Tair | Tch | yc | α | β | c | k |
|---|---|---|---|---|---|---|---|---|---|---|---|---|---|---|
| mm | VND/s | VND/ kWh | kW | kW | kW | s | s | s | s | VND/ Piece | ||||
| 26 | 1397.90 | 1536 | 0.33 | 0.58 | 0.84 | 1.8 | 1 | 1 | 1.5 | 60,000 | 2 | 1 | 900 | 1.3 |
Table 4.
Experimental data of the rotary turning.
| No. | α (°) | ap (mm) | f (mm/rev) | vc (m/min) | EFR (%) | Ra (µm) | CT (VND) |
|---|---|---|---|---|---|---|---|
| Experimental data for generating improved Kriging models | |||||||
| 1 | 16 | 0.20 | 0.20 | 100 | 13.23 | 1.37 | 33,402.26 |
| 2 | 16 | 0.20 | 0.40 | 150 | 18.49 | 1.21 | 13,633.23 |
| 3 | 16 | 0.20 | 0.60 | 200 | 22.96 | 1.41 | 10,049.97 |
| 4 | 28 | 0.20 | 0.20 | 150 | 19.53 | 0.67 | 19,473.74 |
| 5 | 28 | 0.20 | 0.40 | 200 | 24.62 | 0.75 | 11,172.60 |
| 6 | 28 | 0.20 | 0.60 | 100 | 22.38 | 1.93 | 16,321.23 |
| 7 | 40 | 0.20 | 0.20 | 200 | 19.06 | 0.99 | 14,540.49 |
| 8 | 40 | 0.20 | 0.40 | 100 | 17.37 | 1.98 | 20,591.49 |
| 9 | 40 | 0.20 | 0.60 | 150 | 22.14 | 2.02 | 11,686.39 |
| 10 | 16 | 0.40 | 0.20 | 150 | 19.34 | 0.98 | 19,821.58 |
| 11 | 16 | 0.40 | 0.40 | 200 | 24.55 | 1.08 | 11,520.44 |
| 12 | 16 | 0.40 | 0.60 | 100 | 22.15 | 2.26 | 16,669.07 |
| 13 | 28 | 0.40 | 0.20 | 200 | 25.45 | 0.61 | 14,888.33 |
| 14 | 28 | 0.40 | 0.40 | 100 | 23.61 | 1.59 | 20,939.33 |
| 15 | 28 | 0.40 | 0.60 | 150 | 28.50 | 1.62 | 12,034.23 |
| 16 | 40 | 0.40 | 0.20 | 100 | 17.83 | 1.81 | 33,750.10 |
| 17 | 40 | 0.40 | 0.40 | 150 | 23.35 | 1.71 | 13,981.07 |
| 18 | 40 | 0.40 | 0.60 | 200 | 28.07 | 2.07 | 10,397.81 |
| 19 | 16 | 0.60 | 0.20 | 200 | 23.38 | 1.22 | 15,236.16 |
| 20 | 16 | 0.60 | 0.40 | 100 | 21.37 | 2.19 | 21,287.17 |
| 21 | 16 | 0.60 | 0.60 | 150 | 26.38 | 2.23 | 12,382.07 |
| 22 | 28 | 0.60 | 0.20 | 100 | 22.07 | 1.68 | 34,097.94 |
| 23 | 28 | 0.60 | 0.40 | 150 | 27.70 | 1.61 | 14,328.91 |
| 24 | 28 | 0.60 | 0.60 | 200 | 32.54 | 1.89 | 10,745.65 |
| 25 | 40 | 0.60 | 0.20 | 150 | 21.79 | 1.86 | 20,169.42 |
| 26 | 40 | 0.60 | 0.40 | 200 | 27.26 | 2.04 | 11,868.28 |
| 27 | 40 | 0.60 | 0.60 | 100 | 24.42 | 2.96 | 17,016.91 |
| Experimental data for testing the accuracy of improved Kriging models | |||||||
| 28 | 30 | 0.30 | 0.30 | 150 | 23.18 | 0.92 | 15,753.99 |
| 29 | 30 | 0.40 | 0.40 | 100 | 23.59 | 1.62 | 20,939.33 |
| 30 | 35 | 0.50 | 0.40 | 150 | 26.32 | 1.58 | 14,154.99 |
| 31 | 40 | 0.60 | 0.30 | 140 | 22.84 | 2.06 | 17,380.61 |
| 32 | 25 | 0.40 | 0.50 | 200 | 29.35 | 1.13 | 10,846.86 |
| 33 | 25 | 0.30 | 0.40 | 100 | 21.76 | 1.48 | 20,765.41 |
Table 5.
Analysis of variance (ANOVA) results for energy efficiency model.
| Source | Sum of Squares | Mean Square | F-Value | p-Value | Contribution (%) | Remark |
|---|---|---|---|---|---|---|
| Model | 290.4524 | 20.7466 | 37.2805 | <0.0001 | ||
| α | 9.5041 | 9.5041 | 17.0783 | 0.0021 | 3.93 | Significant |
| ap | 47.3269 | 47.3269 | 85.0438 | <0.0001 | 19.57 | Significant |
| f | 48.0524 | 48.0524 | 86.3475 | <0.0001 | 19.87 | Significant |
| vc | 43.6511 | 43.6511 | 78.4386 | <0.0001 | 18.05 | Significant |
| αap | 2.4667 | 2.4667 | 4.4325 | 0.0096 | 1.02 | Significant |
| αf | 0.0000 | 0.0000 | 0.0000 | 1.0000 | 0 | In significant |
| αvc | 0.8590 | 0.8590 | 1.5436 | 0.8343 | 0.36 | In significant |
| apf | 0.4521 | 0.4521 | 0.8124 | 0.9123 | 0.19 | In significant |
| apvc | 2.4865 | 2.4865 | 4.4681 | 0.0084 | 1.03 | Significant |
| fvc | 0.4069 | 0.4069 | 0.7312 | 0.9210 | 0.17 | In significant |
| α2 | 59.9628 | 59.9628 | 107.7499 | <0.0001 | 24.80 | Significant |
| ap2 | 19.0930 | 19.0930 | 34.3091 | 0.0011 | 7.90 | Significant |
| f2 | 5.4401 | 5.4401 | 9.7756 | 0.0062 | 2.25 | Significant |
| vc2 | 2.1399 | 2.1399 | 3.8453 | 0.0105 | 0.88 | Significant |
| Residual | 5.5651 | 0.5565 | ||||
| Cor Total | 296.0175 |
R2 = 0.9812; Adjusted R2 = 0.9632; Predicted R2 = 0.9526.
Table 6.
ANOVA results for the average roughness model.
| Source | Sum of Squares | Mean Square | F-Value | p-Value | Contribution (%) | Remark |
|---|---|---|---|---|---|---|
| Model | 5.1589 | 0.3685 | 42.3555 | <0.0001 | Significant | |
| α | 0.4987 | 0.4987 | 57.3218 | <0.0001 | 9.44 | Significant |
| ap | 0.7762 | 0.7762 | 89.2184 | <0.0001 | 14.70 | Significant |
| f | 1.0386 | 1.0386 | 119.3793 | <0.0001 | 19.66 | Significant |
| vc | 0.8435 | 0.8435 | 96.9540 | <0.0001 | 15.97 | Significant |
| αap | 0.0520 | 0.0520 | 5.9770 | 0.2308 | 0.99 | In significant |
| αf | 0.0325 | 0.0325 | 3.7356 | 0.4436 | 0.62 | In significant |
| αvc | 0.0846 | 0.0846 | 9.7241 | 0.0649 | 1.60 | In significant |
| apf | 0.0065 | 0.0065 | 0.7471 | 0.8764 | 0.12 | In significant |
| apvc | 0.0976 | 0.0976 | 11.2184 | 0.0378 | 1.85 | Significant |
| fvc | 0.0327 | 0.0327 | 3.7586 | 0.4436 | 0.62 | In significant |
| α2 | 0.9573 | 0.9573 | 110.0345 | <0.0001 | 18.12 | Significant |
| ap2 | 0.3914 | 0.3914 | 44.9885 | <0.0001 | 7.41 | Significant |
| f2 | 0.1800 | 0.1800 | 20.6897 | 0.0041 | 3.41 | Significant |
| vc2 | 0.2905 | 0.2905 | 33.3908 | 0.0001 | 5.50 | Significant |
| Residual | 0.0871 | 0.0087 | ||||
| Cor Total | 5.2460 |
R2 = 0.9834; Adjusted R2 = 0.9664; Predicted R2 = 0.9552.
Table 7.
Setting parameters of the NCGA.
| Parameter | Value/Function |
|---|---|
| Population size | 24 |
| Number of generations | 44 |
| Crossover type | 1 |
| Crossover rate | 1 |
| Mutation rate | 0.01 |
| Gene size | 40 |
Table 8.
The results for multi-response optimization.
| Method | α (°) | ap (mm) | f (mm/rev) | vc (m/min) | EFR (%) | Ra (µm) | CT (VND) |
|---|---|---|---|---|---|---|---|
| Initial values | 28 | 0.40 | 0.40 | 150 | 26.14 | 1.15 | 13,981.32 |
| Point 1 | 28 | 0.60 | 0.60 | 200 | 32.52 | 1.89 | 10,737.21 |
| Point 2 | 24 | 0.20 | 0.24 | 200 | 21.85 | 0.42 | 13,528.24 |
| Point 3 | 26 | 0.44 | 0.37 | 200 | 28.47 | 0.92 | 11,541.16 |
| Improvement (%) | 8.91 | −20.00 | −17.45 |
Table 9.
Comparison of optimal results generated by different algorithms.
| Method | α (°) | ap (mm) | f (mm/rev) | vc (m/min) | EFR (%) | Ra (µm) | CT (VND) |
|---|---|---|---|---|---|---|---|
| IK-NCGA | 26 | 0.44 | 0.37 | 200 | 28.47 | 0.92 | 11,541.16 |
| IK-MOPSO | 27 | 0.31 | 0.46 | 200 | 27.78 | 0.94 | 11,875.25 |
| IK-NSGA II | 25 | 0.40 | 0.40 | 189 | 27.75 | 0.93 | 11,868.61 |
© 2020 by the authors. Licensee MDPI, Basel, Switzerland. This article is an open access article distributed under the terms and conditions of the Creative Commons Attribution (CC BY) license (http://creativecommons.org/licenses/by/4.0/).
Share and Cite
MDPI and ACS Style
Nguyen, T.-T.; Duong, Q.-D.; Mia, M. Sustainability-Based Optimization of the Rotary Turning of the Hardened Steel. Metals 2020, 10, 939. https://0-doi-org.brum.beds.ac.uk/10.3390/met10070939
AMA Style
Nguyen T-T, Duong Q-D, Mia M. Sustainability-Based Optimization of the Rotary Turning of the Hardened Steel. Metals. 2020; 10(7):939. https://0-doi-org.brum.beds.ac.uk/10.3390/met10070939
Chicago/Turabian StyleNguyen, Trung-Thanh, Quoc-Dung Duong, and Mozammel Mia. 2020. "Sustainability-Based Optimization of the Rotary Turning of the Hardened Steel" Metals 10, no. 7: 939. https://0-doi-org.brum.beds.ac.uk/10.3390/met10070939
Note that from the first issue of 2016, this journal uses article numbers instead of page numbers. See further details here.