1. Introduction
Pipelines are important structures for transporting and distributing liquid or gaseous products. In the transportation of oils and gases, structural failure concerns the loss of containment, that is, the release of the product transported through the pipe. Releases of a transported product may affect surrounding populations, properties, and the environment, resulting in injury or death as well as material damage to property and to the environment.
The reliable and safe operation is highly dependent on maintaining the structural integrity of the pipeline. Defects that could compromise the safety, can be introduced into the pipeline at any point throughout its life cycle, including the pipe manufacturing process, construction, and operation.
Among the different types of pipeline damage, dents are dangerous yet frequent forms of mechanical damage that are commonly associated with a loss of integrity. A dent is defined as a gross distortion of the pipe cross-section and may be caused by the impact of external elements such as construction equipment during the pipeline construction and operation, resulting in severe plastic deformation of the pipe wall.
The presence of a dent causes a local reduction in the diameter of the pipe, and consequently, strain and stress concentrations are introduced. Dents affect the pipeline’s load-bearing capacity and reduce its operating life [
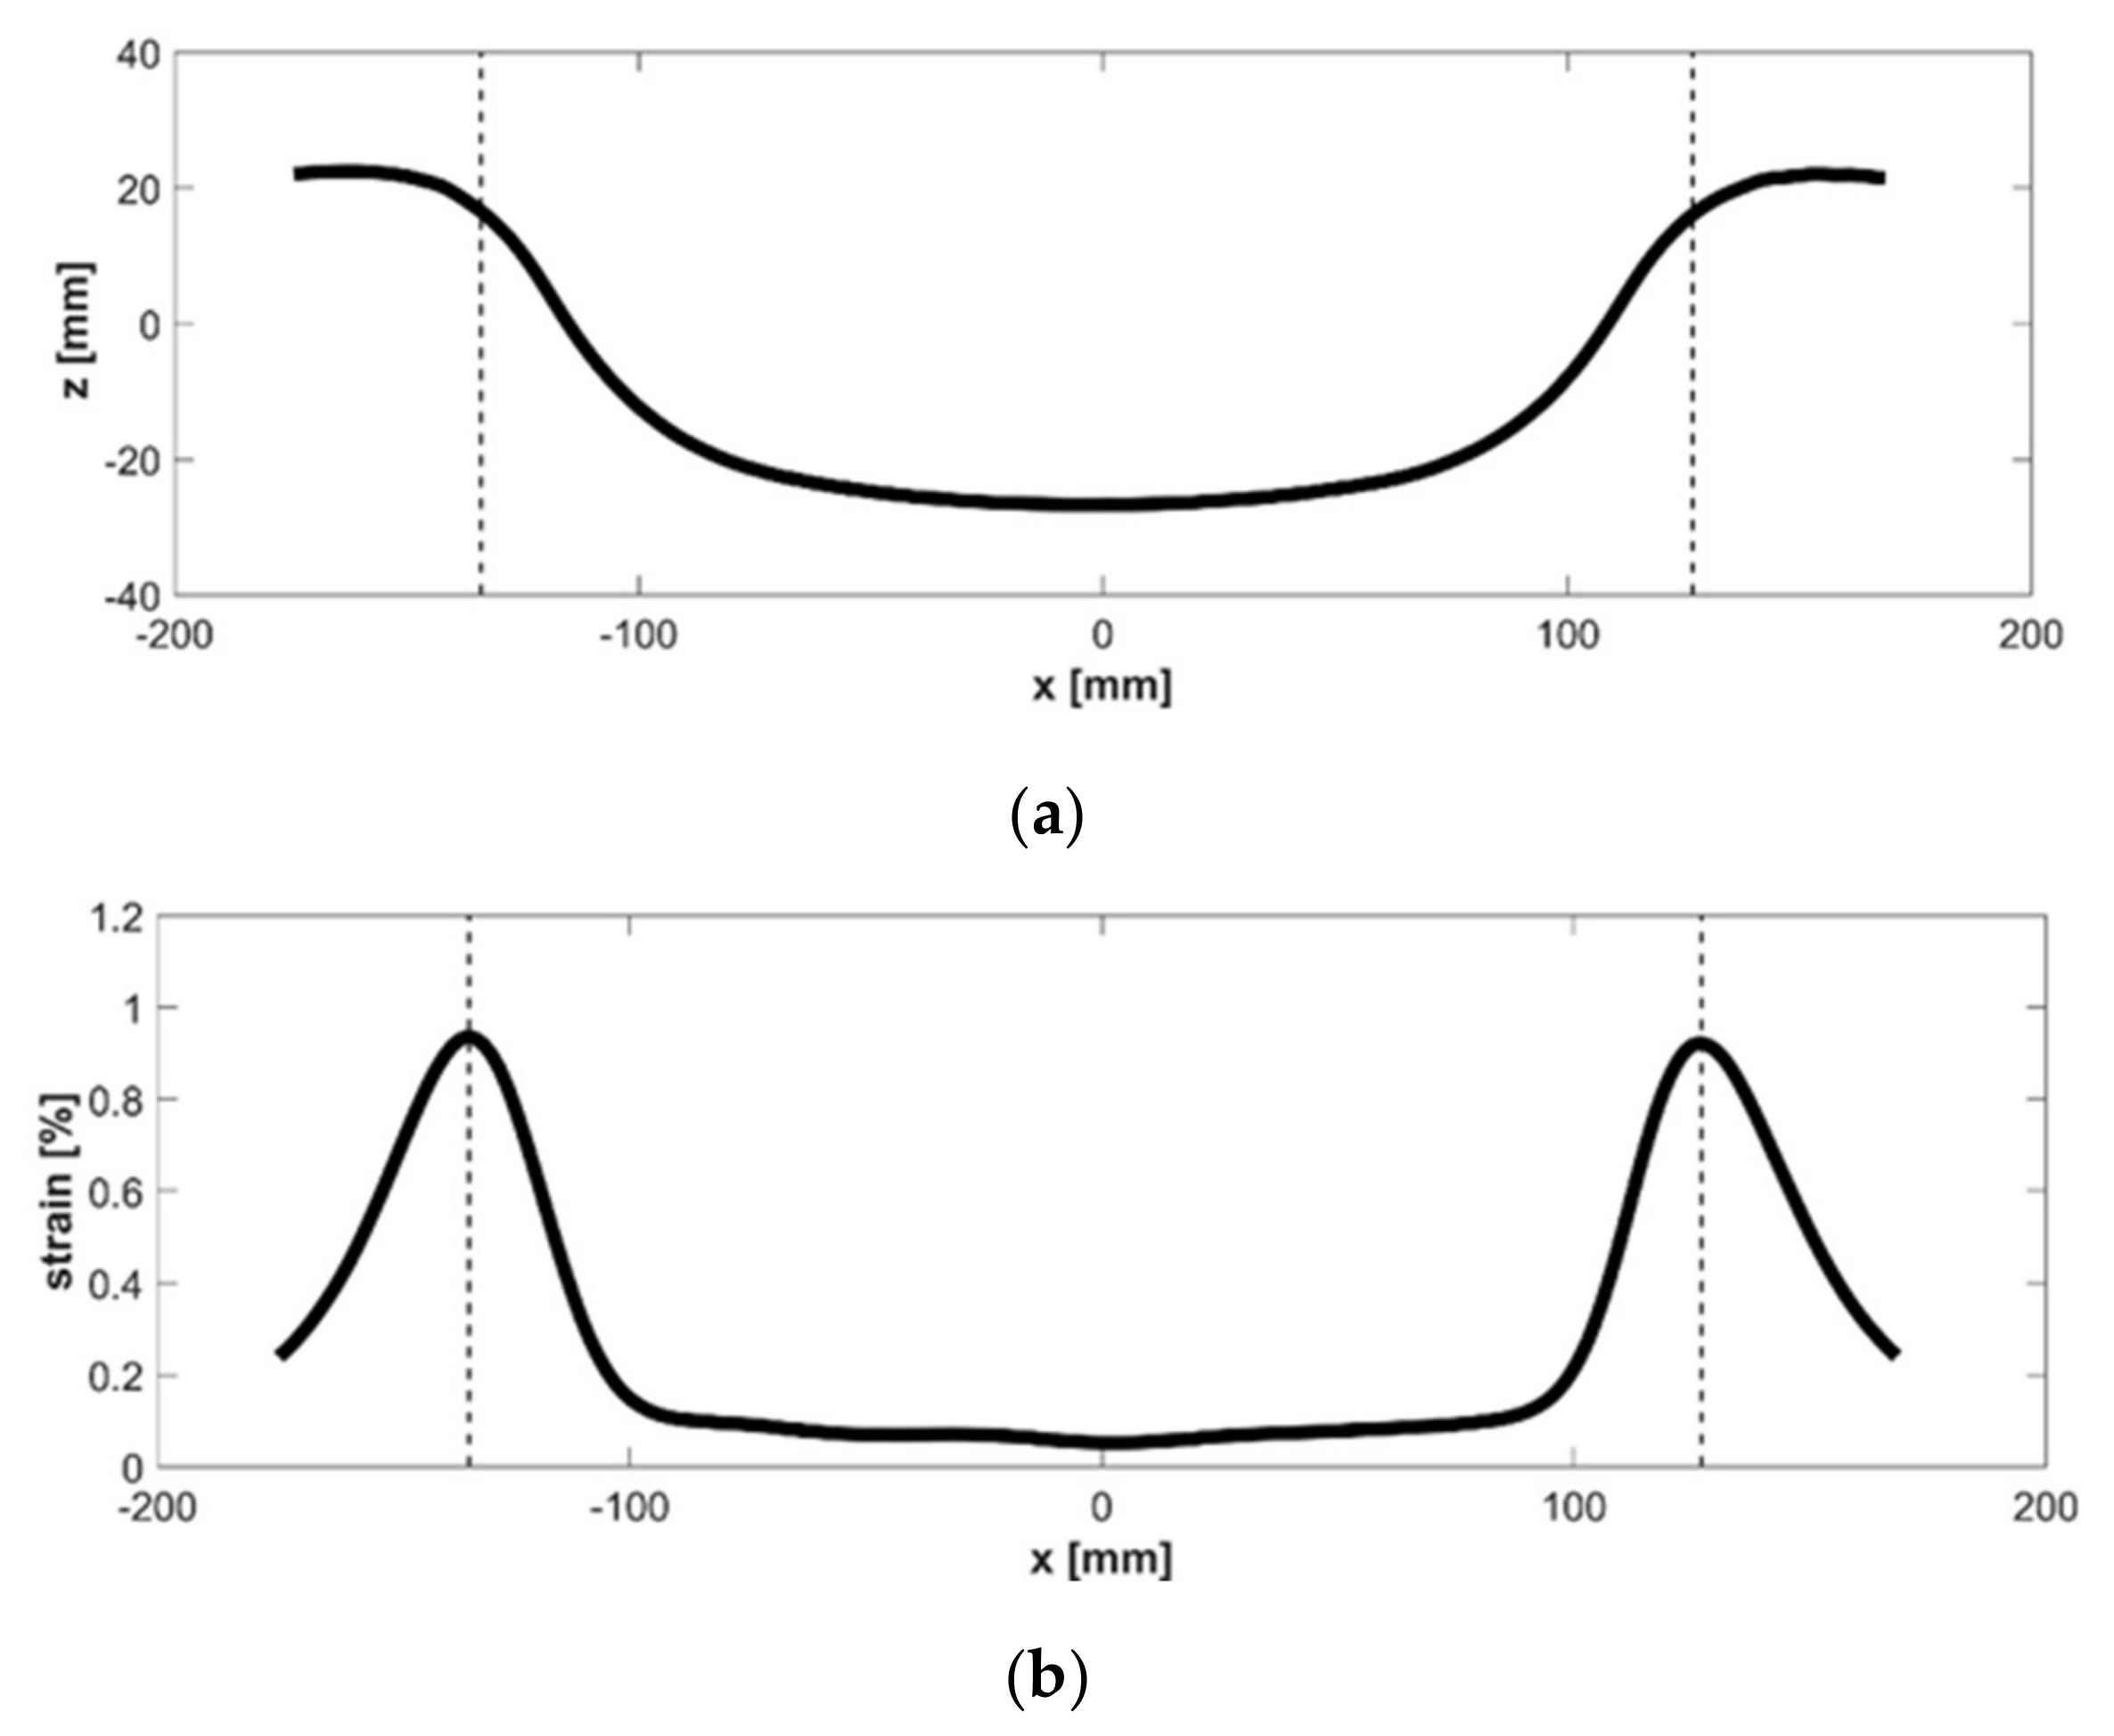
1]. The shape of the dent is a very important factor that influences the fatigue life of the pipeline, since fatigue cracks tend to start at points of strain or stress concentration. Consequently, ascertaining the strain distribution induced by the introduction of a dent plays an important role for determining the structural integrity and safety of the pipeline.
The fatigue behavior of pipeline specimens with dents under cyclic internal pressure loading, with and without restriction constraints to free deformation, have been studied by different researchers (e.g., see [
1,
2,
3,
4,
5,
6,
7,
8,
9]). Although dent depth criteria are the most frequently used in the industry for their ease of application, the determination of cyclic strains operating on the dent hot spots are needed to enhance the accuracy of fatigue life predictions. Moreover, fatigue test results are related to dented specimens tested under internal cyclic pressure loading where the dent areas have no deformation restrictions, such as those imposed by soil contact for buried specimens or by local repair reinforcements.
The present investigation encompassed the fatigue testing of thirty-three full-scale dented steel pipeline specimens divided into three groups. One group comprised nine dented specimens tested in air (no restrictions to the free dent deformation). A second group comprised eight dented specimens tested while buried in soil. The third group was composed of sixteen dented specimens repaired with composite material reinforcement layers that had been tested in air. The aim of this work is to present the results achieved for the group of buried specimens and the group comprising the repaired dents, briefly mentioning the results of the specimens tested in air for comparison purposes.
More explicitly, the paper has the objectives of:
presenting the fatigue test results of dented specimens under similar conditions to those in-the-air test, with the difference that those tests were fully completed while the specimens were buried, simulating the same conditions as a real buried pipeline;
presenting the fatigue test results of dented specimens under similar conditions to those in-the-air test, with the difference that those tests were fully completed after the dent area specimens had been repaired, simulating the same conditions as a real repaired pipeline;
determining circumferential strains operating at the instrumented hot-spot locations in order to establish the soil or repair influences;
using two experimental techniques–Fiber Optic Bragg Strain Gauges (FBSG) and Digital Image Correlation (DIC)—to determine strains at the hot spots to be combined to a strain-life approach proposed by Manson-Coffin in order to estimate the fatigue lives of the dented specimens.
2. Experimental Campaign
The results achieved for the nine non-buried specimens tested in air conditions were fully analyzed and presented in previous publications (e.g., [
10,
11,
12]). They were loaded with hydrostatic internal pressure pulsating at a 1 Hz rate. Six specimens had 15% deep longitudinal smooth dents (ratio between dent depth and outside specimen diameter) and three specimens had complex longitudinal 6% deep-dent shapes. Nominal and hot-spot stresses and strains were determined by experimental techniques (Fiber Optic Bragg Strain Gauges—FBSG, and Digital Image Correlation—DIC) and by a numerical technique (Finite Elements—FE). The stresses and strain fields determined from nominal loading conditions or from experimental measurements and from the finite element analyses were combined with different fatigue assessment methods. The estimated lives were compared with the actual test results. The fatigue assessment methods encompassed those proposed by [
1] and by the API 579-1/ASME FFS-1 Level 2 et al. [
13] methods described in its parts 12 (Dents) and 14 (Fatigue). Most of the predicted lives using these methods exhibited high level of conservatism. A Level 3 method that employed experimentally and numerically determined hot-spot strains in conjunction with a fatigue strain-life equation proposed by Manson-Coffin predicted fatigue lives very close to the test results [
11,
12]. Eight out of nine test results are reported in
Section 3. Those eight specimens were loaded in fatigue tests with constant pressure amplitude. It is out of the scope of this paper to present results for the ninth specimen due to the variable pressure amplitude applied. A separate article presents the results for this specimen [
10].
The tests carried out with this second group of buried specimens were divided into two test phases. The first test phase was performed prior to the dented specimens being buried. During this phase, the specimens were freely placed (not buried) in the laboratory and loaded with five hydrostatic internal pressure cycles so that hot-spot cyclic strain amplitudes in the dent area and at nominal locations could be measured by using DIC and FBSG. The full-field measurements were taken using DIC to identify strain concentration sites that could be potential locations or hot spots for fatigue cracks to start to form. Fiber Optic Strain Gauges were bonded close to these point-locations and the resultant strain measurements were compared with the DIC results. The second test phase encompassed long-life fatigue tests. For these tests, the specimens were buried and cyclic pressure-loaded. The fiber gauges were used to measure the hot-spot strains and to monitor any possible influence that could be caused by the soil coverage restricting the free deformation occurring in the dented areas. The results obtained for the buried specimens have also been analyzed and presented in a previous publication (e.g., [
14]).
For the third group of specimens, the tests performed in the present investigation used composite material repairs applied by three different suppliers. The repair systems were composed by epoxy or polyurethane matrices reinforced with carbon or glass fibers. The composite repairs are referred here as Supplier 1 and Supplier 2 for fiberglass repairs and Supplier 3 for carbon fiber repairs.
Similar to the tests of the buried specimens, the tests with the repaired specimens were performed in two phases. The first phase had been performed prior to repairing the dents specimens. They consisted of loading the specimens with five hydrostatic internal pressure cycles so that hot-spot cyclic strain amplitudes in the dent area could be measured by the DIC and FBSG techniques simultaneously. In the second phase, the specimens were repaired with the composite material sleeves and then cyclic pressurized. During this test phase only the optical fiber gauges bonded to the hot-spot sites were used to determine the strains operating.
All 3 m long pipeline test specimens (324 mm external diameter and 6.35 mm thickness) were cut from the same batch of 12 m long API-5L grade B ERW carbon steel pipes. The pipe mechanical material properties such as the specified nominal minimum yield and the ultimate material strengths were, respectively, equal to SMYS = 245 MPa and SMUS = 415 MPa. The actual engineering yield and ultimate material strengths were measured as being Sye = 316 MPa and Sue = 420 MPa, respectively. The true ultimate material strength was determined to be Su = 500 MPa.
The dents were generated using forceful contact by an indenter element on the external wall of the pipe in a 500 kN servo-hydraulic test machine, causing a 46% ratio (dent depth/pipe external diameter) change in diameter after the indenter was removed. Next, 64-mm thick plain head plates were welded to the pipe specimens and these were hydrostatically pressurized to produce a partial dent recovery. The applied re-round pressure was calculated to produce a nominal circumferential stress equal to 0.68
SMYS, which is equivalent to an internal pressure equal to 6.5 MPa. The re-round pressure forced a partial dent recovery so that the final dent depth ratio became 15%. Details of the indentation tests and hydrostatic recovery tests are presented in [
12].
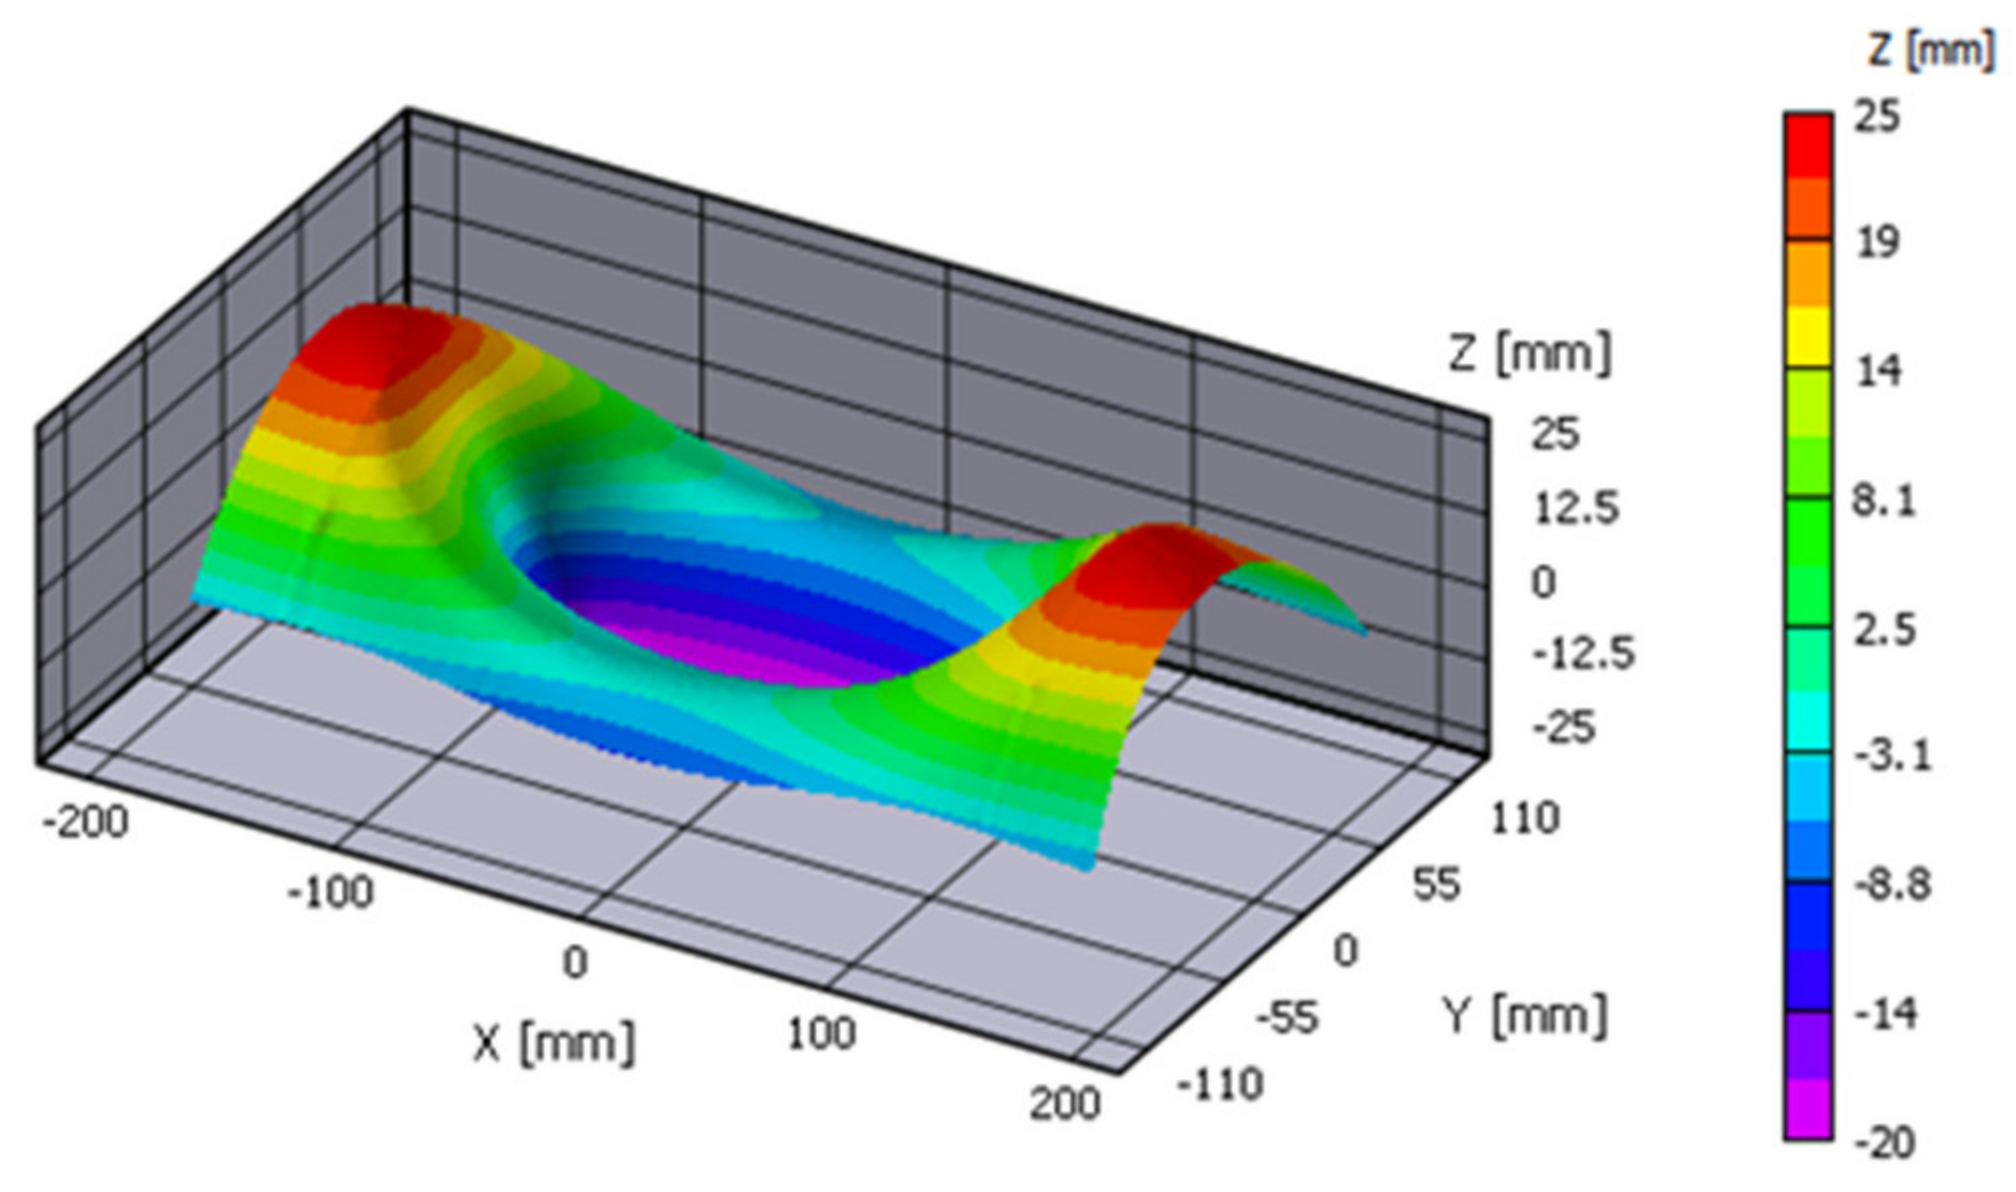
DIC is currently the most popular and effective optical technique used in experimental mechanics to measure displacement and strain distribution on the surface of stressed components [
15]. The DIC technique is a well-established method for measuring in-plane displacements and strains by using tracking and image registration techniques. DIC analysis provides full-field strain distributions to characterize the mechanical behavior and to identify any critical points on the structure. In essence, the DIC technique compares (or correlates) digital images of the material’s surface between its non-deformed and deformed state. Generally, the image acquired in the unloaded stage is called the reference image. The specimens’ dented areas were prepared according to DIC standard requirements [
16]. To do so, the area of interest was first coated with a thin layer of a black paint, and then white dots were added manually, as shown in
Figure 1.
The DIC experimental test setup consisted of a stereoscopic vision system composed of two 5 megapixel CCD cameras GRAS-50S5M Point Grey (FLIR-Grasshopper, Wilsonville, OR, USA) mounted on a tripod. The cameras were fitted with adjustable focal length lenses A031 AF28-200 mm F/3.8-5.6 (Tamron, Saitama, Japan). A lighting system was used in order to obtain homogeneous illumination in the region of the specimen to be analyzed. Before testing, the stereoscopic system was calibrated to allow for 3D-DIC analysis in order to retrieve three-dimensional strains and displacements on the surface of the dented pipe. The 3D-DIC system used in this study was the commercially available VIC-3D model developed by Correlated Solutions et al. [
17]. The experimental tests were carried out in the laboratory prepared for such tests in the facilities of the CTDUT (Center of Technology in Pipelines). The experimental setup is shown in
Figure 2.
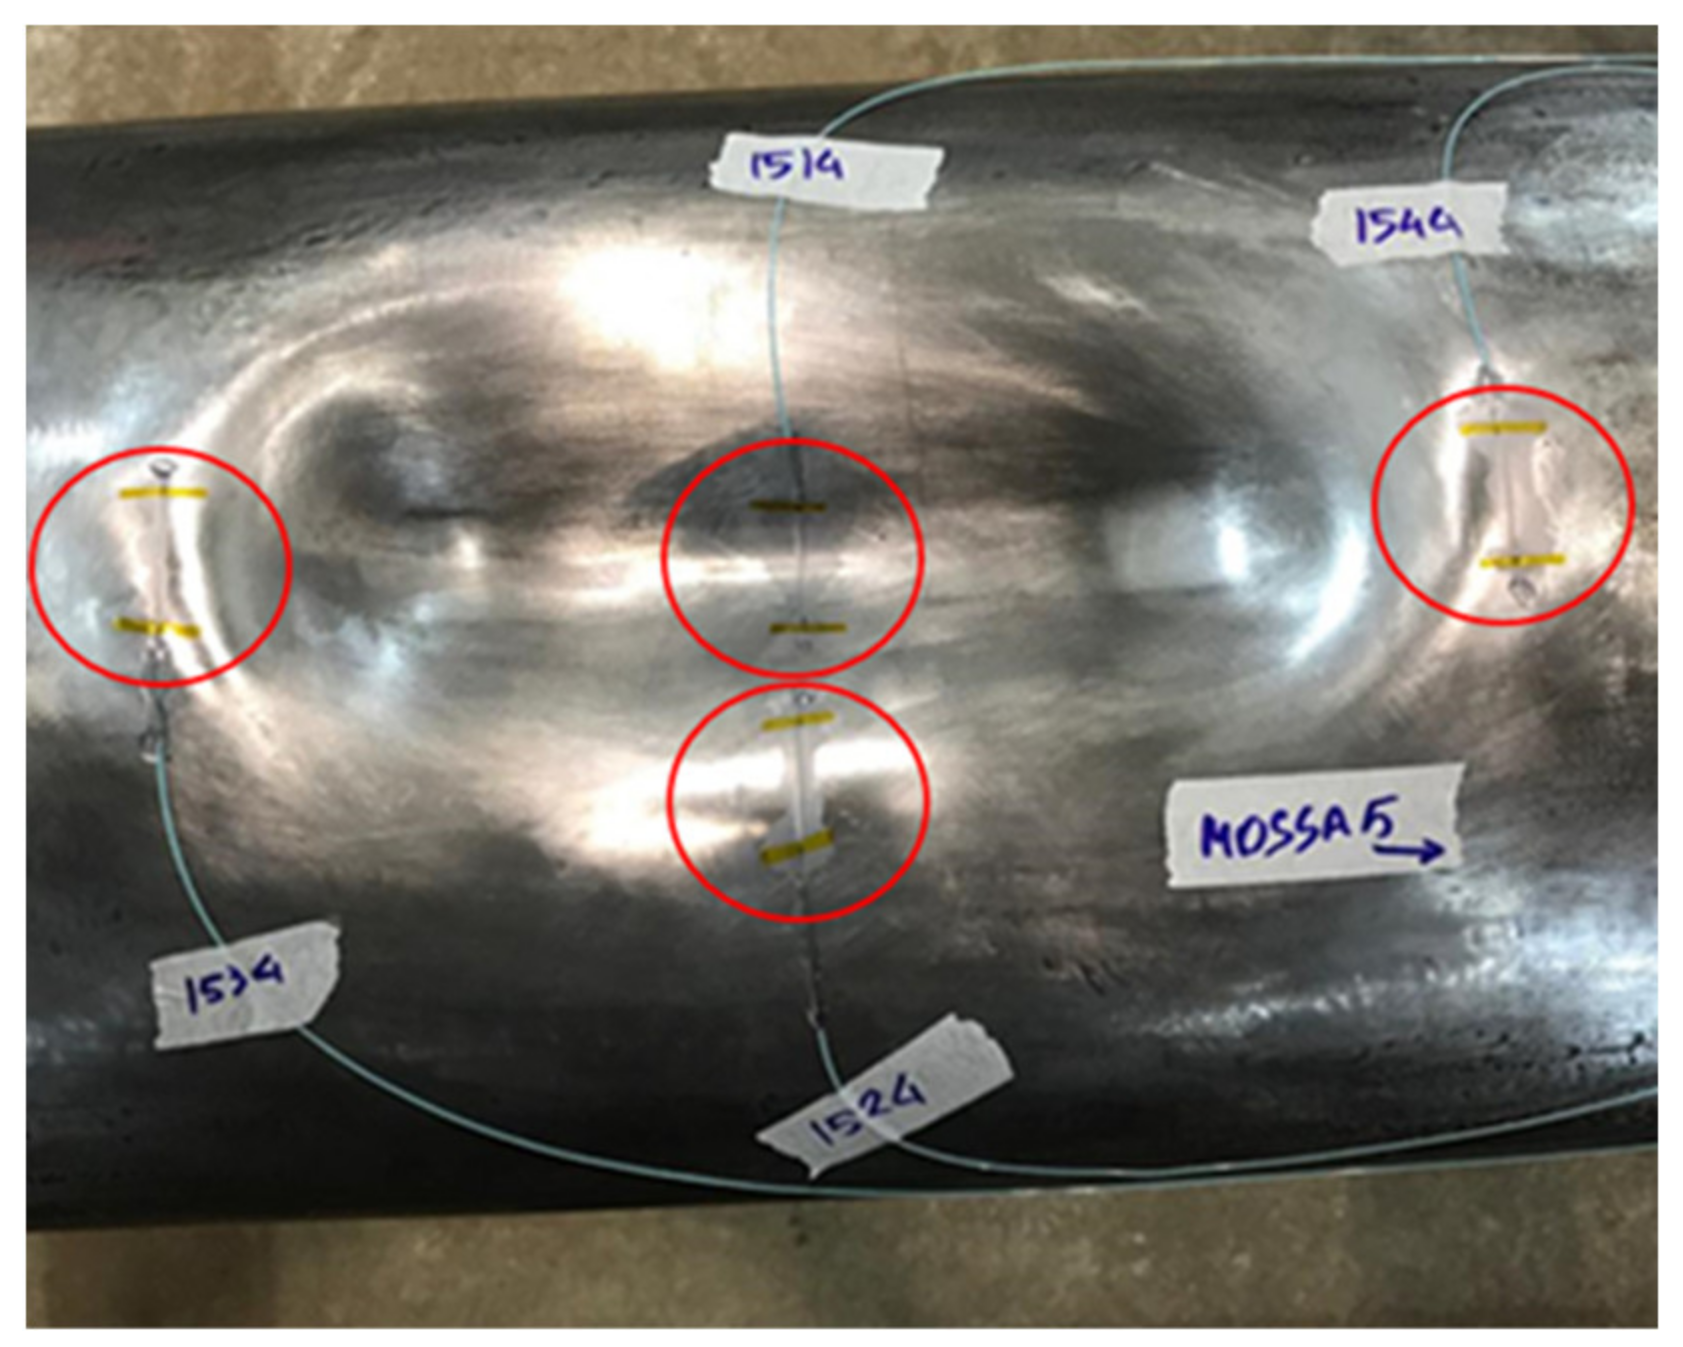
Fiber Optic Bragg Strain Gauge sensors were bonded to the hot-spot locations at the specimens’ dented external surfaces to collect strain information during testing. Based on findings presented by [
9,
12], the circumferential strains are considerably higher compared to longitudinal strains, and the circumferential strain range was assumed to be representative of the specimen’s fatigue behavior. Moreover, in most cases the longitudinal strains showed negligible or even small compressive magnitudes when the hot spots were loaded under elastic-plastic conditions, due to the need for constant volume plasticity deformation [
12]. Thus, the FBSGs were placed at the edges of the dents in the circumferential direction, which present the highest tensile strains.
A cyanoacrylate-based adhesive was used. Each fiber DTG-LBL-1550-F Ormocer coating (Fiber Bragg Gauge Sensors FBGS©) contained two Bragg grating sensors (placed 80 mm from each other) with gauge length equal to 8 mm and distinct wavelengths (1514 nm and 1524 nm) allowing for multiplexing the strain signal. The fiber optic conditioning equipment si255-16-ST/160 (Micron Optic, Atlanta, GA, USA) operated with two channels at an acquisition frequency equal to 1000 Hz.
Figure 3 depicts two fibers with four gauges mounted along the circumferential direction in the dent region of a tested specimen. The Bragg sensors are highlighted by circles in
Figure 3.
The maximum pressure during all the preliminary in-lab cycles applied before the specimens was buried or repaired and, subsequently, the fatigue loading cycles, were limited to 6.2 MPa, generating a maximum nominal circumferential stress equal to 0.65
SMYS. This limited maximum test pressure is lower than the applied re-round internal pressure, which prevents any extra and undesirable dent depth recovery during the cyclic tests. The water-hydrostatic pressure cycles imposed on the test specimens were applied sinusoidally and at a frequency of approximately 1 Hz, using a specially designed cylinder-piston device that was coupled to the hydraulic actuator of a servo-hydraulic 500 kN MTS testing machine [
12]. This set-up is depicted in the right image of
Figure 2. Each specimen was subjected to a specific pressure ratio: more information is presented in
Table 1 (
Section 4).
For the second group of specimens, after completion of the in-lab (in-air) tests, the pipe specimens were buried in the ground. The specimens were installed in trenches dug in an earth fill. The ditch depth was 1.20 m. The fill was built using residual soil from gneiss that was excavated and transported from a burrowed site nearby. The residual soil is composed mainly of silt and sand fractions with less than 15% of clay, and consists of quartz, feldspar, and kaolinite. The stages of this process, as shown in
Figure 4, consisted of digging the ditch, preparing the washed sand cradle, positioning the specimens in the ditch, and covering them with the selected material. Compacting the soil cover was carried out during the covering in stages of about 200 mm depths.
As with the buried specimens, the dents of the third group of specimens were first tested in air without any kind of restriction. After completing this phase, the dents’ repair process began. The repair application process for the three different suppliers is similar. They start with surface preparation for the repair application, and then the dent is filled with epoxy resin until the kneaded portion of the pipe is leveled with the other regions. From then on, layer by layer of composite material is added until the thickness previously designed by the supplier is reached.
The estimations of the thickness of the repair and its application process to each dent were carried out by the suppliers, who followed criteria established by their own procedures and by the ISO 24817 and ASME PCC-2 standards, with the dents considered defects that do not go through the pipe wall. The repair process conducted by Supplier 3 is shown in
Figure 5.
The first five buried and repaired pressure cyclic tests were carried out with the same pressure range (6.0 MPa) employed during the in-lab tests. In sequence to these preliminary cycles, pressure ranges equal to 2.0, 3.0, 4.0, and 6.0 MPa, as given in
Table 1, were applied to the specimens up to their fatigue failures.
4. Discussion
The test results for the buried and repaired specimens are presented in
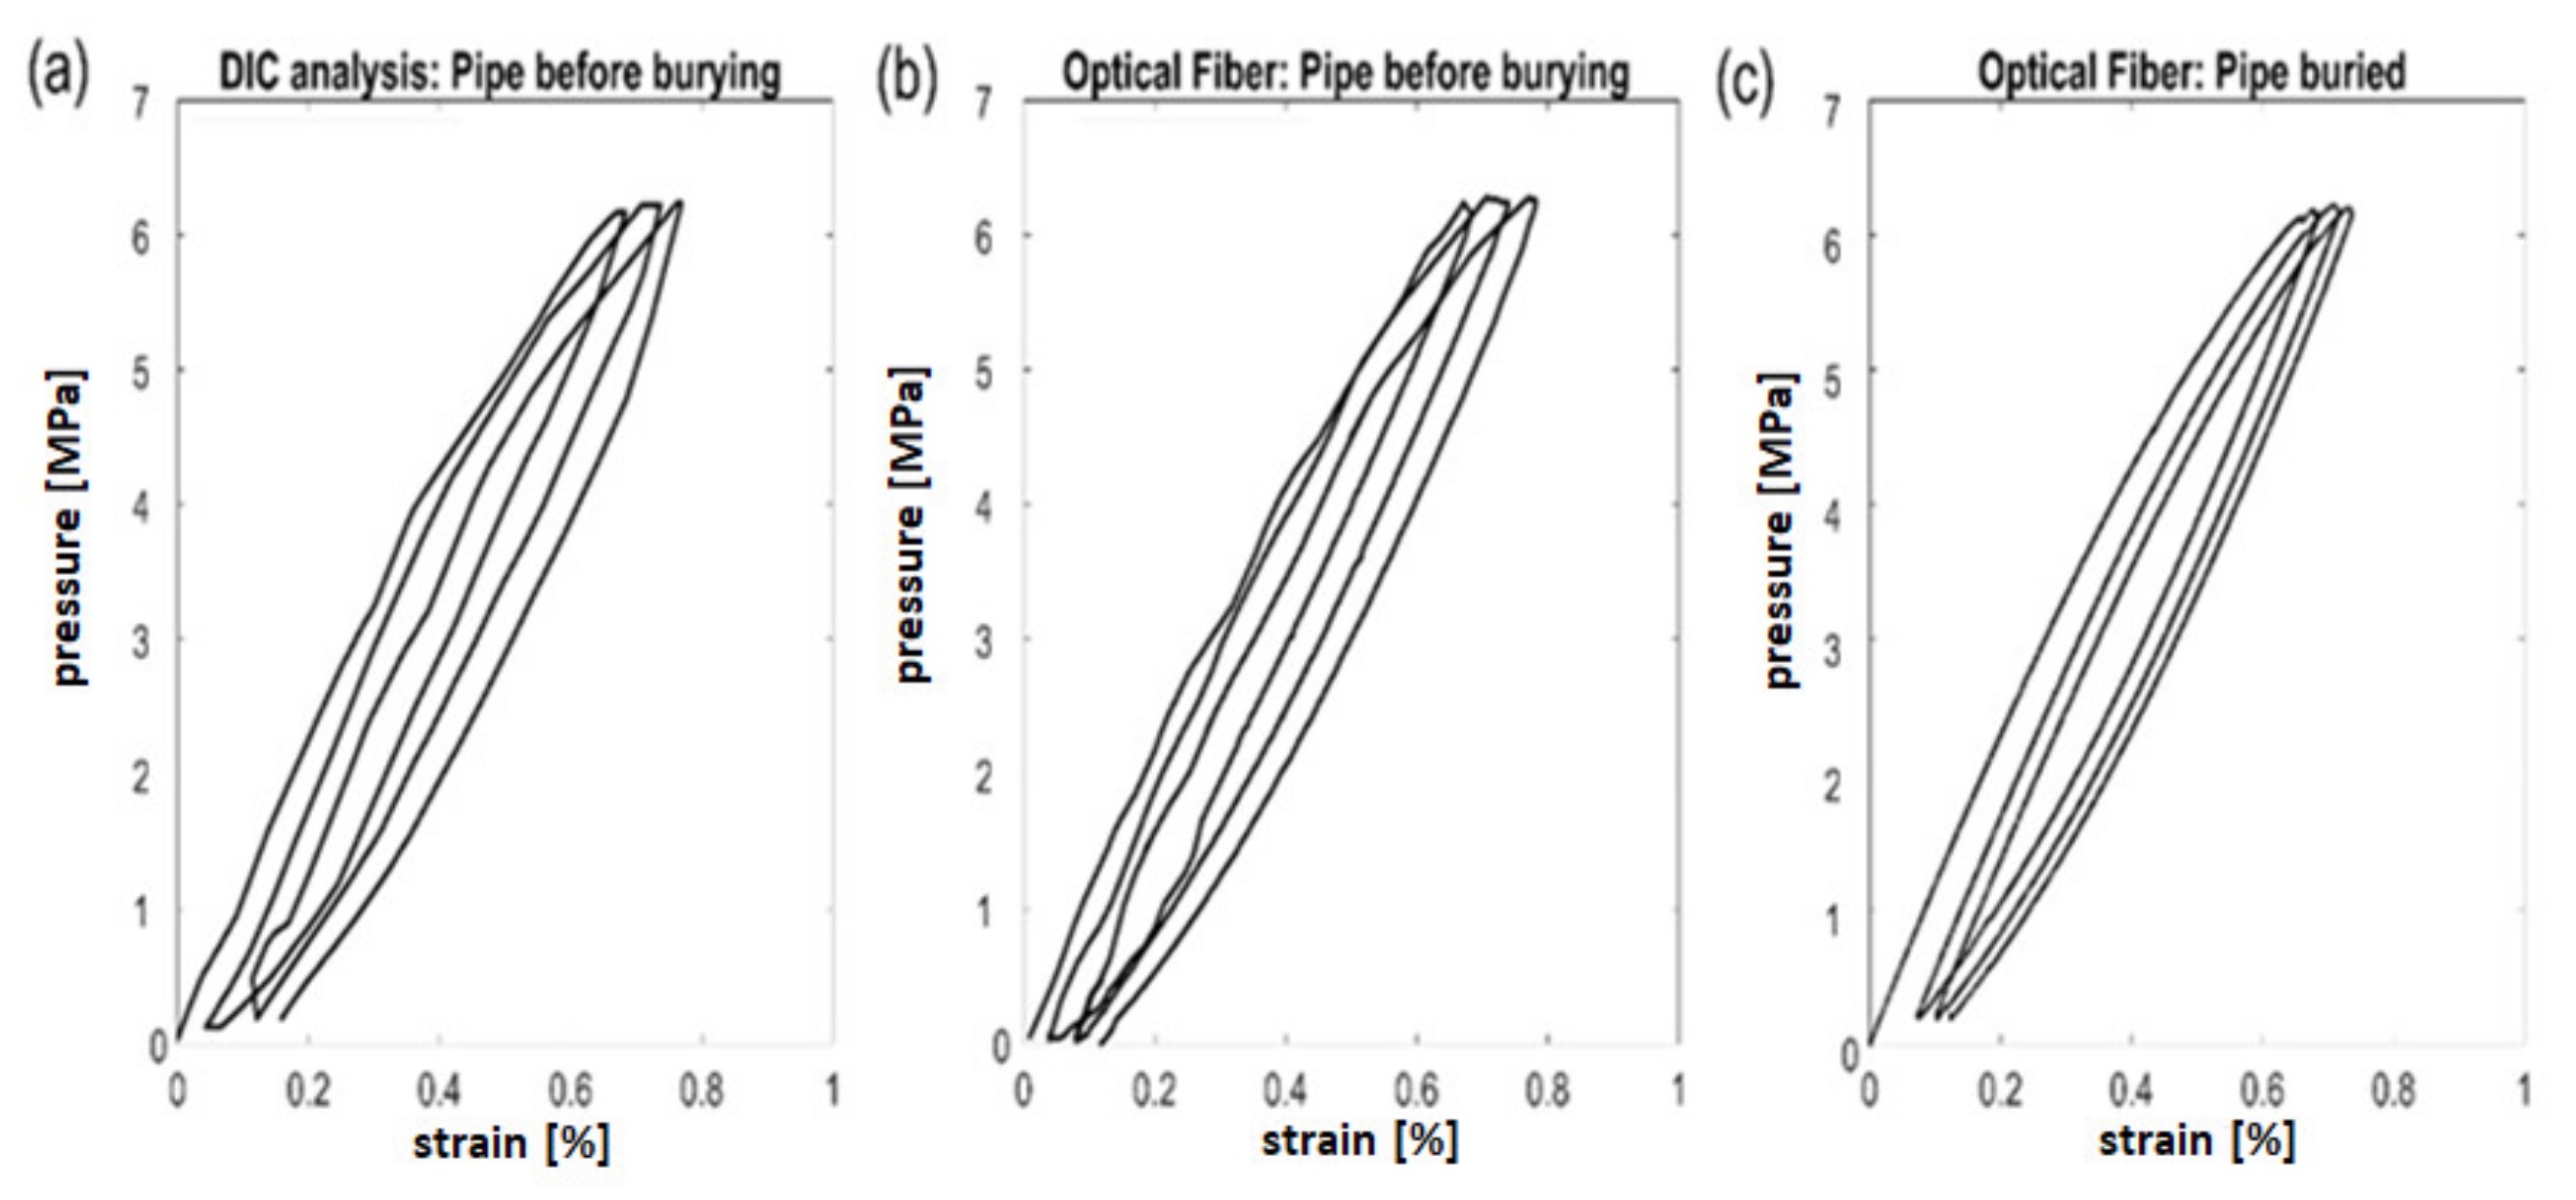
Table 1, which show that the DIC and FBSG-measured strain ranges agreed satisfactorily if uncertainties of both methods are taken into consideration: (+0.014% DIC and +0.010% FBSG). This observation is also valid for non-buried specimens. Cases not reported in this table refer to specimens where instrumented points with the fiber optic strain gauges did not coincide with the hot-spot locations indicated by the DIC technique.
An important point to notice refers to the influence of the soil cover and its possible restraint effect on the strain ranges induced by the test pressure.
Figure 12 and
Table 1 show that measured strains by the FBSG gauges before and after burying the pipe specimens present negligible differences helping to draw the conclusion that the soil cover did not restrain the deformation of the dent induced by the pressure variation.
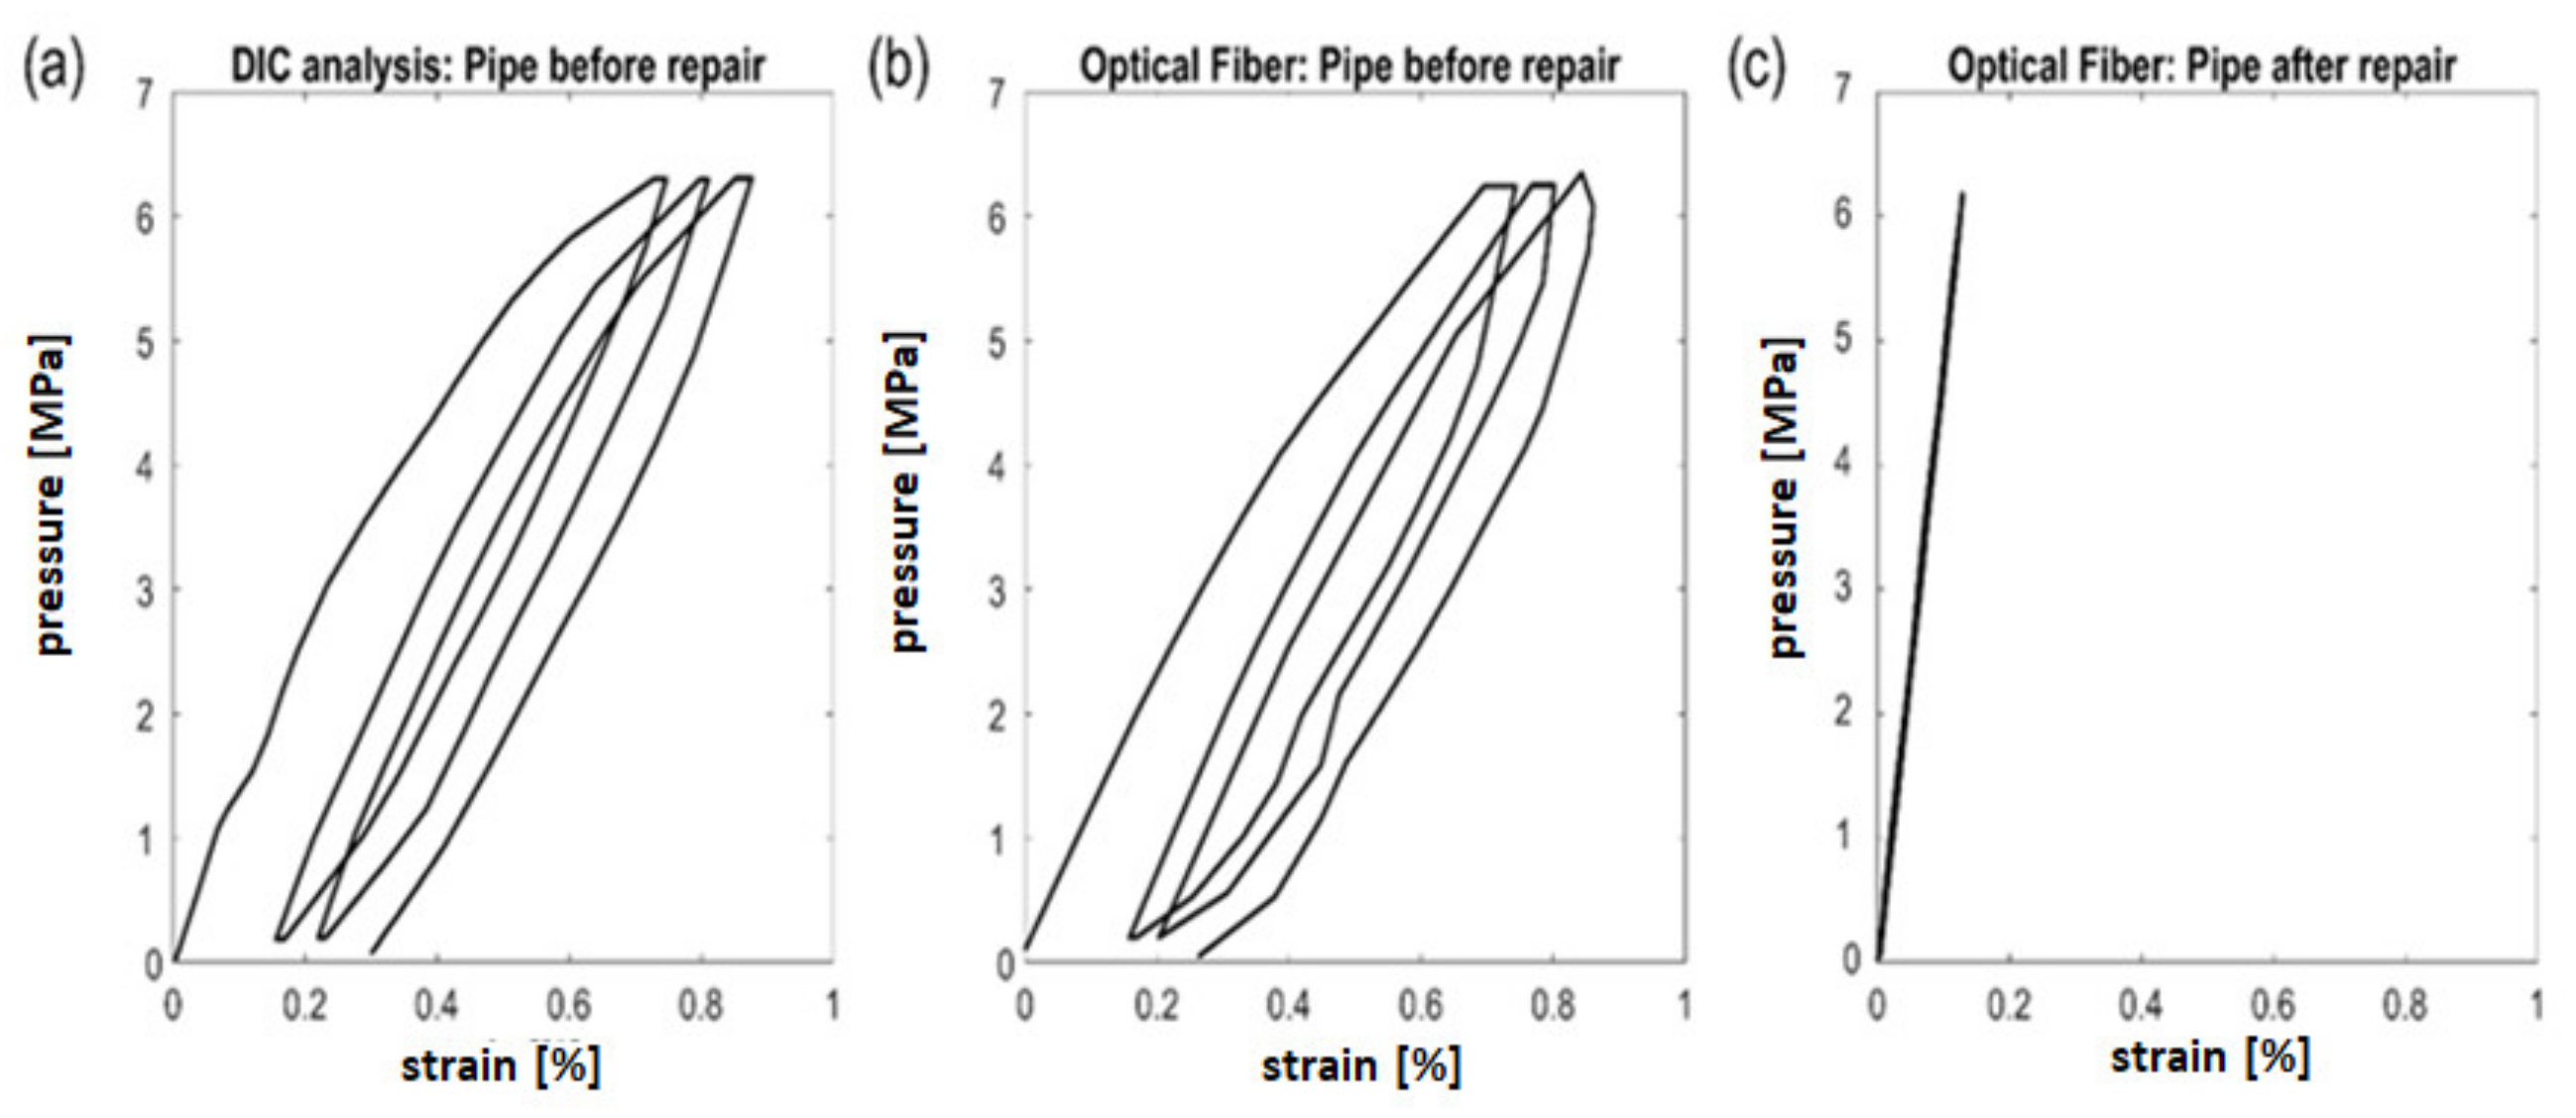
In contrast to the last paragraph observations, the influence of the composite repair on decreasing the strains operating in the same point and measured with the same strain gauge was highly relevant, as shown by
Figure 13 and also
Table 1. Columns three and four of
Table 1 show the ratio between strains measured before and after the application of the composite repairs when the specimens were loaded to the same applied cyclic pressure. The influence of the smaller applied strains on the longer fatigue lives is also noticed by examining the last two columns of
Table 1.
Based on the relationship between the results obtained for FBSG in each of the specimens studied (environmental conditions–buried or repaired), it was possible to estimate the potential circumferential strain at the hot spot that would be measured by the DIC technique (Column six of
Table 1). A linear extrapolation that considered the effects of test-pressure ranges was used.
Using the strain ranges estimated for the DIC technique at the hot spots for the burial or repair conditions as inputs, fatigue damage calculations were performed using the Manson-Coffin Equation (1) as described in (e.g., [
18]) to determine the fatigue life
Nc as a function of the applied (measured) circumferential strain amplitude
εa = Δ
ε/2 (results of strains equation given in terms of m/m).
The formula used for calculating the fatigue damage is given in Equation (1), which uses the universal fatigue exponents −0.12 and −0.6, as proposed by Manson [
18], and the measured mechanical properties of the employed material (Young Modulus
E = 182 GPa, engineering ultimate strength
Sue = 420 MPa and fatigue strain coefficient
ε′
f = 0.36 m/m). One can see that the calculations did not take into consideration the mean cycle stress (
σm = 0). One reason for this is that, although the mean stress caused by the pressure operating can be determined, the total mean stress is unknown due to the uncertain previous load history imposed on the pipe material (such as residual stresses caused by the pipe’s fabrication and the indentation processes).
Table 1 (strains given in %) shows the fatigue damage calculations for all tested specimens and the experimental results from the fatigue tests. It is important to compare the results presented in the last two columns. One can see that the fatigue lives (number of cycles), predicted by the Manson-Coffin Equation (1), and the actual lives, determined via the tests, agree satisfactorily, considering all the uncertainties associated with fatigue calculations and experimental fatigue tests.
Moreover,
Table 1 gives fatigue test results for eight out of nine other but similar specimens that were tested in air (not buried specimens and not repaired) and previously published [
11,
12].
The determined lives for all specimens tested agree well with the curve proposed by Equation (1), this agreement being depicted by the plotted points in
Figure 14. One can see that the set of results falls within the given Manson-Coffin fatigue curve without the mean stress presented in Equation (1). This comparison justifies the use of the same curve to represent the fatigue behavior of repaired, buried, and unmodified (unburied and unrepaired) specimens, on the assumption that actual operating strains are used in the plot.
Furthermore, the repair effectiveness on the fatigue life of dented specimens can be verified by comparing the applied cyclic-pressure ranges and the lives obtained for both repaired and unrepaired (both air and buried tested) specimens,
Figure 15. The higher dispersion of results is caused by neglecting differences in the dent shapes (although nominally the dents had the same depth relative to the specimens’ diameters) and different reinforcement supplier systems.
Table 1.
Experimental results.
Specimen 2
ID and Test
Conditions | Cyclic Test Pressure Range
(MPa) | Measured Circumferential Strain Amplitude
at Hot-Spot Location, εa (%) | Test Condition Influence Factor (DIC in Air/
DIC after Burying or Repairing) | Number of Cycles
to Failure Using Equation (1) and Column 6 Strains,
Nc, Sue = 420 MPa, E = 182 GPa | Number of Applied Test Cycles until Failure, N |
|---|
DIC
in-Air | FBSG
in-Air | FBSG
after Burying
or Repairing | DIC Estimated
after Burying
or Repairing 7 |
|---|
| 1-air | 4.0 | 0.19 | -3 | -1 | -1 | -1 | 21,543 | 38,300 |
| 2-air | 6.0 | 0.25 | -3 | -1 | -1 | -1 | 9032 | 7990 |
| 4-air | 4.0 | 0.50 | -3 | -1 | -1 | -1 | 1531 | 2100 |
| 5-air | 3.0 | 0.16 | 0.13 | -1 | -1 | -1 | 40,162 | 220,000 |
| 6-air | 6.0 | 0.35 | -3 | -1 | -1 | -1 | 3606 | 6500 8 |
| 7-air | 4.0 | 0.22 | 0.20 | -1 | -1 | -1 | 13,319 | 34,400 |
| 8-air | 3.0 | 0.15 | 0.13 | -1 | -1 | -1 | 51,754 | 53,300 |
| 9-air | 4.0 | 0.20 | 0.20 | -1 | -1 | -1 | 18,121 | 38,900 |
| 11-buried | 4.0 | 0.24 | 0.18 | 0.19 | 0.25 | ≈1.0 | 8691 | 26,800 |
| 12-buried | 4.0 | 0.22 | 0.18 | 0.17 | 0.21 | ≈1.0 | 15,982 | 21,700 |
| 13-buried | 2.0 | 0.10 | 0.09 | -4 | 0.10 4 | ≈1.0 | 351,085 | 905,500 |
| 15-buried | 2.0 | 0.09 | 0.10 | -4 | 0.09 4 | ≈1.0 | 643,306 | 130,200 |
| 17-buried | 4.0 | 0.20 | 0.17 | 0.20 | 0.23 | ≈1.0 | 10,823 | 21,900 |
| 20-buried | 6.0 | 0.33 | 0.33 | 0.32 | 0.32 | ≈1.0 | 4548 | 4610 |
| 21-buried | 6.0 | 0.33 | 0.32 | 0.29 | 0.30 | ≈1.0 | 5447 | 5970 |
| 10-repaired (Supplier 1) | 3.0 | 0.12 | 0.07 | 0.06 | 0.11 | 1.0 | 172,097 | 437,980 |
| 14-repaired (Supplier 2) | 6.0 | 0.27 | 0.20 | 0.11 | 0.15 | 0.6 | 53,896 | 123,550 |
| 16-repaired (Supplier 2) | 6.0 | 0.27 | 0.22 | 0.15 | 0.18 | 0.7 | 24,028 | 18,050 |
| 19-repaired (Supplier 1) | 4.0 | 0.16 | 0.11 | 0.06 | 0.09 | 0.6 | 634,833 | 592,510 |
| 23-repaired (Supplier 3) | 4.0 | 0.16 | 0.10 | 0.03 | 0.05 | 0.33 | 3.46 × 10⁷ | -5 |
| 24-repaired (Supplier 1) | 6.0 | 0.30 | 0.24 | 0.20 | 0.25 | 0.8 | 9031 | 19,350 |
| 25-repaired (Supplier 2) | 6.0 | 0.29 | 0.19 | 0.09 | 0.14 | 0.5 | 64,998 | 141,750 |
| 26-repaired (Supplier 3) 6 | 7.0 | 0.28 | 0.20 | 0.05 | 0.05 | 0.2 | 3.52 × 10⁷ | 130,030 |
| 27-repaired (Supplier 2) | 3.0 | 0.13 | 0.07 | 0.04 | 0.07 | 0.6 | 2.6 × 10⁶ | -5 |
| 28-repaired (Supplier 3) | 6.0 | 0.27 | 0.22 | 0.06 | 0.07 | 0.3 | 3.3 × 10⁶ | 155,000 |
| 29-repaired (Supplier 3) | 6.0 | 0.29 | 0.27 | 0.06 | 0.07 | 0.2 | 5.3 × 10⁶ | 53,910 |
| 30-repaired (Supplier 2) | 6.0 | 0.29 | 0.20 | 0.03 | 0.04 | 0.1 | 3.98 × 10⁸ | -5 |
| 31-repaired (Supplier 1) | 6.0 | 0.30 | 0.19 | 0.11 | 0.17 | 0.5 | 29,556 | 62,200 |
| 32-repaired (Supplier 3) | 3.0 | 0.10 | 0.08 | 0.02 | 0.03 | 0.3 | 2.6 × 10⁹ | -5 |
| 34-repaired (Supplier 2) | 6.0 | 0.29 | 0.21 | 0.12 | 0.17 | 0.6 | 35169 | 35,900 |
| 35-repaired (Supplier 1) 6 | 7.0 | 0.29 | 0.21 | 0.03 | 0.03 | 0.1 | 9.29 × 10⁸ | 525,240 |


