Article

Barkhausen Noise Emission in AISI 321 Austenitic Steel Originating from the Strain-Induced Martensite Transformation

1
Faculty of Mechanical Engineering, University of Žilina, Univerzitná 1, 010 26 Žilina, Slovakia
2
Faculty of Materials Science and Technology in Trnava, Slovak University of Technology in Bratislava, J. Bottu 2781/25, 917 24 Trnava, Slovakia
3
Faculty of Nuclear Sciences and Physical Engineering, Czech Technical University in Prague, Trojanova 13, 120 00 Praha, Czech Republic
4
Centre of Advanced Innovation Technologies, VSB—Technical University of Ostrava, 17. listopadu 2172/15, 708 00 Ostrava-Poruba, Czech Republic
5
Faculty of Mathematics and Physics, Charles University, Ke Karlovu 5, 121 16 Praha, Czech Republic
6
Institute of Physics of Materials, Academy of Sciences of Czech Republic, Žižkova 22, 616 62 Brno, Czech Republic
*
Author to whom correspondence should be addressed.
Submission received: 7 February 2021 / Revised: 23 February 2021 / Accepted: 28 February 2021 / Published: 5 March 2021
(This article belongs to the Special Issue In-Situ Investigations of Metals)

Abstract

:
This paper investigates the sensitivity of the Barkhausen noise technique against strain-induced martensite in AISI 321 austenitic stainless steel. Martensite transformation was induced by the uniaxial tensile test, and a variable martensite fraction was obtained at different plastic strains. It was found that Barkhausen noise emission progressively increases with plastic straining, while its evolution is driven by the martensite fraction in the deformed matrix. This study also demonstrates that the uniaxial tensile stressing produced a certain level of stress and magnetic anisotropy in the samples. The number of strong Barkhausen pulses increased for more developed strains, whereas the position of the Barkhausen noise envelope remained less affected. This study clearly demonstrates the good sensitivity of the Barkhausen noise technique against the degree of martensite transformation in austenitic stainless steel. Moreover, this technique is sensitive to the direction of the exerted load.

1. Introduction

Austenitic stainless steels are well-known iron-based alloys that are widely used for various applications because of their high strength, corrosion resistance and ductility. The stability of austenite at room temperature is mainly due to the presence of austenite stabilizers, such as Ni and Mn [1]. However, Cr and Mo elements are also important for their acceptable level of corrosion resistance. Austenitic steels are high alloyed materials and some of them are sensitive to strain-induced martensite transformations [2,3,4,5]. The production of components made of austenitic stainless steels involves technological operations such as forming, machining, welding etc., which can alter the microstructure of austenite and/or initiate martensite phase transformation. In many cases, martensite phase transformation is undesirable in terms of the functionality and operation of components. Talonen et al. [6] provided an outstanding comparison of different methods for measuring the strain-induced martensite content in austenitic steels, including X-ray diffraction, the satmagan method, in addition to density and optical measurements. The authors also reported a method based on magnetic balance. The magnetic technique seems to provide promising measurements, since the non-ferromagnetic austenite phase can be easily contrasted to ferromagnetic martensite. For this reason, the Magnetic Barkhausen Noise (MBN) technique has also already been employed for such purposes. Haušild et al. [4] compared different methods, including magnetic measurements, for monitoring strain-induced martensite in AISI 301 austenite stainless steel. In a later study [3], the MBN technique was adapted to the assessment of a strain-induced martensite fraction under a biaxial stress state. Astudilo et al. [7] linked MBN in austenitic steel with strain-induced martensite in AISI 304 after uniaxial tensile loading up to rupture. Kleber and Barroso [8] applied the MBN technique for monitoring martensite fractions on the surface of AISI 304L steel after exposure to different shot peening conditions. The authors correlated the MBN signals with the volume fraction of martensite and the depth of the treatment. Tavares et al. [9] correlated MBN with the martensite/austenite ratio in stainless steel.
MBN originates from the irreversible and discontinuous domain wall (DW) motion. Such motion is due to pinning the DW by various lattice defects, such as grain boundaries, precipitates, dislocation cells, non-ferromagnetic phases etc. The DW discontinuous motion occurs as soon as the magnetic field exceeds a certain threshold, which is equal to the pinning strength of pinning sites in the matrix [10]. For this reason, an MBN signal contains information about the aforementioned microstructure features, as a result of their interference with DW. Thus, the MBN technique can be employed in many applications in which microstructure and/or stress state are altered or transformed [11,12,13,14]. On the other hand, technological cycles usually alter the stress state and microstructure in terms of their complexity, but the contribution of individual aspects to the MBN is usually difficult to detect. Therefore, MBN tends to ascend or descend along with a variable degree of matrix alterations from the initial untouched state against which the MBN evolution should be confronted. On the other hand, the application of MBN in monitoring the strain-induced transformation of austenitic stainless steel could be very sensitive, since the MBN value for untouched steel is zero. Certain background MBNs, originating from the sensing system or/and possible mechanical vibrations, should be considered. However, decomposition and subtraction can occur [15]. The high sensitivity of MBN to the strain-induced martensite fraction is linked with the idea that the total MBN acquired from the free surface can be directly associated with process parameters and the corresponding martensite fraction (and its properties). For this reason, this study deals with such a purpose, while investigating MBN in austenitic steel as a function of plastic straining under uniaxial tension.
Stainless steels are used in food, oil, gas, and chemical industries [1]. Components made of these steels are manufactured via a variety of technological operations which alter the microstructure and the corresponding functional properties of the steel. For this reason, the employment of the MBN technique for monitoring components made of austenitic steels (especially with respect to the strain-induced phase transformation) would beneficial. AISI 321 steel is used for the production of components in ventilation systems. These components undergo plastic deformation in order to modify their shape and dimensions. A preliminary study assessing real industrial production demonstrated the presence of strain-induced martensite transformation by using the MBN technique. In order to provide true information about the degree of strain-induced phase transformation, the calibration procedure (as presented in this study) should be carried out to correlate MBN signals with the fraction of martensite (by the use of conventional techniques based on X-ray diffraction measurements and/or metallographic observations).

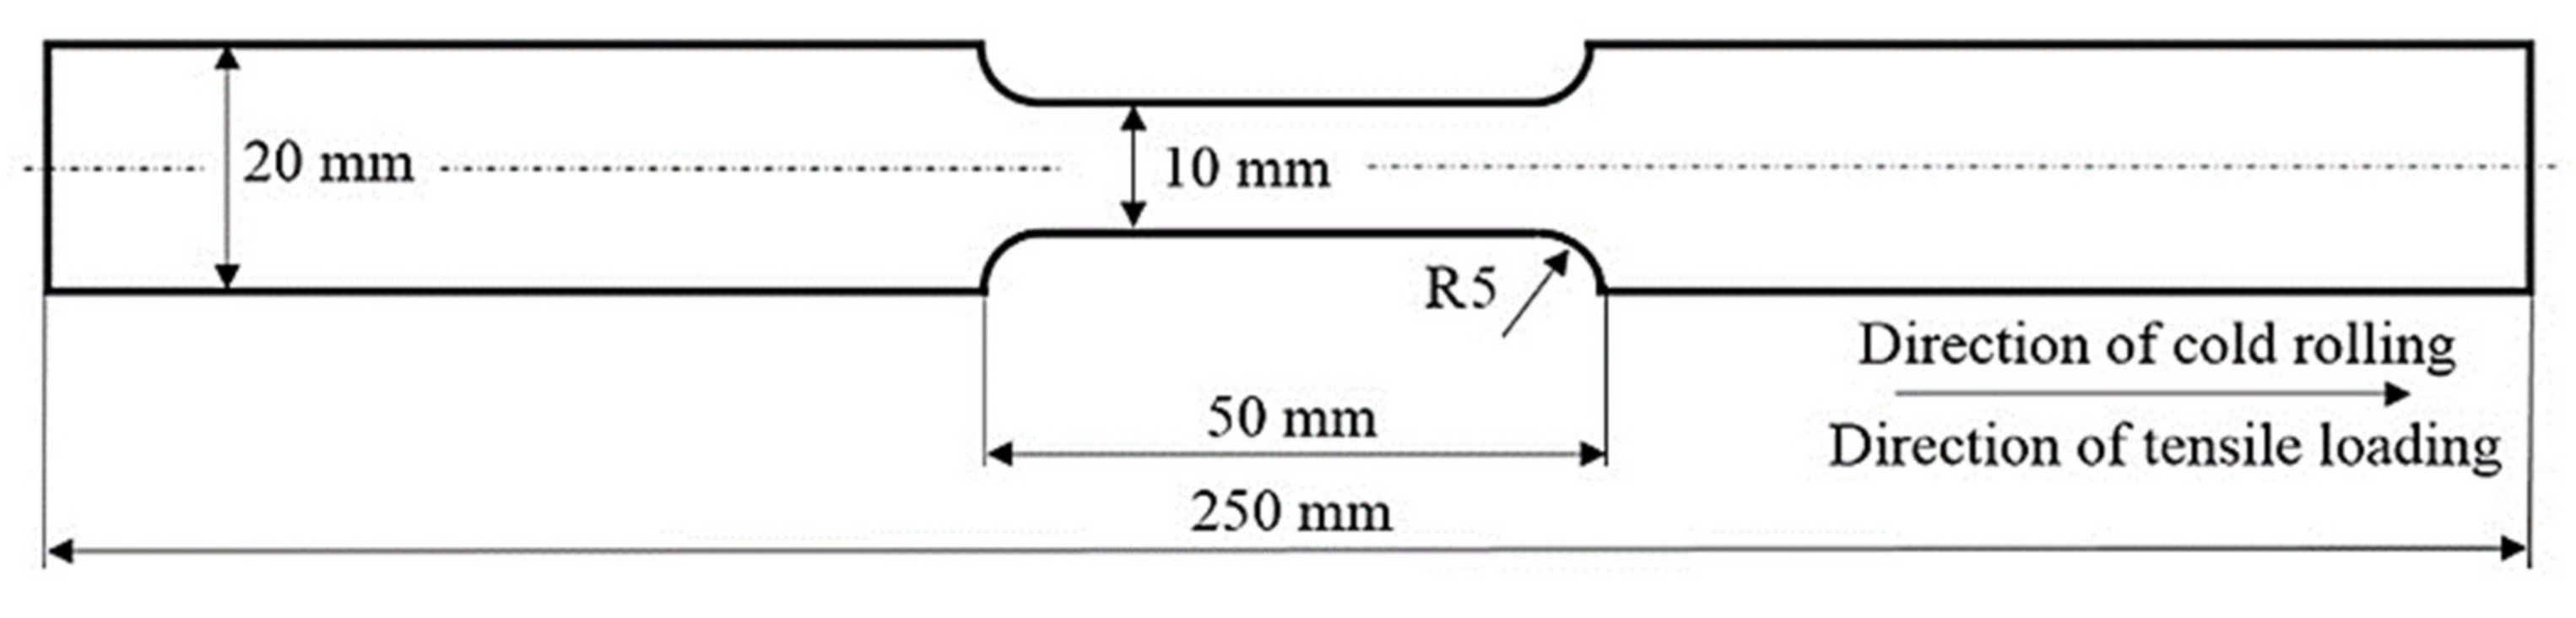
2. Materials and Methods
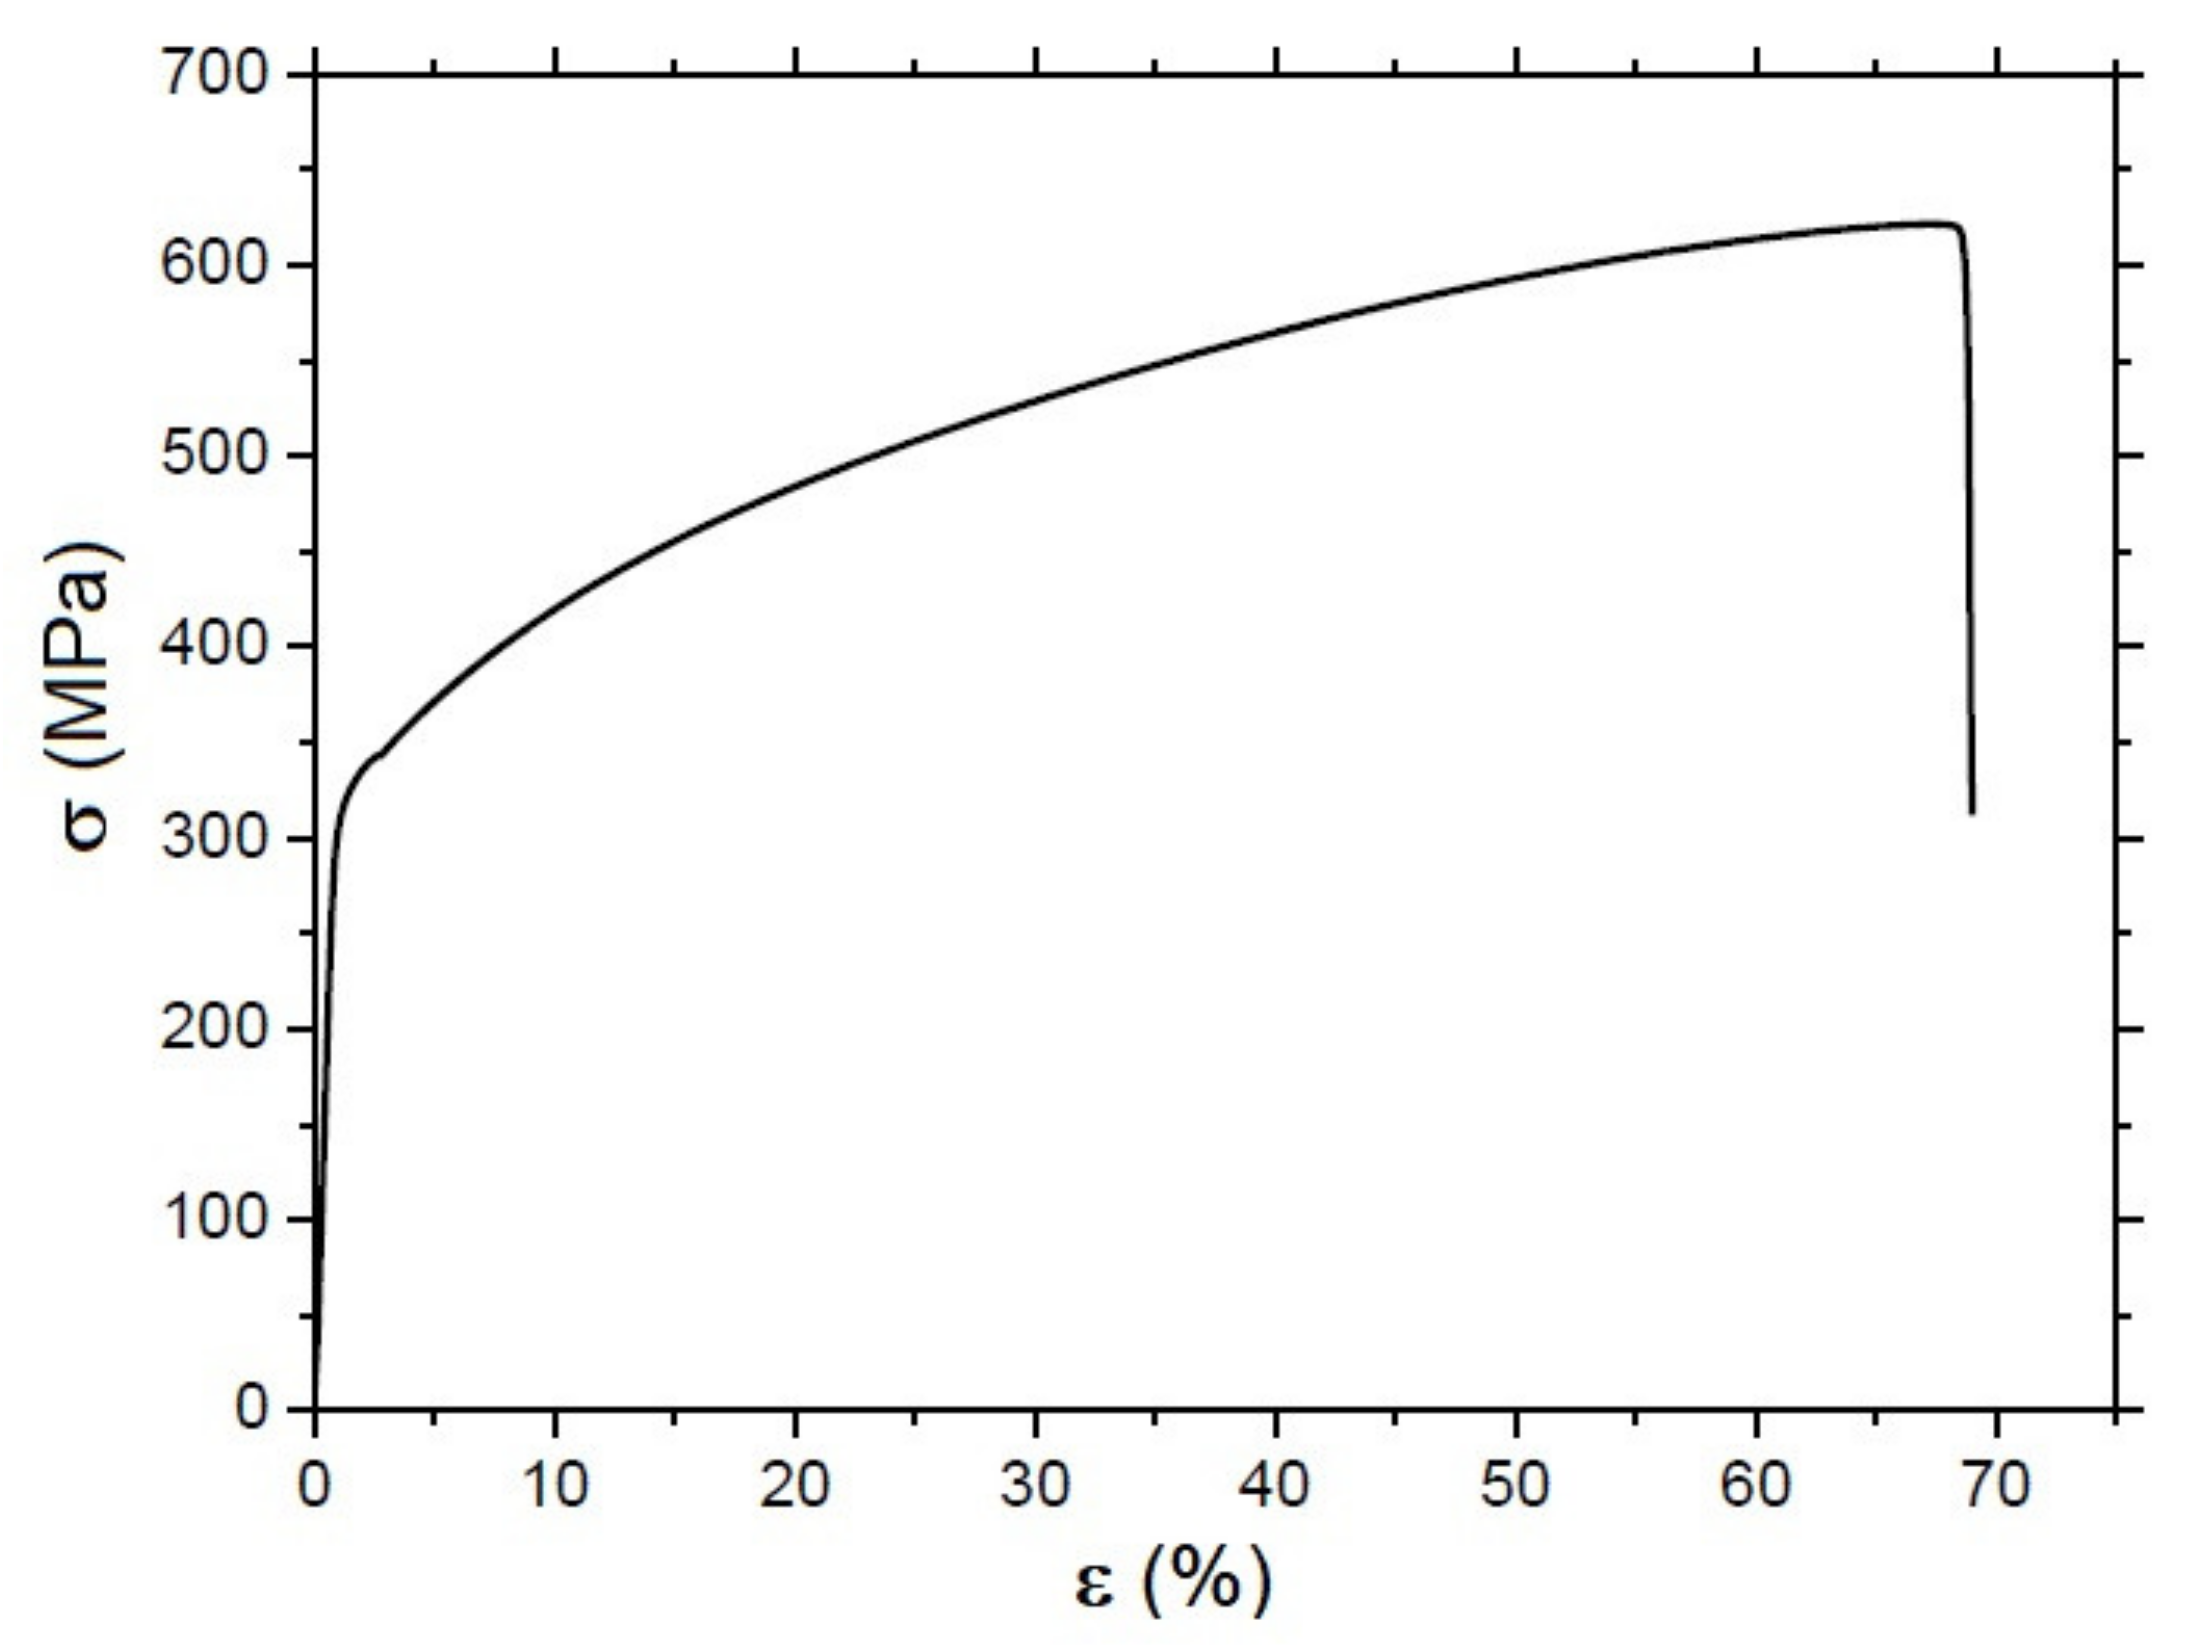
Experiments were carried out on the AISI 321austenitic cold rolled stainless steel. The samples illustrated in Figure 1 were cut from a sheet of 2 mm thickness (in the direction of cold rolling). The final shape of the samples was produced by milling cycles (by the use of a cutter with rounded inserts—10 mm in diameter). The nominal chemical composition is indicated in Table 1. Nominal mechanical properties of AISI 321 were as follows: ultimate strength 540 ÷ 680 MPa, yield strength 202 ÷ 220 MPa and hardness 88 HRB. The stress–strain curve of the investigated AISI 321 sample is shown in Figure 2.
The samples—as illustrated in Figure 1—were subjected to uniaxial tensile stressing in order to initiate and develop strain-induced martensite transformation by the use of the Instron 5985 device. The samples were tensile pre-strained (cross-head speed 1 mm·min−1 and the corresponding initial strain rate 0.33 × 10⁻³ s−1) at different plastic strain values as follows: 5, 25, 35, 45, 55 and 60%. The values of the plastic strains were selected during the preliminary phase of the investigations when the MBN values were measured along the whole stress–strain curve.
Convectional non-destructive XRD (X-ray diffraction technique) as well as metallographic and SEM (electron backscattered diffraction: EBSD) observations were employed in order to correlate the measured changes in the MBN signals (and the extracted MBN parameters) with the microstructural changes.
The microstructures of all pre-strained samples were documented by light microscopy after electro-polishing at 45 V in 10% perchloric acid solution in ethanol mixed with 5% Nital (in proportion 1:1). After electro-polishing, the martensitic phase was darker, so the martensite volume fraction could be estimated by digital image analysis (using a simple threshold method). The detailed microstructure was then revealed by etching in a 1:1:1 solution of H2O, HCl and HNO3 and observed using a Neophot 32 light optical microscope.
An increase in the martensite fraction with increasing deformation was investigated by the electron backscattered diffraction (EBSD) method. The samples were cut from the middle of the active zone and mechanically ground and polished with a decreasing particle size down to 0.05 µm. Subsequently, the samples were analysed using a scanning electron microscope (SEM) Auriga Compact equipped with an EDAX EBSD camera. EBSD mapping was performed with a scan size 200 × 200 µm2 and a resolution of 0.2 µm. The raw datasets were partially cleaned by one step of confidence index standardization, one step of phase neighbour correlation and one step of grain dilatation using OIM TSL 7.3 software.
MBN signals were acquired by the use of the RollScan 350 device and these signals were analysed in the MicroScan 500 software. DW motion was initiated by altering the magnetic field of sine profile, frequency 125 Hz and amplitude 16 V (frequency recorded MBN pulses in the range of 10 to 1000 kHz, 10 bursts). MBN refers to the effective (rms) value of the acquired MBN signal. MBN measurements were carried out in the rolling direction, which corresponds to the direction of the tensile stresses (angle 0° in the angular dependences) as well as the transversal direction (angle 90° in the angular dependences). Moreover, the angular dependence of MBN was also investigated using the sensor rotation with a step of 22.5°. Apart from the effective value of MBN, further parameters were also extracted, such as the number of detected MBN pulses and the peak position (PP). PP corresponds to the magnetic field strength in which MBN envelope attains the maximum.
The X’Pert PRO MPD diffractometer was used to measure lattice deformations in the austenite and the martensite phase of the iron using Mn and Cr radiation with an average effective penetration depth of approximately 4 µm and 6 µm, respectively. Diffraction angles 2θhkl were taken as the centre of gravity of {311} diffraction doublet Mn and {211} diffraction doublet Cr. To determine residual stresses, the Winholtz and Cohen method and X-ray elastic constants ½s2 = 7.18 TPa−1, s1 = −1.2 TPa−1 and ½s2 = 5.75 TPa−1, s1 = −1.25 TPa−1 were used for the austenite and the martensite phase, respectively. Phase compositions, crystallite size (the size of coherently diffracting domains), and microdeformation were determined from the X-ray diffraction (XRD) patterns obtained using cobalt radiation and subsequent Rietveld refinement, performed in MStruct software (used for the fitting of the measured XRD patterns). The effective penetration depth of the XRD measurements was 1–5 µm.
The microhardness (HV1) was measured using an Innova Test 400TM tester by applying a 1000 g force for 10 s. Microhardness values (as well as the standard deviations) were obtained from five repeated measurements.

3. Results

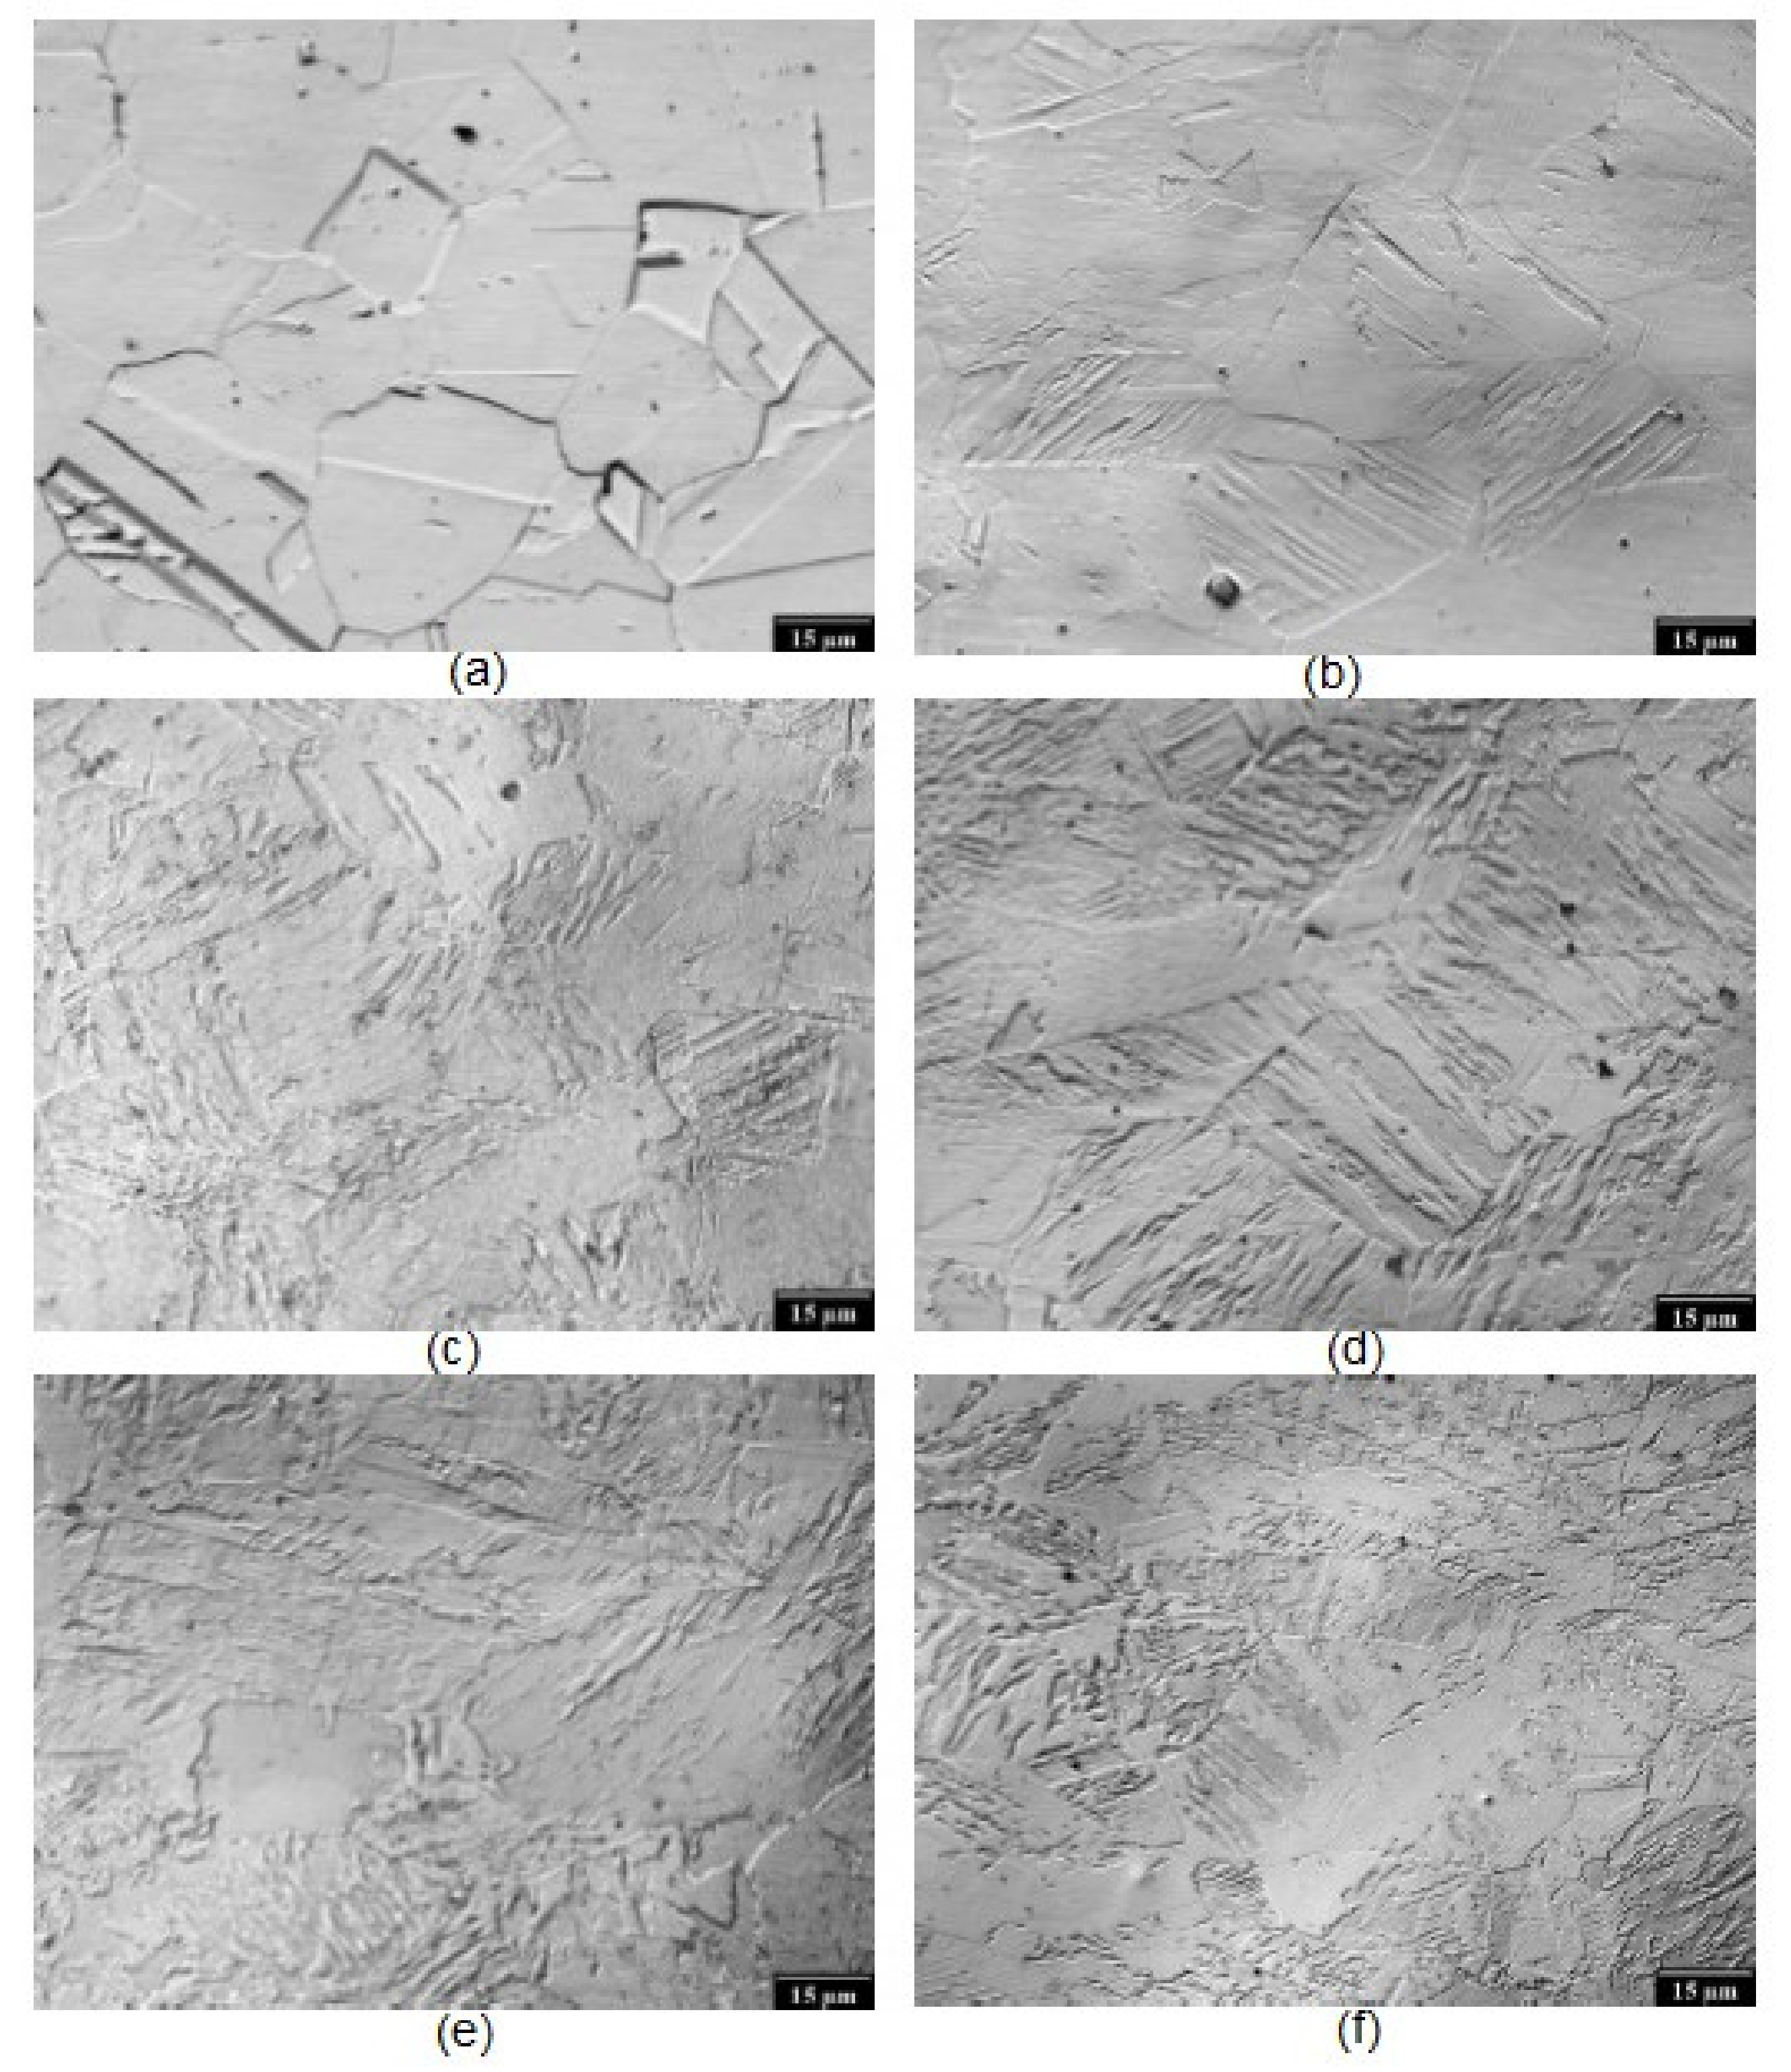
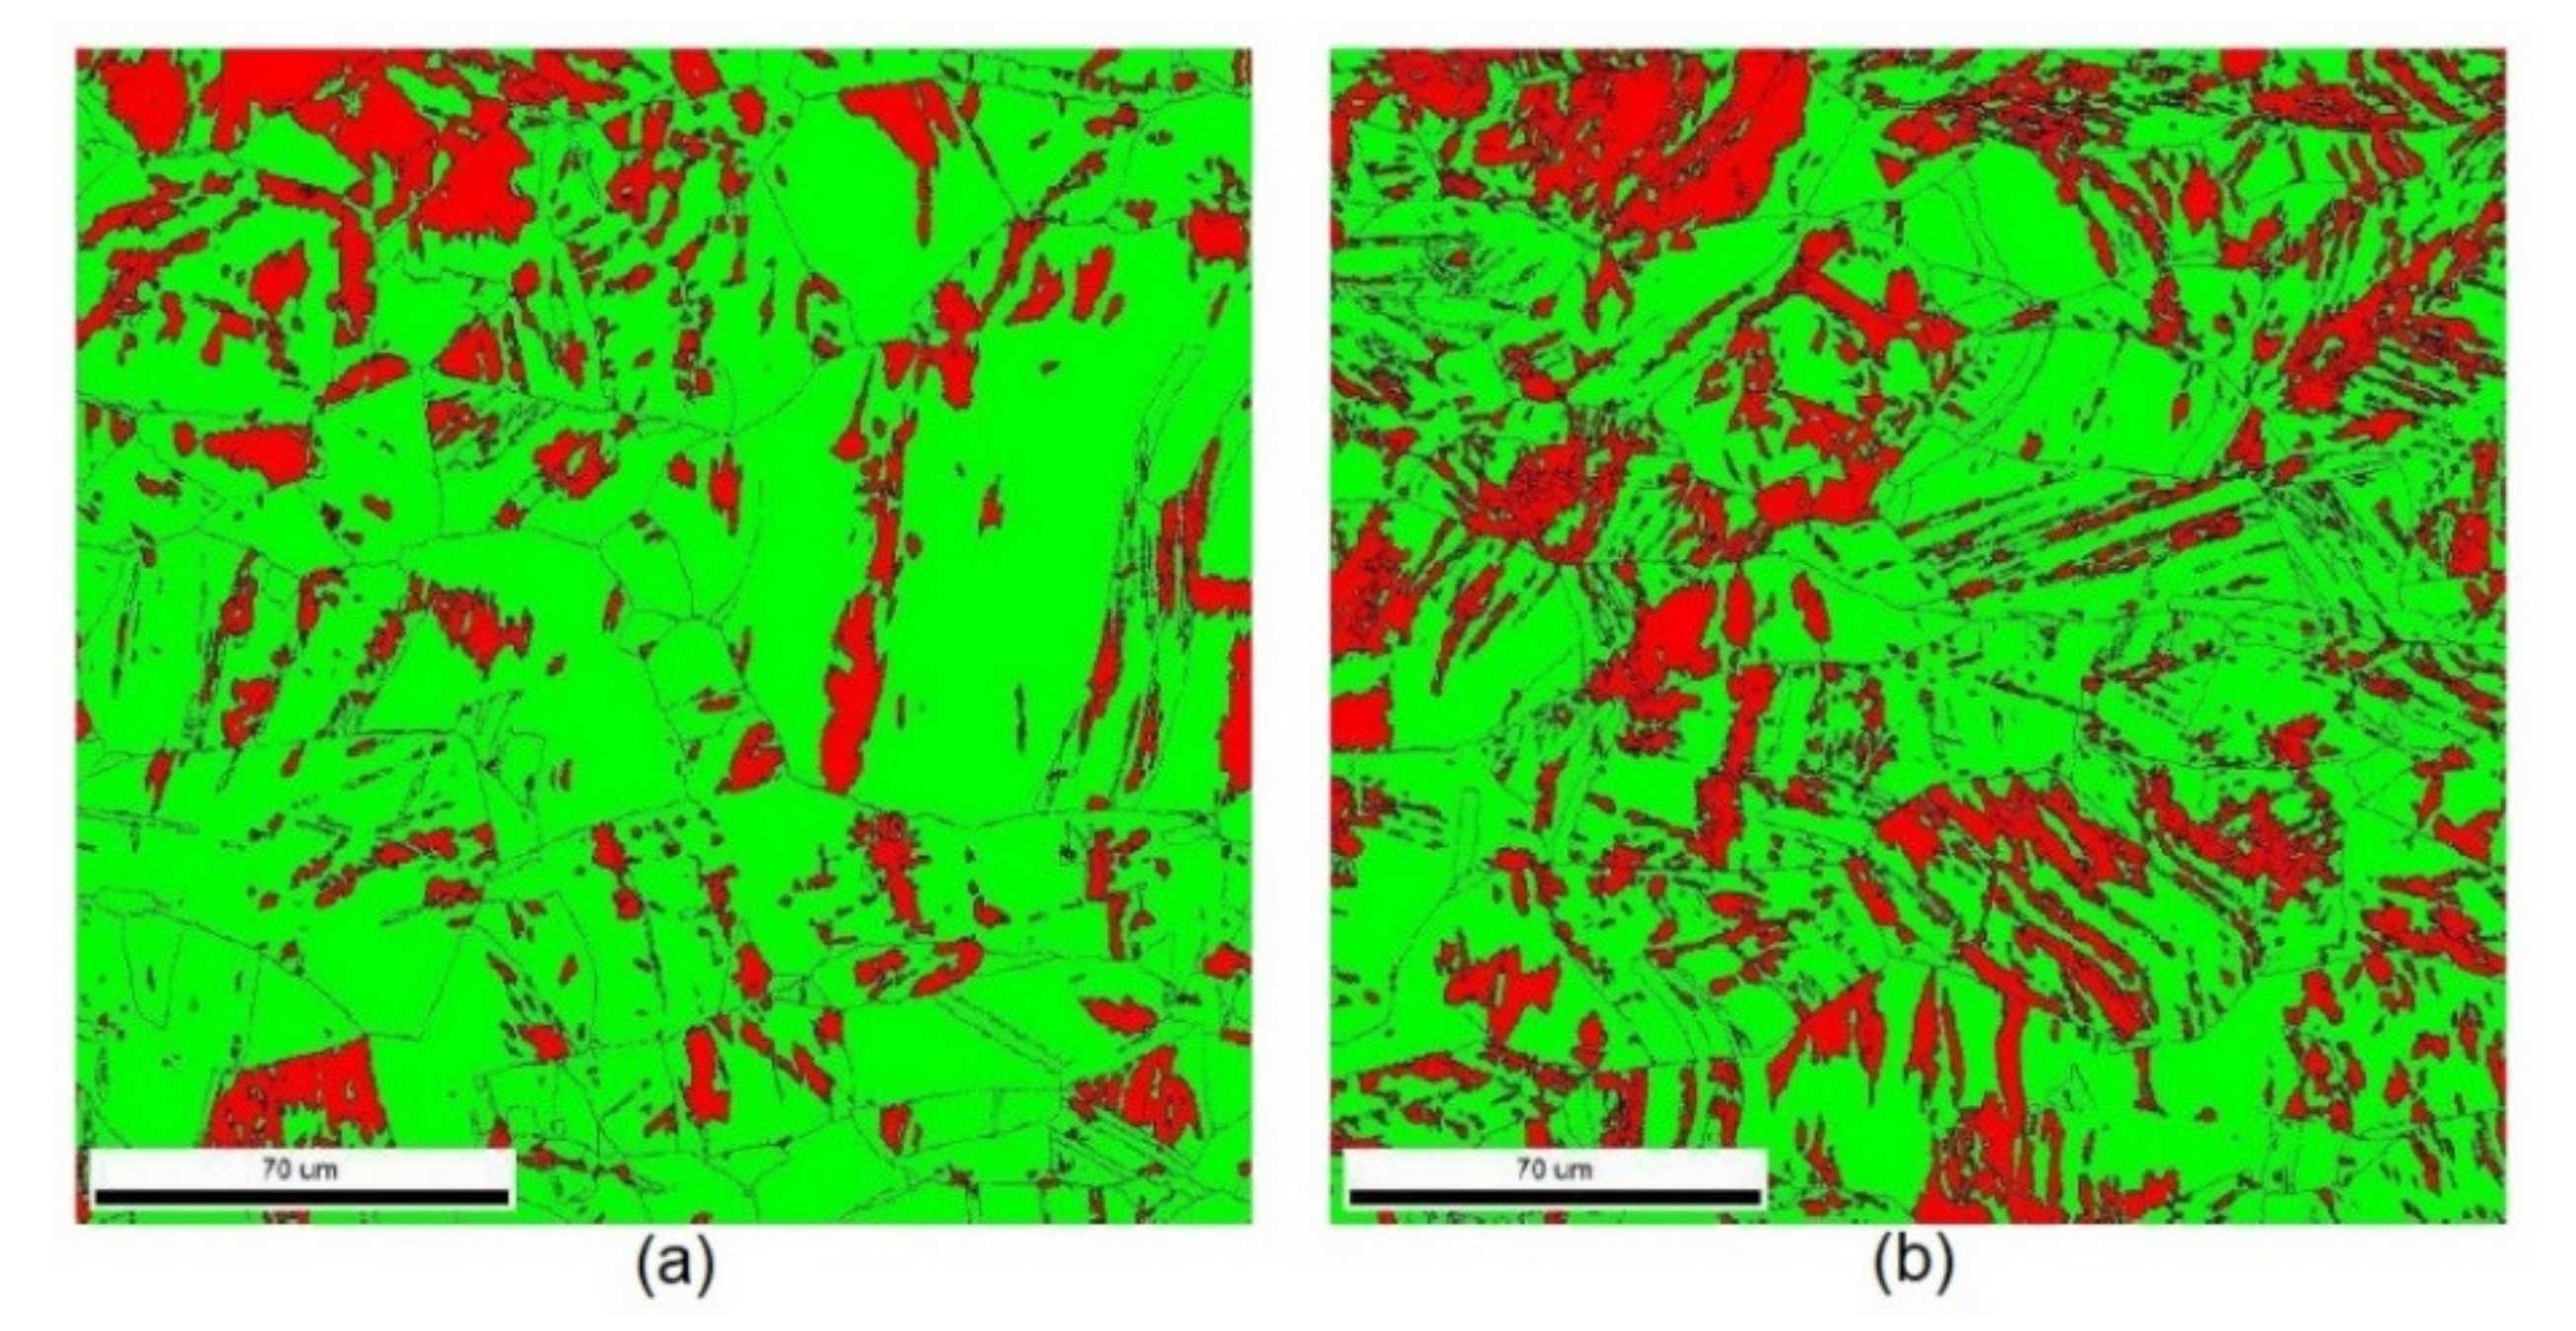
3.1. Metallographic and EBSD Observations

The microstructure, after plastic pre-straining, is illustrated in Figure 3a (for ε = 5%), showing the austenitic equiaxed grains without any evidence of martensite. On the other hand, Figure 3b (for ε = 25%) clearly depicts the martensite phase formed in the austenite matrix. The volume fraction of the martensite phase increases with increasing ε. It is generally considered that the preferential sites for martensite nucleation can be found at the intersection of shear bands [16].
The EBSD technique provides a better colour contrast; Figure 4 demonstrates the initial green austenite phase contrasted to the red martensite one. Figure 4 also shows that the volume of martensite progressively increases with the increasing ε. Additionally, the number and size of the martensite localised islands continually increases with the increasing ε. The increasing number of martensite localised regions is due to the increasing density of the shear band intersections during strain hardening of the austenite matrix.
The hardness of the matrix gradually grows (see Figure 5), owing to the increasing fraction of hard martensite and the superimposing contribution of the increased dislocation density in austenite.

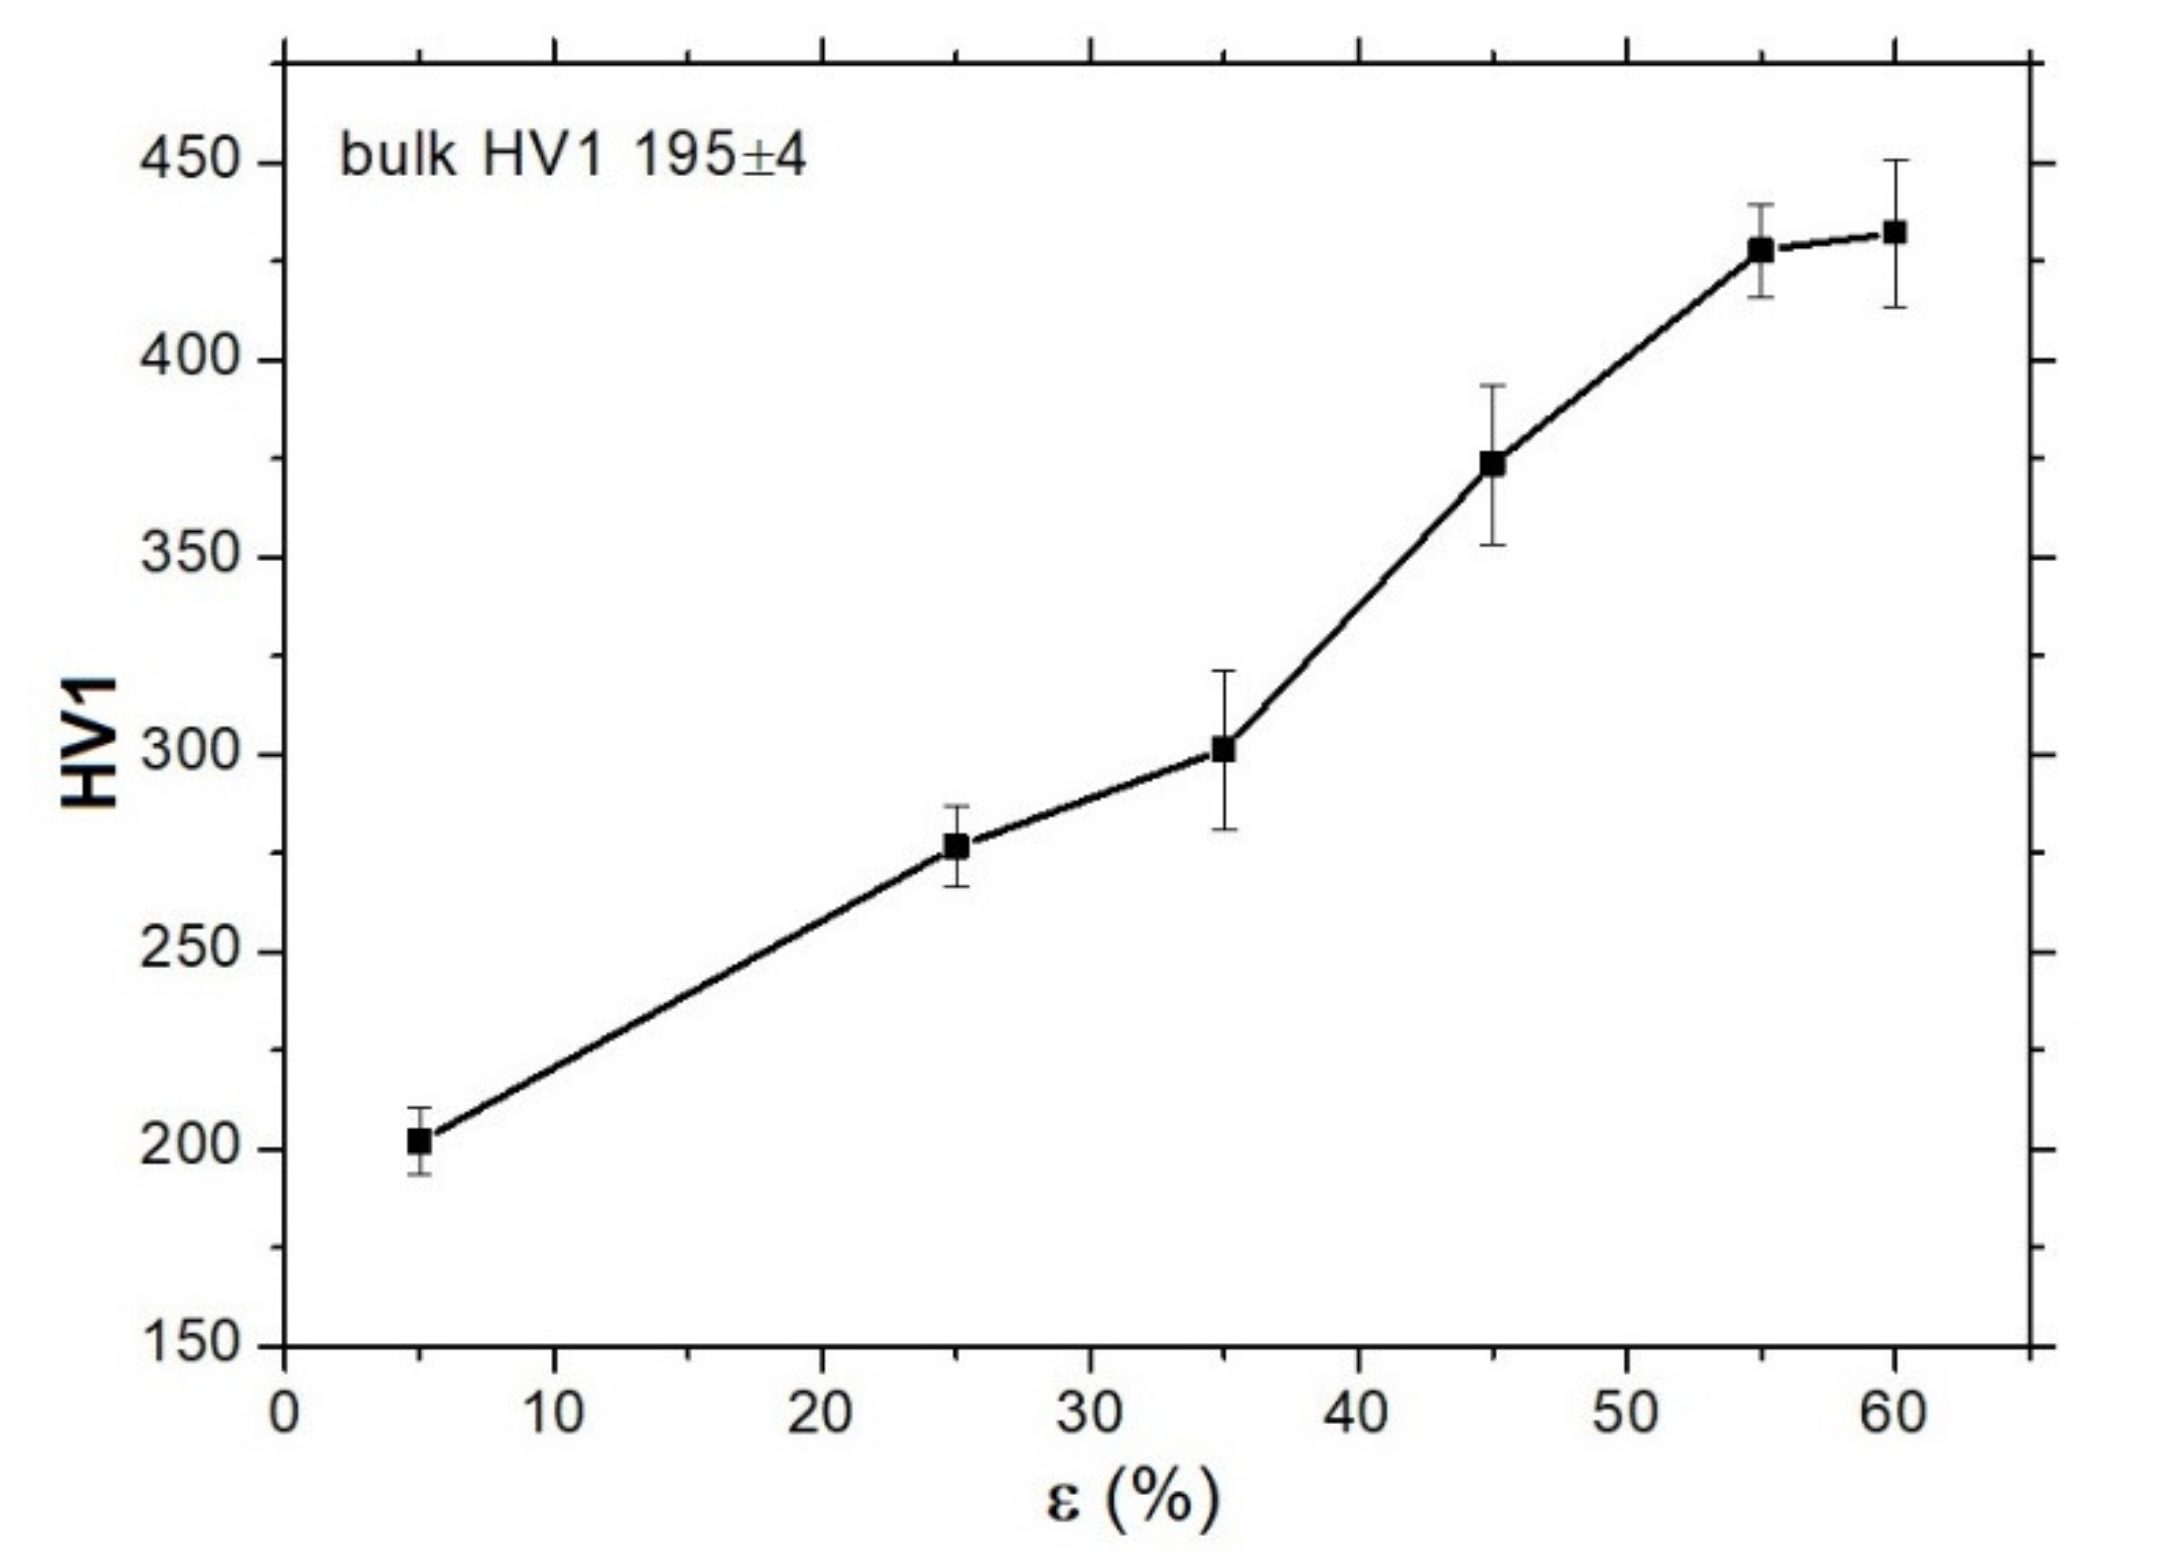
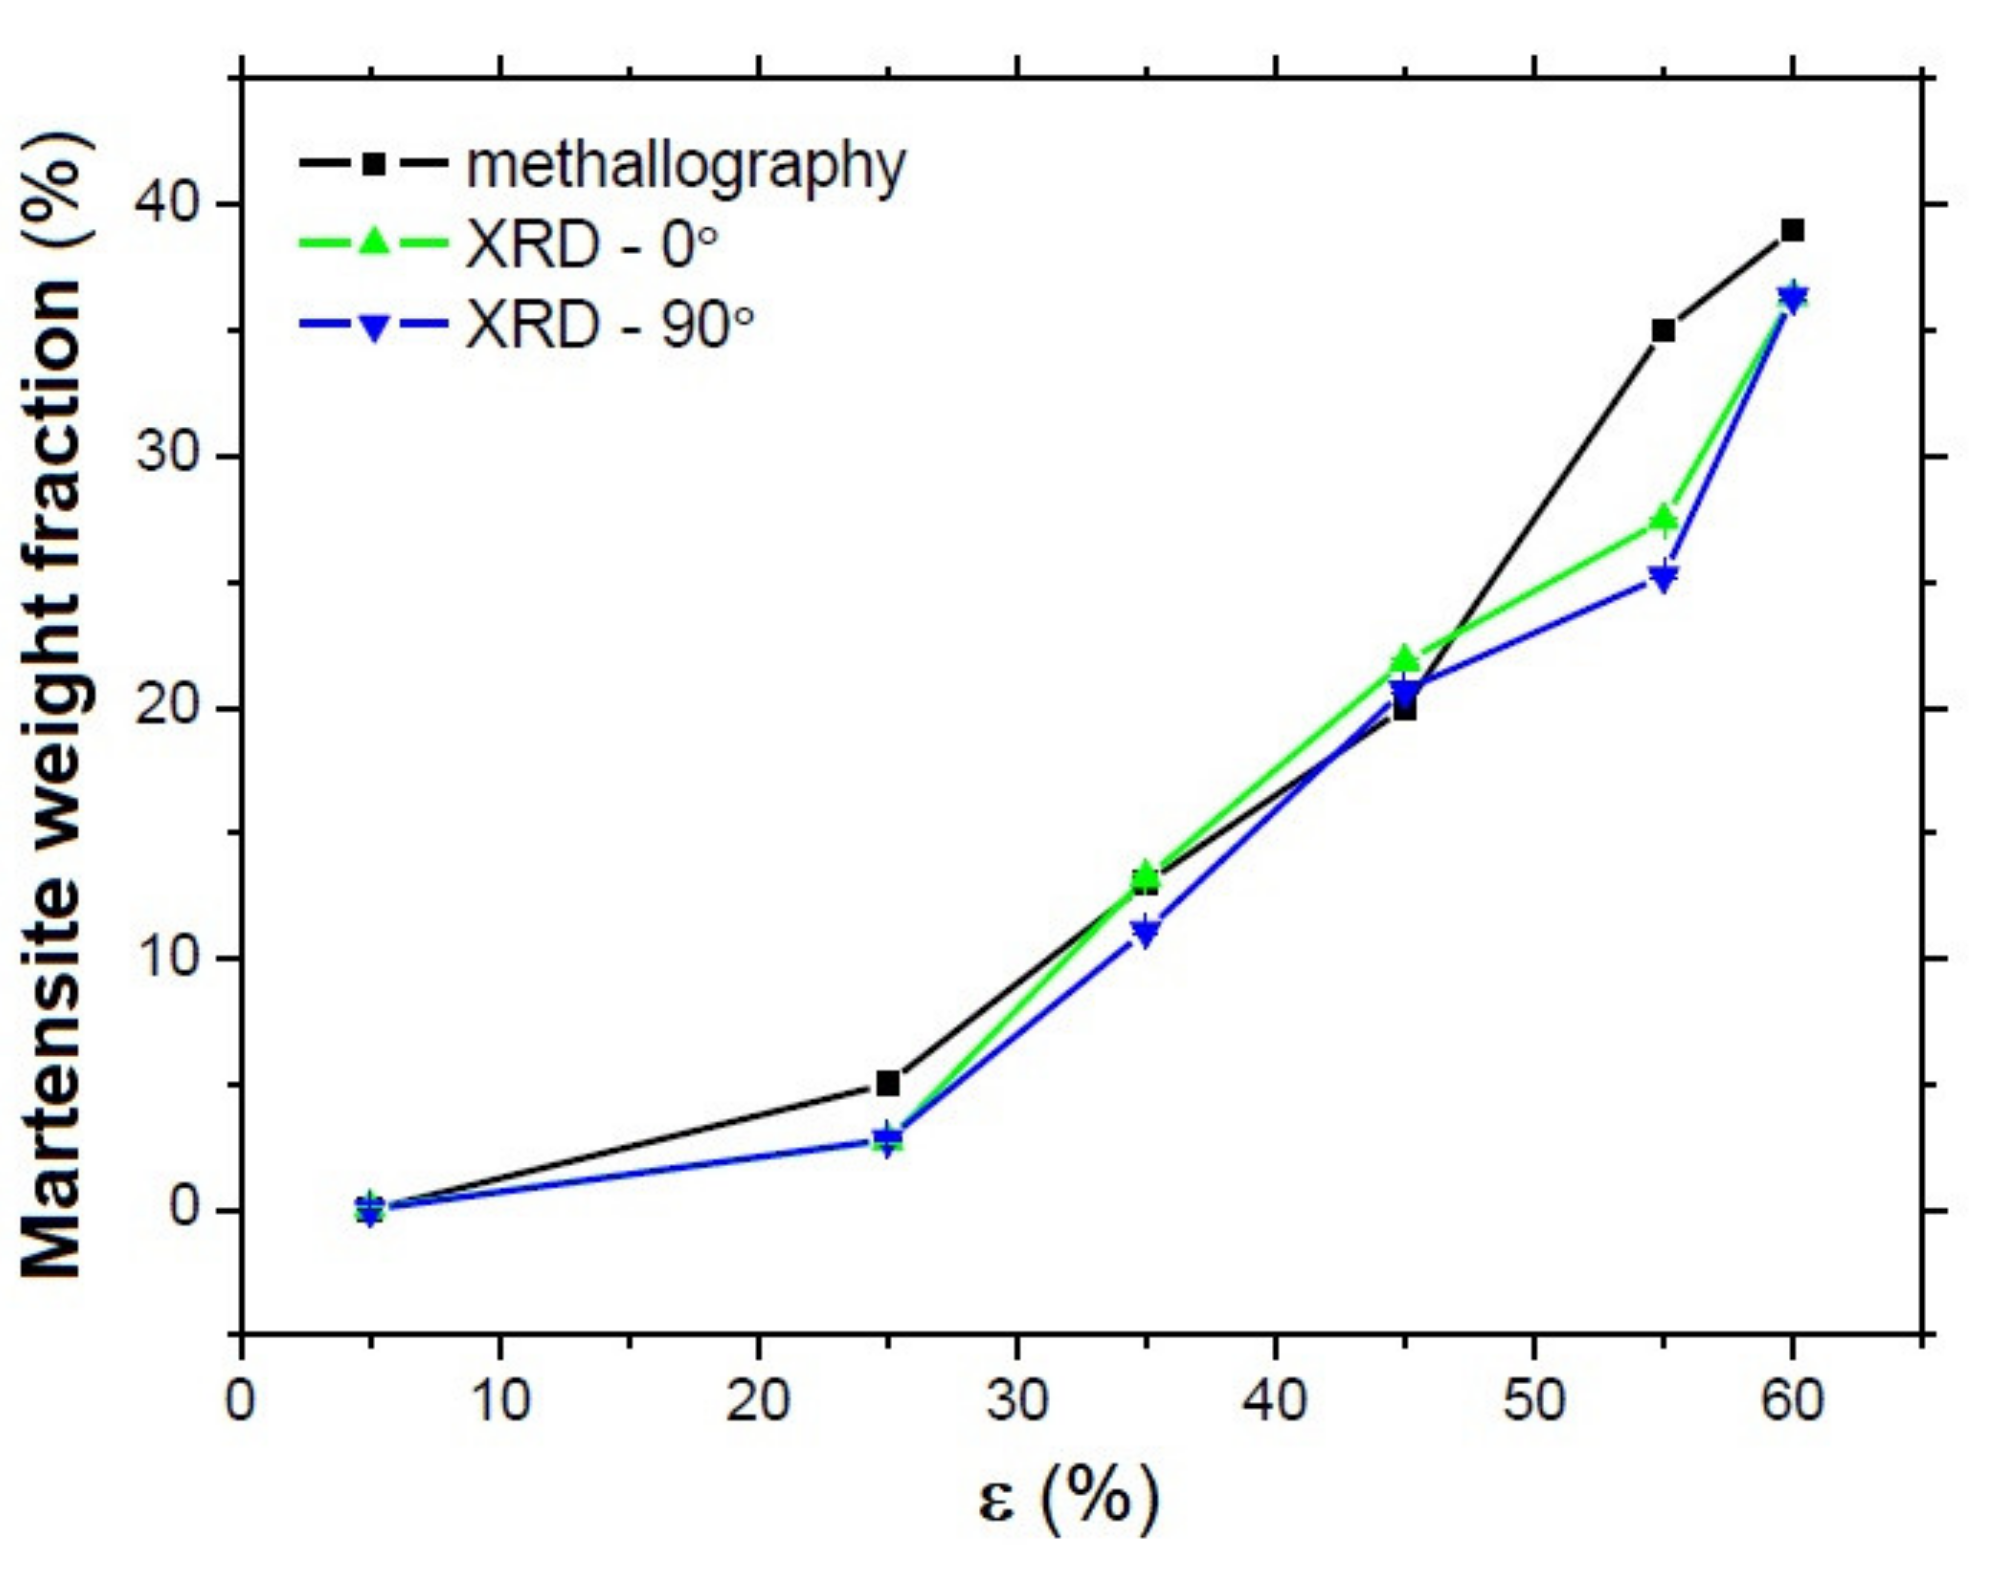
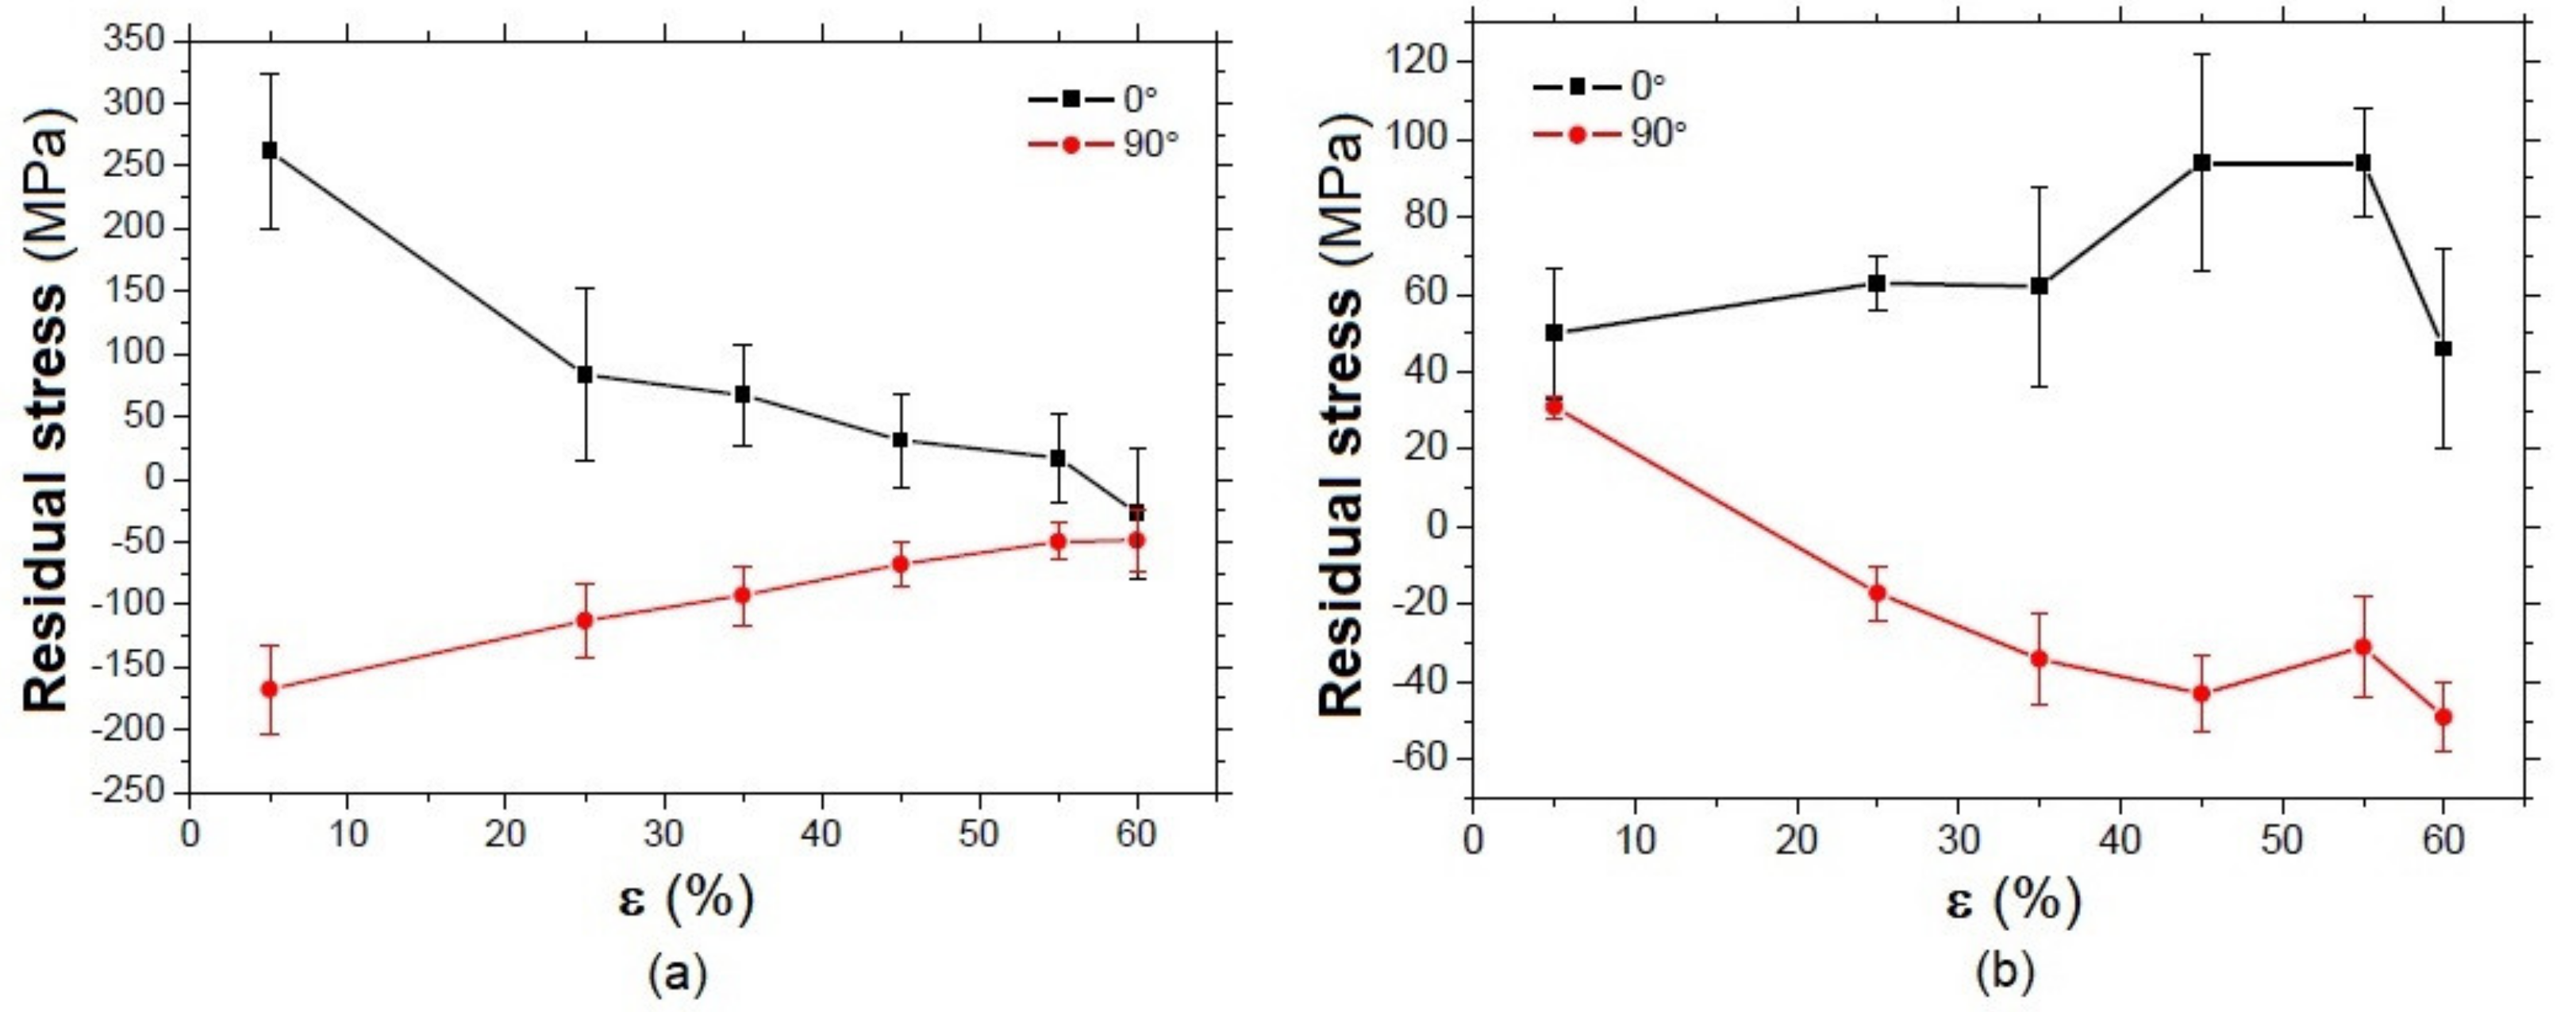
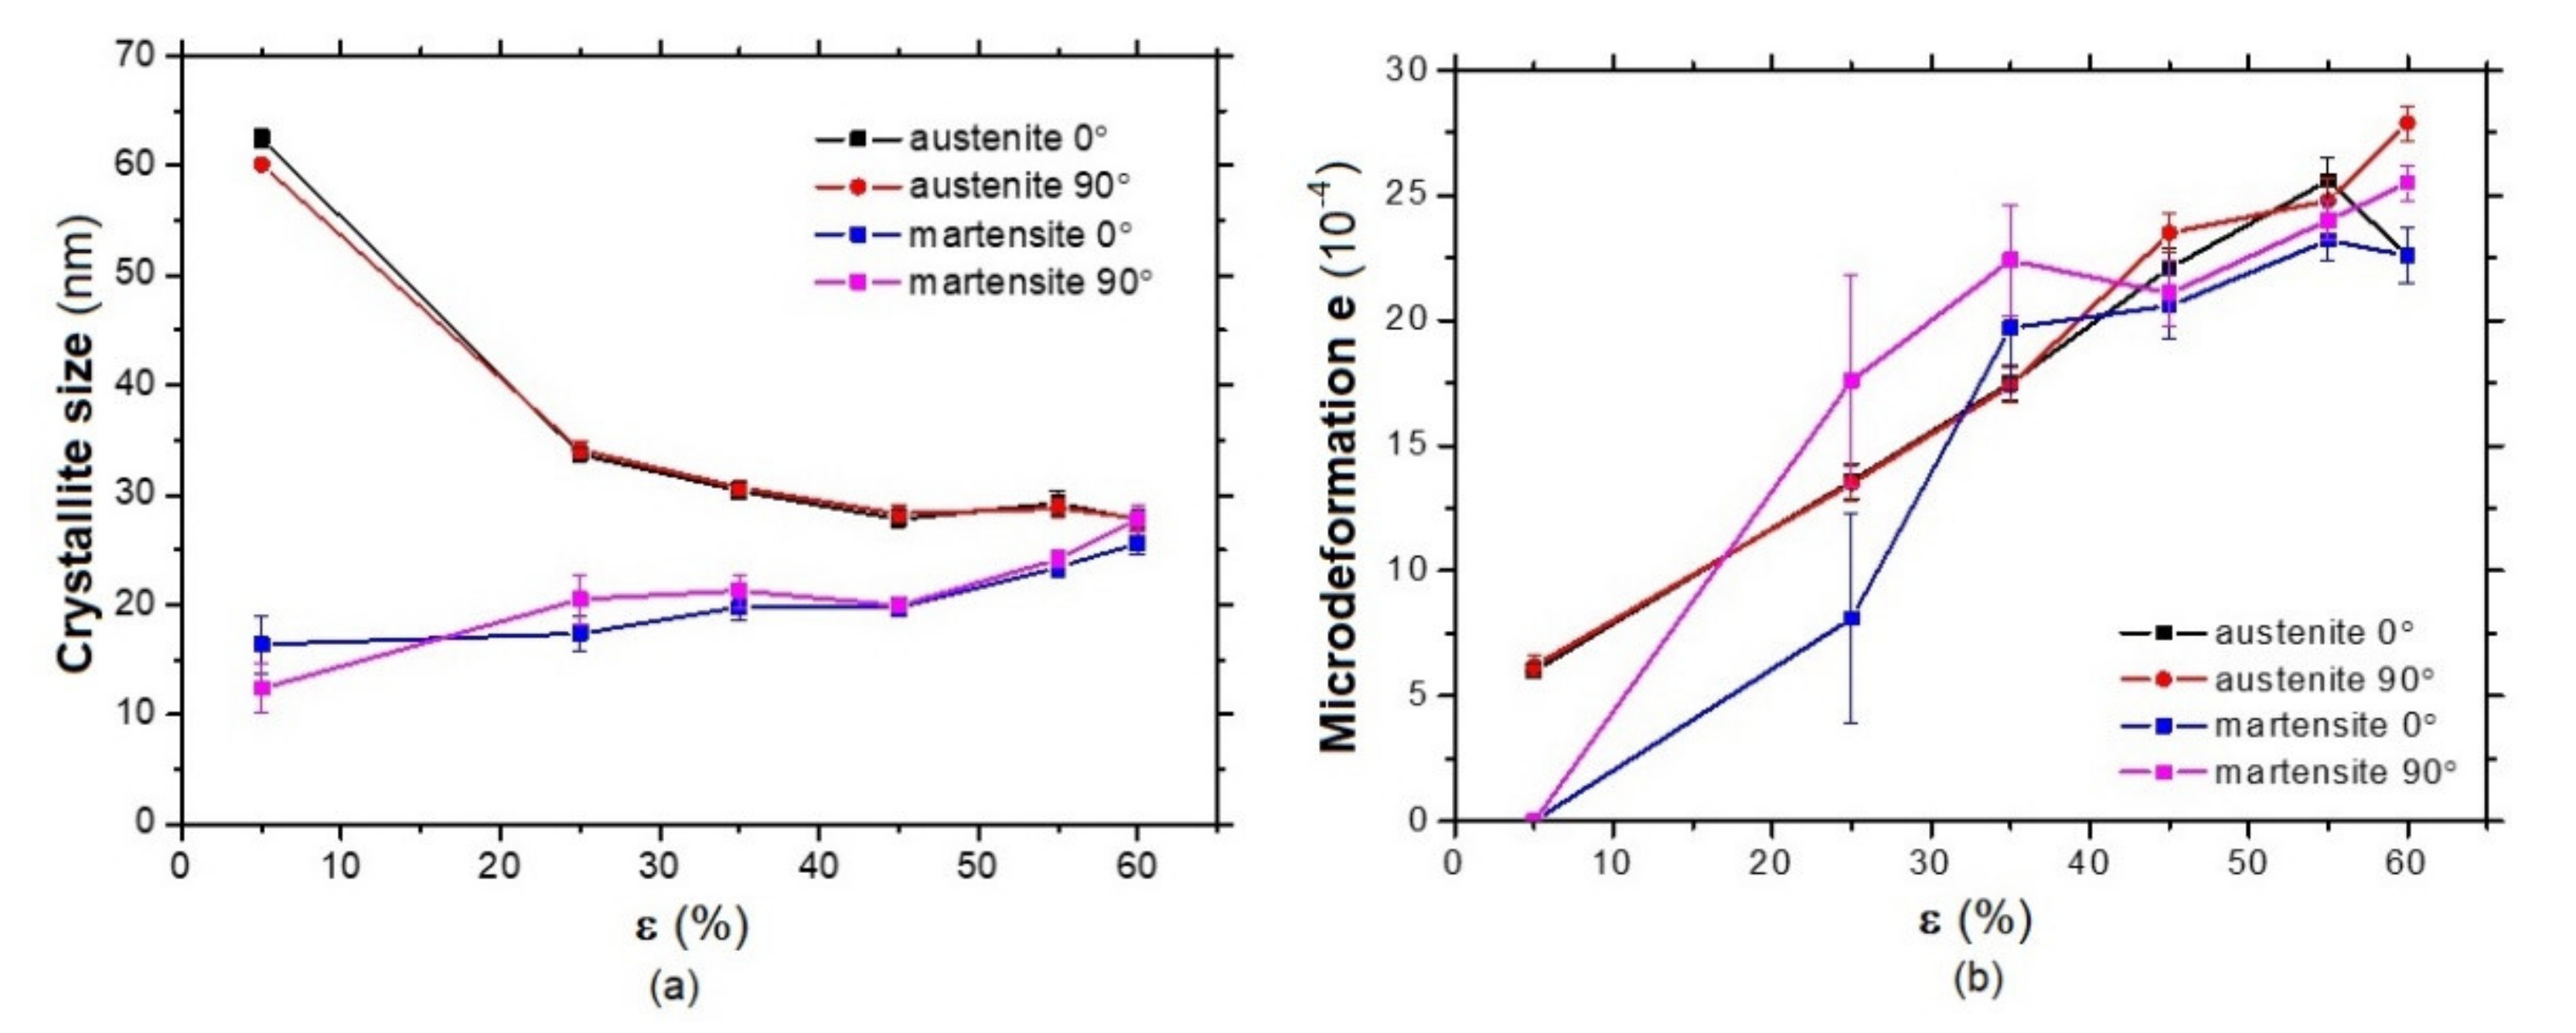
3.2. The XRD Measurements

Figure 6 demonstrates a fraction of the strain-induced martensite phase embedded in the austenite as being nearly the same with respect to the techniques employed for such a purpose. The XRD and EBSD techniques show a progressive increase in the martensite fraction along with the increasing ε.
In the case of metallographic analysis, the martensite volume fraction, fm, can be expressed by the Shin’s equation [17]:
f m = 1 e x p β · ε p l n
where ε p l is the plastic strain, β (=1.9) is the stability parameter and n (=2.6) is the deformation mode parameter.
The presence of different phases and the corresponding phase partitioning is very important, since the alterations of the phases, along with the different degree of plastic straining, significantly differ from those observed in single-phase materials [1]. The main distinction can be found in the strain hardening, which is not exclusively associated with slip dislocations, as the superimposing aspect of the strain-induced phase transformation also plays a significant role.
For instance, component uniaxial tensile straining usually produces compressive residual stresses after unloading [18]. However, Figure 7 clearly illustrates that the martensite phase exhibits progressively decreasing compressive residual stresses versus ε in the direction perpendicular to loading (90°), only if the direction of loading (0°) exhibits mostly tensile stresses which also decrease versus ε. The residual stresses in the austenite phase and the loading direction remain nearly untouched, dropping down slightly with ε in the perpendicular direction. The low magnitudes of residual stresses indicate that the phase transformations during plastic straining consume a high amount of the exerted energy along with sample rehardening.
Additionally, the changes in crystallite size—as shown in Figure 8a—only exhibit a moderate evolution (apart from a quite remarkable initial decrease in austenite from ε = 5%). This figure depicts a minor decrease in the crystallite size in austenite, as the higher ε occurs together with the slow growth of the crystallite size in the strain-induced martensite. On the other hand, microdeformation, in both phases, increases quite rapidly and no valuable difference can be found among different phases and/or directions; see Figure 8b. The higher error in Figure 8b for the plastic strain of 25% is a result of the XRD patterns fitting by the Rietveld refinement performed in the MStruct software. Such large errors occur in the martensite phase only at lower strains, when the initial increase in the martensite phase fraction is initiated. This effect is governed by the low weight fraction of martensite and the corresponding lower intensity of the diffraction peak for this phase.

3.3. Barkhausen Noise Measurements

The preliminary phase of experiments revealed that the first MBN bursts above the background MBN can already be found at the 5% plastic strain. It has already been reported that the background MBN originating from the sensing system is usually very low with respect to the MBN originating from the investigated surface. For this reason, its fraction in the acquired MBN signal can be neglected. However, in this particular case, the MBN emission (especially for ε = 5%) originating from the strain-induced martensite is comparable with the white noise originating from the sensor and decomposition as that reported in [15], which was carried out in order to obtain the pure MBN emission associated only with the strain-induced martensite.
Angular dependence of MBN, as a function of ε, is illustrated in Figure 9. Apart from ε = 5%, the investigated surfaces exhibited a remarkable magnetic anisotropy. MBN progressively increases in all measured directions, along with the increasing plastic strains and the corresponding fraction of strain-induced martensite (a certain saturation can be found for ε = 55 and 60%). The distribution of the MBN measured in different directions demonstrates that the MBN signals are composed of the isotropic component β associated with the randomly oriented DW, and the anisotropic component α associated with the 180° DW, preferentially oriented in the loading direction.
Such a distribution was reported by Krause et al. [19]. The authors introduced the following equation for the angle-dependent MBN:
MBN = α · cos 2 θ + Φ + β
where θ is the angle between the direction of magnetisation field and the easy axis of magnetisation. Figure 10 shows that a low degree of magnetic anisotropy can be found for ε = 5%, when the isotropic component β dominates over the anisotropic one α, followed by the increasing predomination of the anisotropic component for higher ε values.
The MBN envelopes, such as those illustrated in Figure 11, correspond with the angular dependence shown in Figure 11. The easy axis of magnetisation (0° direction) exhibits a higher MBN envelope maxima compared with the hard axis (90° direction). As soon as ε attains 25%, the MBN envelopes for the 0° as well as 90° directions are shifted to the lower magnetic fields. Moreover, the MBN envelopes for the 90° direction can be found at higher magnetic fields compared to those for the 0° direction. For this reason, the corresponding PP for the 90° direction is also higher than that for the 0° direction. Figure 12 demonstrates that the anisotropy expressed by the PP parameter is quite weak for lower values of deformation. For higher deformation values, the anisotropy increases and reaches the saturation point.
An effective (rms) value of MBN can be calculated as follows:
r m s = 1 n · i = 1 n x i 2
where n refers to the number of MBN pulses and Xi their strength. Figure 13 demonstrates that the MBN pulse distribution is remarkably altered by plastic strain. The high number of weak MBN pulses and missing MBN pulses at values above 0.5 V for ε = 5% are in contrast to the lower number of weaker pulses and plentiful MBN pulses in the range of 0.5 up to 2.5 V for ε = 60%. Therefore, MBN (its rms value) grows with an increasing ε, as a result of the increasing magnitude of MBN pulses. It is also worth mentioning that the detected number of MBN pulses does not correspond to the individual DW signal produced by a single domain wall in motion, since domain wall jumping at a magnetising frequency of 125 Hz occurs in the form of avalanches. Therefore, the electromagnetic pulses produced by DW overlap, and the acquisition system is not capable of distinguishing between the individual pulses, despite the sampling frequency of 6.6 MHz.
One might argue that MBN in the 90° direction increases as a result of the decreasing compressive stresses [20], as Figure 7a and Figure 9 demonstrate (also see Figure 14b). However, MBN in the 0° direction also increases versus ε, while tensile stresses tend to decrease (see Figure 14a). Moreover, the decreasing stress anisotropy versus ε is controversial with respect to the increasing MBN anisotropy shown in Figure 10. Such a finding indicates that the influence of residual stresses on MBN is only of minor character, while the microstructure dominates. Bozoroth [21] reported that the influence of matrix inclusions (or defects) in iron-alloys usually dominates over the stress, whereas the high value of magnetostriction in nickel-alloys makes stress the predominant factor that affects the coercive force and the corresponding DW in motion. Néel [22] proposed the following equation for calculating the coercive force:
H c = K 1 · a + K 2 · v
where a is the volume fraction of inclusions, and v is the fraction of the material that is subjected to a large disturbing stress. Néel [22] calculated that K1 for iron is 360 and K2 only 2.1, whereas K1 for nickel is 97 and K2 330. Kondorskij [23] introduced the theory in which the irreversible 180° domain walls motion is a function of stress fluctuation σ in the lattice. Kondorskij reported that the magnetic field necessary for irreversible DW motion grows with stress. The maxima of the field can be found when the DW thickness is equal to the stress field radius, as indicated by Dijkstra and Wert [24]. For these reasons, macrostresses play only a minor role, and the microstresses associated with the lattice defects (microstructure) dominate, as Cullity and Graham also mentioned [25].
On one side, the increasing crystallite size can contribute to increasing the MBN. However, Table 2 clearly shows that microdeformation and the corresponding micro- stresses increase along with the increasing MBN. Such relationship is controversial, since the increasing magnitude of local stress field should hinder the DW motion and decrease the MBN. The increasing weight fraction of martensite prevails in this case and more developed local stress fields only play a minor role. Correlation coefficients for microdeformations (Table 2) demonstrate that the factor plays no role in MBN evolution, and the fraction of strain-induced martensite increases versus ε dominating (see Figure 15a as well as Table 2).
It is worth mentioning, that the sample preparation procedure can also play a certain role in the evolution of plastic straining, as reported before [26,27,28]. The milling cycle employed in this study produces a surface of quite limited alterations in the surface state, with respect to their degree as well as extent towards the dept. However, the results obtained from the samples produced by an alternative method (by using laser cutting, water jet cutting or wire discharge machining) might be slightly different.
Strain induced phase transformation in austenitic steels is not only a function of plastic strain, but further aspects should also be considered, such as the variable deformation speed, the influence of temperature or/and the chemical composition. Moreover, the experimental data can be used in order to validate the predictive models reported in the past [29,30,31]. These aspects should be investigated in the near future.
The information about phase transformation, employed experimental techniques and the corresponding MBN emissions can be considered as the methodology for investigation of similar aspects in ferromagnetic bodies that are not only associated with the uniaxial straining, but also in terms of the surface alterations initiated by other manufacturing processes. Moreover, the MBN technique could be beneficial not only for monitoring of Fe alloy components, but also for those based on Ni and Co as the well-known ferromagnetic elements [32,33].

4. Conclusions

The findings of this study can be summarised as follows:
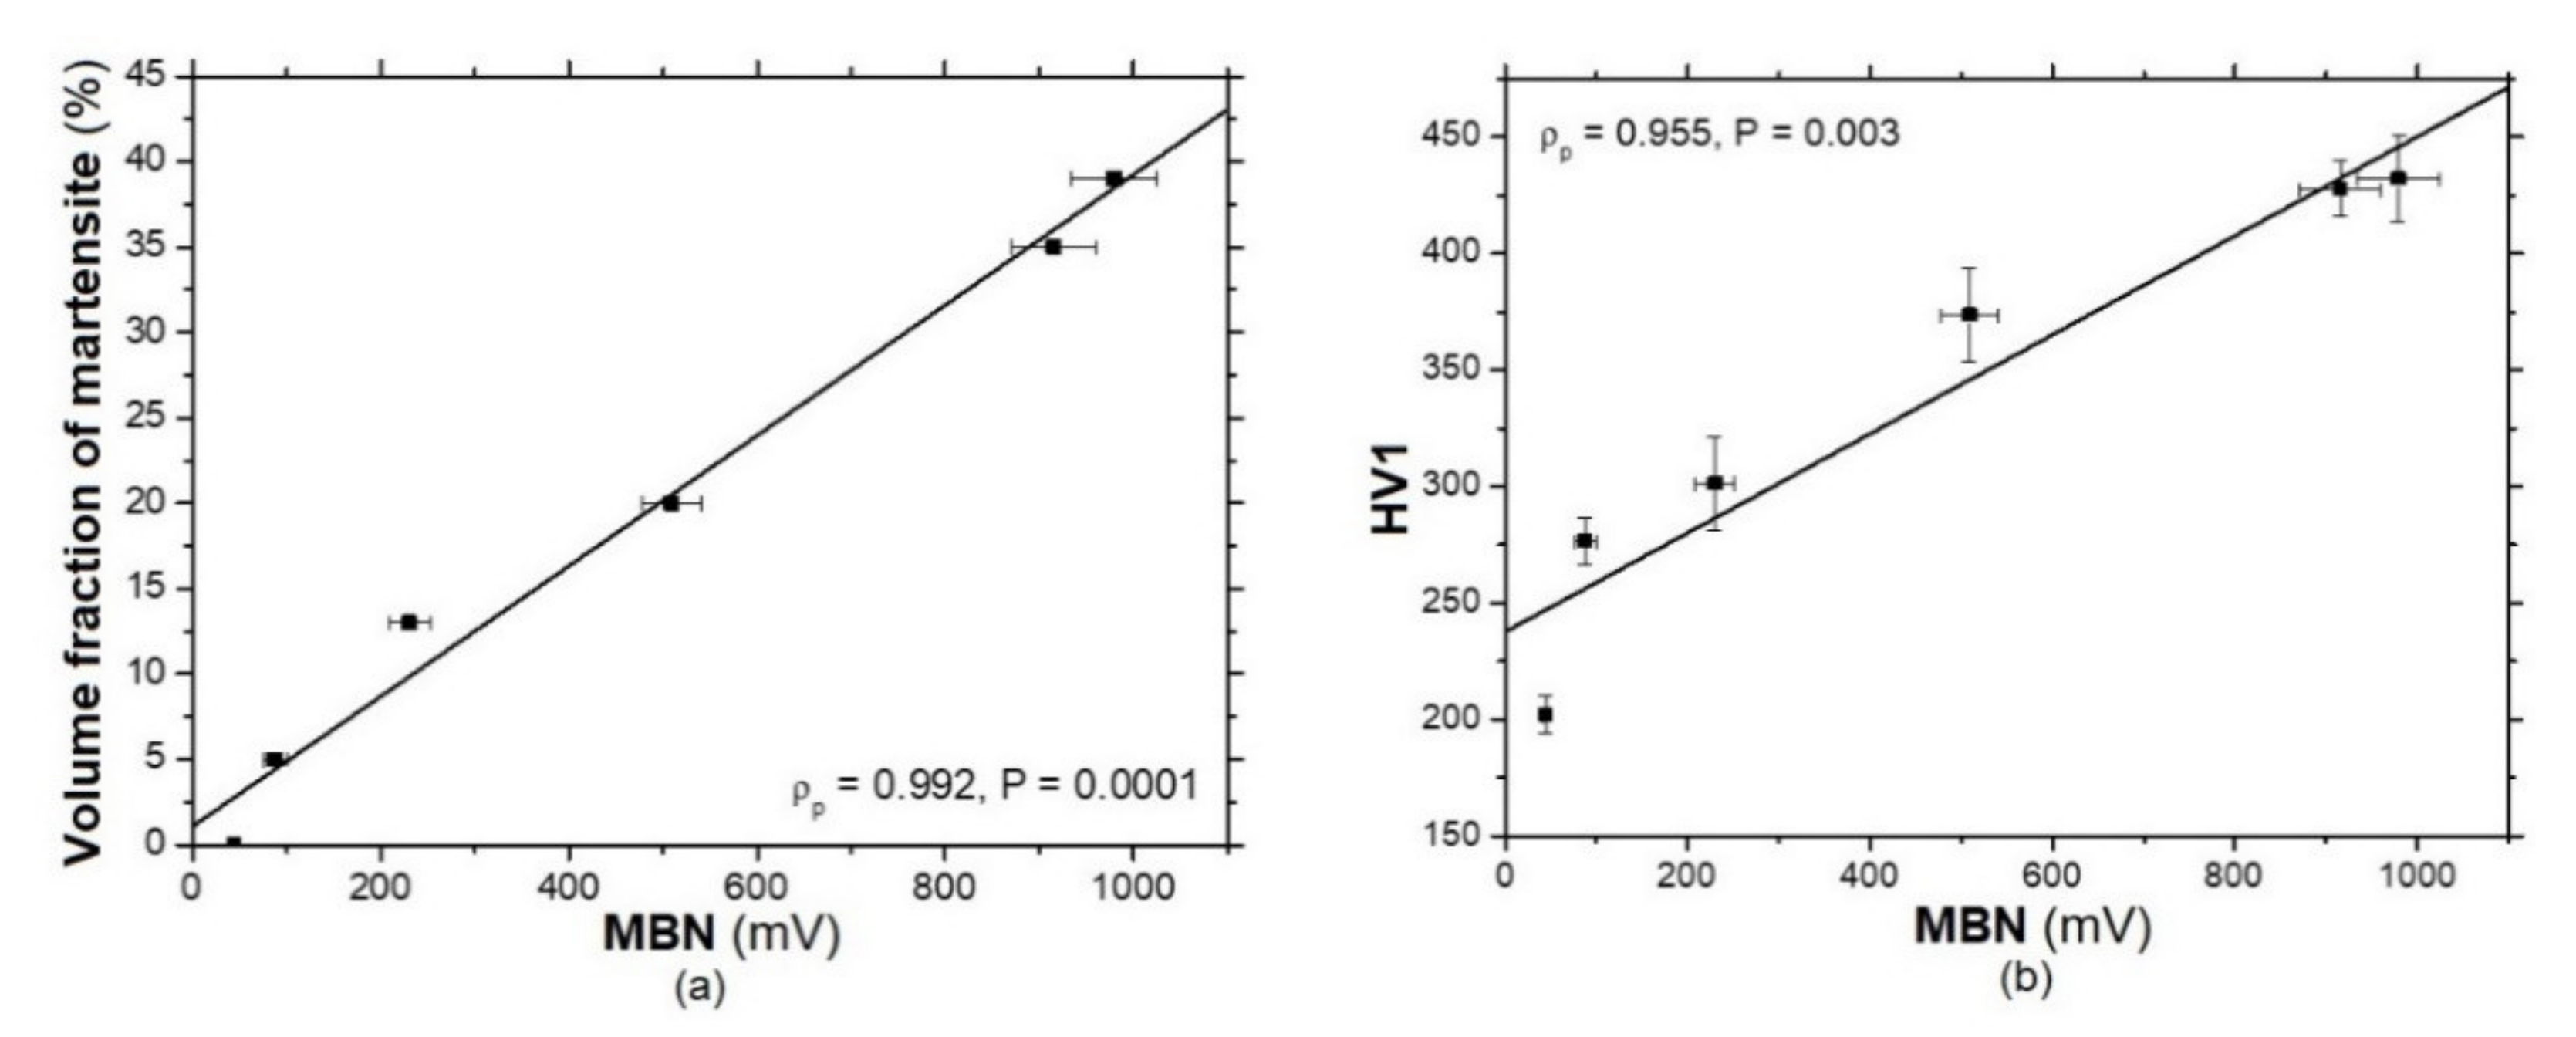
  • the MBN technique demonstrates high sensitivity to revealing the strain-induced martensite transformation in AISI 321 austenitic stainless steel during uniaxial plastic straining;
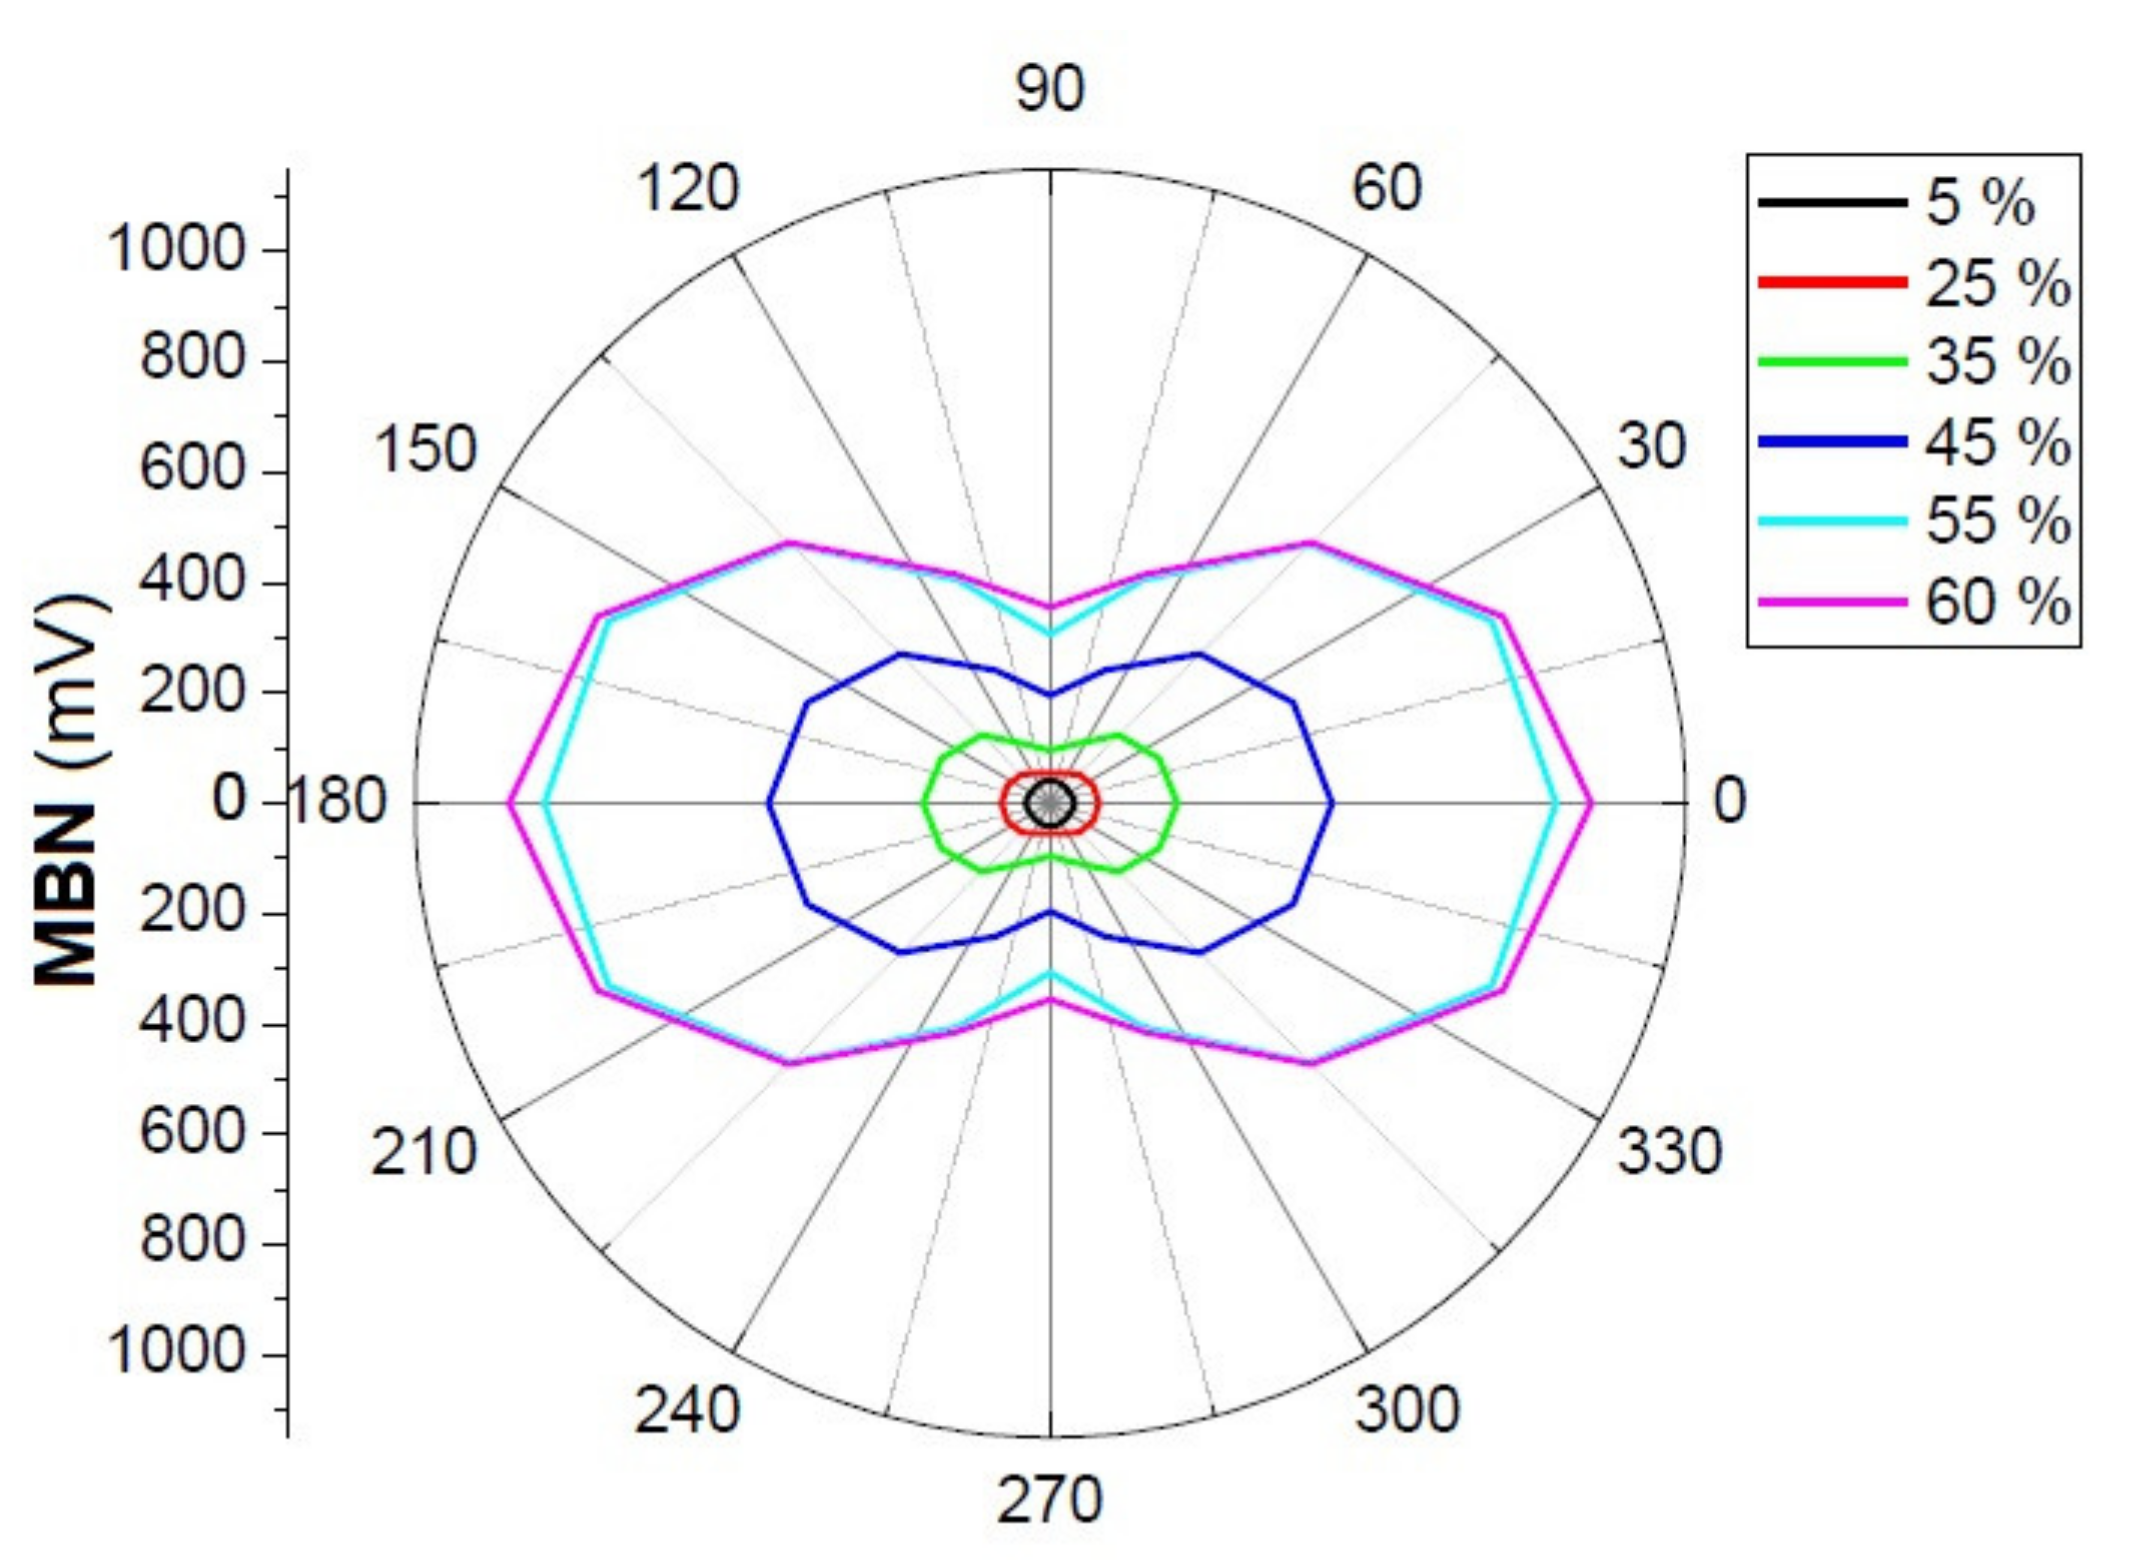
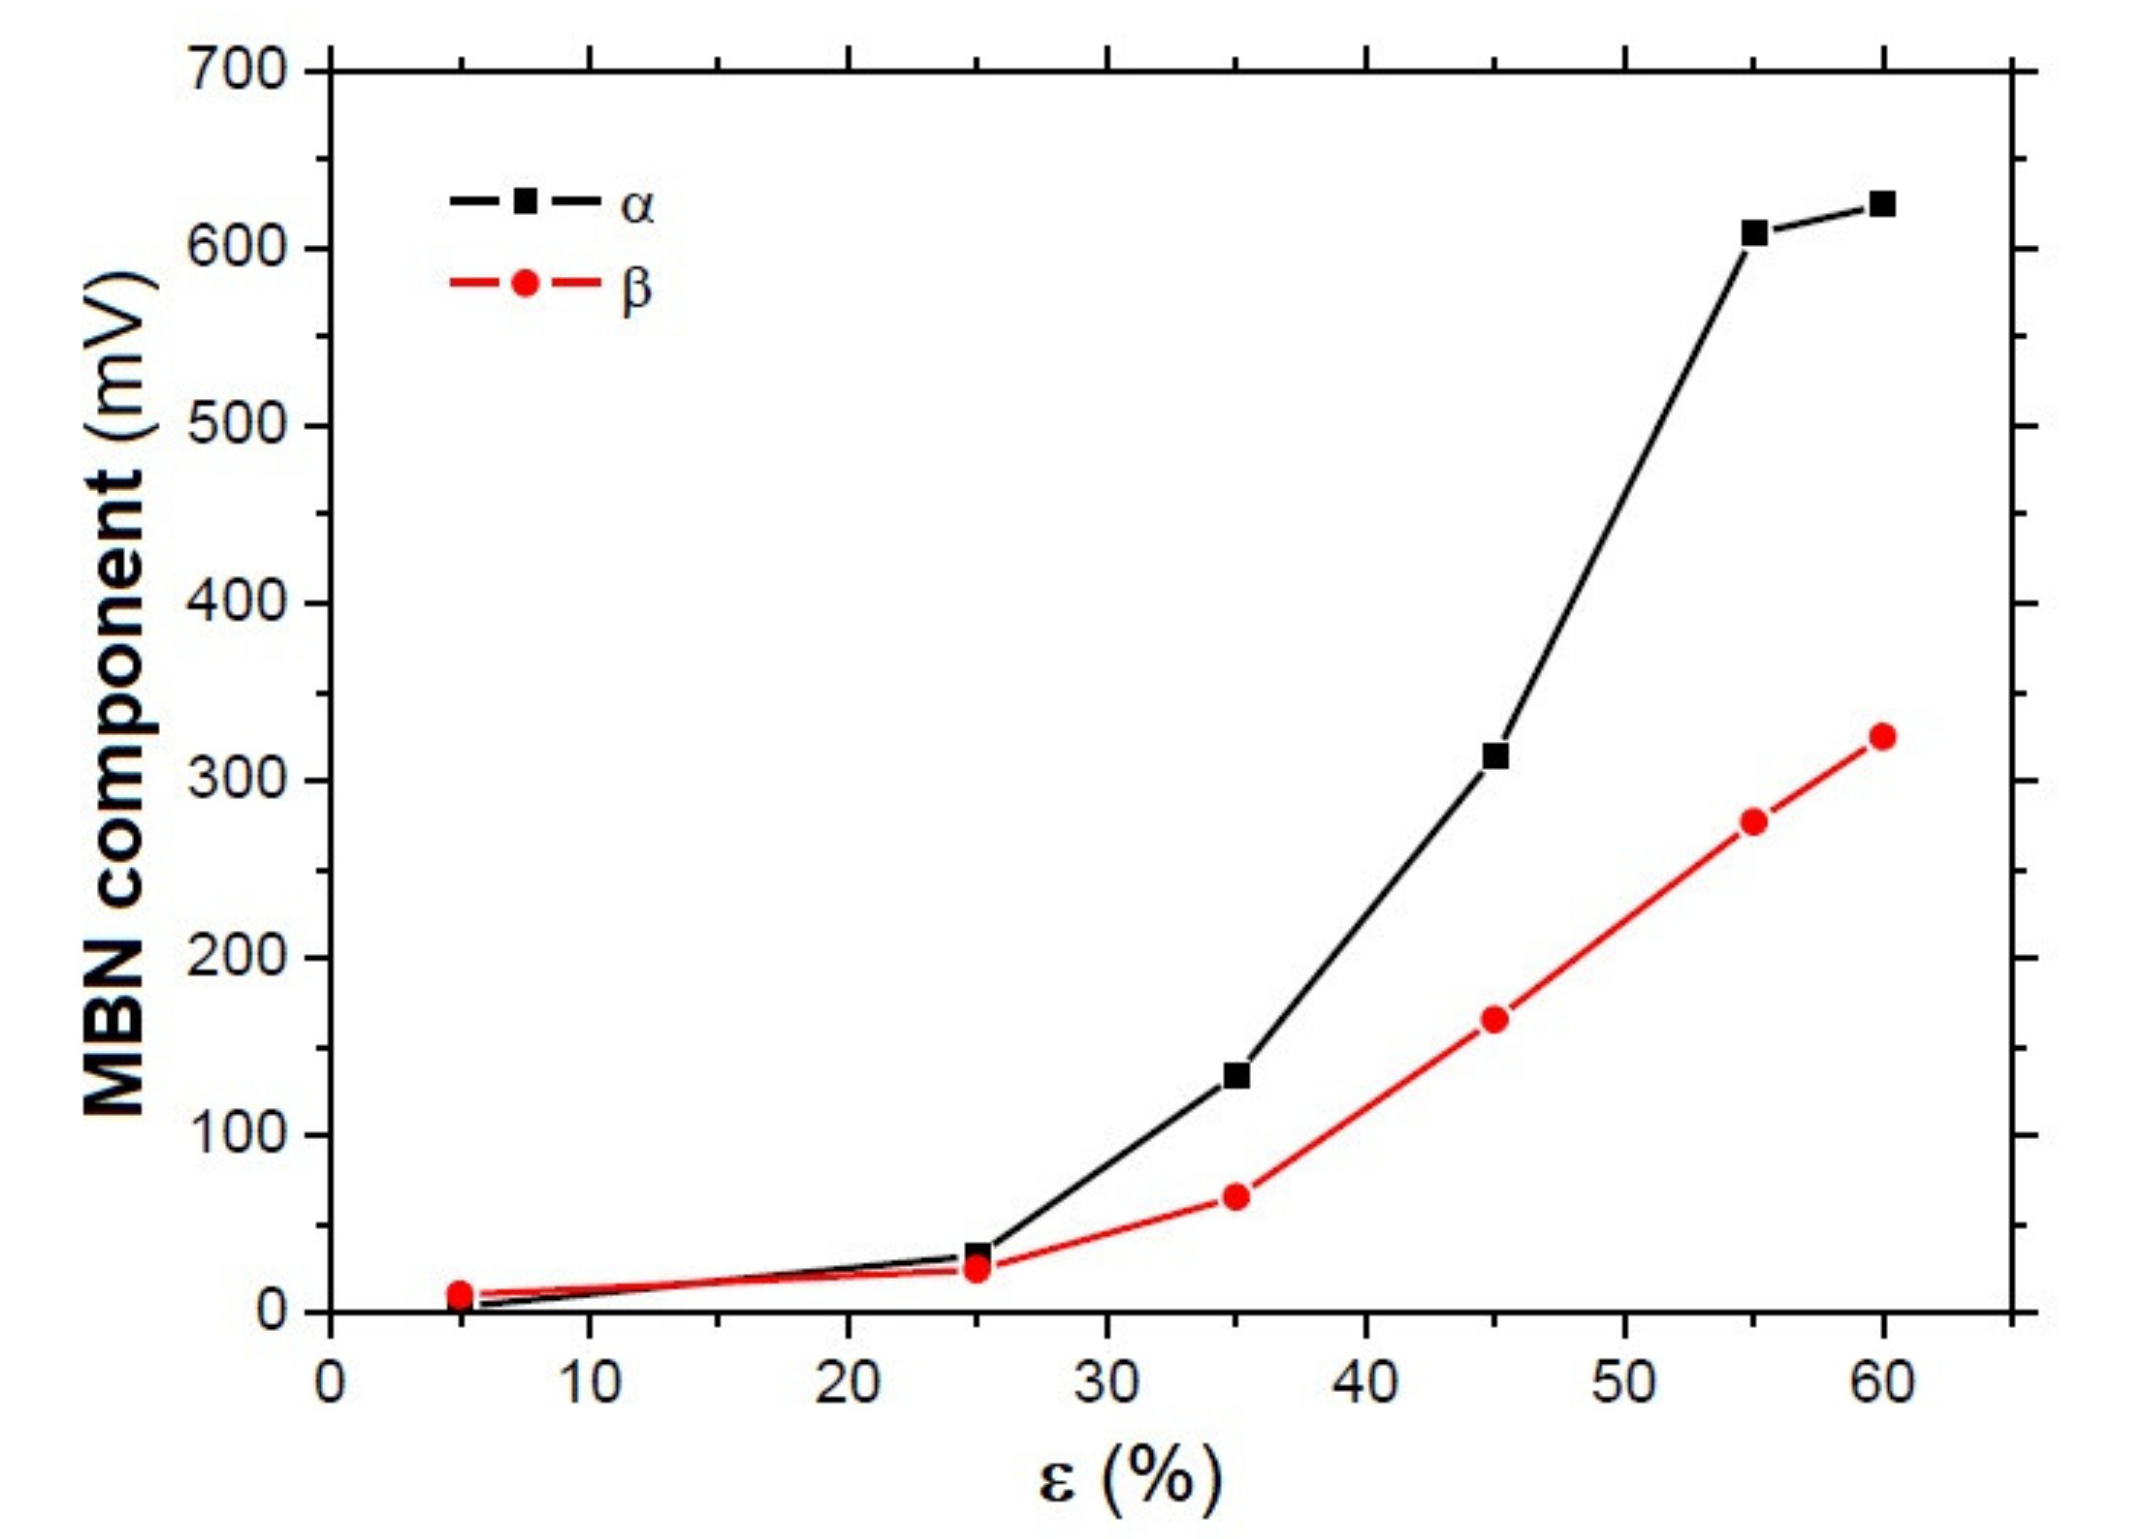
  • the martensite matrix exhibits remarkable magnetic anisotropy that increases with ε;
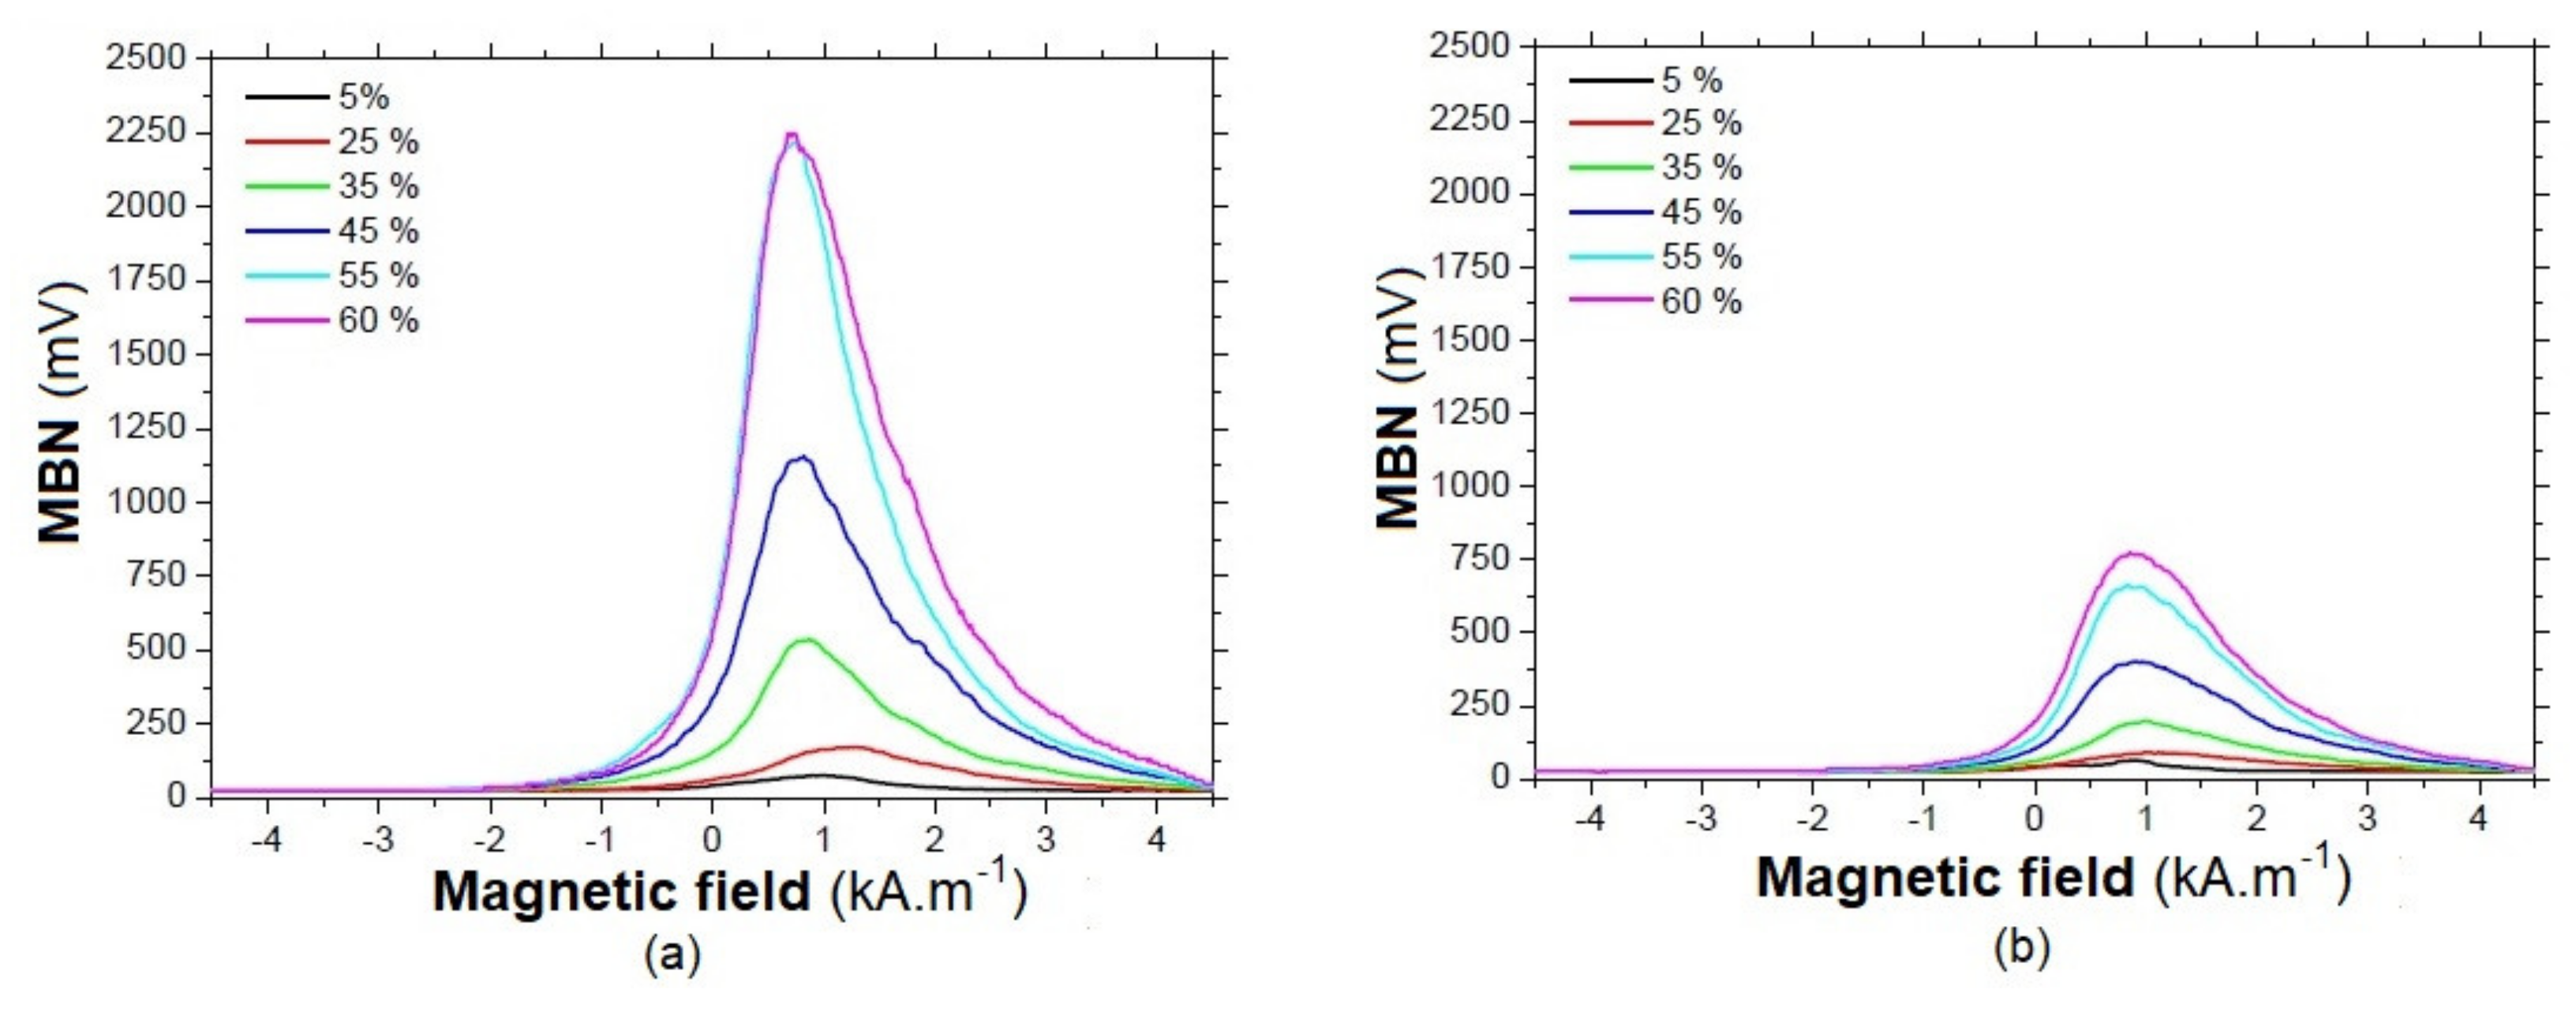
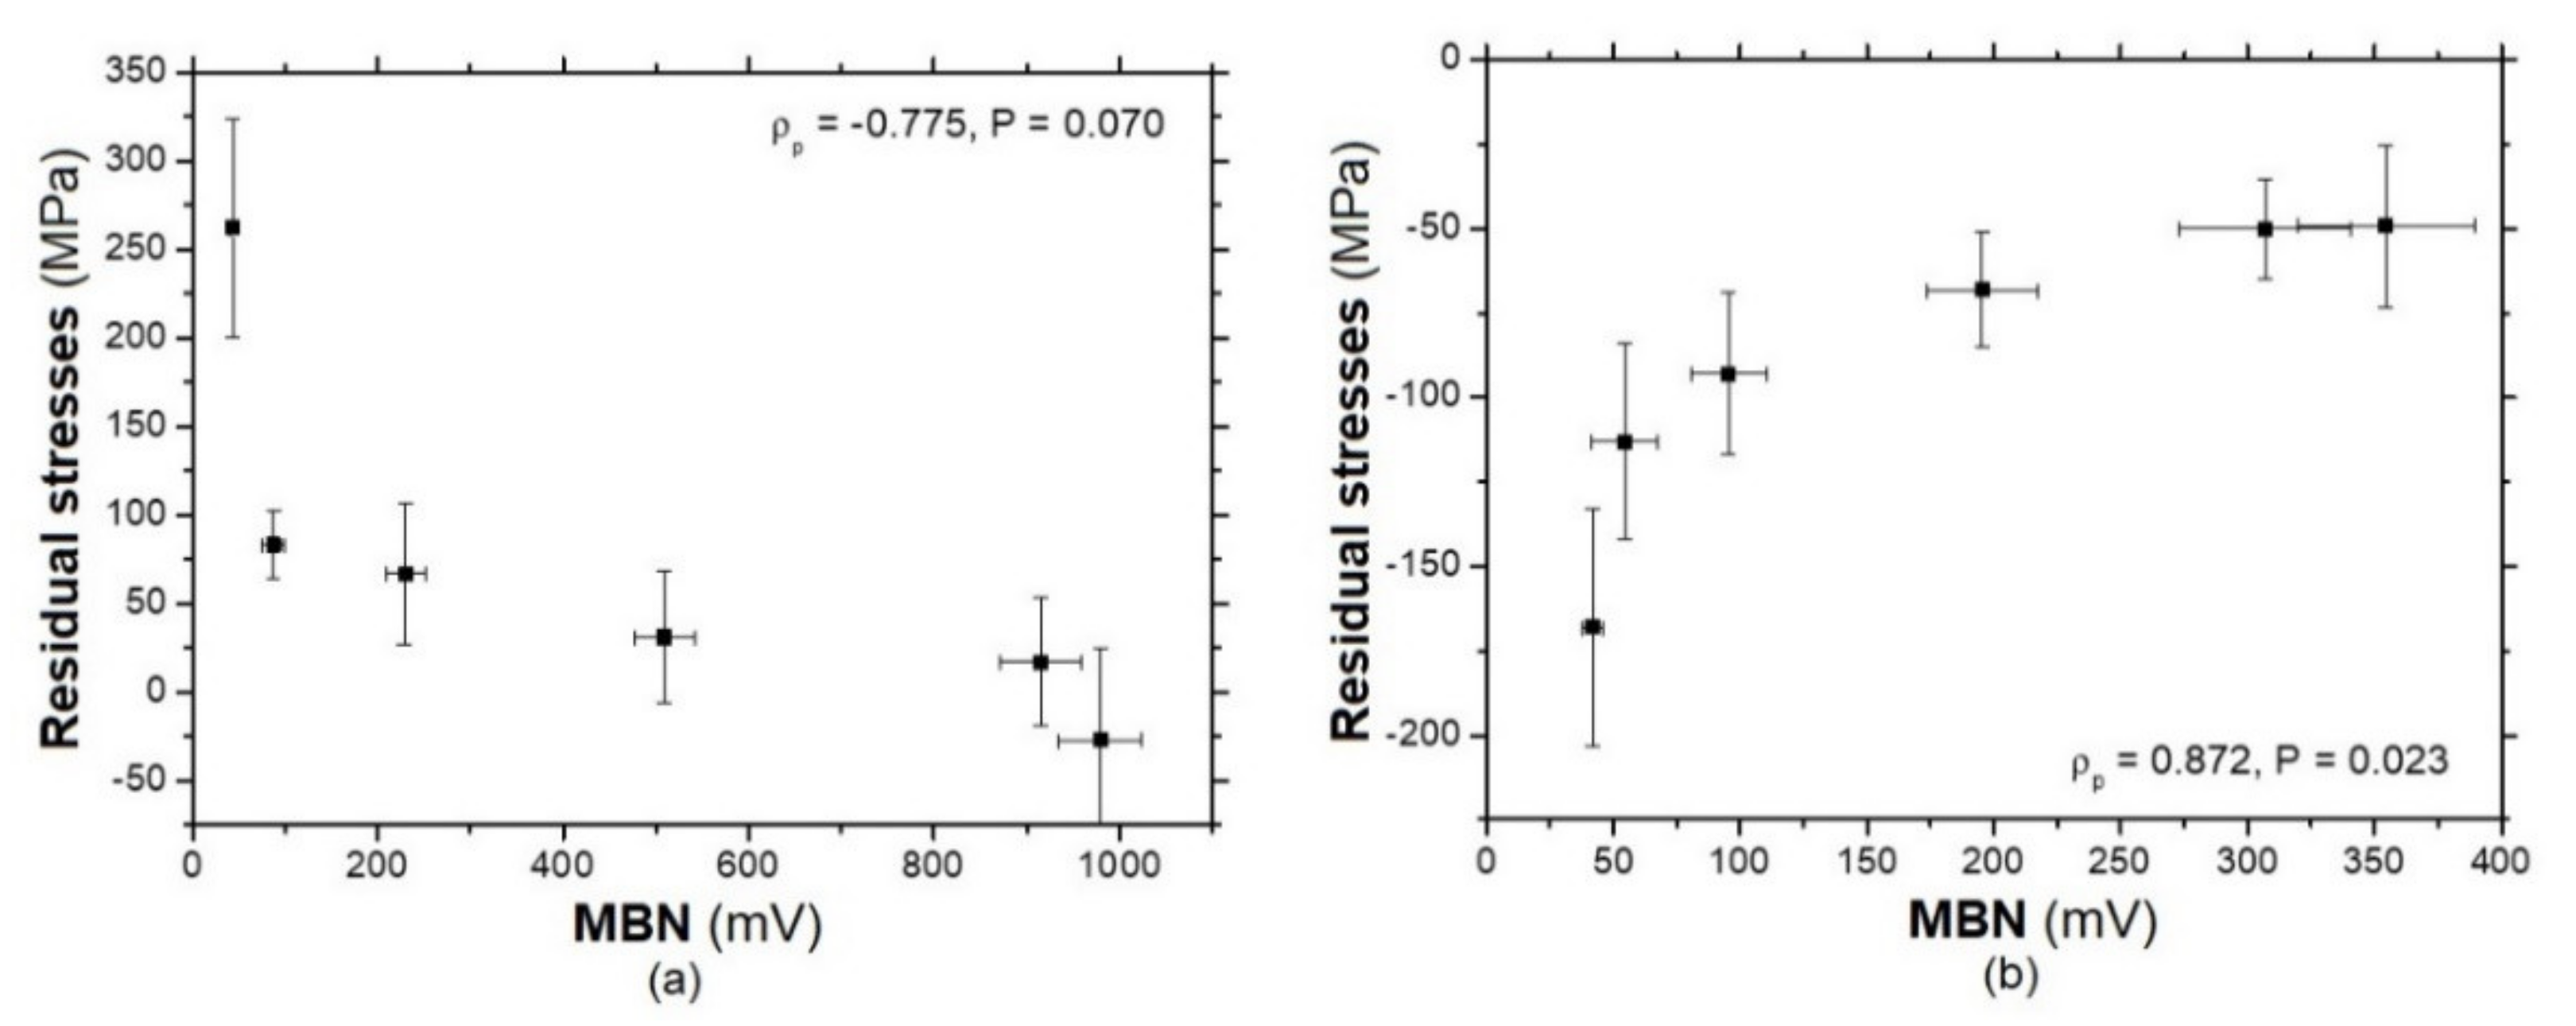
  • MBN increases along with the increasing fraction of strain-induced martensite, while residual stresses play nearly no role in the MBN evolution;
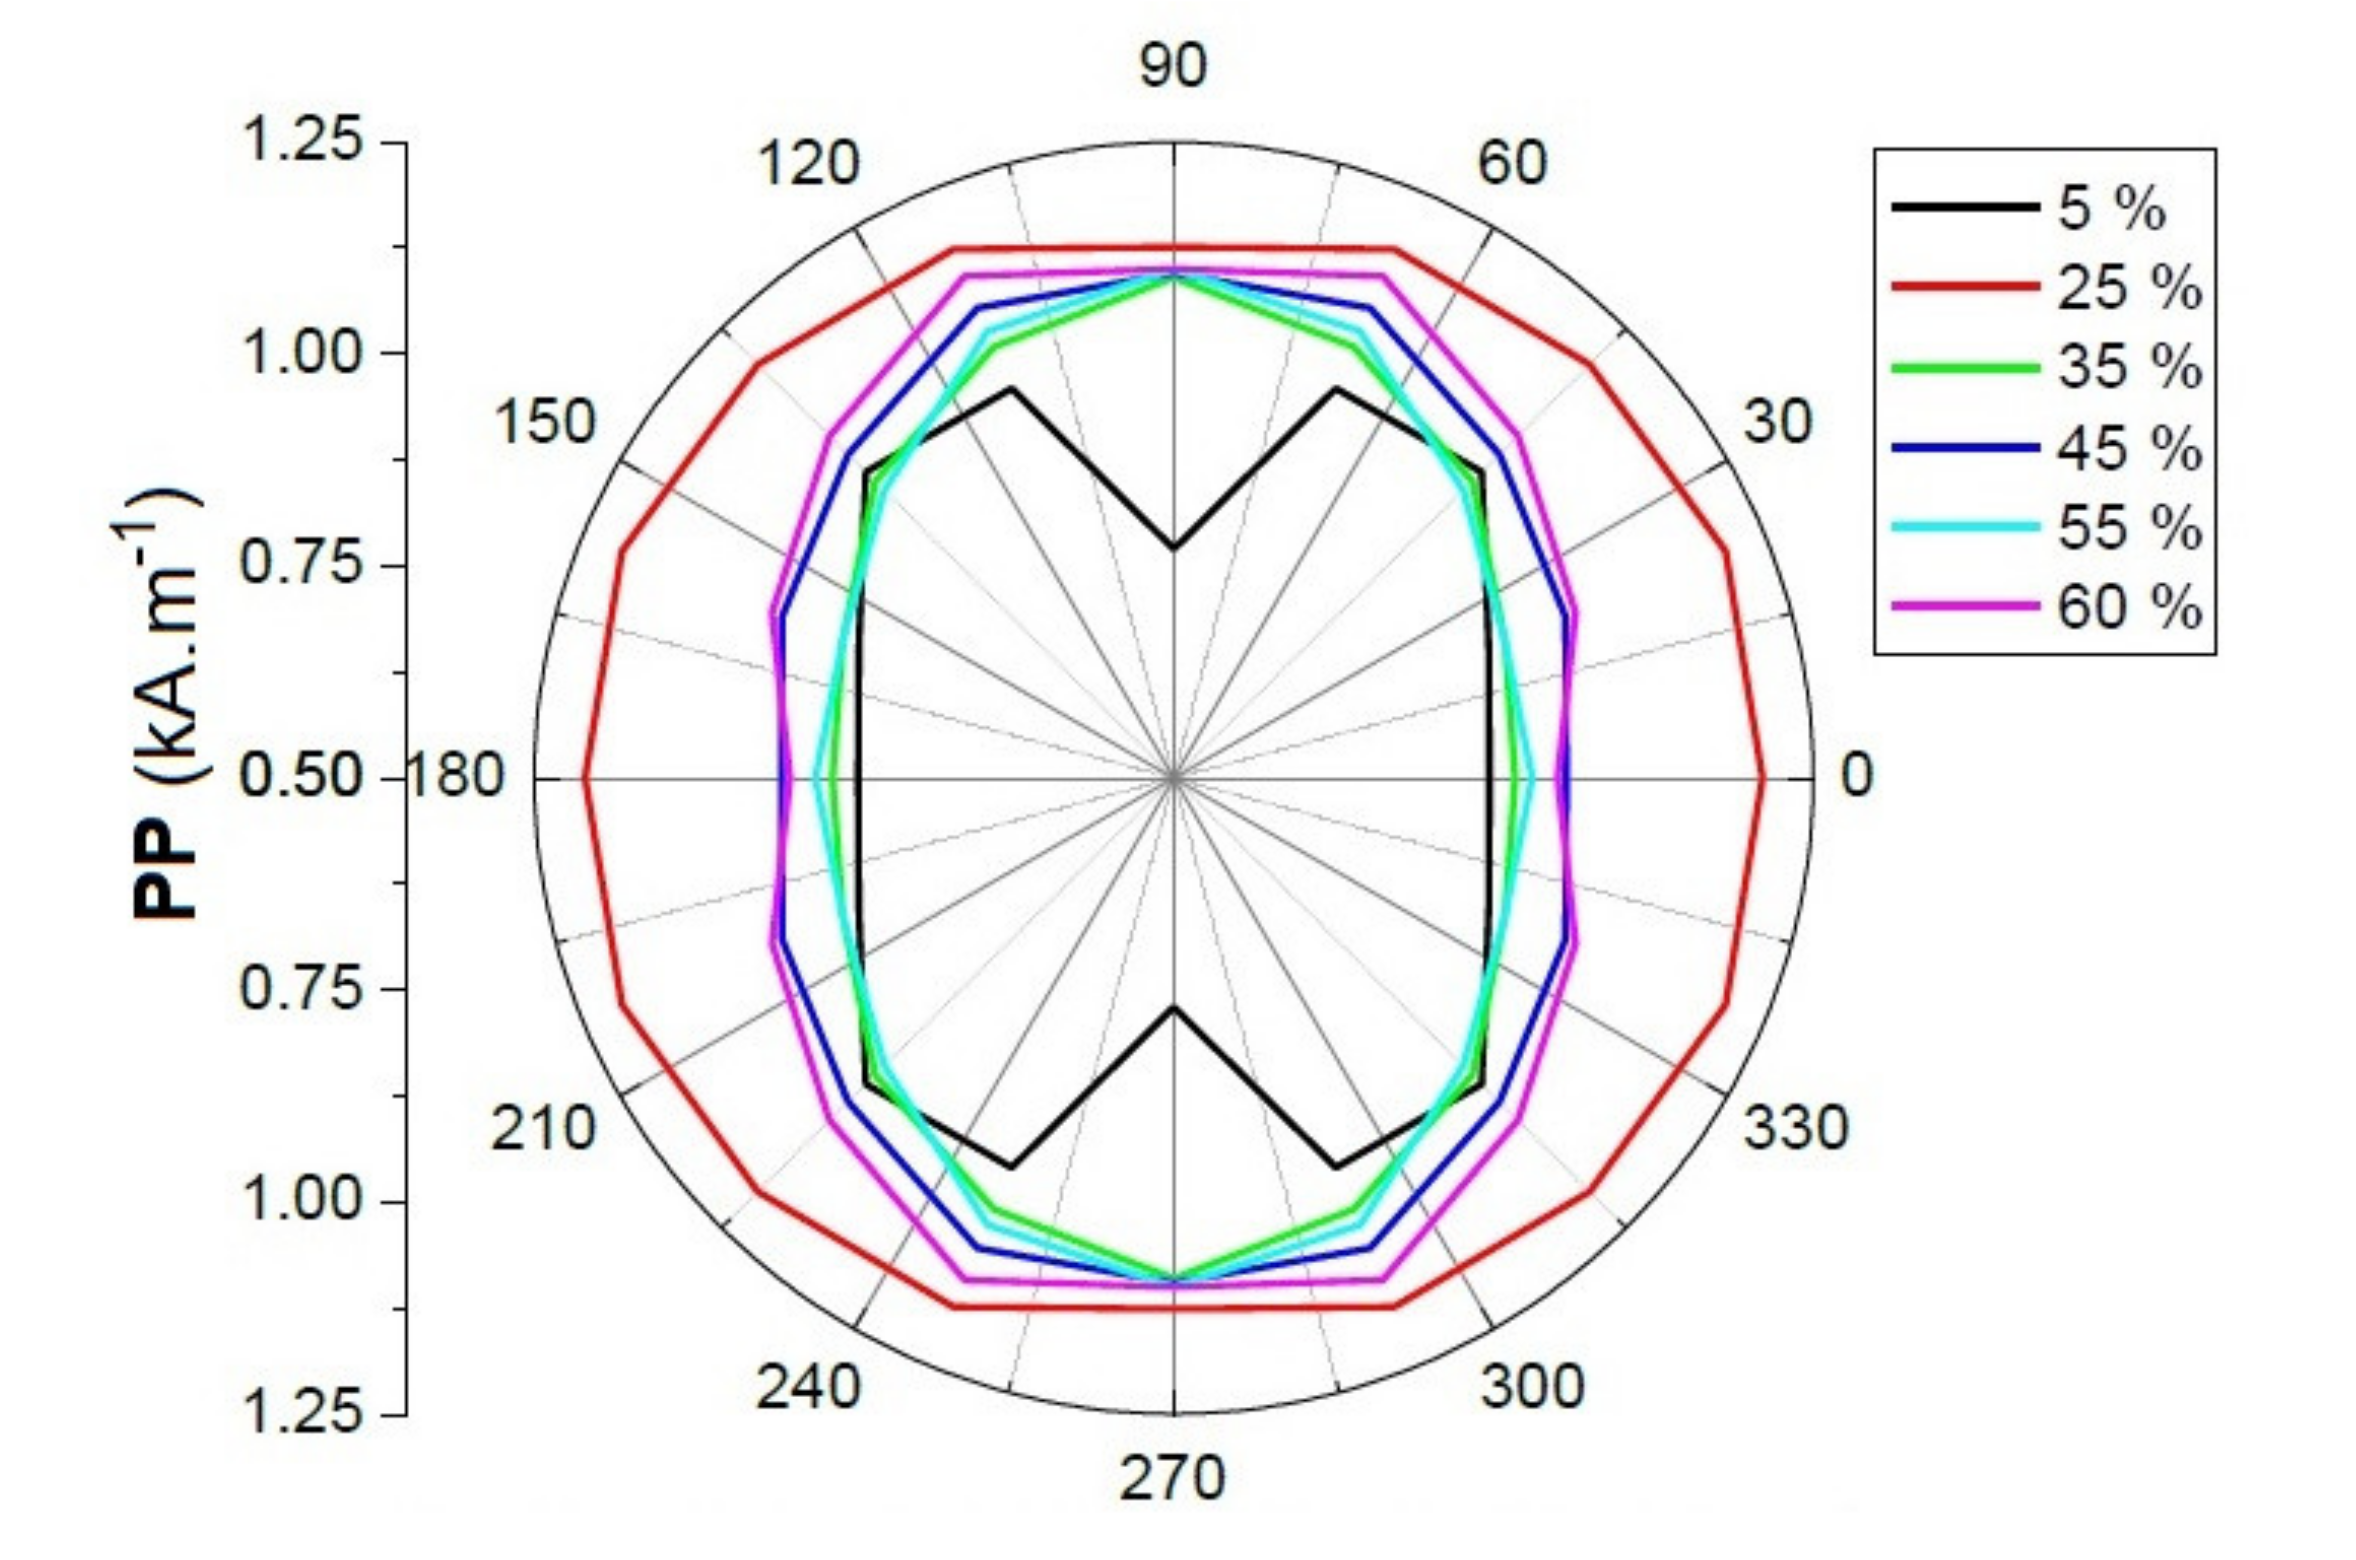
  • MBN envelopes are shifted to the lower magnetic fields versus ε, but this shift saturates for higher ε;
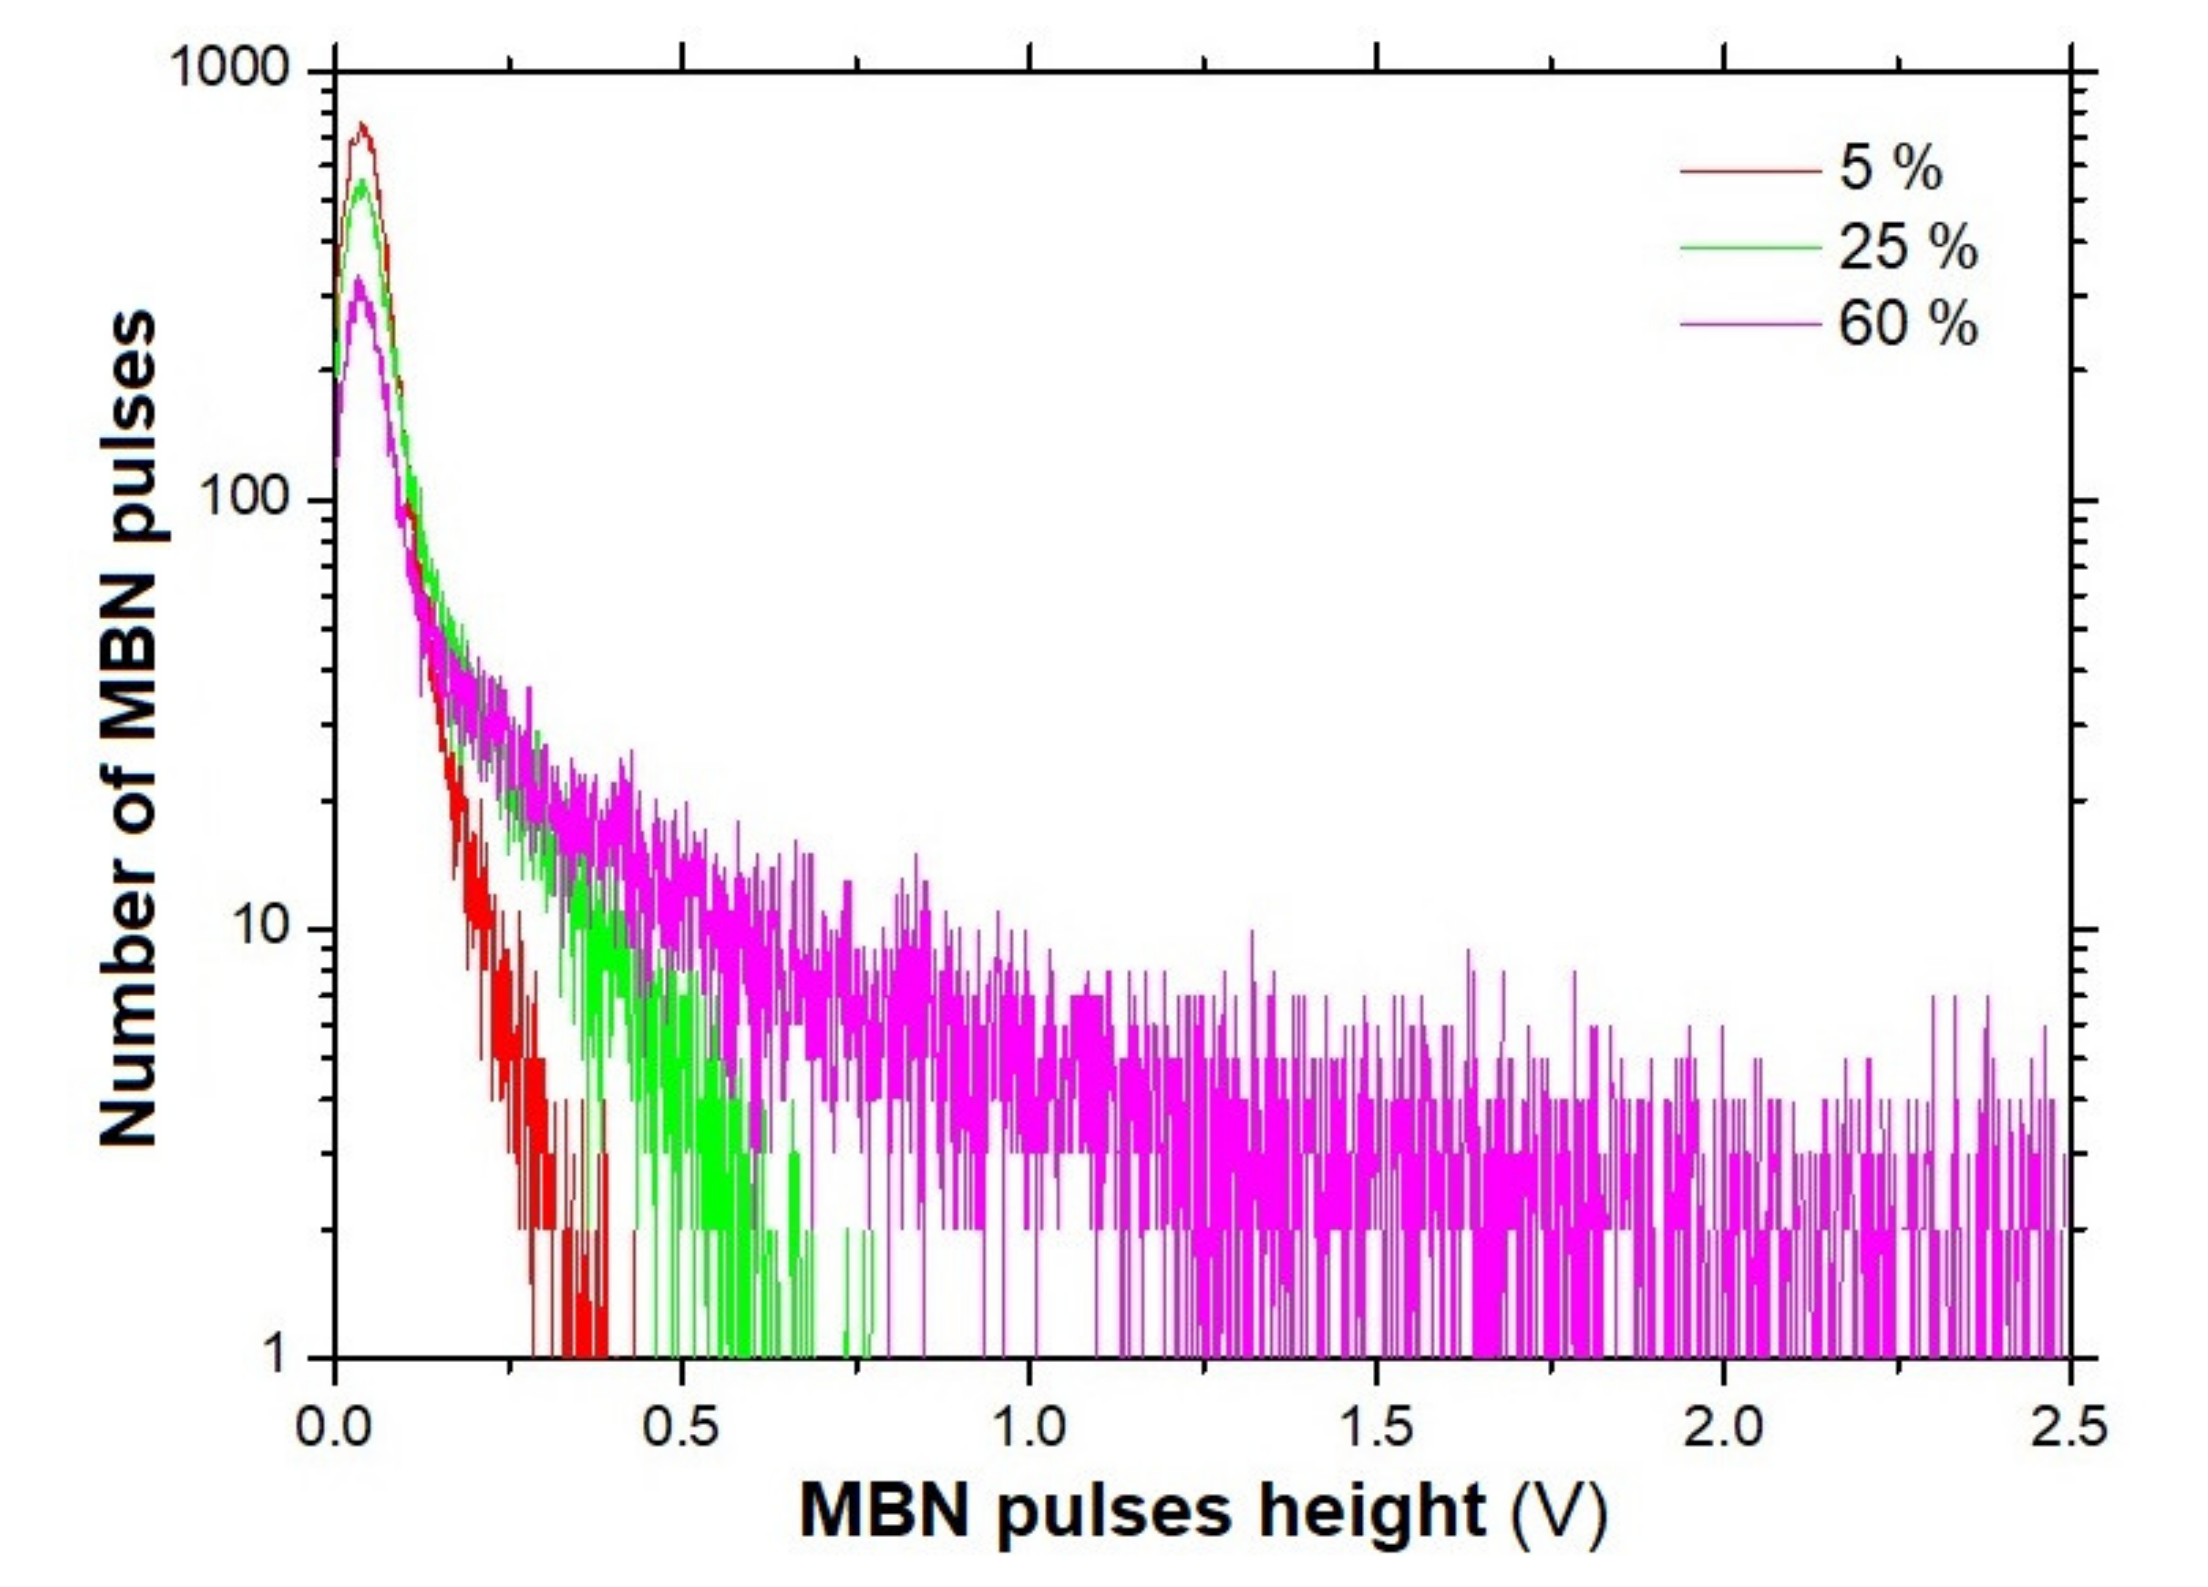
  • the number of MBN pulses decreases versus ε, but their early saturation can also be found.
Finally, we can conclude that the high sensitivity of the MBN technique for revealing strain-induced martensite transformation in austenitic stainless steels is due to the zero initial MBN emission, as a result of a non-ferromagnetic austenite phase (apart from the background and well-known MBN originating from the sensing probe itself). For this reason, any MBN emission above the background MBN can be directly associated with martensite transformation, its degree, and/or alteration.

Author Contributions

Conceptualization and methodology, M.N. and J.Š.; investigation, P.H., P.M., J.Č. and M.J.; writing—original draft preparation, M.N.; writing—editing and review, P.Š.; All authors have read and agreed to the published version of the manuscript.

Funding

This study was supported by the KEGA projects No. 008ŽU-4/2018 and No. 022STU-4/2019. Partial financial support by ERDF under the projects No. CZ.02.1.01/0.0/0.0/16_019/0000778 “Center for Advanced Applied Science” and CZ.02.1.01/0.0/0.0/17_048/0007373 “Damage Prediction of Structural Materials” is acknowledged. J.Č. also thanks to the Grant Agency of the Czech Technical University in Prague, grant No. SGS19/190/OHK4/3T/14. P.M. acknowledges a partial financial support by ERDF under project No. CZ.02.1.01/0.0/0.0/15 003/0000485.

Institutional Review Board Statement

Not applicable.

Informed Consent Statement

Not applicable.

Data Availability Statement

The raw data required to reproduce these findings cannot be shared easily due to technical limitations (especially MBN raw signals are too large due to very high sampling frequency). However, authors can share the data on any individual request (please contact the corresponding author by the use of its mailing address).

Conflicts of Interest

The authors declare no conflict of interest. The funders had no role in the design of the study; in the collection, analyses, or interpretation of data; in writing the manuscript, or in the decision to publish the results.

References

  1. Berns, H.; Gavriljuk, V.; Riedner, S. High Interstitial Stainless Steels, 1st ed.; Springer: Berlin/Heidlberg, Germany, 2012; pp. 7–19. [Google Scholar] [CrossRef]
  2. Mangonon, P.L.; Thomas, G. The martensite phases in 304 stainless steel. Metall. Trans. 1970, 1, 1577–1578. [Google Scholar] [CrossRef]
  3. Haušild, P.; Kolařík, K.; Karlík, M. Characterization of strain-induced martensitic transformation in A301 stainless steel by Barkhausen noise measurement. Mater. Des. 2013, 44, 548–554. [Google Scholar] [CrossRef]
  4. Haušild, P.; Davydov, V.; Drahokoupil, J.; Landa, M.; Pilvin, P. Characterization of strain-induced martensitic transformation in a metastable stainless steel. Mater. Des. 2010, 31, 1821–1827. [Google Scholar] [CrossRef]
  5. Shukla, S.; Patil, A.P. Effect of strain induced martensite reversal on the degree of sensitization of metastable austenitic stainless steel. Proc. Struct. Integr. 2019, 14, 259–264. [Google Scholar] [CrossRef]
  6. Talonen, J.; Aspegren, P.; Hänninen, H. Comparison of different methods for measuring strain induced α’ martensite content in austenitic steels. Mater. Sci. Technol. 2004, 20, 1506–1512. [Google Scholar] [CrossRef]
  7. Astudilo, M.R.N.; Nicolás, M.N.; Ruzzante, J.; Gómez, M.P.; Ferrari, G.C.; Padovese, L.R.; Pumarega, M.I.L. Correlation between martensitic phase transformation and magnetic Barkhausen noise of AISI 304 steel. Proc. Mater. Sci. 2015, 9, 435–443. [Google Scholar] [CrossRef] [Green Version]
  8. Kleber, X.; Barroso, S.P. Investigation of shot-peened austenitic stainless steel 304L by means of magnetic Barkhausen noise. Mater. Sci. Eng. A 2010, 527, 6046–6052. [Google Scholar] [CrossRef]
  9. Tavares, S.S.M.; Noris, L.F.; Pardal, J.M.; da Silva, M.R. Temper embrittlement of super martensitic stainless steel and non-destructive inspection by magnetic Barkhausen noise. Eng. Fail. Anal. 2019, 100, 322–328. [Google Scholar] [CrossRef]
  10. Chikazumi, S. Physics of Ferromagnetism, 2nd ed.; Oxford University Press: Oxford, UK, 2005. [Google Scholar]
  11. Neslušan, M.; Čížek, J.; Kolařík, K.; Minárik, P.; Čilliková, M.; Melikhová, O. Monitoring of grinding burn via Barkhausen noise emission in case-hardened steel in large-bearing production. J. Mater. Process. Technol. 2017, 240, 104–117. [Google Scholar] [CrossRef]
  12. Sorsa, A.; Santa-aho, S.; Wartiainen, J.; Souminen, L.; Vippola, M.; Leviskä, K. Effect of shot peening parameters to residual stress profiles and Barkhausen noise. J. Nondestruct. Eval. 2018, 37, 1–11. [Google Scholar] [CrossRef] [Green Version]
  13. Batista, L.; Rabe, U.; Altpeter, I.; Hirsekom, S.; Dobmann, G. On the mechanism of non-destructive evaluation of cementite content in steel using a combination of magnetic Barkhausen noise and magnetic force microscopy techniques. J. Magn. Magn. Mater. 2014, 354, 248–256. [Google Scholar] [CrossRef]
  14. Čížek, J.; Neslušan, M.; Čilliková, M.; Mičietová, A.; Melikhova, O. Modification of steel surfaces induced by turning: Non-destructive characterization using Barkhausen noise and positron annihilation. J. Phys. D Appl. Phys. 2014, 47, 1–17. [Google Scholar] [CrossRef]
  15. Blažek, D.; Neslušan, M.; Mičica, M.; Pištora, J. Extraction of Barkhausen noise from the measured raw signal in high-frequency regimes. Measurement 2016, 94, 456–463. [Google Scholar] [CrossRef]
  16. Murr, L.E.; Staudhammer, K.P.; Hecke, S.S. Effects of strain state and strain rate on deformation-induced transformation in 304 stainless steel: Part II. Microstructural study. Metall. Mater. Trans. A 1982, 4, 627–635. [Google Scholar] [CrossRef]
  17. Shin, H.C.; Ha, T.K.; Chang, Y.W. Kinetics of deformation induced martensitic transformation in a 304 a stainless steel. Scr. Mater. 2001, 45, 823–829. [Google Scholar] [CrossRef]
  18. Amiri, M.S.; Thielen, M.; Rabung, M.; Marx, M.; Szielasko, K.; Boller, C. On the role of crystal and stress anisotropy in magnetic Barkhausen noise. J. Magn. Magn. Mater. 2014, 372, 16–22. [Google Scholar] [CrossRef]
  19. Krause, T.W.; Mandala, K.; Atherton, D.L. Modelling of magnetic Barkhausen noise in single and dual easy axis systems in steel. J. Magn. Magn. Mater. 1999, 195, 193–205. [Google Scholar] [CrossRef]
  20. Karpuschewski, B.; Bleicher, O.; Beutner, M. Surface integrity inspection on gears using Barkhausen noise analysis. Proc. Eng. 2011, 19, 162–171. [Google Scholar] [CrossRef] [Green Version]
  21. Bozorth, R.M. Ferromagnetism, 2nd ed.; Wiley-IEEE Press: New York, NY, USA, 1993. [Google Scholar]
  22. Néel, L. Principles of a new general theory of the coercive field. Ann. Univ. Grenoble 1946, 22, 299–343. [Google Scholar]
  23. Kondorskij, E.J. On the question of coercivity and irreversible magnetization changes. J. Exp. Teor. Phys. 1937, 7, 1117. [Google Scholar]
  24. Dijkstra, L.J.; Wert, C. Effect of inclusions on coercive force of iron. Phys. Rev. 1950, 79, 979. [Google Scholar] [CrossRef]
  25. Cullity, B.D.; Graham, C.D. Introduction to the Magnetic Materials, 2nd ed.; IEEE Press: New York, NY, USA, 2009. [Google Scholar]
  26. Martínez Krahmer, D.; Polvorosa, R.; López de Lacalle, L.N.; Alonso-Pinillos, U.; Abate, G.; Riu, F. Alternatives for specimen manufacturing in tensile testing of steel plates. Exp. Tech. 2016, 40, 1555–1565. [Google Scholar] [CrossRef]
  27. Silva, C.M.A.; Rosa, P.A.R.; Martins, P.A.F. Innovative testing machines and methodologies for the mechanical characterization of materials. Exp. Tech. 2014, 40, 569–581. [Google Scholar] [CrossRef]
  28. Dixit, U.S.; Joshi, S.N.; Davim, J.P. Incorporation of material behavior in modeling of metal forming and machining processes: A review. Mat. Des. 2011, 32, 3655–3670. [Google Scholar] [CrossRef]
  29. Levitas, V.I.; Roy, A.M.; Preston, D.L. Multiple twinning and variant-variant transformations in martensite: Phase-field approach. Phys. Lett. B 2013, 88, 054113. [Google Scholar] [CrossRef] [Green Version]
  30. Roy, A.M. Influence of Interfacial Stress on Microstructural Evolution in NiAl Alloys. JETP Lett. 2020, 112, 173–179. [Google Scholar] [CrossRef]
  31. Roy, A.M. Multiphase phase-field approach for solid–solid phase transformations via propagating interfacial phase in HMX. J. Appl. Phys. 2021, 129, 025103. [Google Scholar] [CrossRef]
  32. Suárez, A.; Veiga, F.; Lópezde Lacalle, L.N.; Polvorosa, R.; Lutze, S.; Wretland, A. Effects of Ultrasonics-assisted face milling on surface integrity and fatigue life of Ni-alloy 718. J. Mater. Eng. Perform. 2016, 25, 5076–5086. [Google Scholar] [CrossRef]
  33. Pereira, O.; Celaya, A.; Urbikaín, G.; Rodríguez, A.; Fernández-Valdivielso, A.; López de Lacalle, L.N. CO2 cryogenic milling of Inconel 718: Cutting forces and tool wear. J. Mater. Res. Technol. 2020, 9, 8459–8468. [Google Scholar] [CrossRef]
Figure 1. Illustration of the samples employed in plastic straining.
Metals 11 00429 g001
Figure 2. Stress–strain (engineering) curve of AISI 321, strain rate 0.33 × 10⁻³ s−1.
Metals 11 00429 g002
Figure 3. Evolution of microstructure from austenitic to austenitic–martensitic after different levels of plastic pre-straining. (a) ε = 5%, (b) ε = 25%, (c) ε = 35%, (d) ε = 45%, (e) ε = 55%, (f) ε = 60%.
Metals 11 00429 g003
Figure 4. Electron backscattered diffraction (EBSD) phase maps for the different plastic strains, austenite—green colour, martensite—red colour. (a) ε = 35%, (b) ε = 60%.
Metals 11 00429 g004
Figure 5. The influence of plastic straining on hardness of AISI 321.
Metals 11 00429 g005
Figure 6. Martensite weight fraction versus ε.
Metals 11 00429 g006
Figure 7. Depth profiles of residual stresses. (a) martensite phase, (b) austenite phase.
Metals 11 00429 g007
Figure 8. Crystallite size and microdeformation versus ε. (a) crystallite size, (b) microdeformation.
Metals 11 00429 g008
Figure 9. Angular dependence of Magnetic Barkhausen Noise (MBN) for different ε values.
Metals 11 00429 g009
Figure 10. Evolution of isotropic and anisotropic components of MBN versus ε.
Metals 11 00429 g010
Figure 11. MBN envelopes for different ε and directions of measurement. (a) 0° direction, (b) 90° direction.
Metals 11 00429 g011
Figure 12. Angular dependence of peak position (PP) for different ε.
Metals 11 00429 g012
Figure 13. MBN pulses height distribution for different ε, 0°direction.
Metals 11 00429 g013
Figure 14. Correlation between residual stresses and MBN. (a) 0° direction, (b) 90° direction.
Metals 11 00429 g014
Figure 15. Correlation relationships of MBN for the direction 0°. (a) MBN versus volume fraction of martensite, metallography, (b) MBN versus HV1.
Metals 11 00429 g015
Table 1. Chemical composition of the 321 austenitic stainless steel (wt. %).
FeCMnCrNiSPSiTi
bal.0.0821810.50.030.04515 × wt. C
Table 2. Correlation coefficients for MBN.
DirectionResidual StressesCrystallite
Size
Micro
Deformation
HV1Martensite
Fraction, XRD
Martensite Fraction,
Metallography
−0.7750.9630.8060.9550.9670.992
90°0.8730.8190.6850.9520.9760.990
Publisher’s Note: MDPI stays neutral with regard to jurisdictional claims in published maps and institutional affiliations.

