Article

The Significance of Optimizing Mn-Content in Tuning the Microstructure and Mechanical Properties of δ-TRIP Steels

1
State Key Laboratory of Rolling and Automation, Northeastern University, Shenyang 110819, China
2
Department of Materials Physics and Chemistry, School of Materials Science and Engineering, Northeastern University, Shenyang 110819, China
3
Angang Steel Company Limited, Anshan 114009, China
4
Laboratory for Excellence in Advanced Steel Research, Department of Metallurgical, Materials and Biomedical Engineering, University of Texas at El Paso, 500 W. University Avenue, El Paso, TX 79968, USA
*
Authors to whom correspondence should be addressed.
Submission received: 25 February 2021 / Revised: 12 March 2021 / Accepted: 22 March 2021 / Published: 23 March 2021
(This article belongs to the Special Issue Advanced Multiphase Steels)

Abstract

:
The δ-TRIP steel has attracted a lot of attention for its potential application in automotive components, owing to the low density, good combination of strength, and ductility. As the difficulty in yield strength further increasement is caused by large fraction ferrite, the work hardening ability was enhanced by optimizing the manganese (Mn)-content in this study. Three δ-TRIP steels with different manganese (Mn)-content were designed to explore the significant effect of Mn content on the work hardening behavior in order to develop high strength steel suitable for the industrial continuous annealing process. The detailed effect of Mn on microstructure evolution and deformation behavior was studied by scanning electron microscope (SEM), interrupted tensile tests, X-ray diffraction (XRD), and in-situ electron backscattered diffraction (EBSD). The study suggested that 2 Mn steel has the lowest degree of bainitic transformation, as a result of fine grain size of prior austenite. The large TRIP effect and dislocation strengthening improve the work hardening rate, resulting in 2 Mn steel exhibiting comparable mechanical properties with the QP980 steels. The retained austenite in 1.5 Mn steel progressively transformed into martensite and sustained the strain to a high strain value of 0.40, showing a good strength-ductility balance.

1. Introduction

The requirement of low-cost production, environmental friendliness, and high safety performance in the automotive industry drives the development of lightweight vehicles. Besides weight reduction by the down-gauging of high strength steels, reducing the density of steels through the addition of aluminum (Al) has recently attracted significant attention [1,2,3,4]. In recent years, a low-density δ-TRIP steel with good mechanical properties and weldability was developed for potential application in automotive components. The unconventional microstructure of δ-TRIP steel consisted of δ-ferrite, bainite ferrite, and retained austenite [5]. The microstructure with complex phases contributes to the good combination of strength and ductility [6,7], which satisfies the requirement of formability. The addition of 3–5 wt.% Al provides a reduction in density of 4.5–8% [8]. Moreover, δ-TRIP steel possesses good weldability because of stable δ-ferrite [9]. These excellent characteristics make it potentially attractive as a third-generation automotive steel. However, the large fraction of δ-ferrite in microstructure limits the further improvement of strength in δ-TRIP steels.
The yield strength of δ-TRIP steels is mainly controlled by the strength of soft δ-ferrite. Previous studies indicated that 1 wt.% Al addition to BCC (body-centered cubic) iron provides solid solution strengthening of ~50 MPa [10], and the addition of 4 wt.% Al in ferrite has a similar strength effect compared with a 2 wt.% silicon addition [11]. In spite of the positive effect of high Al content, the yield strength of 500–600 MPa in δ-TRIP steels does not meet the requirement [6,7]. The strength of δ-TRIP steels depends on both yield strength and subsequent work hardening ability. Thus, the enhancement of work hardening ability can be considered as one effective approach for further enhancing the strength of δ-TRIP steels. Given that the work hardening behavior is related to the TRIP effect of austenite, the adjustment of austenite stability significantly affects the work hardening behavior, and hence the tensile strength [12,13].
In the study described here, we aim to design a δ-TRIP steel with the strength of 980 MPa, which is suitable for a continuous annealing line in industrial production. Mn is an austenite stabilizer, which influences stability of prior austenite and retained austenite, and consequently bainitic transformation behavior during the heat-treatment process and deformation induced martensitic transformation. Therefore, the effect of Mn on the microstructure evolution and the mechanical properties of δ-TRIP steels were also explored. It is believed that this study will be beneficial in promoting the application of δ-TRIP steels.

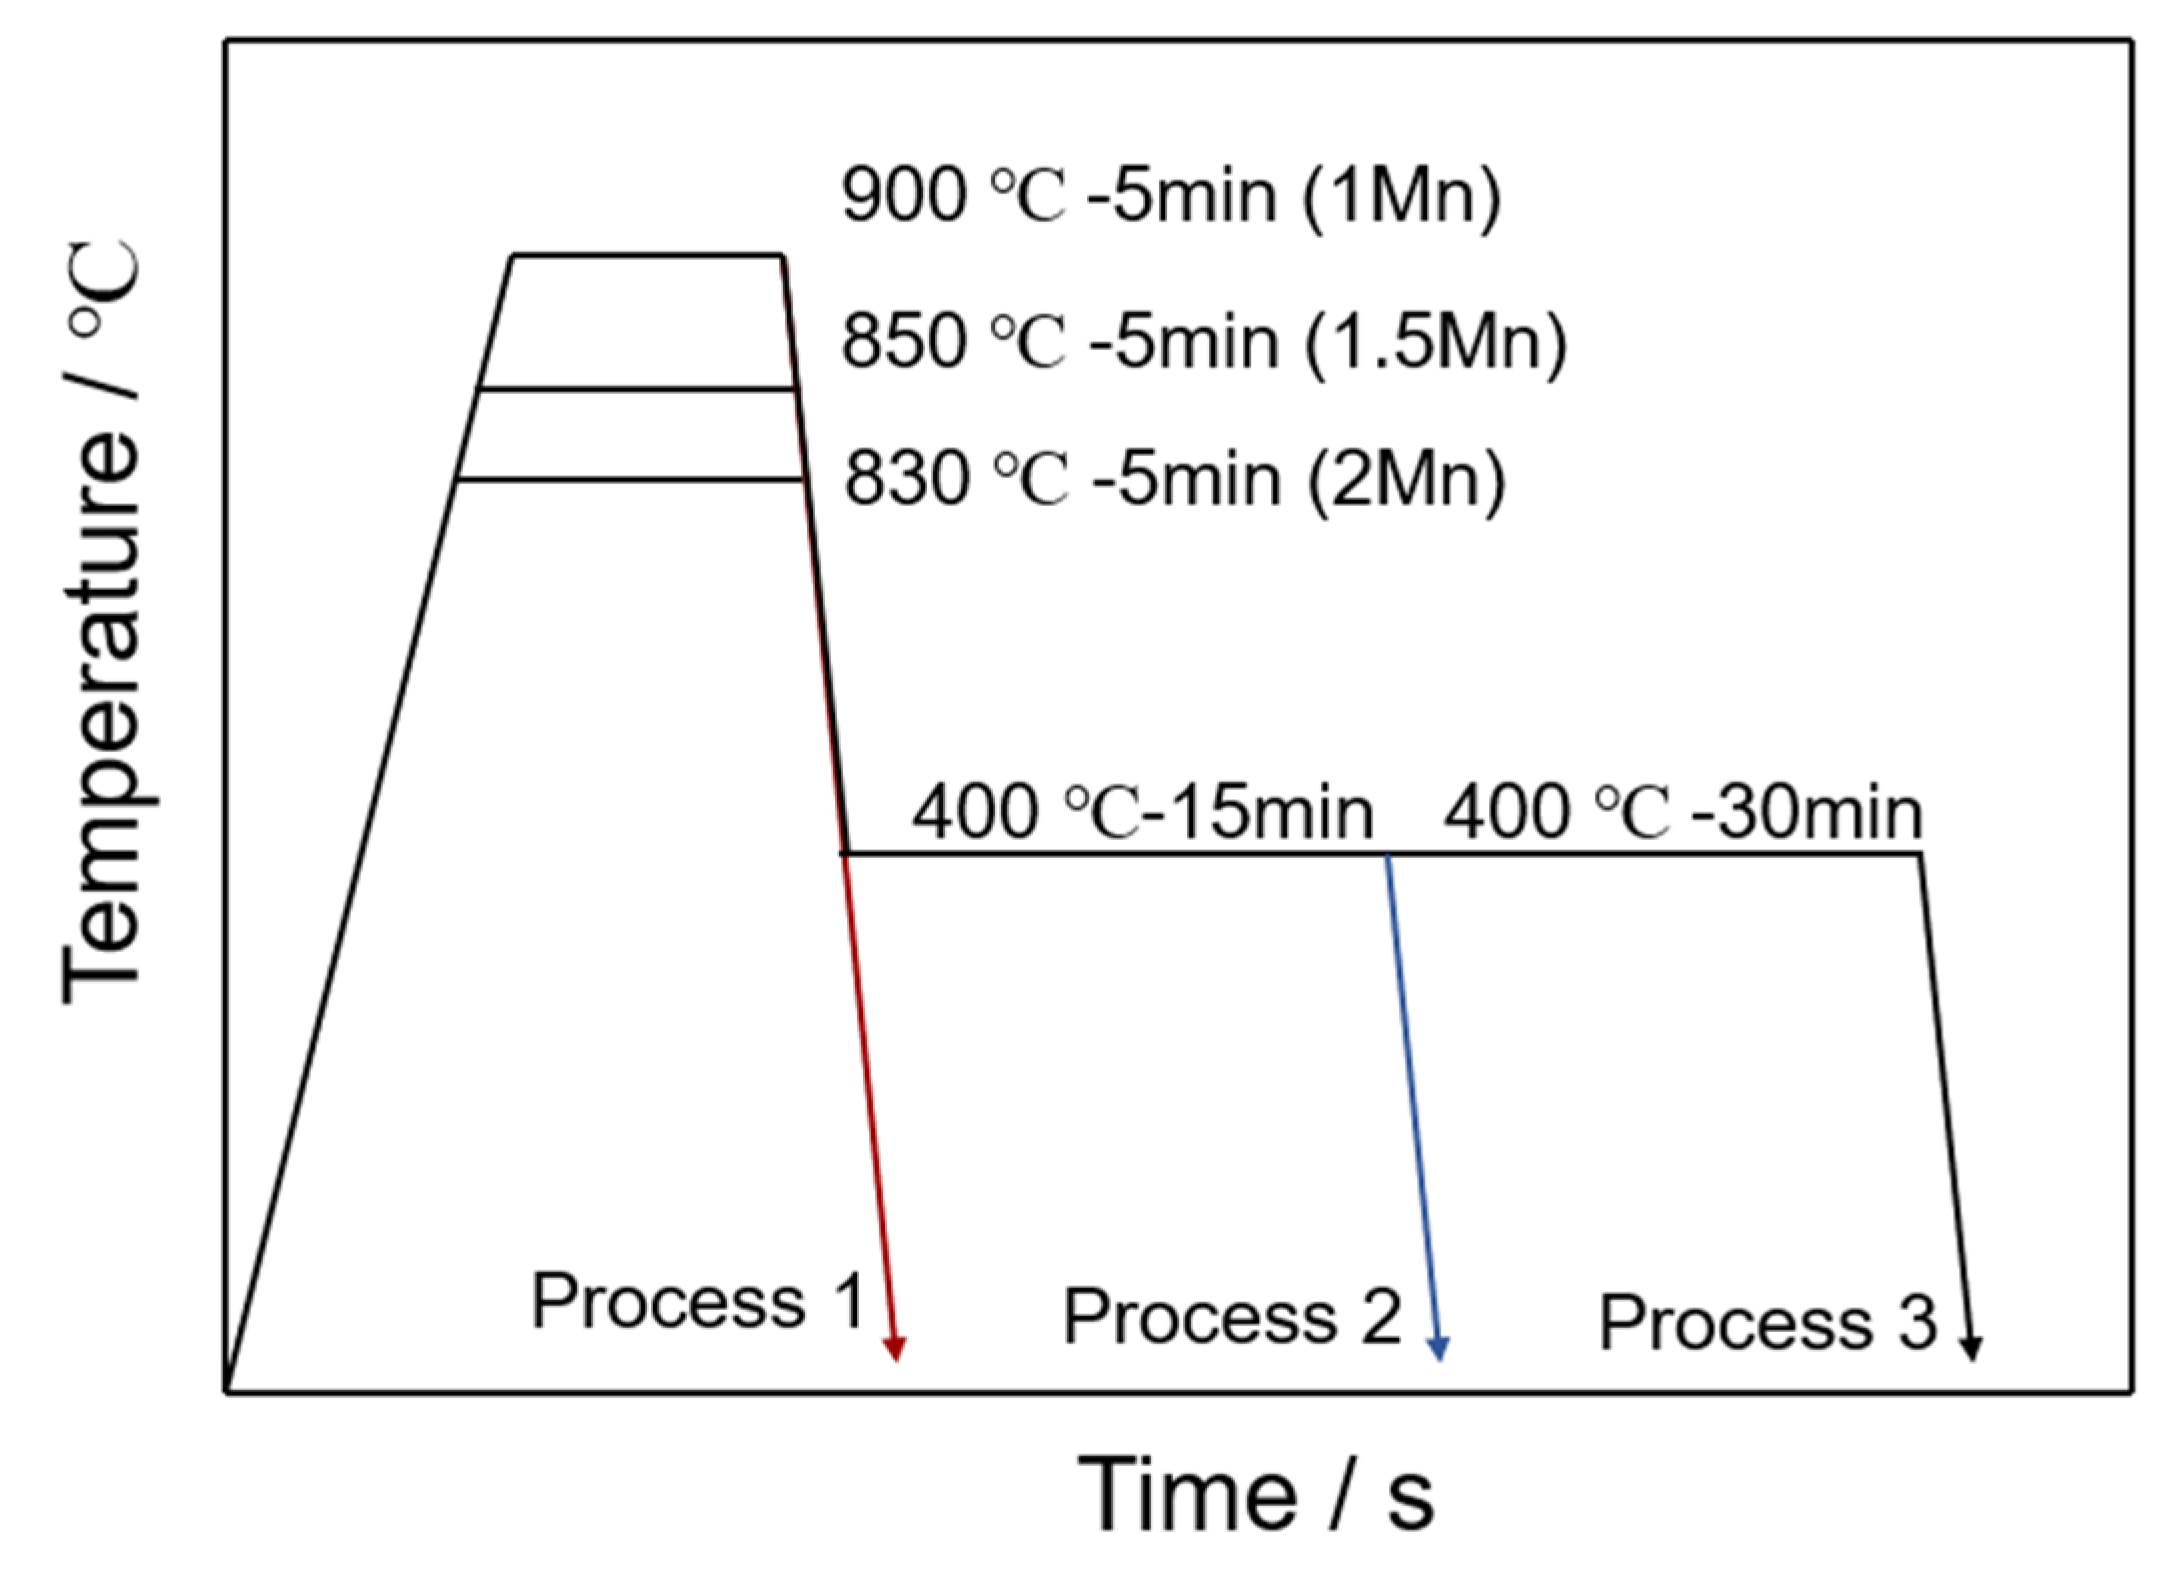
2. Materials and Methods

Based on reference [14], three δ-TRIP steels were cast as a 50 kg ingot in a vacuum induction furnace (Tongchuang Technology, Jinzhou, China). The experimental δ-TRIP steels with different Mn content (Table 1) are referred to as 1 Mn, 1.5 Mn, and 2 Mn, respectively. In order to guarantee the bainitic transformation, no δ-TRIP steel with higher Mn content was designed in this study. After heating to 1200 °C, the ingot was forged into a billet with cross-sectional dimensions of 30 × 100 mm2, and subsequently reheated to 1200 °C for 40 min and hot rolled to 4 mm thickness via four passes with a finish rolling temperature of 900 °C, followed by water cooling to ~650 °C and furnace cooling to ambient temperature. The hot-rolled sheets were pickled in 10% hydrochloric acid (Tiangang Chemical, Shenyang, China) to remove the oxidized layer and then cold rolled to 1.5 mm thickness.
To guide the heat treatment process, the equilibrium phase fraction as a function of temperature and the composition of each phase were calculated by ThermoCalc software combined with the TCFE9 database (Version 2017b, KTH Royal Institute of Technology, Stockholm, Sweden). As illustrated in Figure 1, the intercritical annealing time was 5 min for meeting the industrial requirement, and annealing temperature was set at 900 °C for 1 Mn, 850 °C for 1.5 Mn, and 830 °C for 2 Mn, respectively, for obtaining a ferrite and austenite microstructure with similar volume fraction. The fraction of austenite in quenched samples (process 1) was ~50 vol.%, as determined by Image J software (Version 1.53e, National Institute of Health, Bethesda, MD, USA). The grain size of prior austenite was described by equivalent circle diameter (ECD) as follows: ECD = (4A/π)0.5, where A is the area of prior austenite, and more than 100 grains were analyzed by Image J software. The Ms temperatures of prior austenite in three steels were measured by dilatometry in process 1. Bainitic isothermal transformation at 400 °C for 15 min was suitable for an industrial continuous annealing process (process 2). The isothermal treatment at 400 °C for 30 min was carried out using a dilatometer (Bähr D805, Hüllhorst, Germany) to measure the kinetics of bainitic transformation during extended isothermal treatment (process 3). The samples for the dilatometer had dimensions of 10 × 4 × 1.5 mm3.
According to the ASTM E8M-00, tensile coupons with a gage width and length of 12.5 mm and 50 mm, respectively, were heat treated as process 2 in Figure 1 to simulate the industrial continuous annealing process. The tensile specimens were ground to a final thickness of 1.3 mm to remove the decarburization layer. Three tensile specimens were tested for each condition, and the tensile tests were performed at a strain rate of 3.3 × 10⁻⁴ s−1 at room temperature using a SANS 5105 testing machine equipped with a laser extensometer (SANS, Shenzhen, China). In addition to tensile to failure, interrupted tensile tests to engineering strains of 2%, 10%, and 20% were carried out to assess the stability of the retained austenite. To quantify the volume fraction and carbon content of austenite during straining, X-ray diffraction (XRD) measurements were performed by a Smartlab 9 KW X-ray diffractometer using Cu-Kα radiation (RIGAKU, Tokyo, Japan) with a wavelength of 0.179 nm. The 2θ Bragg angle was varied from 40° to 100° with a step size of 0.04°. The integrated intensities of (200)γ, (220)γ, (311)γ, (200)α, and (211)α peaks were used to calculate the austenite fraction, using the equation: fγ = 1.4Iγ/(Iα + 1.4Iγ), where fγ is the volume fraction of retained austenite, Iγ is the average integral intensity of (200)γ, (220)γ, and (311)γ, and Iα is the average integral intensity of (200)α, (211)α [15,16,17]. The interrupted deformation and fracture specimens for XRD were metallographically ground and electropolished using an electrolyte of 90% ethanol (Fuyu Chemical, Tianjin, China) and 10% perchloric acid (Tiangang Chemical, Shenyang, China). The carbon content in austenite was estimated by the relationship between chemical composition and austenite lattice parameter, using the equation: aγ = 0.3556 + 0.00453xC + 0.000095xMn + 0.00056xAl, where aγ is the average austenite lattice parameter of (200)γ, (220)γ, (311)γ in nm, xC, xMn, and xAl are the concentrations of C, Mn, and Al in austenite, respectively, in wt.%. The samples for microscopic observations were prepared using standard mechanical polishing method using a series of SiC paper (Sharpness, Beijing, China) to mirror finish, followed by etching with 4% nital (Fuyu Chemical, Tianjin, China) for 10 s. High-resolution microscopy observations were conducted using the electron probe microanalyzer (JEOL JXA-8530 F, Tokyo, Japan) operated at 20 kV accelerating voltage. The electron backscattered diffraction (EBSD) specimens were prepared by mechanical grinding and polishing, followed by electrolytic polishing at a voltage of 20 V for 20 s in a solution of 10% perchloric acid (Tiangang Chemical, Shenyang, China). In situ EBSD tensile measurements were conducted on specimens with the gage size of 2 × 1.8 × 0.6 mm3. EBSD scans were performed on an OXFORD system, attached to a Zeiss Gimini300 microscope (Carl Zeiss AG, Oberkochen, Germany). The scans were performed at 20 kV, a specimen tilt of 70° and a step size of 0.08 μm. The EBSD data was processed by means of Channel 5 software (Oxford Company, Abingdon-on-Thames, UK). The recrystallization, substructure, and deformation regions of ferrite were distinguished by Tango module in Channel 5, according to the angle of grain boundary.

3. Results

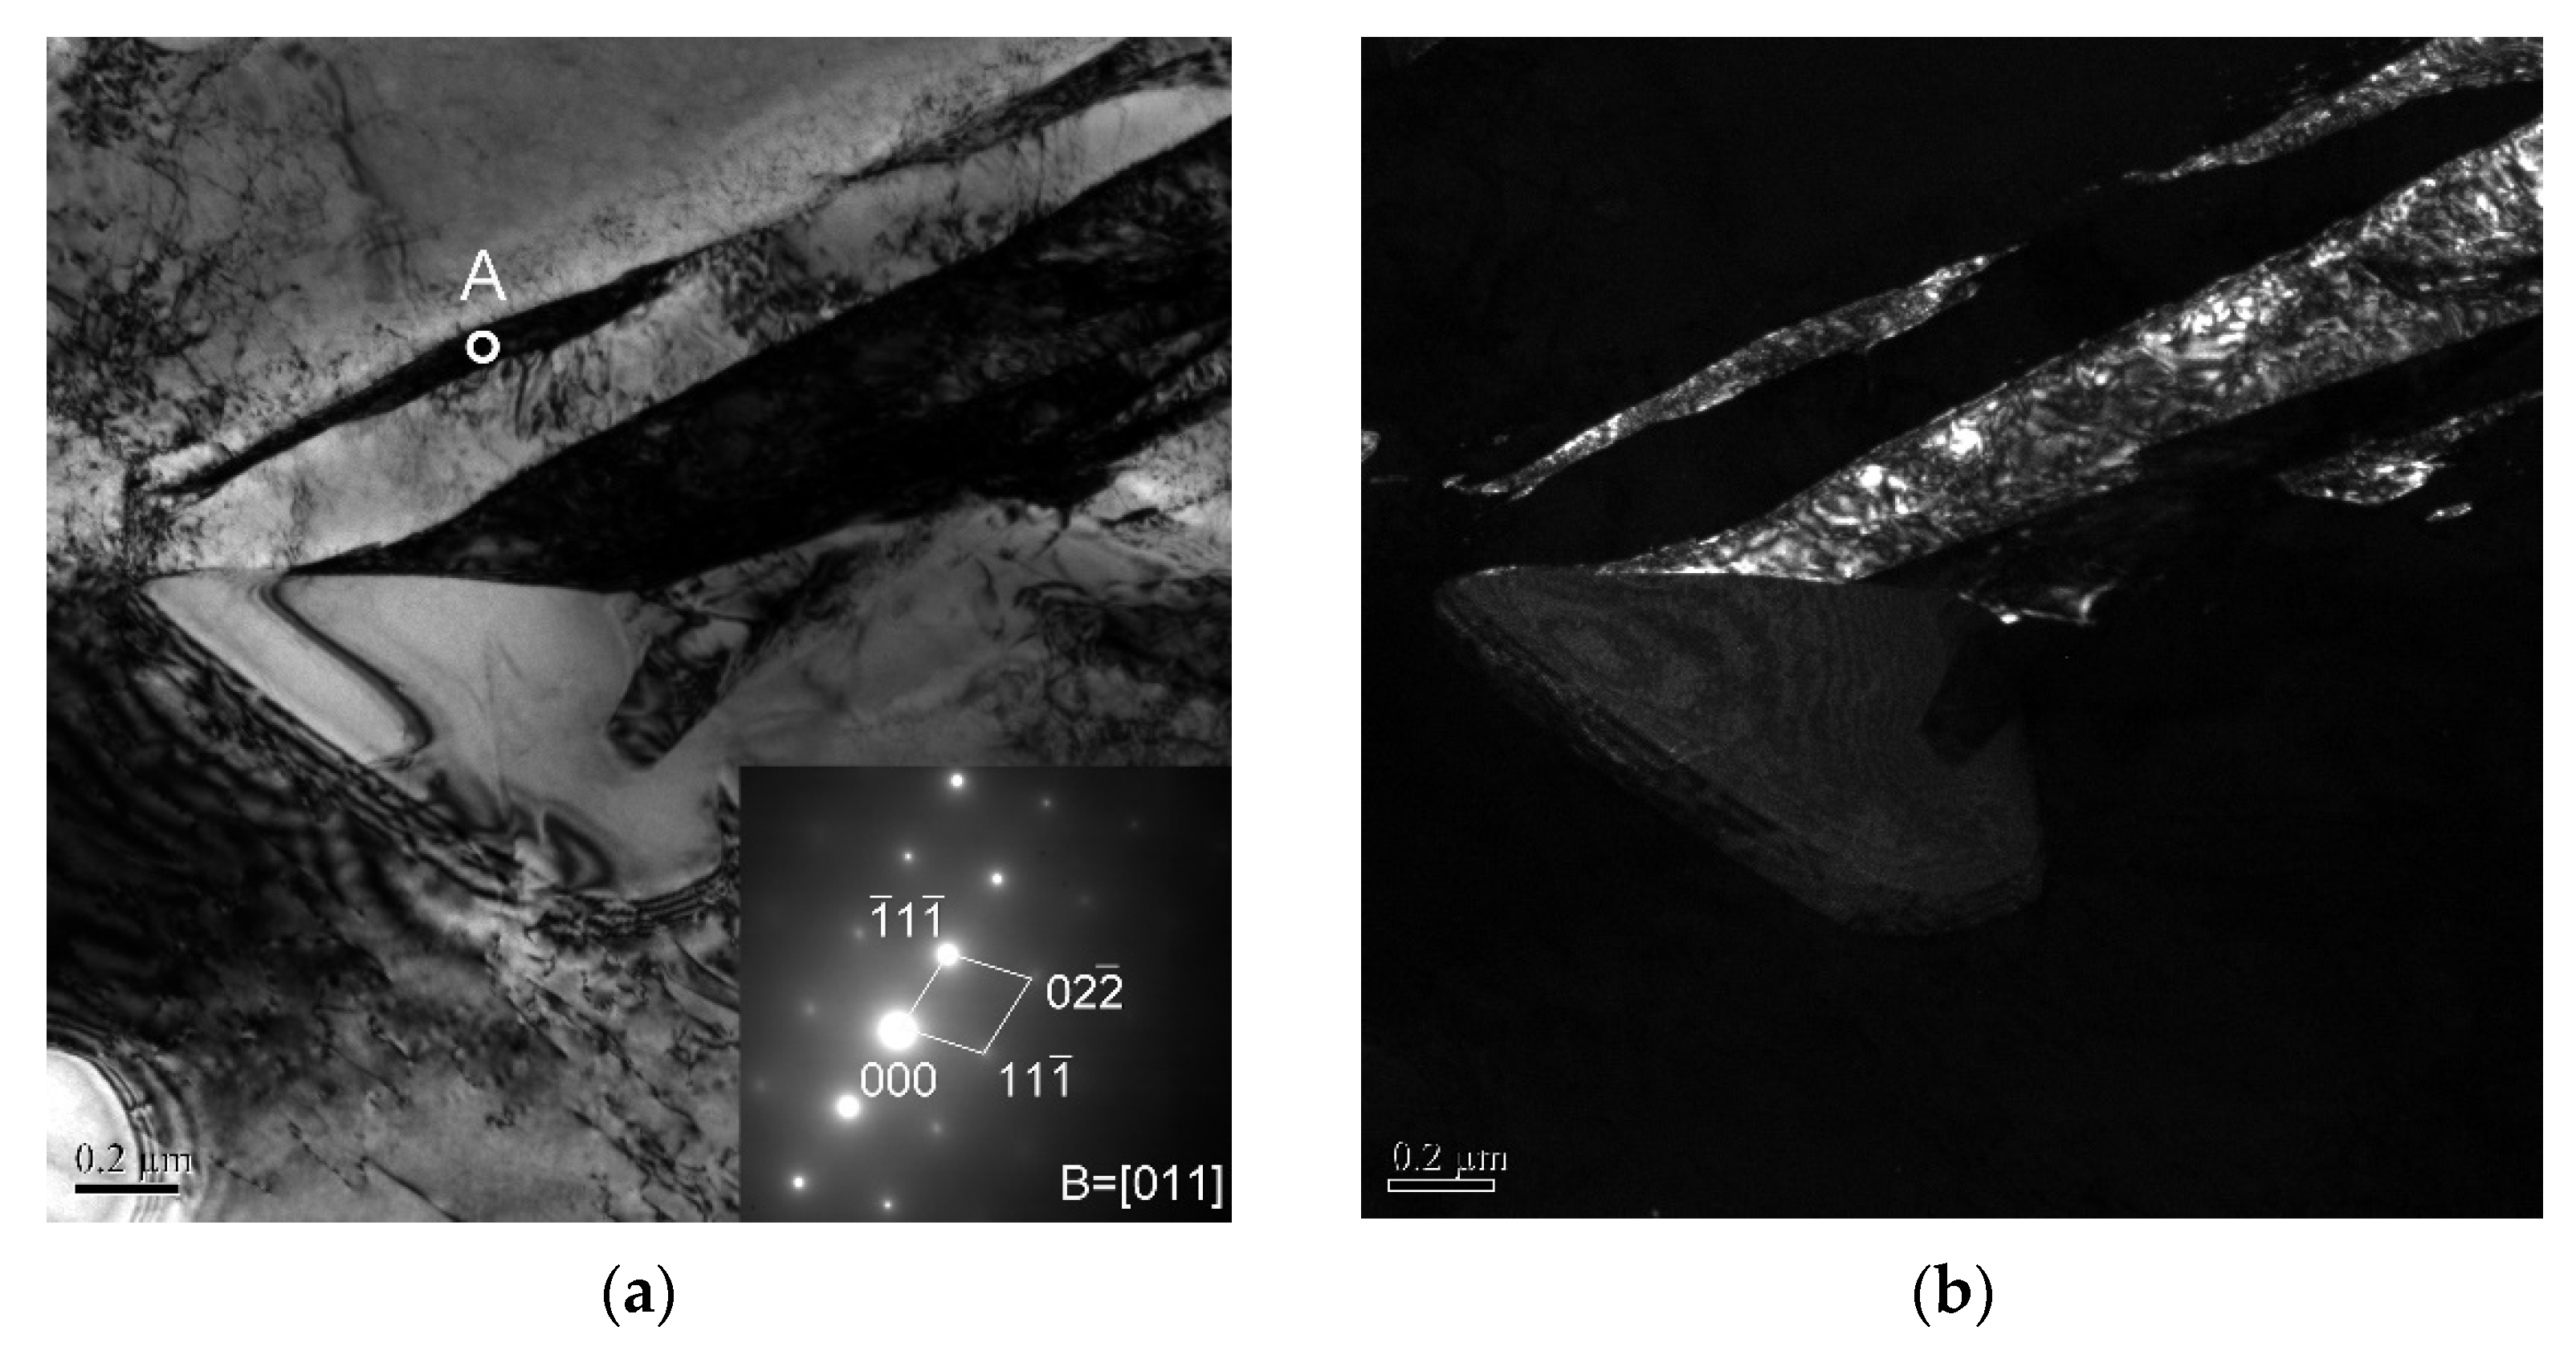
3.1. Microstructure Evolution

Through combined thermodynamic calculations and experimental exploration, the intercritical annealing process was conducted as shown in Figure 1, giving similar ferrite fractions of ~50 vol.% in the three samples (Table 2). The annealed microstructure, as illustrated in Figure 2a–c, are ferrite and prior austenite, which partly transformed into martensite due to the lower martensite start (Ms) temperature being above the ambient temperature. Ms temperature was measured as 173 °C, 93 °C, 82 °C for 1 Mn, 1.5 Mn, 2 Mn steels by dilatometry, respectively (Figure 2d). It is hard to distinguish the martensite and retained austenite in the quenched microstructure, due to the inheritance of martensite from prior austenite. This was also observed in previous reports [18]. High Al addition enables the presence of ferrite even at a high annealing temperature. The main difference in micrographs among the three quenched samples is the grain size of prior austenite; the grain size was finer in higher Mn steel caused by the lower isothermal temperature (Figure 1 and Figure 2a–c, Table 2). The average grain size of prior austenite is 4.0 ± 0.5, 3.2 ± 0.4, and 1.5 ± 0.1 µm for 1 Mn, 1.5 Mn, and 2 Mn steels, respectively (Table 2). Consequently, prior austenite in the 2 Mn sample is the most stable owing to finer grain size and higher Mn content. The stability of prior austenite subsequently affects the bainitic transformation in processes 2 and 3.
The condition of 5 vol.% of bainitic transformation was extracted for the time-temperature-transformation (TTT) curve mapping, which is generally indicative of start of bainitic transformation (BS) (Figure 3a). It reveals that the fastest bainitic transformation happens at 400 °C for the three steels, and the incubation time of bainitic transformation increases with the increase of Mn content. Thus, 400 °C was used for bainitic isothermal hold. Figure 3b is the dilatometric curve of isothermal hold at 400 °C for 30 min after different intercritical annealing, representing the degree of bainitic transformation. The curve remained almost flat at ~15 min, which means that the bainitic transformation was close to completion. The maximum degree of bainitic transformation occurred in 1 Mn steel, and the bainitic transformation of 2 Mn steel ceased fastest.
Based on the dilatometric curve, the samples held at 400 °C for 15 min was adequate for completion of bainitic transformation. The samples of process 2 were observed as presented in Figure 4. The δ-TRIP steels had a microstructure consisting of carbide-free bainite, austenite, and ferrite (Figure 4a–c), and no martensite was obtained based on both microstructure observation and dilatometry (Figure 3c and Figure 4). TEM micrograph (Figure 5) of 1 Mn revealed that the bainite composite microstructure was comprised of lath bainite ferrite and lath austenite, and there was no carbide precipitation during bainitic transformation. So, there were two types of austenite, i.e., lath austenite in bainite, and untransformed blocky austenite. Minimum transformation in 2 Mn steel was also confirmed by microstructure observation, and the lath austenite in 2 Mn steel was the finest, such that part of lath austenite could not be identified by EBSD due to the step size of 0.08 μm. The austenite fraction and carbon concentration in austenite are shown in Table 3. The lower austenite fraction obtained from EBSD results compared to XRD results is attributed to the underestimation during EBSD measurement by limited step size. Moreover, the decrease in carbon concentration in high Mn steel is caused by insufficient carbon diffusion at lower annealing temperatures and a lower amount of bainitic transformation. The Kernel average misorientation (KAM) is an indicator of local misorientation and, therefore, of geometrically necessary dislocation density. This is presented in Figure 4d, revealing higher dislocation density in the bainite region because of expansion during transformation. The dislocation density was estimated by KAM using the equation: ρGND = 3θ/ab, where θ is average value of KAM in selected region, a is step size, and b is magnitude of Burgers vector (0.25 nm for BCC-Fe and 0.254 nm for FCC-Fe) [19,20,21]. The dislocation density of ferrite and austenite in the selected bainite region was 1.74 × 10¹⁵ and 1.39 × 10¹⁵ m−2 (average KAM value: 0.67°, 0.53°), respectively, greater than the other ferrite regions of 7.4 × 10¹⁴ m−2 (average KAM value: 0.28°). The other two steels had a similar tendency of dislocation distribution, and more recrystallization ferrite grain was observed in high Mn steel (Figure 4), which was confirmed by the recrystallization analysis based on EBSD results (Figure 6).

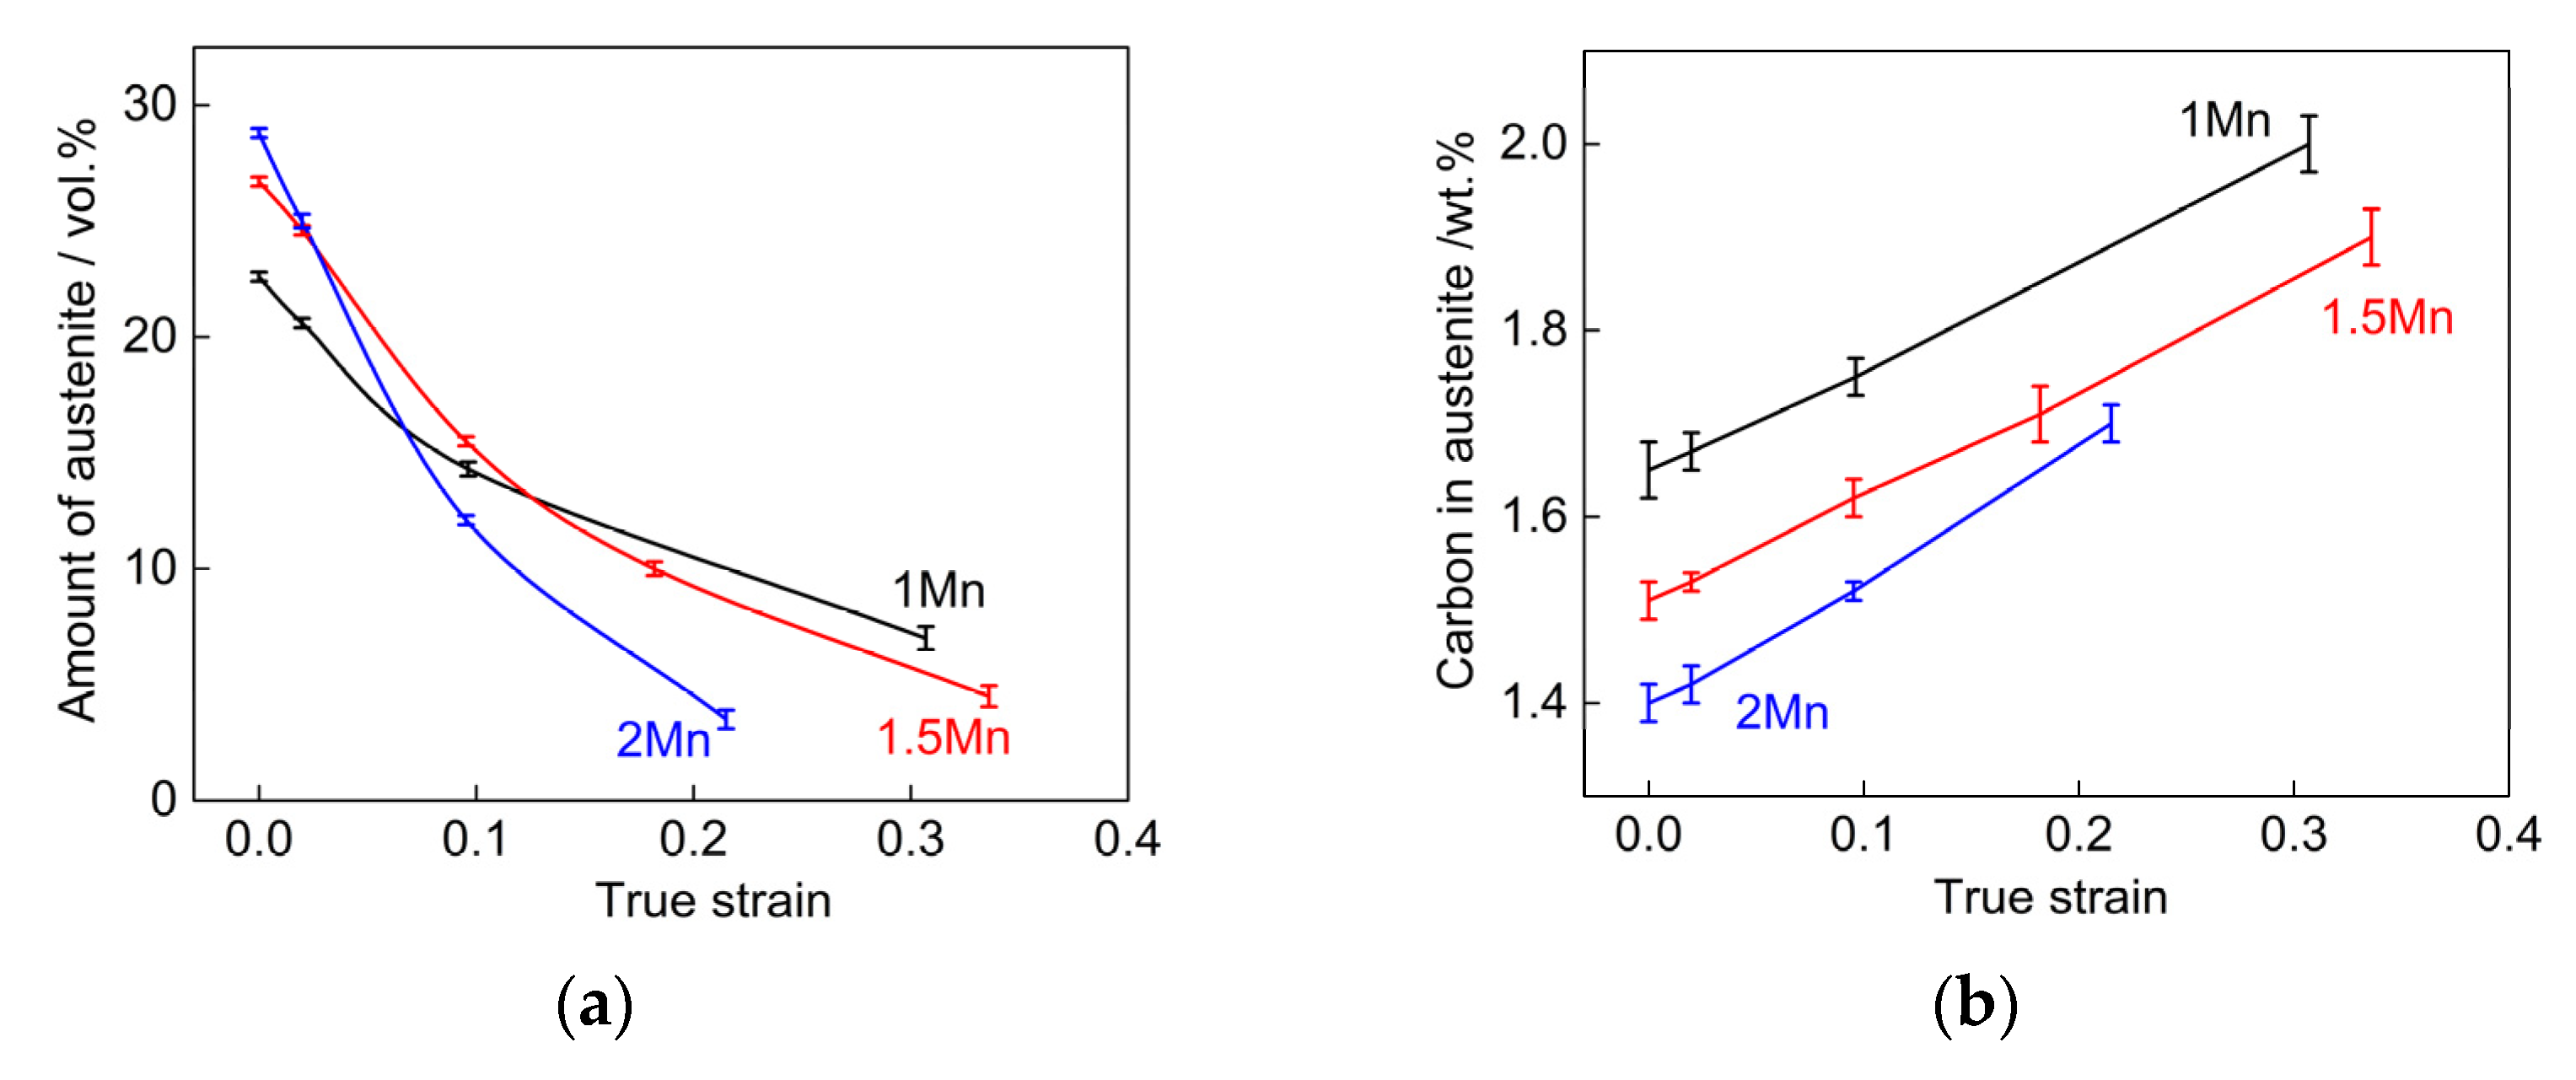
3.2. Tensile Deformation Behavior

Figure 7a illustrates the engineering stress-strain curves of three δ-TRIP steels. 1.5 Mn and 2 Mn steels have higher yield strength, and the tensile strength increases with increasing Mn content. The 2 Mn steel shows comparable mechanical properties with industrial QP980 steel, and has a ~5% lower in density, indicating good applicability. The yield strength, tensile strength, tensile elongation (TEL), and product of strength and elongation (PSE) are presented in Table 4. Compared to the work hardening behavior of experimental steels, the working hardening rate increases with Mn content (Figure 7b). The three steels showed similar work hardening behavior. The work hardening rate first decreases rapidly (Stage I), then recovers to maximum (Stage II), followed by a decrease until necking (Stage III). The work hardening rate of 1.5 Mn and 2 Mn recovers quickly from 4.8 GPa and 6.1 GPa, respectively, and subsequently decreases quickly and then steadily; while that of 1 Mn steel recovers from 1.3 GPa slowly until 0.02 strain, and it remains stable from 0.02 to 0.04 before decreasing slowly (Figure 7b). Furthermore, the work hardening rate of 2 Mn steel has the smallest decreasing rate at the beginning of stage III prior to 0.12 strain.
Tensile tests of δ-TRIP steels were interrupted to obtain specimens at strain levels of 0.0198, 0.0953, and 0.18 (engineering strain of 0.02, 0.1, and 0.2), and the evolution of austenite fraction and carbon content in austenite were obtained by XRD results (Figure 8). Excluding the value in the fracture specimen, the volume fraction of retained austenite seemingly decreased linearly (Figure 8a), and it did not follow the exponential model of fγ = fγ0 exp(−kε) proposed in previous studies [22,23]. This is attributed to the staged transformation behavior of austenite with different morphologies during straining, which was not considered in the exponential model. The carbon content was enhanced with the increase of strain because the retained austenite with lower carbon content had low stability and transformed into martensite (Figure 8b). The progressive TRIP effect of retained austenite was considered as a factor contributing to the enhancement of working hardening, and therefore simultaneous increase of tensile strength and elongation.
Additionally, dislocation density is an important factor that influences the deformation behavior. Using the method mentioned in Section 3.1, the KAM results were used to estimate the average dislocation density during in situ EBSD deformation at strains of 0, 0.0198, 0.0488, 0.0953, and 0.182 (engineering strains of 0, 0.02, 0.05, 0.1, and 0.2). The average dislocation density in austenite and ferrite are listed in Table 5. The initial dislocation density is lower than the value of 1.6 × 10¹⁵ m−2 in Fe-0.42C Q&P steel [24], because of large internal stress generated by large fraction of martensite transformation. Similarly, the low amount of bainitic transformation in high Mn steel reduces the initial dislocation density (Table 5). The dislocation density in both austenite and ferrite increased with strain, because of dislocation multiplication during plasticity deformation and gradually martensitic transformation (Table 5).

4. Discussion

4.1. Effect of Mn Content on Bainitic Transformation

The bainitic transformation occurs by shear transformation such that bainitic ferrite sub-unit nucleates at austenite grain boundaries when the driving force (difference in free energy between FCC and BCC) is adequate. The carbon in supersaturated bainite ferrite partitions to austenite, accompanied by continued bainitic reaction. This reaction stops when the composition in austenite reaches the T0′ curve, widely known as the incomplete reaction of bainitic transformation [25]. At the bainitic isothermal temperature of 400 °C (Figure 1), the bainitic transformation is influenced by chemical and mechanical stability of austenite, which control the bainitic reaction initiation and termination. With increased Mn content in steel (Table 1), the Mn content in prior austenite increases due to similar austenite fraction and the annealing temperature sufficient for C and Mn diffusion. The driving force for bainitic transformation at 400 °C, considering the stored energy 400 J∙mol−1, was calculated as −1797, −1488, and −1213 J∙mol−1 for prior austenite in 1 Mn, 1.5 Mn, and 2 Mn steels, respectively. Thus, high Mn content is the reason for longer induction period of bainitic transformation (Figure 3a). The inhibiting effect of Mn on bainitic transformation kinetics was also reported in previous studies [26,27]. Smaller average grain size of prior austenite was obtained in high Mn steel because of lower annealing temperature (Table 2). It is reported that bainitic transformation is suppressed with a decrease in grain size when the grain size of prior austenite is reduced to several micrometers [28,29,30]. Besides, the growth of a sheaf of bainite cannot be sustained beyond austenite grain boundaries, thus, a smaller grain size is expected to retard its growth [31,32]. Consequently, the smaller grain size of austenite in 2 Mn of 1.5 ± 0.1 μm is the reason for the inhibition of bainitic transformation in high Mn steel (Table 2 and Figure 3b).
Thinner bainite plate microstructure was observed in high Mn δ-TRIP steel (Figure 4). As reported in a previous study [33], the factors affecting the plate thickness are temperature, driving force, and austenite strength. Three experimental steels were all isothermally held at 400 °C for bainitic transformation (Figure 1). The prior austenite in 1 Mn steel had maximum bainitic transformation driving force of −1797 J∙mol−1, which was beneficial for thin bainite plate. However, it obtained the thickest plate (Figure 4), which is contradictory with the driving force data. This is because the significance of austenite strength on plate thickness is 1.8, and it is significantly greater compared to a driving force of 0.6 [33]. High strength of prior austenite in high Mn steel is mainly because of refinement of grain size (Table 2), while the high Mn content has a negligible contribution to the strengthening of austenite. According to the Hall-Petch relationship [34], the strength contribution by grain refinement strengthening of prior austenite in 2 Mn is 245 MPa, greater than that of 1 Mn steel and 1.5 Mn steel. The high Mn steel required low annealing temperature to attain targeted austenite fraction, resulting in a refined grain size of prior austenite with high strength, and thus a thinner plate (Figure 4).

4.2. Effect of Mn Content on Deformation Behavior

Higher yield strength was obtained in 1.5 Mn steel of 559 ± 1 MPa and 2 Mn steel of 558 ± 2 MPa than 1 Mn steel of 532 ± 5 MPa (Figure 7a and Table 4). The yield strength of δ-TRIP is determined by the softer phase ferrite, as the retained austenite is significantly strengthened by carbon in solution [35]. Hence, the contribution to the yield strength is derived from the intrinsic strength of ferrite, solid solution strengthening of Al and Mn in ferrite, grain refinement strengthening, and dislocation strengthening. There was no obvious difference in the Al content, so there was a similar solid solution strengthening effect of Al in three steels. However, the solid solution strengthening effect of Mn increased with the Mn content. More ferrite recrystallization regions in high Mn steel mean refined ferrite grains and thereby an enhanced grain refinement strengthening effect (Figure 6). The highest dislocation density was obtained in 1 Mn steel because of a high degree of bainitic transformation (Table 5), such that subsequently some carbon might be trapped by dislocations during the following hold, achieving the strengthening effect [18]. Even though the dislocation density is low in high Mn steel, the more significant grain refinement strengthening effect and solid solution strengthening effect of Mn lead to higher yield strength (Figure 7a and Table 4).
Considering that it is difficult to increase the yield strength over 500–600 MPa because of the presence of a large fraction of ferrite, the work hardening ability of δ-TRIP steels is needed to enhance target tensile strength. The work hardening of complex phase δ-TRIP steels is mainly controlled by the increase of dislocation density during deformation and martensitic transformation from austenite, namely TRIP effect [36]. As regards TRIP effect, some studies suggested that local plasticity generated by martensitic transformation during deformation results in an increase in dislocation activities and thereby enhances work hardening [37,38,39]. While some studies suggest that the strength difference between fresh martensite and other phases induces strain and stress partitioning, resulting in a composite-like deformation behavior and thus the enhancement of work hardening [40,41,42]. The work hardening ability of experimental δ-TRIP steels increased with Mn content, leading to high tensile strength (Figure 7 and Table 4). In order to understand the increased work hardening in high Mn steel, it was necessary to examine the microstructure at different stages of deformation. The EBSD maps of 1 Mn steel are illustrated in Figure 9, as an example. At an engineering strain of 0.02, part of the blocky austenite with less stability transformed (Figure 8a and Figure 9b). The work hardening rate recovered to maximum (Stage II) in 1 Mn steel and is related to the TRIP effect playing accompanied by dislocation multiplication. The finer size of 1.5 Mn and 2 Mn induced more dislocation multiplication, due to the lager grain boundary. Thus, the rapid work hardening rate recovery (Stage II) and higher work hardening rate in 1.5 Mn and 2 Mn steel are mainly attributed to finer grain size, which generates more dislocations generation near the grain boundaries. This is consistent with the dislocation density results in Table 5, which show increasing dislocation.
With the engineering strain increasing to 0.1, the austenite fraction in the three steels seemingly decreased linearly. As observed in Figure 9c, part of the lath austenite transformed. The linear reduction behavior of retained austenite is attributed to the stage-wise transformation of retained austenite with different morphologies, which was not considered in the conventional model. The austenite in 2 Mn decreases faster in this stage, because of lower mechanical stability (lower carbon content) and reduced hydrostatic pressure by insufficient bainitic transformation (Figure 8). The larger TRIP effect in 2 Mn steel sustains the work hardening rate at a high value in this stage, which contributes to higher strength (Figure 7). Besides the TRIP effect, the dislocations also contribute to significant work hardening. The high internal stress in ferrite adjacent to austenite is obtained by bainitic transformation during isothermal hold and is further enhanced by the martensitic transformation during straining (Figure 9a–c). The high dislocation density near grain boundaries, generated by plastic strain mismatch, resulted in work hardening in this region (Figure 9). Considering the highest fraction of retained austenite transformation and finest grain size in 2 Mn steel, the dislocation strengthening also contributed to high strength. Despite the lower fraction of austenite in 1.5 Mn played TRIP effect during straining compared with the other two steels, it achieves a medium work hardening rate because of the highest dislocation density in both ferrite and austenite at an engineering strain of 0.1 (Figure 7 and Table 4).
At the 0.2 engineering strain, the majority of retained austenite has transformed (Figure 8a and Figure 9d). In view of the lowest stability of retained austenite in 2 Mn steel, its transformation terminated at an engineering strain of 0.24, followed by fracture (Figure 7 and Table 4). The retained austenite in 1.5 Mn steel, with less stability than 1 Mn steel, progressively transformed into martensite and sustained the strain to a high strain value of 0.40. Moreover, the high dislocation density and medium TRIP effect led to medium tensile strength. Consequently, 2 Mn steel has excellent tensile strength comparable with QP980 steel, as a result of significant TRIP effect on the work hardening.

5. Conclusions

The objective of this study was to obtain a δ-TRIP steel with improved tensile strength that is suitable for industrial production. Given that yield strength is low because of a large fraction of ferrite, optimizing the work hardening ability is necessary to increase the strength. The Mn content in δ-TRIP steel was optimized to accomplish the objective. Thus, the effect of Mn on microstructure evolution and deformation behavior was investigated. The main conclusions are as follows:
(1) 2 Mn steel has the lowest degree of bainitic transformation, as a result of fine grain size of prior austenite. The longer incubation period of bainitic transformation in 2 Mn steel is because of high Mn content, and the high strength of prior austenite induces a thinner bainitic plate in 2 Mn steel.
(2) Significant grain refinement strengthening effect and solid solution strengthening effect of Mn lead to higher yield strength of high Mn steels, in spite of lower dislocation density.
(3) The retained austenite in 1.5 Mn steel progressively transformed into martensite and sustained the strain to a high strain value of 0.40, showing that it has obtained the best ductility.
(4) During the deformation process, more dislocations were generated in finer grains, leading to the quick recovery of the working hardening rate (stage II) and higher work hardening in 2 Mn steel. The large TRIP effect in 2 Mn steel provided a high work hardening rate. Hence, 2 Mn indicates highest tensile strength, which is comparable to the mechanical properties of QP980 steel (the first industrialized third generation automotive steel).

Author Contributions

Writing—original draft preparation and review, B.X.; writing—review and editing, P.C.; writing—review and editing, Z.L.; writing—review & editing and revising English writing, R.D.K.M.; project administration: D.W., G.W.; supervision, J.G. and R.L.; Funding acquisition, supervision, project administration and writing-review & editing: H.Y. All authors have read and agreed to the published version of the manuscript.

Funding

The research was financially supported by the National Natural Science Foundation of China (Grant No. 51804072), the Fundamental Research Funds for the Central Universities (Grant No. N2007012), the 111 Project (Grant No. B16009), the National Key Research and Development Program of China (Grant No. 2016YFB0101605-3), the China Postdoctoral Science Foundation (Grant No. 2018M631802), and the Liaoning Revitalization Talents Program (No. xlyc1907128). The authors are grateful to R.D.K. Misra for interpretation, discussion, and suggestions.

Institutional Review Board Statement

Not applicable.

Informed Consent Statement

Not applicable.

Data Availability Statement

Not applicable.

Conflicts of Interest

The authors declare no conflict of interest.

References

  1. Guo, R.; Zhou, J.; Shi, Y. Application of the High Strength Steel in the Automobile. Adv. Mater. Res. 2013, 748, 227–230. [Google Scholar] [CrossRef]
  2. Sohn, S.S.; Song, H.; Kwak, J.-H.; Lee, S. Dramatic improvement of strain hardening and ductility to 95% in highly-deformable high-strength duplex lightweight steels. Sci. Rep. 2017, 7, 1927. [Google Scholar] [CrossRef] [PubMed]
  3. Chen, S.; Rana, R.; Haldar, A.; Ray, R.K. Current state of Fe-Mn-Al-C low density steels. Prog. Mater. Sci. 2017, 89, 345–391. [Google Scholar] [CrossRef]
  4. Injeti, V.S.Y.; Li, Z.C.; Yu, B.; Misra, R.D.K.; Cai, Z.H.; Ding, H. Macro to nanoscale deformation of transformation-induced plasticity steels: Impact of aluminum on the microstructure and deformation behavior. J. Mater. Sci. Technol. 2018, 34, 745–755. [Google Scholar] [CrossRef]
  5. Chatterjee, S.; Murugananth, M.; Bhadeshia, H.K.D.H. δ TRIP steel. Mater. Sci. Technol. 2007, 23, 819–827. [Google Scholar] [CrossRef]
  6. Yi, H.L.; Lee, K.Y.; Bhadeshia, H.K.D.H. Extraordinary ductility in Al-bearing δ-TRIP steel. Proc. R. Soc. A 2011, 467, 234–243. [Google Scholar] [CrossRef] [Green Version]
  7. Yi, H.L.; Lee, K.Y.; Bhadeshia, H.K.D.H. Mechanical stabilisation of retained austenite in δ-TRIP steel. Mater. Sci. Eng. A 2011, 528, 5900–5903. [Google Scholar] [CrossRef]
  8. Yi, H.L. Review on δ-transformation-induced plasticity (TRIP) steels with low density: The concept and current progress. JOM 2014, 66, 1759–1769. [Google Scholar] [CrossRef]
  9. Yi, H.L.; Lee, K.Y.; Lim, J.H.; Bhadeshia, H.K.D.H. Spot weldability of δ-TRIP steel containing 0.4 wt-%C. Sci. Technol. Weld. Join. 2010, 15, 619–624. [Google Scholar] [CrossRef]
  10. Mintz, B.; Gunawardana, W.D.; Su, H. Al as solid solution hardener in steels. Mater. Sci. Technol. 2008, 24, 596–600. [Google Scholar] [CrossRef]
  11. Pang, J.; Xu, B.; Wang, G.; Lu, Q.; Wang, J.; Yi, H.L. Effect of silicon and aluminium in ferrite on tensile and impact properties. Mater. Sci. Technol. 2017, 33, 1–5. [Google Scholar] [CrossRef]
  12. Chiang, J.; Lawrence, B.; Boyd, J.D.; Pilkey, A.K. Effect of microstructure on retained austenite stability and work hardening of TRIP steels. Mater. Sci. Eng. A 2011, 528, 4516–4521. [Google Scholar] [CrossRef]
  13. Chiang, J.; Boyd, J.D.; Pilkey, A.K. Effect of microstructure on retained austenite stability and tensile behaviour in an aluminum-alloyed TRIP steel. Mater. Sci. Eng. A 2015, 638, 132–142. [Google Scholar] [CrossRef]
  14. Yi, H.L.; Lee, K.Y.; Bhadeshia, H.K.D.H. Stabilisation of ferrite in hot rolled δ-TRIP steel. Mater. Sci. Technol. 2011, 27, 525–529. [Google Scholar] [CrossRef]
  15. Rietveld, H.M. Line profiles of neutron powder-diffraction peaks for structure refinement. Acta Crystallogr. 1967, 22, 151–152. [Google Scholar] [CrossRef]
  16. Rietveld, H.M. A profile refinement method for nuclear and magnetic structures. J. Appl. Crystallogr. 1969, 2, 65–71. [Google Scholar] [CrossRef]
  17. Hill, R.J.; Howard, C.J. Quantitative phase analysis from neutron powder diffraction data using the Rietveld method. J. Appl. Crystallogr. 1987, 20, 467–474. [Google Scholar] [CrossRef]
  18. Chen, P.; Wang, G.D.; Ceguerra, A.V.; Breen, A.J.; Ringer, S.P.; Xiong, X.C.; Lu, Q.; Wang, J.F.; Yi, H.L. Yield Strength Enhancement by Carbon Trapping in Ferrite of the Quenching and Partitioning Steel. Metall. Mater. Trans. A 2018, 49, 235–240. [Google Scholar] [CrossRef]
  19. Konijnenberg, P.J.; Zaefferer, S.; Raabe, D. Assessment of geometrically necessary dislocation levels derived by 3D EBSD. Acta Mater. 2015, 99, 402–414. [Google Scholar] [CrossRef]
  20. Guglielmi, P.O.; Ziehmer, M.; Lilleodden, E.T. On a novel strain indicator based on uncorrelated misorientation angles for correlating dislocation density to local strength. Acta Mater. 2018, 150, 195–205. [Google Scholar] [CrossRef]
  21. Wang, M.; Huang, M.X. Abnormal TRIP effect on the work hardening behavior of a quenching and partitioning steel at high strain rate. Acta Mater. 2020, 188, 551–559. [Google Scholar] [CrossRef]
  22. Sugimoto, K.-I.; Kobayashi, M.; Hashimoto, S.-I. Ductility and strain-induced transformation in a high-strength transformation-induced plasticity-aided dual-phase steel. Metall. Trans. A 1992, 23, 3085–3091. [Google Scholar] [CrossRef]
  23. Shi, J.; Sun, X.; Wang, M.; Hui, W.; Dong, H.; Cao, W. Enhanced work-hardening behavior and mechanical properties in ultrafine-grained steels with large-fractioned metastable austenite. Scr. Mater. 2010, 63, 815–818. [Google Scholar] [CrossRef]
  24. Gao, G.; Gao, B.; Gui, X.; Hu, J.; He, J.; Tan, Z.; Bai, B. Correlation between microstructure and yield strength of as-quenched and Q&P steels with different carbon content (0.06–0.42 wt%C). Mater. Sci. Eng. A. 2019, 753, 1–10. [Google Scholar]
  25. Bhadeshia, H.K.D.H. Bainite in Steels: Transformations, Microstructure and Properties, 2nd ed.; The Institute of Materials, University of Cambridge: London, UK, 2001; pp. 63–89. [Google Scholar]
  26. Sourmail, T.; Smanio, V. Low temperature kinetics of bainite formation in high carbon steels. Acta Mater. 2013, 61, 2639–2648. [Google Scholar] [CrossRef]
  27. Liu, S.K.; Zhang, J. The influence of the Si and Mn concentrations on the kinetics of the bainite transformation in Fe-C-Si-Mn alloys. Metall. Trans. A 1990, 21, 1517–1525. [Google Scholar] [CrossRef]
  28. Jiang, T.; Liu, H.; Sun, J.; Guo, S.; Liu, Y. Effect of austenite grain size on transformation of nanobainite and its mechanical properties. Mater. Sci. Eng. A 2016, 666, 207–213. [Google Scholar] [CrossRef]
  29. Sun, J.-J.; Lian, F.-L.; Liu, H.-J.; Jiang, T.; Guo, S.-W.; Du, L.-X.; Liu, Y.-N. Microstructure of warm rolling and pearlitic transformation of ultrafine-grained GCr15 steel. Mater. Charact. 2014, 95, 291–298. [Google Scholar] [CrossRef]
  30. Lian, F.L.; Liu, H.J.; Sun, J.J.; Sun, X.J.; Guo, S.W.; Liu, Y.N.; Du, L.X. Ultrafine grain effect on pearlitic transformation in hypereutectoid steel. J. Mater. Res. 2013, 28, 757–765. [Google Scholar] [CrossRef]
  31. Xu, G.; Liu, F.; Wang, L.; Hu, H. A new approach to quantitative analysis of bainitic transformation in a superbainite steel. Scr. Mater. 2013, 68, 833–836. [Google Scholar] [CrossRef]
  32. Sun, J.; Wang, Y.; Guo, S.; Liu, Y. Effect of prior austenite grain size on isothermal bainite transformation in 65Cr steel. Mater. Lett. 2020, 266, 127495. [Google Scholar] [CrossRef]
  33. Singh, S.B.; Bhadeshia, H.K.D.H. Estimation of bainite plate-thickness in low-alloy steels. Mater. Sci. Eng. A 1998, 245, 72–79. [Google Scholar] [CrossRef]
  34. Seo, E.J.; Cho, L.; Estrin, Y.; De Cooman, B.C. Microstructure-mechanical properties relationships for quenching and partitioning (Q&P) processed steel. Acta Mater. 2016, 113, 124–139. [Google Scholar]
  35. Eliasson, J.; Sandström, R. Proof strength values for austenitic stainless steels at elevated temperatures. Steel Res. 2000, 71, 249–254. [Google Scholar] [CrossRef]
  36. Findley, K.O.; Hidalgo, J.; Huizenga, R.M.; Santofimia, M.J. Controlling the work hardening of martensite to increase the strength/ductility balance in quenched and partitioned steels. Mater. Des. 2017, 117, 248–256. [Google Scholar] [CrossRef]
  37. Han, H.N.; Lee, C.G.; Suh, D.-W.; Kim, S.-J. A microstructure-based analysis for transformation induced plasticity and mechanically induced martensitic transformation. Mater. Sci. Eng. A 2008, 485, 224–233. [Google Scholar] [CrossRef]
  38. Miyamoto, G.; Shibata, A.; Maki, T.; Furuhara, T. Precise measurement of strain accommodation in austenite matrix surrounding martensite in ferrous alloys by electron backscatter diffraction analysis. Acta Mater. 2009, 57, 1120–1131. [Google Scholar] [CrossRef]
  39. Ennis, B.L.; Jimenez-Melero, E.; Atzema, E.H.; Krugla, M.; Azeem, M.A.; Rowley, D.; Daisenberger, D.; Hanlon, D.N.; Lee, P.D. Metastable austenite driven work-hardening behaviour in a TRIP-assisted dual phase steel. Int. J. Plast. 2017, 88, 126–139. [Google Scholar] [CrossRef]
  40. Harjo, S.; Tsuchida, N.; Abe, J.; Gong, W. Martensite phase stress and the strengthening mechanism in TRIP steel by neutron diffraction. Sci. Rep. 2017, 7, 15149. [Google Scholar] [CrossRef]
  41. Jacques, P.J.; Delannay, F.; Ladrière, J. On the influence of interactions between phases on the mechanical stability of retained austenite in transformation-induced plasticity multiphase steels. Metall. Mater. Trans. A 2001, 32, 2759–2768. [Google Scholar] [CrossRef]
  42. Tan, X.; Ponge, D.; Lu, W.; Xu, Y.; He, H.; Yan, J.; Wu, D.; Raabe, D. Joint investigation of strain partitioning and chemical partitioning in ferrite-containing TRIP-assisted steels. Acta Mater. 2020, 186, 374–388. [Google Scholar] [CrossRef]
Figure 1. Schematic representation of the δ-TRIP steels heat treatment.
Metals 11 00523 g001
Figure 2. The quenched microstructure after intercritical annealing of (a) 1 Mn steel, (b) 1.5 Mn steel, and (c) 2 Mn steel; (d) relative volume variation as a function of temperature during cooling in process 1. F and IA present ferrite and prior austenite, respectively.
Metals 11 00523 g002aMetals 11 00523 g002b
Figure 3. The dilatometry results of experimental steels. (a) Time-temperature-transformation (TTT) curves; (b) relative volume variation as a function of time during the bainite isothermal and subsequent cooling in process 3; (c) relative volume variation as a function of temperature during cooling in process 3.
Metals 11 00523 g003
Figure 4. The microstructure observation by scanning electron microscope (SEM) (ac) and electron backscattered diffraction (EBSD) (df) on three experimental steels treated by process 2. (a,d) 1 Mn steel; (b,e) 1.5 Mn steel; (c,f) 2 Mn steel. F, A, and B in (ac) represent ferrite, austenite, and bainite; the red regions in (cf) show austenite phase. The inserted image in (d) is the kernel average misorientation (KAM) map of the yellow rectangle region.
Metals 11 00523 g004
Figure 5. The TEM morphology of 1 Mn in process 2, (a) bright field of lath austenite; (b) dark field of lath austenite.
Metals 11 00523 g005
Figure 6. The volume fraction of recrystallization, substructure, and deformation region in ferrite.
Metals 11 00523 g006
Figure 7. (a) Engineering stress-strain curves; (b) true stress-strain and corresponding work hardening rate curves up to necking of experimental steels. The mechanical properties of industrial QP980 steel are labelled in (a), and the inserted map in (b) is the magnification of the green dotted rectangle.
Metals 11 00523 g007
Figure 8. (a) The change of austenite fraction and (b) carbon content in austenite as a function of true strain, obtained from XRD results.
Metals 11 00523 g008
Figure 9. The EBSD phase maps, KAM maps, and KAM in ferrite maps of 1 Mn steel at different engineering strain of (a) 0, (b) 0.02, (c) 0.1 and (d) 0.2.
Metals 11 00523 g009
Table 1. Chemical compositions of three δ-TRIP steels with different Mn content (wt.%).
SteelsCMnAlFe
1 Mn0.411.073.37Bal.
1.5 Mn0.401.553.45Bal.
2 Mn0.391.993.54Bal.
Table 2. Fraction and grain size of prior austenite measured by image analyses.
SteelsAnnealing ProcessFraction/vol.%Grain Size/µm
1 Mn900 °C-5 min48 ± 14.0 ± 0.5
1.5 Mn850 °C-5 min50 ± 13.2 ± 0.4
2 Mn830 °C-5 min52 ± 11.5 ± 0.1
Table 3. Austenite fraction and carbon content in austenite, obtained from X-ray diffraction (XRD) and EBSD results.
SteelsXRD ResultsEBSD Results
Austenite Fraction/vol.%Carbon Content/wt.%Austenite Fraction/vol.%
1 Mn22.6 ± 0.21.65 ± 0.0316.2
1.5 Mn26.7 ± 0.21.51 ± 0.0226.9
2 Mn28.8 ± 0.21.40 ± 0.0227.2
Table 4. Tensile properties of three δ-TRIP steels.
SteelsYS/MPaTS/MPaTEL/%PSE/GPa%
1 Mn532 ± 5672 ± 736 ± 124.2
1.5 Mn559 ± 1824 ± 140 ± 232.6
2 Mn558 ± 2951 ± 524 ± 122.8
Table 5. The change in the dislocation density and fraction in retained austenite at different strains, as obtained by EBSD. (Unit of dislocation density: 1015 m−2; fraction of retained austenite: vol.%) Dγ, Dα, and Vγ represent density of austenite, density of ferrite, and fraction of retained austenite.
Strain (Engineering Strain)1 Mn1.5 Mn2 Mn
DγDαVγDγDαVγDγDαVγ
01.341.1216.20.830.7527.00.740.7227.2
0.0198 (0.02)1.471.1915.81.020.8725.30.940.8625.0
0.0488 (0.05)1.641.3713.21.311.1121.11.301.1318.6
0.0953 (0.1)1.711.679.81.801.5815.61.751.5411.9
0.182 (0.2)2.412.235.62.592.399.82.362.166.8
Publisher’s Note: MDPI stays neutral with regard to jurisdictional claims in published maps and institutional affiliations.

