
Improving the W Coating Uniformity by a COMSOL Model-Based CVD Parameter Study for Denser Wf/W Composites

 , ,
, ,  and
and
Abstract
:1. Introduction
2. Model Descriptions
2.1. Micro-Scale Model
2.1.1. Geometry and Boundary Conditions
2.1.2. Parameter Study Concept
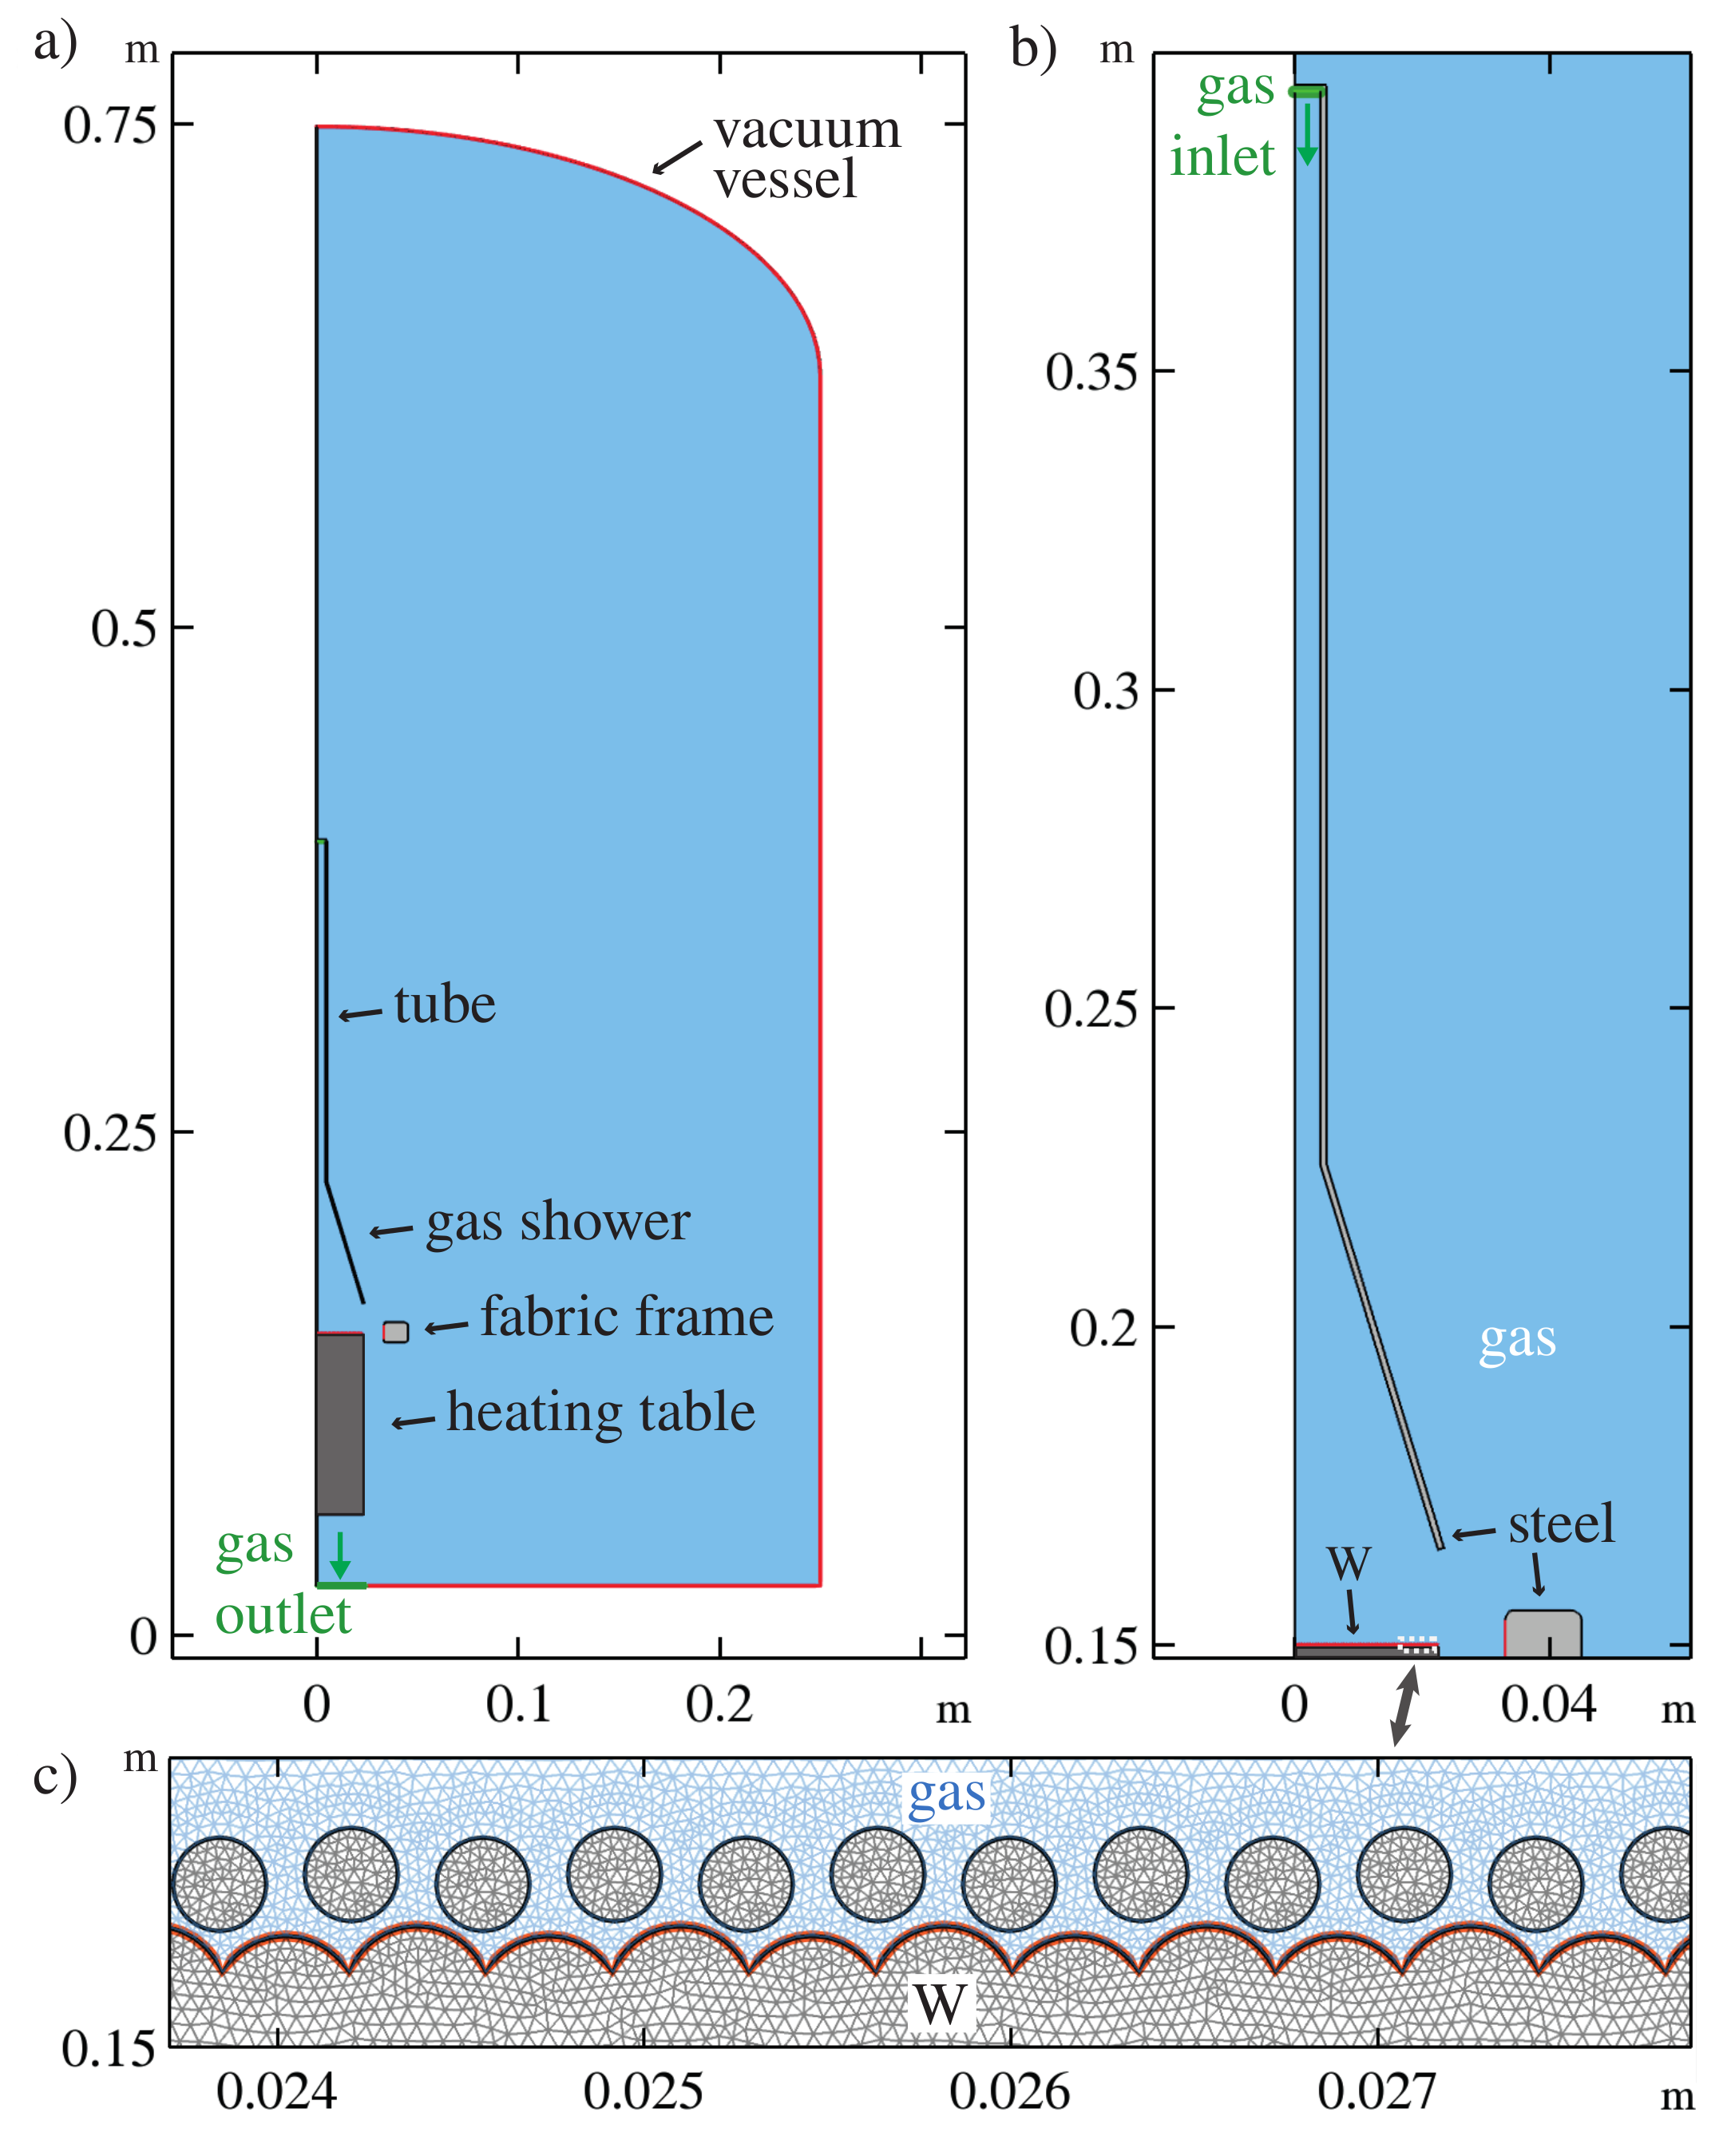
2.2. Macro-Scale Model (CVD-Reactor)
3. Results and Discussion
3.1. Physical Parameter Study (Micro-Scale)
3.1.1. Variation of
3.1.2. Variation of
3.1.3. Variation of T
3.1.4. Variation of the Substrate Geometry
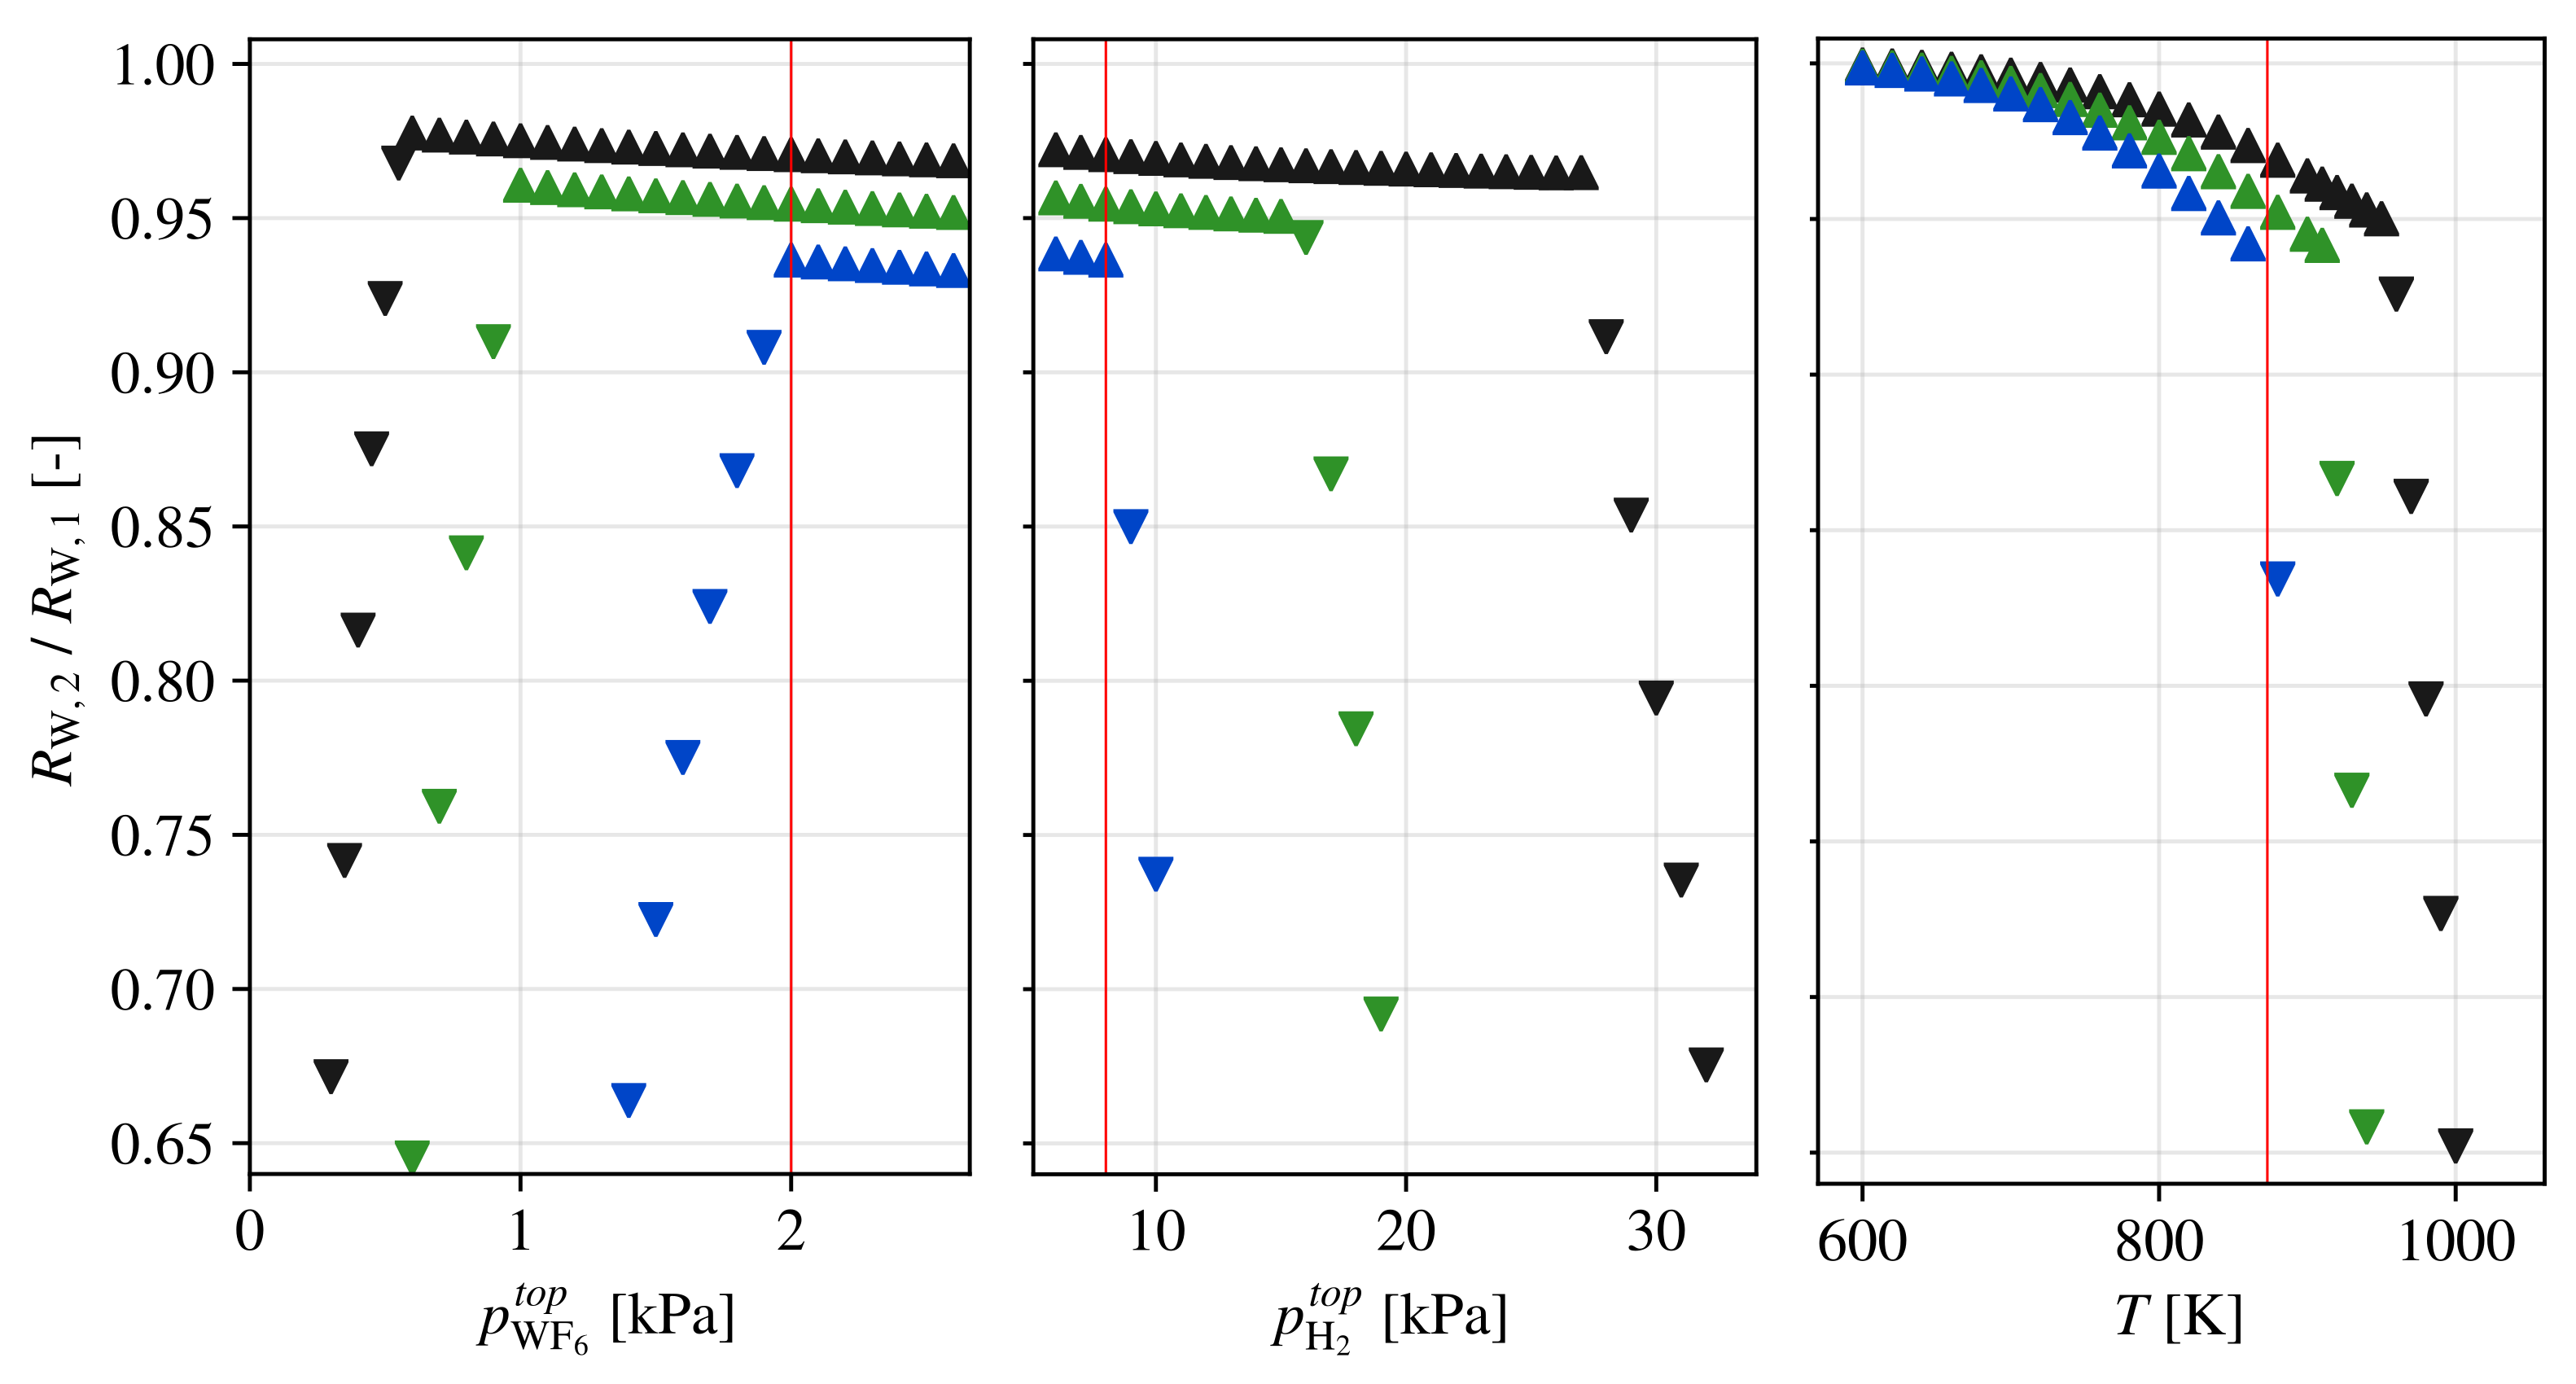
3.2. CVD Process Parameter Study (Macro Scale)
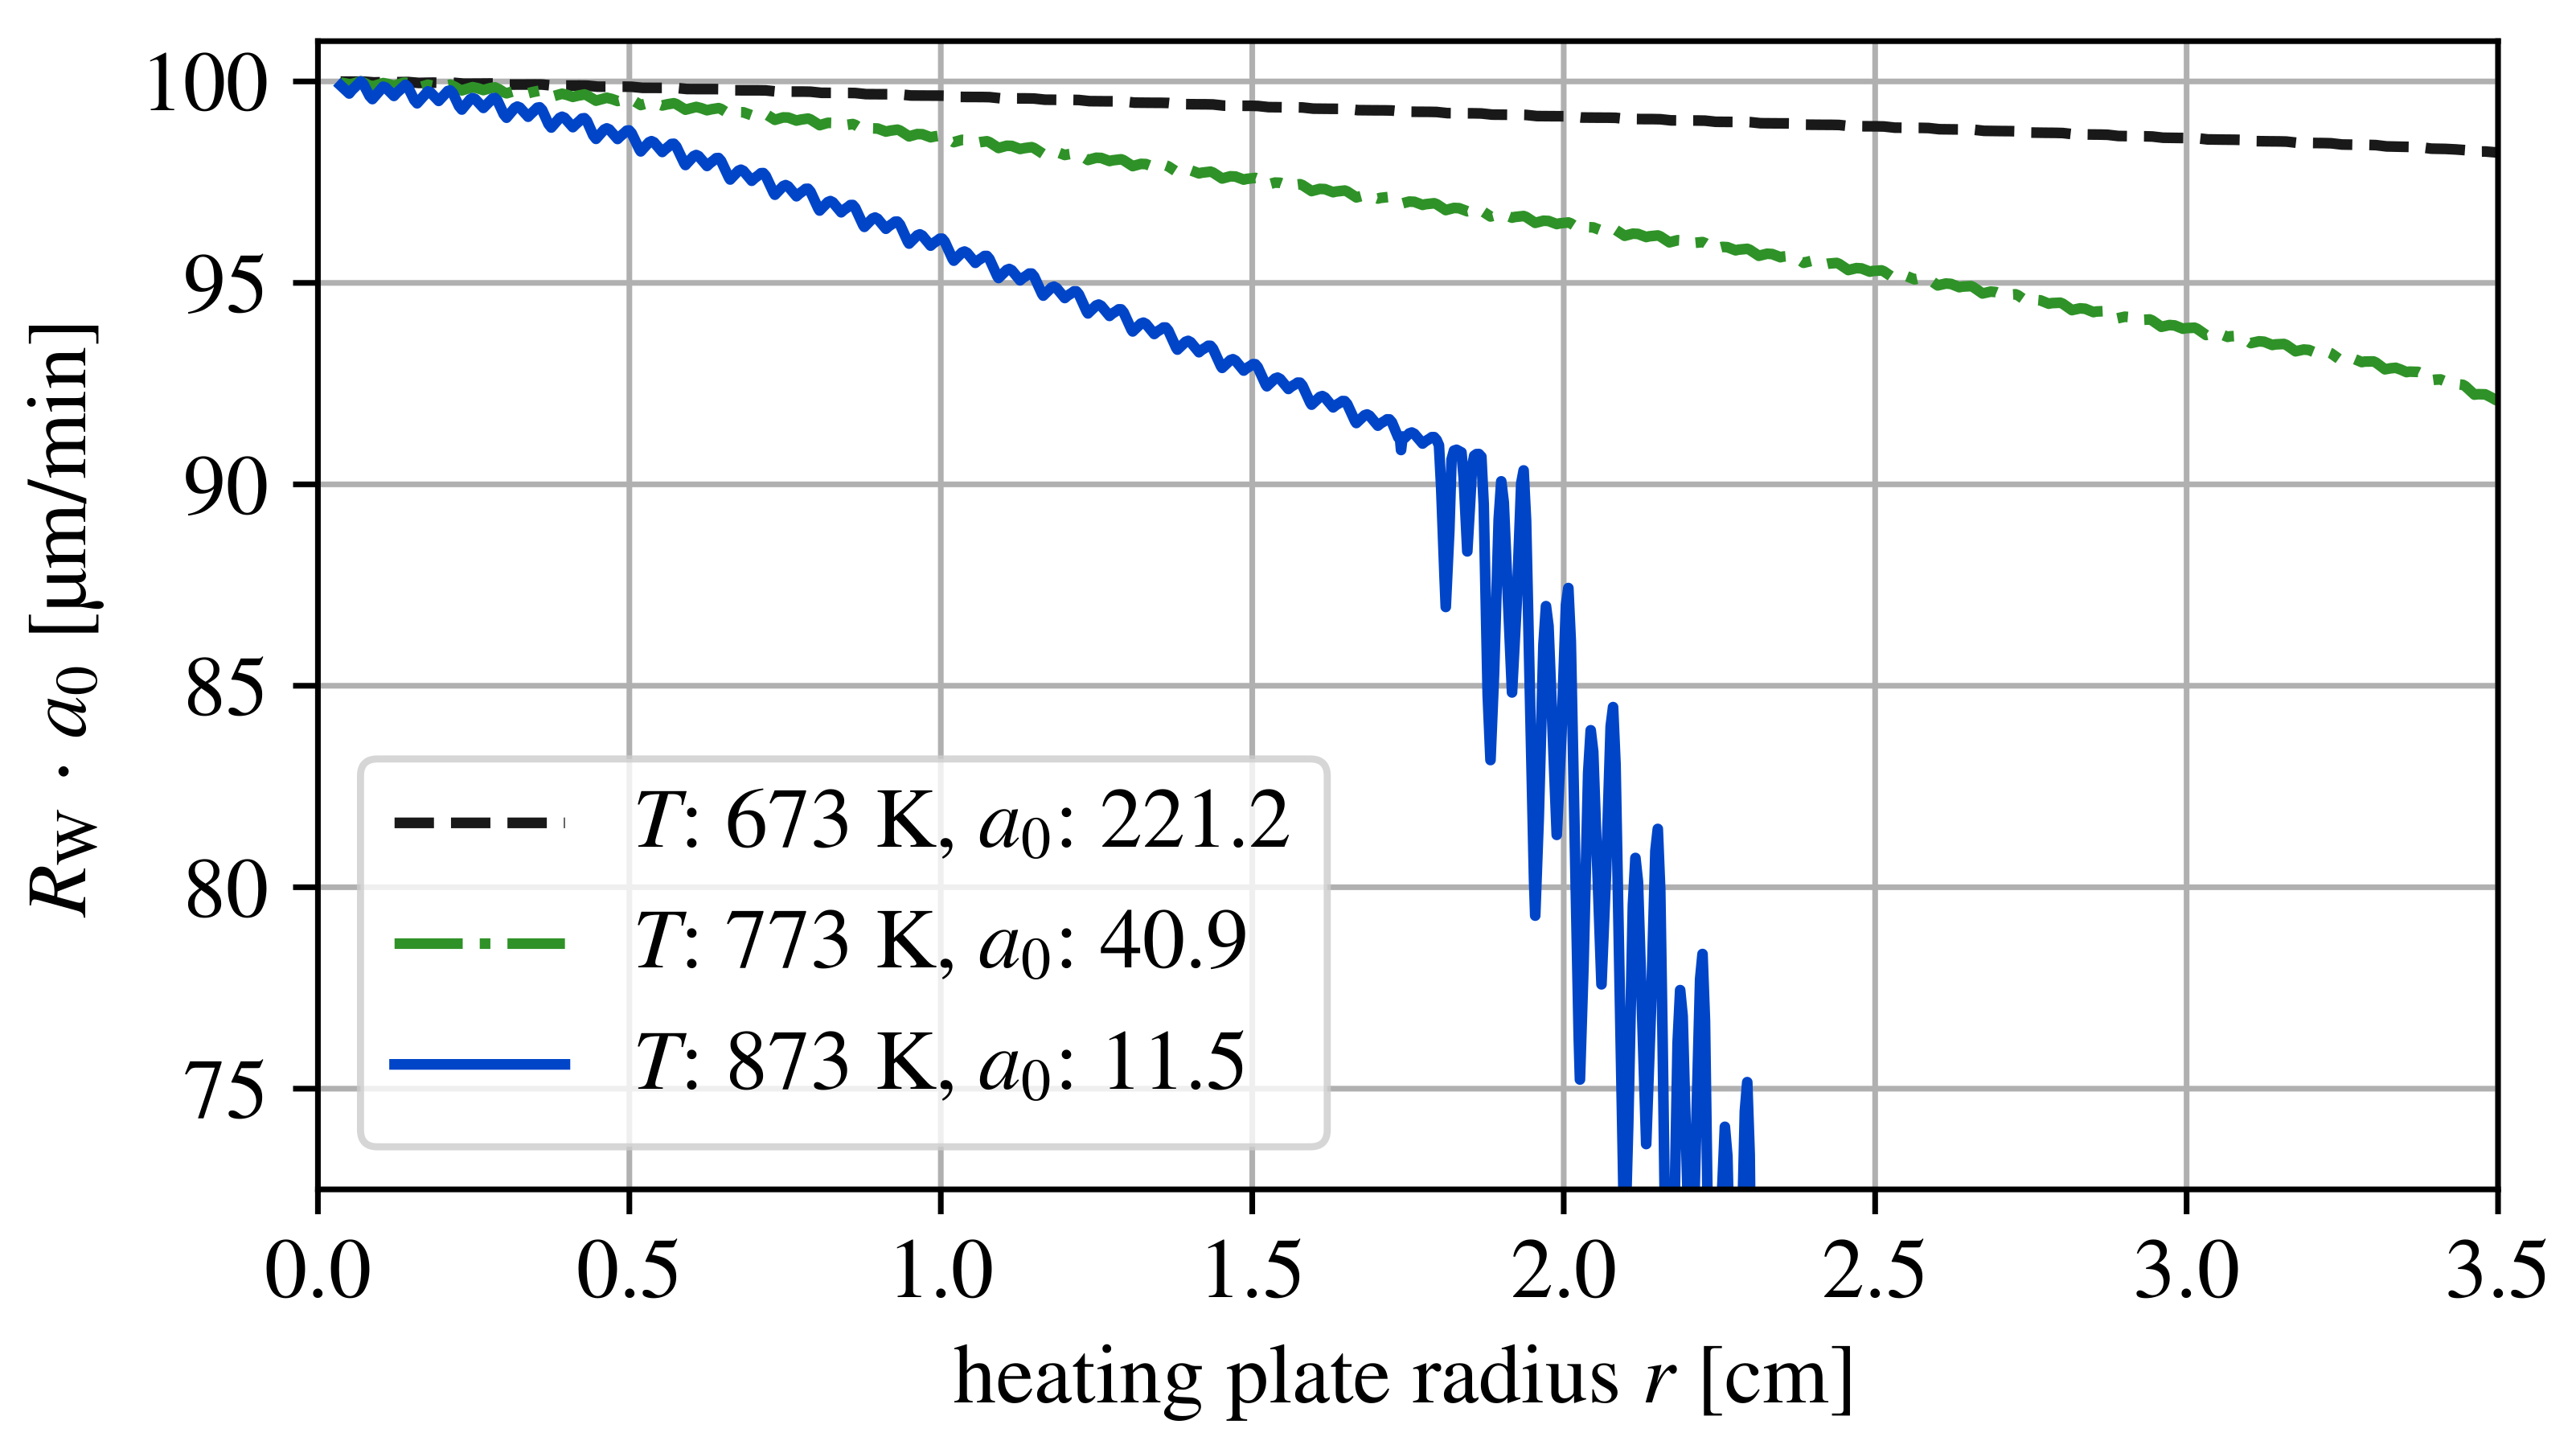
3.2.1. Variation of T
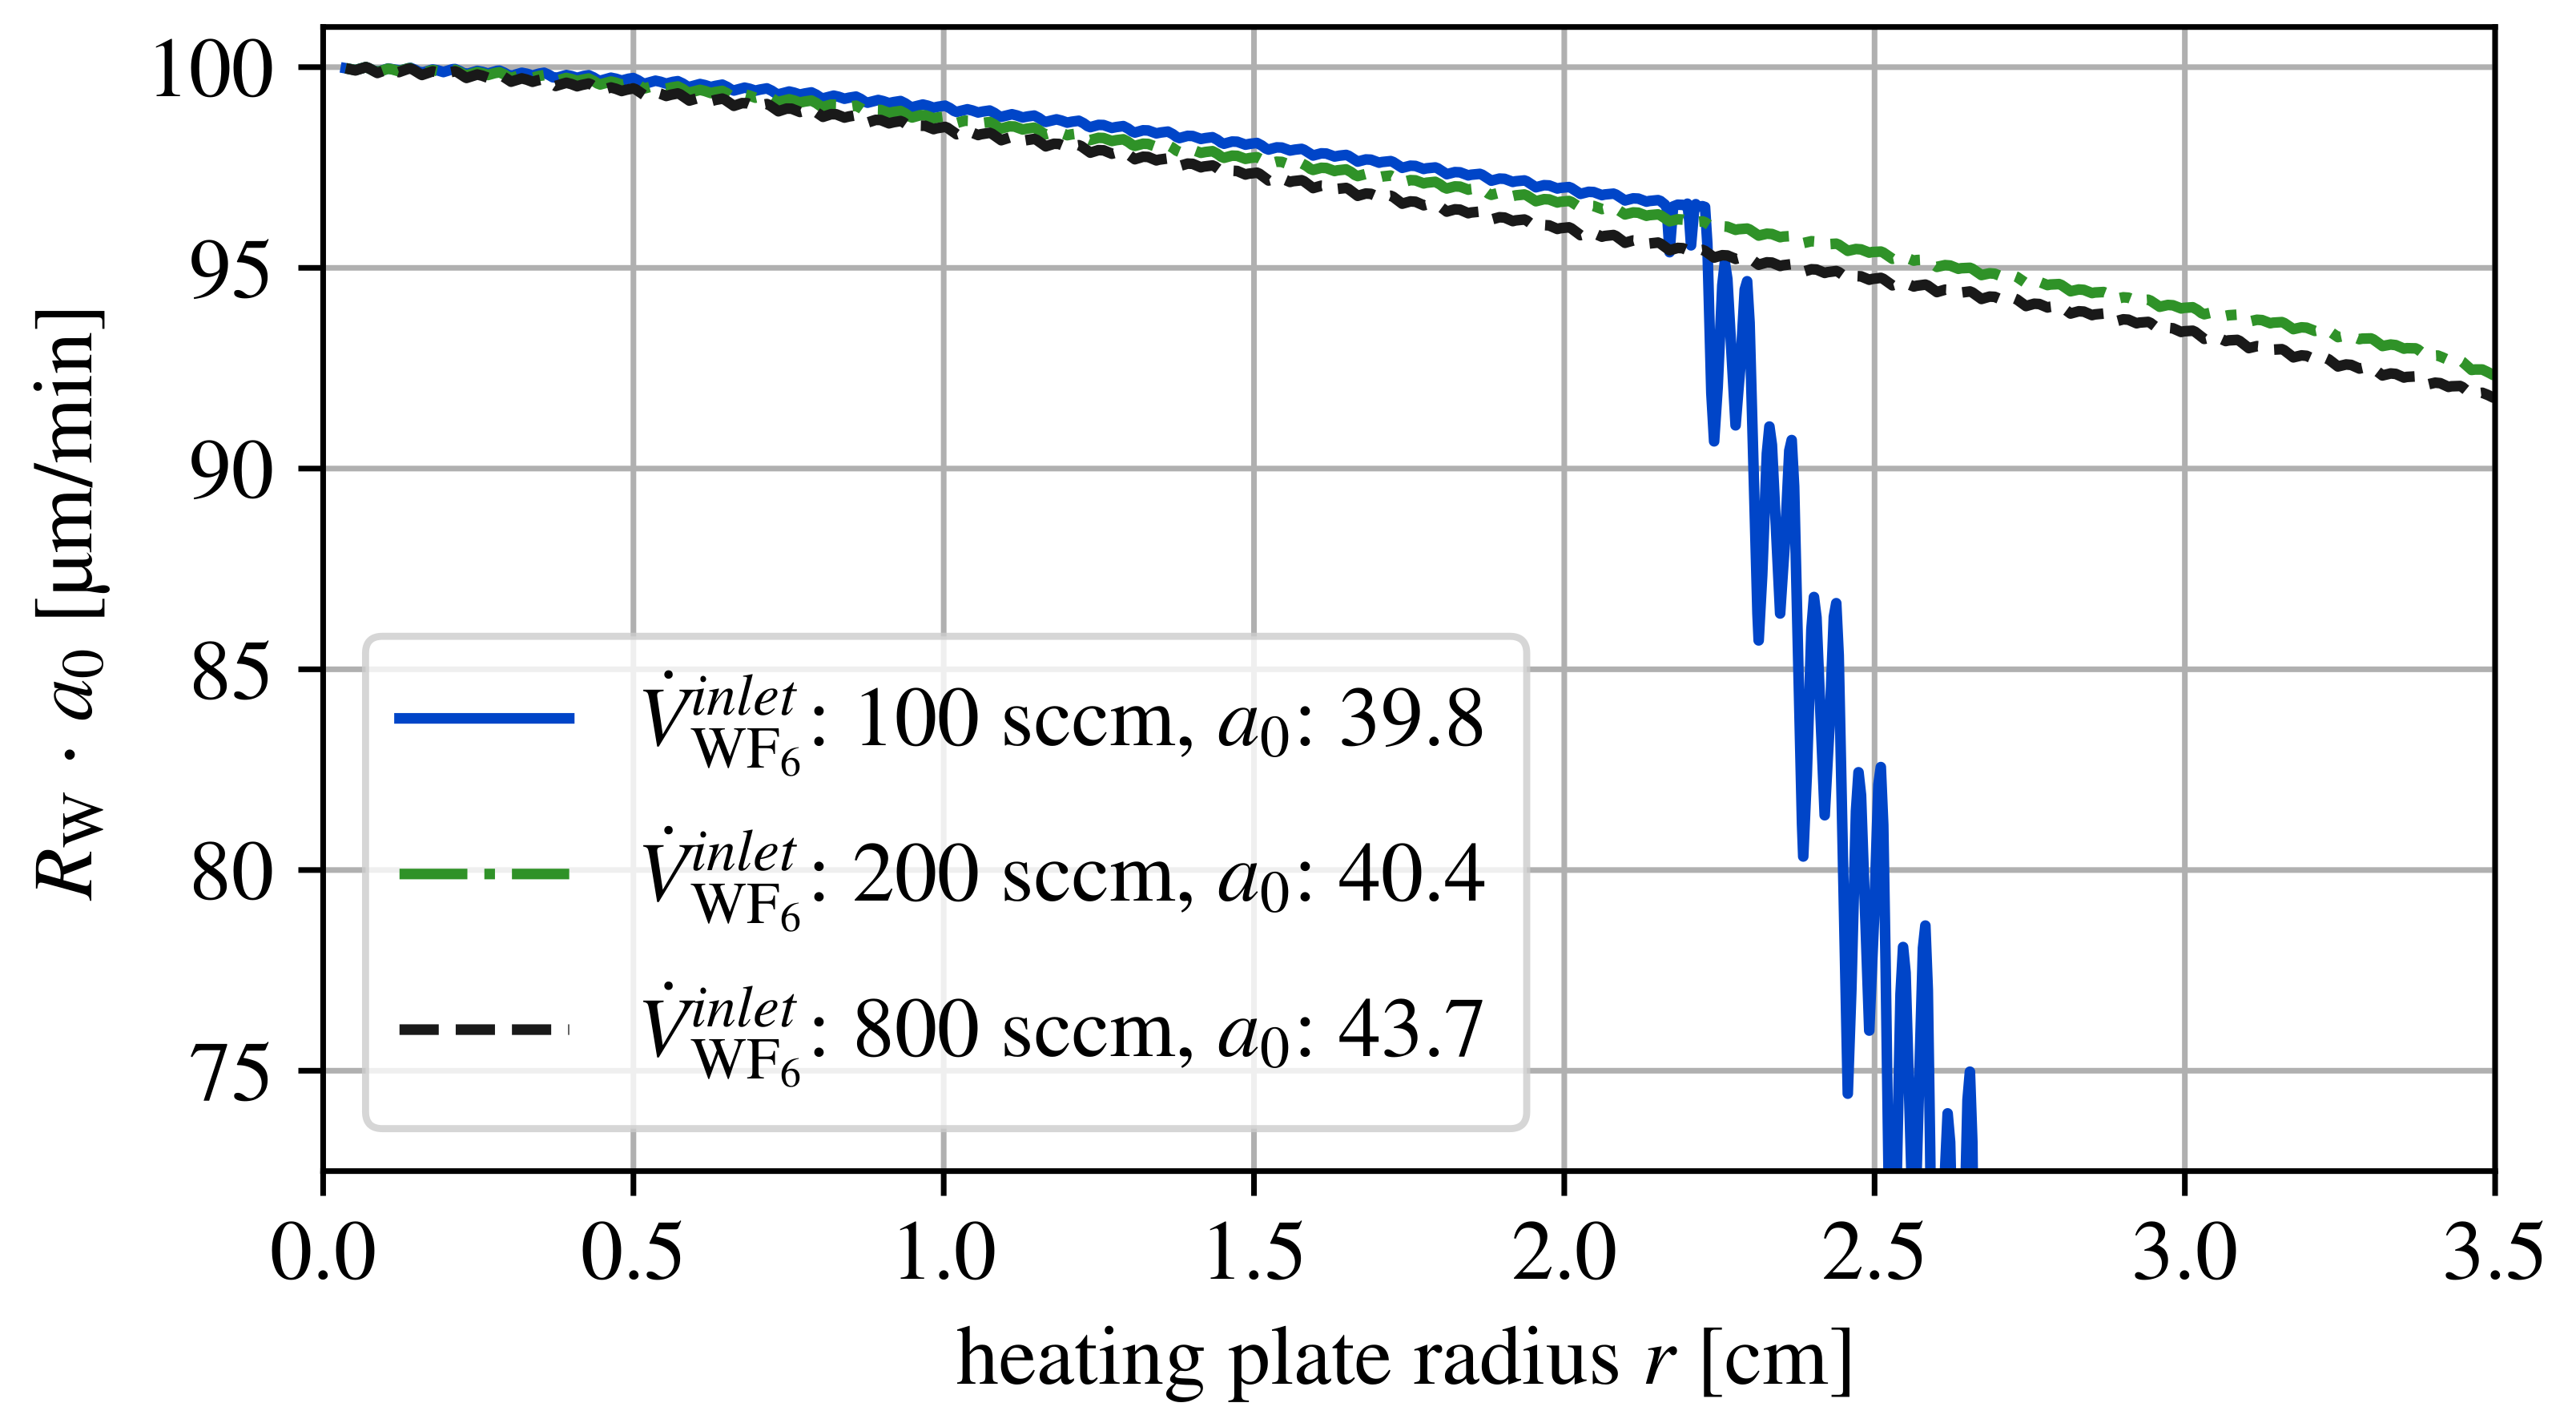
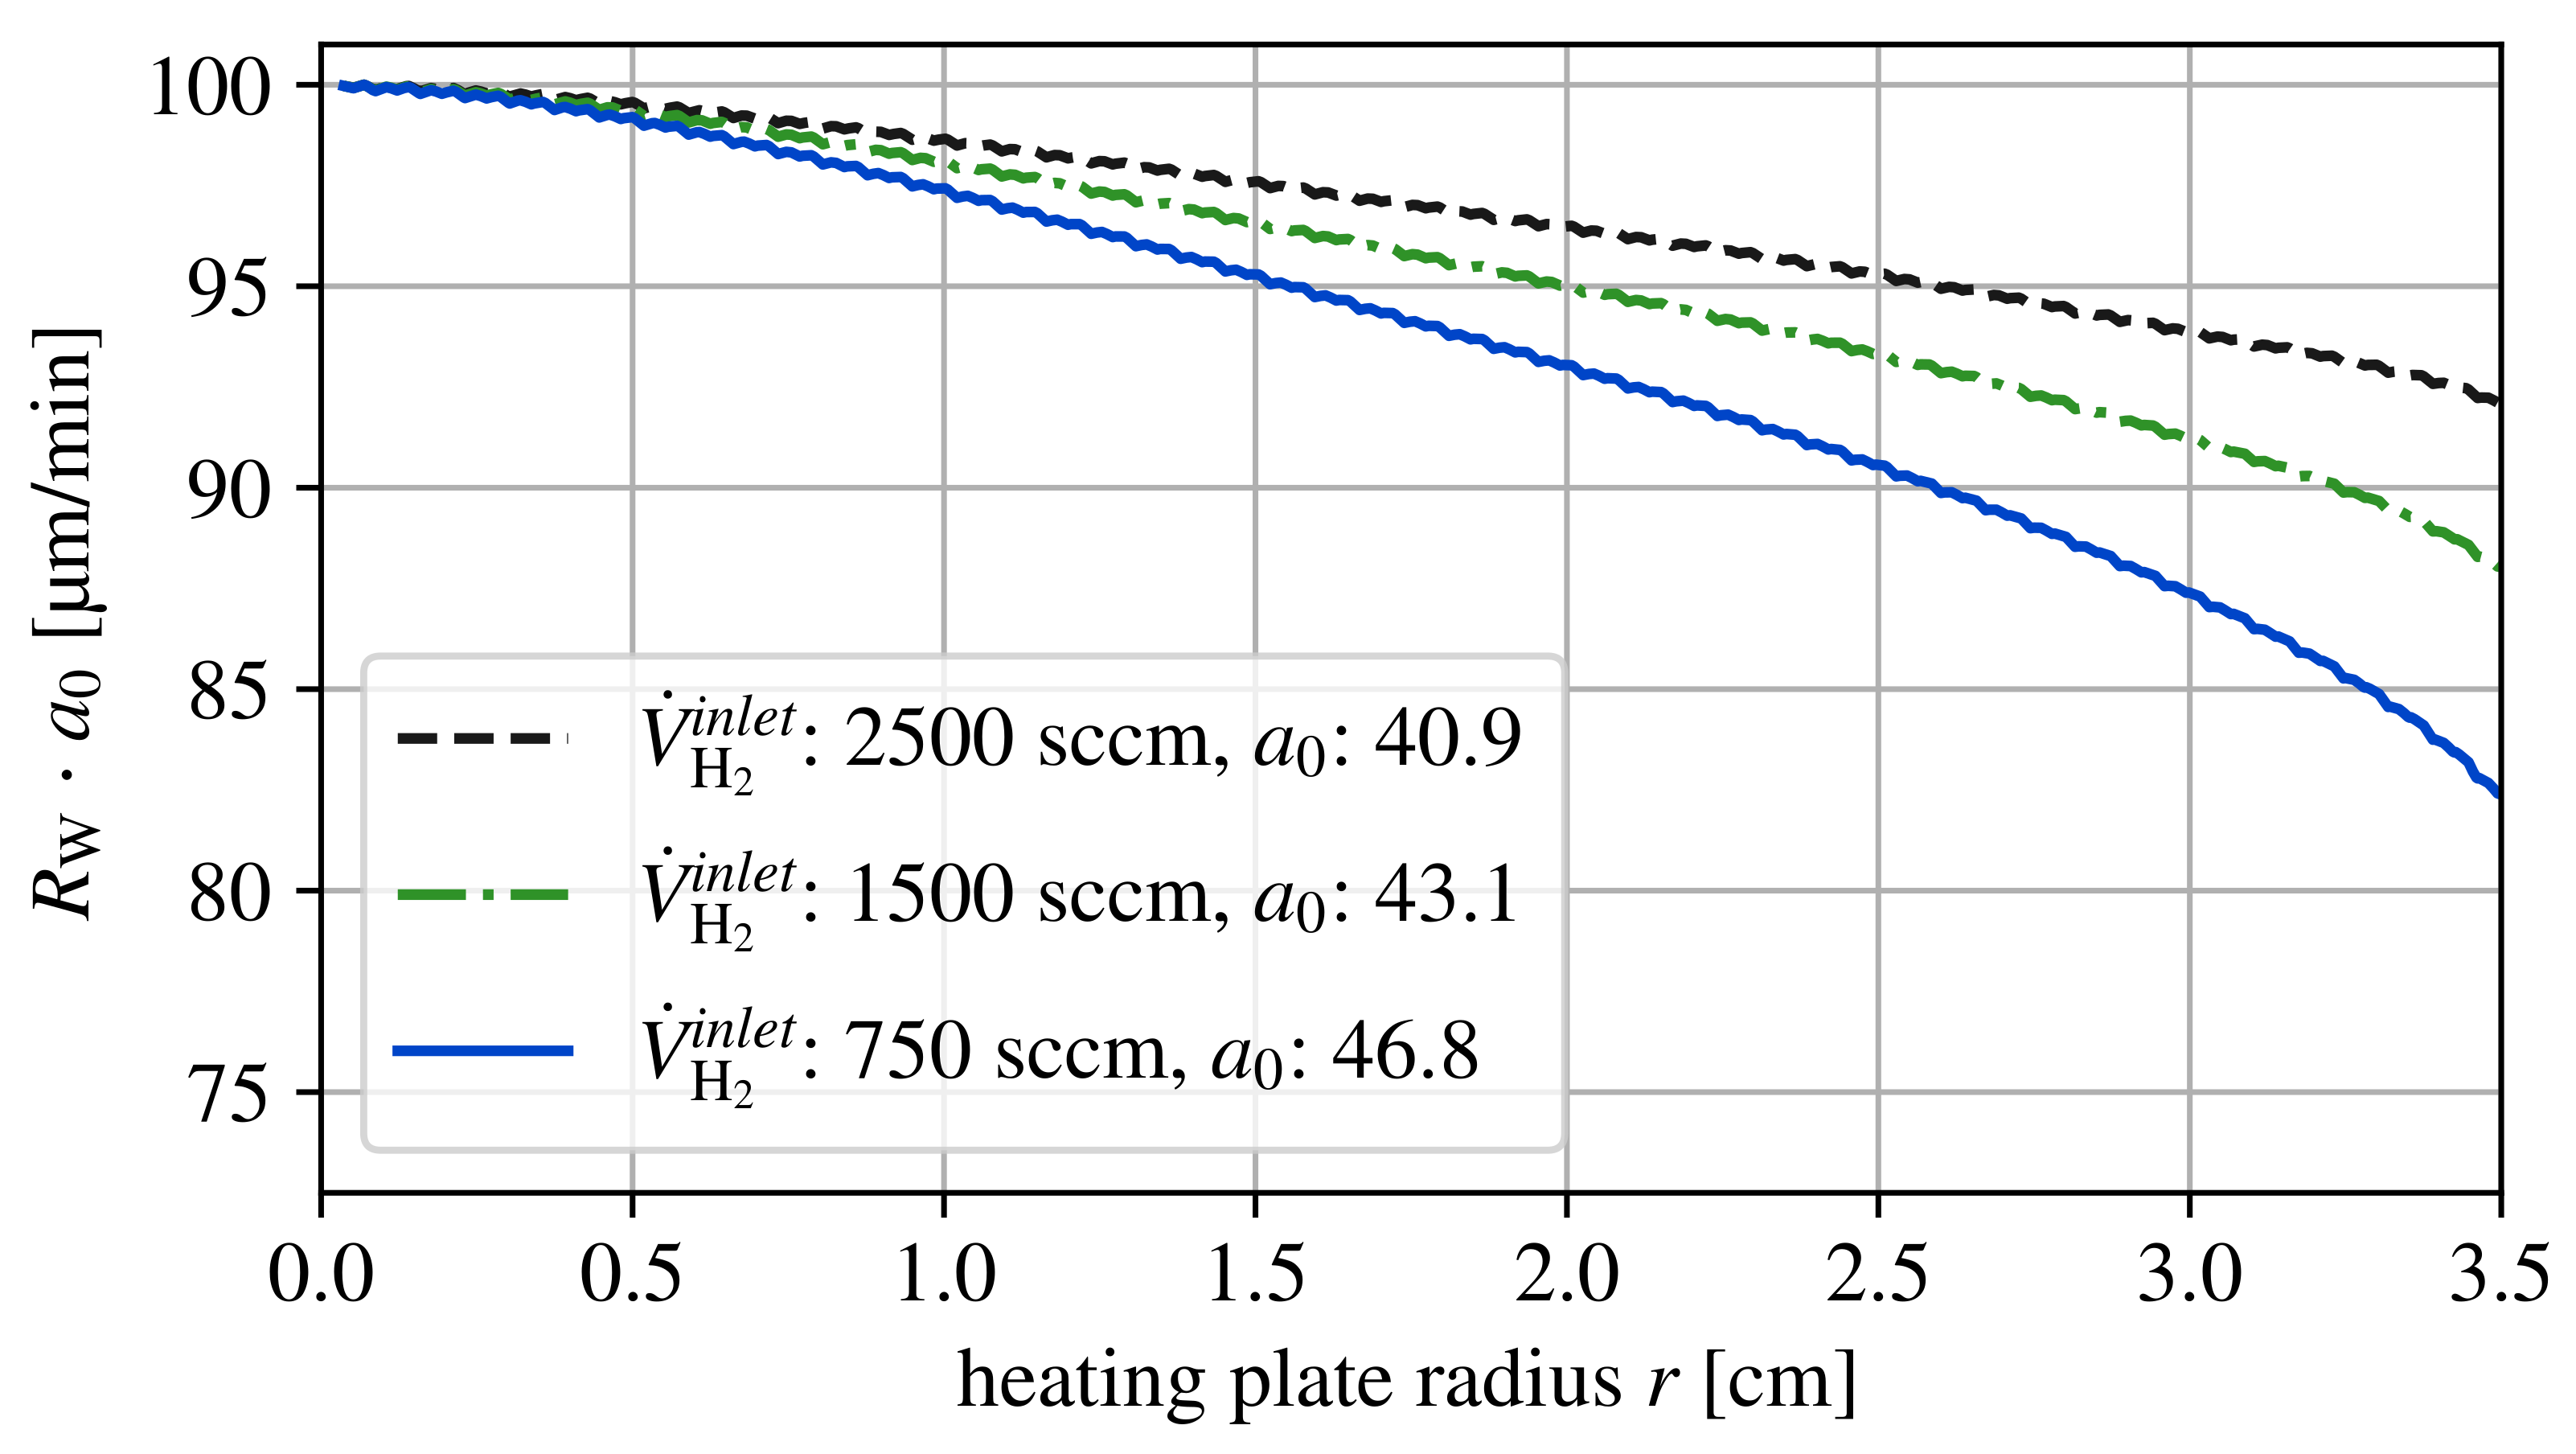
3.2.2. Variation of
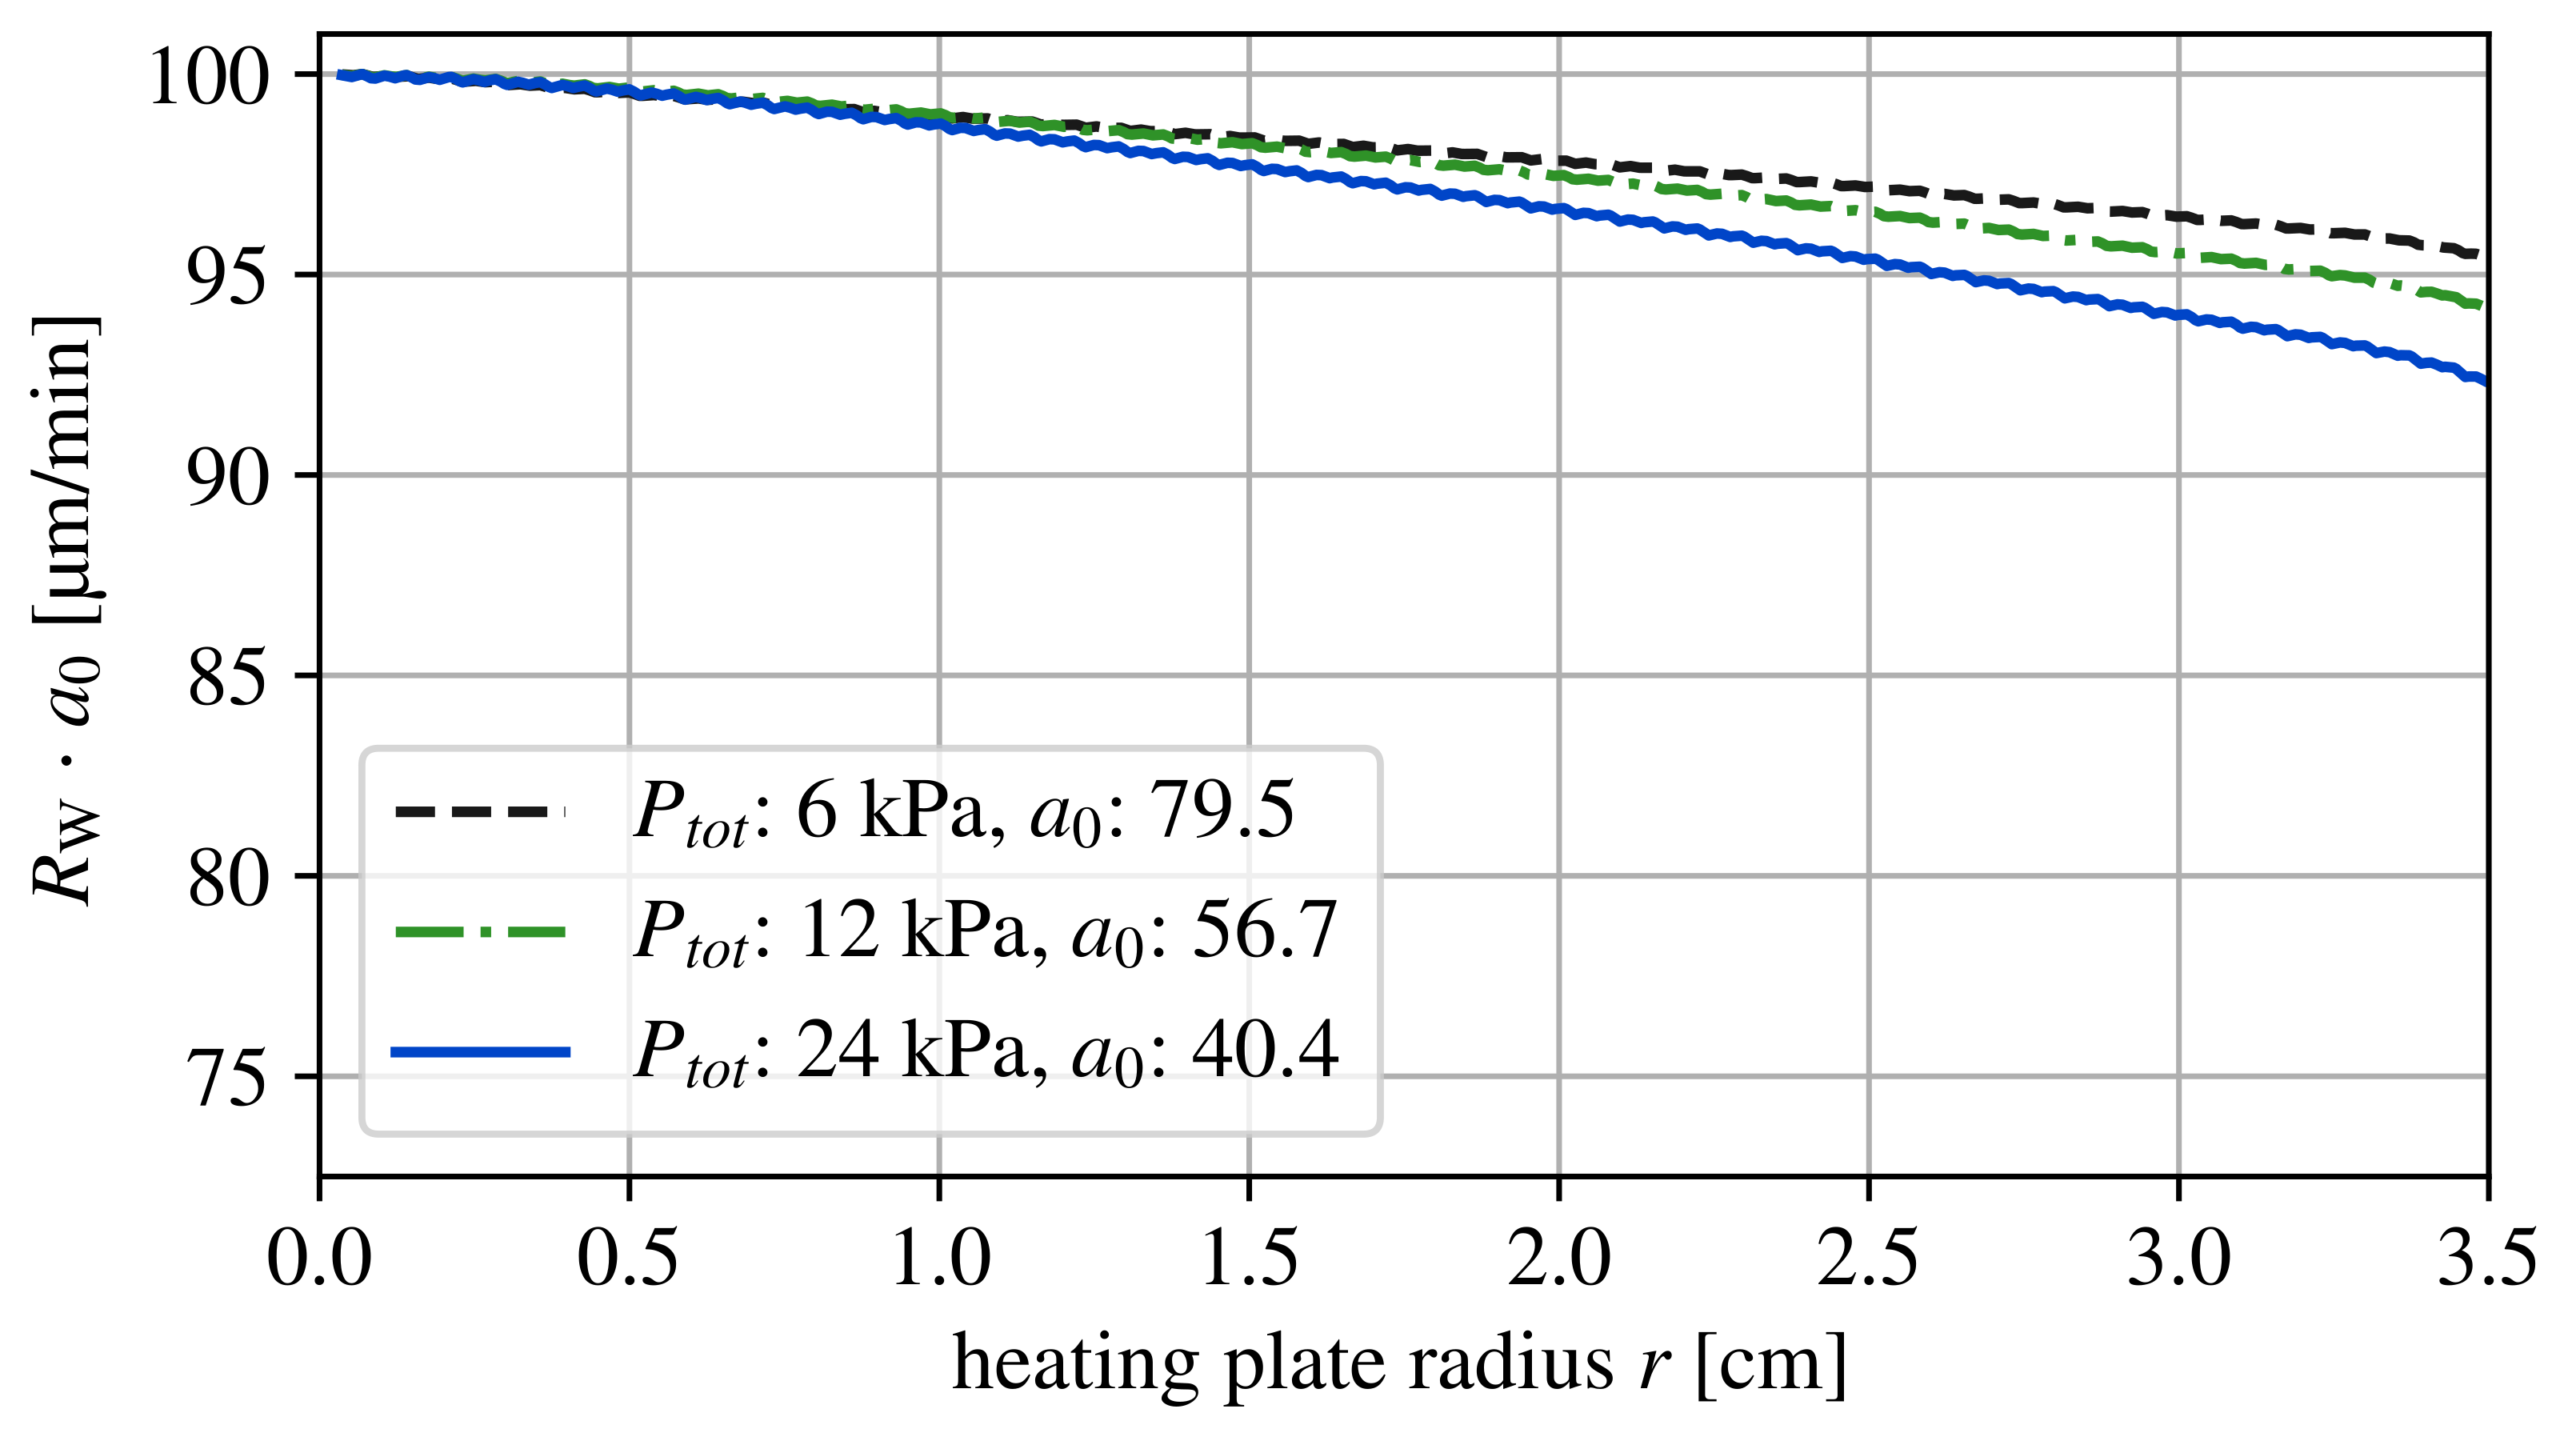
3.2.3. Variation of and
3.3. Applying the Improved Parameters
4. Summary and Conclusions
Author Contributions
Funding
Conflicts of Interest
Nomenclature
| Activation energy [J mol ] | |
| Constants for deposition rate equations [m s Pa] | |
| Total pressure [Pa] | |
| Partial pressure of species i [Pa] | |
| R | Gas constant [8.314 J mol K ] |
| Deposition rate of W [m s] | |
| at the pore entrance [m s] | |
| deep inside the pore [m s] | |
| , dependent on [m s] | |
| , independent on [m s] | |
| r | heating plate radius [cm] |
| T | Temperature [K] |
| Deposition duration [s] | |
| Volume flow rate of species i [sccm] | |
| Relative density [-] |
Abbreviations
| CVD | Chemical vapor deposition |
| FEM | Finite element method |
| W | Tungsten |
| W /W | Tungsten fiber-reinforced tungsten |
References
- Romanelli, F. Fusion Electricity a Roadmap to the Realisation of Fusion Energy; European Fusion Development Agreement, EFDA: Garching, Germany, 2012; ISBN 978-3-00-040720-8. [Google Scholar]
- Federici, G.; Giruzzi, G.; Lowry, C.; Kemp, R.; Ward, D.; Wenninger, R.; Zohm, H. EU DEMO design and R&D studies. In Proceedings of the 2013 IEEE 25th Symposium on Fusion Engineering (SOFE), San Francisco, CA, USA, 10–14 June 2013; pp. 1–8. [Google Scholar]
- Zohm, H. Assessment of DEMO challenges in technology and physics. Fusion Eng. Des. 2013, 88, 428–433. [Google Scholar] [CrossRef] [Green Version]
- Wenninger, R.; Bernert, M.; Eich, T.; Fable, E.; Federici, G.; Kallenbach, A.; Loarte, A.; Lowry, C.; McDonald, D.; Neu, R.; et al. DEMO divertor limitations during and in between ELMs. Nucl. Fusion 2014, 54, 114003. [Google Scholar] [CrossRef] [Green Version]
- Baluc, N. Materials for fusion power reactors. Plasma Phys. Control. Fusion 2006, 48, B165–B177. [Google Scholar] [CrossRef]
- Linsmeier, C.; Rieth, M.; Aktaa, J.; Chikada, T.; Hoffmann, A.; Hoffmann, J.; Houben, A.; Kurishita, H.; Jin, X.; Li, M.; et al. Development of advanced high heat flux and plasma-facing materials. Nucl. Fusion 2017, 57, 092007. [Google Scholar] [CrossRef]
- Yang, X.; Hassanein, A. Atomic scale calculations of tungsten surface binding energy and beryllium-induced tungsten sputtering. Appl. Surf. Sci. 2014, 293, 187–190. [Google Scholar] [CrossRef]
- Jackson, D.P. Binding energies in cubic metal surfaces. Radiat. Eff. 1973, 18, 185–189. [Google Scholar] [CrossRef]
- Lassner, E.; Schubert, W.-D. Tungsten—Properties, Chemistry, Technology of the Element, Alloys, and Chemical Compound; Springer: Berlin/Heidelberg, Germany, 1999. [Google Scholar]
- Reiser, J.; Rieth, M.; Dafferner, B.; Hoffmann, A. Charpy impact properties of pure tungsten plate material in as-received and recrystallized condition. J. Nucl. Mater. 2013, 442, 204–207. [Google Scholar] [CrossRef]
- Bolt, H.; Barabash, V.; Federici, G.; Linke, J.; Loarte, A.; Roth, J.; Sato, K. Plasma facing and high heat flux materials—Needs for ITER and beyond. J. Nucl. Mater. 2002, 307–311, 43–52. [Google Scholar] [CrossRef]
- Coenen, J.W.; Antusch, S.; Aumann, M.; Biel, W.; Du, J.; Engels, J.; Heuer, S.; Houben, A.; Höschen, T.; Jasper, B.; et al. Materials for DEMO and reactor applications—Boundary conditions and new concepts. Phys. Scr. 2015, T167, 014002. [Google Scholar] [CrossRef]
- Pintsuk, G.; Bobin-Vastra, I.; Constans, S.; Gavila, P.; Rödig, M.; Riccardi, B. Qualification and post-mortem characterization of tungsten mock-ups exposed to cyclic high heat flux loading. Fusion Eng. Des. 2013, 88, 1858–1861. [Google Scholar] [CrossRef]
- Coenen, J.W. Fusion Materials Development at Forschungszentrum Jülich. Adv. Eng. Mater. 2020, 22, 1901376. [Google Scholar] [CrossRef] [Green Version]
- Coenen, J.W.; Mao, Y.; Sistla, S.; Riesch, J.; Höschen, T.; Broeckmann, C.; Neu, R.; Linsmeier, C. Improved pseudo-ductile behavior of powder metallurgical tungsten short fiber-reinforced tungsten (Wf/W). Nucl. Mater. Energy 2018, 15, 214–219. [Google Scholar] [CrossRef]
- Neu, R.; Riesch, J.; Coenen, J.W.; Brinkmann, J.; Calvo, A.; Elgeti, S.; Garcia-Rosales, C.; Greuner, H.; Höschen, T.; Holzner, G.; et al. Advanced tungsten materials for plasma-facing components of DEMO and fusion power plants. Fusion Eng. Des. 2016, 109–111 Pt A, 1046–1052. [Google Scholar] [CrossRef]
- Neu, R.; Riesch, J.; Müller, A.; Balden, M.; Coenen, J.W.; Gietl, H.; Höschen, T.; Li, M.; Wurster, S.; You, J.-H. Tungsten fibre-reinforced composites for advanced plasma facing components. Nucl. Mater. Energy 2016, 12, 1308–1313. [Google Scholar] [CrossRef] [Green Version]
- Riesch, J.; Aumann, M.; Coenen, J.W.; Gietl, H.; Holzner, G.; Höschen, T.; Huber, P.; Li, M.; Linsmeier, C.; Neu, R. Chemically deposited tungsten fibre-reinforced tungsten—The way to a mock-up for divertor applications. Nucl. Mater. Energy 2016, 9, 75–83. [Google Scholar] [CrossRef] [Green Version]
- Riesch, J.; Han, Y.; Almanstötter, J.; Coenen, J.W.; Höschen, T.; Jasper, B.; Zhao, P.; Linsmeier, C.; Neu, R. Development of tungsten fibre-reinforced tungsten composites towards their use in DEMO—Potassium doped tungsten wire. Phys. Scr. 2016, T167, 014006. [Google Scholar] [CrossRef]
- Gietl, H.; Olbrich, S.; Riesch, J.; Holzner, G.; Höschen, T.; Coenen, J.W.; Neu, R. Estimation of the fracture toughness of tungsten fibre-reinforced tungsten composites. Eng. Fract. Mech. 2020, 232, 107011. [Google Scholar] [CrossRef]
- Riesch, J.; Buffiere, J.-Y.; Höschen, T.; di Michiel, M.; Scheel, M.; Linsmeier, C.; You, J.-H. In situ synchrotron tomography estimation of toughening effect by semi-ductile fibre reinforcement in a tungsten-fibre-reinforced tungsten composite system. Acta Mater. 2013, 61, 7060–7071. [Google Scholar] [CrossRef] [Green Version]
- Terentyev, D.; Riesch, J.; Lebediev, S.; Khvan, T.; Zinovev, A.; Rasinski, W.; Dubinko, A.; Coenen, J. Plastic deformation of recrystallized tungsten-potassium wires: Constitutive deformation law in the temperature range 22-600C. Int. J. Refract. Met. Hard Mater. 2018, 73, 38–45. [Google Scholar] [CrossRef] [Green Version]
- Chawla, K.K. Ceramic Matrix Composites, 2nd ed.; Springer: New York, NY, USA, 2003. [Google Scholar]
- Riesch, J. Entwicklung und Charakterisierung Eines Wolframfaserverstärkten Wolfram-Verbundwerkstoffs. Ph.D. Thesis, Technische Universität München, Munich, Germany, 2012. [Google Scholar]
- Mao, Y.; Coenen, J.W.; Riesch, J.; Sistla, S.; Almanstötter, J.; Jasper, B.; Terra, A.; Höschen, T.; Gietl, H.; Bram, M.; et al. Development and characterization of powder metallurgically produced discontinuous tungsten fiber reinforced tungsten composites. Phys. Scr. 2017, T170, 014005. [Google Scholar] [CrossRef]
- Mao, Y.; Coenen, J.W.; Riesch, J.; Sistla, S.; Almanstötter, J.; Jasper, B.; Terra, A.; Höschen, T.; Gietl, H.; Linsmeier, C.; et al. Influence of the interface strength on the mechanical properties of discontinuous tungsten fiber-reinforced tungsten composites produced by field assisted sintering technology. Compos. Part A Appl. Sci. Manuf. 2018, 107, 342–353. [Google Scholar] [CrossRef]
- Coenen, J.W.; Mao, Y.; Sistla, S.; Müller, A.; Pintsuk, G.; Wirtz, M.; Riesch, J.; Höschen, T.; Terra, A.; You, J.-H.; et al. Materials development for new high heat-flux component mock-ups for DEMO. Fusion Eng. Des. 2019, 146, 1431–1436. [Google Scholar] [CrossRef]
- Gietl, H.; Müller, A.V.; Coenen, J.W.; Decius, M.; Ewert, D.; Höschen, T.; Huber, P.; Milwich, M.; Riesch, J.; Neu, R. Textile preforms for tungsten fibre-reinforced composites. J. Compos. Mater. 2018, 52, 3875–3884. [Google Scholar] [CrossRef]
- Gietl, H.; Riesch, J.; Coenen, J.W.; Höschen, T.; Neu, R. Production of tungsten-fibre reinforced tungsten composites by a novel continuous chemical vapour deposition process. Fusion Eng. Des. 2019, 146, 1426–1430. [Google Scholar] [CrossRef]
- Zinn, A.F. The Chemistry of Metal CVD; Chapter: Chemical Vapor Deposition of Tungsten; VCH Verlagsgesellschaft: Weinheim, Germany, 2007; pp. 105–174. [Google Scholar]
- Raumann, L.; Coenen, J.W.; Riesch, J.; Mao, Y.; Schwalenberg, D.; Wegener, T.; Gietl, H.; Höschen, T.; Linsmeier, C.; Guillon, O. Modeling and validation of the Wf/W-fabrication by chemical vapor deposition and infiltration. Nucl. Mater. Energy 2021, submit. [Google Scholar]
- Gietl, H. Weiterentwicklung von Wolframfaserverstfärktem Wolframverbundwerkstoff für den Einsatz in der Fusion. Ph.D. Thesis, Technische Universität München, Munich, Germany, 2018. [Google Scholar]
- Gietl, H.; Riesch, J.; Coenen, J.W.; Höschen, T.; Linsmeier, C.; Neu, R. Tensile deformation behavior of tungsten fibre-reinforced tungsten composite specimens in as-fabricated state. Fusion Eng. Des. 2017, 124, 396–400. [Google Scholar] [CrossRef]
- Mao, Y.; Coenen, J.W.; Riesch, J.; Sistla, S.; Almanstötter, J.; Terra, A.; Chen, C.; Wu, Y.; Raumann, L.; Höschen, T.; et al. Fiber Volume Fraction Influence on Randomly Distributed Short Fiber Tungsten Fiber-Reinforced Tungsten Composites. Adv. Eng. Mater. 2020, 22, 1901242. [Google Scholar] [CrossRef] [Green Version]
- COMSOL INC. Available online: https://www.comsol.com/ (accessed on 6 July 2021).
- Raumann, L.; Coenen, J.W.; Riesch, J.; Mao, Y.; Gietl, H.; Höschen, T.; Linsmeier, C.; Guillon, O. Modeling and validation of chemical vapor deposition of tungsten for tungsten fiber reinforced tungsten composites. Surf. Coat. Technol. 2020, 381, 124745. [Google Scholar] [CrossRef]
- Raumann, L. Modeling and Validation of Chemical Vapor Deposition for Tungsten Fiber Reinforced Tungsten, Volume 515 of Schriften des Forschungszentrums Juelich—Energy and Environment; Forschungszentrum Jülich GmbH: Aachen, Germany, 2020. [Google Scholar]
- McInerney, E.J.; Srinivasan, E.; Smith, D.C.; Ramanath, G. Kinetic rate expression for tungsten chemical vapor deposition in different WF6 flow regimes from step coverage measurements. Z. Met. 2000, 91, 573–580. [Google Scholar]
- Raumann, GitHub Repository for the Model and Script Files of the Present Work. 2020. Available online: https://github.com/Leo-Raumann/Dissertation-Files.git (accessed on 6 July 2021).
- Kuijlaars, K.; Kleijn, C.; van Den Akker, H. A detailed model for low-pressure CVD of tungsten. Thin Solid Film. 1995, 270, 456–461. [Google Scholar] [CrossRef]
- Kuijlaars, K.; Kleijn, C.; van Den Akker, H. Multi-component diffusion phenomena in multiple-wafer chemical vapour deposition reactors. Chem. Eng. J. Biochem. Eng. J. 1995, 57, 127–136. [Google Scholar] [CrossRef]
- Creighton, J. The surface chemistry and kinetics of tungsten chemical vapor deposition and selectivity loss. Thin Solid Film. 1994, 241, 310–317. [Google Scholar] [CrossRef]
- Knudsen, M. The Kinetic Theory of Gases; John Wiley & Sons, Inc.: New York, NY, USA, 1950. [Google Scholar]
- Hasper, A. Modeling and Optimization of the Step Coverage of Tungsten LPCVD in Trenches and Contact Holes. J. Electrochem. Soc. 1991, 138, 1728. [Google Scholar] [CrossRef]
- Coenen, J.W.; Treitz, M.; Gietl, H.; Huber, P.; Hoeschen, T.; Raumann, L.; Schwalenberg, D.; Mao, Y.; Riesch, J.; Terra, A.; et al. The use of tungsten yarns in the production for w f /w. Phys. Scr. 2020, T171, 014061. [Google Scholar] [CrossRef]
- Subhash, G.; Lee, Y.; Ravichandran, G. Plastic deformation of CVD textured tungsten—I. Constitutive response. Acta Metall. Mater. 1994, 42, 319–330. [Google Scholar] [CrossRef]
- Wei, Q.; Jiao, T.; Ramesh, K.T.; Ma, E.; Kecskes, L.J.; Magness, L.; Dowding, R.; Kazykhanov, V.U.; Valiev, R.Z. Mechanical behavior and dynamic failure of high-strength ultrafine grained tungsten under uniaxial compression. Acta Mater. 2005, 54, 7. [Google Scholar] [CrossRef]
- Dunstan, D.J.; Bushby, A.J. Grain size dependence of the strength of metals: The Hall–Petch effect does not scale as the inverse square root of grain size. Int. J. Plast. 2014, 53, 56–65. [Google Scholar] [CrossRef] [Green Version]
- Hall, E.O. The Deformation and Ageing of Mild Steel: III Discussion of Results. Proc. Phys. Soc. Sect. B 1951, 64, 747–753. [Google Scholar] [CrossRef]
- Hansen, N. Hall–Petch relation and boundary strengthening. Scr. Mater. 2004, 51, 801–806. [Google Scholar] [CrossRef]


| Criteria | CVD Process Parameters (*) | |||
|---|---|---|---|---|
| low tot. WF demand | − | ↓ | − | − |
| fast process | ↑ | (↓) | (↑) | ↑ |
| high and coating uniformity in the micro- and macro-scale | ↓ | (↓) | ↑ | ↓ |
Publisher’s Note: MDPI stays neutral with regard to jurisdictional claims in published maps and institutional affiliations. |
© 2021 by the authors. Licensee MDPI, Basel, Switzerland. This article is an open access article distributed under the terms and conditions of the Creative Commons Attribution (CC BY) license (https://creativecommons.org/licenses/by/4.0/).
Share and Cite
Raumann, L.; Coenen, J.W.; Riesch, J.; Mao, Y.; Schwalenberg, D.; Gietl, H.; Linsmeier, C.; Guillon, O. Improving the W Coating Uniformity by a COMSOL Model-Based CVD Parameter Study for Denser Wf/W Composites. Metals 2021, 11, 1089. https://0-doi-org.brum.beds.ac.uk/10.3390/met11071089
Raumann L, Coenen JW, Riesch J, Mao Y, Schwalenberg D, Gietl H, Linsmeier C, Guillon O. Improving the W Coating Uniformity by a COMSOL Model-Based CVD Parameter Study for Denser Wf/W Composites. Metals. 2021; 11(7):1089. https://0-doi-org.brum.beds.ac.uk/10.3390/met11071089
Chicago/Turabian StyleRaumann, Leonard, Jan Willem Coenen, Johann Riesch, Yiran Mao, Daniel Schwalenberg, Hanns Gietl, Christian Linsmeier, and Olivier Guillon. 2021. "Improving the W Coating Uniformity by a COMSOL Model-Based CVD Parameter Study for Denser Wf/W Composites" Metals 11, no. 7: 1089. https://0-doi-org.brum.beds.ac.uk/10.3390/met11071089