Article

Study on the Relationship between High Temperature Mechanical Properties and Precipitates Evolution of 7085 Al Alloy after Long Time Thermal Exposures

1
Beijing Engineering Research Center of Advanced Aluminum Alloys and Application, Beijing Institute of Aeronautical Materials, AECC, Beijing 100095, China
2
Xi’an Key Laboratory of High Performance Oil and Gas Field Materials, School of Materials Science and Engineering, Xi’an Shiyou University, Xi’an 710065, China
3
State Key Laboratory of Solidification Processing, Northwestern Polytechnical University, Xi’an 710072, China
*
Authors to whom correspondence should be addressed.
Submission received: 31 August 2021 / Revised: 11 September 2021 / Accepted: 14 September 2021 / Published: 18 September 2021

Abstract

:
The requirement for 7085 Al alloy as large airframe parts has been increasing due to its low quenching sensitivity and high strength. However, the relationship between high temperature mechanical properties and the evolution of precipitates in hot environments is still unclear. In this work, thermal exposure followed by tensile tests were conducted on the 7085 Al alloy at various temperatures (100 °C, 125 °C, 150 °C and 175 °C). Variations of hardness, electrical conductivity and tensile properties were investigated. The evolution of the nano scale precipitates was also quantitatively characterized by transmission electron microscopy (TEM). The results show that the hardness and electrical conductivity of the alloy are more sensitive to the temperature than to the time. The strength decreases continuously with the increase of temperature due to the transformation from η′ to η phase during the process. Furthermore, the main η phase in the alloy transformed from V3 and V4 to V1 and V2 variants when the temperature was 125 °C. Additionally, with increasing the temperature, the average precipitate radius increased, meanwhile the volume fraction and number density of the precipitates decreased. The strengthening effect of nano scale precipitates on tensile properties of the alloy was calculated and analyzed.

1. Introduction

High strength 7xxx series Al alloys are often called aeronautical materials due to their wide applications in aerospace field. Over the last decade, in order to meet the rapid development of large aircrafts, it has been desirable to fabricate large structural components using heavy forgings or thick plates [1,2,3,4]. 7085 Al alloy, as a new generation of thick plate alloy, has been developed by Alcoa in 2003. The higher Zn/Mg ratio along with lower Cu content than other 7xxx series Al alloys means that the 7085 Al alloy possesses excellent properties, such as high corrosion resistance, outstanding workability and especially low quench sensitivity [5,6,7,8]. Hence, the alloy has been a preferred choice for these semi-products with large sections. For example, the 7085 Al alloy forging has been successfully used as the inner rear spar in advanced aircrafts A380 [1,9]. T7452 heat treatment has been proved to be an effective method to simultaneously improve the fracture toughness and corrosion resistance of 7085 Al alloy [10,11]. Thus, there have been many investigations on the microstructures and properties of 7085-T7452 Al alloy [5,10,12,13].
When used as structural airframe parts in aerospace industries, the 7085-T7452 Al alloy thick plate is inevitably exposed to slightly elevated temperatures (83–177 °C), which often come from aerodynamic heating during supersonic and flight speed, high temperatures generated by engines or auxiliary power units, and so forth. [14,15,16,17]. The tailored microstructure of 7085 Al alloy can be damaged in overheating conditions, which would cause deterioration of the mechanical performance [15]. Therefore, in order to retain the designed properties of the alloy, further investigations are required to study the evolutions of precipitates and mechanical properties during the high temperature environment.
Previous investigations of 7085 Al alloy have mainly focused on the quench sensitivity and hot deformation behavior during solution and aging treatment [2,18,19]. For instance, Liu et al. investigated the quench sensitivity of a series of Al-Zn-Mg-Cu alloys by time-temperature-properties relationships. Their results showed that the 7085 alloy is the least quench sensitive compared to 7055, 7075 and 7175 alloys due to the difference in chemical compositions [2]. Chen et al. found that the flow stresses of the 7085 Al alloy were sensitive to the heat treatment conditions and deformation parameters [18]. However, only a few studies have been performed on the evolution of mechanical properties after thermal exposure treatment. For example, Jabra et al., whose purpose was mainly linked to the heat treatment process design, researched the influence of thermal exposure on the tensile properties of 7085 alloy, but no attention has been paid to the microstructural features [15].
In contrast to the above studies, our previous research mainly evaluated the microstructural evolution of the 7085 Al alloy and the corresponding room temperature (RT) mechanical properties’ (hardness and tensile properties) responses to thermal exposure at different temperatures and durations [20,21], but without considering the performance of the alloy at high temperatures. The treatment of thermal exposure is actually similar to continuous aging. When used as airframe parts, the 7085 alloy is usually exposed to a hot environment (slightly elevated temperature and for a long time), which easily leads to precipitates evolution and alloy failure. Therefore, further study is required to completely characterize microstructure evolution and, above all, to evaluate the ultimate fracture behaviors of the 7085 Al alloy by simulating its real application.
In this study, the hardness, electrical conductivity and tensile properties of 7085 Al alloy plate at T7452 state have been characterized. In order to simulate the practical application of the alloy, various heat treatment temperatures (100 °C, 125 °C, 150 °C and 175 °C) were set. The corresponding mechanical properties and microstructural evolution were investigated. Moreover, the strengthening mechanism and relationship between nano scale precipitates and the tensile properties of 7085 Al alloy thick plate after various heat treatments were also analyzed in detail.

2. Experimental Procedure

The investigations were carried out on a forged 7085 Al alloy plate, 220 mm in thickness. The chemical composition of the alloy was Al-7.56Zn-1.50Mg-1.45Cu-0.12Zr-0.06Fe-0.02Si (wt.%). The alloy was solution treated at 470 °C for 6 h, followed by 5% cold compression, finally it was artificially two-step aged at 120 °C for 6 h and 160 °C for 10 h, named the T7452 treatment. Samples were cut from the 7085-T7452 alloy at the position of 1/2 in thickness. The 7085-T7452 samples were thermally exposed at various temperatures (100 °C, 125 °C, 150 °C and 175 °C) for 100–1000 h and then the tensile tests were conducted at the corresponding temperatures, respectively. The detailed thermal exposure parameters and tensile test conditions are summarized in Table 1.
The tensile tested samples were dog bone shaped rod-shaped tensile samples with a gauge length of 25 mm and a diameter of 5 mm according to the tensile test standard ISO 6892-1. Tensile performance was tested on an Instron 3382 material testing machine at RT (25 °C), 100 °C, 125 °C, 150 °C and 175 °C with an accuracy of ± 5 °C, respectively. In order to keep the thermal uniformity, the samples were heated to the tensile temperature at a heating rate of 4 °C/min and were then held for 10 min before loading. The tensile speed was 0.03 mm/s. The samples for Vickers hardness, electrical conductivity and microstructural investigations were sampled at least 6 mm away from the tensile fracture surfaces. The hardness tests were performed at RT using a load of 0.5 kg for 15 s by an HMV-2 hardness tester (Shimadzu Corp., Kyoto, Japan). A minimum of 15 measurements were conducted for each specimen and the mean value was applied in this work. The electrical conductivity of the samples was measured in a PZ60A eddy-current device (Dongguan Zhanpeng Electronic Instruments Co., LTD, Dongguan, China).
To further investigate the microstructure variation (precipitates type, size, etc.) during the heat treatment process, an FEI Tecnai F30G2 transmission electron microscopy (TEM, FEI Electron Optics International B.V., Eindhoven, The Netherlands) device operated at 300 kV was used in the present study. Thin foils for TEM examination were prepared by mechanical grinding followed by twin-jet electro-polishing in a solution of 30 vol% nitric acid and 70 vol% methanol below −30 °C.

3. Results and Analysis

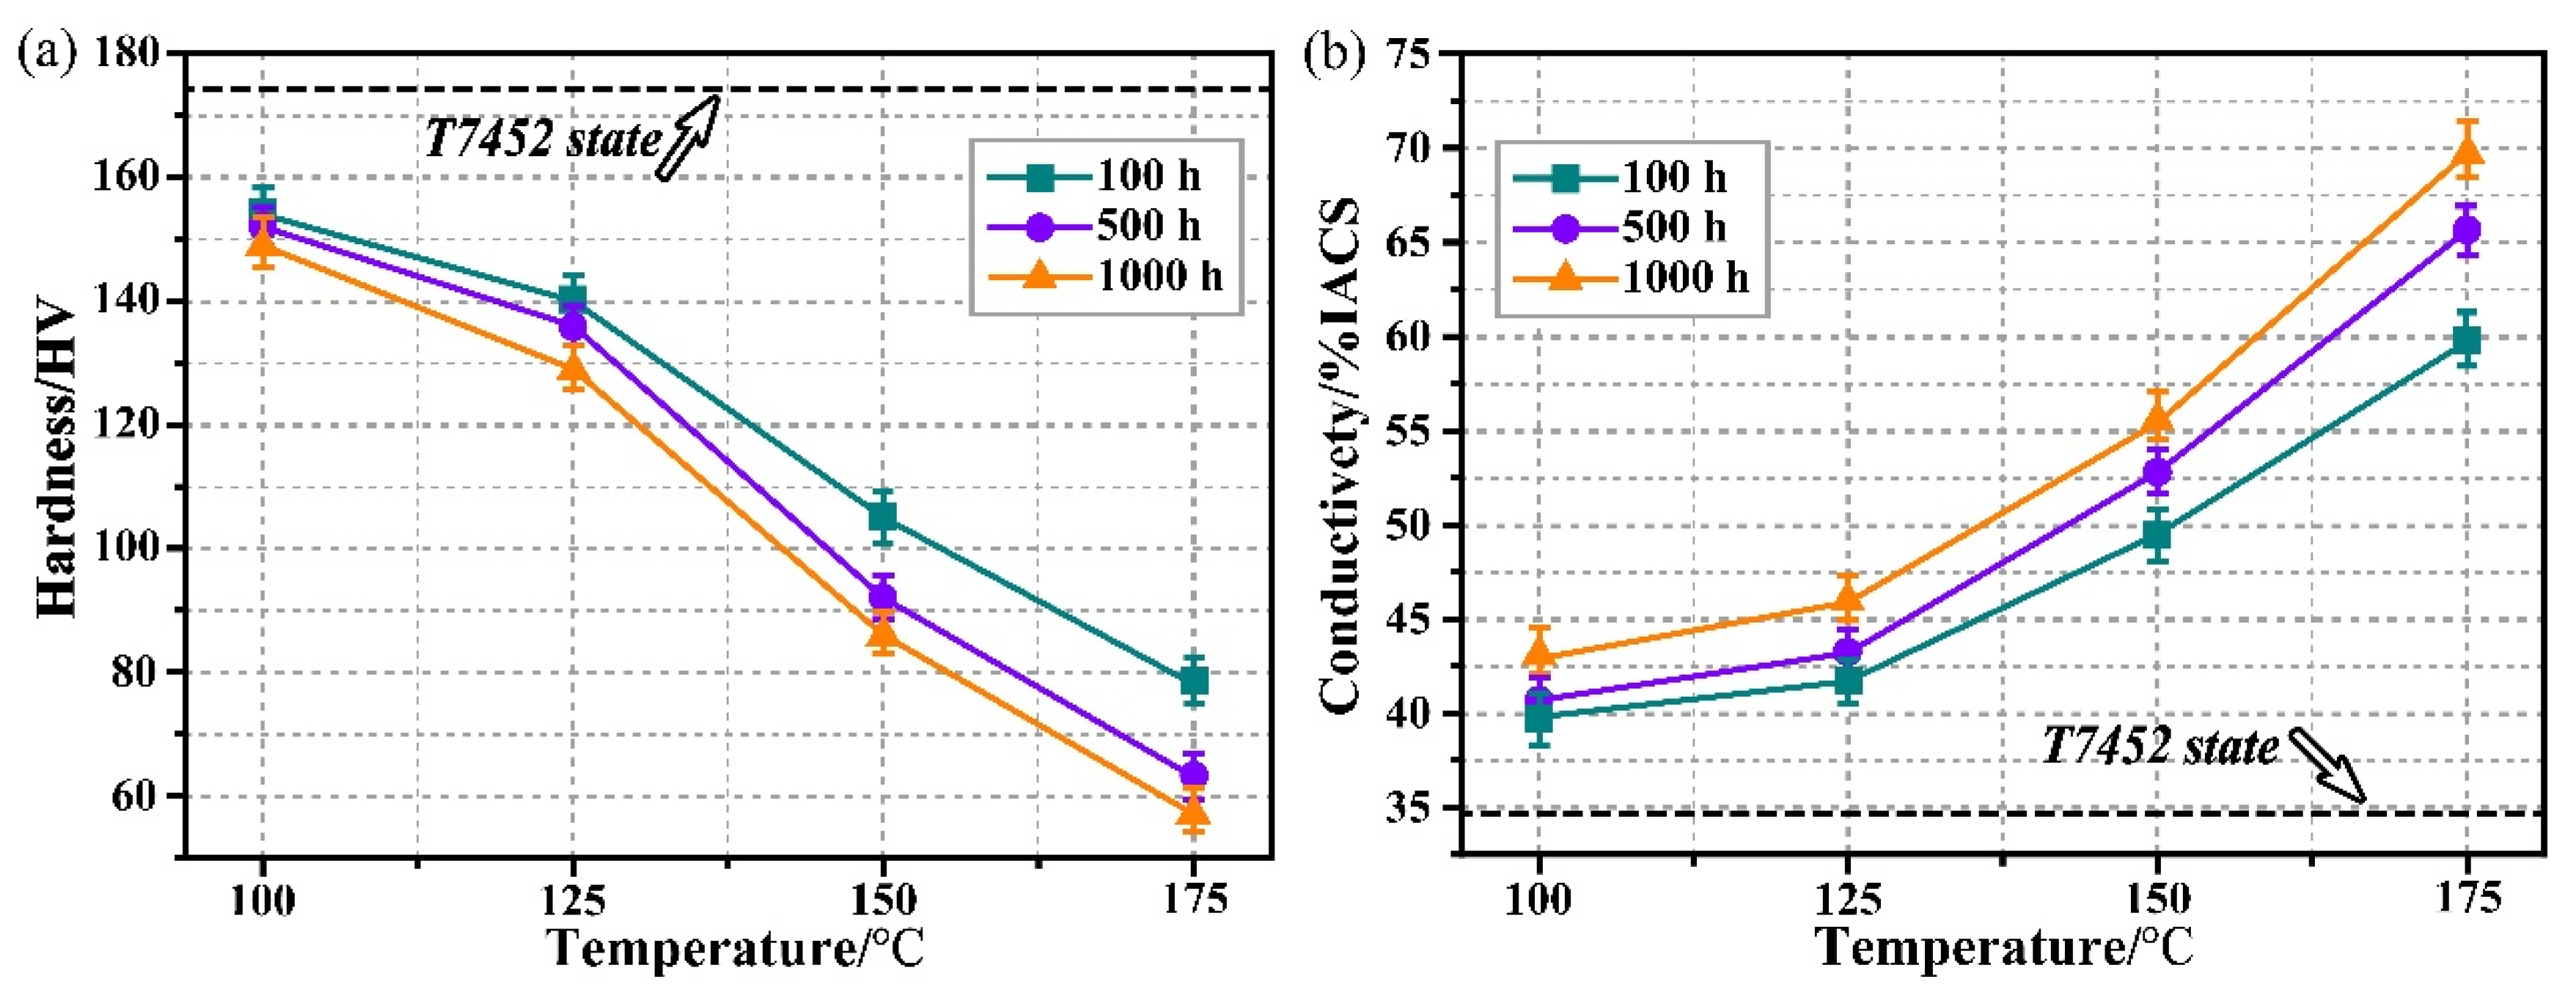
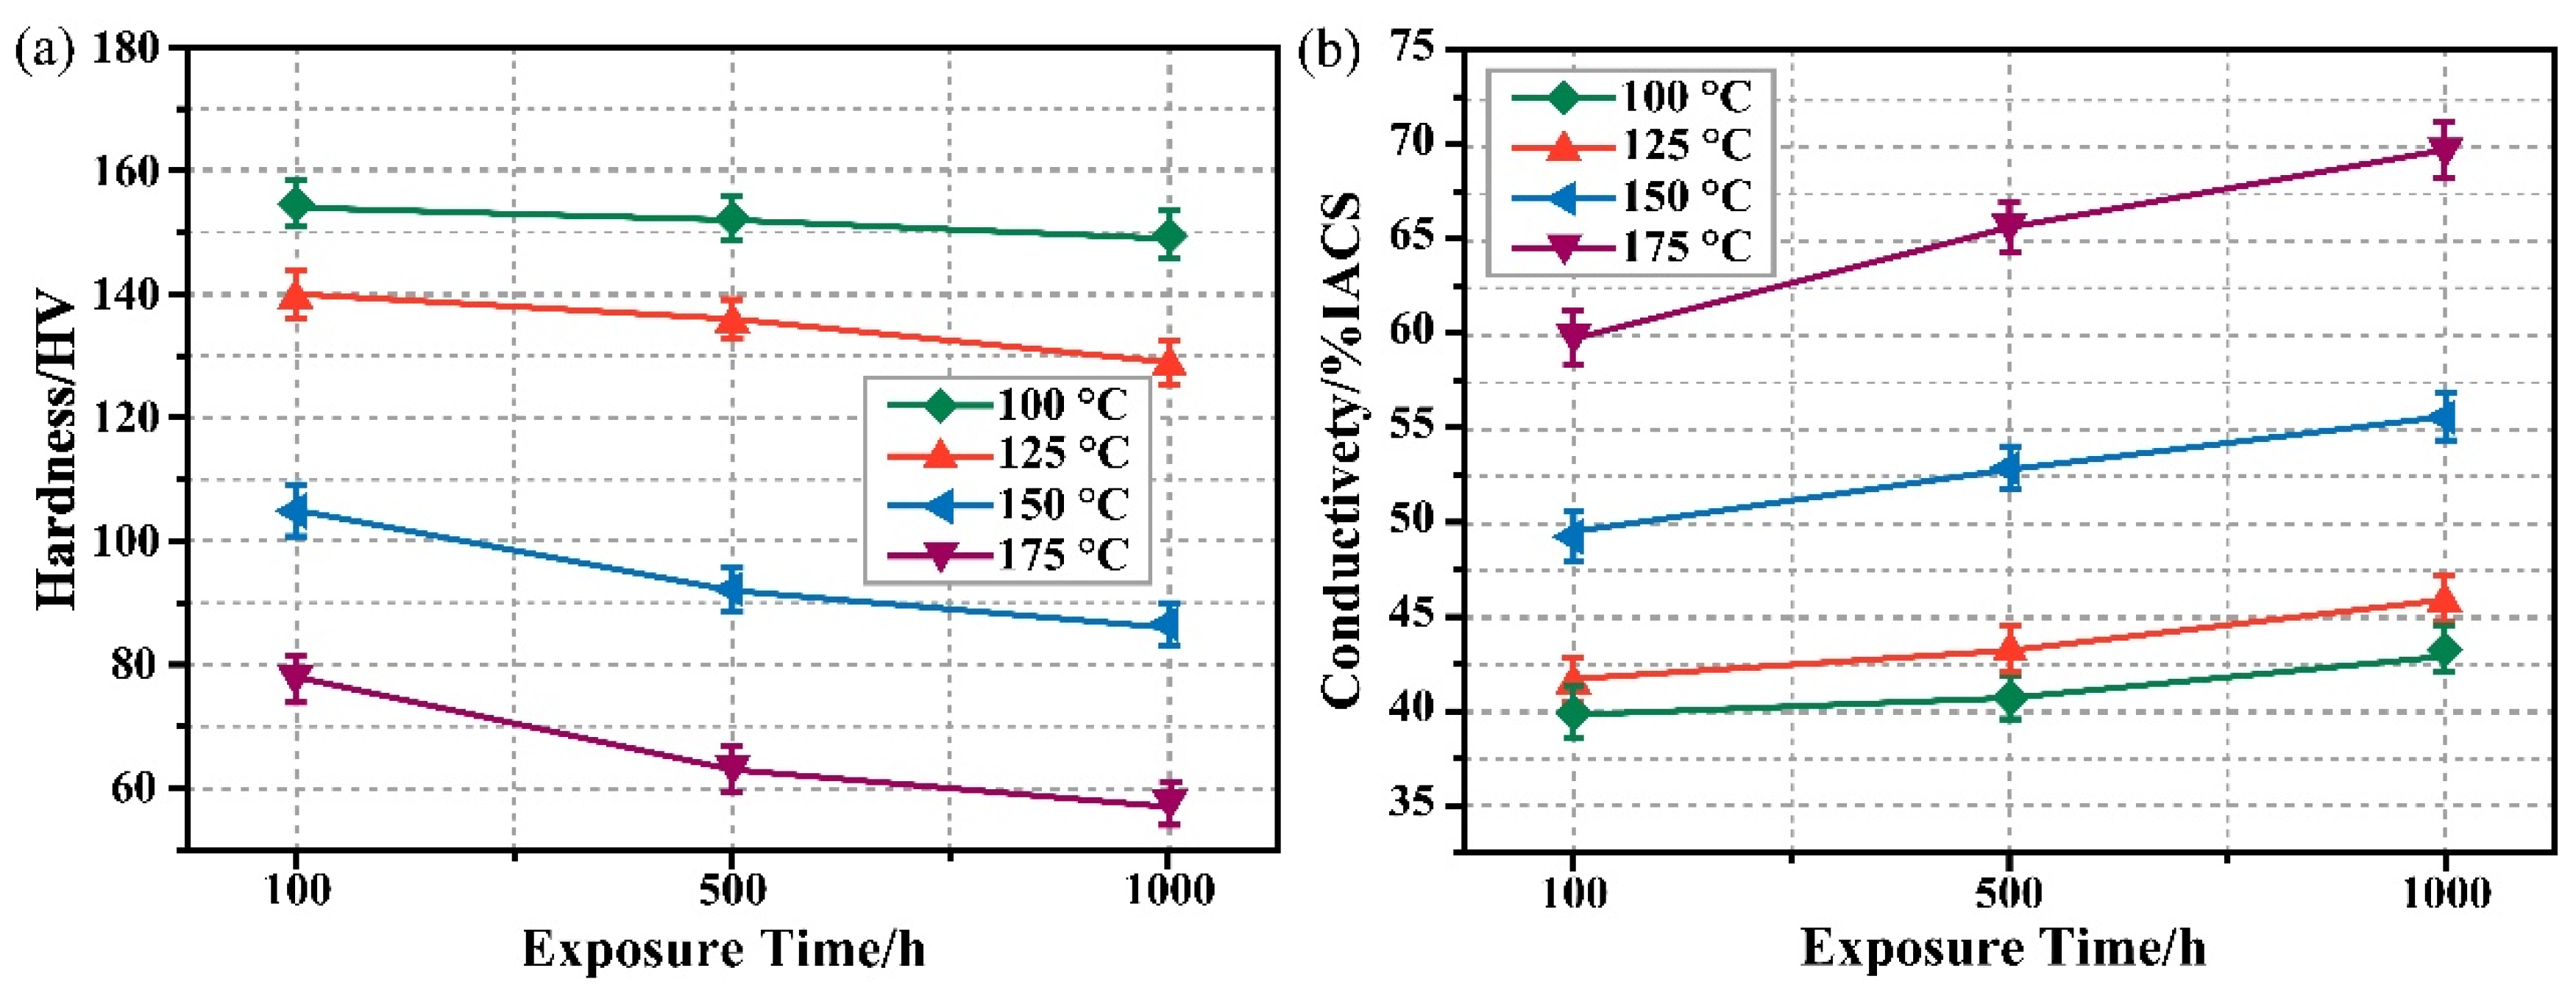
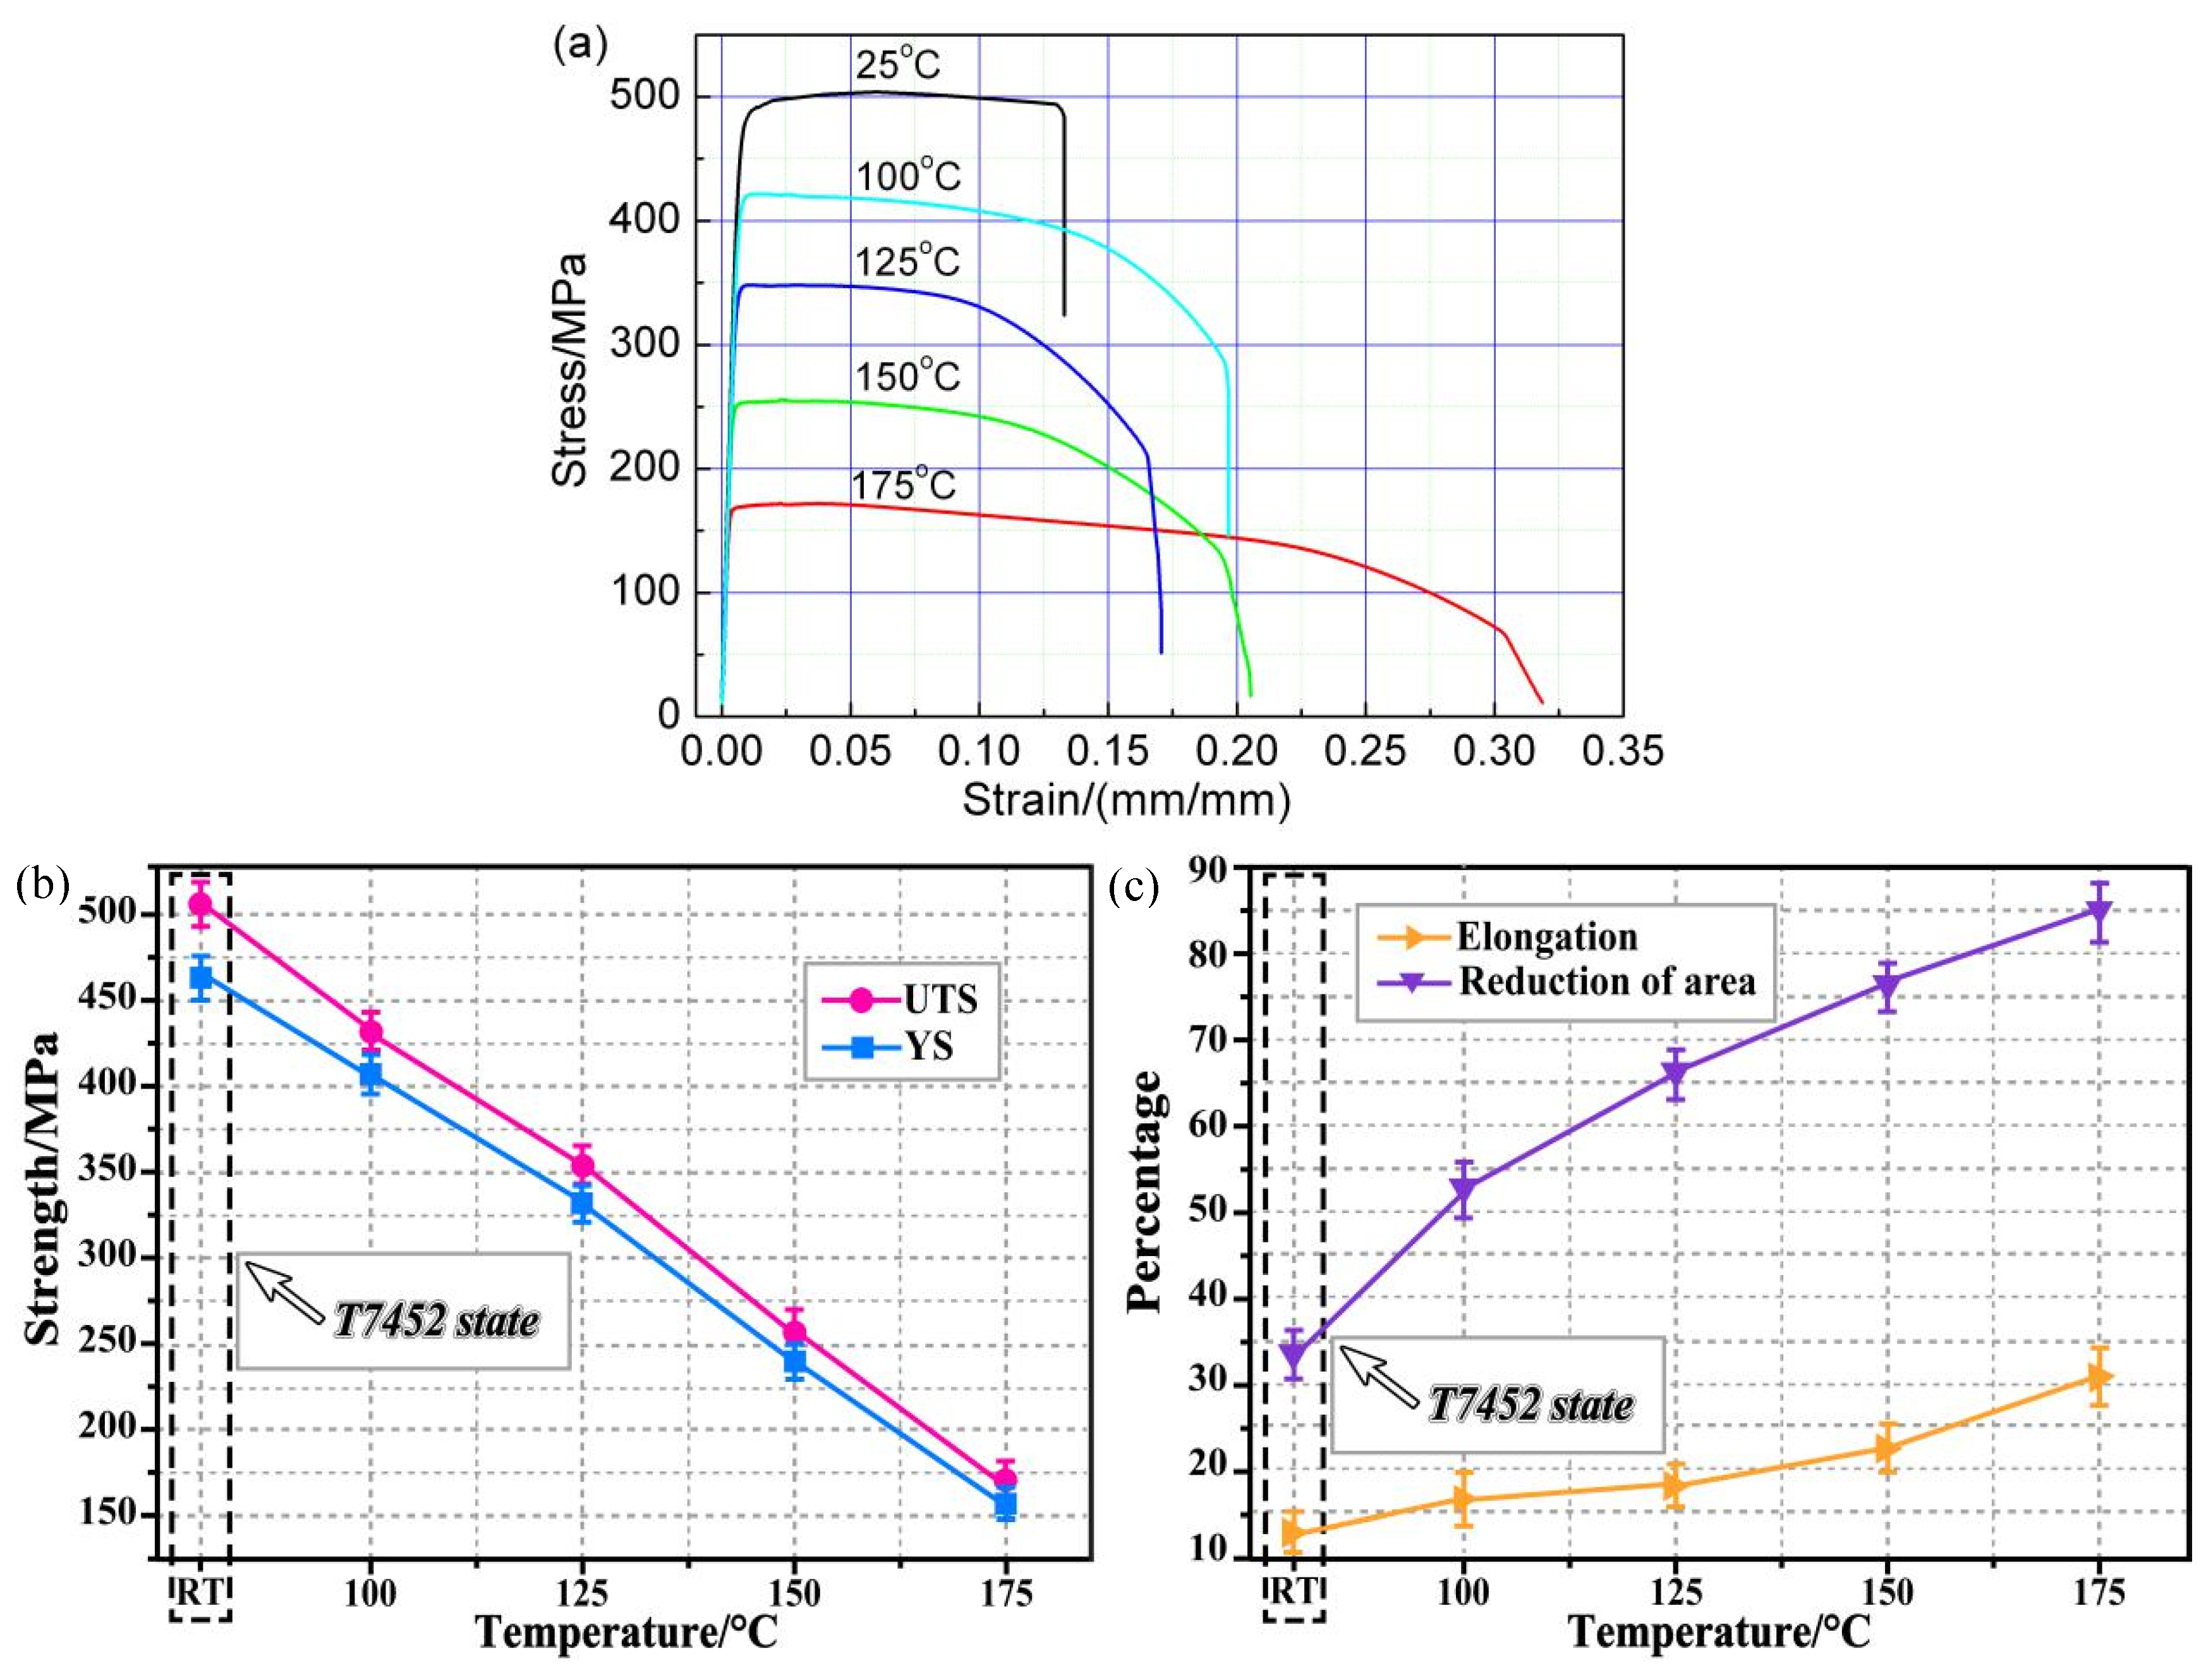
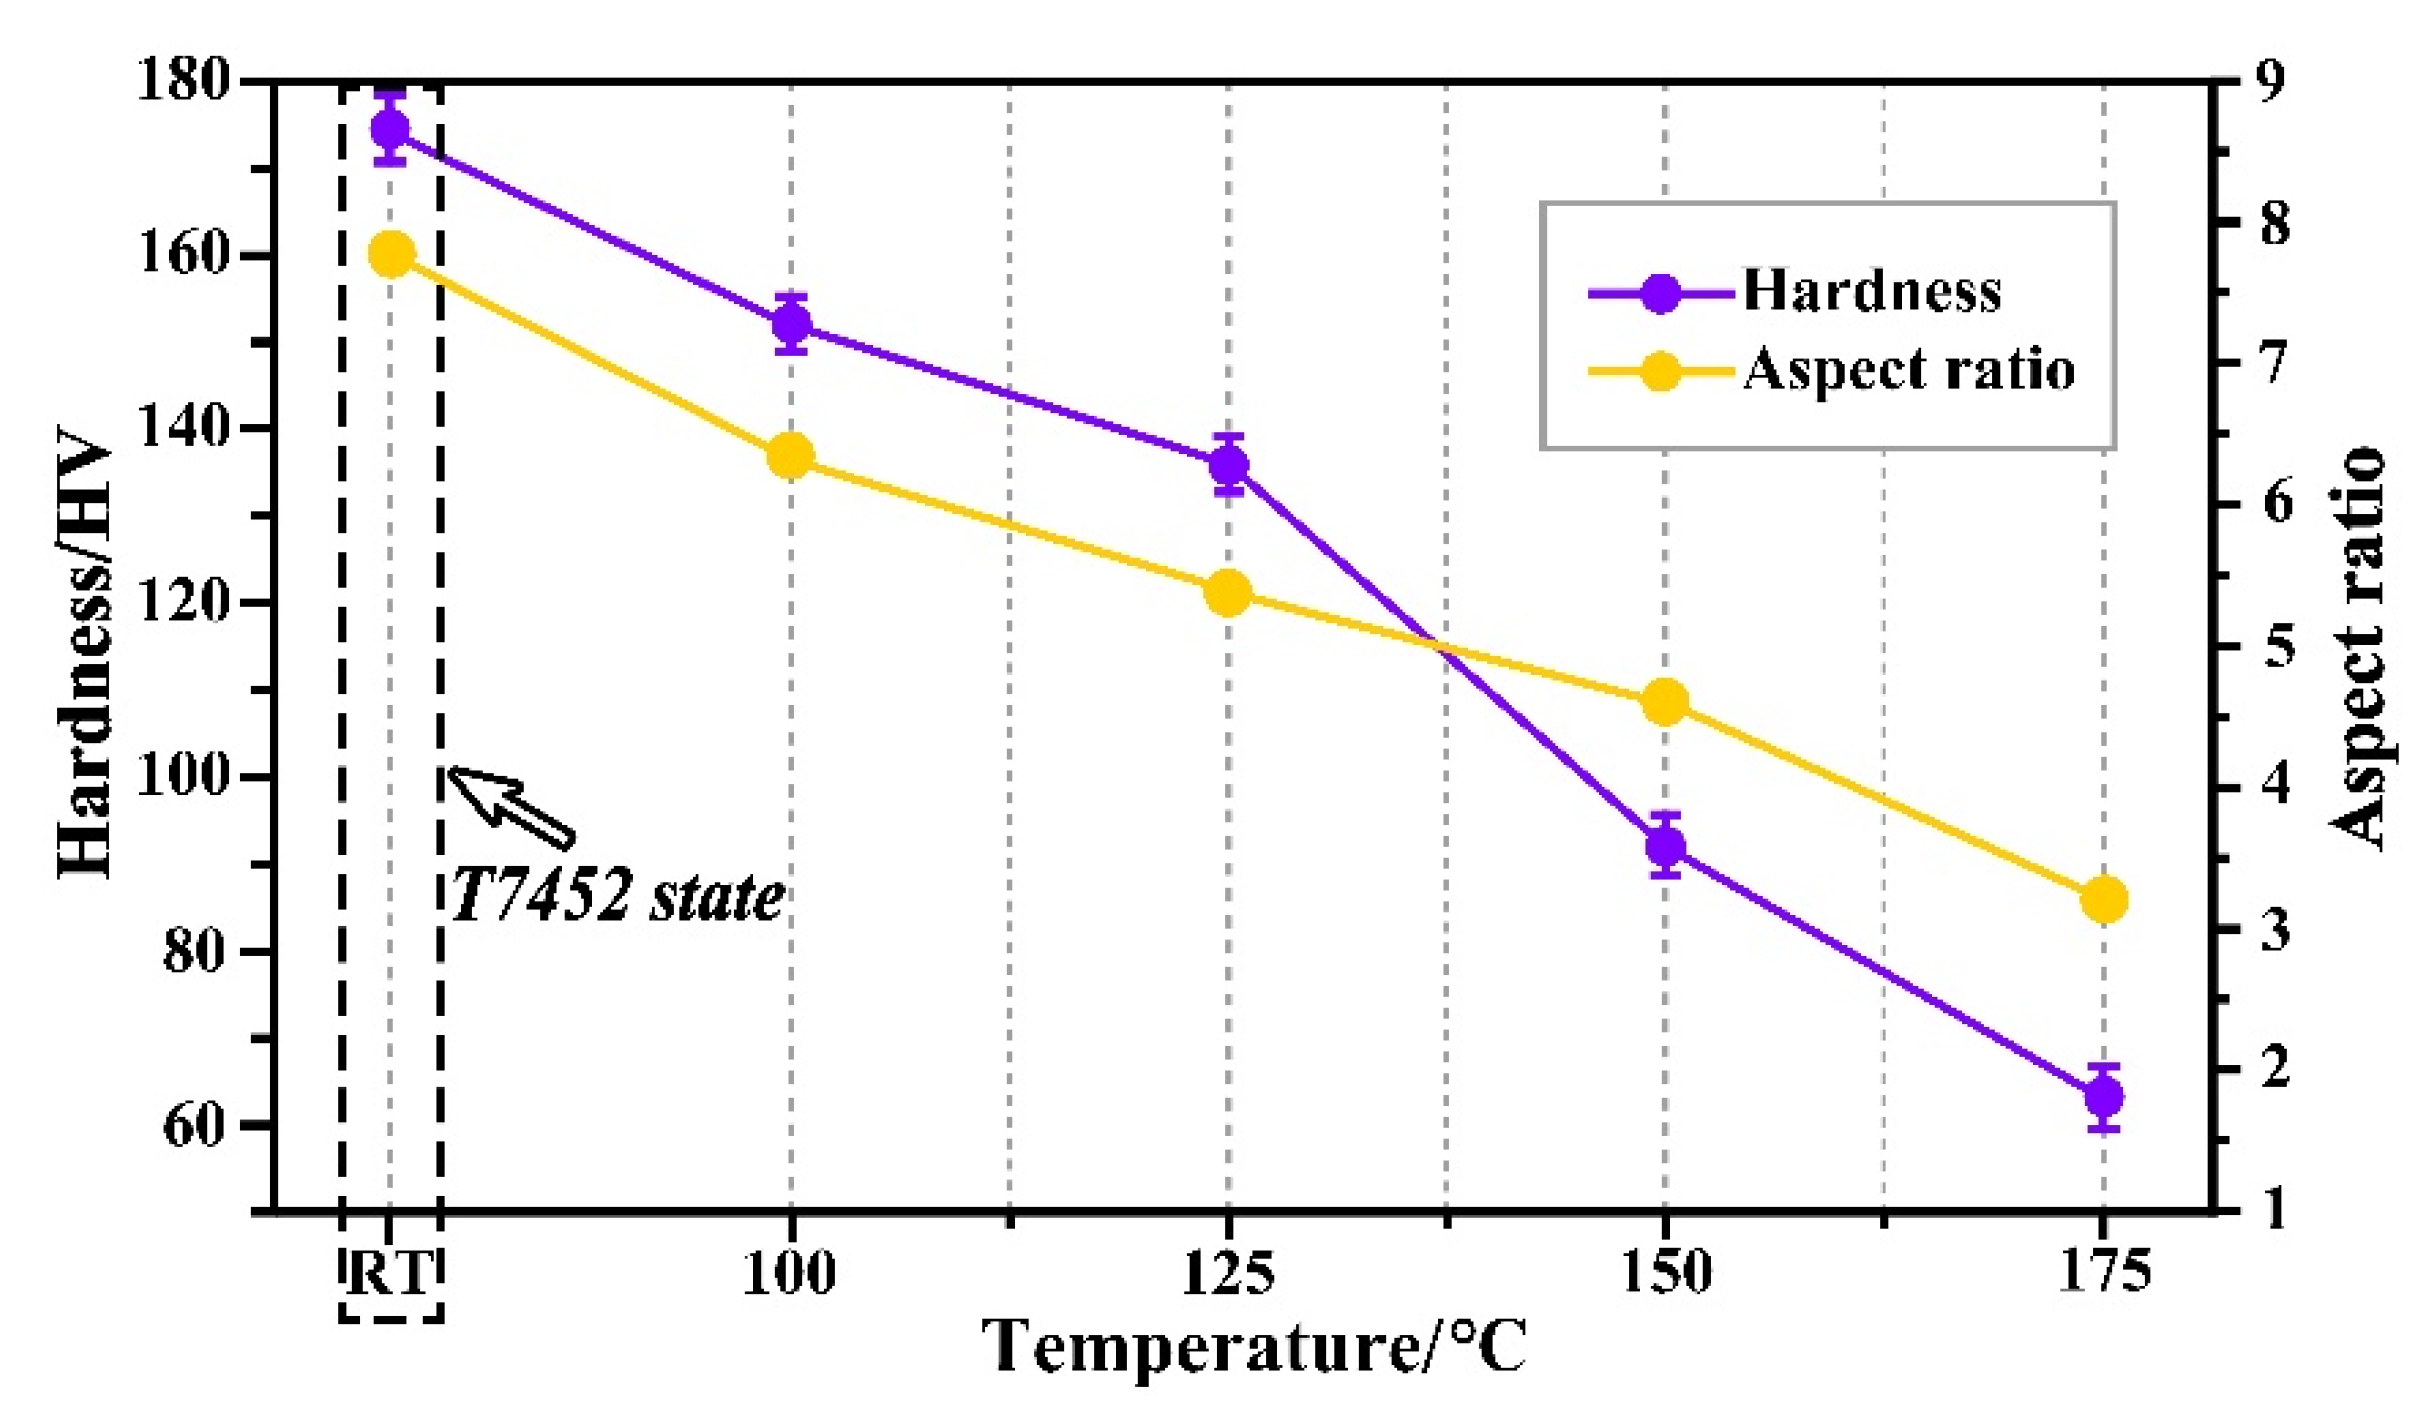
3.1. Hardness, Electrical Conductivity and Tensile Properties

Figure 1 shows the hardness and electrical conductivity of the 7085Al alloy after thermal exposure and tensile tests at different temperatures. The black dotted lines in Figure 1a,b represent the results of the hardness and electrical conductivity of the 7085 plate at the T7452 state, respectively. As shown in Figure 1a, compared with the hardness of the sample at the T7452 state, the values of the samples after heat treatment at 100–175 °C are lower. The hardness curves show a slight decrease below 125 °C but a significant decrease above 125 °C. Furthermore, with the rise of the temperature, the hardness decreases continually regardless of the exposure time. The hardness of the alloy decreases to only 57 HV after 175 °C/1000 h thermal exposure and the 175 °C tensile test. Figure 1b presents the electrical conductivity of the 7085 alloy after thermal exposure and tensile tests at different temperatures. Contrary to the trend of hardness variety, the corresponding electrical properties of the sample increase with the increase of temperature regardless of time. The highest achieved conductivity of the alloy was 69.7% IACS after 175 °C/1000 h thermal exposure and the 175 °C tensile test.
Figure 2 shows the effect of thermal exposure time and tensile tests on the hardness and electric conductivity of the 7085 Al alloy plate. The results reveal that the hardness of the alloy decreases while the conductivity increases as the time extends.
The results in Figure 1 and Figure 2 indicate that the influence of thermal exposure and tensile tests’ temperature on both the hardness and electrical properties is much stronger than that of the duration. Therefore, the present study mainly focused on the effect of thermal exposure and tensile test temperature on the mechanical properties and microstructural evolution of the 7085 Al alloy. The five representative samples of the 7085 Al alloy chosen for the analyses are listed in Table 2.
Figure 3 shows the tensile properties of the alloy at different temperatures for 500 h (25 ℃ tensile samples are excluded). Figure 3a shows the typical stress–strain curves of the samples after thermal exposure at different temperatures. It can be seen that the strengths of the samples continuously decrease with the increase of thermal exposure and tensile temperature, while the change trend of ductility is just the opposite on the whole. The trend of both ultimate tensile strength (UTS) and yield strength (YS) affected by the temperature in Figure 3b is similar to that of the hardness. The highest strength (UTS: 503 MPa and YS: 462 MPa) is at the T7452 state while the lowest strength (UTS: 171 MPa and YS: 158 MPa) is after the 175 °C heat treatment. Figure 3c shows the average elongation and reduction of area of the alloy after different heat treatment temperatures. The curves show that both of them increase with increasing temperatures, which indicates better plasticity. The elongation and reduction of the area reach 30.7% and 85.0% after being heat treated at 175 °C, which increases by 35% and 11% compared with those at 150 °C, respectively.
The microstructure of the alloy would be changed significantly after thermal exposure and tensile tests at different temperatures, so the electrical conductivity, hardness and tensile properties of the alloy also changed. Therefore, it is necessary to study the microstructural evolutions after various thermal exposure and tensile test conditions in order to reveal the relationships between microstructures and tensile properties.

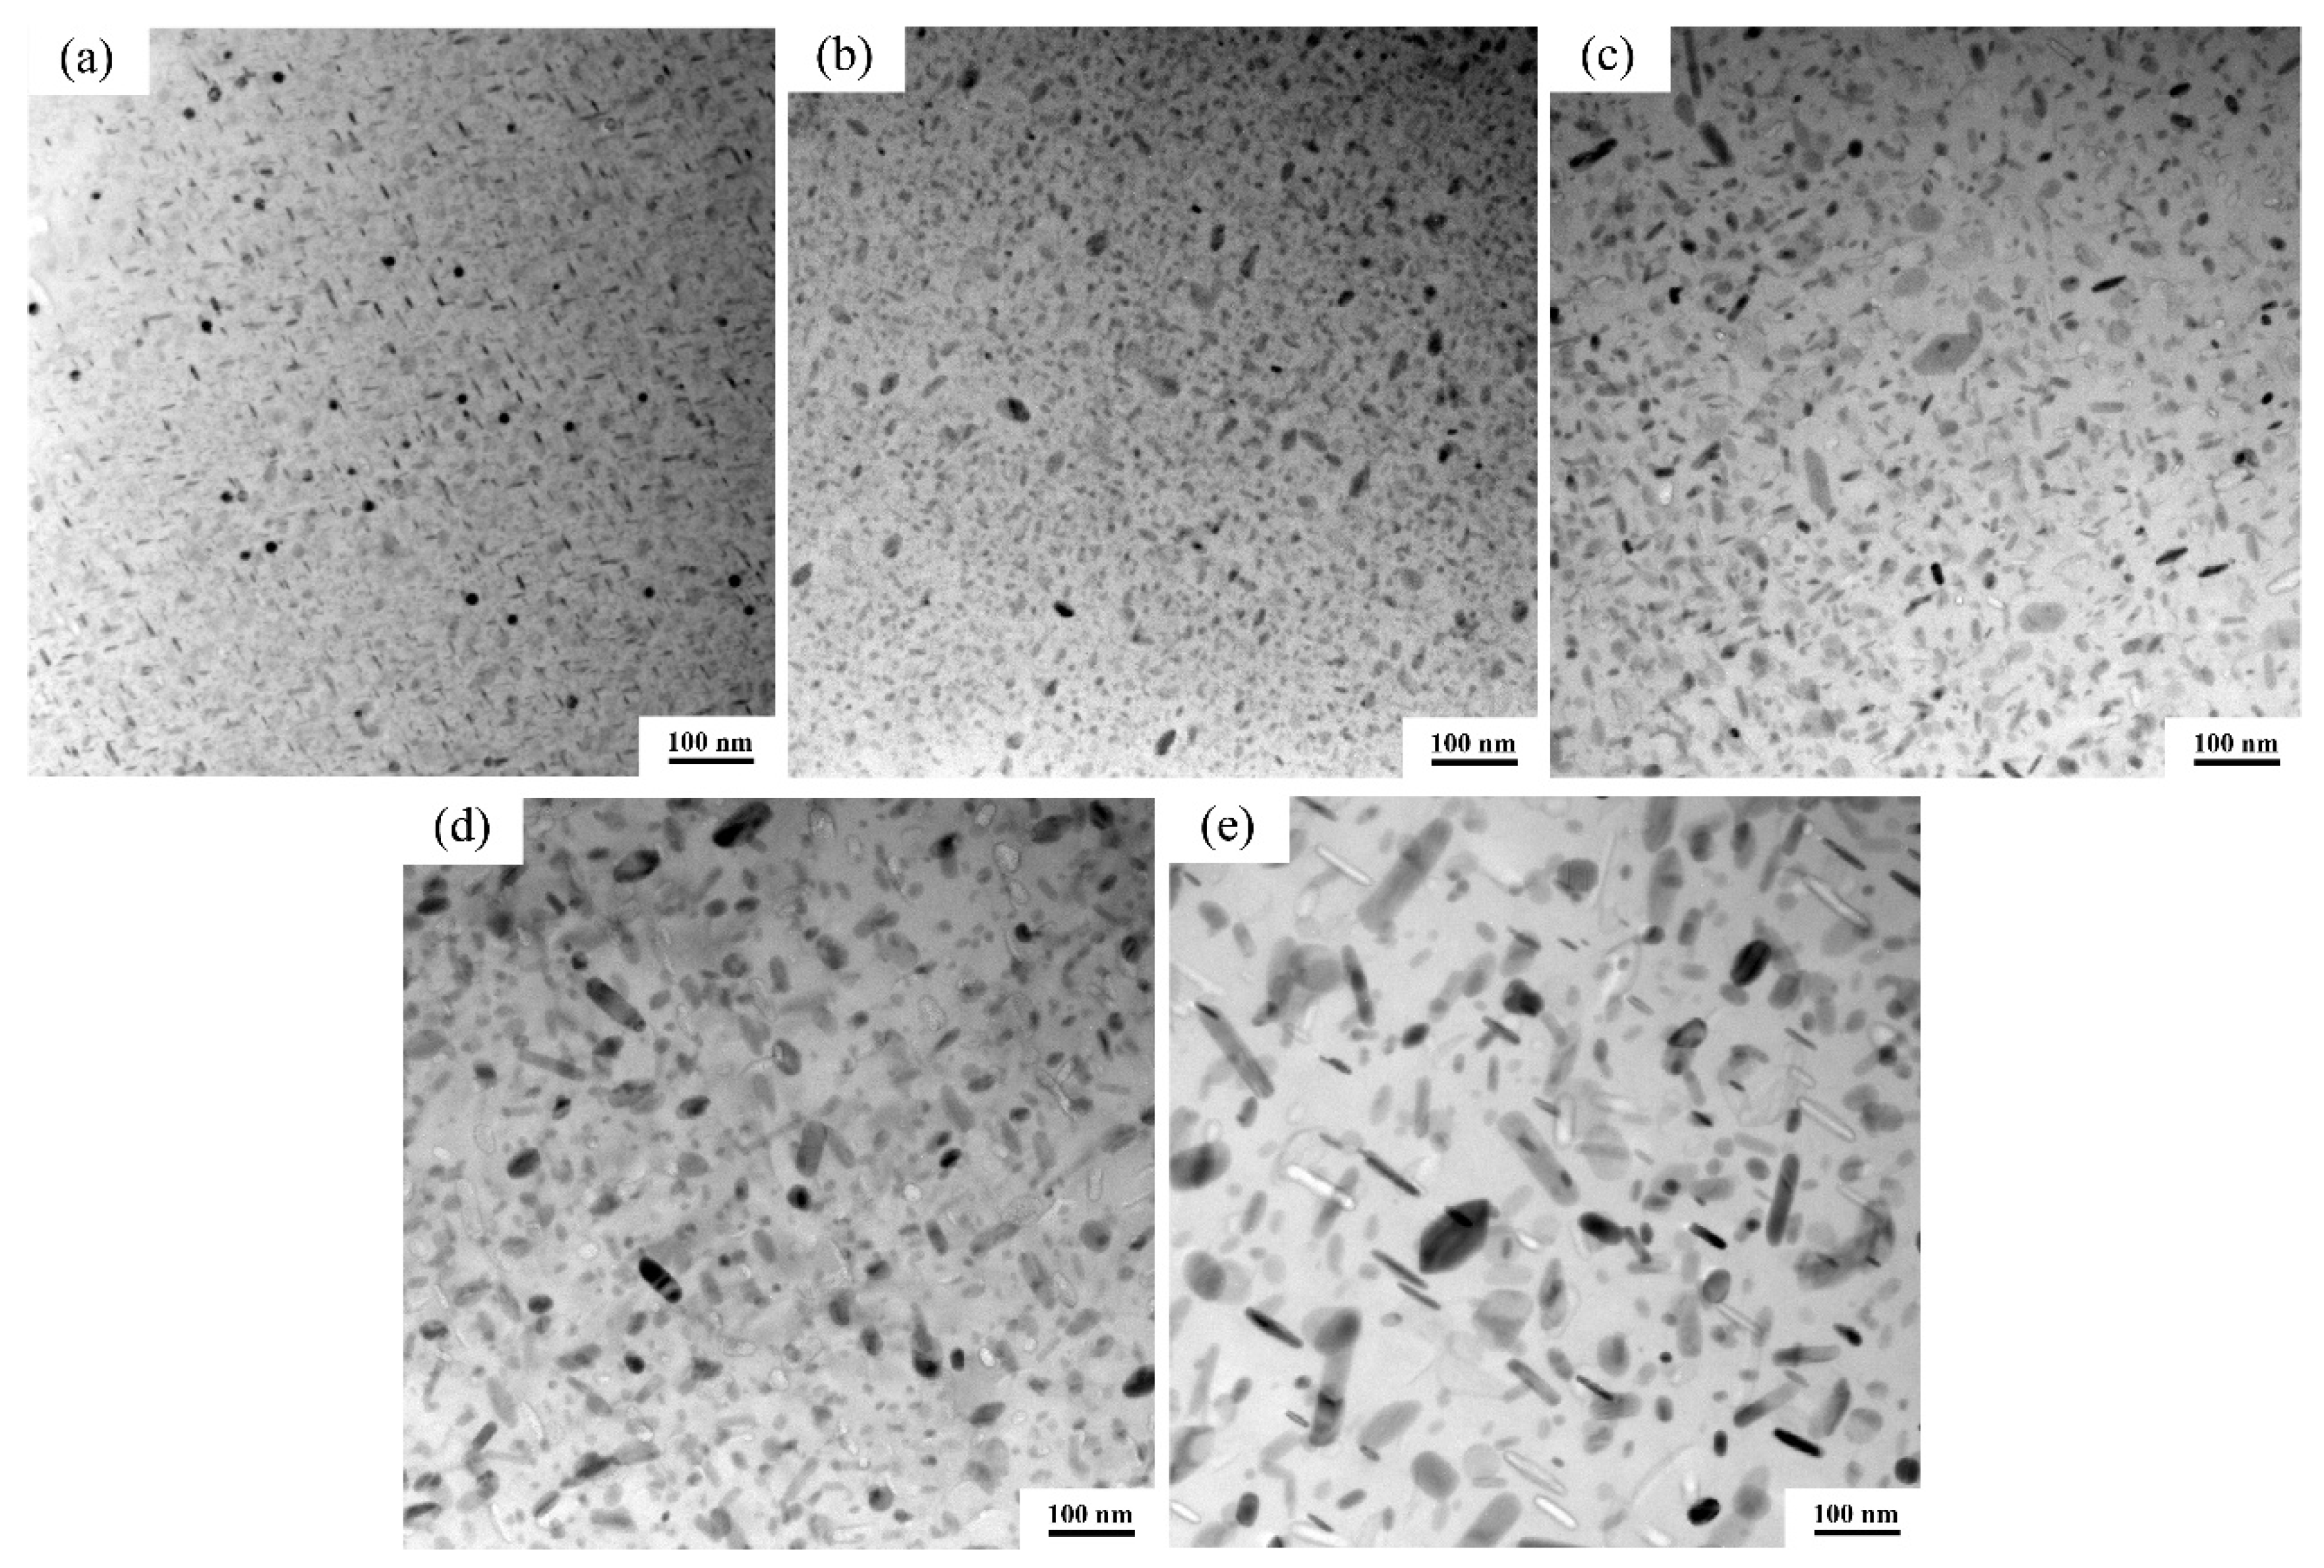
3.2. Microstructures of 7085 Al Alloy after Various Thermal Exposure and Tensile Tests Conditions

Figure 4 shows the bright-field TEM micrograph of the samples after different heat treatment processes. The nano-scale precipitates distribute uniformly in the α-Al matrix. The result shows that the precipitate size of sample I is smaller than that of the other samples (II–V). As the temperature increases, the precipitate size increases.
Generally, the type of precipitates in the Al alloys can be distinguished according to the selected area electron diffraction (SAED) patterns. Figure 5a presents a schematic representation in the [001]Al projection [20,21,22,23,24]. Figure 5b–f shows the corresponding SAED patterns of Figure 4a–e under the [001]Al zone axis, respectively. In Figure 5a, the main stronger diffraction spots come from the Al matrix. The sharp spots at {100} Al and {110}Al associate with the L12 Al3Zr dispersoids [25], which appear during the homogenization treatment. Since both the η′ and η phases are hexagonal in structure and the lattice parameters are aη′ = 4.96 A o , cη′ = 14.02 A o , aη = 5.21 A o , cη = 8.6 A o [26,27,28], the spots at 1/3(220)Al and the other one could be indexed as { 1 ¯ 010 } η′ and { 01 1 ¯ 0 } η, respectively, as indicated in Figure 5a.
Figure 5b indicates that sample I contains both η′ and η precipitates. After heat treatment at different temperatures, the diffraction features come from metastable η′ phase and the equilibrium η phase can be clearly identified. This suggests that η′ and η precipitates coexist in the samples. As the temperature rises, the diffraction spots from the η phase become sharper and stronger, which indicates that the volume fraction of η precipitate increases. When the temperature is 175 °C (sample V), the η phase becomes the dominant. This phenomenon further confirms that the η′ phase transforms into the η phase during the thermal exposure and tensile tests at different temperatures.
Figure 6 presents the high-resolution transmission electron microscopy (HRTEM) images for the samples after various heat treatments in the <110>Al orientation. In sample I, as Figure 6a shows, the platelet η′ phase appears edge-on (elongated) as thin layers on {111}Al planes. The insert in the upper left corner shows the fast Fourier transform (FFT) pattern of the η′ phase, which is faint with slight diffuse scattering. It can be seen that the thickness of the η′ precipitates are 1.5–2 nm and the radii are 4–6 nm. The sample I also contains disc-like η precipitate with a thickness of 4.3 nm and a radius of 4.9 nm. Figure 6b–e shows the HRTEM images of samples II, III, IV and V, respectively, which indicate that both the η′ and η phases exist in the samples. As the temperature increases, the precipitate size becomes gradually larger. When the temperature reaches 175 °C (Figure 6e), the thickness and radius of the η′ precipitate are 3 nm and 11.5 nm, respectively. Besides, the grown η precipitate with 33 nm in radius and 11.8 nm in thickness could also be observed. The corresponding inverse FFT image shown in Figure 6h,i,g are larger versions of the white solid frame in Figure 6h and the yellow dashed frame in Figure 6i, respectively. Apparently, the clearer observation in Figure 6g shows the significant lattice distortion due to the non-coherency between the η phase and the α-Al matrix [21,27,29,30].
Based on the classic orientation relationship between the η phase and the α-Al matrix, that is, (0001)η//{111}Al, 10 1 ¯ 0 η//{110}Al [31,32], there exist four types of equivalent variants of the η phase on the {111}Al plane. As Figure 7a shows, four circular disc-like η phases with the same thickness and diameter maintain their (0001)η habit planes parallel to four equivalent {111}Al planes, which can be defined as V1–V4 variants, respectively. As shown in Figure 7b, when observed from the [110]Al orientation, V1 and V2 variants are edge-on while V3 and V4 variants turn out to be elliptical. In combination with Figure 6, it can be indicated that, when the temperature is lower than 100 °C, the η precipitates in the alloy are mainly V3 and V4. V1 and V2 become the main η precipitates when the temperature range is 125–175 °C.

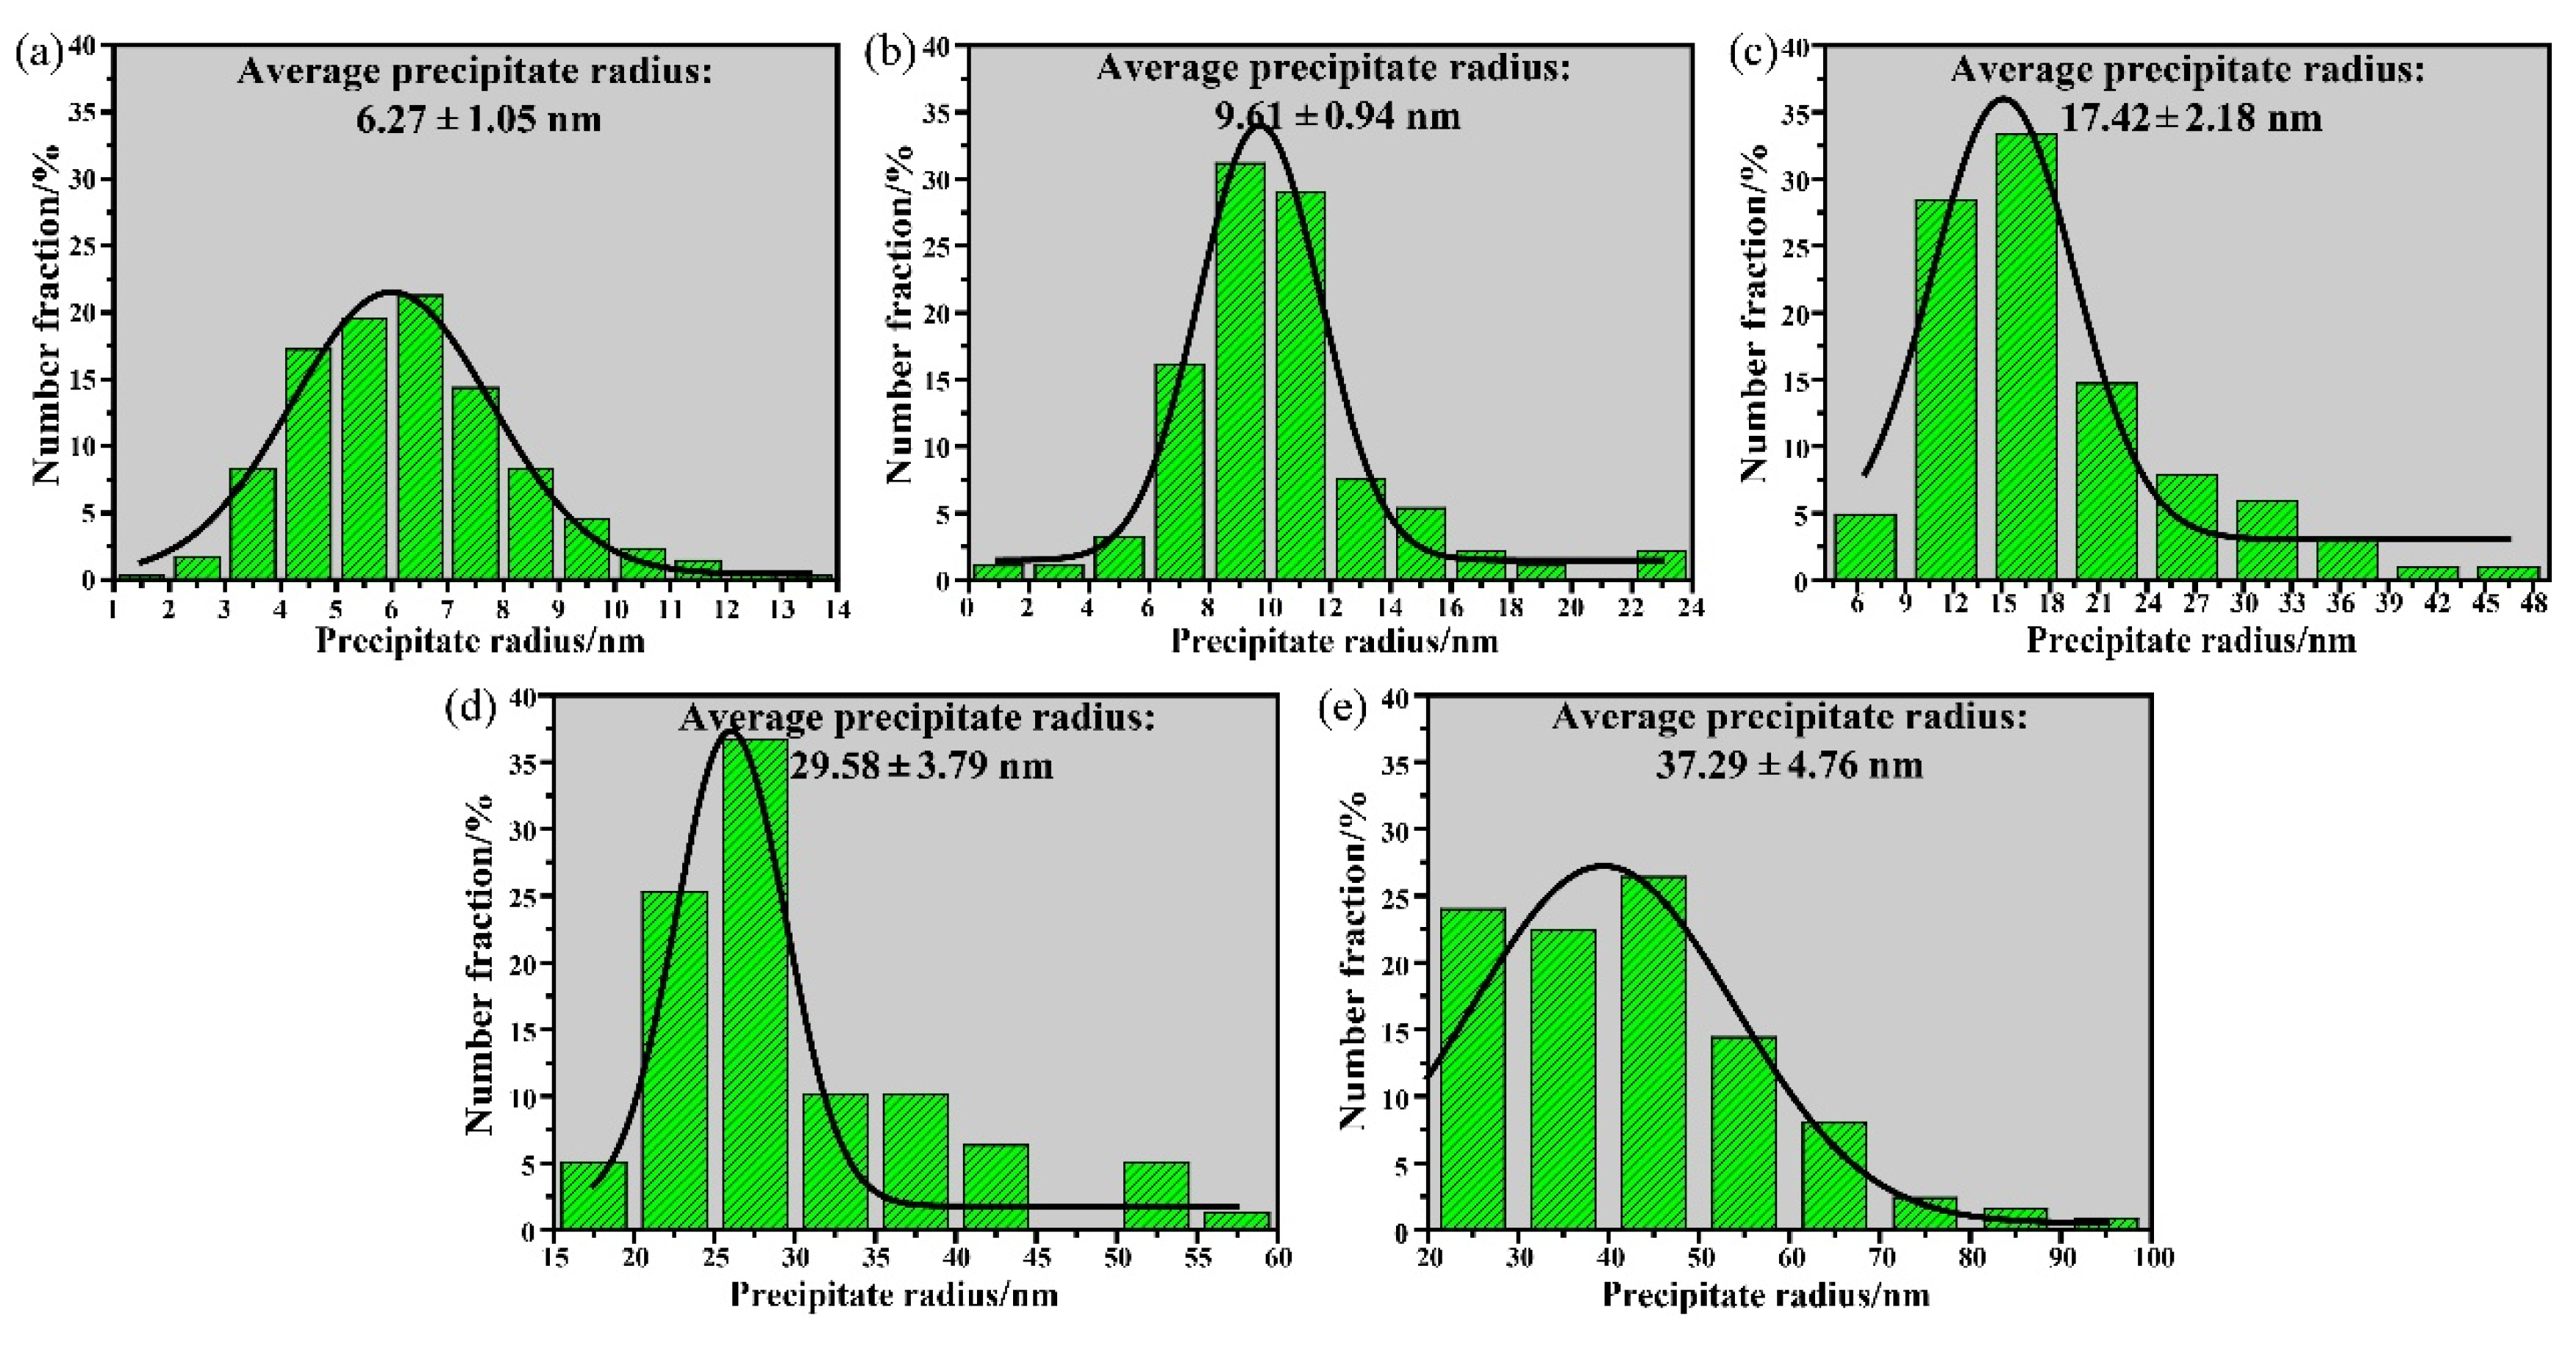
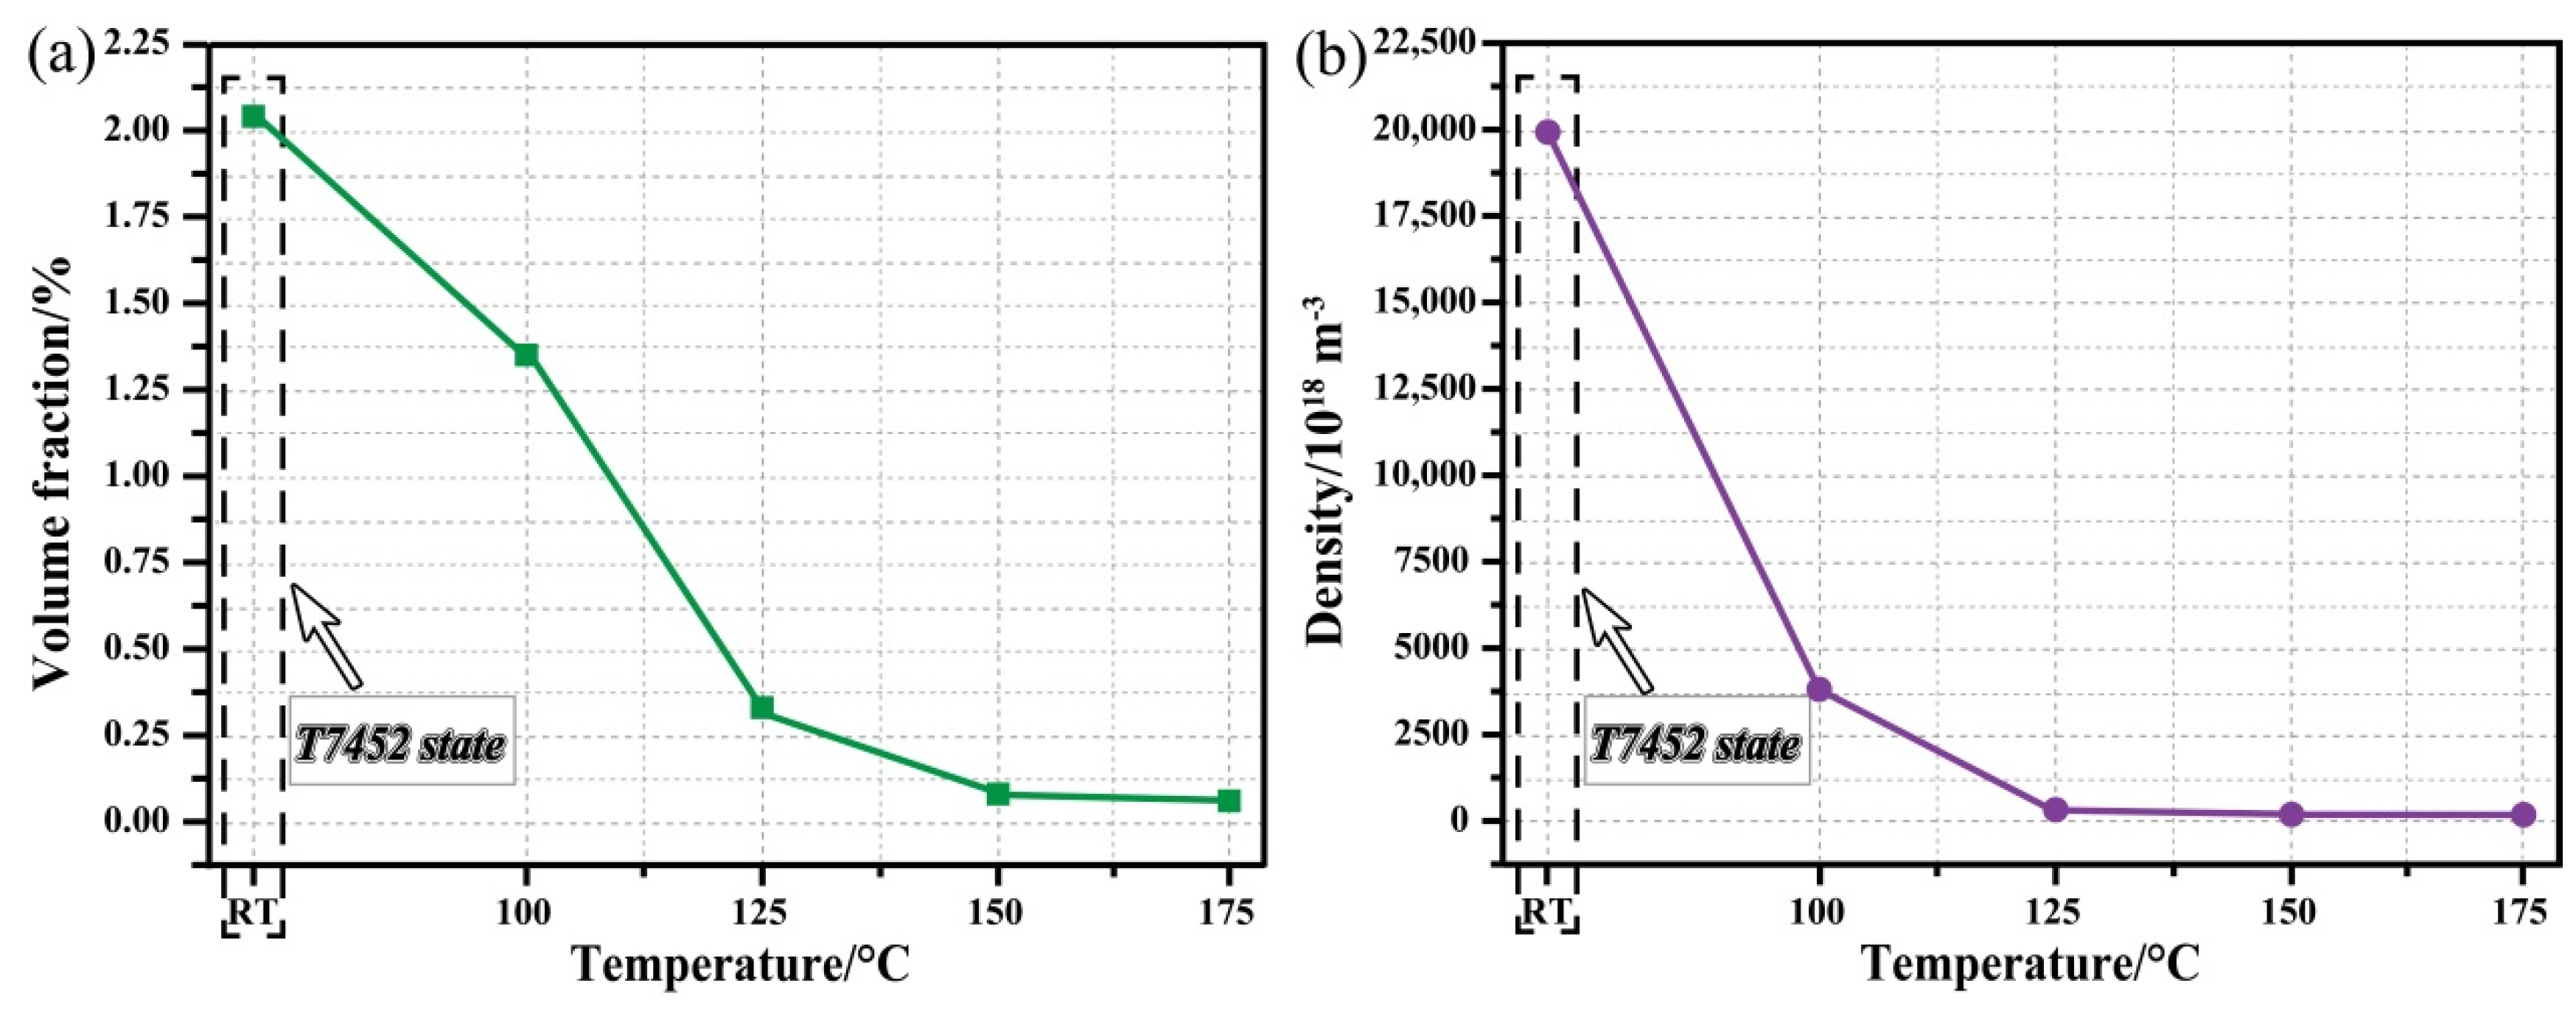
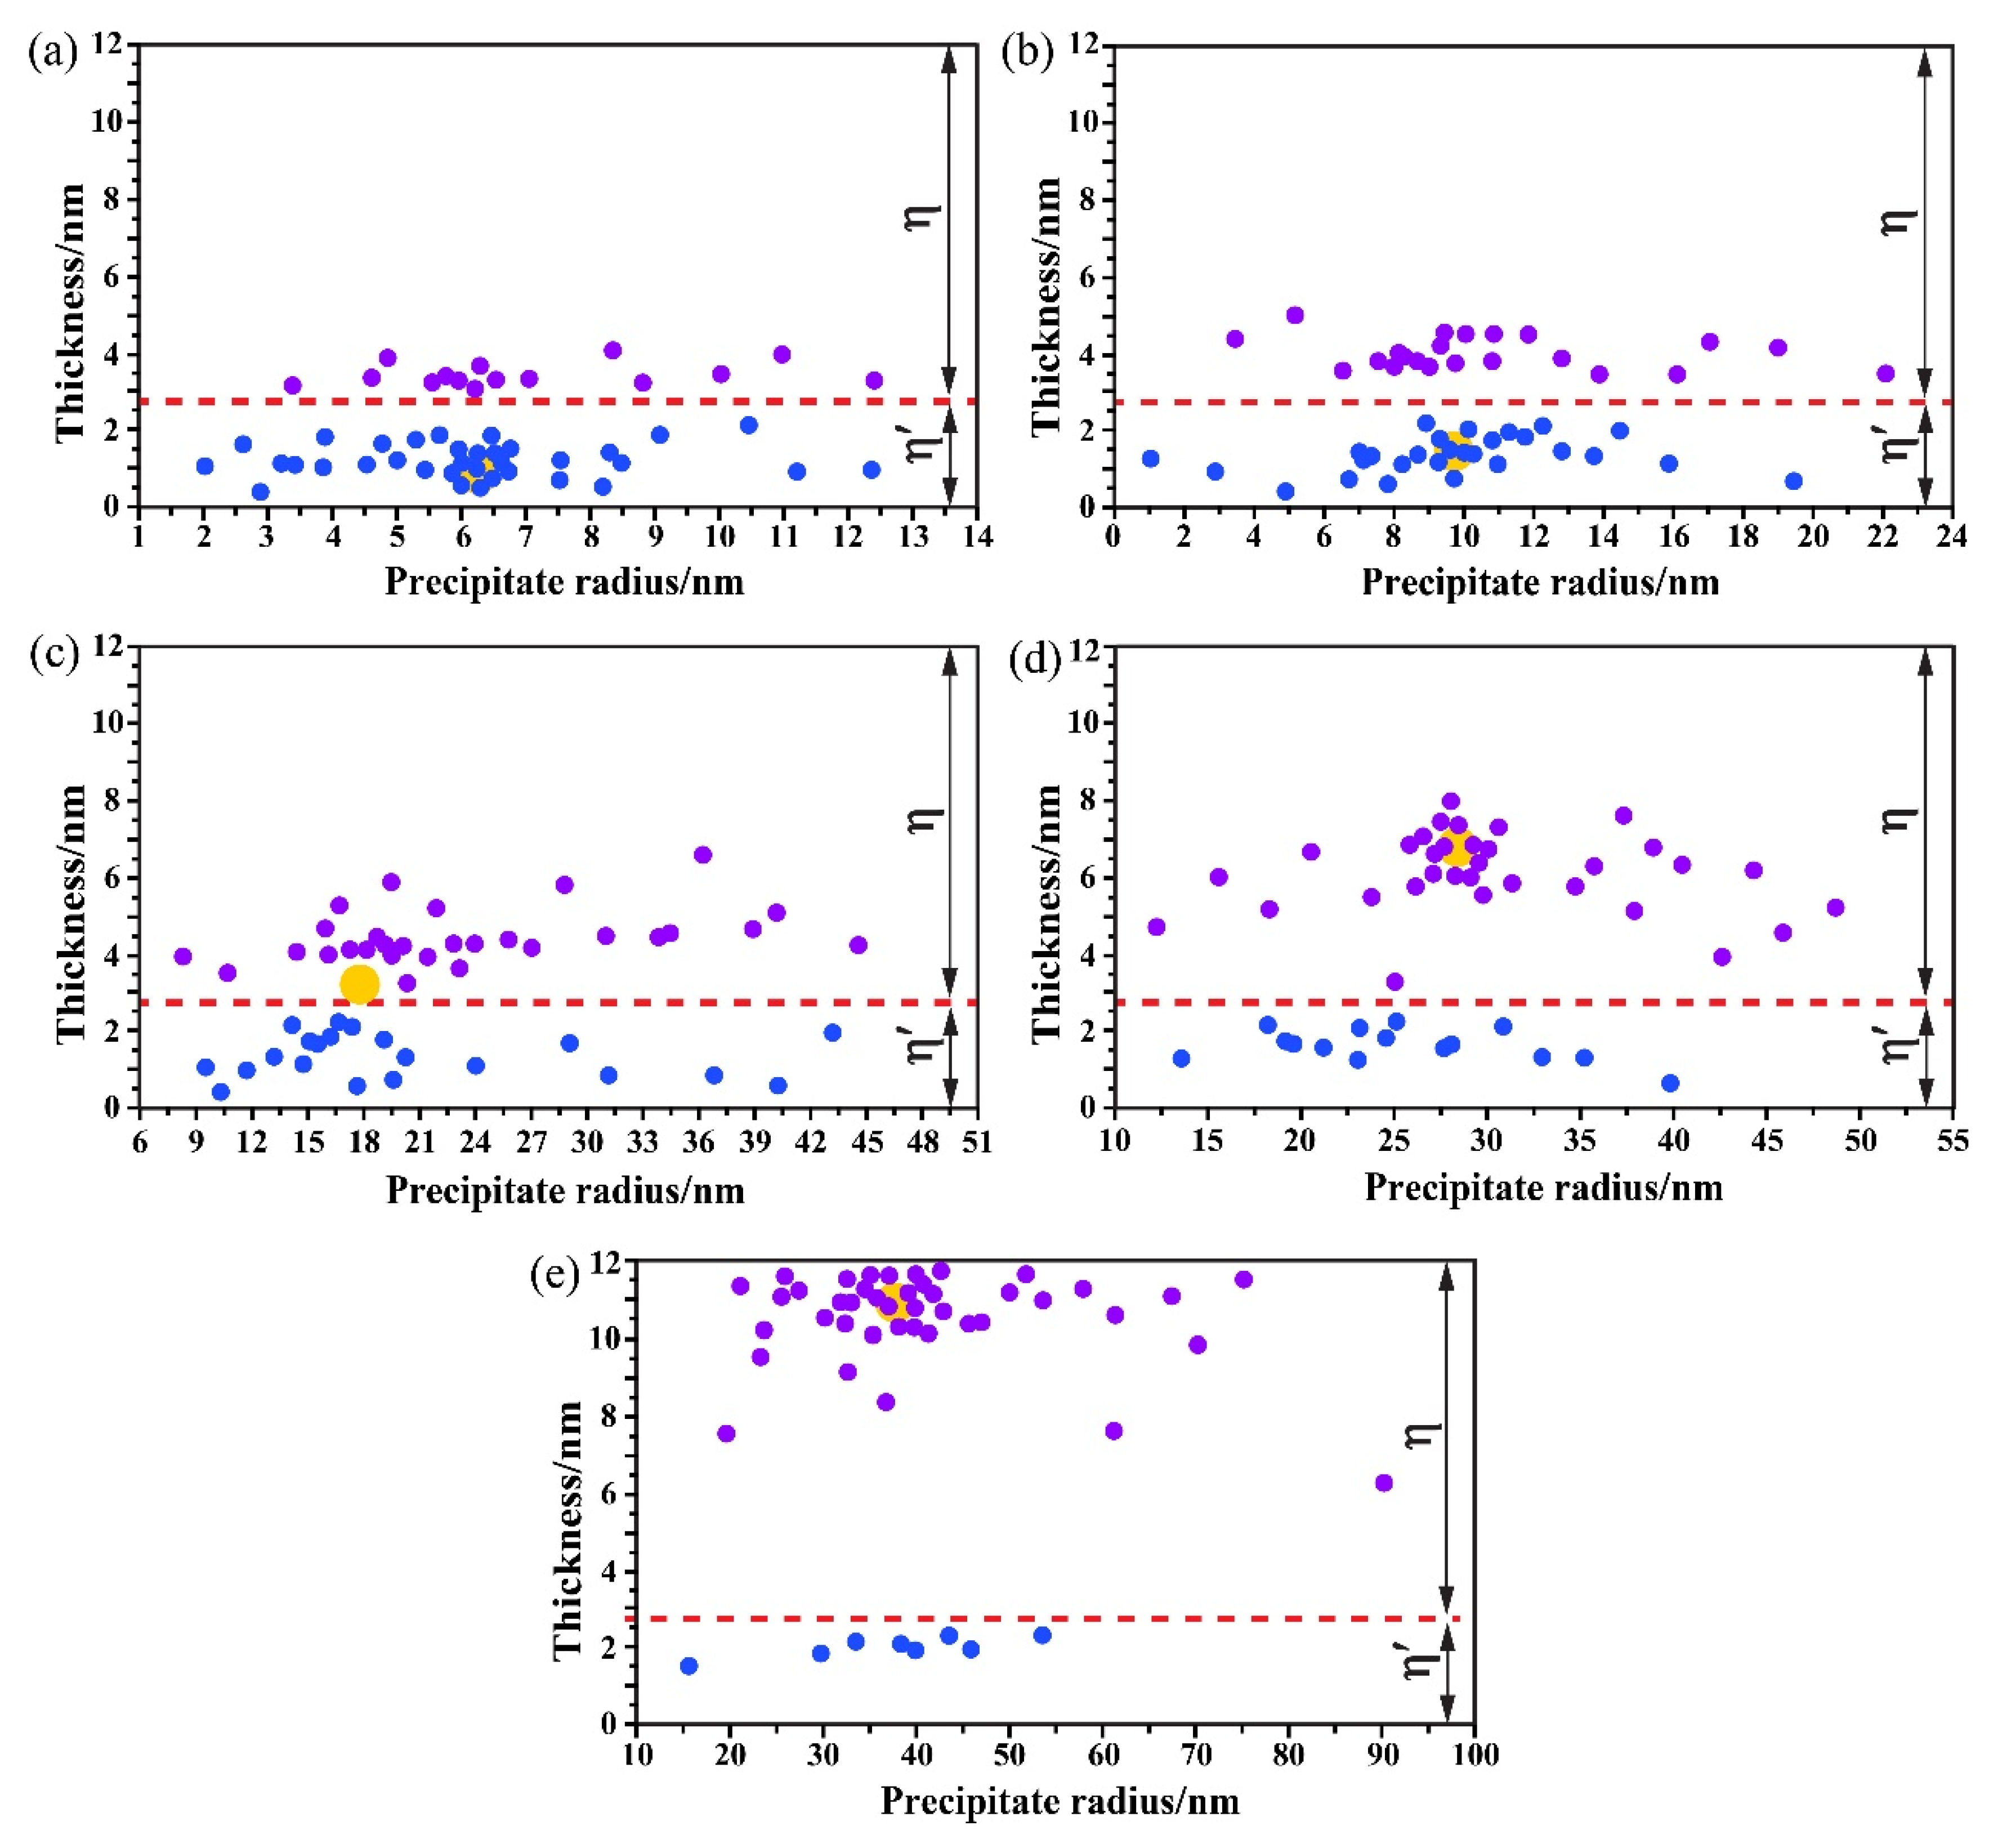
3.3. Precipitate Parameters Characterization

Since the precipitate size plays an important role in the mechanical properties of Al alloys [20,33], we measured over 1000 precipitates per sample to ensure accuracy. The corresponding statistical result of the precipitate size is shown in Figure 8. The radii of most precipitates (~71%) in sample I (Figure 8a) are in the range of 4–8 nm with ~18% of them larger than 8nm and ~11% smaller than 4 nm. The average precipitate radius is 6.27 ± 1.05 nm with a distribution range of 1–14 nm.
As for sample II, there exist larger sizes of precipitates with radii larger than 14 nm occupying about 10%. The number fraction of the precipitates with radii less than 8 nm drops to 4.5%. The average precipitates radius increases to 9.61 ± 0.94 nm, and the size distribution range becomes 0–24 nm.
Figure 8c displays the distribution of precipitate size in sample III. The result shows that the number fraction of the precipitates with the radius range of 9–24 nm reaches ~78%, while the number fraction of precipitates with the size below 9 nm is only ~2%, and that of a size larger than 22 nm is about 5%. The radius range of all the precipitates is 4.5–48 nm. Furthermore, the mean radius of the precipitates reaches 17.42 ± 2.18 nm.
When the temperatures reaches 150 °C and 175 °C (Figure 8c,d), the precipitate size increases rapidly. The average precipitate radii in samples IV and V reach 29.58 ± 3.79 nm and 37.29 ± 4.76 nm, respectively, and the radius distribution range also expands obviously.
Additionally, the precipitate volume fractions (fv) in the specimens are shown in Figure 9a, which were calculated by the method in Refs. [20,34,35]. The resulting volume fractions of the precipitates of the samples I–V are 2.04%, 1.35%, 0.33%, 0.08% and 0.06%, respectively. Moreover, according to the previous work by Deschamps [36], the number density (N) of the precipitates can be calculated by N = 3fv/4¦Ðr3, where r refers to the precipitate radius. Figure 9b presents the results of precipitate number density in the samples I–V. It is seen that the precipitate number density also decreases as the temperature increases.

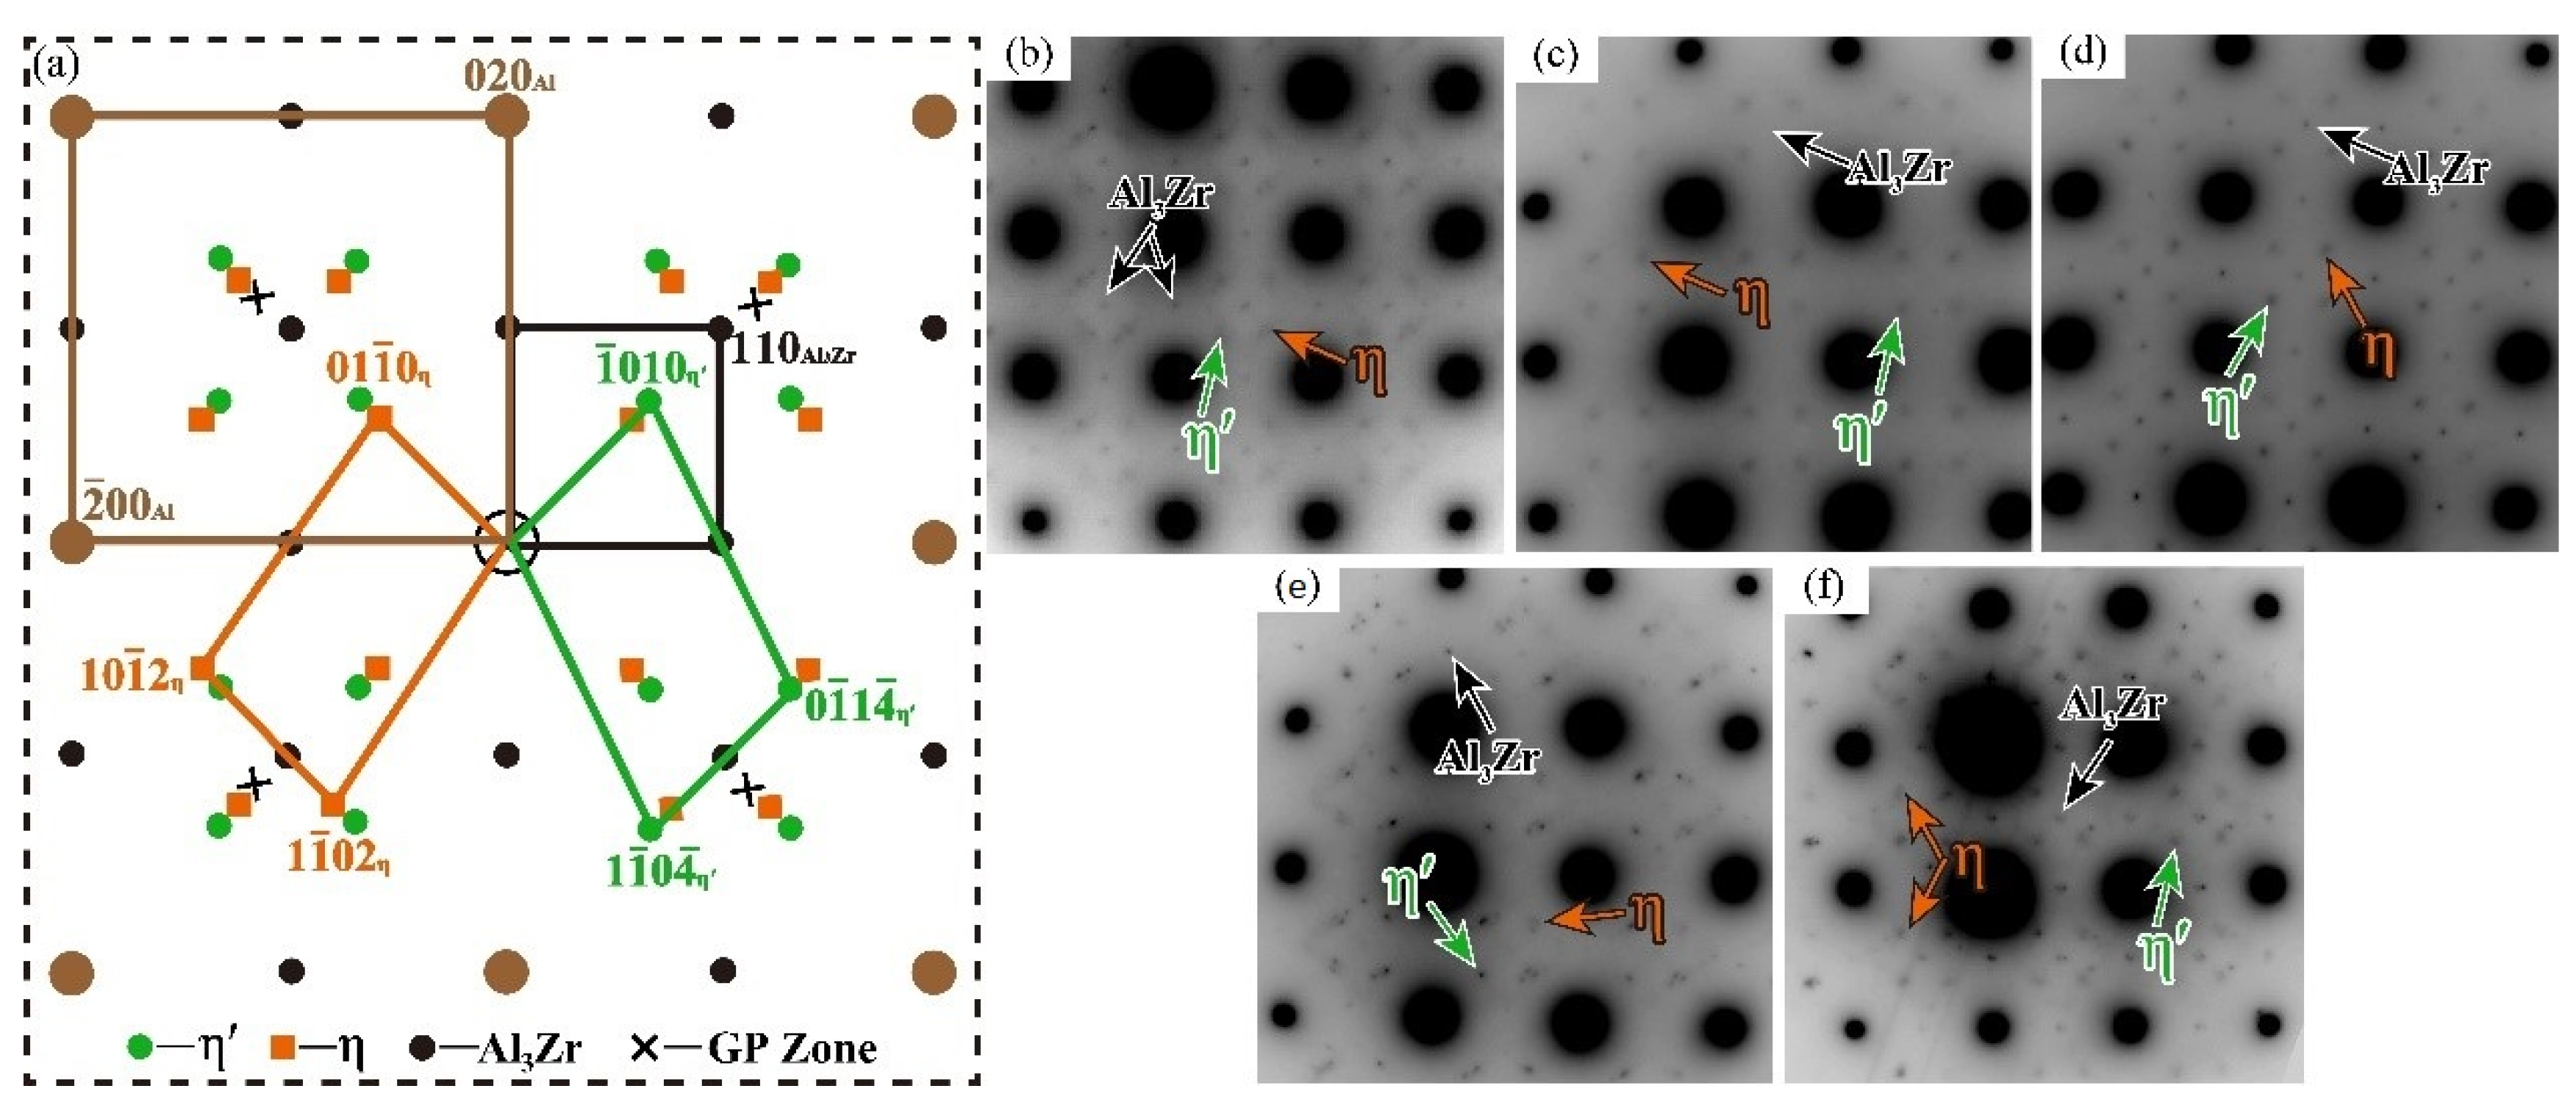
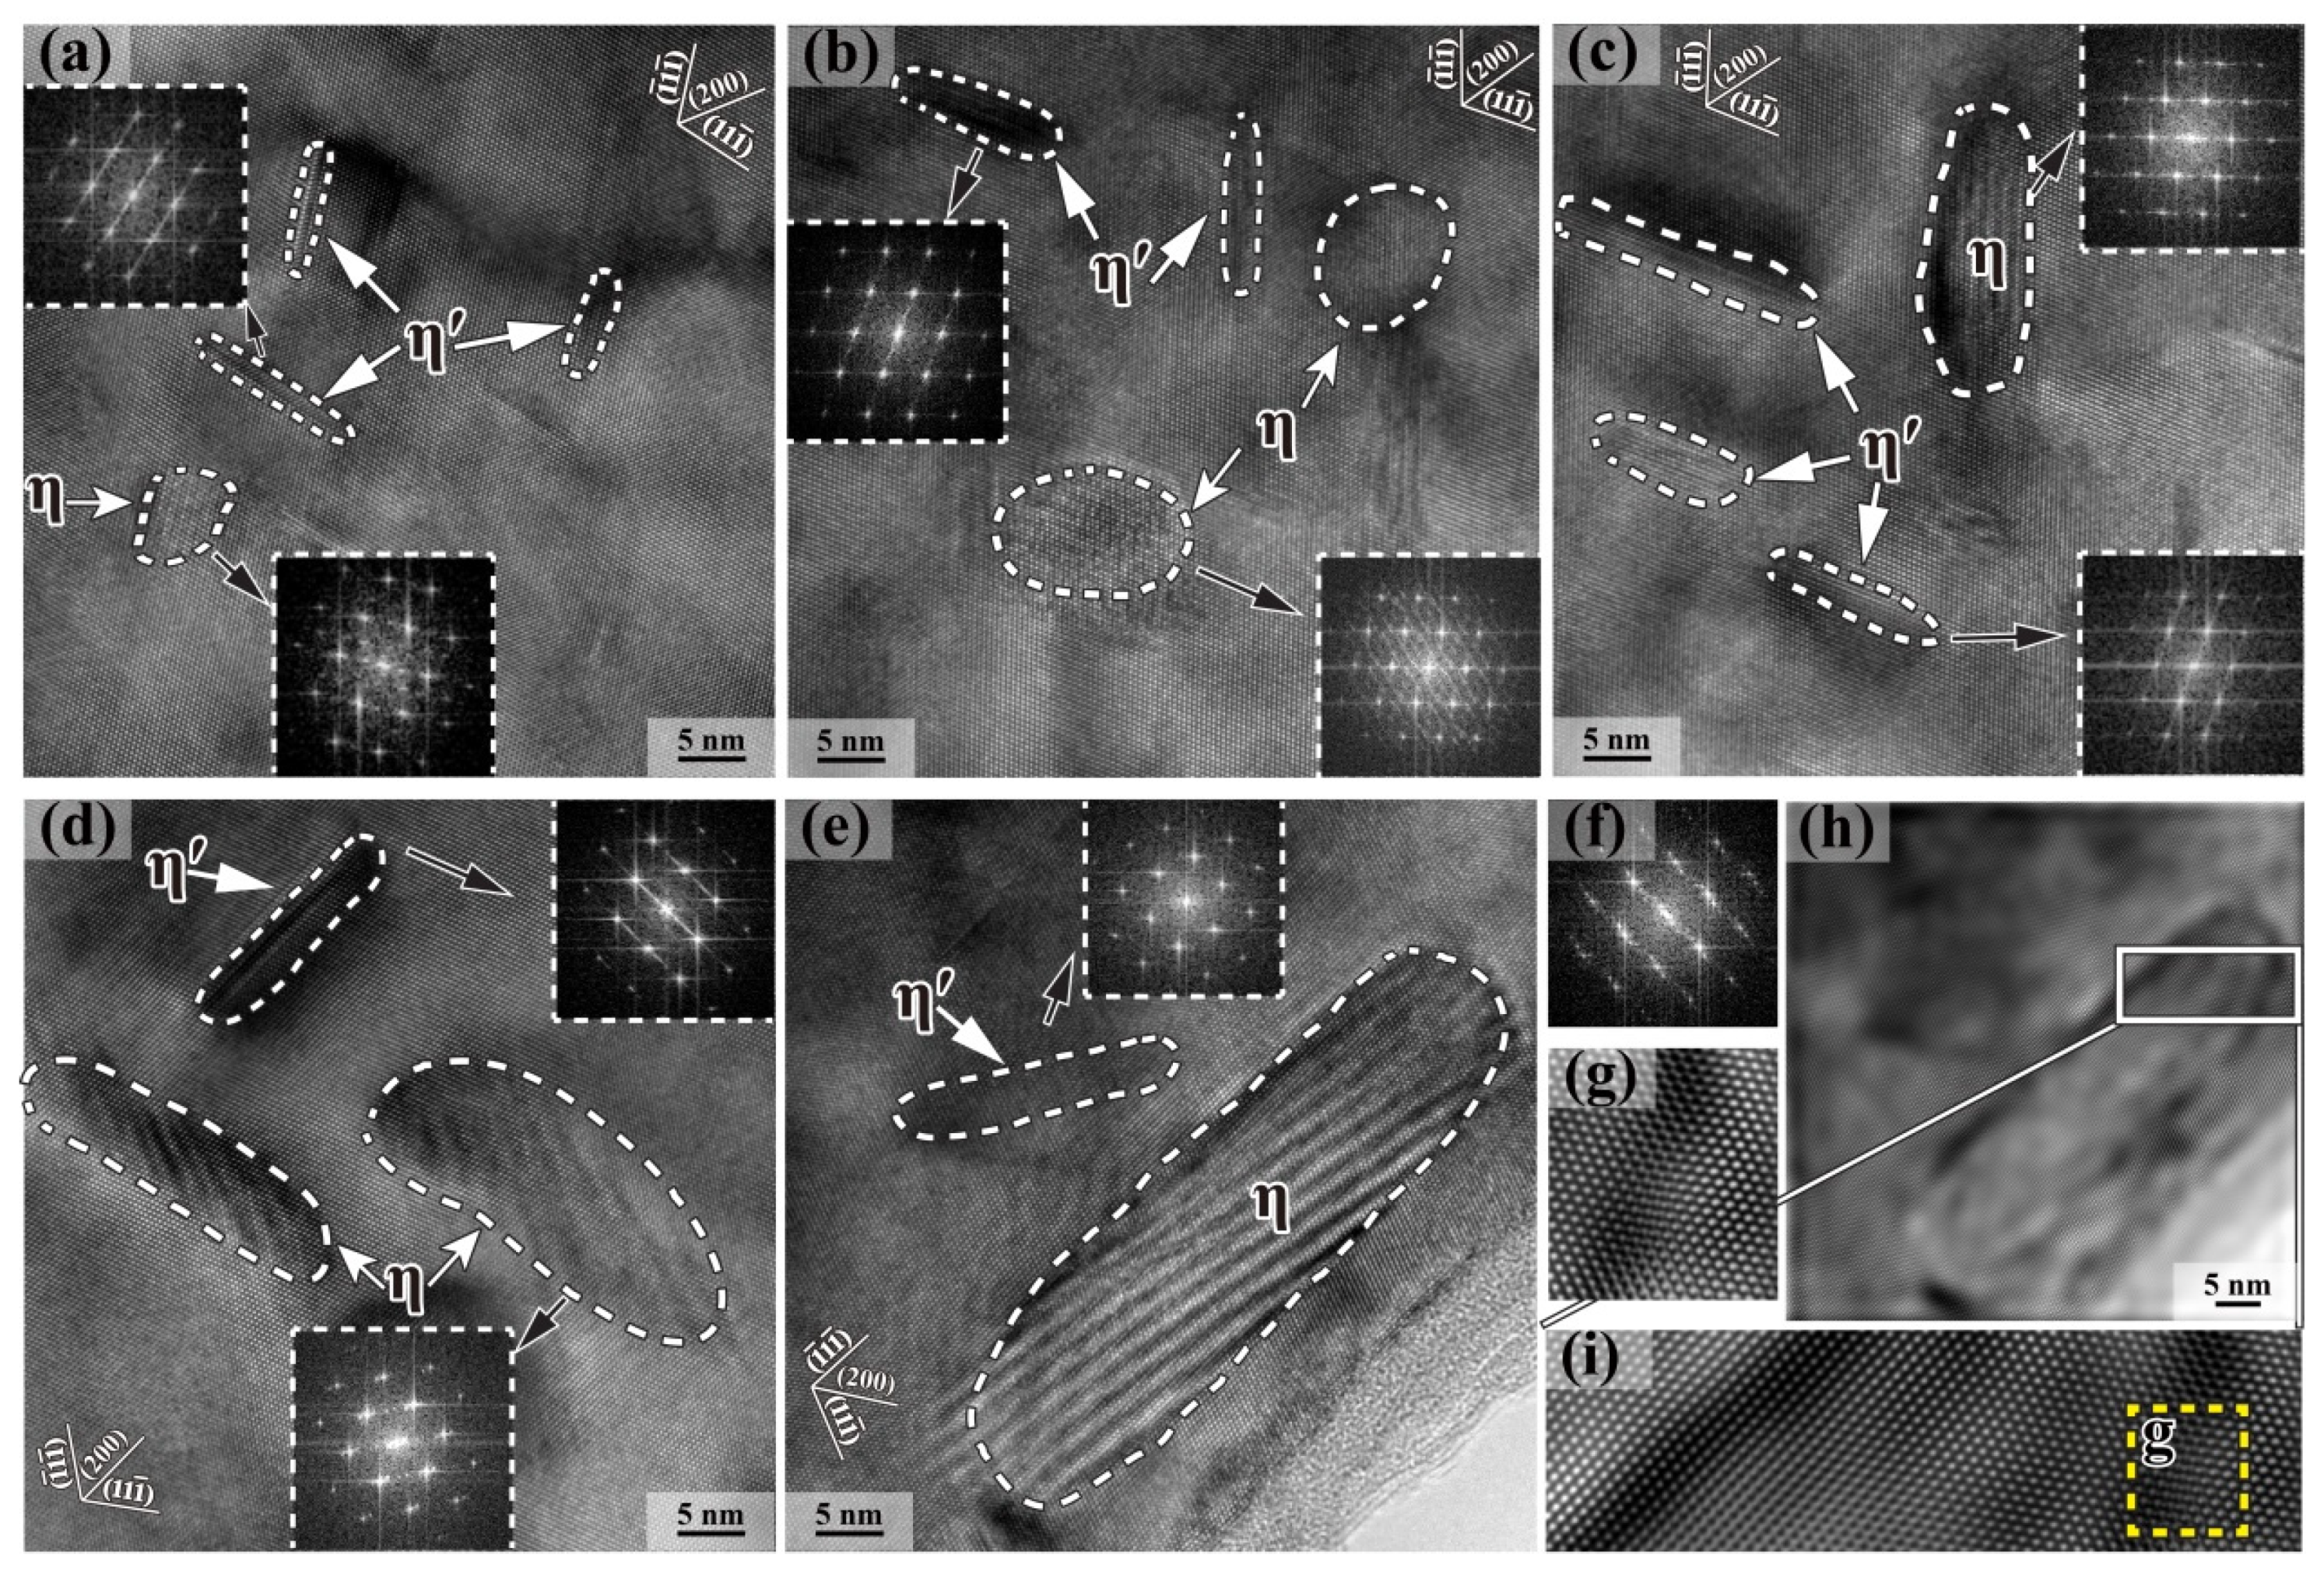
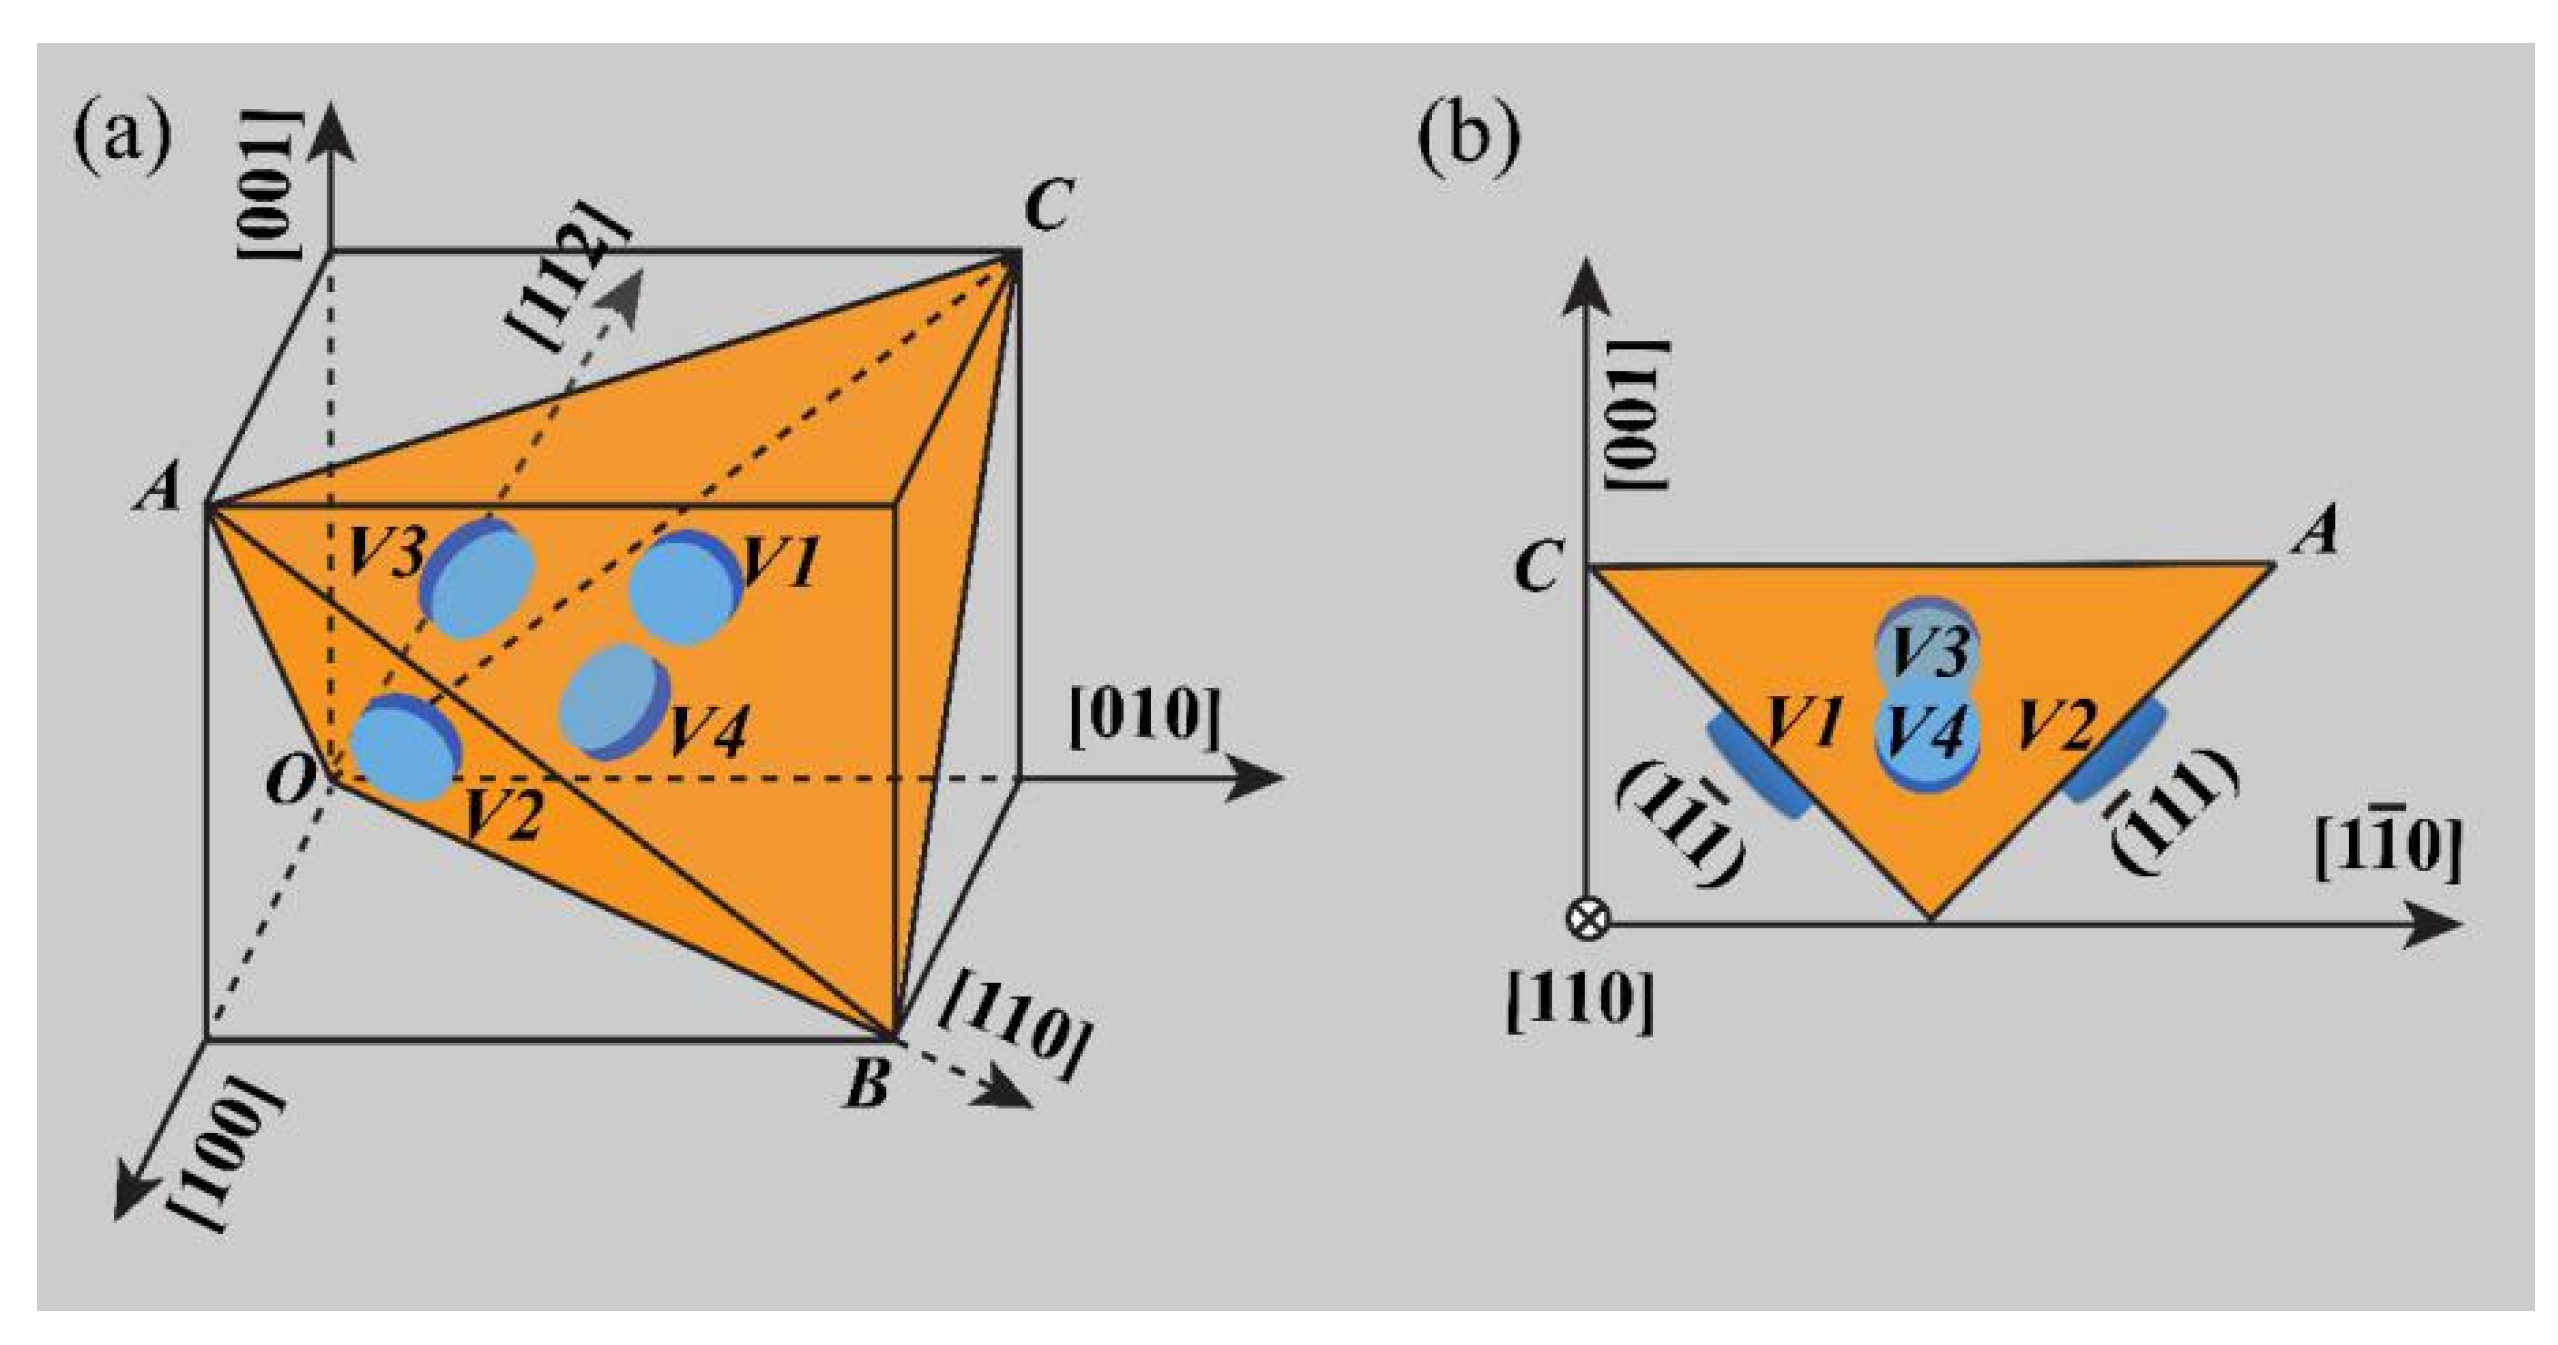
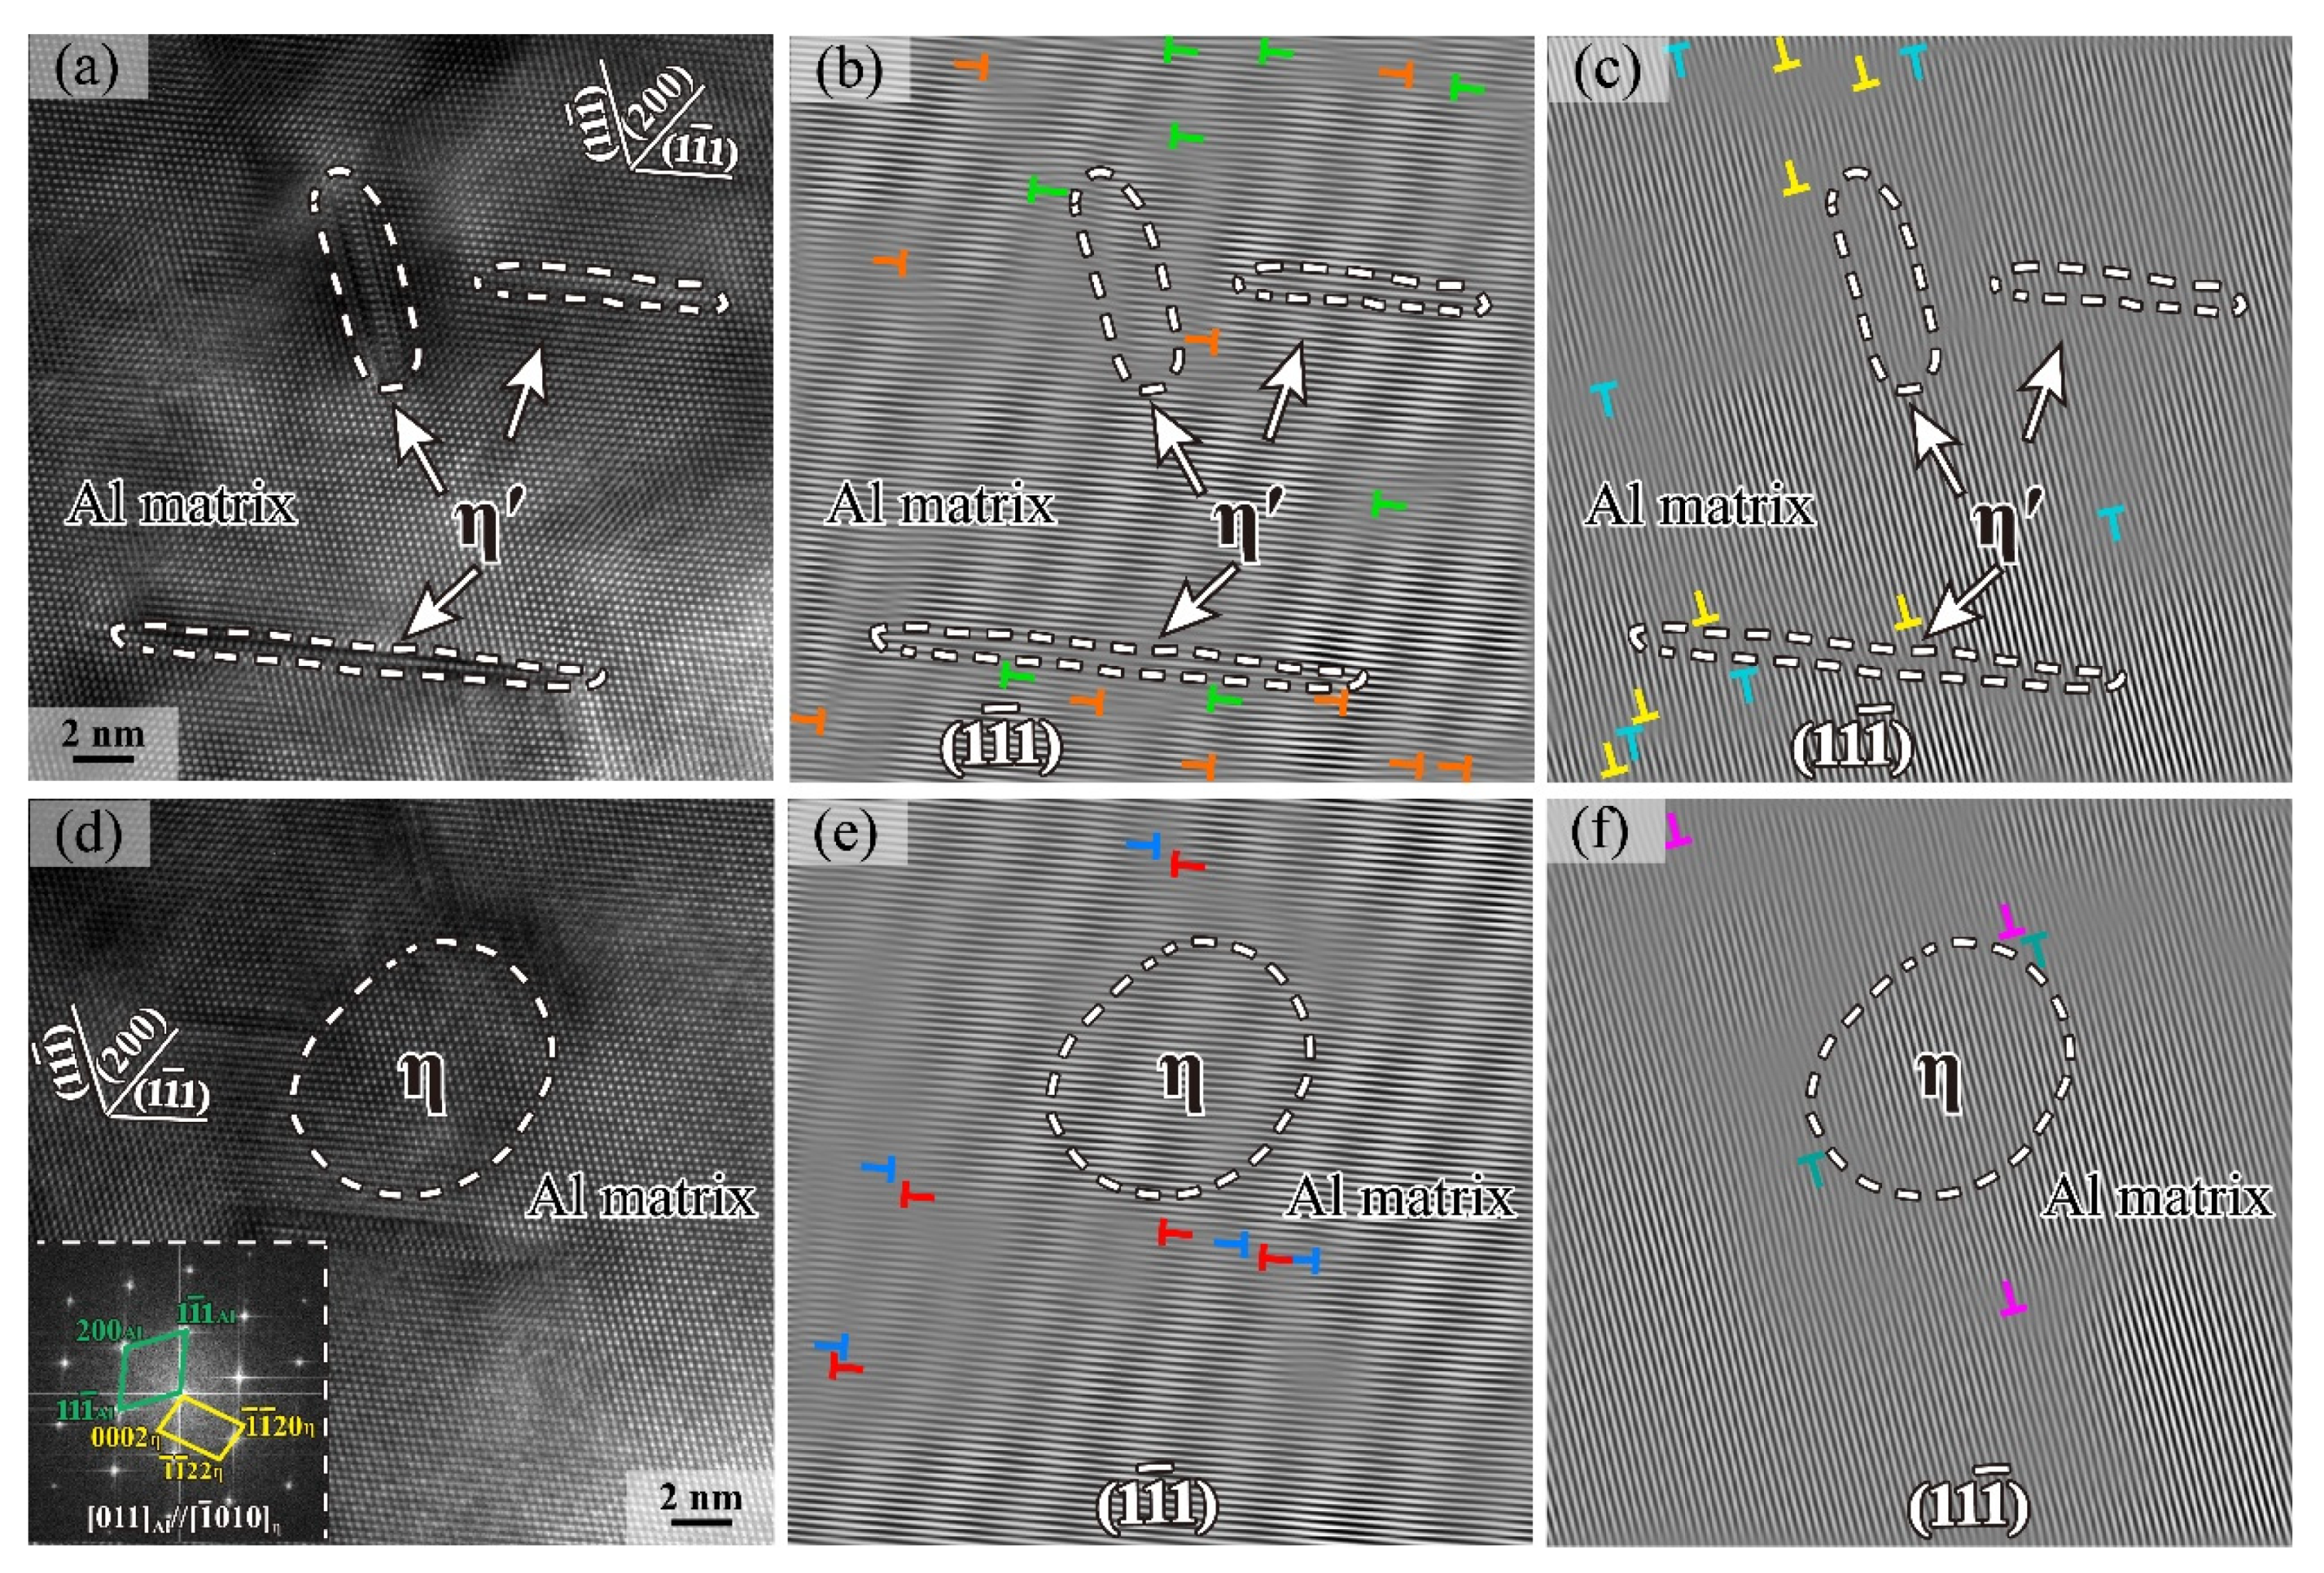
3.4. Evolutions of Precipitate Morphology

Figure 8 shows the radius distributions of all the precipitates in the different samples. The SAED patterns in Figure 5 indicate that the samples contained both η′ and η precipitates. Along the <110>Al zone axis, metastable η′ precipitates exhibit a plate-like shape while stable η precipitates are always disc-like or platelet-like in shape due to their orientations [37,38,39]. It is generally acknowledged that the size distributions of η′ and η phases have a significant effect on hardness of Al-Zn-Mg-Cu alloy [29,33,40]; hence it is necessary to obtain an enormous amount of statistical data in order to analyze the size distribution of η′ and η phases.
In the present study, over 60 HRTEM images per sample were measured. The statistical results are presented in Figure 10. For sample I (Figure 10a), the main phase is fine η′ precipitates. The radii of η′ phase are in the range of 2–13 nm, but their thickness is smaller than 3 nm, which further indicates that the morphology of the η′ phase in the sample is platelet. When the heat treatment temperature reaches 100 °C (sample II), the number of η′ phase decreases compared with that of sample I. The distribution ranges of precipitate radii and thicknesses also expand. As presented in Figure 10c–e, with the temperature increasing, the number of η′ precipitates decreases while that of the η precipitates increases gradually. Besides, both the radius and thickness of η precipitates become larger and larger. The average radius of the precipitate is consistent with the statistical result in Figure 8. The above results further confirm that there is a phase transformation from η′ to η precipitates during the heat treatment.
In order to understand the relationship between the hardness of the alloy and the morphology of the precipitates, the aspect ratio (radius-thickness ratio) of the precipitate is analyzed, which is defined as:
R ¯ = 1 n 1 n r i t i ,
where n represents the total number of precipitates, ri and ti are the radius and thickness of the precipitate i, respectively. The average aspect ratios of the precipitates in the samples I–V are shown in Figure 11. The aspect ratio–temperature curve matches well with the hardness–temperature one, which reveals that the hardness of the alloy changes along with the radius–thickness ratio. The result shows that the aspect ratio decreases continuously as the temperature increases, since more and thicker η precipitates form during the thermal exposure and tensile tests. Consequently, the hardness of the alloy also decreases.

3.5. Discussion

The usual precipitation sequence of Al-Zn-Mg-Cu alloys has been known as: super-saturated solid solution (SSSS) → GP zones → η′ phase → η phase [41,42,43]. The above results show that the main precipitates in the samples I-V are η′ and η phases. The number of η precipitates gradually increases as the temperature rises and the η phase becomes the dominant one after thermal exposure and tensile tests at 125 °C and above (Figure 5 and Figure 10).
After T7452 heat treatment, sample I contains both semi-coherent η′ and incoherent η precipitates with an average radius of 6.27 ± 1.05 nm (Figure 8a). Generally speaking, in 7xxx series Al alloys, the strengthening mechanism of either bypassing or cutting precipitates is determined primarily by the precipitate radius [40,44]. Our previous research shows that when the precipitate size reaches 3 nm, the shearing mechanism of the 7085 Al alloy transforms to the Orowan bypassing mechanism [20]. For 7085-T7452 alloy, the number fraction of precipitates greater than 3 nm in radius is 95%, hence it is difficult for dislocation to cut theses precipitates. As a result, the bypassing mechanism is a preferred choice for dislocation to strengthen the alloy. The strengthening effect Δτbypass can be described as:
Δ τ b y p a s s = α f v 1 / 2 r 1 ,
with
α = ( 3 / 2 π ) 1 / 2 b μ ,
where Δ τ b y p a s s represents the bypass stress increment, fv represents the volume fraction of the precipitates, r represents the average radius of the precipitates, b = 0.284 nm is the magnitude of the matrix Burgers vector, and μ = 42.5 GPa is the shear modulus mismatch between the matrix and the precipitates [45,46]. Hence, α is 8340 MPa·nm. So Equation (2) can be written as:
Δ τ b y p a s s = 8340 f v 1 / 2 r 1 .
HRTEM images for sample II along the <110>Al orientation in Figure 12 show the relationship between precipitates (η′ and η) and dislocations. The lenticular η′ precipitates can be observed in Figure 12a. The flank of the platelet is parallel to {111}Al matrix. As shown in Figure 12b,c, the different types of dislocations in the inverse FFT images are due to the migration and reaction of dislocations from multiple slip systems [31]. According to the result of the corresponding FFT pattern in Figure 12d, the elliptical phase (V3 or V4) was considered to be an equilibrium η precipitate. Figure 12e,f shows the corresponding inverse FFT images, which also indicate that the precipitates can strengthen the alloy after being heat treated at different temperatures through the Orowan bypassing mechanism.
Figure 8b–e shows that the average precipitate radius increases and the corresponding size distribution expands as the temperature increases. For sample II, the average precipitate radius reaches about 9.61 nm and the corresponding radius distribution is 0–20 nm. As the temperature increases to 175 °C (sample V), the average precipitate radius reaches about 37.29 nm and the size distribution expands to 20–100 nm. So, the strengthening effect can also be calculated by Equation (4), which reveals that the bypassing stress increment is in direct proportion to the precipitate volume fraction but inversely proportional to the precipitate radius. Table 3 summarizes the precipitate parameters of the specimens after various heat treatments. The results clearly show that the precipitate volume fraction decreases with increasing temperature.
Figure 13 shows the increment in the yield strength of the samples. The calculated results show that the strengthening effect is weakened continuously with the temperature increasing. So, the yield strength of the alloy decreases continuously as the temperature increases, as shown in Figure 3.
The microstructure of the Al-Zn-Mg-Cu alloy can greatly affect its electrical conductivity, which is determined by the scattering of electrons [47]. During the thermal exposure and tensile tests treatment, the phases gradually precipitate from the α-Al matrix, which could result in both reduced lattice distortion and decreased inner stress. Therefore, it is much easier for the electron motion, which could effectively improve the electrical properties of the alloy plate. As the temperature and time increase, the precipitation and growth of the phases become more sufficient, hence the electrical conductivity increases [21]. In addition, as shown in Table 3, the precipitate radius increases while both the number density and volume fraction decrease with the increasing temperature. This phenomenon could further reduce the lattice defects scattering electrons; as a result, the electrical properties of the 7085 Al alloy thick plate increase [48].
In summary, the 7085 Al alloy mainly contains η′ and η precipitates at the T7452 state, and the corresponding average size is 6.27 nm. The dominant strengthening mechanism is the Orowan bypassing precipitates. Along with the rise of thermal exposure and tensile test temperature, the number of η precipitates increases and the precipitates (η′ + η) also gradually become larger. Hence the Orowan bypassing mechanism has a stronger impact on the overall strengthening result and achieves the most noticeable influence when the temperature is 175 °C. The calculated results of the increment in yield strength show that the strengthening effect is weakened continuously as the heat treatment temperature increases. Accordingly, the yield strength decreases continuously.

4. Conclusions

In this work, the hardness, electrical conductivity and tensile properties of the 7085 Al alloy thick plate were investigated after thermal exposure and tensile tests at different temperatures, and the corresponding microstructure evolutions were studied in detail. The main conclusions can be summarized as follows:
(1) The influence of thermal exposure and tensile test temperature on the hardness and electrical conductivity is much stronger than that of the thermal exposure and tensile test duration;
(2) The strength of the alloy decreases continuously as the heat treatment temperature increases. The η′ phase transforms into the η phase constantly during the thermal exposure and tensile tests processes. The increase of the equilibrium η phase is the main reason for the decrease of strength;
(3) The transformation temperature of the η phase in the alloy from V3 and V4 variants to V1 and V2 ones is 125 °C;
(4) As thermal exposure and tensile test temperature increases, the average precipitate radius increases while the volume fraction and number density decrease. So, the strengthening effect is weakened continuously.

Author Contributions

Conceptualization, J.R.; Formal analysis, P.D.; Funding acquisition, X.L.; Investigation, P.D.; Data curation, B.H.; Methodology, Y.Y., S.L. and B.H.; Project administration, J.Z., Y.Y. and J.R.; Resources, J.Z. and J.R.; Software, S.L.; Supervision, Y.Y. and X.L.; Visualization, P.D.; Writing–original draft, J.Z.; Writing–review & editing, B.H. and X.L. All authors have read and agreed to the published version of the manuscript.

Funding

This research was funded by National Natural Science Foundation of China, grant number 51901184 and Aviation Science Foundation of China, grant number 2016ZE53046.

Institutional Review Board Statement

Not applicable.

Informed Consent Statement

Not applicable.

Data Availability Statement

The data are provided within the article.

Acknowledgments

The authors would like to acknowledge the financial support of the National Natural Science Foundation of China (51901184) and the Aviation Science Foundation of China (2016ZE53046).

Conflicts of Interest

The authors declare no conflict of interest.

References

  1. Zheng, Y.L.; Li, C.B.; Liu, S.D.; Deng, Y.L.; Zhang, X.M. Effects of homogenization time on quench sensitivity of 7085 aluminum alloy. Trans. Nonferrous Met. Soc. China 2014, 24, 2275–2281. [Google Scholar] [CrossRef]
  2. Liu, S.D.; Zhong, Q.M.; Liu, W.J.; Zhang, X.M.; Deng, Y.L. Investigation of quench sensitivity of high strength Al-Zn-Mg-Cu alloys by time-temperature-properties diagrams. Mater. Des. 2010, 31, 3116–3120. [Google Scholar] [CrossRef]
  3. Chung, T.F.; Yang, Y.L.; Shiojiri, M.; Hsiao, C.N.; Li, W.C.; Tsao, C.S.; Shi, Z.S.; Lin, J.G.; Yang, J.R. An atomic scale structural investigation of nanometer-sized η precipitates in the 7050 aluminum alloy. Acta Mater. 2019, 174, 351–368. [Google Scholar] [CrossRef]
  4. Wang, Z.J.; Wang, Z.Y.; Xiong, B.W.; Cai, C.C.; Xu, Z.F.; Yu, H. Micromechanics analysis on the microscopic damage mechanism and mechanical behavior of graphite fiber-reinforced aluminum composites under transverse tension loading. J. Alloys Compd. 2020, 815, 152459. [Google Scholar] [CrossRef]
  5. Chen, S.Y.; Chen, K.H.; Peng, G.S.; Jia, L.; Dong, P.X. Effect of heat treatment on strength, exfoliation corrosion and electrochemical behavior of 7085 aluminum alloy. Mater. Des. 2012, 35, 93–98. [Google Scholar] [CrossRef]
  6. Rometsch, P.A.; Zhang, Y.; Knight, S. Heat treatment of 7xxx series aluminum alloys-some recent developments. Trans. Nonferrous Met. Soc. China 2014, 24, 2003–2017. [Google Scholar] [CrossRef]
  7. Shi, Y.J.; Pan, Q.L.; Li, M.J.; Liu, Z.M.; Huang, Z.Q. Microstructural evolution during homogenization of DC cast 7085 aluminum alloy. Trans. Nonferrous Met. Soc. China 2015, 25, 3560–3568. [Google Scholar] [CrossRef]
  8. Luong, H.; Hill, M.R. The effects of laser peening on high-cycle fatigue in 7085-T7651 sluminum alloy. Mater. Sci. Eng. A 2008, 477, 208–216. [Google Scholar] [CrossRef]
  9. Nie, B.H.; Liu, P.Y.; Zhou, T.T. Effects of compositions on the quenching sensitivity of 7050 and 7085 alloys. Mater. Sci. Eng. A 2016, 667, 106–114. [Google Scholar] [CrossRef]
  10. Xu, W.F.; Luo, Y.X.; Fu, M.W. Microstructure evolution in the conventional single side and bobbin tool fraction stir welding of thick rolled 7085-T7452 aluminum alloy. Mater. Charact. 2018, 138, 48–55. [Google Scholar] [CrossRef]
  11. Xiao, Y.P.; Pan, Q.L.; Li, W.B.; Liu, X.Y.; He, Y.B. Influence of retrogression and re-aging treatment on corrosion behavior of an Al-Zn-Mg-Cu alloy. Mater. Des. 2011, 32, 2149–2156. [Google Scholar] [CrossRef]
  12. Xu, W.F.; Luo, Y.X.; Zhang, W.; Fu, M.W. Comparative study on local and global mechanical properties of bobbin tool and conventional friction stir welded 7085-T7452 aluminum thick plate. J. Mater. Sci. Technol. 2018, 34, 173–184. [Google Scholar] [CrossRef]
  13. Wang, Y.C.; Cao, L.F.; Wu, X.D.; Tong, X.; Liao, B.; Huang, G.J.; Wang, Z.A. Effect of retrogression treatments on microstructure, hardness and corrosion behaviors of aluminum alloy 7085. J. Alloys Compd. 2021, 814, 1–10. [Google Scholar] [CrossRef]
  14. Ortiz, D.; Brown, J.; Abdelshehid, M.; DeLeon, P.; Dalton, R.; Mendez, L.; Soltero, J.; Pereira, M.; Hahn, M.; Lee, E.; et al. The effects of prolonged thermal exposure on the mechanical properties and fracture toughness of C458 aluminum-lithium alloy. Eng. Fail. Anal. 2006, 13, 170–180. [Google Scholar] [CrossRef]
  15. Jabra, J.; Romios, M.; Lai, J.; Lee, E.; Setiawan, M.; Lee, E.W.; Witters, J.; Abourialy, N.; Ogren, J.R.; Clark, R.; et al. The effects of thermal exposure on the mechanical properties of 2099-T6 die forgings, 2099-T83 extrusions, 7075-T7651 plate, 7085-T7452 die forgings, 7085-T7651 plate, and 2397-T87 plate aluminum alloys. J. Mater. Eng. Perform. 2006, 15, 601–607. [Google Scholar] [CrossRef]
  16. Sauvage, X.; Bobruk, E.V.; Murashkin, M.Y.; Nasedkina, Y.; Enikeev, N.A.; Valiev, R.Z. Optimization of electrical conductivity and strength combination by structure design at the nanoscale in Al-Mg-Si alloys. Acta Mater. 2015, 98, 355–366. [Google Scholar] [CrossRef]
  17. Lee, E.W.; Oppenheim, T.; Robison, K.; Aridkahari, B.; Neylan, N.; Gebreyesus, D.; Richardson, M.; Arzate, M.; Bove, C.; Iskandar, M.; et al. The effect of thermal exposure on the electrical conductivity and static mechanical behavior of several age hardenable aluminum alloys. Eng. Fail. Anal. 2017, 14, 1538–1549. [Google Scholar] [CrossRef]
  18. Chen, S.Y.; Chen, K.H.; Peng, G.S.; Chen, X.H.; Ceng, Q.H. Effect of heat treatment on hot deformation behavior and microstructure evolution of 7085 aluminum alloy. J. Alloys Compd. 2012, 537, 338–345. [Google Scholar] [CrossRef]
  19. Liu, S.D.; Li, Q.; Lin, H.Q.; Sun, L.; Long, T.; Ye, L.Y.; Deng, Y.L. Effect of quench-induced precipitation on microstructure and mechanical properties of 7085 aluminum alloy. Mater. Des. 2017, 132, 119–128. [Google Scholar] [CrossRef]
  20. Dai, P.; Luo, X.; Yang, Y.Q.; Kou, Z.D.; Huang, B.; Wang, C.; Zang, J.X.; Ru, J.G. Nano-scale precipitate evolution and mechanical properties of 7085 aluminum alloy during thermal exposure. Mater. Sci. Eng. A 2018, 729, 411–422. [Google Scholar] [CrossRef]
  21. Dai, P.; Luo, X.; Yang, Y.Q.; Kou, Z.D.; Huang, B.; Zang, J.X.; Ru, J.G. Thermal stability analysis of a lightweight Al-Zn-Mg-Cu alloy by TEM and tensile tests. Mater. Charact. 2019, 153, 271–283. [Google Scholar] [CrossRef]
  22. Berg, L.K.; GjØnnes, J.; Hansen, V.; Li, X.Z.; Knutson-Wedel, M.; Waterloo, G.; Schryvers, D.; Wallenberg, L.R. GP-Zones in Al-Zn-Mg alloys and their role in artificial aging. Acta Mater. 2001, 49, 3443–3451. [Google Scholar] [CrossRef]
  23. Stiller, K.; Warren, P.J.; Hansen, V.; Angenete, J.; Gjønnes, J. Investigation of precipitation in an Al-Zn-Mg alloy after two-step ageing treatment at 100 °C and 150 °C. Mater. Sci. Eng. A 1999, 270, 55–63. [Google Scholar] [CrossRef]
  24. Engdhl, T.; Hansen, V.; Warren, P.J.; Stiller, K. Investigation of fine scale precipitates in Al-Zn-Mg alloys after various heat treatments. Mater. Sci. Eng. A 2002, 327, 59–64. [Google Scholar] [CrossRef]
  25. Sha, G.; Cerezo, A. Early-stage precipitation in Al-Zn-Mg-Cu alloy (7050). Acta Mater. 2004, 52, 4503–4516. [Google Scholar] [CrossRef]
  26. Ringer, S.P.; Hono, K. Microstructural evolution and age hardening in aluminum alloys: Atom probe field-ion microscopy and transmission electron microscopy studies. Mater. Charact. 2000, 44, 101–131. [Google Scholar] [CrossRef]
  27. Li, X.Z.; Hansen, V.; GjØnnes, J.; Wallenberg, L.R. HREM study and structure modeling of the η′ phase, the hardening precipitates in commercial Al-Zn-Mg alloys. Acta Mater. 1999, 47, 2651–2659. [Google Scholar] [CrossRef]
  28. Komura, Y.; Tokunaga, K. Structural studies of stacking variants in Mg-base Friauf-Laves phases. Acta Cryst. B 1980, 36, 1548–1554. [Google Scholar] [CrossRef]
  29. Yang, X.B.; Liu, J.Z.; Chen, J.H.; Wan, C.Y.; Fang, L.; Liu, P.; Wu, C.L. Relationship between the strengthening effect and the morphology of precipitates in Al-7.4Zn-1.7Mg-2.0Cu alloy. Acta Metall. Sin. 2014, 27, 1070–1077. [Google Scholar] [CrossRef] [Green Version]
  30. Bendo, A.; Matsuda, K.; Lee, S.; Nishimura, K.; Nunomura, N.; Toda, H.; Yamaguchi, M.; Tsure, T.; Hirayama, K.; Shimizu, K.; et al. Atomic scale HAADF-STEM study of η′ and η1 phases in peak-aged Al-Zn-Mg alloys. J. Mater. Sci. 2018, 53, 4598–4611. [Google Scholar] [CrossRef]
  31. Chen, Y.X.; Yang, Y.Q.; Feng, Z.Q.; Huang, B.; Luo, X.; Zhang, W. The depth-dependent gradient deformation bands in a sliding friction treated Al-Zn-Mg-Cu alloy. Mater. Charact. 2017, 132, 269–279. [Google Scholar] [CrossRef]
  32. Yang, W.C.; Ji, S.X.; Wang, M.P.; Li, Z. Precipitation behavior of Al-Zn-Mg-Cu alloy and diffraction analysis from η′ precipitates in four variants. J. Alloys Compd. 2014, 610, 623–629. [Google Scholar] [CrossRef] [Green Version]
  33. Rout, P.K.; Ghosh, M.M.; Ghosh, K.S. Microstructure, mechanical and electrochemical behavior of a 7017 AL-Zn-Mg alloy of different tempers. Mater. Charact. 2015, 104, 49–60. [Google Scholar] [CrossRef]
  34. Dumont, M.; Lefebvre, W.; Doisneau-Cottignies, B.A. Deschamps, Characterisation of the composition and volume fraction of η′ and η precipitates in an Al–Zn–Mg alloy by a combination of atom probe, small-angle X-ray scattering and transmission electron microscopy. Acta Mater. 2005, 53, 2881–2892. [Google Scholar] [CrossRef]
  35. Dai, P.; Luo, X.; Yang, Y.Q.; Kou, Z.D.; Huang, B.; Zang, J.X.; Ru, J.G. High temperature tensile properties, fracture behaviors and nanoscale precipitate variation of an Al-Zn-Mg-Cu alloy. Prog. Nat. Sci. Mater. Int. 2020, 30, 63–73. [Google Scholar] [CrossRef]
  36. Deschamps, A.; Fribourg, G.; Bréchet, Y.; Chemin, J.L.; Hutchinson, C.R. In situ evaluation of dynamic precipitation during plastic straining of an Al-Zn-Mg-Cu alloy. Acta Mater. 2012, 60, 1905–1916. [Google Scholar] [CrossRef]
  37. Sha, G.; Wang, Y.B.; Liao, X.Z.; Duan, Z.C.; Ringer, S.P.; Langdon, T.G. Influence of equal-channel angular pressing on precipitation in an Al-Zn-Mg-Cu alloy. Acta Mater. 2009, 57, 3123–3132. [Google Scholar] [CrossRef]
  38. Kverneland, A.; Hansen, V.; Vincent, R.; GjØnnes, K.; GjØnnes, J. Structure analysis of embedded nano-sized particles by precession electron diffraction. η′-precipitate in an Al-Zn-Mg alloy as example. Ultramicroscopy 2006, 106, 492–502. [Google Scholar] [CrossRef]
  39. Godard, D.; Archambault, P.; Aeby-Gautier, E.; Lapasset, G. Precipitation sequences during quenching of the AA 7010 alloy. Acta Mater. 2002, 50, 2319–2329. [Google Scholar] [CrossRef]
  40. Wen, K.; Fan, Y.Q.; Wang, G.J.; Jin, L.B.; Li, X.W.; Li, Z.H.; Zhang, Y.A.; Xiong, B.Q. Aging behavior and precipitate characterization of a high Zn-containing Al-Zn-Mg-Cu alloy with various tempers. Mater. Des. 2016, 101, 16–23. [Google Scholar] [CrossRef]
  41. Deschamps, A.; Brechet, Y. Influence of predeformation and ageing of an Al-Zn-Mg alloy-II. Modeling of precipitation kinetics and yield stress. Acta Mater. 1999, 47, 293–305. [Google Scholar] [CrossRef]
  42. Liu, J.Z.; Chen, J.H.; Yuan, D.W.; Wu, C.L.; Zhu, J.; Cheng, Z.Y. Fine precipitation scenarios of AlZnMg(Cu) alloys revealed by advanced atomic-resolution electron microscopy study part I: Structure determination of the precipitates in AlZnMg(Cu) alloys. Mater. Charact. 2015, 99, 277–286. [Google Scholar] [CrossRef]
  43. Garcia-Garcia, A.L.; Dominguez-Lopez, I.; Lopez-Jimenez, L.; Barceinas-Sanchez, J.D. Comparative quantification and statistical analysis of η′ and η precipitates in aluminum alloy AA7075-T7651 by TEM and AFM. Mater. Charact. 2014, 87, 116–124. [Google Scholar] [CrossRef]
  44. Chen, Y.X.; Yang, Y.Q.; Feng, Z.Q.; Huang, B.; Luo, X. Surface gradient nanostructures in high speed machined 7055 aluminum alloy. J. Alloys Compd. 2017, 726, 367–377. [Google Scholar] [CrossRef]
  45. Schlesier, C.; Nembach, E. Strengthening of aluminum-lithium alloys by long-range ordered δ’ precipitates. Acta Metall. Mater. 1995, 43, 3983–3990. [Google Scholar] [CrossRef]
  46. Christopher, B.M.; David, C.D.; David, N.S. Coarsening resistance at 400 °C of precipitation-strengthened Al-Zr-Sc-Er alloys. Acta Mater. 2011, 59, 7029–7042. [Google Scholar]
  47. Valiev, R.Z.; Murashkin, M.Y.; Sabirov, I. A nanostructural design to produce high-strength Al alloys with enhanced electrical conductivity. Scr. Mater. 2014, 76, 13–16. [Google Scholar] [CrossRef]
  48. Rositter, P.L. The Elctrical Resistivity of Metals and Alloys; Cambridge University Press: Cambridge, UK, 2003. [Google Scholar]
Figure 1. Effects of thermal exposure and tensile test temperature on hardness (a) and electrical conductivity (b) of 7085-T74 Al alloy.
Metals 11 01483 g001
Figure 2. Effects of thermal exposure and tensile test time on hardness (a) and electrical conductivity (b) of 7085-T74 Al alloy.
Metals 11 01483 g002
Figure 3. (a) Mechanical properties of the 7085 Al alloy after heat treatment at different temperatures, (b) tensile strength, (c) elongation and reduction of area.
Metals 11 01483 g003
Figure 4. Bright-field TEM images of 7085 Al alloy plate after different heat treatment processes: (a) sample I (25 °C), (b) sample II (100 °C), (c) sample III (125 °C), (d) sample IV (150 °C), and (e) sample V (175 °C).
Metals 11 01483 g004
Figure 5. (a) Schematic representation of the (001)Al pattern and SAED patterns along (001)Al zone axis of the 7085 alloy after various heat treatments: (b) sample I (25 °C), (c) sample II (100 °C), (d) sample III (125 °C), (e) sample IV (150 °C), and (f) sample V (175 °C).
Metals 11 01483 g005
Figure 6. HRTEM images of the precipitates viewed along <110>Al orientation in 7085 alloy after various heat treatments: (a) sample I (25 °C), (b) sample II (100 °C), (c) sample III (125 °C), (d) sample IV (150 °C), (e) sample V (175 °C), (f) corresponding FFT pattern of η phase in (e), (g) is from the yellow dashed frame in (i), (h) is the corresponding inverse FFT image of (e), and (i) is from the white solid frame in (h).
Metals 11 01483 g006
Figure 7. Schematic illustrations showing four types of η variants V1-4 on {111}Al. (a) The three-dimensional view, and (b) the projection from [110]Al direction.
Metals 11 01483 g007
Figure 8. Precipitate radius distributions for the 7085 alloy after various heat treatments: (a) sample I (25 °C), (b) sample II (100 °C), (c) sample III (125 °C), (d) sample IV (150 °C), and (e) sample V (175 °C).
Metals 11 01483 g008
Figure 9. Evolutions of the precipitate parameters of the samples after various heat treatments: (a) precipitate volume fraction, and (b) precipitate number density.
Metals 11 01483 g009
Figure 10. Distributions of the thickness versus radius of the precipitates in the 7085 alloy after various heat treatments: (a) sample I (25 °C), (b) sample II (100 °C), (c) sample III (125 °C), (d) sample IV (150 °C), and (e) sample V (175 °C). The orange points correspond to the average thickness and radius of the precipitates.
Metals 11 01483 g010
Figure 11. Comparison of the average aspect ratio–temperature curve with the hardness-temperature curve.
Metals 11 01483 g011
Figure 12. (a) HRTEM image of η′ precipitate in sample II (100 °C), (b,c) corresponding inverse FFT patterns of (a), (d) HRTEM image of η precipitate in sample II (100 °C), (e,f) corresponding inverse FFT patterns of (d). Dislocations with different Burgers vectors are labeled by different colored ‘T’ symbols.
Metals 11 01483 g012
Figure 13. Increment in yield strength of the samples after thermal exposure and tensile tests at different temperatures.
Metals 11 01483 g013
Table 1. Thermal exposure and tensile test conditions of 7085-T7452 Al alloy plate.
TableTensile Test Temperature/°C
Temperature/°CTime/h
100100, 500, 1000100
125100, 500, 1000125
150100, 500, 1000150
175100, 500, 1000175
Table 2. The five representative samples of the 7085 Al alloy chosen for the tests.
Sample No.Thermal Exposure ConditionTensile Test Temperature
I/25 °C
II100 °C/500 h100 °C
III125 °C/500 h125 °C
IV150 °C/500 h150 °C
V175 °C/500 h175 °C
Table 3. The precipitate parameters of the samples after different heat treatment processes.
SamplePrecipitate TypeAverage Precipitate Radius/nmPrecipitate Radius DistributionPrecipitate Volume Fraction/%Precipitate Number Density/1018 m−3Aspect Ratio
Iη + η′6.27 ± 1.051–142.0419,7507.75
IIη + η′9.61 ± 0.940–241.3536306.33
IIIη + η′17.42 ± 2.186–480.331495.38
IVη + η′29.58 ± 3.7915–600.087.374.58
Vη + η′37.29 ± 4.7620–1000.062.763.20
Publisher’s Note: MDPI stays neutral with regard to jurisdictional claims in published maps and institutional affiliations.

