
AZ31 Sheet Forming by Clustering Ball Spinning-Analysis of Damage Evolution Using a Modified GTN Model

1
School of Materials Science and Engineering, Jilin University, Changchun 130025, China
2
Institute of Roll Forging Research, Jilin University, Changchun 130025, China
*
Author to whom correspondence should be addressed.
Metals 2022, 12(2), 220; https://0-doi-org.brum.beds.ac.uk/10.3390/met12020220
Submission received: 17 December 2021
/
Revised: 14 January 2022
/
Accepted: 17 January 2022
/
Published: 25 January 2022
(This article belongs to the Topic Processing, Analysis, Modelling and Mechanics of Materials and Structures)
Abstract
:Clustering ball spinning (CBS) forming is a novel approach to manufacturing a complex curved surface. In order to explore the forming limit of magnesium alloy in the CBS forming process, the modified GTN model was incorporated into the FE simulation to analyze the damage evolution. The theoretical analyses are conducted to investigate the deformation mechanism and to explore the stress state in the CBS forming process. The numerical results show that the modified GTN model can predict the result more accurately compared with the standard GTN model, and the damage parameters for GTN model are determined by the experiments. Besides, the forming limit of AZ31 magnesium alloy can be improved by CBS forming method. To explore the reason for the increased forming limit, the microstructure of curved surface was tested by electron backscattered scattering detection (EBSD). The results demonstrate that the deformation of magnesium alloy plate by the CBS method is dominated initially by the extension twinning, and non-basal slip systems are activated with the development of forming process.
1. Introduction
Clustering ball spinning (CBS) forming is a novel forming process used to produce complex curved surfaces. Compared with the traditional press forming process using male and female die, CBS forming exhibits its inherent advantages and flexibility such as simple tooling, low forming force, and improved mechanical properties. It can be seen from Figure 1 that the CBS method manufactures curved metal workpieces with discrete rigid balls instead of female die. Hu et al. [1,2] had demonstrated that CBS method has great forming performance for aluminum alloys, and proposed a multi-layer rigid ball (MLRB) model that can simulate the process of CBS accurately. Although CBS forming had high precision at room temperature, the theoretical study and the forming limit of magnesium alloy in CBS forming remained to be solved. There are highly non-linear tooling/sheet interactions and complex local stress states in the CBS forming process. For low-ductility materials such as magnesium alloy, cracking often took place during the CBS forming process due to plastic deformation surpassing the general limit of flow formability.
The FE simulation combined with ductile fracture criteria is an efficient way to analyze the ductile fracture of metal [3,4]. The ductile fracture criteria are divided into coupled and uncoupled models by defining whether the damage variable is included in the material constitutive model. The simulation results of uncoupled fracture criteria such as Rice–Tracey, McClintock and Cockcroft–Lathan are highly dependent on the size of mesh [5]. The other category is coupled ductile fracture criteria which couples the influence of plastic damage into the material constitutive model such as the Lemaitre model and Gurson–Tvergaard–Needleman (GTN) damage model [6]. The typical model is the GTN damage model which attributes the ductile failure process to micro voids nucleation, growth and coalescence [7]. Yan et al. [8] proved the GTN damage model is valid for silicon steel during the rolling process. Riedel et al. [9] supposed Gurson model had limitations arising from the fact that only spherical voids were considered and the model was generally too stable. In fact, the original GTN model is not appropriate for predicting damage evolution well under low stress triaxiality [10] and negative stress triaxiality. To overcome the limitation of stress triaxiality, the standard GTN constitutive model had been improved [11,12,13,14,15,16]. Nahshon et al. [17] modified the GTN model by introducing a phenomenological extension to the porosity evolution equation. SUN et al. [18] applied modified GTN model to analyze the ductile damage and failure behavior of steel sheet with edge defects under multi-pass cold rolling. In this paper, the GTN model modified by Nahshon and Hutchinson was incorporated into FE software (Abaqus) by user-defined material subroutine (VUMAT).
In order to optimize the CBS forming process, it is necessary to analyze and predict the forming limit of sheet during the forming process. In the paper, a complex curved surface with the AZ31 sheet was fabricated by the CBS forming process and the forming limit of magnesium was predicted by FE model cooperated with modified GTN model.
2. Materials and Methods
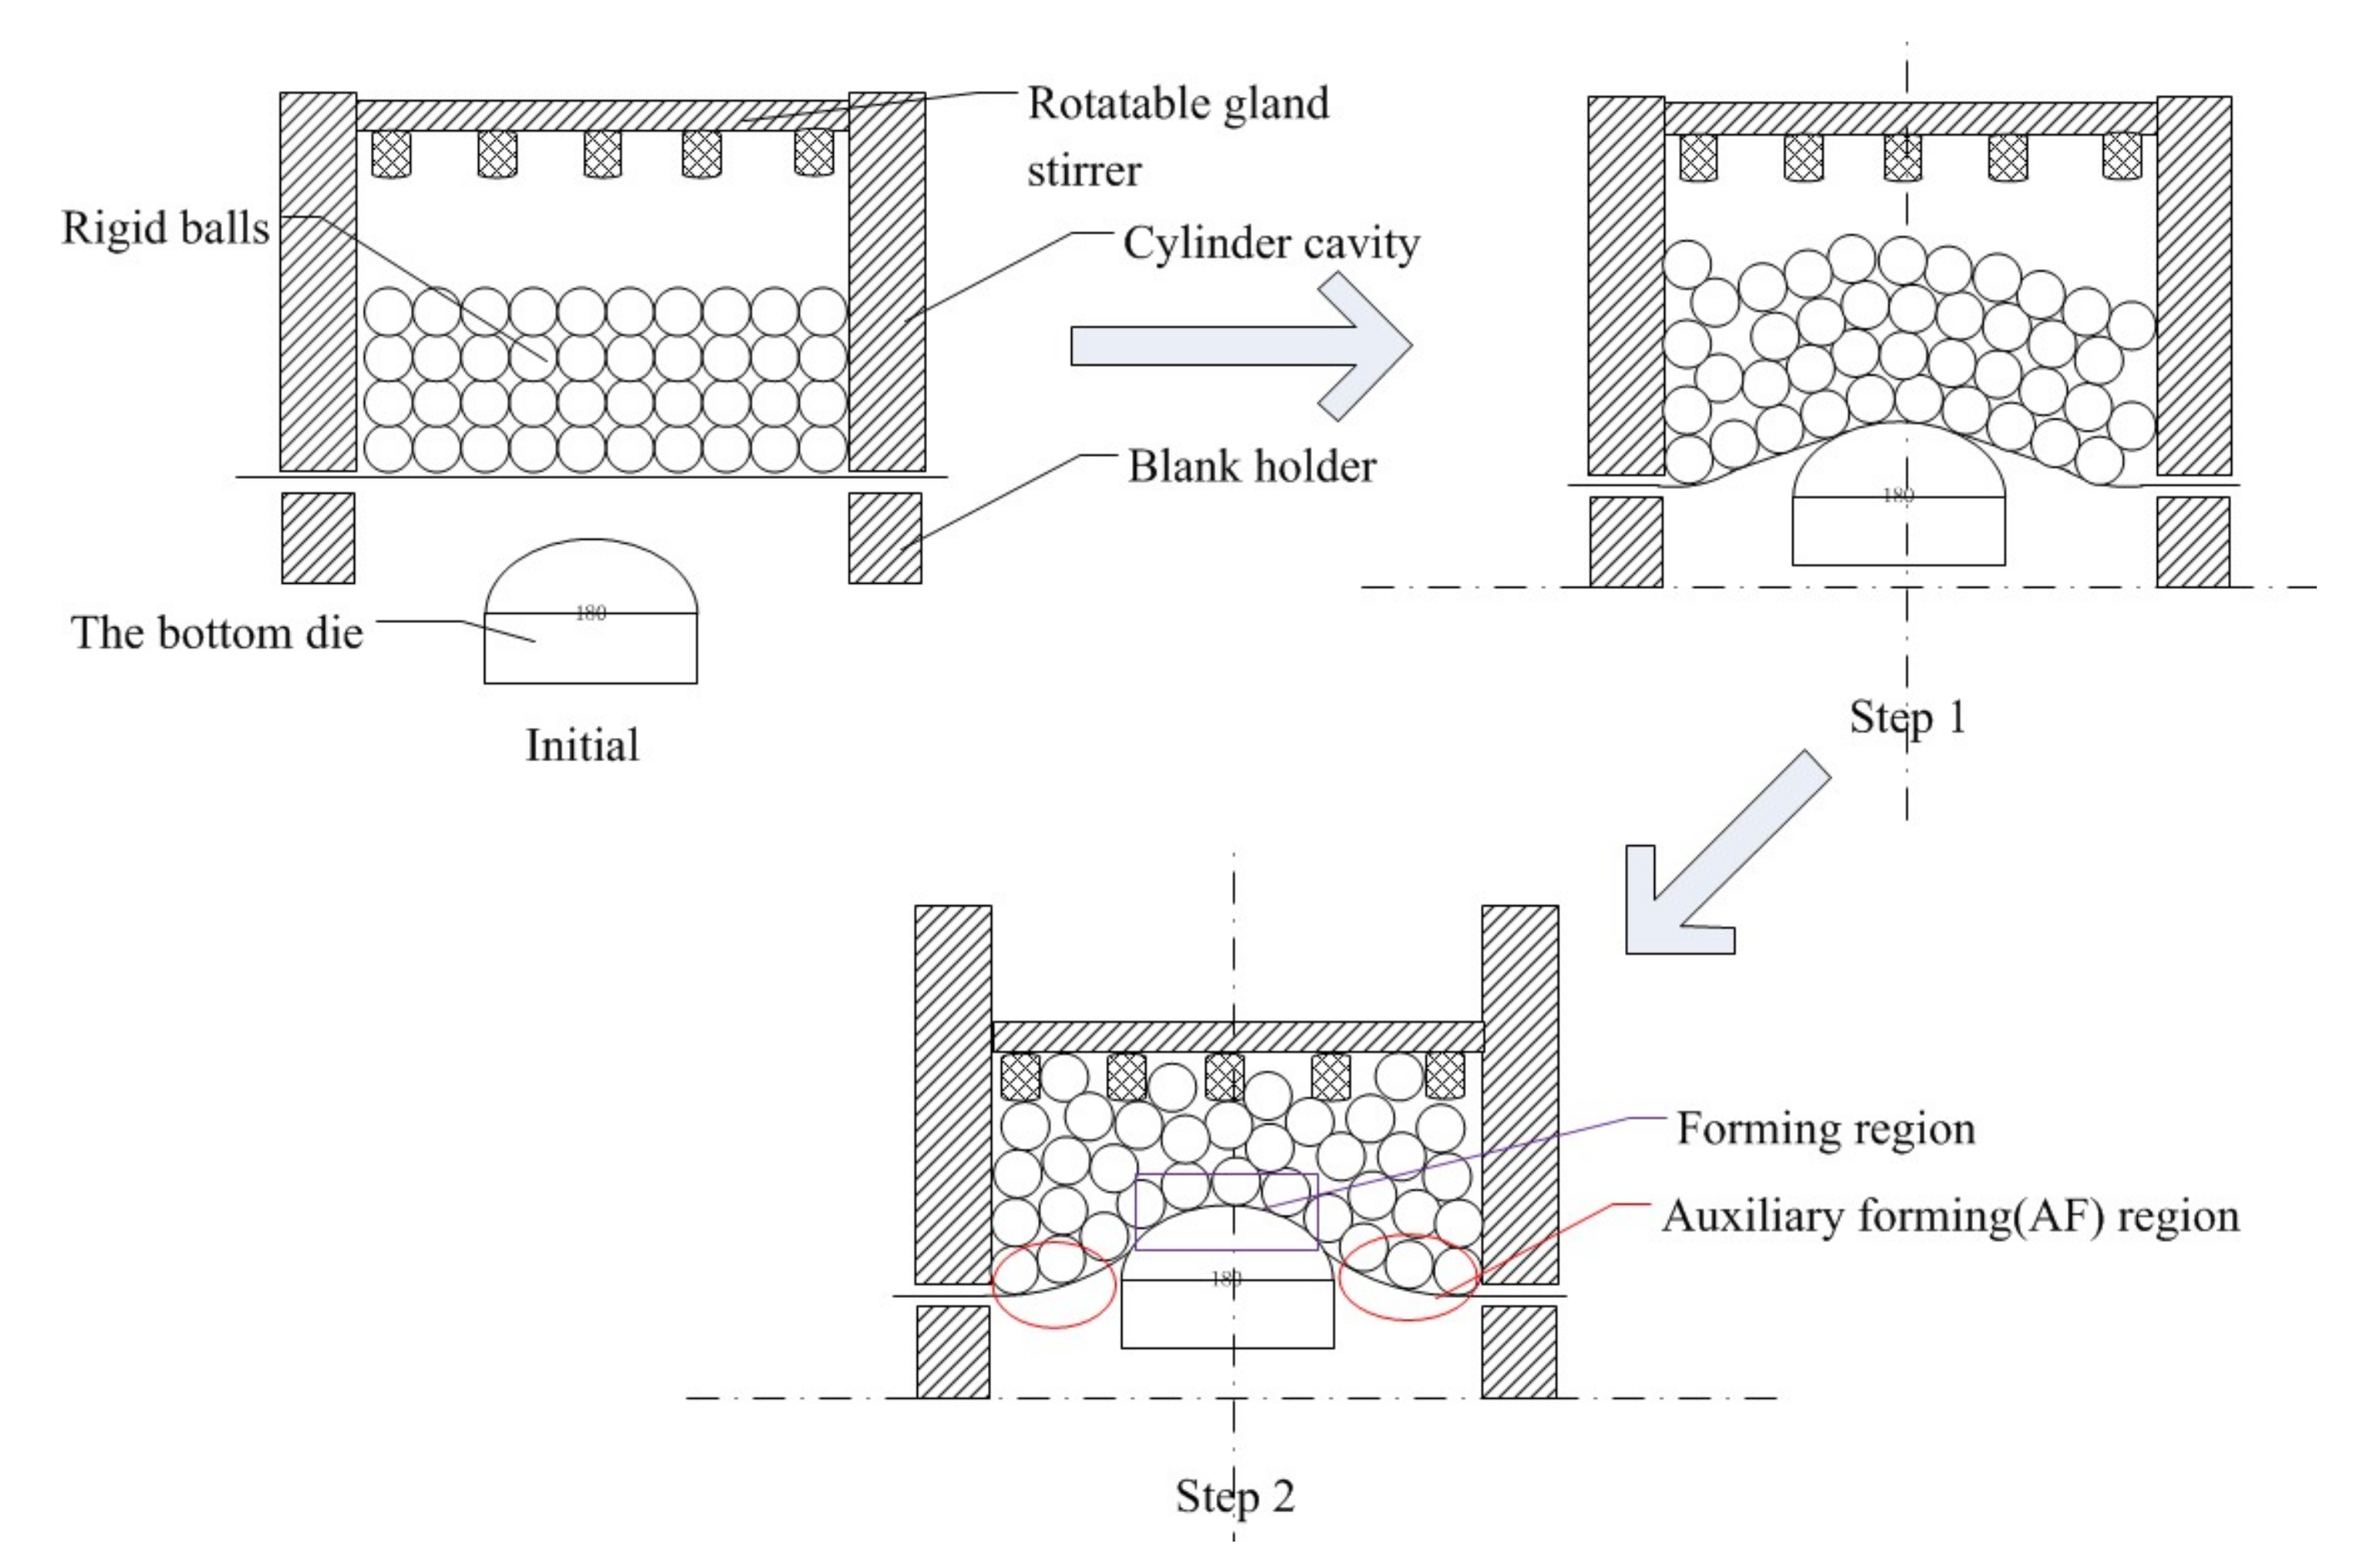
In this experiment, the commercial magnesium alloy AZ31 with the size of 200 mm × 200 mm × 1.5 mm was employed, and the compositions were listed in Table 1. The forming device of CBS is shown in Figure 1, and fundamental parameters are listed in Table 2. As shown in Figure 2, the forming device included the following sections: rotatable gland stirrer, rigid balls, cylinder cavity, blank holder, and the bottom die. The forming process of AZ31 sheet was shown in Figure 2, and the detailed experimental steps were shown as follows: Prepared magnesium alloy sheet was placed between the blank holder and the cylinder cavity (applied with 2.5 MPa pressure), while allowing the rotatable gland stirrer to contact with rigid balls and the bottom die to contact with the magnesium alloy sheet. It can be seen from Figure 2 that the forming process is divided into two steps: Step 1 was that the bottom die rose while the rotatable gland stirrer was not moved and rotated. Step 2 was the bottom die rose while the rotatable gland stirrer was moved down and rotated. It can be known that rigid balls have a complicated influence on the sheet forming, which needs further analysis by theoretical formula and FE simulation.
3. Mechanical Analysis and Constitutive Model
3.1. Contact Stress
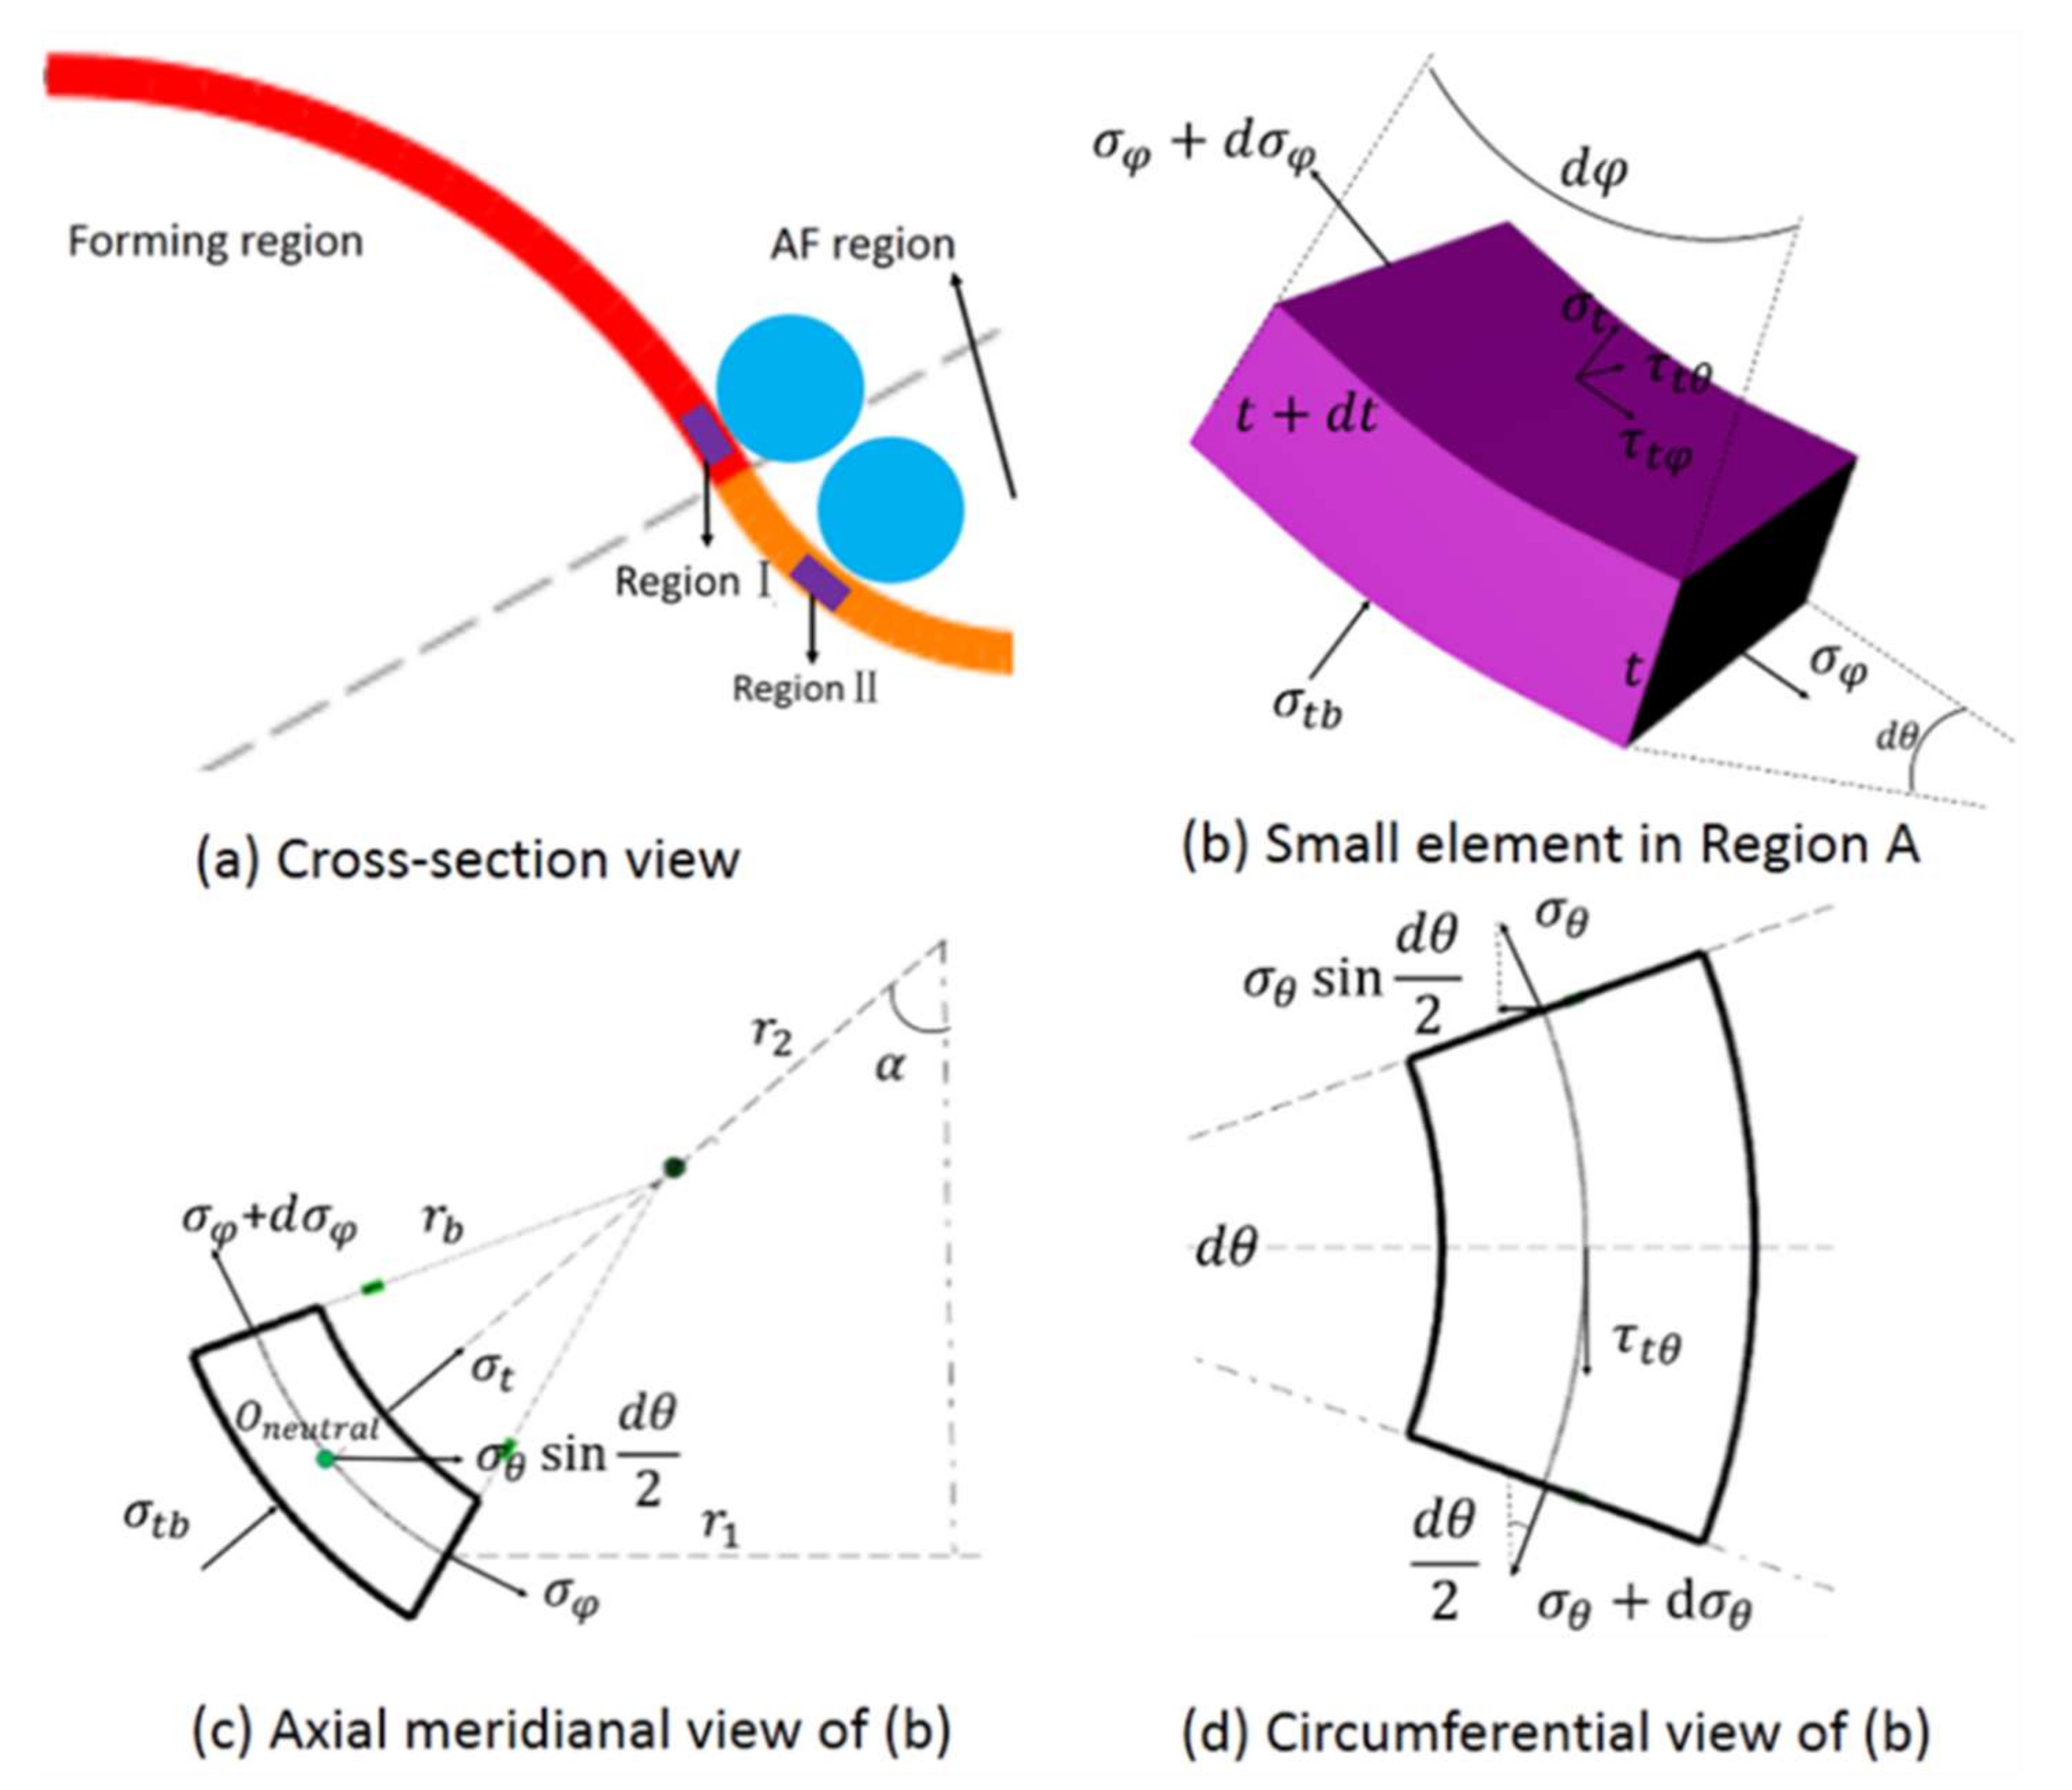
In order to explore the stress state at the boundary of the die, membrane analysis of the contact stresses on the neutral surface was conducted to develop a theoretical model. Silva et al. [19] proposed a theoretical model for stress analysis based on membrane approach to address the material deformation in ISF process. Chang et al. [20] updated the membrane theory by taking into account the hardening of the material. In the present work, membrane analysis was applied to the CBS process. Figure 3a showed the two contact regions between rigid balls and the sheet in the forming regions and AF regions. Figure 3b showed the stress components on a small element in region A. As shown in Figure 3c,d, along the directions of thickness t, circumference and meridian , the corresponding stress components ,,, were considered in the membrane analysis. represents the opposite stress of the rigid ball on the sheet, while defined as the stress of the bottom die acting on the sheet. represents the thickness of the sheet, and represents the radius of the rigid ball. The assumptions of the theoretical analysis were summarized as,
(1) Bending effect is neglected as the sheet thickness is much smaller than the tool radius.
(2) Shear stress and are taken into account due to the shearing effect on the formability, while the other shear stress is neglected because it has no obvious effect on the plastic deformation.
(3) is related to and not related to : the through-thickness stress is linearly distributed along the thickness direction and evenly distributed along the circumferential direction.
Along the circumferential direction, the force equilibrium equation can be expressed as,
In addition can be simplified by neglecting higher order terms and assuming.,
Resolving the force equilibrium along the thickness direction,
In addition can be simplified by,
Considering the Levy-Mises constitutive equation in plane strain, the equivalent stress can be calculated by,
By combining the above equations, the following equations can be derived as,
The hydrostatic stress of the contact zone can be calculated as,
The stress triaxiality of the sheet in region I during the CBS process can be obtained as:
The stress component can be neglected in region II and the stress triaxiality of the sheet can be obtained as,
From Equations (9) and (10), it can be seen that the plate is in a lower stress triaxiality and the stress triaxiality decreased with the radius of rigid balls decreasing. In order to solve the problem that the GTN damage model cannot accurately describe material damage at low stress triaxiality, Nahshon and Hutchinson introduced a phenomenological extension to the porosity evolution equation.
3.2. Constitutive Model
Gurson proposed a continuous damage model by accounting the hydrostatic stress and the model was modified by Tvergaard and Needleman in order to encapsulate the nucleation, growth and coalescence of voids. The damage law can be expressed as follows:
where the macroscopic Von-Mises stress is defined as, , , .
The Cauchy stress tensor is represented by , is the hydraulic stress, is the deviatoric stress, is the identity tensor and is a function of the equivalent plastic strain.
Nahshon and Huchinson modified the damage law to accommodate the damage contribution from shear since it could play a major role in the forming process.
The evolution of porosity and shear damage is given in Equations (12) and (13). is the void volume rate due to the nucleation of new voids. Once nucleated, porosity growth is determined by the rate of the plastic strain, while is determined by the shear deformation. The shear damage evolution is determined by damage parameter .
The effective volume fraction in the Gurson potential function is described by the following equation.
where denotes the shear damage at complete shear failure.
where = det(s) represents the third invariant of stress state, A is a function of the equivalent plastic strain, is a function determined by the parameter .
Yield stress material is considered as a dependent variable of plastic strain, strain rate and temperature as given in Equation (17).
3.3. Parameters Identification
3.3.1. Elastic-Plastic Behavior
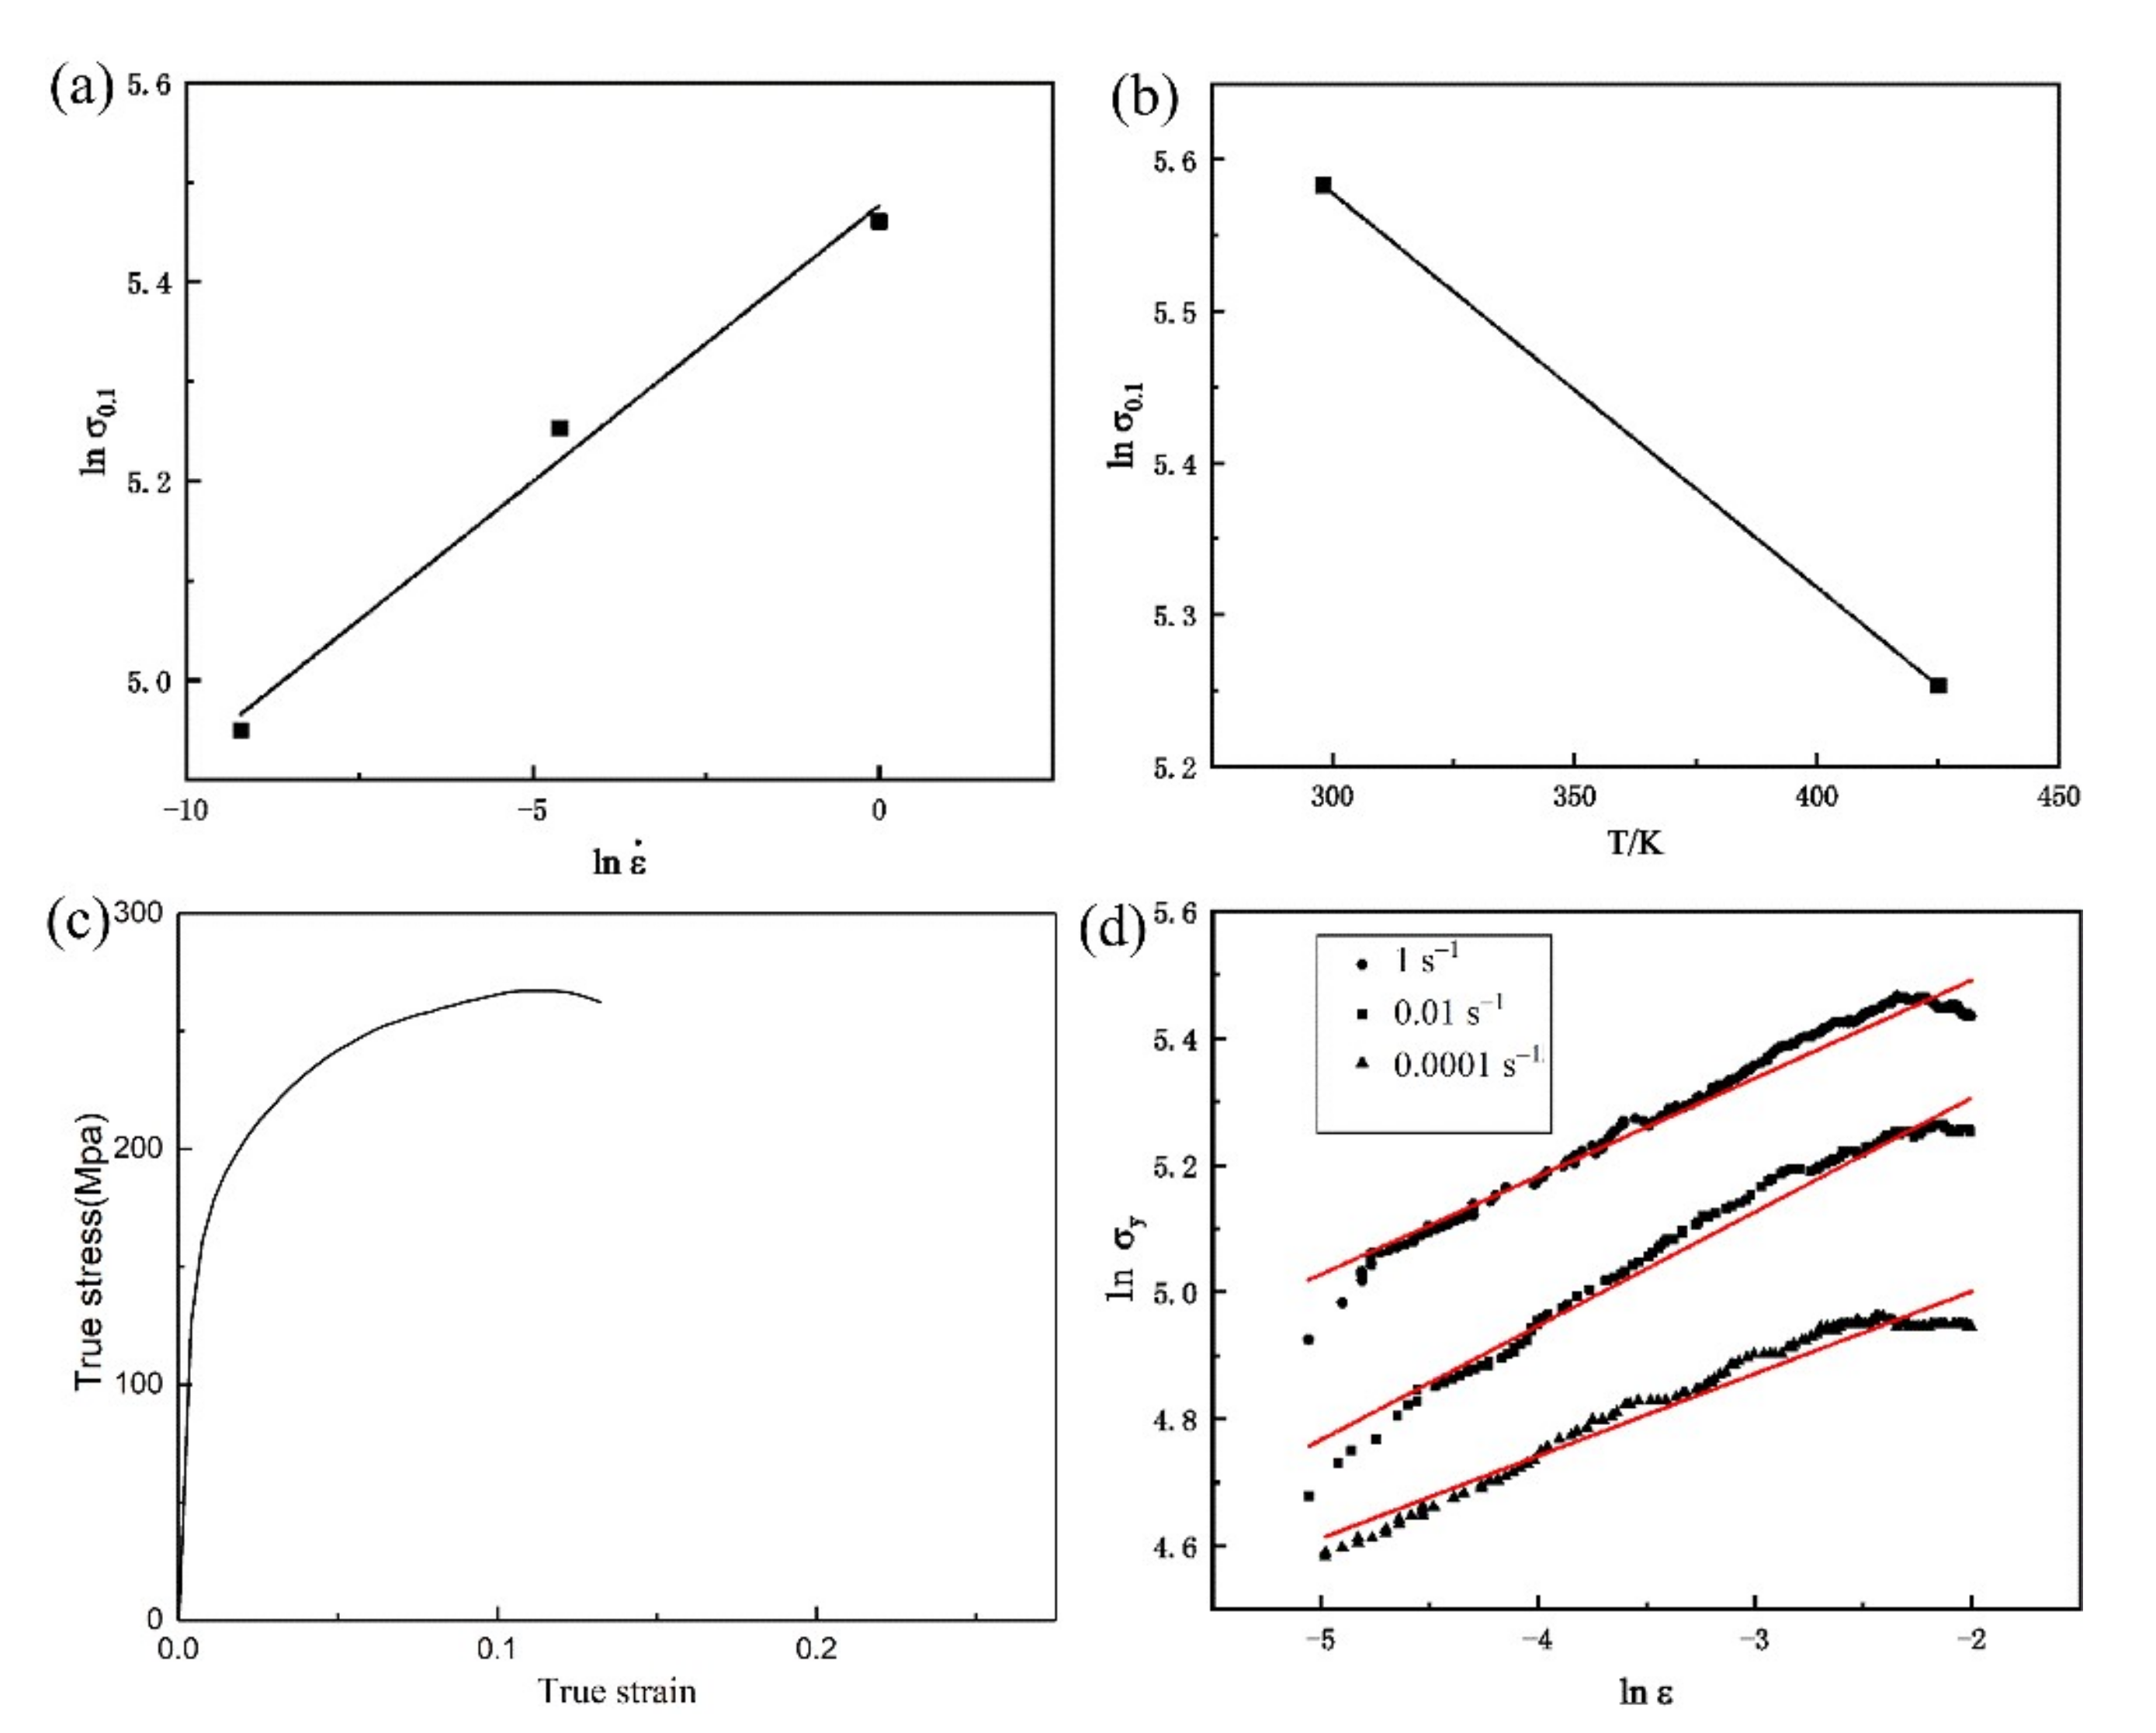
A series of tests at different strain rates were carried out to determine the model parameters. The dominant forming temperature in the CBS forming process is 423 k. Figure 4 illustrated that the stress-strain relationship at different strain rates at 423 K. It can be seen from Figure 4 that the stress is in a relatively stable state when , and the stress at this strain is called .The equation can be obtained by taking the natural logarithm to Equation (17).
The relationship between and was plotted in Figure 5a and . Figure 5b illustrated the relationship between and temperature T. The stress-strain relationship at 0.01 s at 298 K was shown in Figure 5c. It can be concluded that b = 0.0026, m = 0.05544. The relationship between and was plotted in Figure 5d, and it can be concluded that n = 0.1546.
Parameter can be obtained as follow:
where k = 5.6647 was the intercept obtained from the curve of and , and.
3.3.2. Fractional Factor of GTN Model
The GTN constitutive parameters , and were determined by Tverggard and were applied in much research. The damage parameters of AZ31 alloy sheet according to the previous research were listed in Table 3. For most structural alloys, should lie in the range . The value of is related to the stress triaxiality and the Lode parameter. The formula for the Lode parameter can be expressed as follow:
Combining Equation above, the Lode parameter in the CBS forming process can be obtained as follow:
The stress component can be neglected in region II and the Lode parameter of the sheet can be obtained as,
It can be found from Equation (22) that the stress triaxiality is related to the sheet thickness and the radius of rigid balls. It can be calculated that in region II the stress triaxiality is about 0.26 and the Lode parameter is about 0.68. In addition, the parameter is set to 3 according to the value of the stress triaxiality and the Lode parameter.
3.3.3. The FE Model of Shear-Tensile
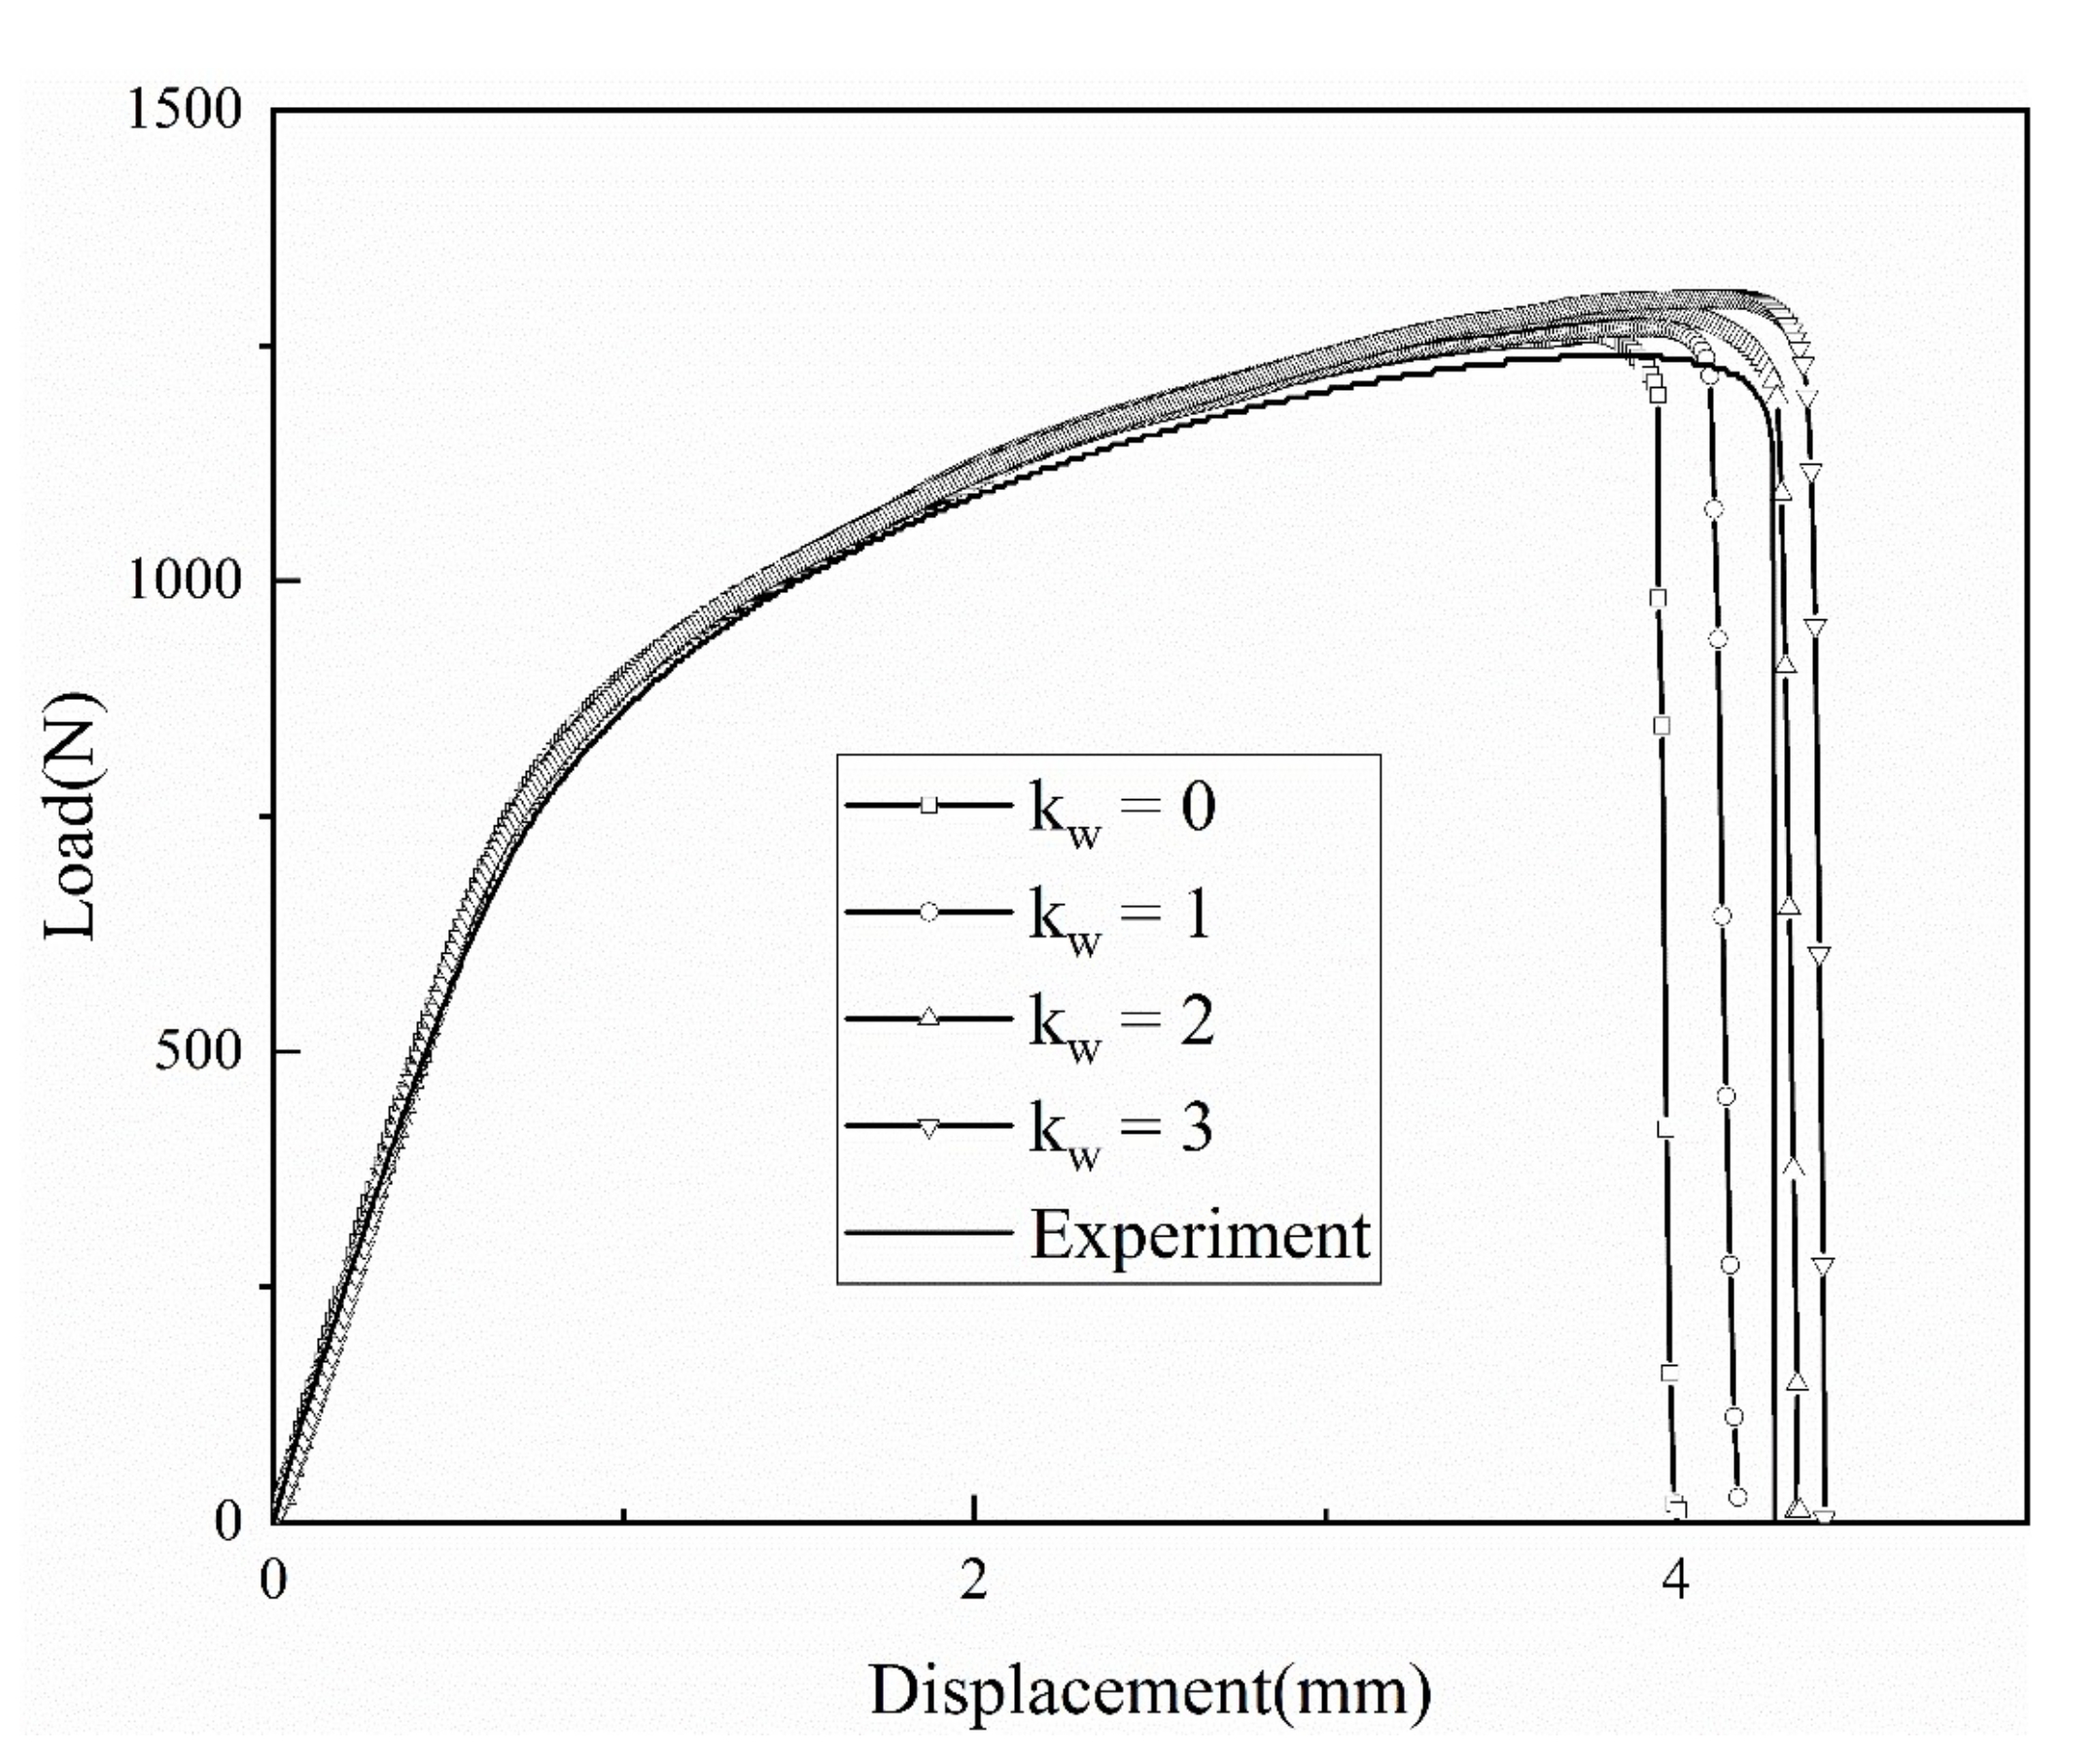
In order to verify the accuracy of the constitutive model, the shear-tensile test was established and simulated by ABAQUS/Explicit. The GTN damage model was integrated with ABAQUS/Explicit through user-defined material parameters. It can be seen from Figure 6 that three models with different numbers of meshes were built separately, in order to compare the influence of the number of meshes on the results of numerical simulations. Theoretically, the constitutive model in the paper requires a comparatively low number of meshes, and it is important to choose the suitable amount of mesh. Figure 7 showed the Load-Displacement curves results and crack shapes of models with different numbers of mesh. When the model was meshed with 6852 elements and 3 layers, it can be seen that the simulation results are completely different from the other two and do not match the actual situation in terms of crack shape. The most suitable number of meshes is 14,720 with 4 layers, and the increasing number of meshes had a little influence on the calculation results when compared with the model of 37,420 elements both in crack shape and the Load-Displacement curves. The simulation of the CBS forming process is more complex and reducing the number of meshes can greatly improve the efficiency of the simulation without influencing the accuracy of the simulation. In order to explore the effect of on the simulation results, the values of parameter are set to 0, 1, 2, 3, respectively. It can be seen that is a more accurate damage parameter in the shear-tension model. It can be seen from Figure 8 that when increased, the elongation of the material decreased.
4. Results and Discussion
4.1. Step 1
The result of modified GTN model during CBS forming process was discussed here in order to optimize the process. It was proposed in Section 2 that the forming process was divided into two steps. Step 1 was that the bottom die raised up while the rotatable gland stirrer was not moved and rotated, and the temperature of magnesium alloy sheet was 293 K.
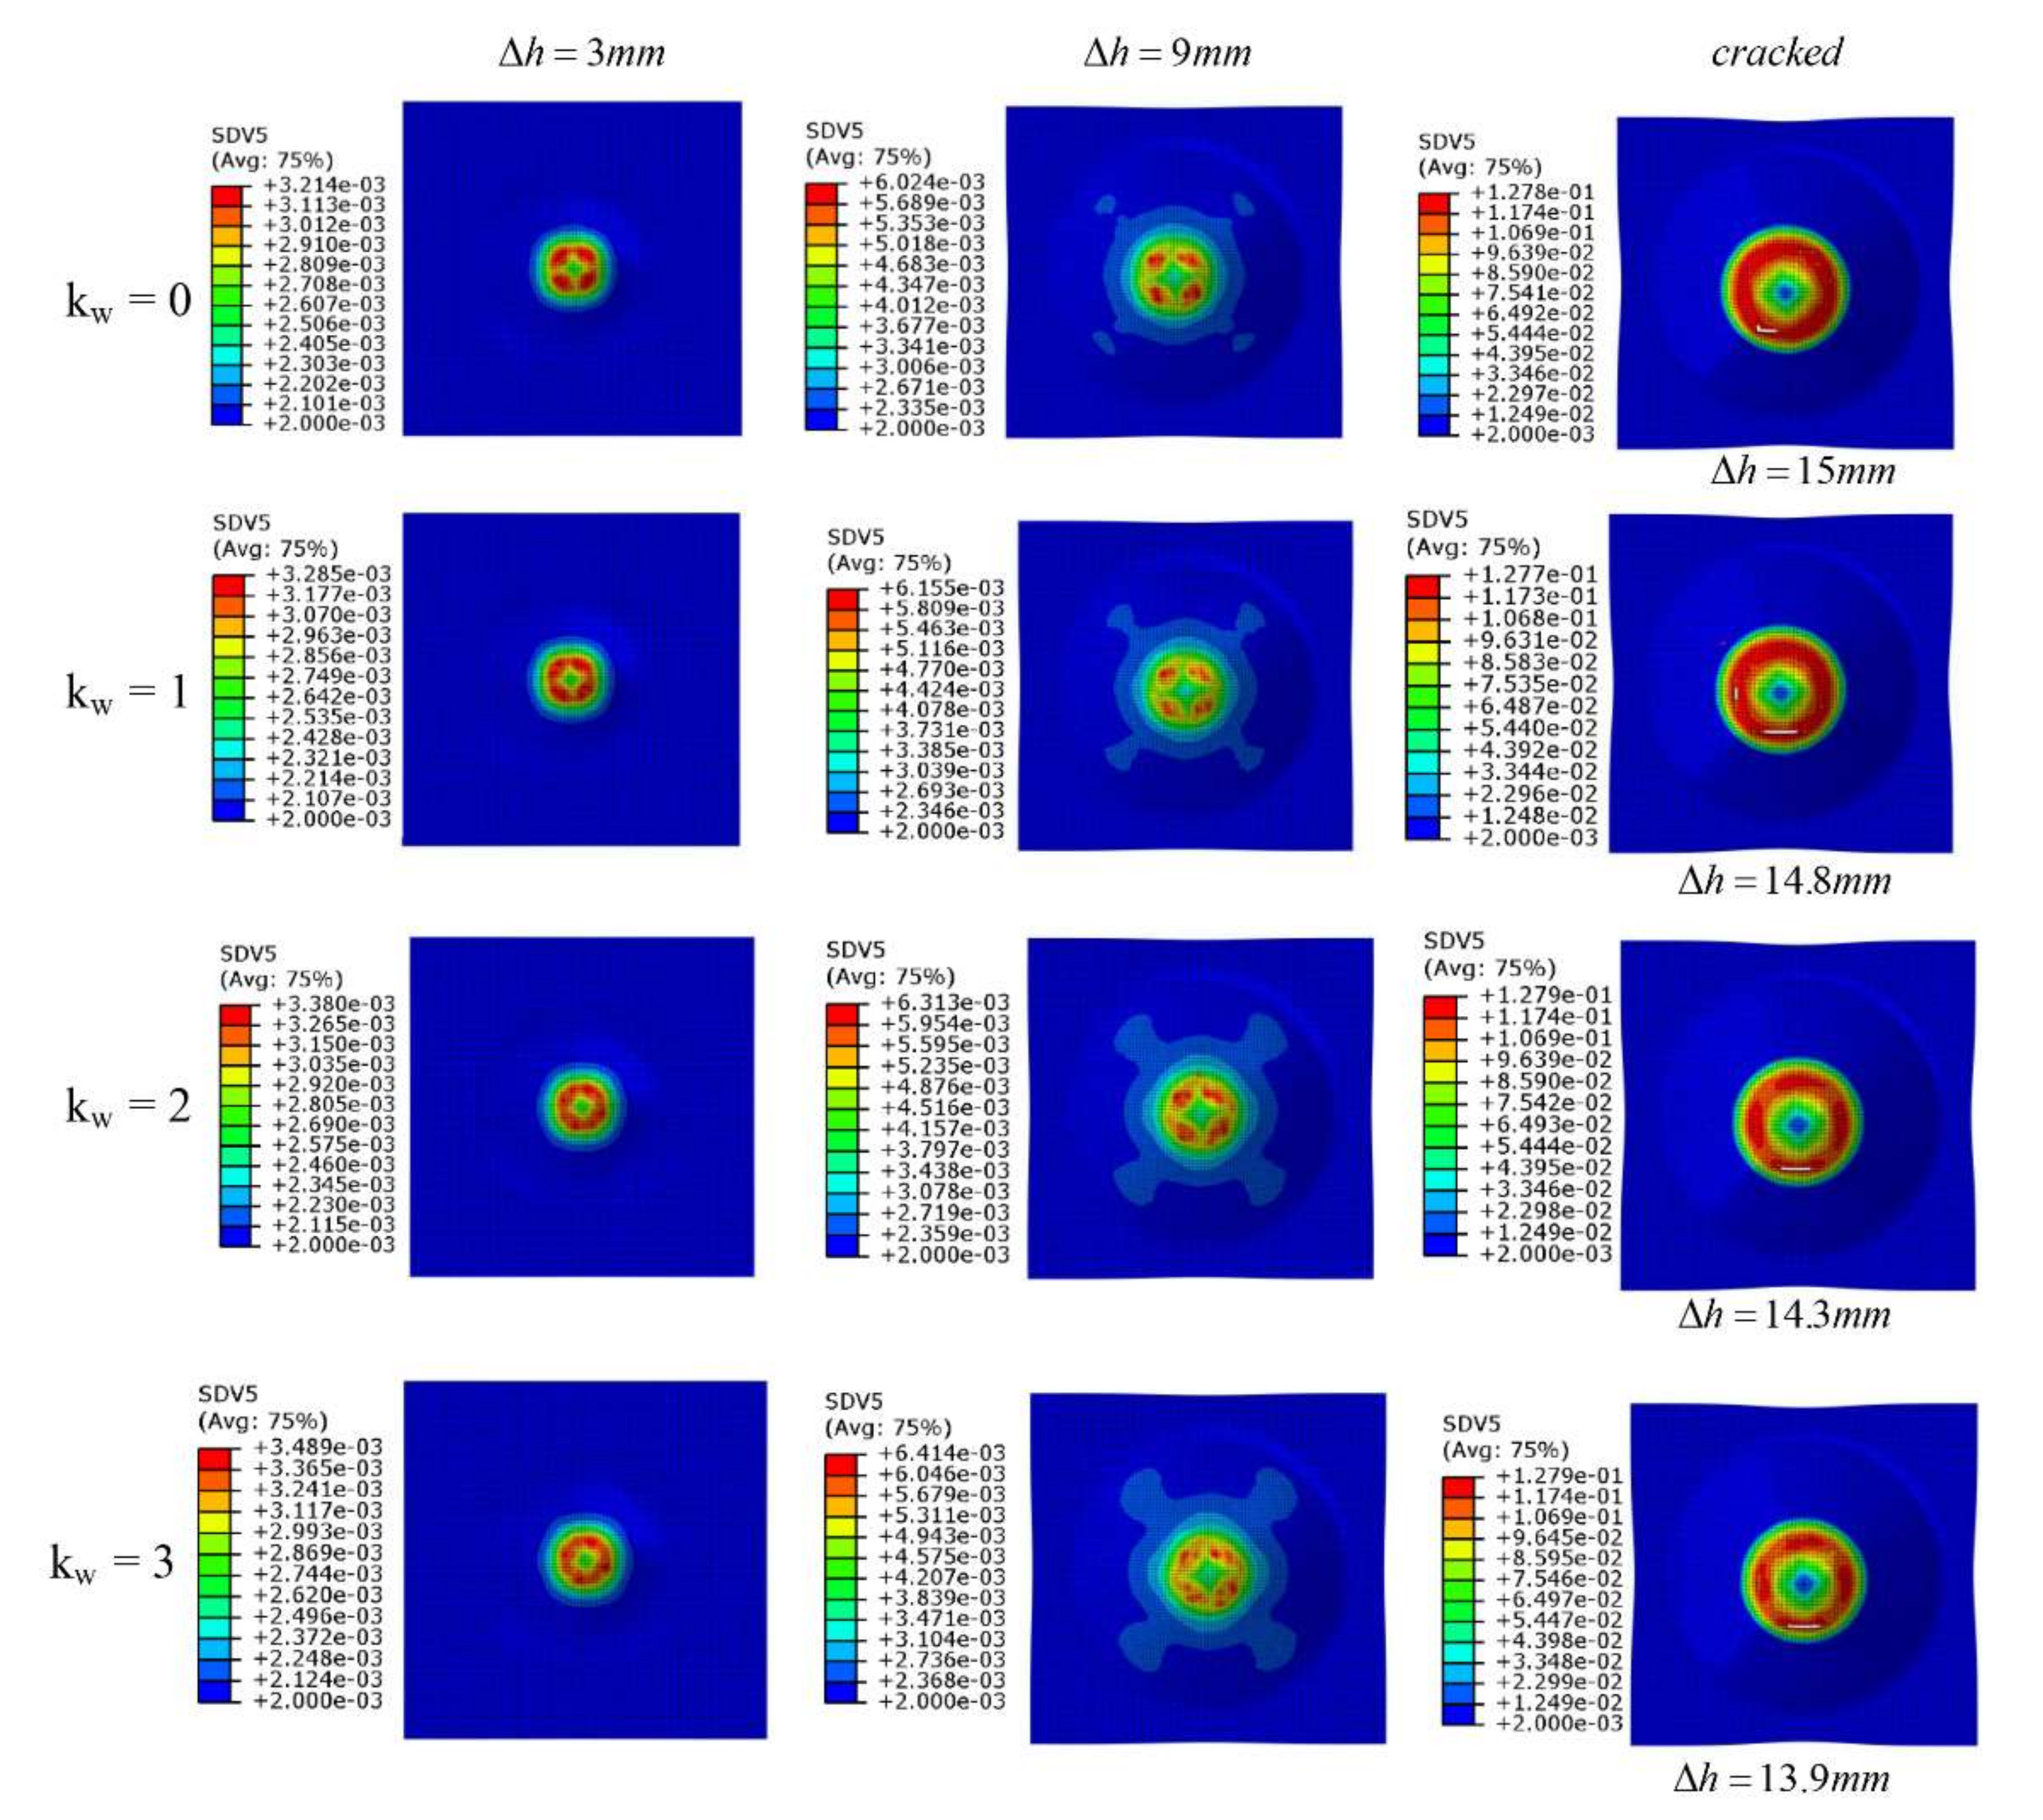
As the sheet cracked in the CBS forming mainly depended on void volume fraction and damage parameter in the modified GTN model, the damage parameter was set as 0, 1, 2, 3, respectively, to compare the effect of on material damage. The distribution of effective void volume faction at different was shown in Figure 9. The maximum void volume fraction predicted by GTN model increased with the value of . In the modified GTN model with the damage parameter , the sheet cracked as the bottom die reached 13.9 mm. In the GTN model with , the sheet cracked when the displacement of the bottom die reached 15 mm. Besides, it can be noted that the maximum void volume fraction was insufficient at a low deformation and increased dramatically at a high deformation. The crack occurred when the bottom die displacement reached 14 mm in the CBS forming experiment. Compared the results of simulation with different values of in Step 1, the modified model with was similar with the experiment well.
The purpose of Step 1 was to make the sheet contact with the bottom die and increase the size of the forming region. The effective forming radius used to define the size of the forming region and the variation of maximum void volume fraction of the sheet in Step 1 was shown in Figure 10. It should be noticed the maximum void volume fraction increased rapidly when the displacement of the bottom die increased to 10 mm and the growth rate of effective forming radius decreased. It can be concluded the suitable displacement of the bottom die was 5 mm and the growth rate of the effective forming radius reached the maximum without increasing void volume fraction.
4.2. Step 2
When the displacement of the bottom die reached 5 mm, it was time to move and rotate the rotatable gland stirrer in order to increase the size of the effective forming radius. The temperature of the magnesium sheet raised to 423 K due to the spinning of rigid balls, and the formability of magnesium sheet had been improved. The logarithmic strain distribution and void volume fraction under different damage parameter are shown in Figure 11. It can be found that the maximum displacement of the bottom die decreased from 30.8 mm to 27.3 mm with the increasing value of . It can be concluded that the forming limit of the AZ31 sheet was improved by Step 2, and the damage parameter are similar with the result of experiment.
According to the damage evolution Equations (15) and (17) during plastic forming, the equivalent plastic strain was an important factor that led to material failure. It can be seen from Figure 12b the equivalent plastic strain of all regions increased with the displacement of the bottom die at different regions and the maximum strain took place at Region B, which is the boundary of forming region and AF region. Besides, the equivalent plastic strain of Region C increased due to the pressure of rigid balls. In fact, the effective forming radius increased by the extra pressure. When the bottom die reached the displacement of 27.3 mm, the void of fraction reached the maximum at Region B and crack occurred. Besides, the effective radius reached 25 mm which is similar with the result of the experiment (24.7 mm). It can be concluded that CBS forming process can improve the forming limit of the sheet and the effective forming radius. Figure 12d shows the evolution of stress triaxiality in different regions and the stress triaxiality decreased when the rigid ball pressed on the surface of the sheet. It can be found that the stress triaxiality influenced by the rigid balls and it is necessary to apply modified GTN model to the FE simulation.
4.3. The Result of Experiment
Figure 13 shows the photographs of cracked AZ31 magnesium alloy in CBS forming process. It can be seen from Figure 13 that the displacement of the bottom die increased from 14 mm to 27 mm and the maximum effective increased from 12.5 mm to 24.7 mm. It can be concluded that the rotation of rigid balls can improve the forming limit of AZ31 magnesium alloy and increase the effective forming radius. In order to explore the mechanism of deformation, the microstructure of curved surface was tested by EBSD.
The EBSD inverse pole figure map (IPF) of as-received AZ31 sheet about the distribution of the grain orientations was shown in Figure 14a. Figure 14b showed the (0002) pole figure plots of the as-received AZ31 sheet. It can be seen from Figure 14a,b that the c-axes in the grains were slightly tilted away from the normal of the sheet and lie on the ND-RD plane. The EBSD Inverse pole figure map (IPF) of the deformed AZ31 sheet was shown in Figure 14c, and the (0002) pole figure plots of the deformed AZ31 sheet was shown in Figure 14d. It can be seen from Figure 14c,d that the c-axes in the grains were rotated to 86° and lay nearly parallel to the RD. It was suggested that the extension twinning participate fully in the deformation process. Meanwhile, it can be seen from Figure 14b that the c-axes in the grains had a small angle rotation which was caused by the shear deformation during CBS forming process. During CBS forming process, a large amount of friction heat improved the temperature of the sheet up to 423 K, which would further provide the energy to active the pyramidal slip system <c+a> and induce the shear deformation of the sheet. In all, the deformation of magnesium alloy plate using the CBS method is dominated initially by the extension twinning while non-basal slip system and shear deformation take place with the spinning of rigid balls.
5. Conclusions
In the paper, the CBS forming process was optimized by FE simulation and simulations. A modified GTN model extended to shear deformation was implemented in ABAQUS/Explicit to analyze the damage evolution. The main conclusions are summarized as follows:
- The material parameters of the GTN model for AZ31 magnesium alloy were determined by experiment, and the reliability of modified GTN model was verified through the comparison of numerical simulation and experimental observation on the shear-tensile process with the AZ31 magnesium alloy. Theoretical formula is conducted to contact stress analysis in the CBS forming process, and it can be found that the stress triaxiality is related to the radius of rigid balls and the thickness of the sheet. Besides, the stress triaxiality was about 0.26 and the Lode parameter was about 0.68 in the AF region, and the forming region was under the negative stress triaxiality in this simulations and experiments.
- The numerical results are compared under different damage parameter , it can be found that the results of damage parameter are similar with that of experiments both in Step 1 and Step 2. The maximum displacement of the rotatable gland stirrer reached 27.3 mm and the effective forming radius reached 24.7 mm in Step 2, which was much higher than that in Step 1 (The maximum displacement was 13.9 mm, and the effective forming radius was 12 mm in Step 1). With spinning of rigid balls, forming limit was improved and the effective forming radius increased.
- To explore the increased forming limit in the CBS forming process, the microstructure of curved surface was tested by electron backscattered scattering detection (EBSD). It is indicated from the microstructure that the deformation of AZ31 sheet using the CBS method is dominated initially by the extension twinning and non-basal slip system is activated with development of forming and the improvement of the temperature. Meanwhile, it can be found that the c-axes in the grains had a small angle rotation which was caused by the shear deformation during CBS process.
Author Contributions
Conceptualization, Z.H. and L.D.; methodology, Z.H.; software, L.D.; validation, Z.H. and J.X.; formal analysis, L.D.; investigation, L.D.; resources, Z.H.; data curation, X.L.; writing—original draft preparation, L.D.; writing—review and editing, Z.H.; visualization, L.D.; supervision, Z.H.; project administration, Z.H.; funding acquisition Z.H. All authors have read and agreed to the published version of the manuscript.
Funding
This research was funded by the National Natural Science Foundation of China (Grant No.51275201 and 51311130129) and the Jilin Province Key R&D Plan Project (Grant No.2014020462GX).
Institutional Review Board Statement
Not applicable.
Informed Consent Statement
Not applicable.
Data Availability Statement
The data presented in this study are available on request from the corresponding author.
Conflicts of Interest
The authors declare no conflict of interest.
References
- Hu, Z.; Guo, C.; Li, H. Influence of AZ31 sheet treated by cryogenic on punch shearing. J. Cent. South Univ. 2019, 26, 1582–1591. [Google Scholar] [CrossRef]
- Hu, Z.; Zheng, X.; An, D.; Zhou, C.; Yang, Y.; Li, R. New analytic buckling solutions of side-cracked rectangular thin plates by the symplectic superposition method. Int. J. Mech. Sci. 2021, 191, 106051. [Google Scholar] [CrossRef]
- Feng, F.; Li, J.; Yuan, P.; Zhang, Q.; Huang, P.; Su, H.; Chen, R. Application of a GTN Damage Model Predicting the Fracture of 5052-O Aluminum Alloy High-Speed Electromagnetic Impaction. Metals 2018, 8, 761. [Google Scholar] [CrossRef] [Green Version]
- Li, H.; Fu, M.W.; Lu, J.; Yang, H. Ductile fracture: Experiments and computations. Int. J. Plast. 2011, 27, 147–180. [Google Scholar] [CrossRef]
- Ma, H.; Xu, W.; Jin, B.C.; Shan, D.; Nutt, S.R. Damage evaluation in tube spinnability test with ductile fracture criteria. Int. J. Mech. Sci. 2015, 100, 99–111. [Google Scholar] [CrossRef]
- Tvergaard, V.; Tvergaard, N. Analysis of the cup-cone fracture in a round tensile bar. Acta Metall. 1984, 32, 157–169. [Google Scholar] [CrossRef]
- Lee, H.W.; Basaran, C. A Review of Damage, Void Evolution, and Fatigue Life Prediction Models. Metals 2021, 11, 609. [Google Scholar] [CrossRef]
- Yan, Y.; Sun, Q.; Chen, J.; Pan, H. The initiation and propagation of edge cracks of silicon steel during tandem cold rolling process based on the Gurson–Tvergaard–Needleman damage model. J. Mater. Processing Technol. 2013, 213, 598–605. [Google Scholar] [CrossRef]
- Riedel, H.; Andrieux, F.; Walde, T.; Karhausen, K.F. The Formation of Edge Cracks during Rolling of Metal Sheet. Steel Res. Int. 2007, 78, 818–824. [Google Scholar] [CrossRef]
- Hambli, R. Comparison between Lemaitre and Gurson damage models in crack growth simulation during blanking process. Int. J. Mech. Sci. 2001, 43, 2769–2790. [Google Scholar] [CrossRef]
- Achouri, M.; Germain, G.; Dal Santo, P.; Saidane, D. Numerical integration of an advanced Gurson model for shear loading: Application to the blanking process. Comput. Mater. Sci. 2013, 72, 62–67. [Google Scholar] [CrossRef] [Green Version]
- Cao, T.S.; Maire, E.; Verdu, C.; Bobadilla, C.; Lasne, P.; Montmitonnet, P.; Bouchard, P.O. Characterization of ductile damage for a high carbon steel using 3D X-ray micro-tomography and mechanical test—Application to the identification of a shear modified GTN model. Comput. Mater. Sci. 2014, 84, 175–187. [Google Scholar] [CrossRef]
- Cao, T.S.; Mazière, M.; Danas, K.; Besson, J. A model for ductile damage prediction at low stress triaxialities incorporating void shape change and void rotation. Int. J. Solids Struct. 2015, 63, 240–263. [Google Scholar] [CrossRef]
- Madou, K.; Leblond, J.-B. A Gurson-type criterion for porous ductile solids containing arbitrary ellipsoidal voids—I: Limit-analysis of some representative cell. J. Mech. Phys. Solids 2012, 60, 1020–1036. [Google Scholar] [CrossRef] [Green Version]
- Monchiet, V.; Bonnet, G. A Gurson-type model accounting for void size effects. Int. J. Solids Struct. 2013, 50, 320–327. [Google Scholar] [CrossRef]
- Morin, L.; Michel, J.-C.; Leblond, J.-B. A Gurson-type layer model for ductile porous solids with isotropic and kinematic hardening. Int. J. Solids Struct. 2017, 118–119, 167–178. [Google Scholar] [CrossRef]
- Nahshon, K.; Hutchinson, J.W. Modification of the Gurson Model for shear failure. Eur. J. Mech.-A/Solids 2008, 27, 1–17. [Google Scholar] [CrossRef]
- Sun, Q.; Zan, D.; Chen, J.; Pan, H. Analysis of edge crack behavior of steel sheet in multi-pass cold rolling based on a shear modified GTN damage model. Theor. Appl. Fract. Mech. 2015, 80, 259–266. [Google Scholar] [CrossRef]
- Silva, M.B.; Skjoedt, M.; Martins, P.A.F.; Bay, N. Revisiting the fundamentals of single point incremental forming by means of membrane analysis. Int. J. Mach. Tools Manuf. 2008, 48, 73–83. [Google Scholar] [CrossRef]
- Chang, Z.; Chen, J. Investigations on the deformation mechanism of a novel three-sheet incremental forming. J. Mater. Processing Technol. 2020, 281, 116619. [Google Scholar] [CrossRef]
Figure 1.
The device of Clustering ball spinning.

Figure 2.
The forming process of CBS.

Figure 3.
Schematic representation of the target sheet in CBS: (a) Cross-section view; (b) Small element in Region A; (c) Axial meridianal view of (b); (d) Circumferential view of (b).
Figure 3.
Schematic representation of the target sheet in CBS: (a) Cross-section view; (b) Small element in Region A; (c) Axial meridianal view of (b); (d) Circumferential view of (b).

Figure 4.
Tension (true) responses at different strain rate in the temperature of 423 K.

Figure 5.
The parameter can be calculated as list: (a) The relationship between and ; (b) The relationship between and T; (c) Tension (true) responses at 0.01 s in the temperature of 298 K; (d) The relationship between and .
Figure 5.
The parameter can be calculated as list: (a) The relationship between and ; (b) The relationship between and T; (c) Tension (true) responses at 0.01 s in the temperature of 298 K; (d) The relationship between and .

Figure 6.
Sample geometry and three models with different number of meshes: (a) Sample geometry; (b) Model with 6852 elements, 3 layers; (c) Model with 14,720 elements, 4 layers; (d) Model with 37,420 elements, 5 layers.
Figure 6.
Sample geometry and three models with different number of meshes: (a) Sample geometry; (b) Model with 6852 elements, 3 layers; (c) Model with 14,720 elements, 4 layers; (d) Model with 37,420 elements, 5 layers.

Figure 7.
The Load-Displacement curves and crack shapes with different number of meshes: (a) Load-Displacement curves; (b) Crack shape with 6852 elements, 3 layers; (c) Crack shape with 14,720 elements, 4 layers; (d) Crack shape with 37,420 elements, 5 layers; (e) The result of experiment.
Figure 7.
The Load-Displacement curves and crack shapes with different number of meshes: (a) Load-Displacement curves; (b) Crack shape with 6852 elements, 3 layers; (c) Crack shape with 14,720 elements, 4 layers; (d) Crack shape with 37,420 elements, 5 layers; (e) The result of experiment.

Figure 8.
The load-displacement curve of experiment and simulation results in shear-tension tests.

Figure 9.
Damage distribution under the different displacement of the bottom die and the image of cracked sheet. (SDV5 represented void volume fraction).
Figure 9.
Damage distribution under the different displacement of the bottom die and the image of cracked sheet. (SDV5 represented void volume fraction).

Figure 10.
The result of FE simulation of Step1: (a) The evolution of void volume fraction; (b) The Schematic diagram of the effective forming radius.
Figure 10.
The result of FE simulation of Step1: (a) The evolution of void volume fraction; (b) The Schematic diagram of the effective forming radius.

Figure 11.
Logarithmic strain and damage distribution under different damage parameter . (SDV5 represented void volume fraction).
Figure 11.
Logarithmic strain and damage distribution under different damage parameter . (SDV5 represented void volume fraction).

Figure 12.
The evolution of different region: (a) Schematic diagram of different region; (b) The evolution of Equivalent plastic strain; (c) The evolution of void volume fraction; (d) The evolution of stress trixiality.
Figure 12.
The evolution of different region: (a) Schematic diagram of different region; (b) The evolution of Equivalent plastic strain; (c) The evolution of void volume fraction; (d) The evolution of stress trixiality.

Figure 13.
Photographs of cracked AZ31 magnesium alloy in CBS forming process (left: Step1; Right: Scheme 2. (a) Overhead view of deformed sheet; (b) Bottom view of deformed sheet; (c) Side view of deformed sheet; (d) The bottom die.
Figure 13.
Photographs of cracked AZ31 magnesium alloy in CBS forming process (left: Step1; Right: Scheme 2. (a) Overhead view of deformed sheet; (b) Bottom view of deformed sheet; (c) Side view of deformed sheet; (d) The bottom die.

Figure 14.
Inverse pole figure and pole figure: (a) Inverse pole figure of as-received sheet; (b) Pole figure of as-received sheet; (c) Inverse pole figure of the deformed sheet; (d) Pole figure of the deformed sheet.
Figure 14.
Inverse pole figure and pole figure: (a) Inverse pole figure of as-received sheet; (b) Pole figure of as-received sheet; (c) Inverse pole figure of the deformed sheet; (d) Pole figure of the deformed sheet.


Table 1.
Chemical composition of AZ31 Mg alloy.
| Alloys | Mg | Al | Zn | Mn |
|---|---|---|---|---|
| AZ31 | 95.7 | 3.0 | 1.0 | 0.3 |
Table 2.
Fundamental parameters for CBS forming.
| Parameters | Value |
|---|---|
| The radius of the rotatable gland stirer (mm) | 75 |
| The radius of rigid balls (mm) | 4 |
| The Rotational speed of rotatable gland stirere (r/min) | 24 |
| The radius of the bottom die | 46 |
Table 3.
Parameters for GTN model.
| q1 | q2 | q3 | fN | fc | ff | εN | SN | f0 |
|---|---|---|---|---|---|---|---|---|
| 1.5 | 1 | 2.25 | 0.04 | 0.0732 | 0.1279 | 0.2 | 0.1 | 0.001 |
Publisher’s Note: MDPI stays neutral with regard to jurisdictional claims in published maps and institutional affiliations. |
© 2022 by the authors. Licensee MDPI, Basel, Switzerland. This article is an open access article distributed under the terms and conditions of the Creative Commons Attribution (CC BY) license (https://creativecommons.org/licenses/by/4.0/).
Share and Cite
MDPI and ACS Style
Hu, Z.; Da, L.; Xi, J.; Li, X. AZ31 Sheet Forming by Clustering Ball Spinning-Analysis of Damage Evolution Using a Modified GTN Model. Metals 2022, 12, 220. https://0-doi-org.brum.beds.ac.uk/10.3390/met12020220
AMA Style
Hu Z, Da L, Xi J, Li X. AZ31 Sheet Forming by Clustering Ball Spinning-Analysis of Damage Evolution Using a Modified GTN Model. Metals. 2022; 12(2):220. https://0-doi-org.brum.beds.ac.uk/10.3390/met12020220
Chicago/Turabian StyleHu, Zhiqing, Lijia Da, Jia Xi, and Xinchen Li. 2022. "AZ31 Sheet Forming by Clustering Ball Spinning-Analysis of Damage Evolution Using a Modified GTN Model" Metals 12, no. 2: 220. https://0-doi-org.brum.beds.ac.uk/10.3390/met12020220
Note that from the first issue of 2016, this journal uses article numbers instead of page numbers. See further details here.