
A Probabilistic Fatigue Strength Assessment in AlSi-Cast Material by a Layer-Based Approach


1
Christian Doppler Laboratory for Manufacturing Process Based Component Design, Chair of Mechanical Engineering, Montanuniversität Leoben, Franz-Josef-Straße 18, 8700 Leoben, Austria
2
Chair of Mechanical Engineering, Montanuniversität Leoben, Franz-Josef-Straße 18, 8700 Leoben, Austria
3
Institute of Structural Durability and Railway Technology, Graz University of Technology, Inffeldgasse 25/D, 8010 Graz, Austria
*
Author to whom correspondence should be addressed.
Metals 2022, 12(5), 784; https://0-doi-org.brum.beds.ac.uk/10.3390/met12050784
Submission received: 8 March 2022
/
Revised: 25 April 2022
/
Accepted: 26 April 2022
/
Published: 30 April 2022
(This article belongs to the Special Issue Structural Quality and Its Effects on the Performance of Light Alloy Castings)
Abstract
:An advanced lightweight design in cast aluminium alloys features complexly shaped geometries with strongly varying local casting process conditions. This affects the local microstructure in terms of porosity grade and secondary dendrite arm spacing distribution. Moreover, complex service loads imply changing local load stress vectors within these components, evoking a wide range of highly stressed volumes within different microstructural properties per load sequence. To superimpose the effects of bulk and surface fatigue strength in relation to the operating load sequence for the aluminium alloy EN AC 46200, a layer-based fatigue assessment concept is applied in this paper considering a non-homogeneous distribution of defects within the investigated samples. The bulk fatigue property is now obtained by a probabilistic evaluation of computed tomography results per investigated layer. Moreover, the effect of clustering defects of computed tomography is studied according to recommendations from the literature, leading to a significant impact in sponge-like porosity layers. The highly stressed volume fatigue model is applied to computed tomography results. The validation procedure leads to a scattering of mean fatigue life from −2.6% to 12.9% for the investigated layers, inheriting strongly varying local casting process conditions.
1. Introduction
Based on the beneficial characteristics in terms of castability, light weight, weldability, and high corrosion resistance, AlSi-cast alloys are widely used in mobility applications [1,2,3,4]. It is well known that these complexly shaped cast components are affected by different defects depending on local manufacturing process conditions such as gas- and shrinkage-porosity and oxide films [5,6]. It is stated within preliminary studies that local defect sizes correlate with the secondary dendrite arm spacing and the degree of porosity [7,8]. As mentioned in [9], the shape of shrinkage-porosity, or microporosity, adopts the negative shape of the solidified dendrites, which can be subdivided into cavities and sponge shrinkage according to [10]. Another important impact factor regarding fatigue is the surface roughness, i.e., cast surface layer, analysed in more detail in [11,12,13], because surfaces often cannot be machined due to restrictions of accessibility within complex cast components. Surface texture can be assessed non-destructively by line-based [14,15] or area-based methodologies [13,16]. Porosity can be evaluated either destructively by a fractographical inspection of tested fatigue specimens [17] or non-destructively via computed tomography (CT) [18,19]. Computed tomography is therefore an efficient technique for inspecting industrial components, following standards such as ASTM E155 [20], as exemplified by Rotella et al. [10]; however, inhomogeneities play a decisive role regarding the fatigue strength of AlSi-cast components, apparent in various studies that contributed to the impact of maximum-sized inhomogeneities on fatigue strength [4,13,21,22,23,24].
1.1. Statistical Analysis of Defects
Fatigue initiating defects in castings, or even in additively manufactured parts, can be described well by extreme value statistics, such as the generalized extreme value distribution (GEV), given in Equation (1). The application of extreme value statistics is cited in numerous studies, e.g., [23,25,26,27,28,29,30,31,32,33], whereby a comprehensive summary about this field is given by Beretta in [34].
The cumulative distribution function (CDF) of the GEV can be estimated by using the maximum likelihood method [28,35,36] and is defined by the location , scale , and shape parameter, covering the Fréchet, Gumbel, and Weibull distribution [37]. As represented by Tiryakioğlu [31], the shape parameter of the GEV indicates the type of extreme value distribution, namely,
- if , a Gumbel or Type I distribution is defined; see Equation (2);
- if , a Fréchet, or Type II distribution is defined;
- if , a Weibull, or Type III distribution is defined.
According to Murakami and Beretta, it can be stated that the largest initiating defects are Gumbel-distributed, which means Type I or the largest extreme value distribution (LEVD) [23,28]; however, the probabilistic observation of inhomogeneities using the generalized extreme value distribution features a shape factor that is unequal to zero, applying the Fréchet or Weibull distribution instead. Modern components consist of several highly stressed volumes (HSVs) of varying local defect distributions as a result of manufacturing processes and arbitrary loading. According to [29,30,38], the defect distribution is shifted on the axis of abscissae depending on the -times enlarged volume ; see Equation (3).
1.2. Consideration of Defects in Fatigue Design
Regarding defects acting as crack initiation spots, the Kitagawa–Takahashi diagram (KTD) [39] provides a sound methodology for the fatigue strength assessment of cyclically loaded castings, invoking the long-life fatigue strength of the near-defect-free material and the long crack threshold value as material resistance. Moreover, taking into account a geometry factor Y, which depends on the geometrical shape and location of the defect [40], the defect size in terms of offers the application towards casting defects. El Haddad [41,42] and Chapetti [43] made improvements to the Kitagawa–Takahashi diagram by taking into account an intrinsic crack length , defined as a function of the effective crack threshold and the cyclic crack resistance curve (R-curve). The R-curve represents the crack extension from the intrinsic threshold up to the long crack threshold induced by crack closure effects [44], as recommended by Maierhofer et al. in [45,46]. The proposed equation to describe the cyclic R-curve is given in Equation (4).
with
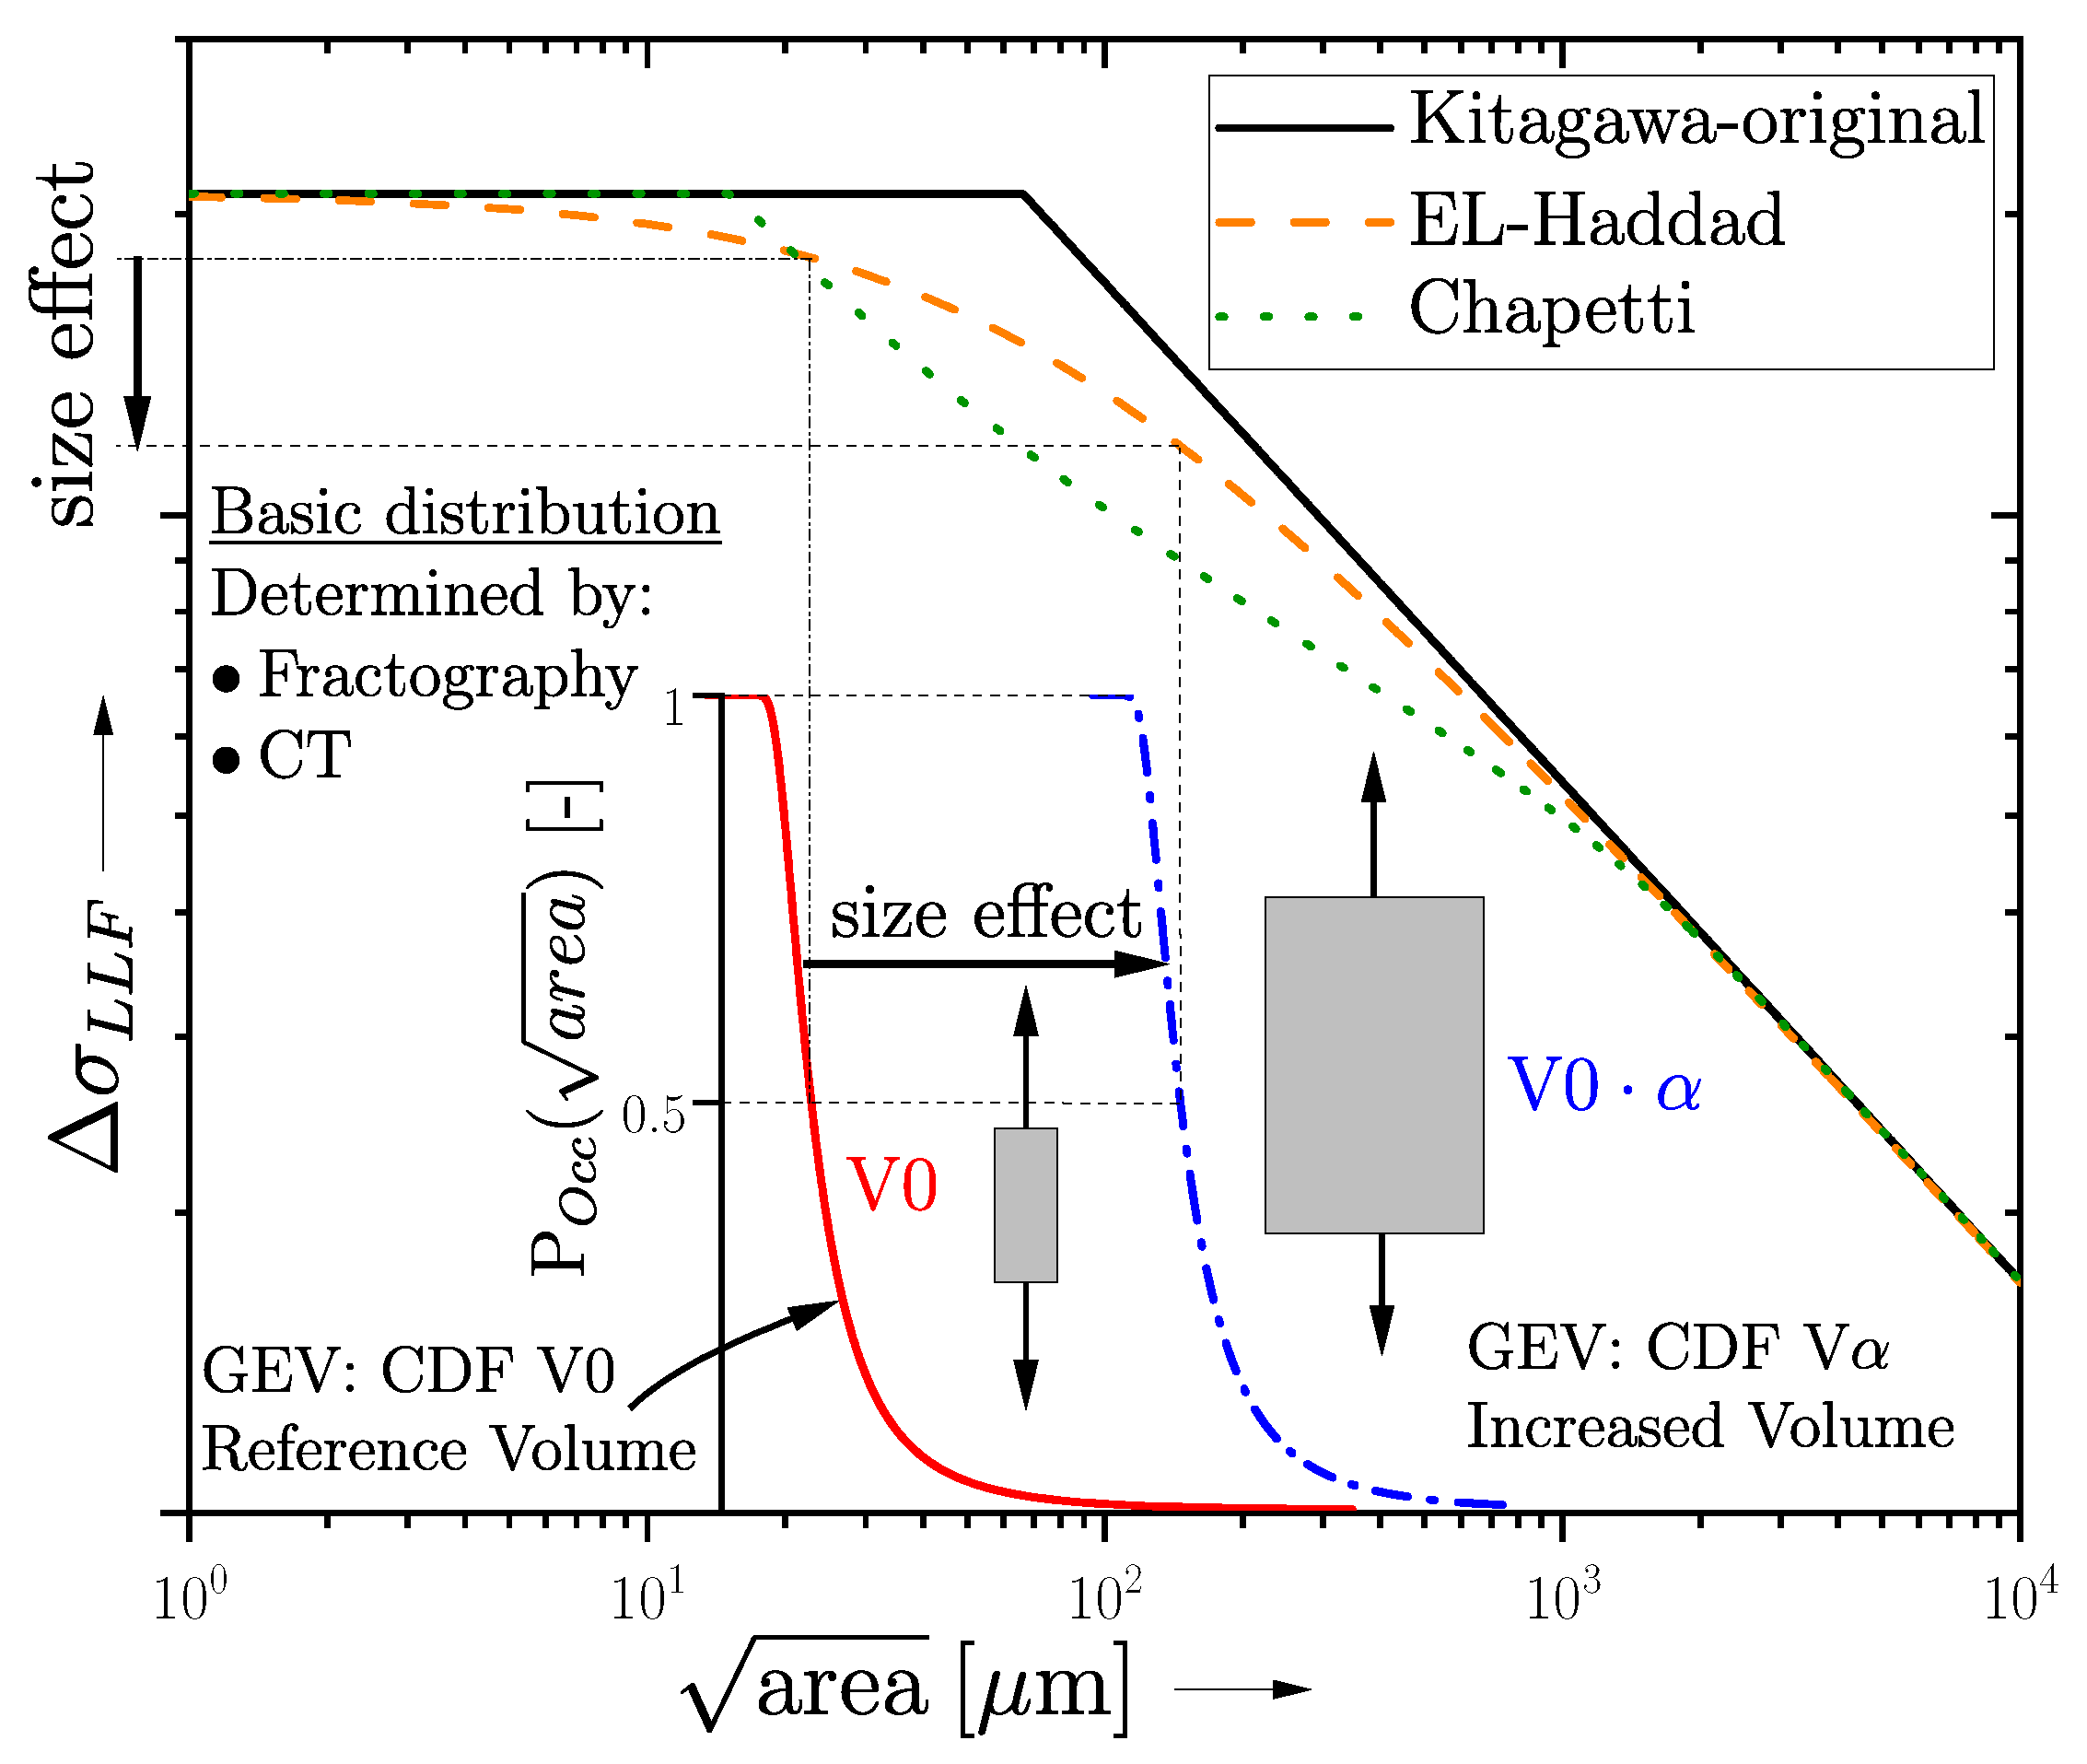
As mentioned in Section 1.1, a varying HSV evokes a shift in the defect distribution if there is a overall homogeneous distribution present [21,29]. Following, a shift in the GEV applies also within the KTD, as illustrated schematically in Figure 1. Sonsino [47] introduced an efficient methodology to estimate the fatigue strength of varying HSVs depending on the return period and a Weibull factor ; see Equation (5), assuming a homogeneous distribution of defects. In the common guideline [48], a constant kappa value for cast alloys is recommended; however, recent research by [21,29] on the fatigue strength of aluminium alloys indicated that the Weibull factor depends both on the location parameter of the defect distribution and the evaluated return period of the highly stressed volume. Ai et al. and Zhu et al. studied the size effect regarding defective components for different materials in [49,50] featuring the return period as well. Within these investigations, a flow chart was raised for the fatigue assessment of defective material taking into account the statistical size effect, the geometrical size effect, and the technological size effect.
1.3. Measurement of Defects
However, it is quite obvious that fatigue failure occurs at the largest defect present in the highly stressed volume [17]. The -parameter represents the projected area perpendicular to the load direction, is easily measurable within the fracture surface, and can be used as the equivalent crack size [22,39,51,52]. Several studies [18,19,25,27,53,54,55] have revealed that the projected area of defects perpendicular to the stress direction can be used as the equivalent crack size from CT analysis for deducing the fatigue limit within the Kitagawa diagram. Due to the complex shape of shrinkage porosities in cast alloys, fracture occurs at interacting porosities in many cases [4,13,56]. In the study of Åman et al. [57,58], defects are regarded as interacting if the distance between two defects is less than the size of the smaller defect. In contrast, Nadot [56] considered defects as unique if the distance is less than the bigger one and the overall size includes the ligament between these defects. Li and Bidhar studied the effect of interacting defects with regard to fatigue strength by analytical and numerical analyses [59,60]. Thus, the effect of imperfection distribution has to be covered by improved fatigue assessment methods in detail, especially if the highly stressed volume increases and the largest defect projections may change by varying load angles. Of course, a fatigue assessment by the largest possible defect grants a sound starting point, but the adjacency effect of imperfections is often not negligible [61].
1.4. Outline of the Work
This paper describes a layer-based methodology regarding fatigue strength assessment of imperfective AlSi-cast material. Due to the casting process, severe changes in porosity content in terms of shape, projected size, and distribution within different highly stressed volumes may occur, implying a clustering of single pores to pore networks according to [57,58]. In contrast, the SDAS as a microstructural characteristic value remains almost unaffected within the investigated region [13]. Thus, a layer-based fatigue model is introduced to assess the size effect in terms of the highly stressed volume and the casting process-related manufacturing properties in a combined manner. Micro-computed tomography scans have been conducted on thick-walled specimens, beginning at the surface layer and covering up to 7 mm in depth, featuring an individual defect distribution for each layer. Furthermore, the effect of clustering defects on imperfection distributions, evaluated by computed tomography, was studied. Additionally, the preliminary developed methodology regarding the statistical size effect [21,29] was applied within selected thin-walled layers. Thus, the time and cost effort for computed tomography can be minimized by an evaluation of increased-volume scaled return parameters based on the defect distribution of small CT volumina. Finally, the presented methodical flowchart is experimentally validated by thin-walled specimens within selected layers, leading to a sound estimation of the overall fatigue strength featuring strongly varying local casting conditions.
2. Materials and Methods
The material was taken out of a gravity cast component, manufactured by the core package system casting process [2,62,63]. The nominal chemical composition following the standard [64] of the investigated specimens as well as the results from a spectral analysis are given in Table 1. In order to obtain peak hardness and therefore maximum strength in the cast components, a T6 heat treatment was conducted after the casting process.
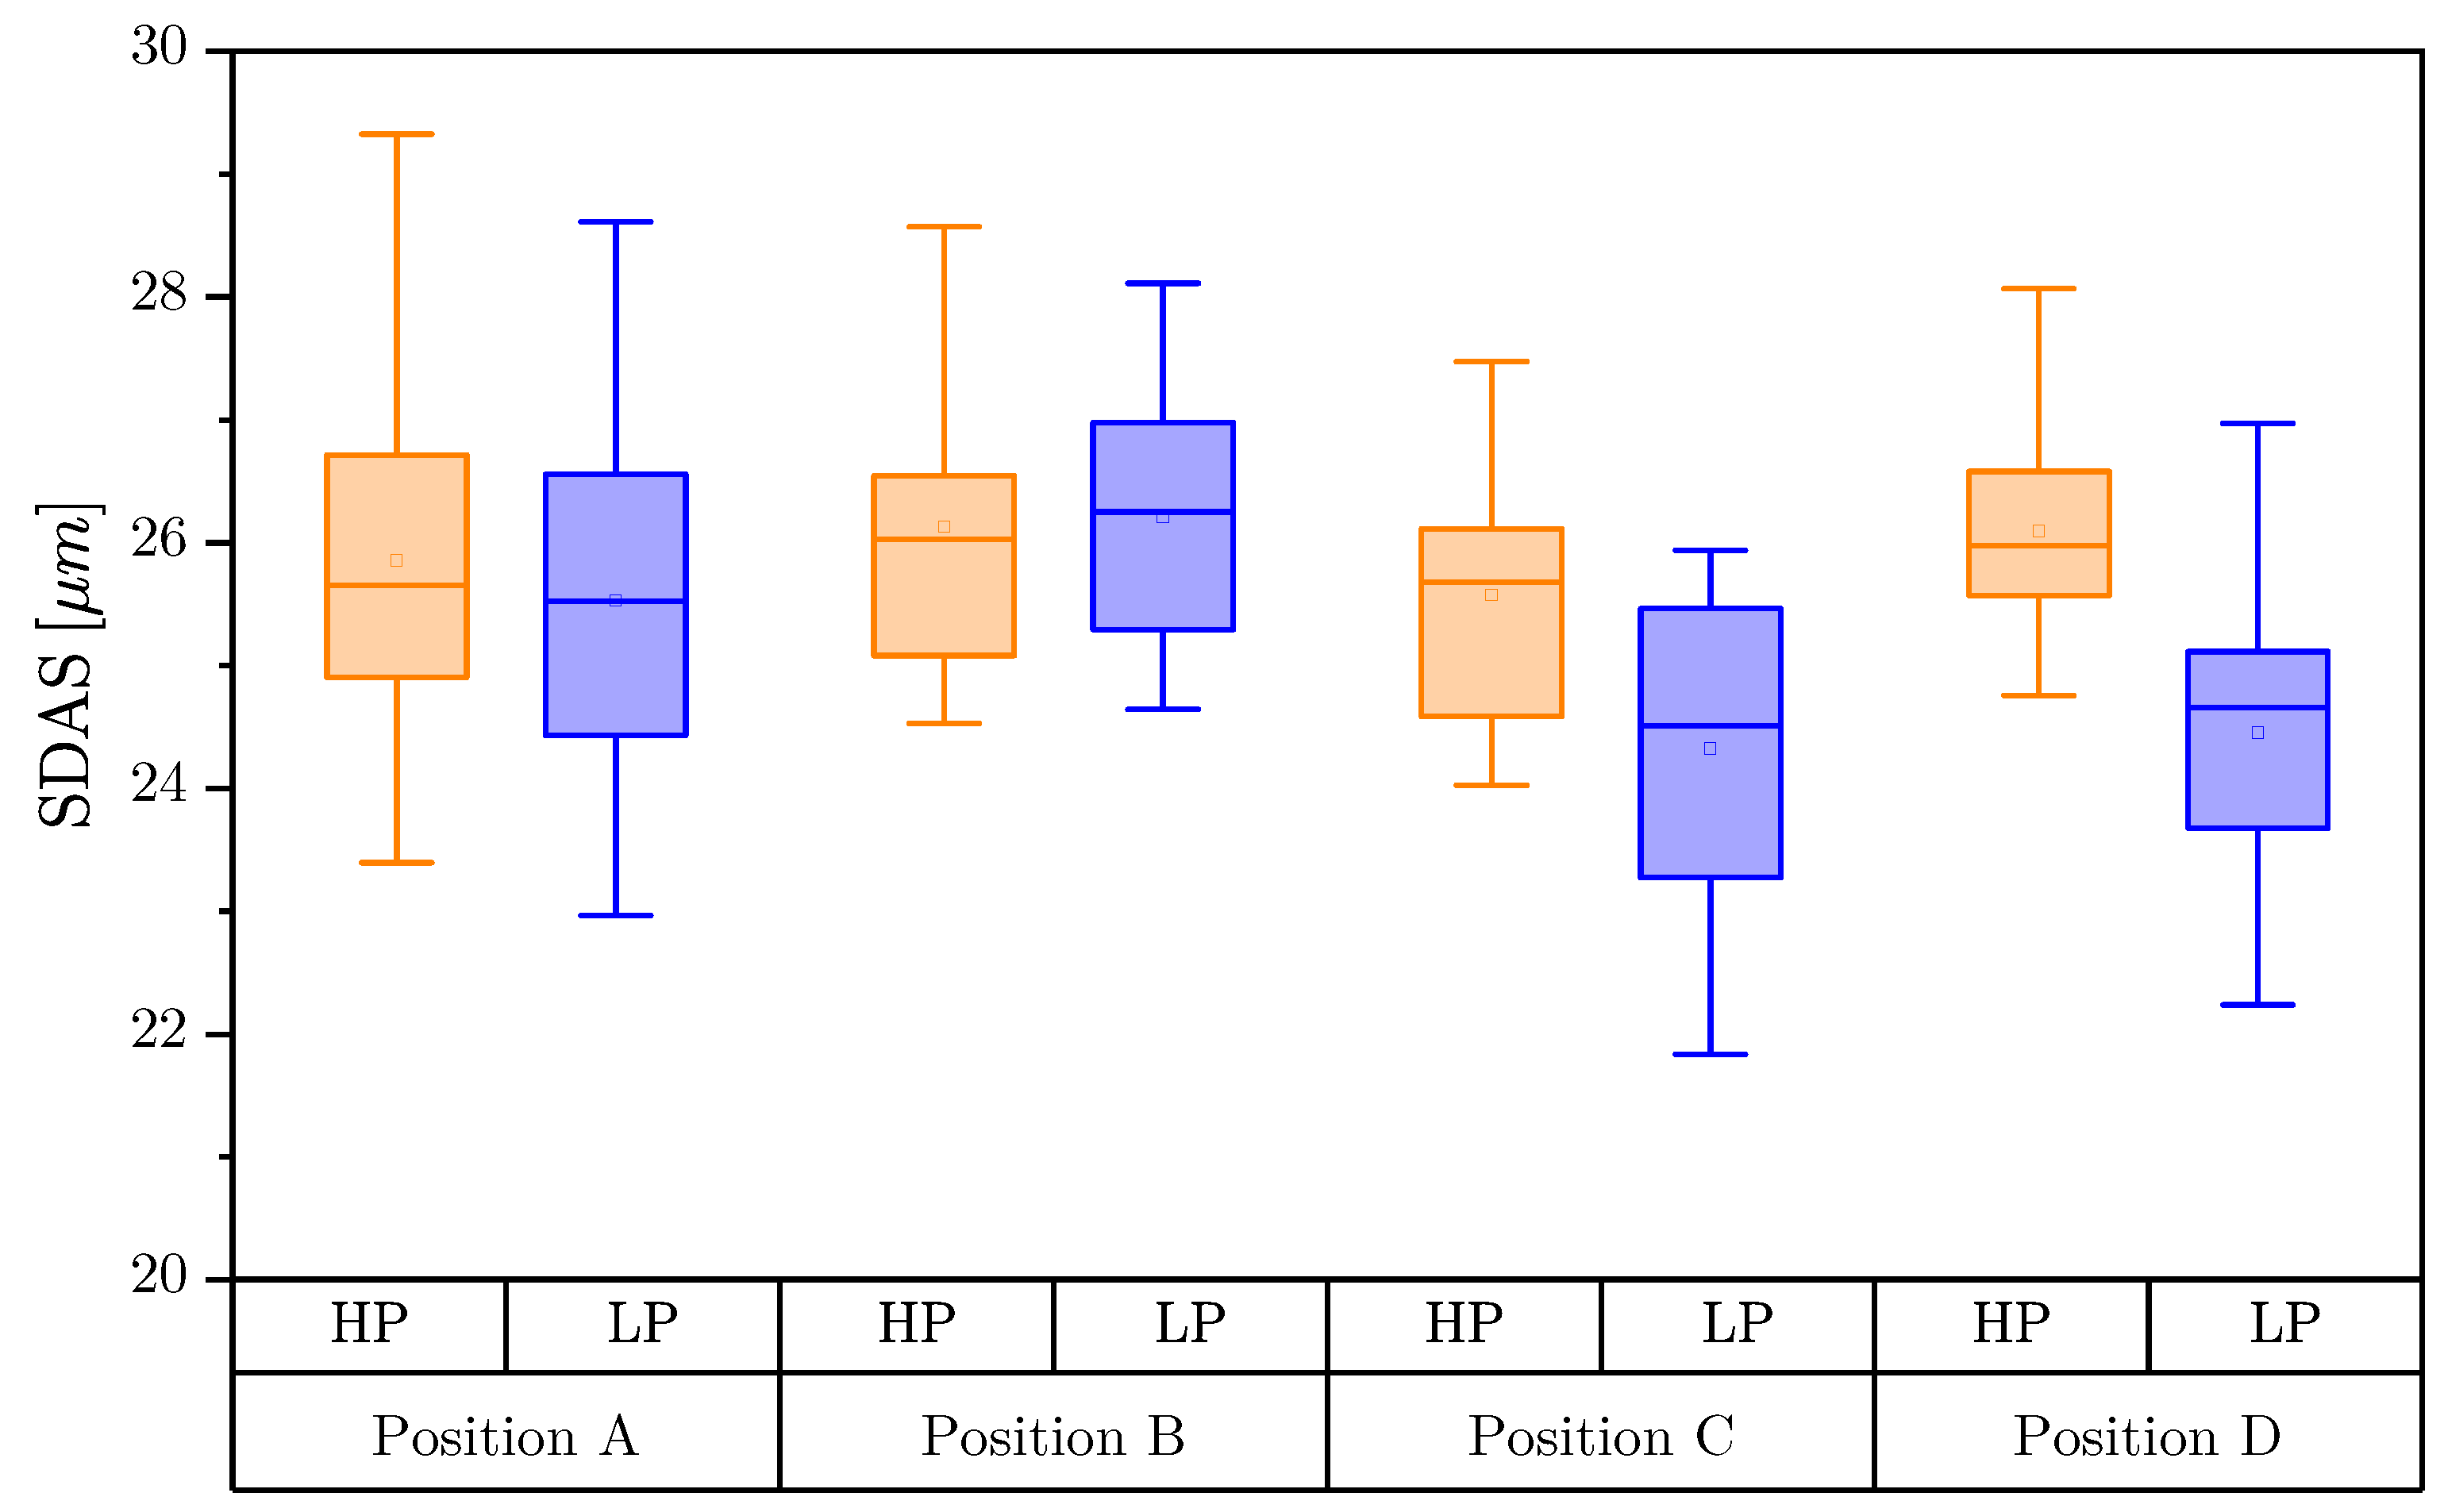
Specimens were selected from four positions within the component, referred to as Position A–D. The basic requirement for choosing these positions was the same cooling rate, or secondary dendrite arm spacing, as a basic microstructural indicator. It is clearly visible within Figure 2 that no significant difference occurs regarding the SDAS distribution. The mean value of the SDAS ranges between 24 and 26 µm across all positions. The initial specimen geometry manufactured from these positions is depicted within Figure 3, similar to previous studies of the authors [13,65]. Furthermore, a summary of the quasistatic properties is given in Table 2, deriving a comparable brittle behaviour of the investigated material in T6 post-treatment condition.
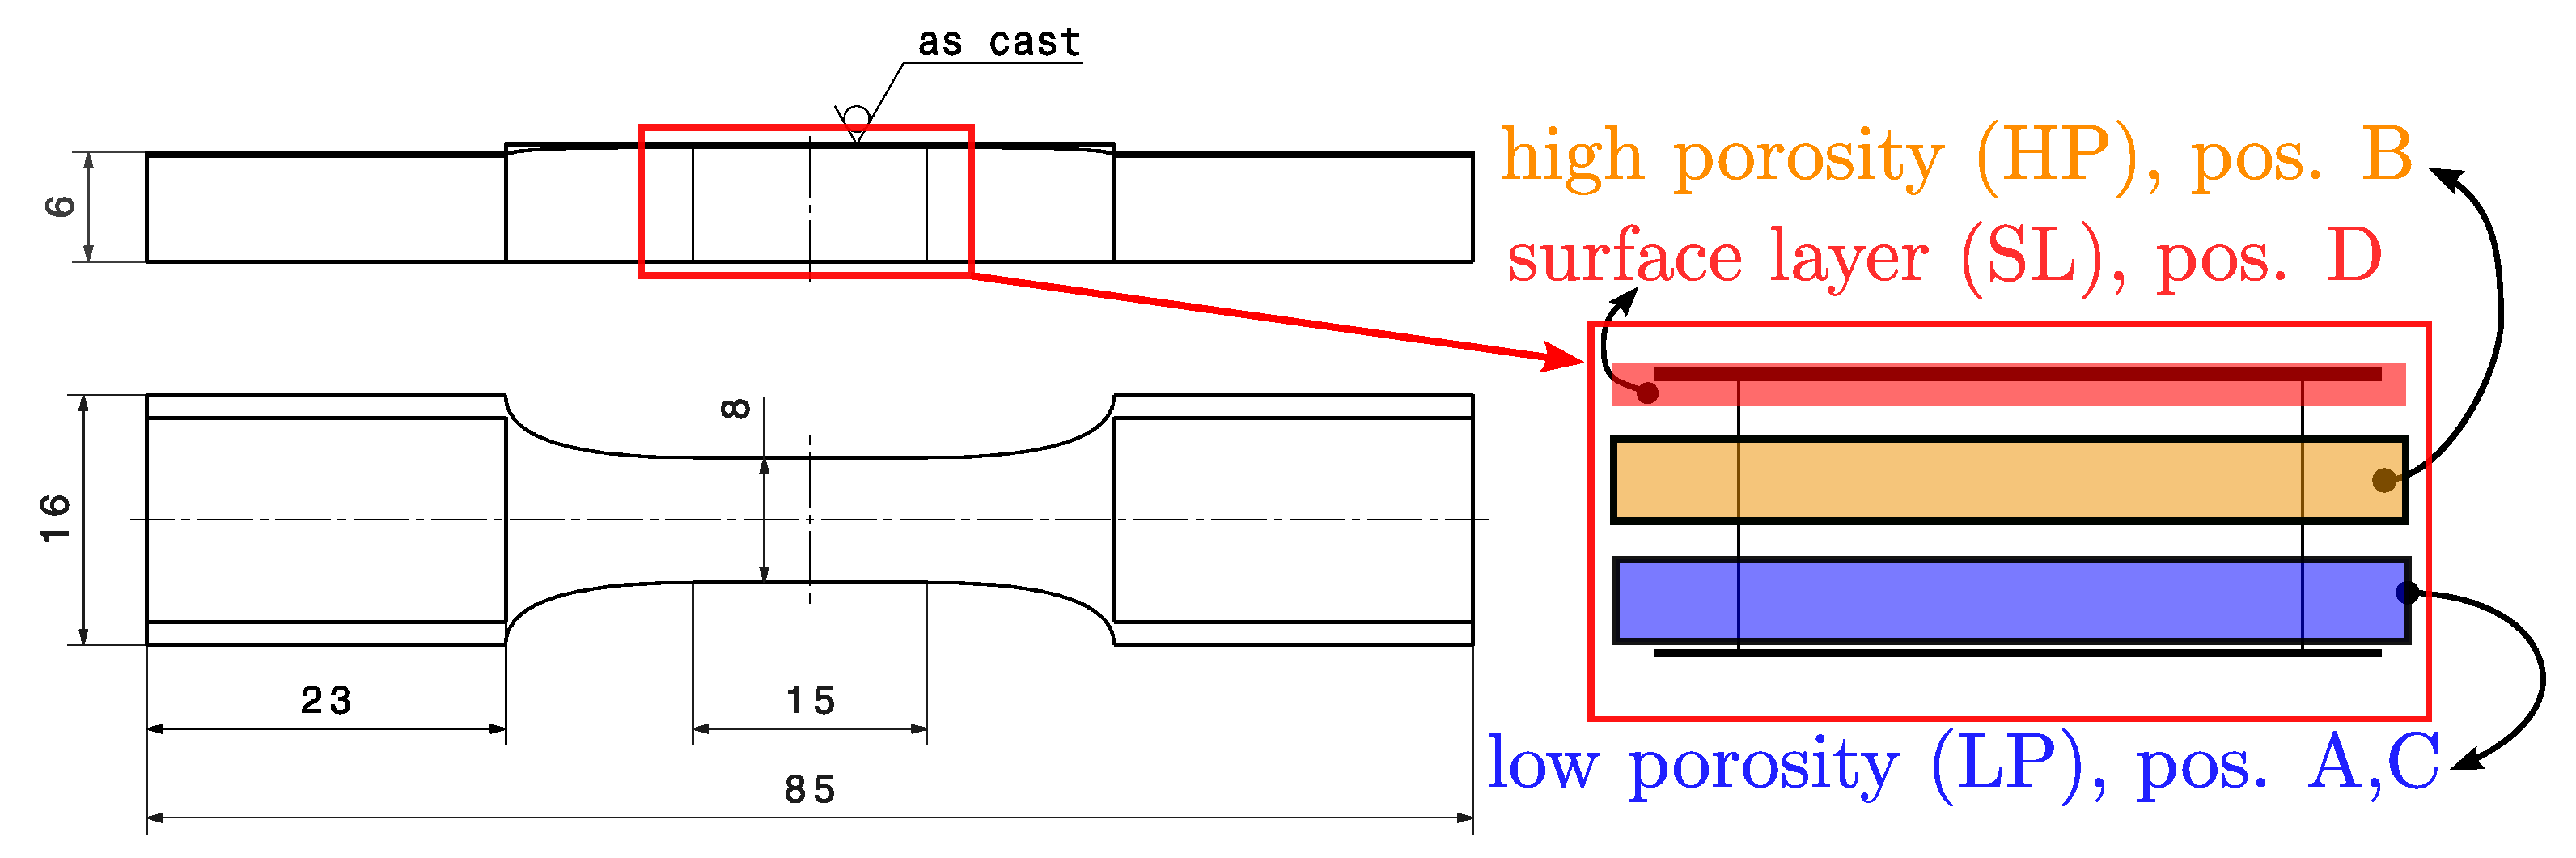
As introduced, the aim of this paper is a layer-based fatigue assessment methodology. In a previous study [13], the authors showed that the porosity distribution is not homogeneous over the specimen cross section. Thus, the specimens were subdivided into homogeneous layers regarding defects for fatigue testing, beginning at the surface. The region from the surface up to 0.5 mm in depth is designated as the surface layer (SL), i.e., the red shaded section in Figure 3. Specimens for uniaxial bending loading are taken from Position D in Figure 2. Uniaxial bending defines the highly stressed volume into this surface layer (SL) due to the nominal stress gradient. Within a distance between 1.5 and 3 mm from the surface, a layer featuring large and sponge-like pore networks occurs, i.e., the yellow shaded section in Figure 3. Specimens possessing this high degree of porosity are taken from Position B, later referred to as HP within the paper. The lower side of the specimen in Figure 3, a distance approximately between 5.2 and 6.7 mm from the surface, features a low degree of porosity, i.e., the blue marked section in Figure 3. In this paper, these specimens are labelled as LP and taken out of Positions A and C. It should be emphasized that all mentioned series (SL, HP, and LP) utilize the specimen geometry depicted in Figure 3.
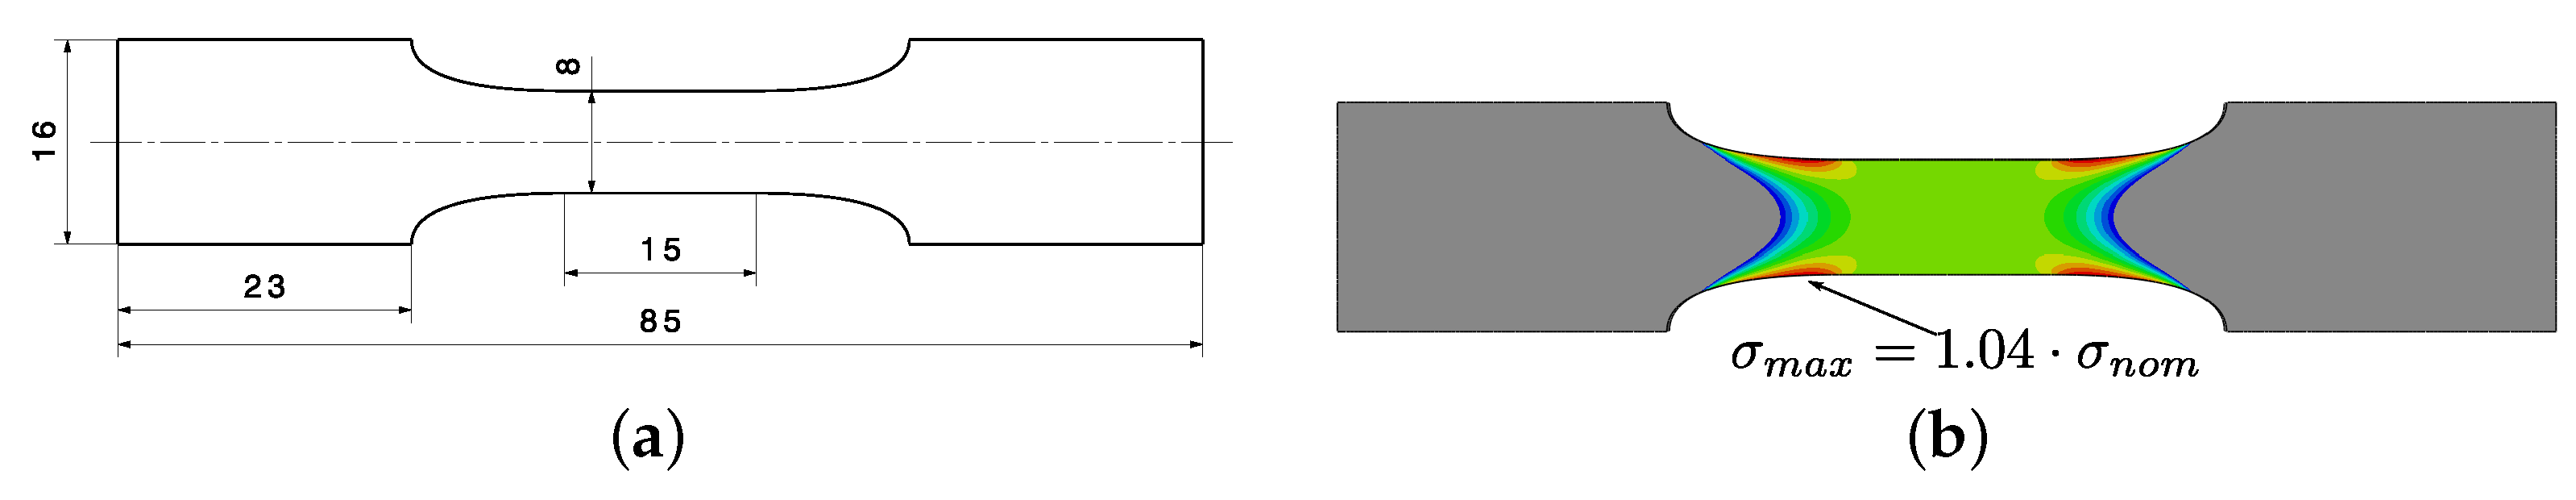
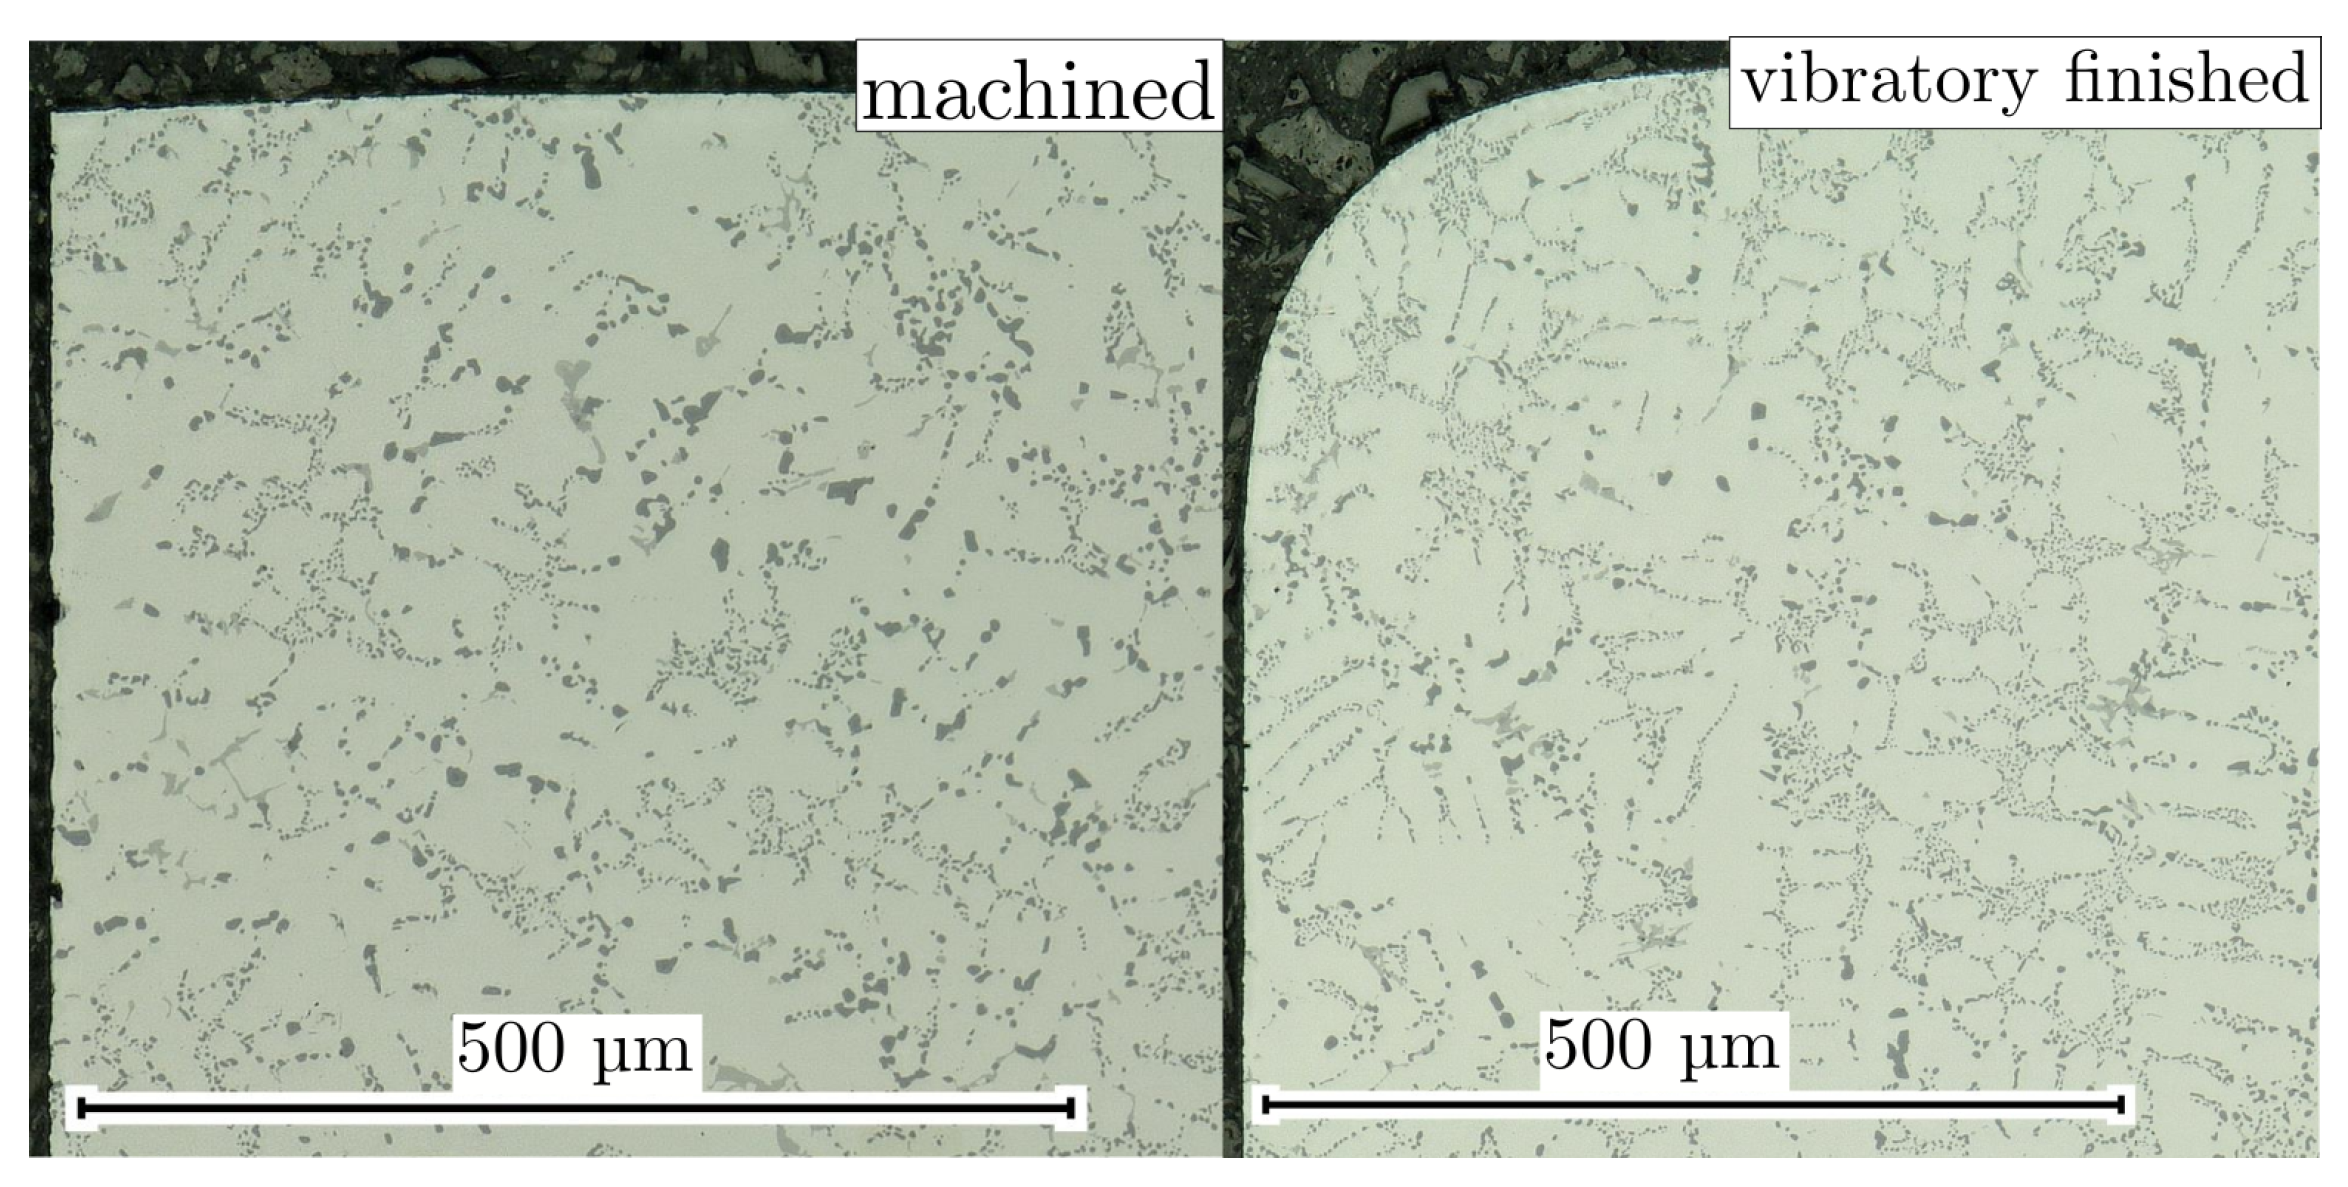
To study the fatigue strength of each layer itself, a thin-walled specimen geometry was additionally examined, as sketched in Figure 4. In order to enable the application of the Kitagawa diagram, a near-defect-free material resistance is required. Hence, specimens were manufactured from HIP + T6 heat-treated components from the blue marked layer in Figure 3 of Positions A and B, later referred to as BM. Ref. [13] represents a summary of standard heat treatment parameters for hot isostatic pressing for this alloy. The thin-walled specimen geometry for fatigue testing under uniaxial tension loading in Figure 4 possesses a thickness of 1.5 mm and manufactured samples ranging from Positions A to D. To minimize the stress concentration factor in the cross section, the specimens were firstly numerically shape-optimized. The radius near the test cross section is about 62 mm, featuring a smooth transition at the curved elliptical section. Thus, the resulting stress concentration factor is only 1.04 using 20-node quadratic brick elements with reduced integration in Abaqus; see Figure 4b. As the CNC-driven milling process produces sharp edges, specimens were additionally polished by a vibratory finishing process [66,67,68,69]. Thereby, the specimens were ground and polished with different abrasive media to obtain the required surface quality. In addition, a grinding of sharp edges occurred, and this reduced the influence of varying surface machining conditions to a minimum. Additionally, the human operator influence by polishing was prevented. A comparison between machined and vibratory finished edges is given in Figure 5.
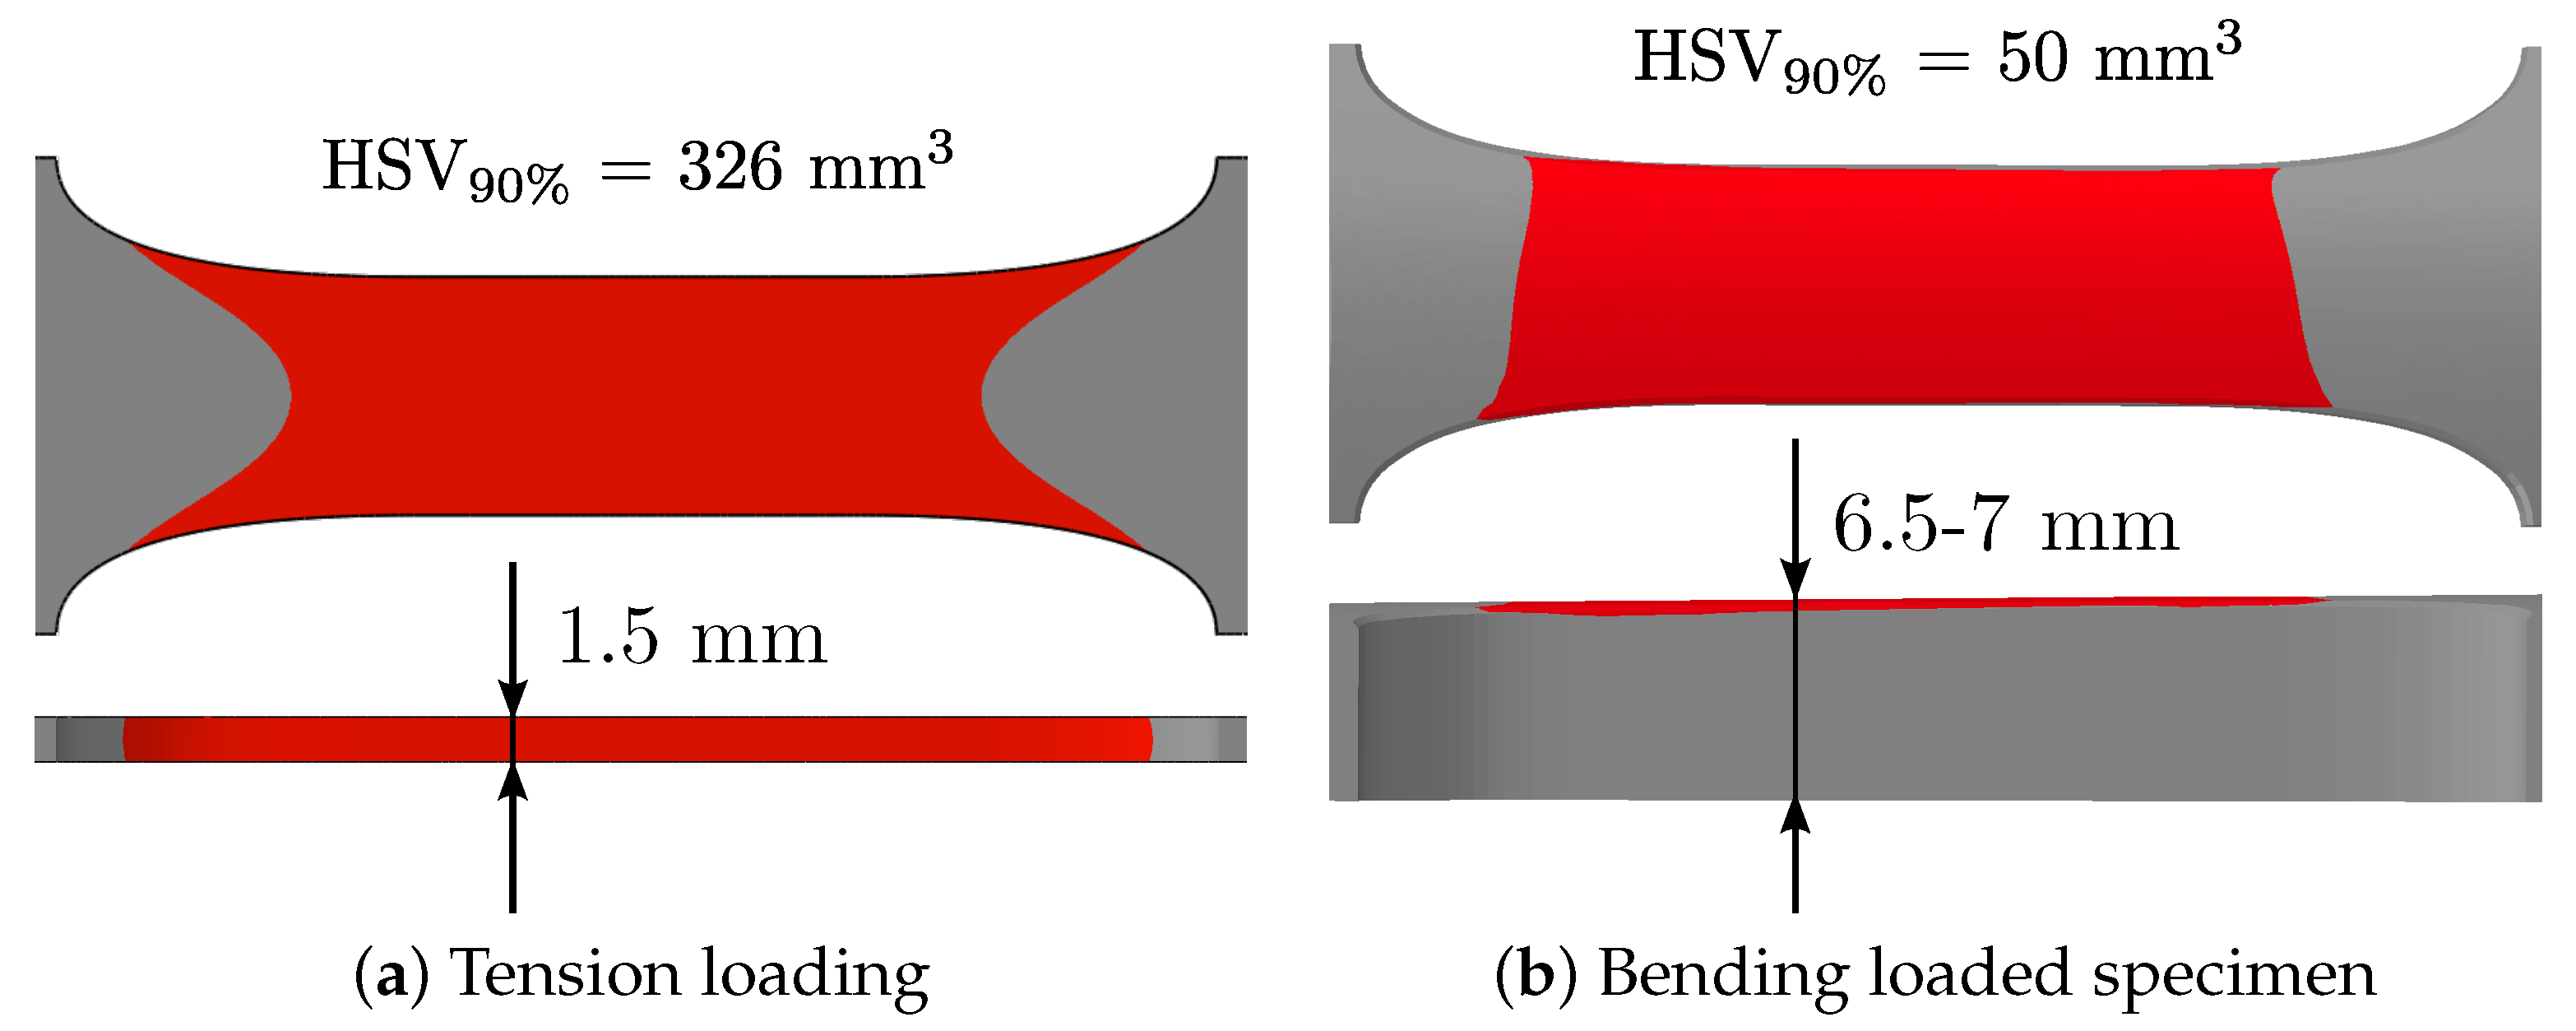
The statistical size effect was taken into account using the results of computed tomography, as discussed in Section 3. This requires the determination of the highly stressed volume (HSV) of the investigated specimens. A linear elastic finite element analysis was set up featuring an uniaxial tension load case for the specimens taken out of high- and low-porosity layers (yellow and blue) and a bending load case for the cast surface layer (red), depicted in Figure 4. The Abaqus element types applied were C3D20R (20-node quadratic brick, reduced integration) for tension specimens and C3D10 (10-node quadratic tetrahedron) for bending specimens. These were used to evaluate a highly stressed volume of 326 mm for tension and 50 mm for bending loading based on maximum principal stress analysis; see Figure 6.
3. Experimental Results
3.1. Computed Tomography
One of the main contributions of this paper is to take the defect sizes evaluated by computed tomography in the fatigue assessment methodology into account. This methodology was designed initially for the fractographic inspection of tested samples for different microstructural sections within AlSi-cast parts [21]. The machine used for µCT scans is a Phoenix V|tome|x c from General Electric (GE). Table 3 provides a brief summary of the process variables used for the non-destructive analysis of porosity within the initial specimen geometry.
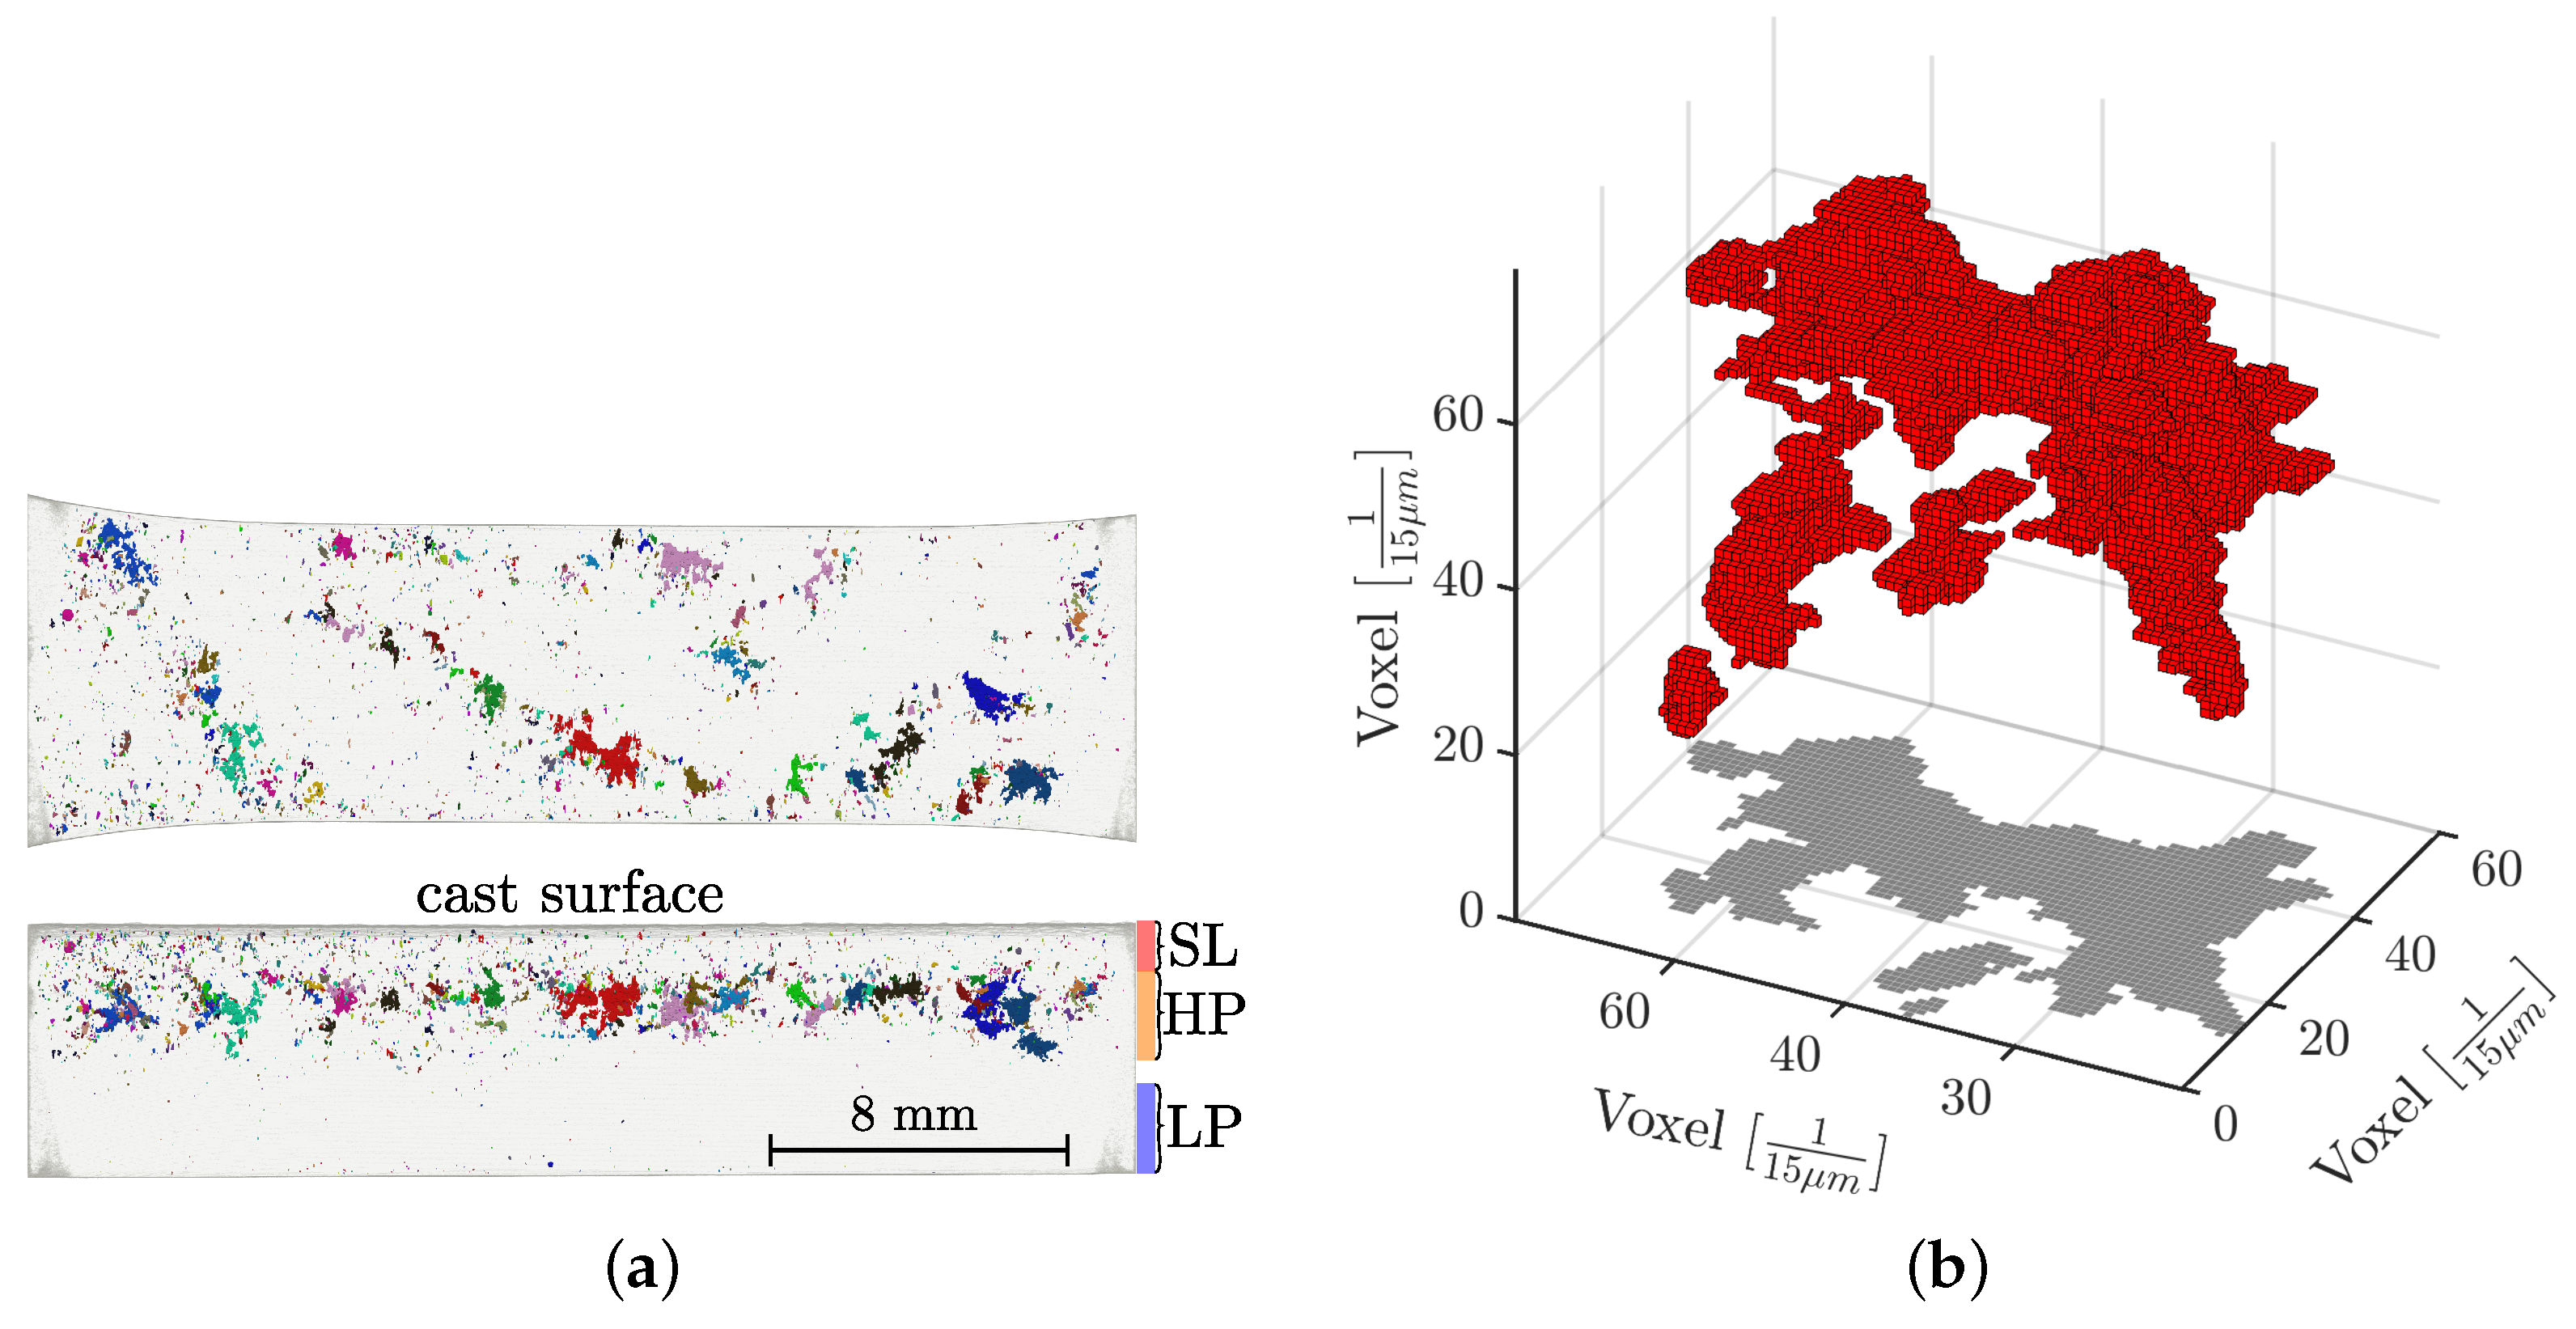
The subsequent processing of the raw data was performed by user-defined scripting with the Python3 language. Non-local mean tools were applied to filter the noise of the raw data, followed by segmentation that was performed using grayscale thresholding [70,71,72,73,74]. In order to evaluate the distance of the pores from the cast surface, an analytical surface representing the real nominal geometry of the cast part was fitted. A scan of an exemplary specimen with about a 7 mm thickness is given in Figure 7a. It is clear in this figure that the size and shape of the shrinkage porosity is not homogeneously distributed over the cross section of the specimen; therefore, the aforementioned layers (HP, LP, and SL) for fatigue testing are additionally illustrated in the figure as a reference.
Due to the sponge-like porosity networks, especially in the HP layer (Figure 7a), a clustering of defects is of utmost importance; therefore, defects are considered as interacting if the distance between two defects is less than the size of the smaller one, as proposed by Åman [57,58] or Murakami [17]. According to this proposal, interacting defect networks are shown with matching colours in Figure 7a. The effect of clustering defects on statistical distributions will be explained in more detail at the end of this section. After the clustering of the defects in the CT data, the projected area perpendicular to the load direction is evaluated, depicted exemplarily in Figure 7b. The projection vector is kept normal in relation to the load direction, which is the horizontal axis in Figure 7a.
One challenge regarding CT is the relationship between the size of the region of interest (ROI) and the resolution of the setup. For example, if the kind of porosity is quite complex (such as the material used in this study), the resolution should be fine, approximately in the range of 10 up to 15 µm. Assuming that the size of the detector is about 4000 pixels, the maximum size of the scan is from approximately 40 to 60 mm. In reality, the maximum size of the part is somewhat reduced, but the stitching of multiple scans increases the maximum size significantly, leaving only the challenge of the scanning time required. One further task in this study is the deduction of the defect distribution of the fractographic investigations via the CT scans of small partitions of the cast part to reduce the effort of component-like CT scans to an adequate minimum.
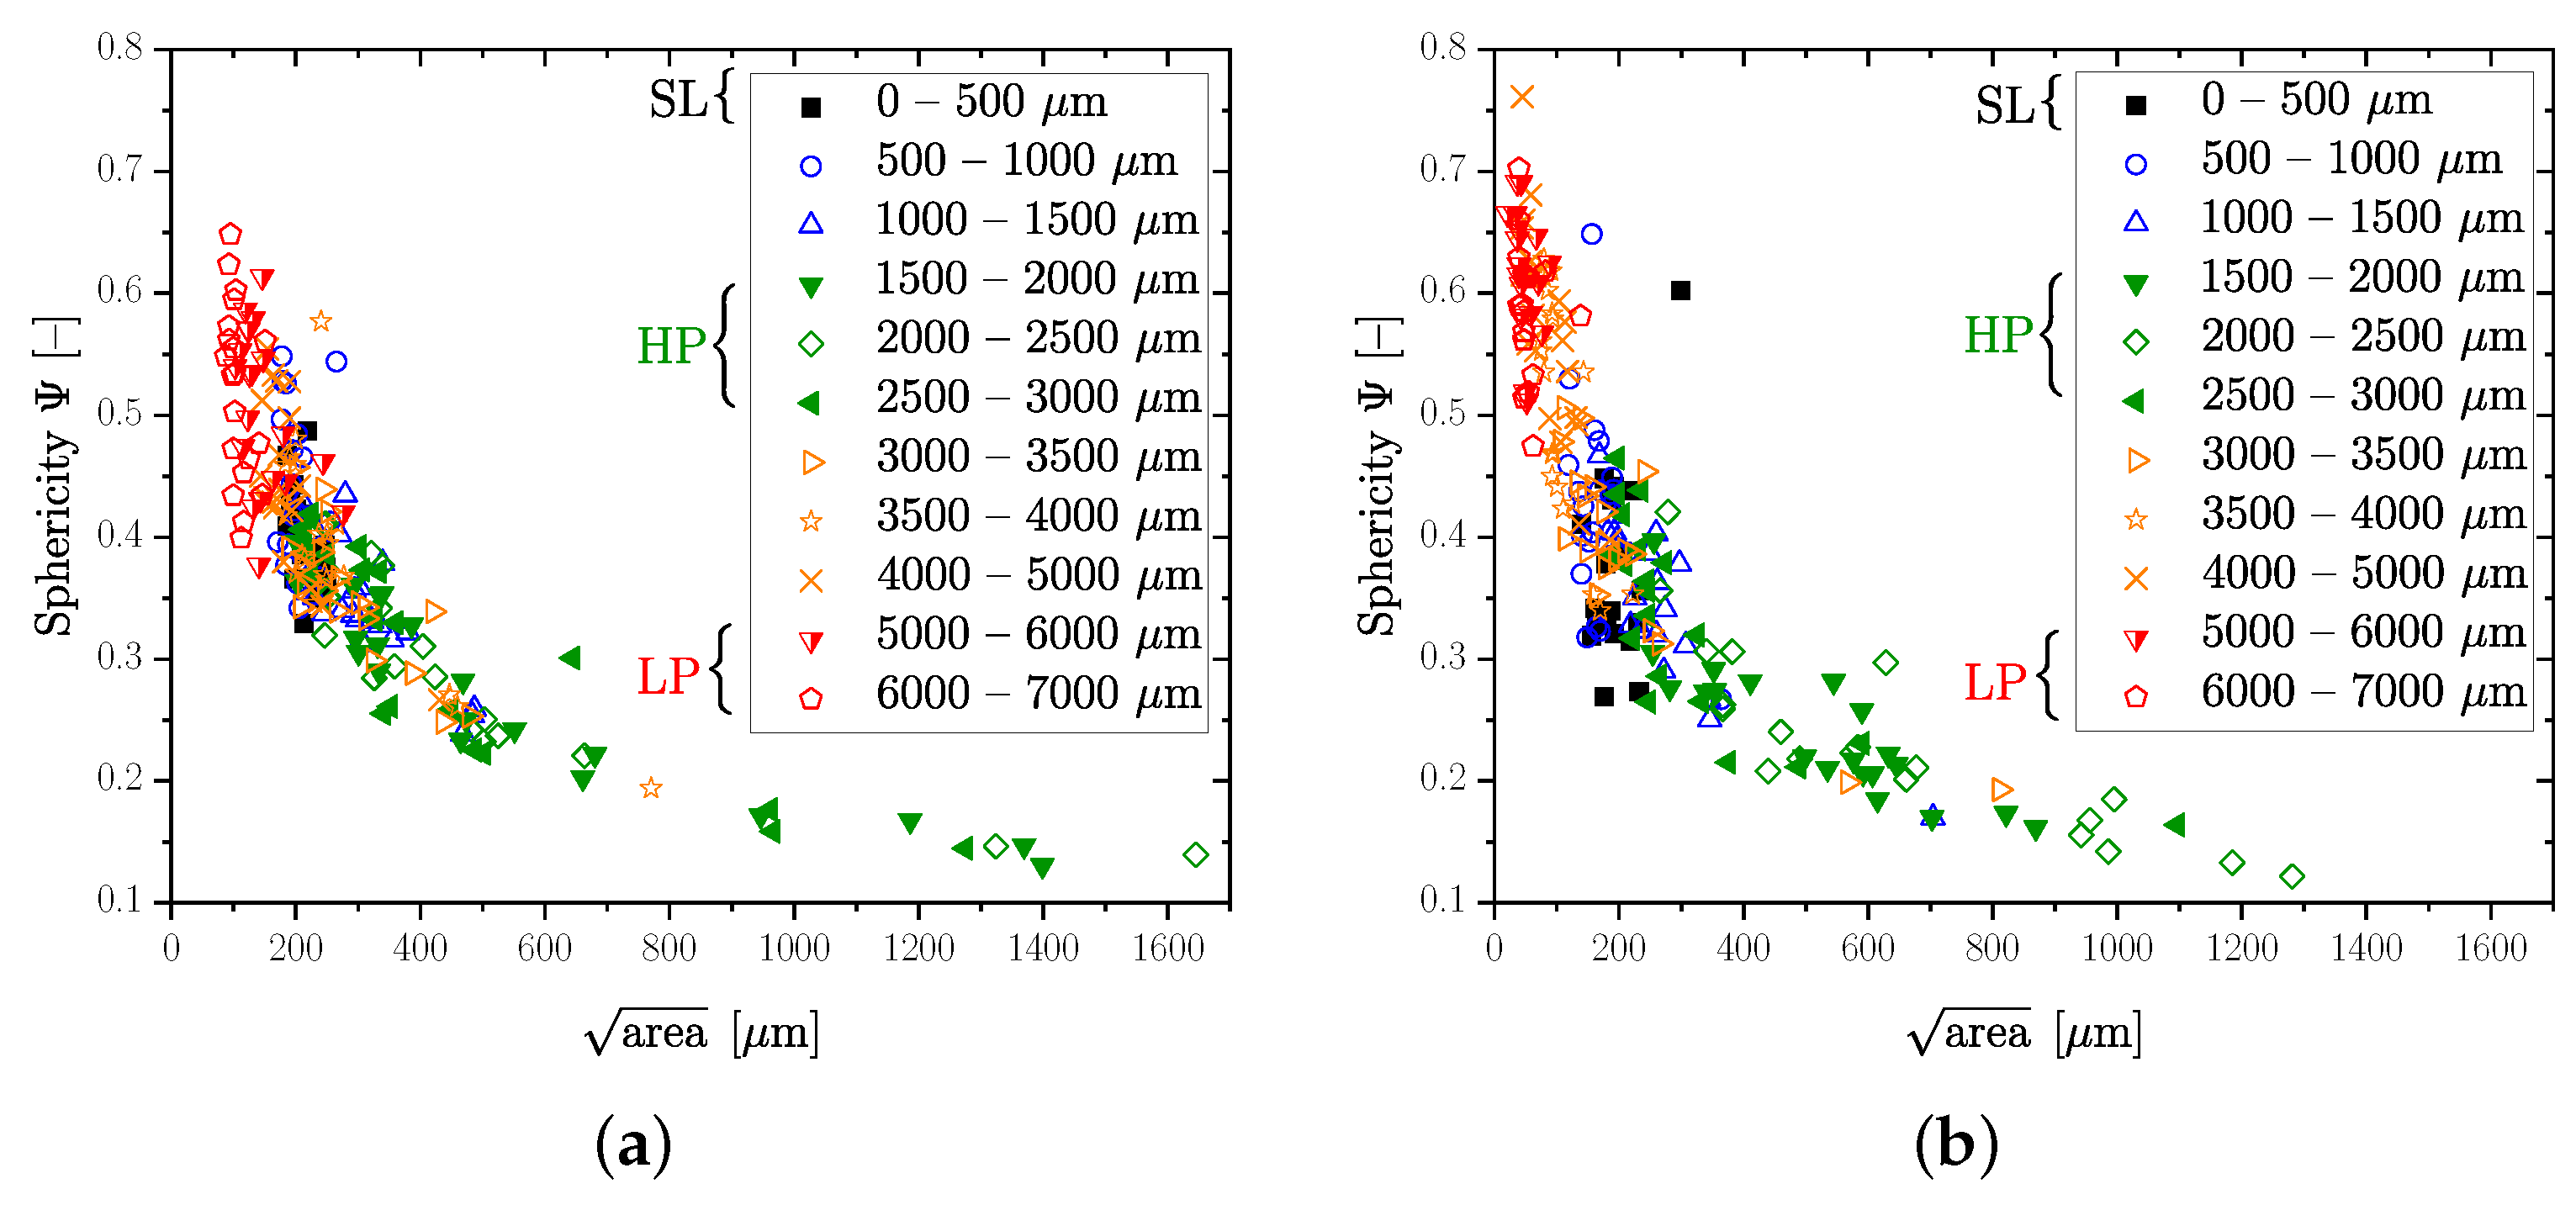
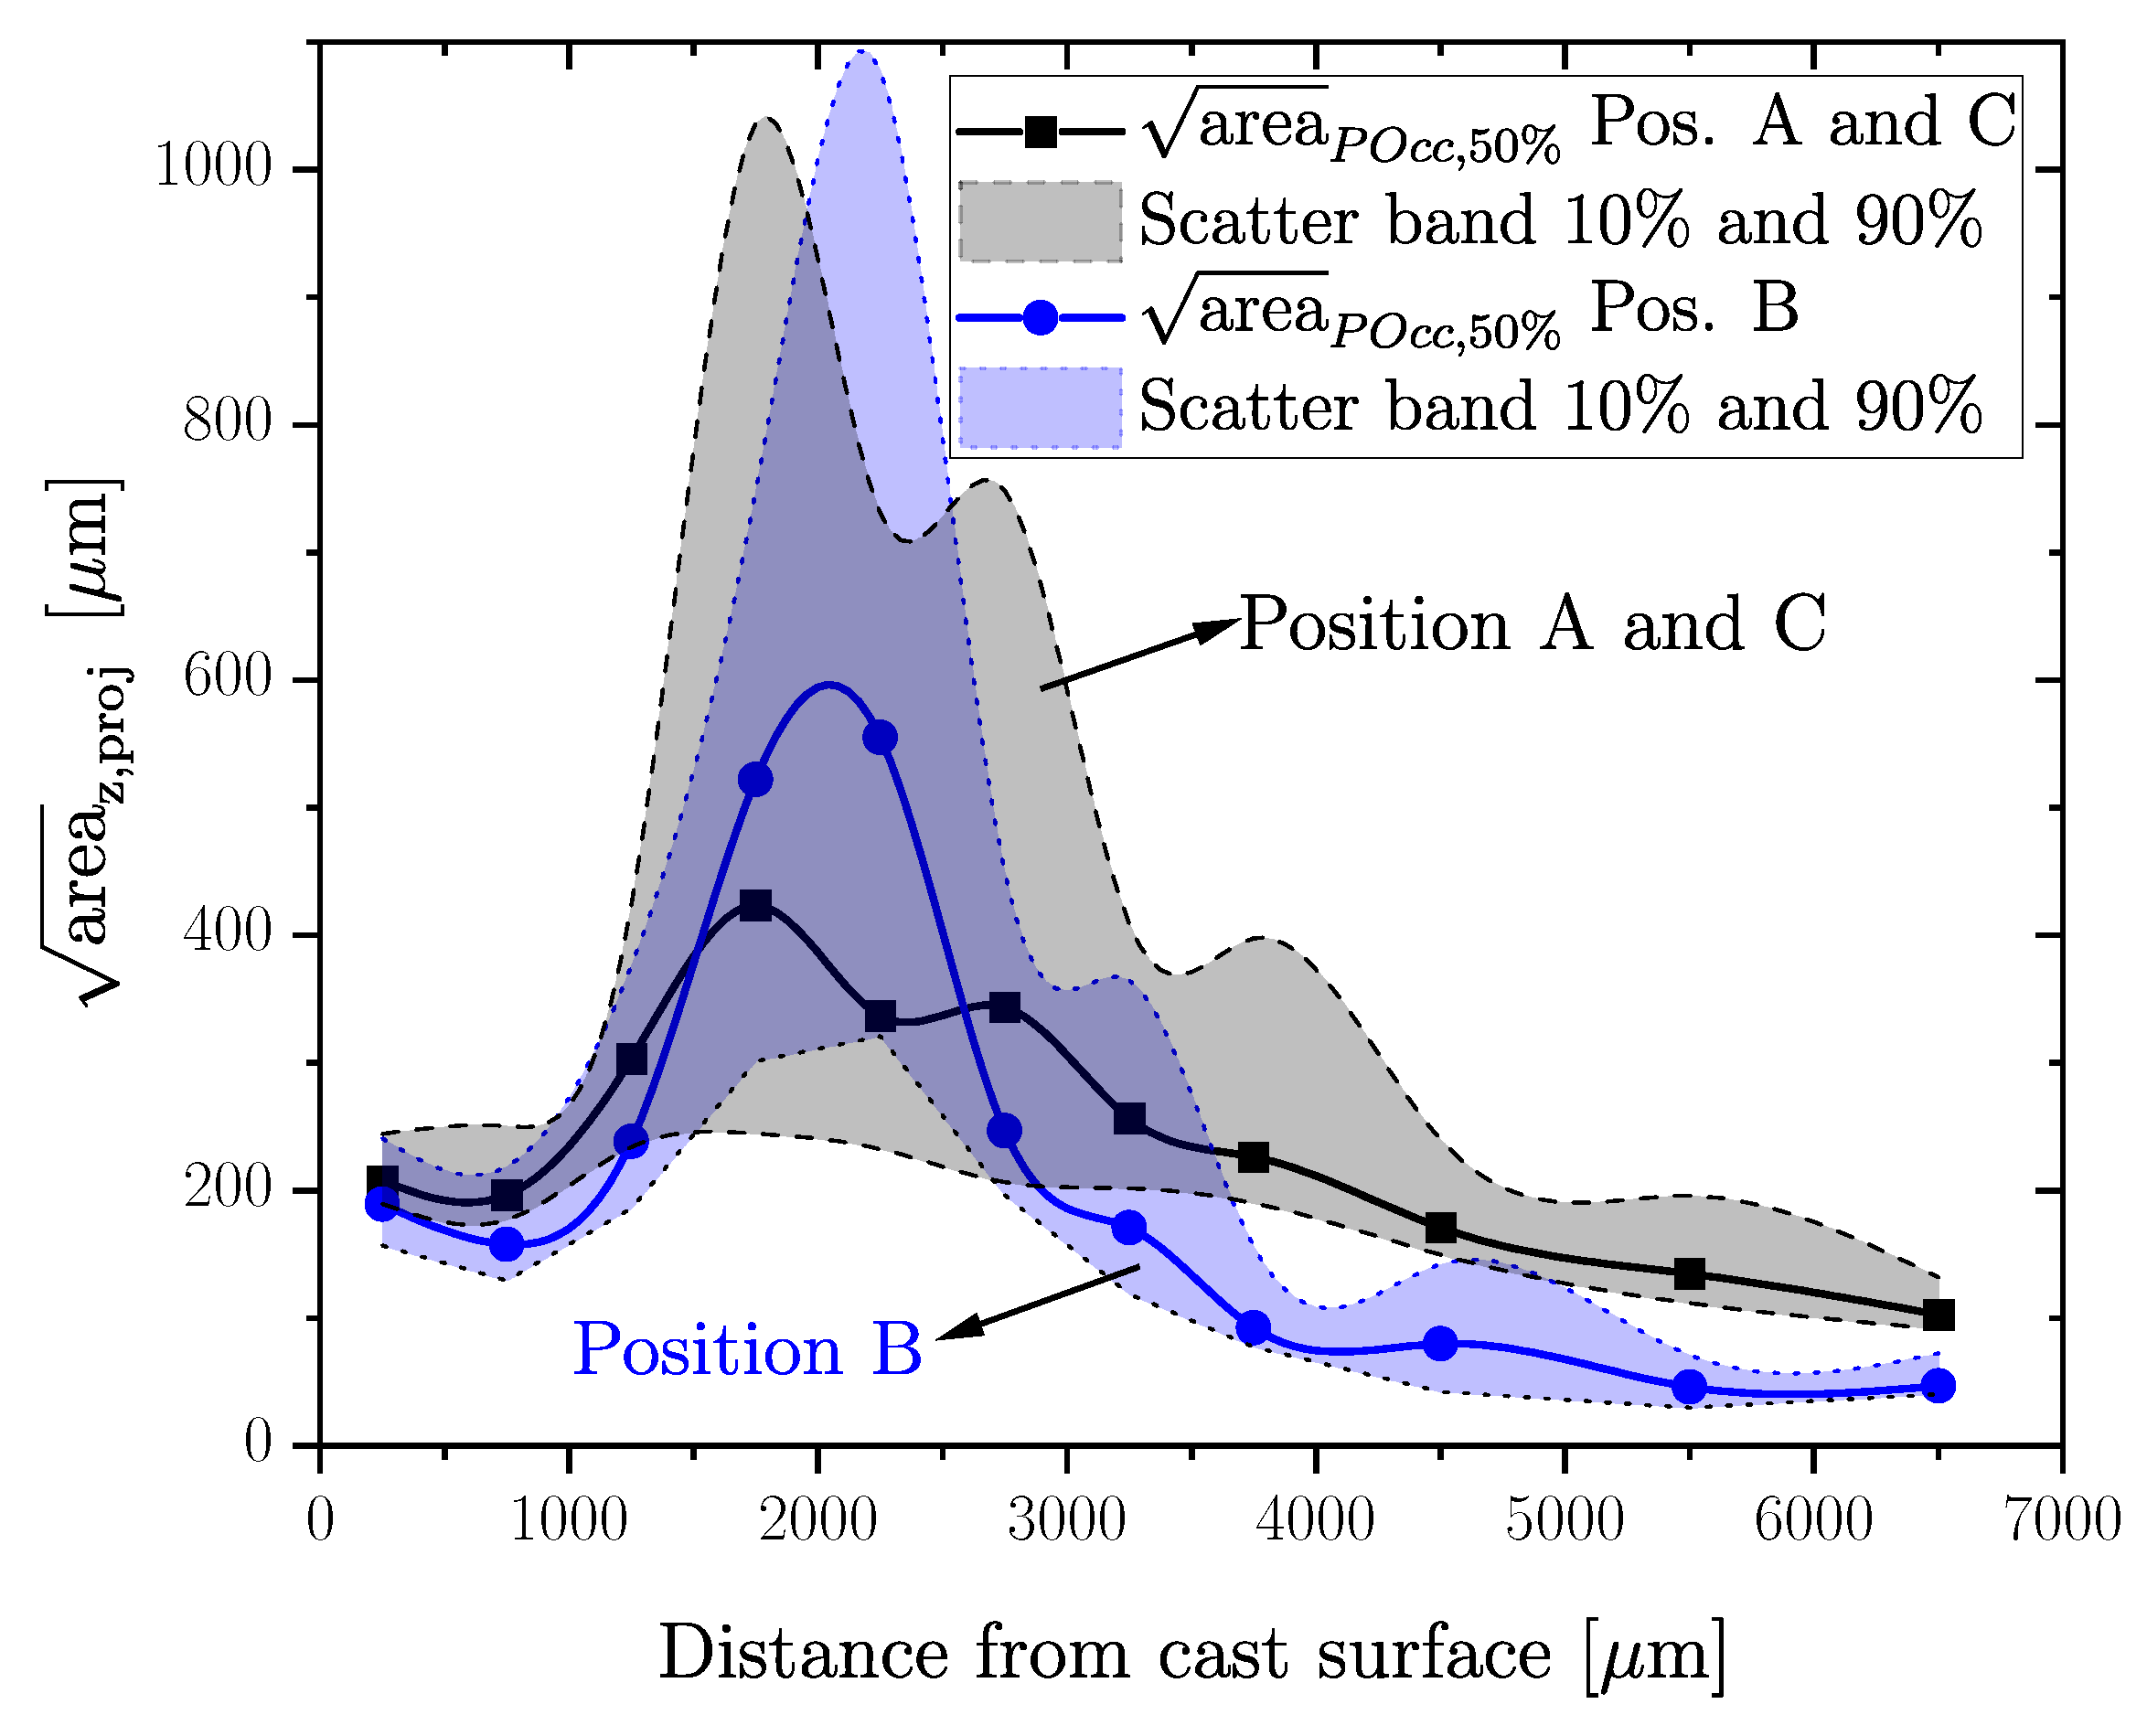
The overall aim of this paper is a layer-based fatigue assessment depending on the local porosity distribution. Therefore, the CT data are subdivided into layers of defined spacing. Beginning at the surface up to a depth of 4 mm, the layer thickness is set to 500 µm. For the remaining section, a layer thickness of 1 mm was chosen due to the low degree of porosity and therefore the low quantity of available pores for statistical assessment. Figure 8 depicts the sphericity over for all layers of the initial specimen geometry. The evaluated sphericity, calculated according to Equation (6), gives important information about the shape of the defects: All of the largest defects of the investigated positions are very complexly shaped, confirming the sponge-like porosity of some investigated layers. Especially the HP layer at a depth between 1.5 and 3 mm exhibits this kind of inhomogeneity, exemplary depicted in Figure 7. For this reason, the evaluation of the GEV distribution of defects is based on the 10 largest imperfections found in each layer, for each investigated specimen, in order to avoid an underestimation of the critical defect size population. Similar approaches have been made by the authors for cast material [33] and additive manufacturing [75].
Additionally, for each HP and LP position, two CT scans were conducted, resulting in 10 maximum inhomogeneities for each layer and scan due to the above-mentioned methodology. As a result, layers of the same specimen positions are merged together, resulting in 20 defects for each layer. For the subsequent statistical GEV evaluation of the merged dataset, the proposal of [31] was applied using Matlab®. The cumulative distribution function (CDF) of the GEV is given in Equation (1). A Kolmogorov–Smirnov (KS) test was conducted at a significance level of 5% to determine the goodness of fit for the statistical assessment of the distribution [76]. The empirical distribution of the samples was therefore compared with a hypothesized distribution. Thus, a value of indicates a matching compliance between fit and data. In addition, the parameters for the distributions in this paper were statistically evaluated using the maximum likelihood estimation [28]. A summary of the statistical assessment within the above mentioned layers for Positions HP and LP is given in Figure 9. The trend of the pore size depending on the distance from the surface is plotted for the projected for a probability of occurrence as a solid line with data points for the middle of each layer. Additionally, the scatter band for and of the corresponding distribution function is plotted as a dotted line and a dashed line, respectively, in Figure 9. The pore size for ranges from 46 to 555 µm for the HP specimens and from 102 to 424 µm for the LP specimens. Particularly, in the HP layers, an increased scatter band of the values for and can be observed. The reason for that is the occurrence of few very large defects in these sections, leading to a flatter curve of the GEV fit. In contrast, layers inheriting smaller defects result in a steep course of the cumulative distribution function and a lower scatter band of the data.
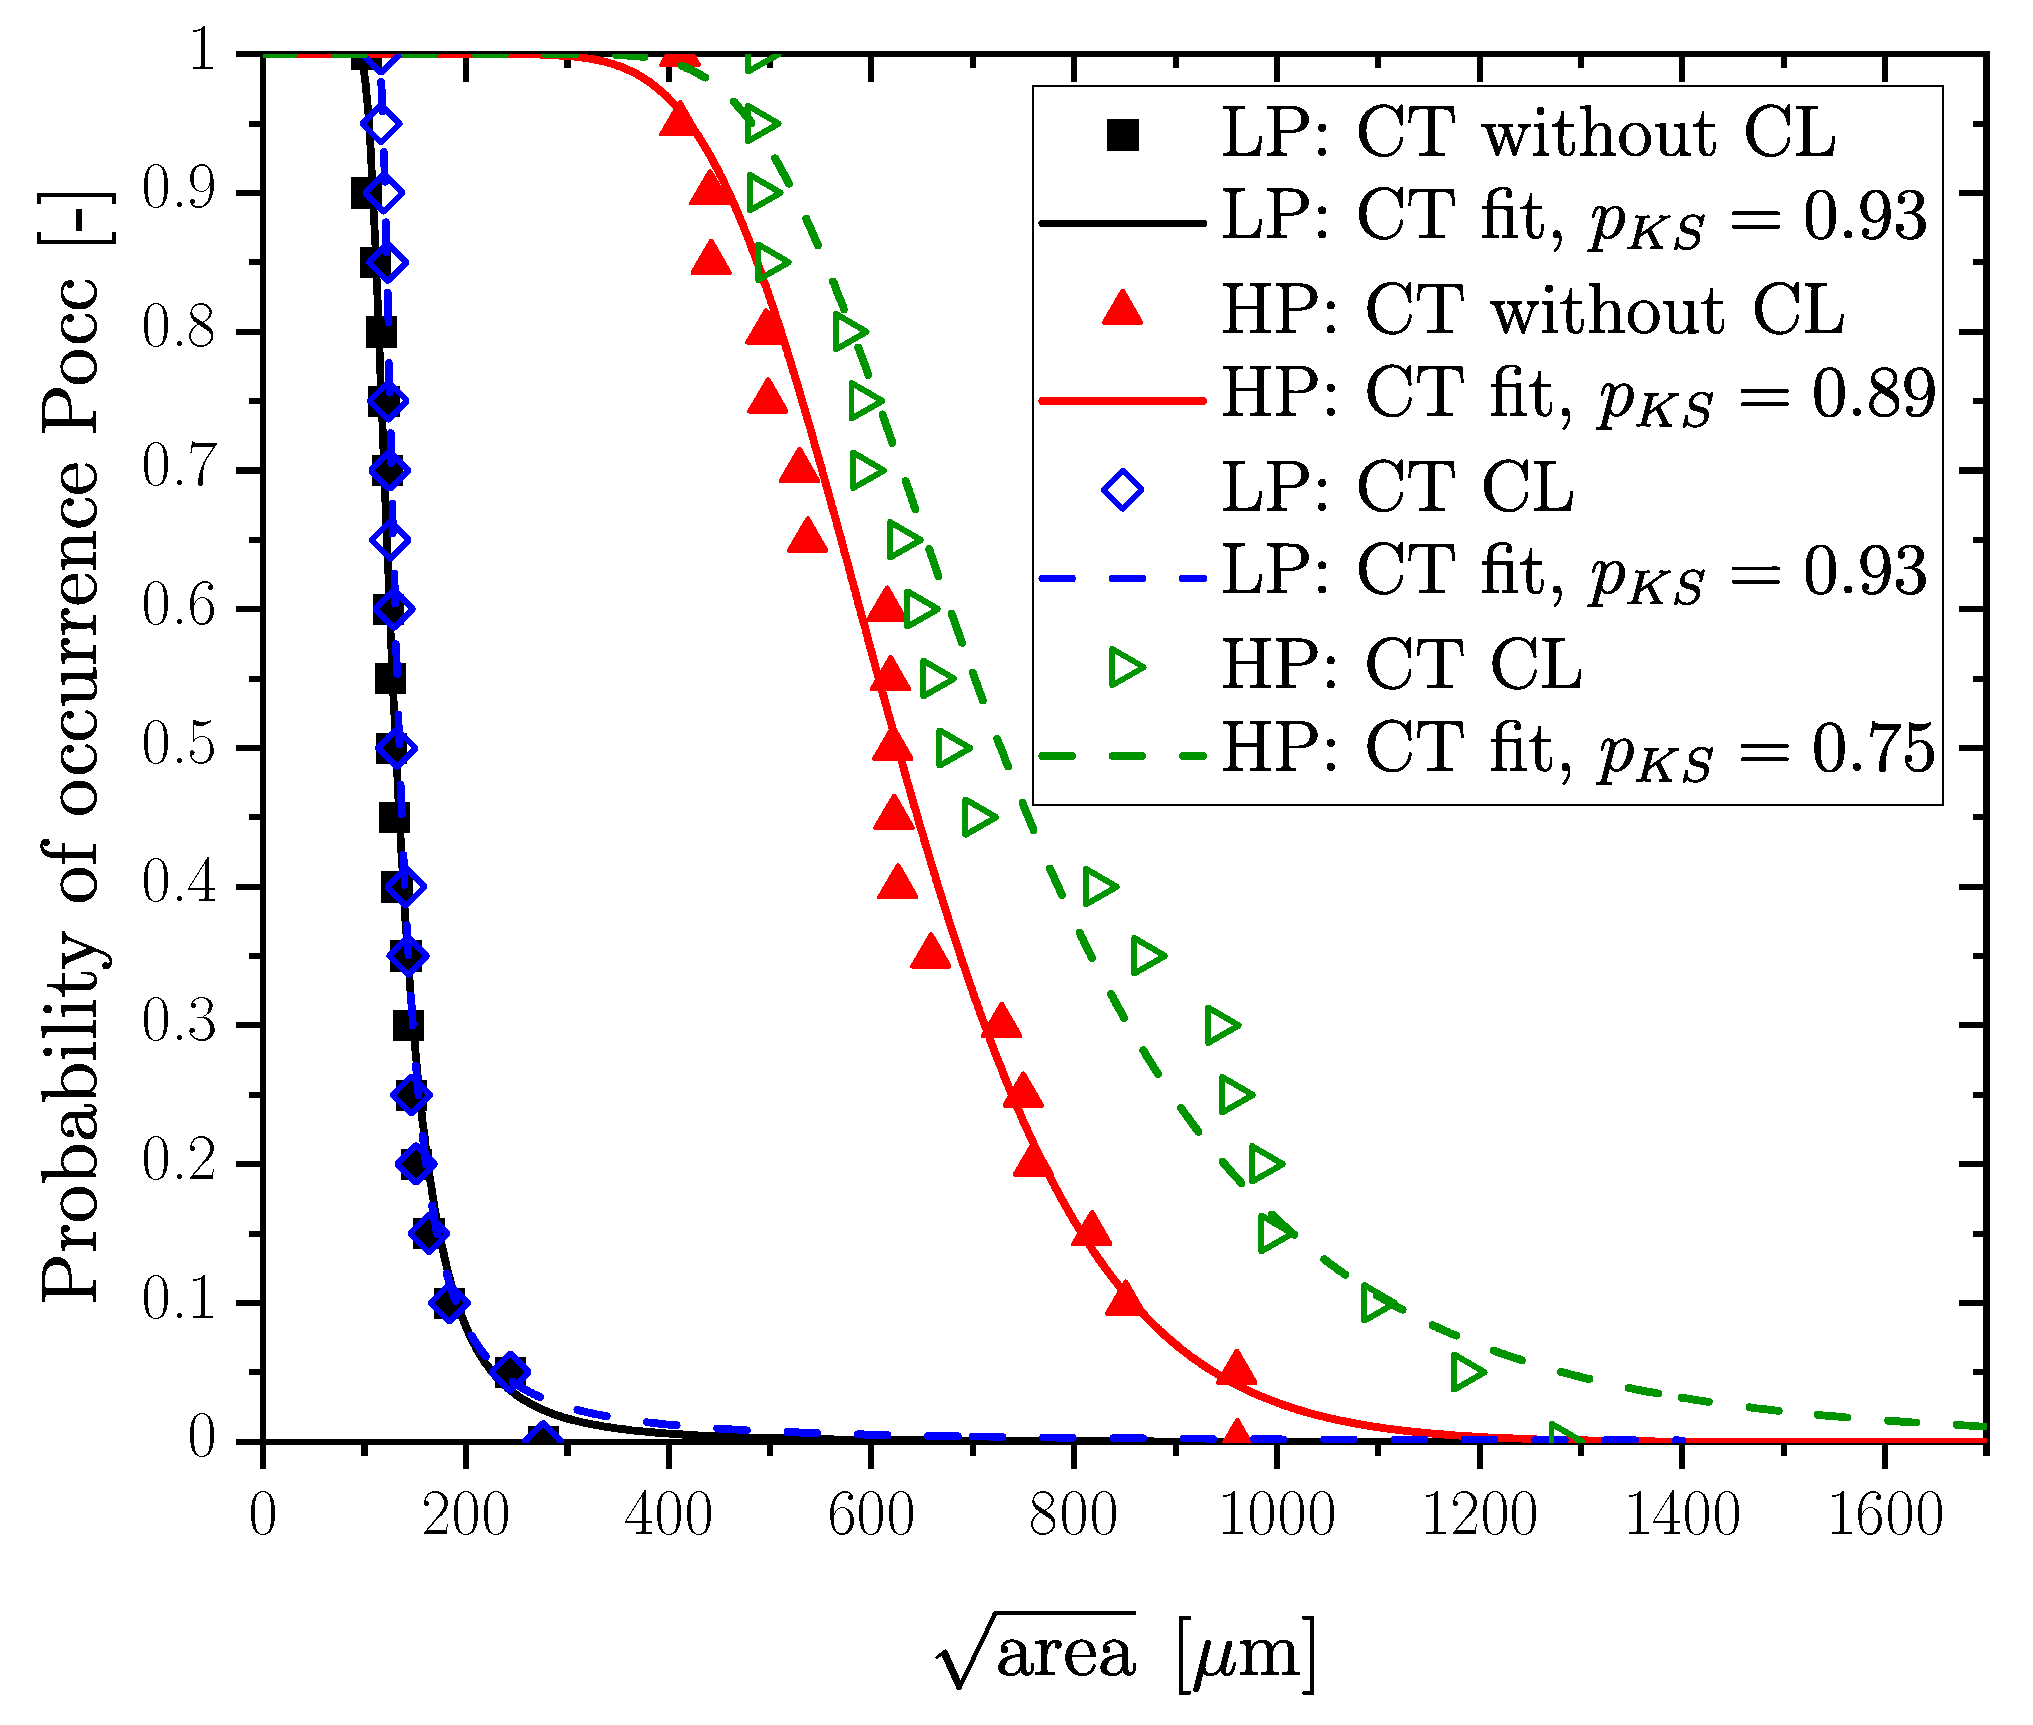
In detail, a reason for the occurrence of large pores in the HP layer could be the effect of complex clusters of defects, or the sponge-like texture. To investigate the effect of clustering (denoted as CL in the legend of Figure 10) for defects according to the above-mentioned methodologies, the cumulative distribution function was evaluated for the HP (1.5–3 mm) and LP (5.2–6.7 mm) layers of differently evaluated raw data; therefore, pores were additionally accounted for without consideration of the interaction to each other in the investigated samples. Particularly, in the case of a high pore density and a complex shape (low sphericity), as well as a large pore size, a clustering of defects according to Åman [57,58] has a significant influence on the defect distribution, as shown by the green and red lines in Figure 10; however, a low pore size and density with high sphericity lead to a negligible difference between the distributions, as shown by the black and blue lines in Figure 10. A summary of the effect of clustering on defect distribution for the investigated sections is given in Table 4.
3.2. Fatigue Strength
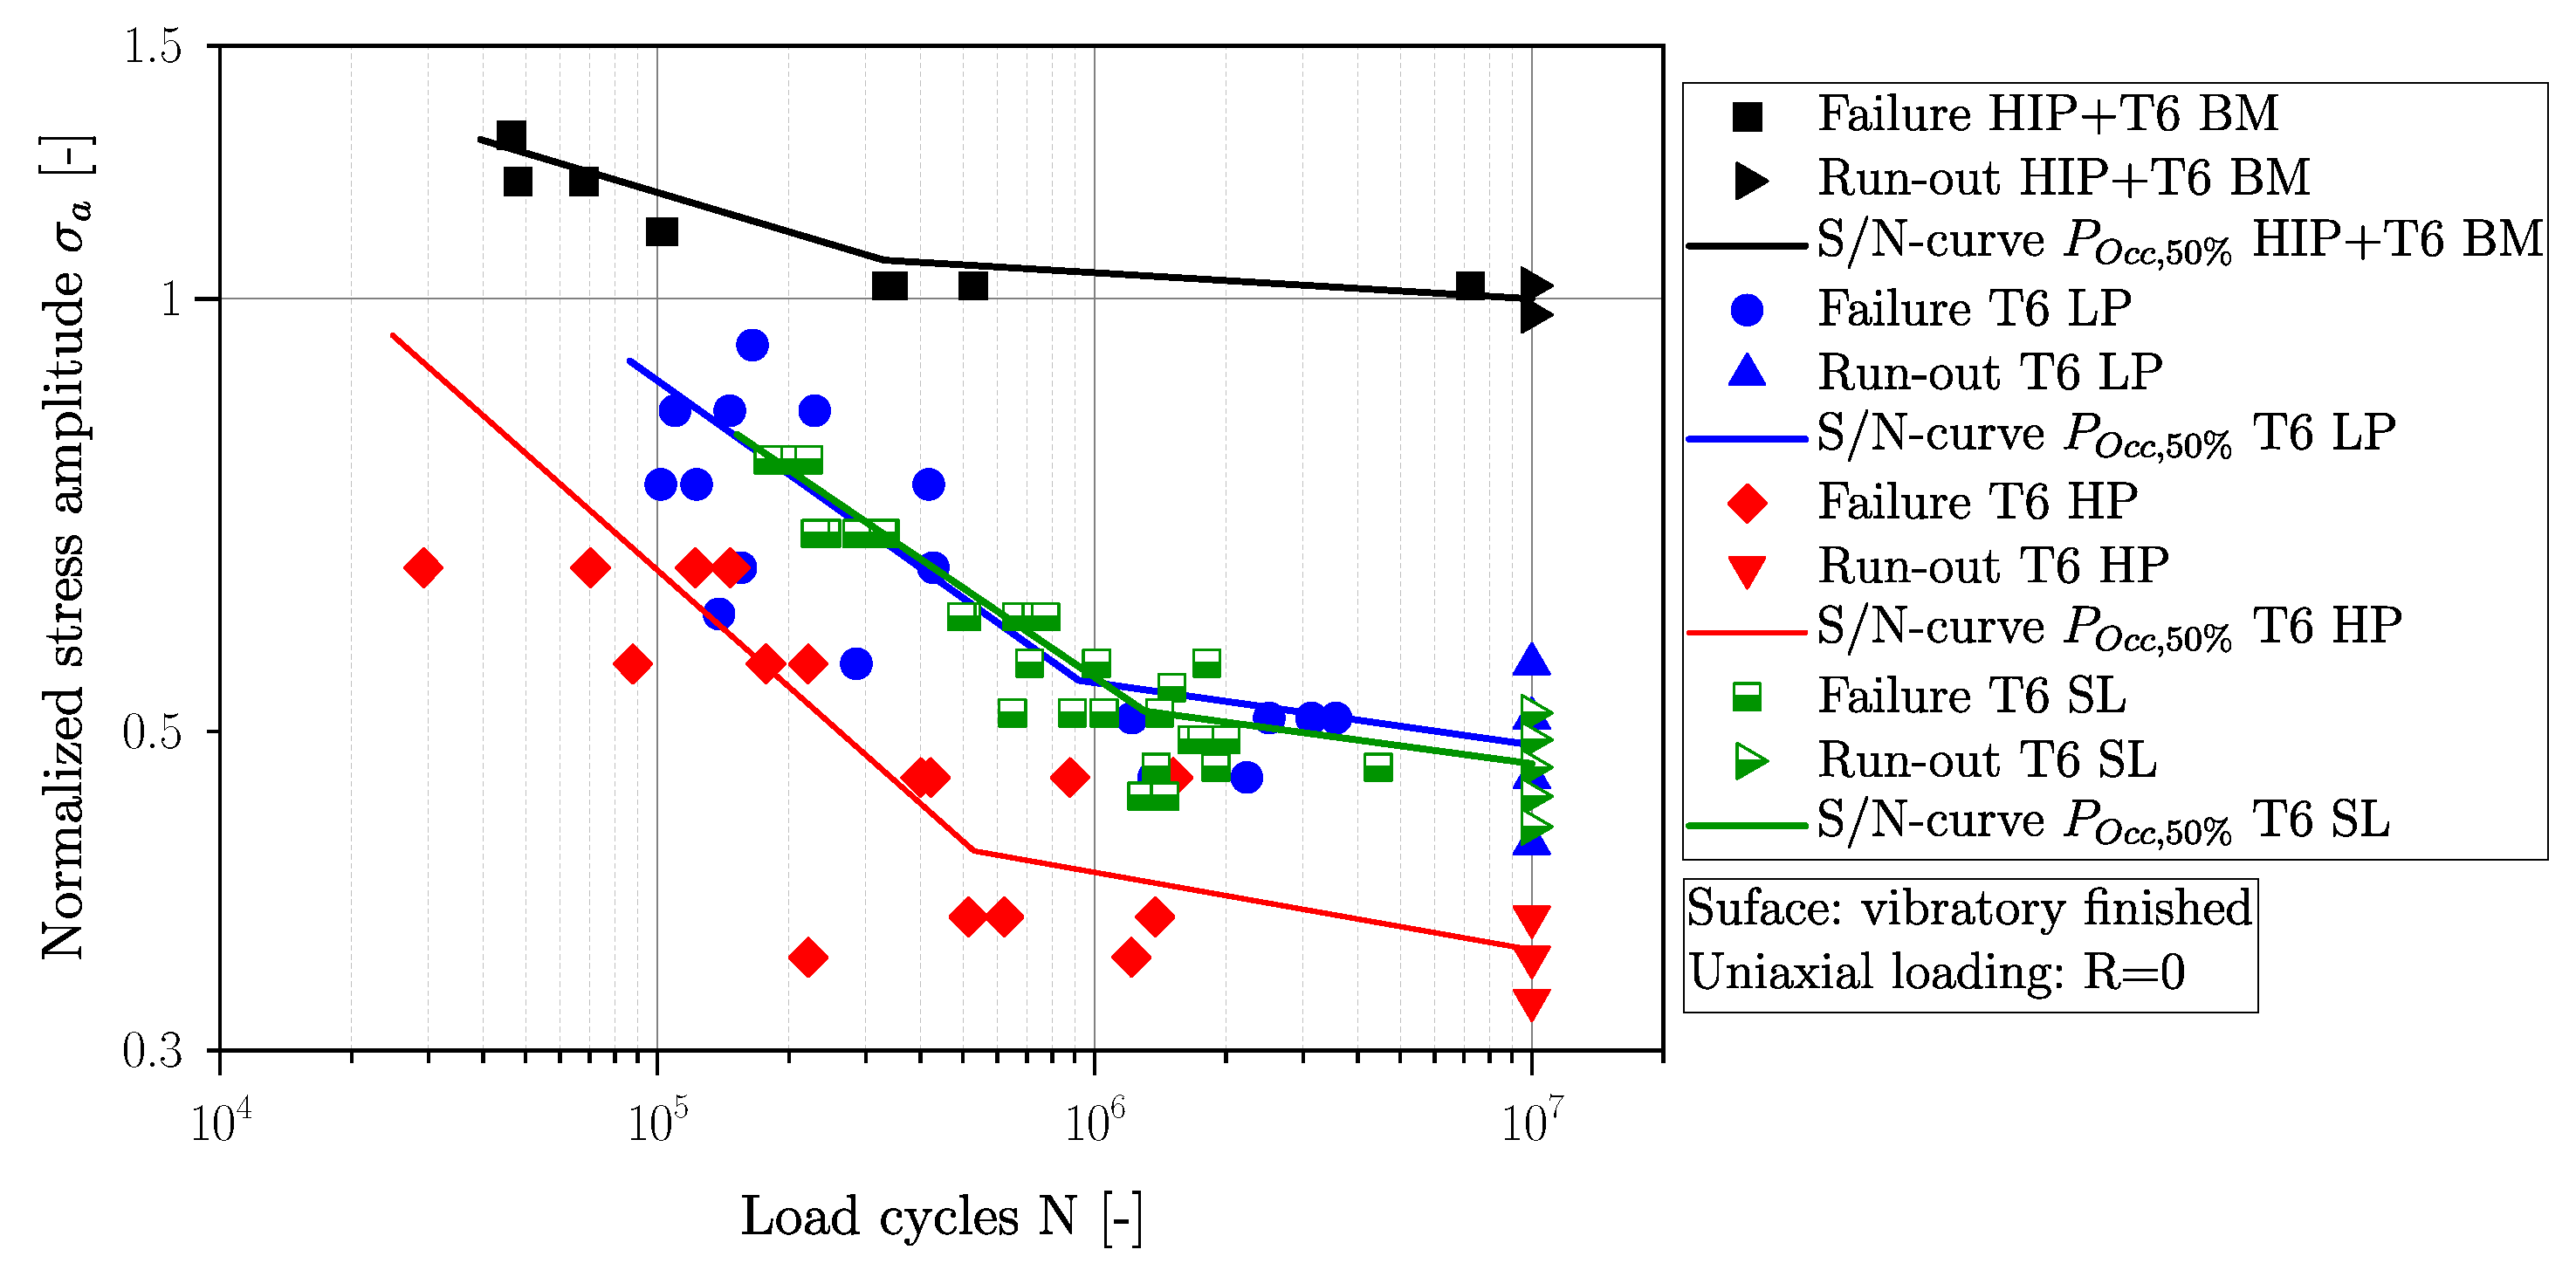
The fatigue strength of the near-defect-free material (HIP + T6) and the specimens with high and low porosity content (T6) is determined using a resonant test rig with a testing frequency of about 108 Hz for uniaxial cyclic tension loading at a stress ratio of R = 0. Furthermore, the surface layer fatigue strength was tested at a resonant test rig under bending loading at a frequency of about 66 Hz. The number of specimens ranges between 15 and 30 for each S/N-curve in order to determine a statistical long-life fatigue strength. Focusing on the long-life fatigue region, the run-out number was set to 10 million load cycles. These run-out specimens were subsequently re-inserted at high load levels within the finite life region [77]. As recommended in [48,78], the slope of the S/N-curve in the long-life region scales with the slope in the finite life region and is therefore assigned with . In the finite life region, the S/N-curve was evaluated according to the statistical procedure given in the standard [79]. The long-life fatigue strength is estimated at a probability of survival invoking [80].
All of the fatigue data in Figure 11 are normalized to the long-life fatigue strength of the near-defect-free material (HIP + T6) for a probability of occurrence of 50%, later referred to as normalized stress amplitude and presented as a black line in the aforementioned figure. The slopes in the finite life region of the defective specimens (LP, HP, and SL) are quite similar and range from 3.7 to 4.8, whereas the slope of the near-defect-free material (BM) is significantly increased with . Comparing the scatter indices of the investigated layers, fatigue data from the defective material feature an increased scatter index in a range from 1:1.19 to 1:1.3, compared to the near-defect-free material, resulting in a substantially reduced scatter index of = 1:1.06; however, a summary of the fatigue data for all positions is given in Table 5.
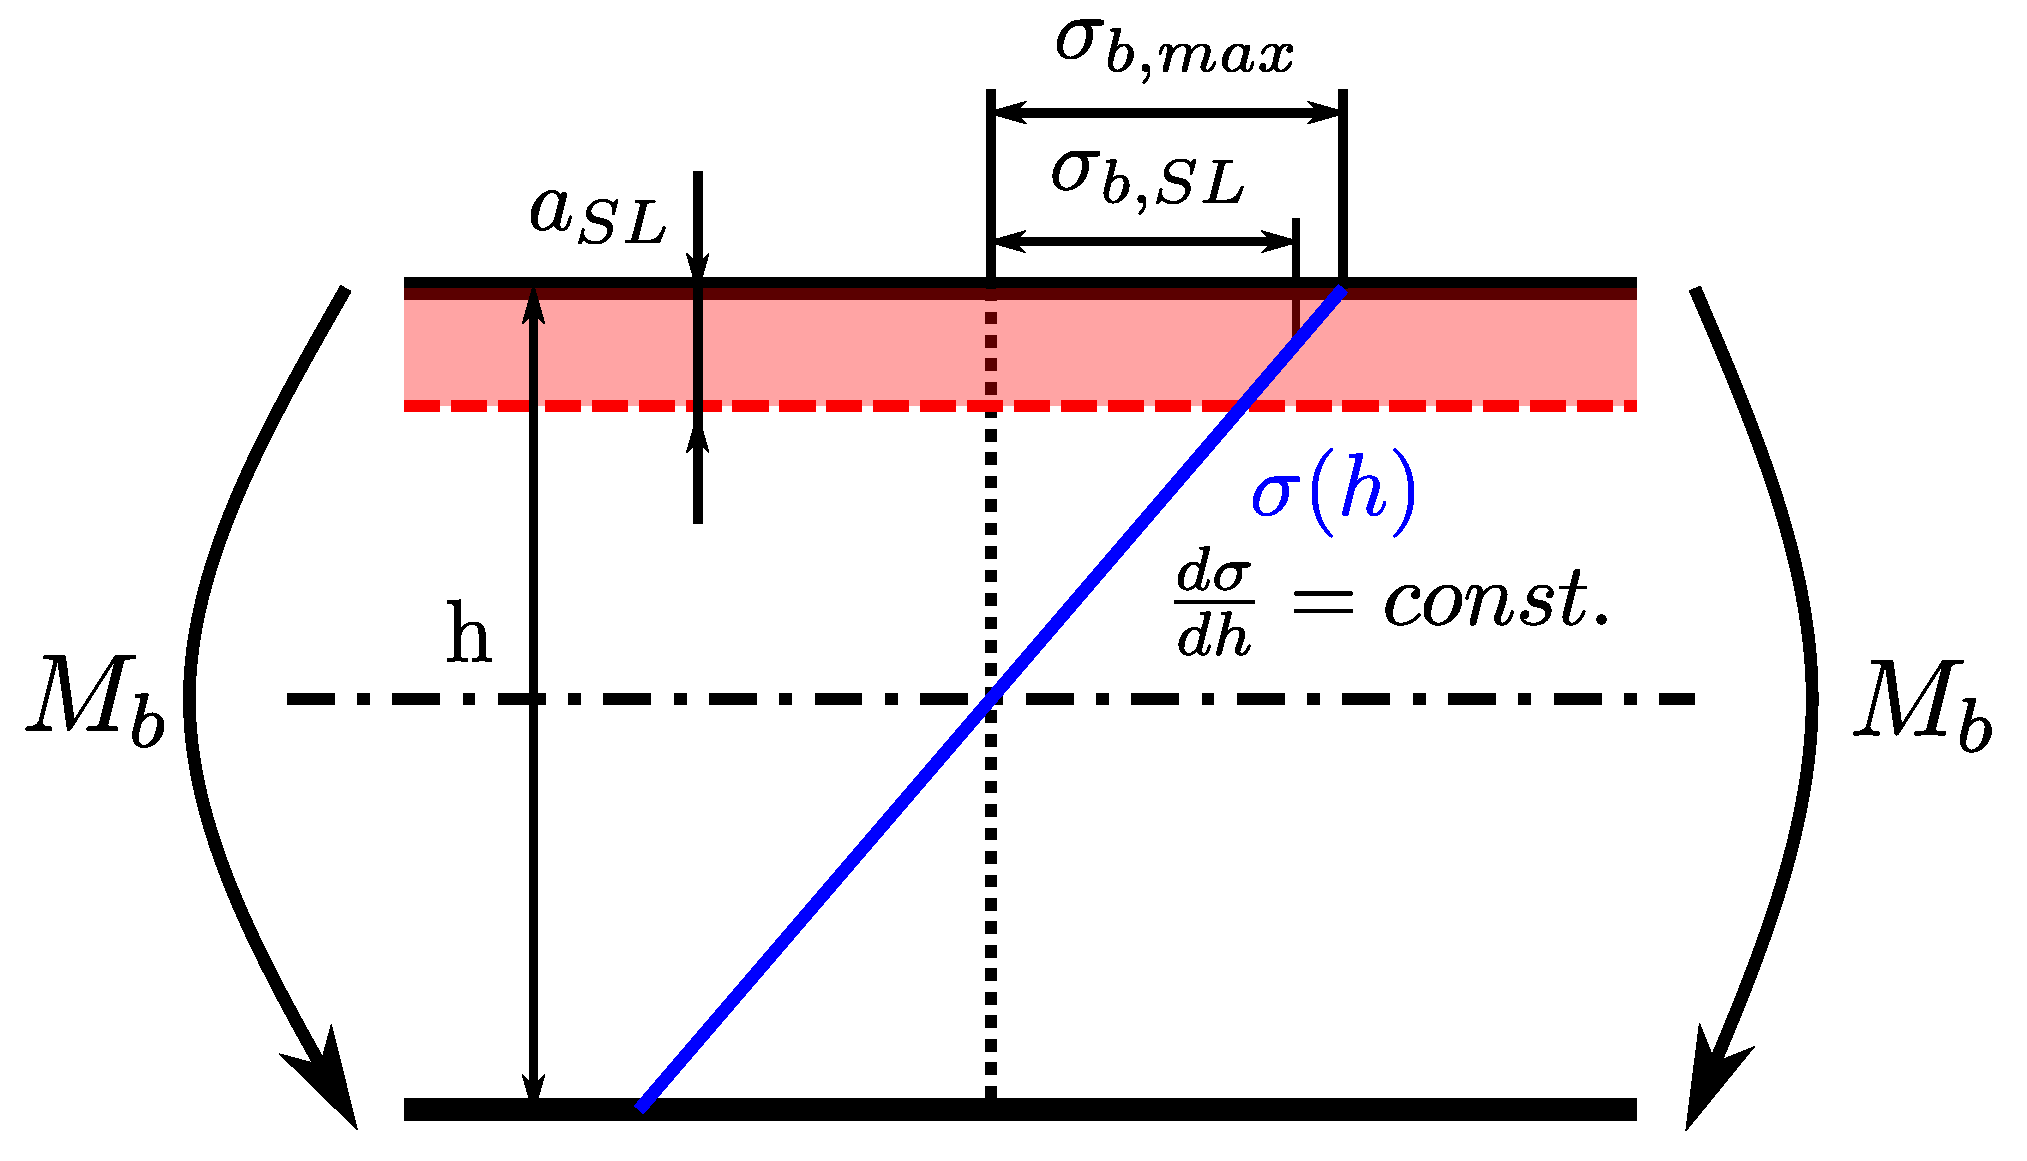
Although the SDAS of all investigated positions is quite similar (Figure 2), an effect of porosity can be clearly observed; see Table 5 and Figure 11. The long-life fatigue strength of the HP layer is reduced by 65% compared to the near-defect-free material, as well as layer LP featuring a reduction of 51%. In order to enable a comparison of the nominal stress state within the surface layer with the BM, LP, and HP layers, a mean normal stress is calculated according to Equation (7) for the bending load case; see Figure 12.
3.3. Fractography
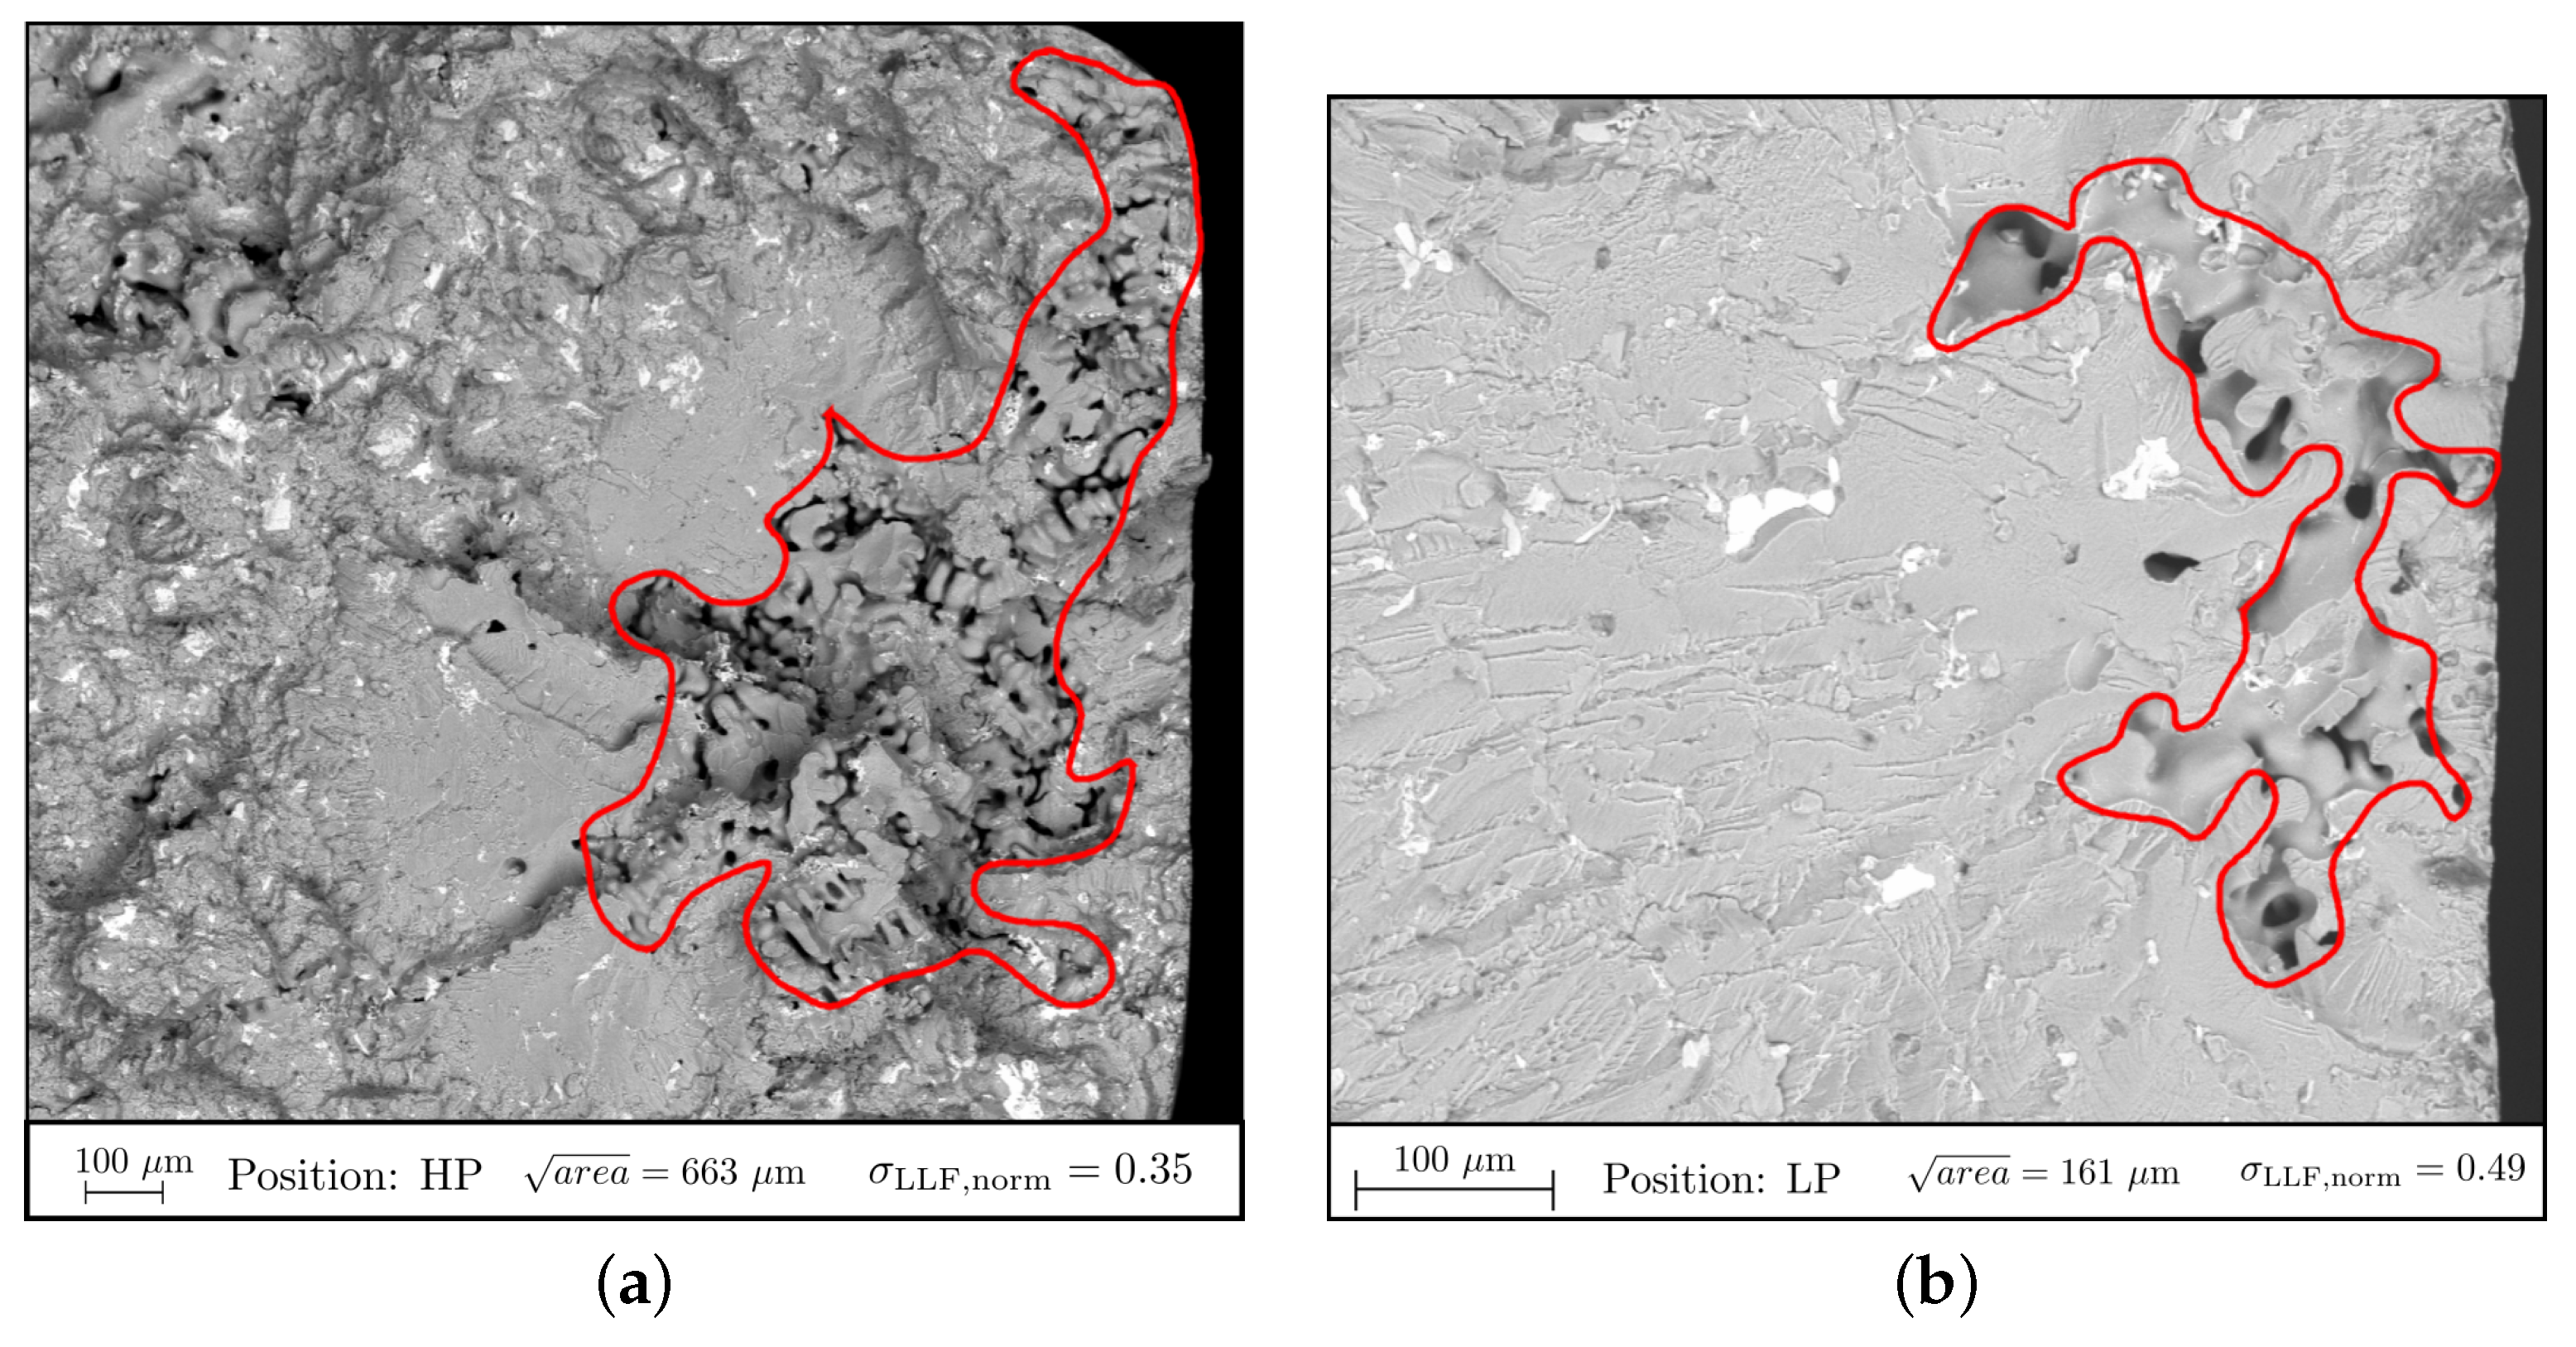
The crack initiating defect sizes of the HCF specimens were evaluated after fatigue testing utilizing a digital optical microscopy for macroscopic inspection and scanning electron microscopy for local analysis. The defect sizes were evaluated by their precise contour in the LP layer (see Figure 13b) according to previous investigations [13,21] in contrast to the coarser method proposed by Murakami [17], where a smooth hull contour, enveloping the original shape, was utilized. Due to the sponge-like microstructure in the HP layer, a measurement of the precise contour of the clustered porosity is not quite feasible. Subsequently, sponge-like pore networks were measured by their surrounding boundary, exemplary depicted in Figure 13a; therefore, a spline was drawn manually at the contour of the defect, or the pore network, using Fiji, enabling a rapid calculation of the enclosed area. This manually adjusted, semi-precise measurement leads to smaller but more precisely determined defect sizes in comparison to Murakami’s approach. Hence, the distortive effects of a projected pore shape on the statistical evaluation of defect sizes are reduced. Moreover, a direct comparison of fractography and CT is more feasible. The analysis of the initiating cracks of the specimens from the LP and HP layers revealed that, in most cases, the crack initiated at the surface near defects, depicted in Figure 13. One reason might be the increased stress intensity factor of surface-intersecting inhomogeneities, as the near-surface defects lead to a lowered crack initiation phase compared to defects within the bulk volume [17,81].
In summary, the fractographic analysis revealed that, in most cases, the crack initiation starts at the shrinkage porosity near the surface; see Figure 13. Additionally, interactions between defects are taken into account in the procedure described in Section 3.1. Following the methodology applied for the statistical evaluation of the projected areas perpendicular to the load direction from the CT scans (refer to Section 3.1), the generalized extreme value distribution was used for the subsequent evaluation of the fracture initiating defects; see Equation (1). Moreover, the Kolmogorov–Smirnov test was conducted to evaluate the goodness of fit for the statistical distribution, resulting in a high matching compliance between the fractographic data and the evaluated CT distribution of defects.
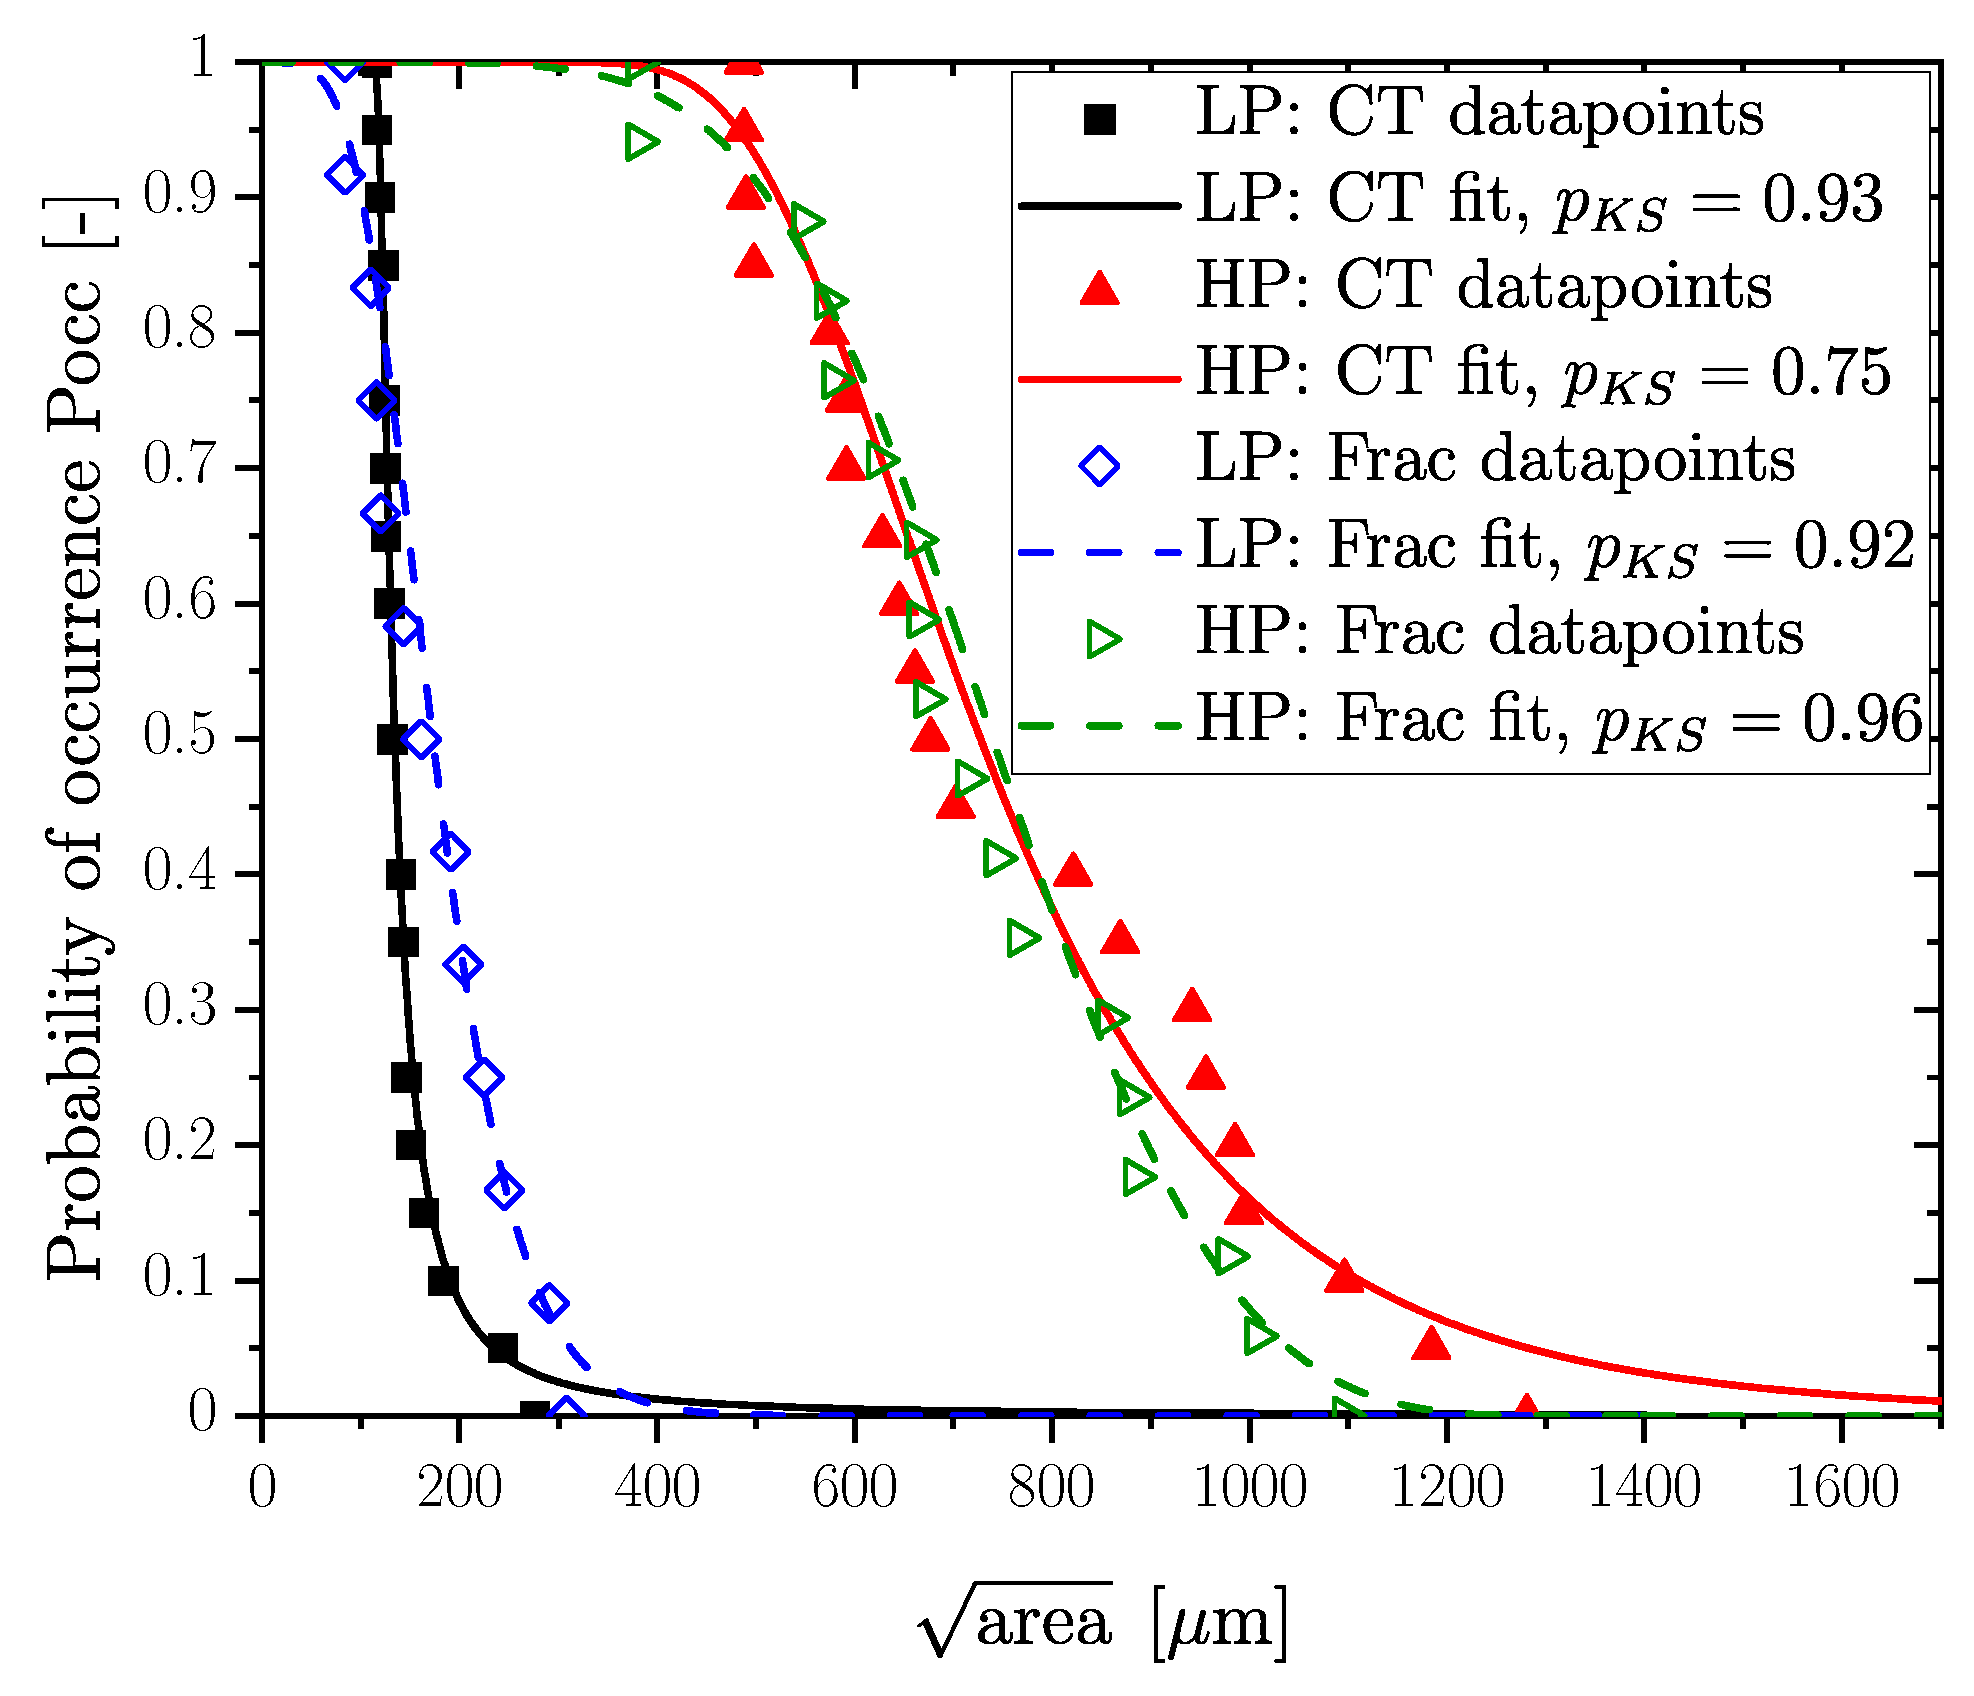
The evaluated probability of occurrence of the fracture initiating defects for the investigated specimens in Positions LP and HP is indicated in blue and green in Figure 14. The parameters for the distributions in Figure 14 were statistically evaluated using the maximum likelihood estimation, proposed by [28]. Finally, a comparison between distributions derived from computed tomography with those of fractographical investigations is necessary to apply the previously developed probabilistic fatigue assessment model in [13,21,29]. Figure 14 shows a comparison of the defect distributions for the HP and LP layers. The distributions of the HP layer correspond well; only the regions of the most extremal pores lead to small deviations between the fractography and CT. Observing the LP distributions, it is noticeable that the probability of occurrence of defects from fractography is slightly underestimated. One reason for this underestimation might be caused by the effect that the fractographical investigation represents one of the maximum defects for each specimen depending on the crack initiation site. In contrast, the 20 maximum-sized defects of two specimens are taken into account for the distribution of the CT scan for the same investigated material volume. A summary of the defect size with a certain probability of occurrence for a comparison of fractography and CT is additionally given in Table 6. From this, a deviation of about 23% for LP and 1.6% for HP can be observed for .
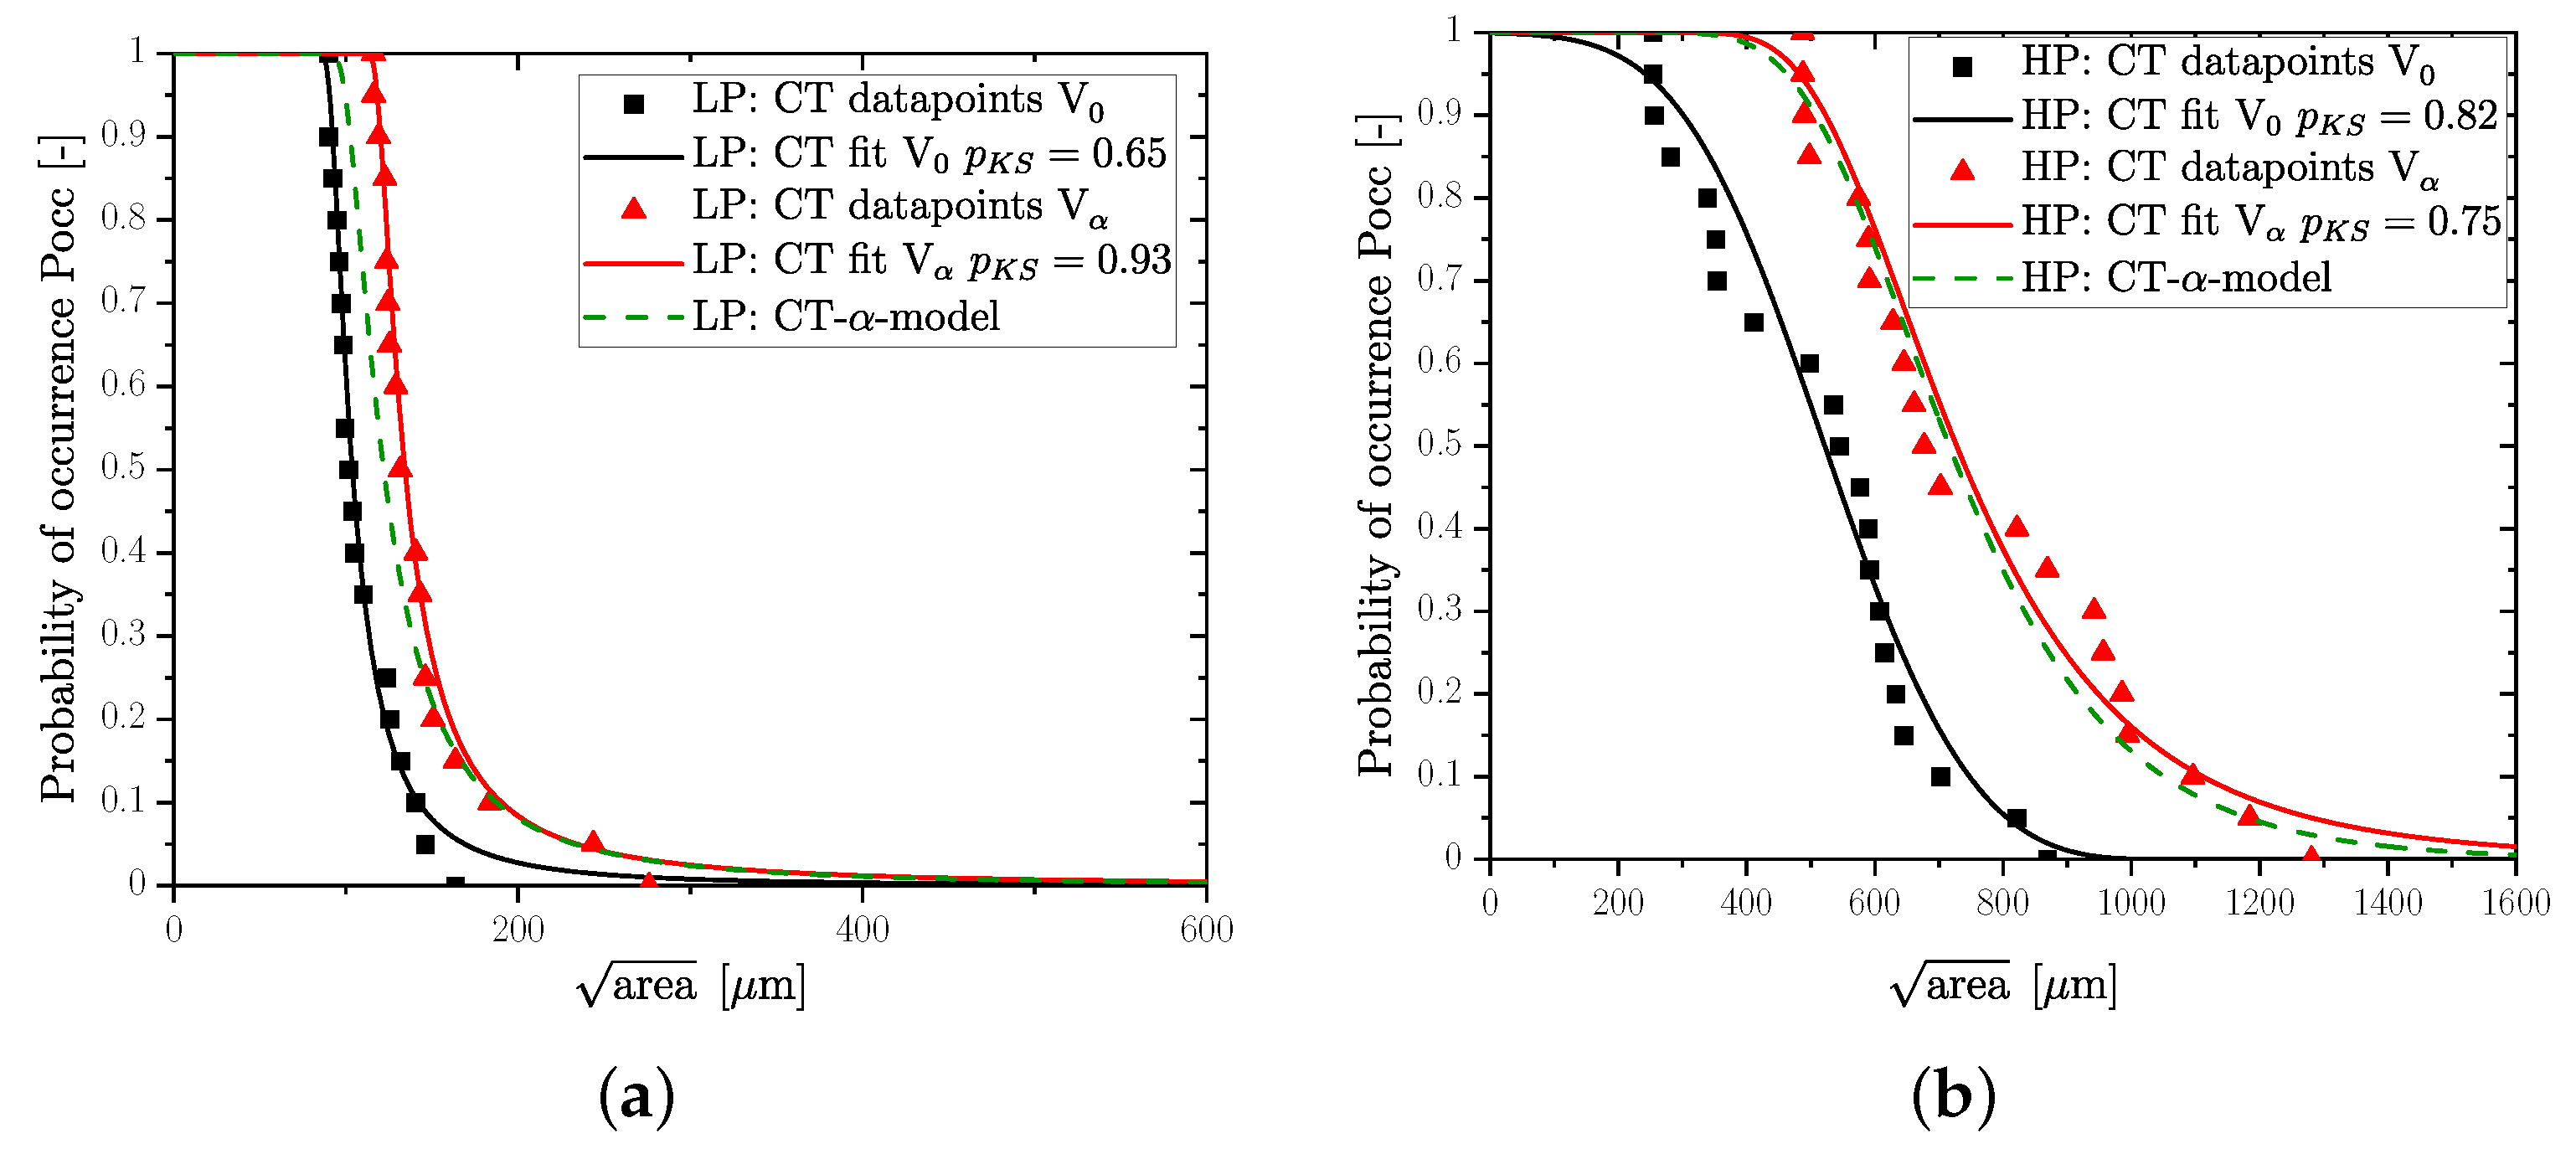
The comparison of fractography and CT was performed by an investigation of the same HSV for each series, whereby this effect did not need to be considered in this regard. Next, the fatigue strength was calculated based on the defect distributions for all layers with 0.5 mm and 1 mm spacing. The course of , which is necessary for the application of the fatigue assessment methodology, is given in Figure 9; however, due to the minor layer spacing of 0.5 mm instead of 1.5 mm, the effect of the HSV had to be considered for further calculation of the probabilistic fatigue strength. Hence, the distribution of one selected sub-layer of 0.5 mm spacing was taken from HP and LP layers, respectively, indicated by the black continuous lines in Figure 15. Furthermore, a homogeneous defect distribution is necessary within the LP and HP layers for direct comparison. Once the distribution parameters for the reference distribution were estimated, the parameters for the -times enlarged volume could be calculated by exponentiating the basic distribution function by the return period . The layer thickness of 0.5 mm compared to 1.5 mm led to a return period of . Finally, Equation (8) could be invoked for the calculated distribution function of the -times increased volume. Moreover, the originally proposed methodology of the authors in [21,29] for fractographical results led to a sound agreement of the distribution functions of CT scans as well; see Figure 15. Table 7 represents a summary for the quantitative comparison of the calculated distribution functions in relation to the experimental data.
4. Layer-Based Fatigue Assessment Methodology
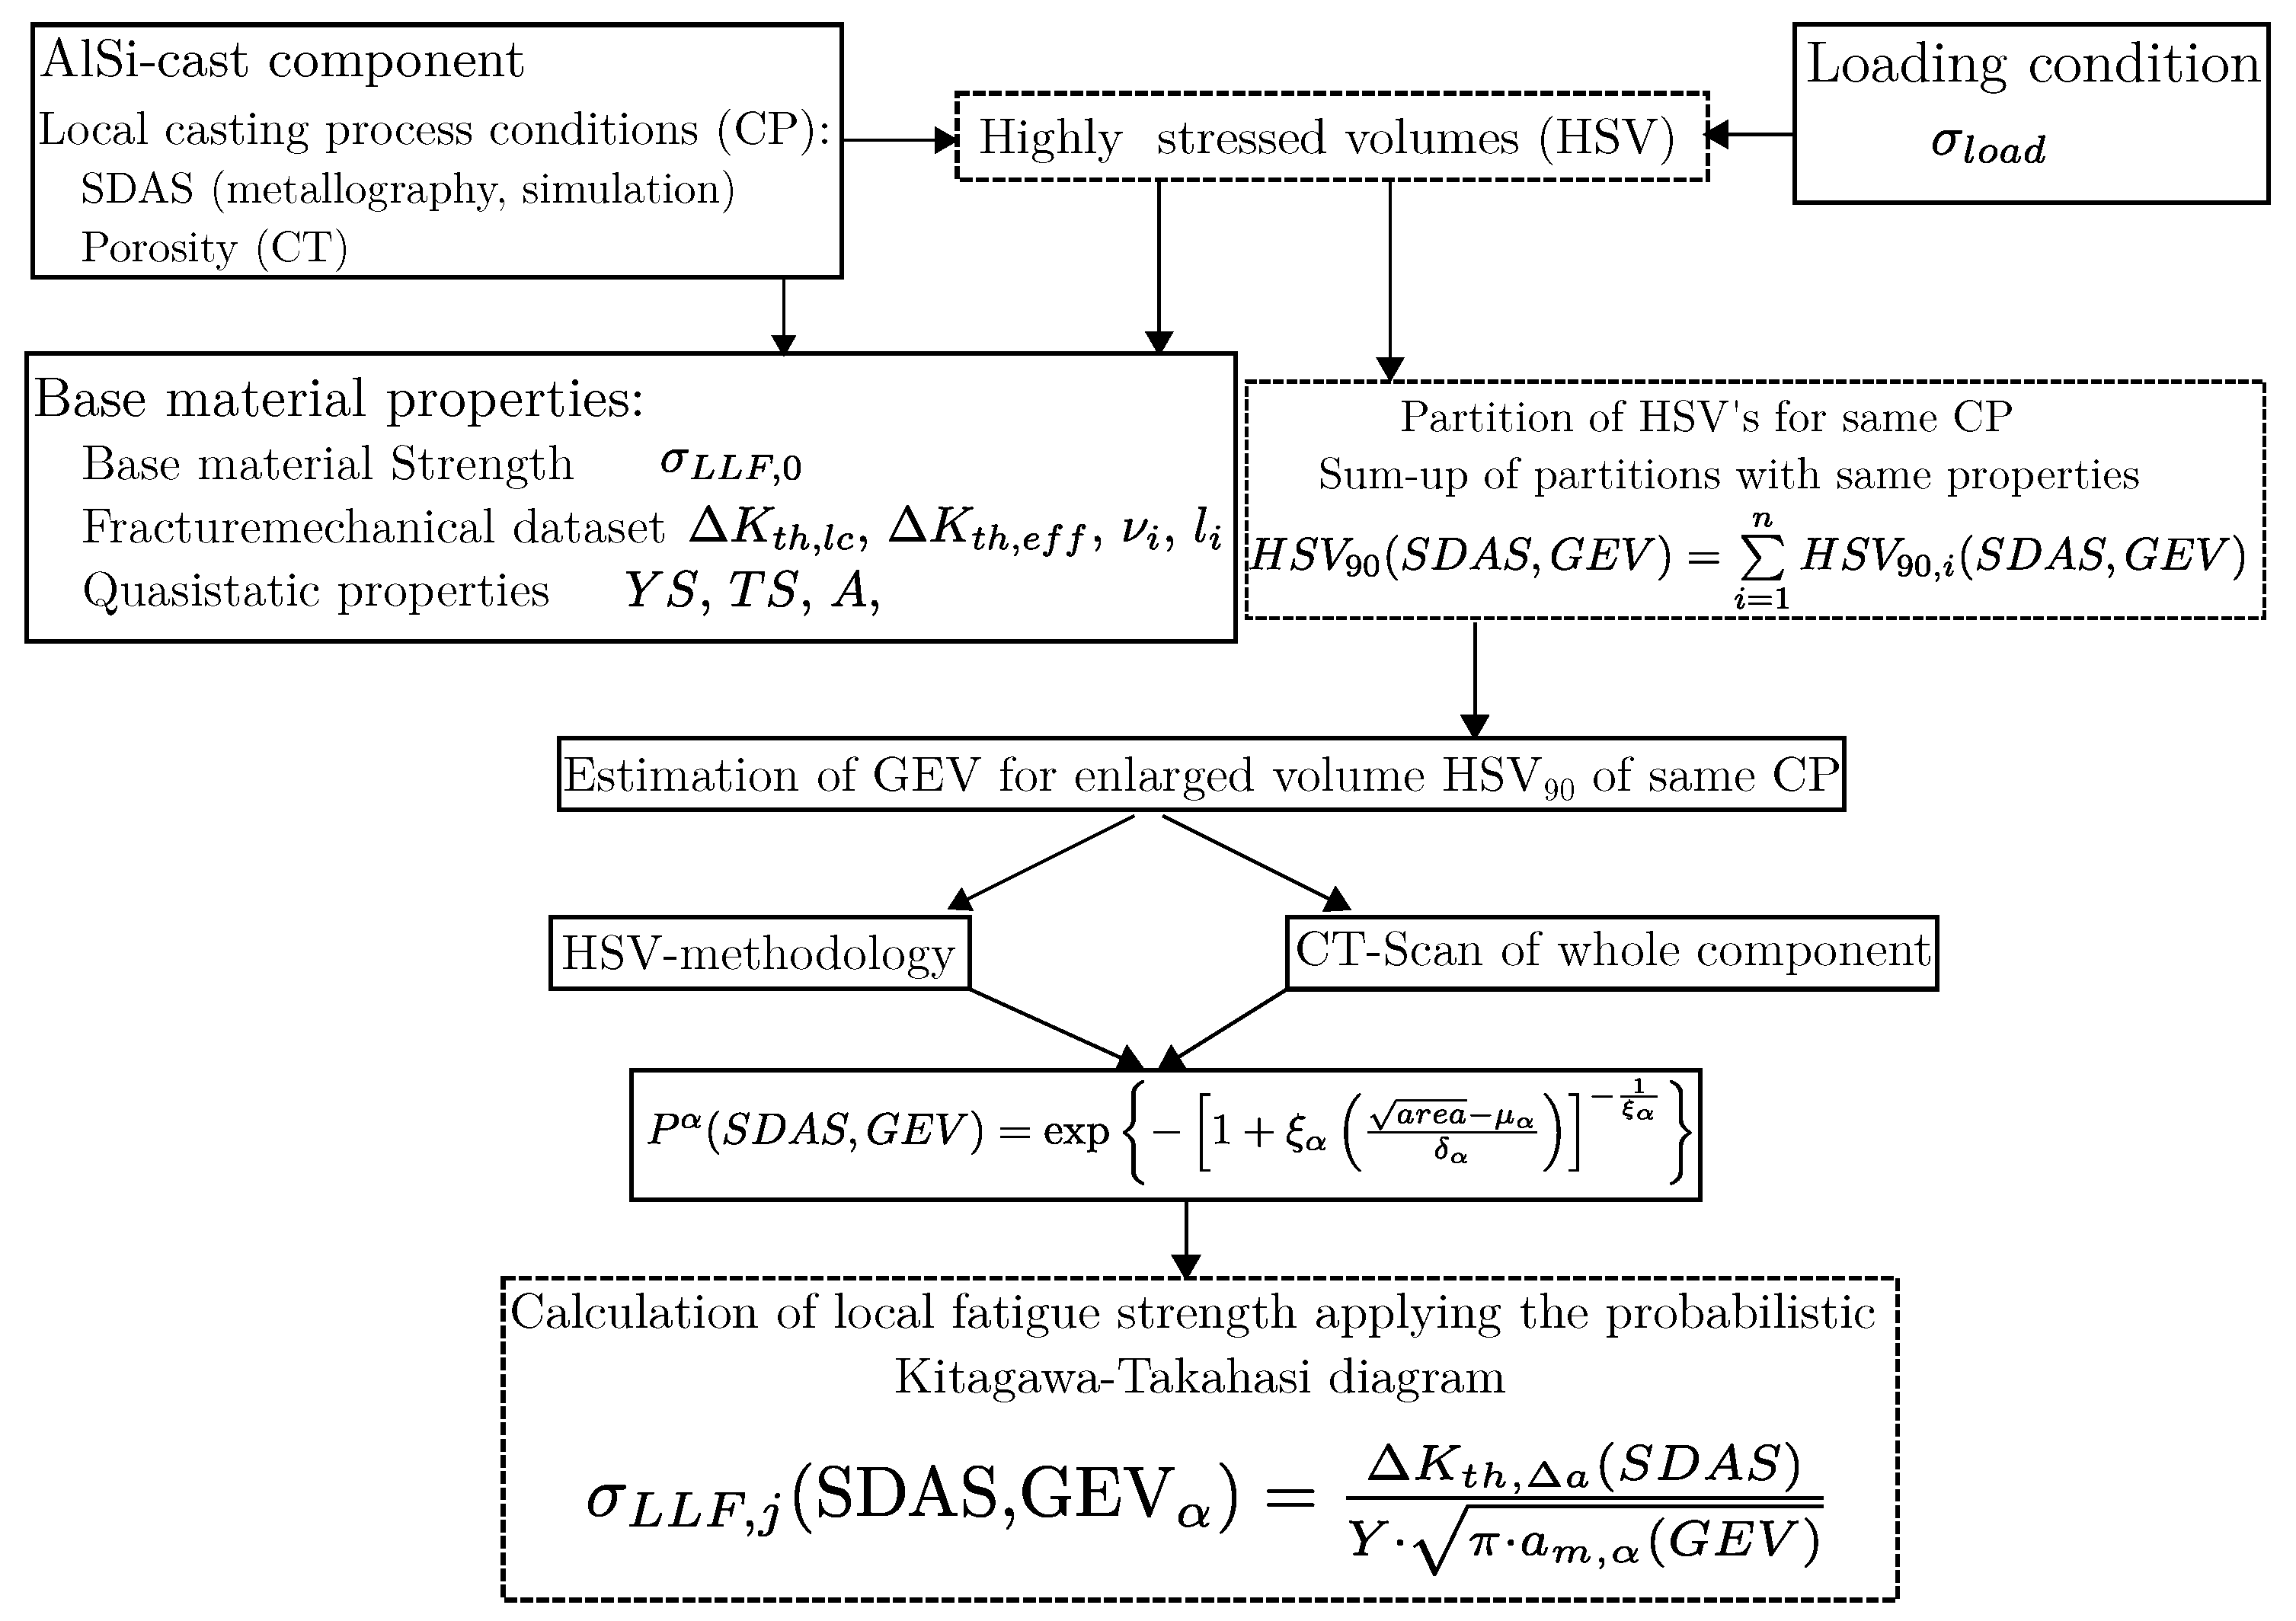
To set up the layer-based fatigue assessment methodology given in Figure 16, the probabilistic models of preliminary studies [13,21,29] had to be applied and extended regarding layer-based properties. Due to the complex shape of AlSi-cast components in most engineering cases, local casting process conditions (CP) are highly variable. Those variations within the casting process are well quantifiable by microstructural parameters, such as secondary dendrite arm spacing, which depends on the solidification rate. The porosity content is also traceable to the local casting conditions. The secondary dendrite arm spacing can be either calculated in casting simulations or measured by means of metallographic investigations.
As clearly shown in this study, porosity is not necessarily dependent on SDAS, because the investigated positions show no significant difference in SDAS, but exhibit wide differences with regard to porosity. Porosity can therefore be well determined via micro-computed tomography (CT) in a non-destructive way. This enables the detection of the 3D-pore geometry of the complex shrinkage porosity, with sometimes sponge-like clustered porosity as well. By applying the subsequent calculation steps given in Figure 16, all required geometric information can be estimated for the scanned specimen. In previous studies of the authors, fractographic investigations were used to determine the most critical defects in several sections of the component. In order to determine the critical section in a complex part, detailed information about the applied mechanical load case to this component are of importance. Thus, enabling the determination of the highly stressed volumes (HSVs) of the component; therefore, the determination of the maximum principal stress value within these sections is needed for local fatigue assessment. Once the HSVs are determined, they can be partitioned into sub-HSVs featuring the same local casting process conditions, e.g., SDAS and inhomogeneities distribution datasets. As proposed previously in [29], it is necessary to sum up the individual HSV possessing similar microstructural properties regarding the local casting process. Hence, the layer-based fatigue assessment leads to a database including several HSVs for related local casting process conditions. Now, a distinction between two cases is necessary: If the whole component is analysed by computed tomography, the defects can be assigned in the same manner, as described in the previous step, extending the database of the location-based HSV with information about the pores within these HSVs. In the other case, if only a few regions are analysed by CT, the methodology for an enlarged HSV has to be applied; see Section 3.1 and Section 3.3. Depending on the reference defect distributions for the individual local casting process conditions, these distributions are shifted on the axis of abscissae subjected to the currently evaluated return period, determined as the ratio of the volume from the reference distribution in relation to the HSV of the whole partition for CP; however, this results approximately in the same defect distributions for the HSVs as observed by CT analysis in the component, discussed in Section 3.3. The parameters of the distribution for the enlarged HSV are given in Equations (9)–(11) according to [21], featuring Equation (8) as an HSV probability value.
In order to calculate the long-life fatigue strength following Equation (12) for each HSV, material input parameters are required as follows. The base material strength was determined at specimens with HIP treatment; see the summary in Table 5. An extensive study about crack propagation in a varying microstructure is given in [82], enabling the determination of probabilistic crack growth parameters used to construct the Kitagawa diagram. The crack extension can be calculated using Equation (13), whereas the value is determined based on the statistical distribution of the defects for a probability of occurrence of 50%.
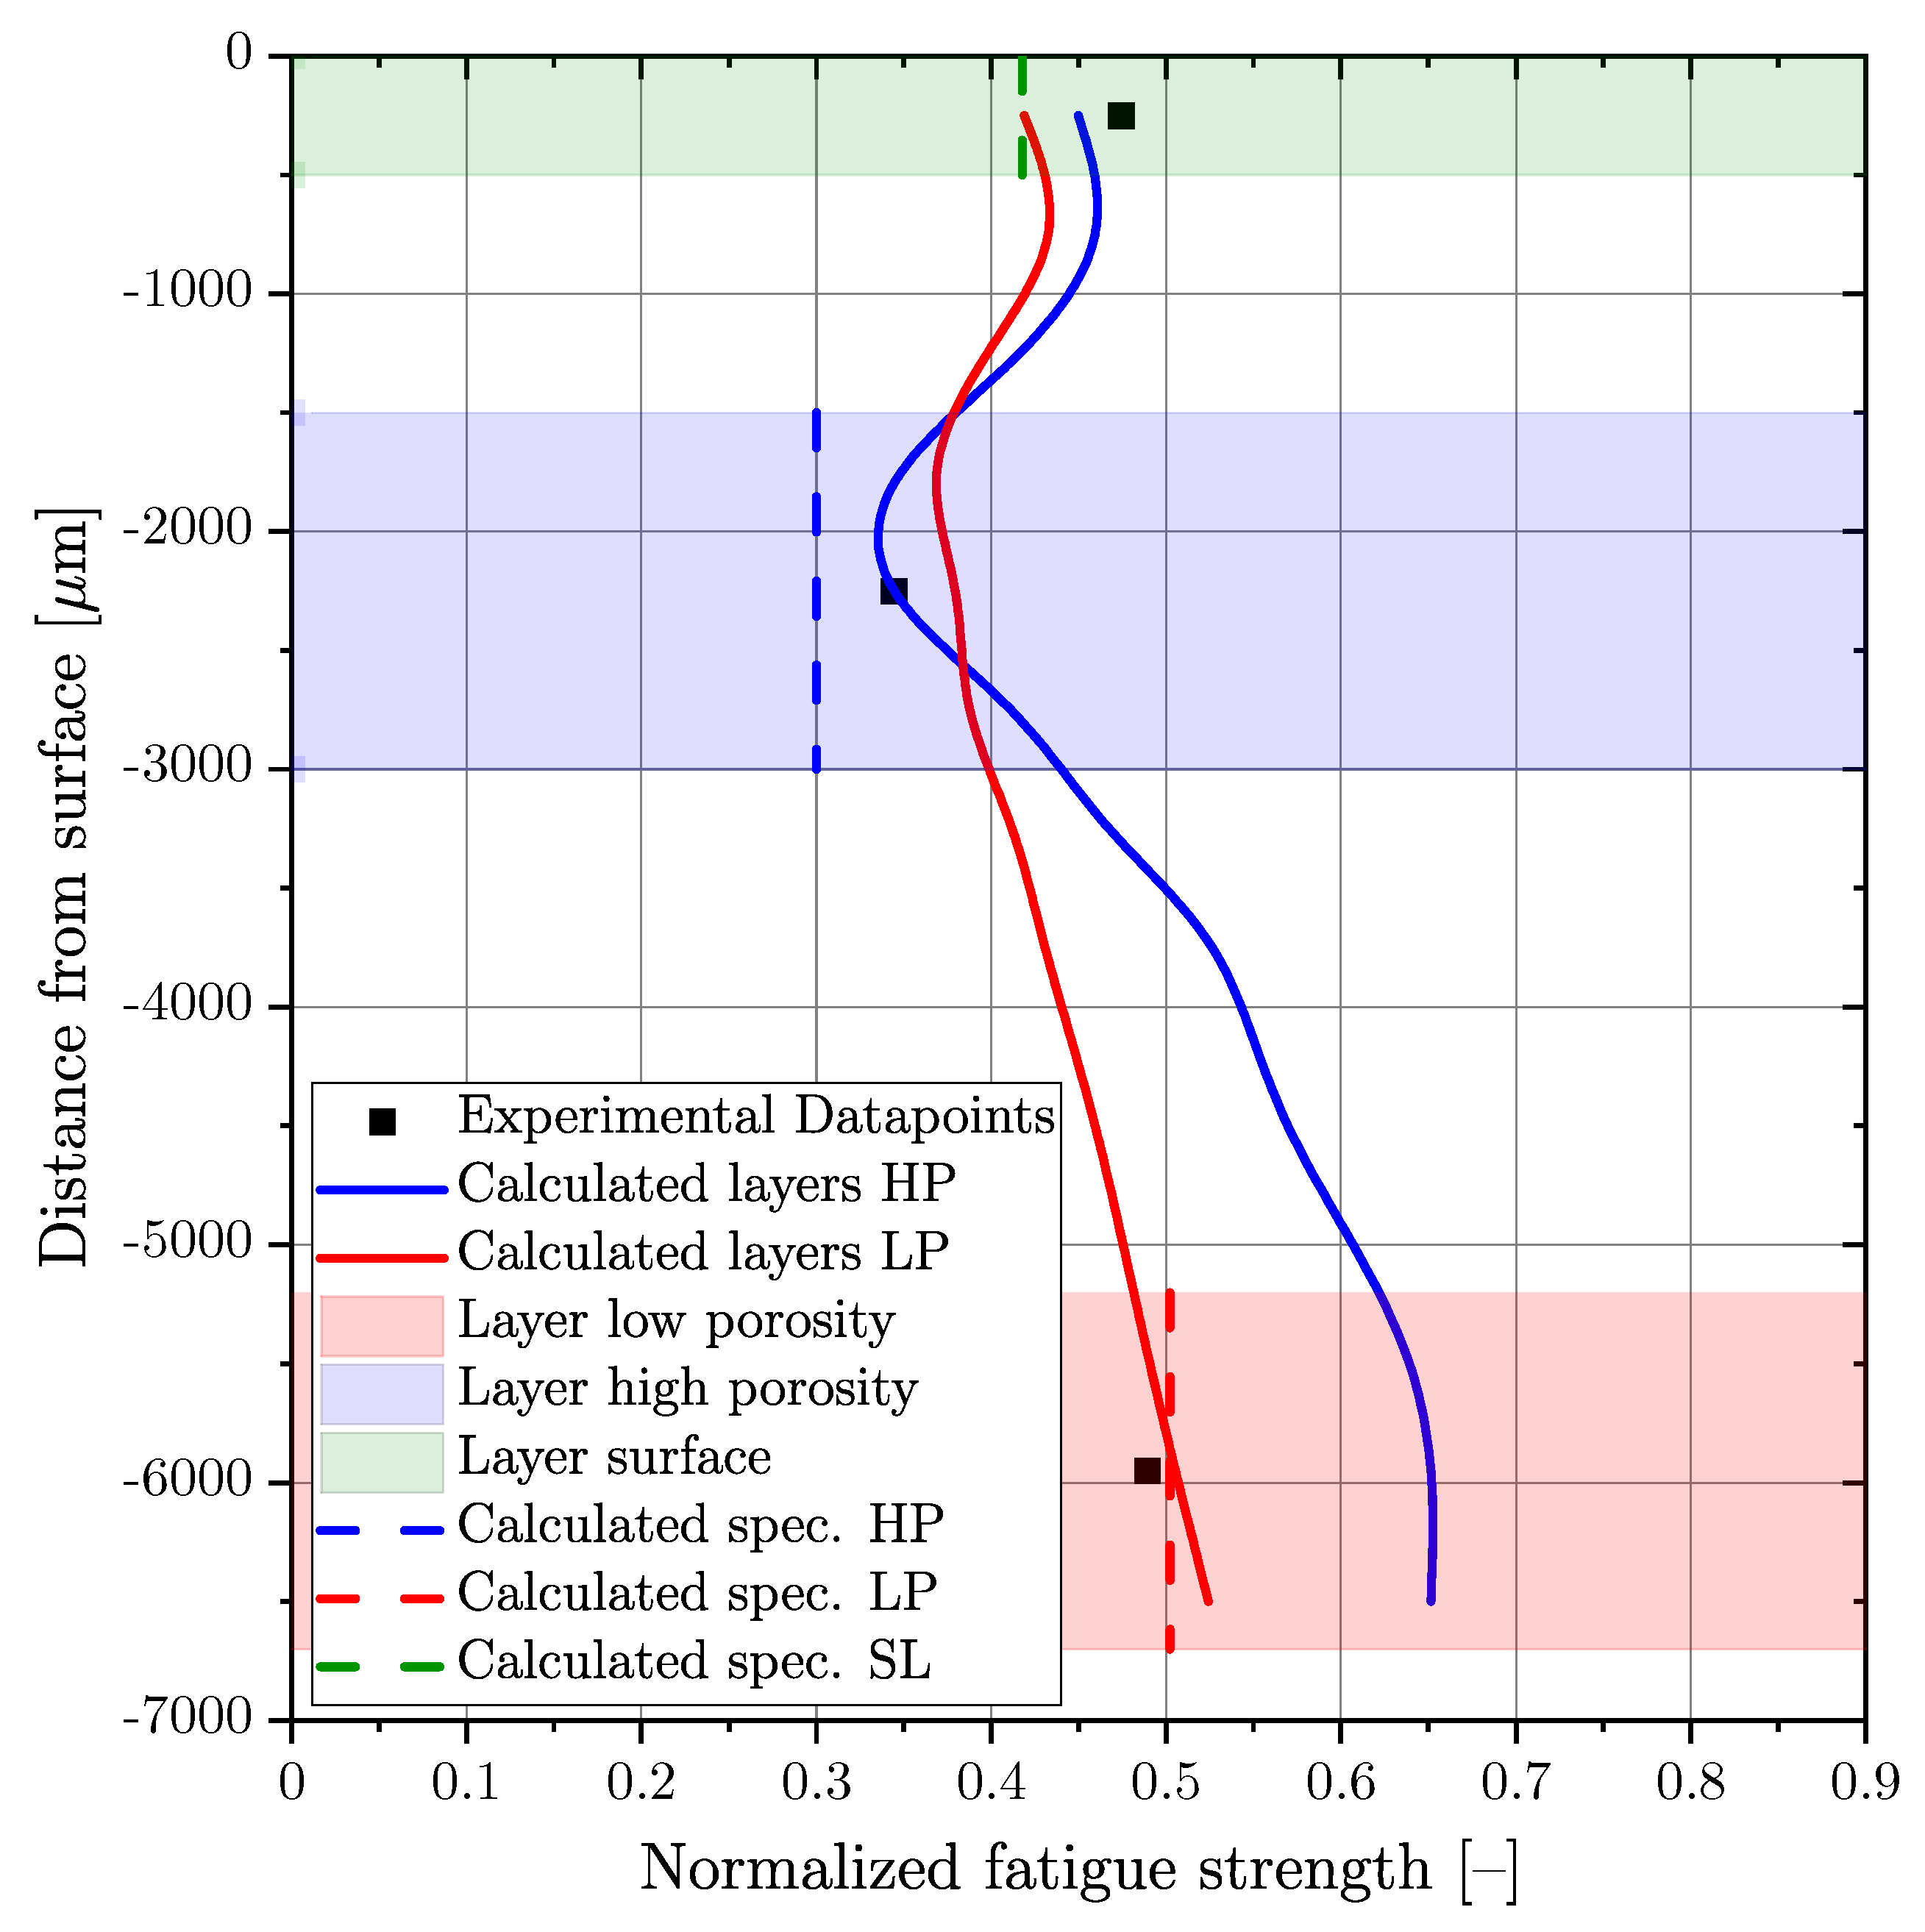
The application of the comprehensive assessment methodology results in a gradient of fatigue strength over the cross section of the thick-walled specimen geometry, shown in Figure 3. Figure 17 depicts the course of the calculated fatigue strength, whereas the blue (HP samples) and the red (LP samples) solid lines represent the calculated layer fatigue strength of each thick-walled specimen series. Moreover, the thin-walled specimens are visualized as shaded regions, blue for HP samples and red for LP samples. The thin-walled HP samples were tested at a distance from the surface from 1.5 to 3 mm, as shown in the blue-shaded section. The thin-walled LP specimens were tested at a layer from 5.2 to 6.7 mm, as shown in the red-shaded section. The calculation of this fatigue strength values was realized with a layer thickness from 0.5 to 1 mm; see Figure 9 for the distribution of porosity size. Due to the thickness of 1.5 mm of the fatigue specimens, the model for enlarged highly stressed volumes was applied to calculate the fatigue strength of the tested specimens. These values were plotted as vertical dashed lines in the investigated layers for the HP and LP specimens in Figure 17. The surface layer fatigue strength, from 0 to 0.5 mm in depth, was estimated by application of the previously published methodology of Pomberger et al. [13].
The validation of the layer-based fatigue assessment model reveals a conservative estimation of mean fatigue strength in the HP and SL layers and a slightly non-conservative fatigue strength for the low-porosity LP section, summarised in Table 8. A reason for the deviations between the model and the experiment might be the small differences regarding crack initiation and propagation parameters used for the Kitagawa diagram, as the effect of sponge-like porosity on fracture-mechanical parameters has not been investigated yet due to the small layer thickness, resulting in no suitable fracture-mechanical test specimen geometry.
To summarise, the layer-based fatigue assessment model was constructed for the alloy EN AC-46200 in a sand cast condition for different degrees of porosity, leading to an enhanced fatigue assessment considering the local material resistance. Furthermore, the method proposed by Åman [57,58] was successfully applied to the results of computed tomography for the investigated alloy and different degrees of porosity within the near-surface layers. Nevertheless, other alloys or manufacturing processes may be investigated to approve the presented statistical method even further.
5. Conclusions
A comprehensive, layer-based methodology is introduced to facilitate the probabilistic calculation of the fatigue strength of highly stressed volumes with a manufacturing-process-dependent microstructure and porosity distributions. This concept calculates the fatigue strength accurately for layer-based steppings of at least five-hundred microns in depth. Previously developed probabilistic fatigue bulk models are applied and significantly extended regarding the CT-evaluated porosity grade. Overall, the following conclusions can be drawn:
- The clustering of porosity obtained by computed tomography revealed a significant impact on the statistically evaluated parameters of the defect distribution given a high porosity, such as in sponge-like imperfect sections. The effect of clustering may increase the projected size of the largest defect distribution up to 100 µm in such cases; however, if there is a low pore density, clustering has a negligible effect on defect distribution, resulting into a deviation of only a few microns.
- Although the SDAS is quite constant across the whole investigated cross section, significant changes regarding pore size and distribution may occur due to local casting process conditions.
- In order to reduce effort regarding micro-computed tomography for large scan volumes, the applicable distribution function can be also obtained by scanning a smaller, albeit representable, volume and proposing the final distribution parameters scaled by the return value ratio. As illustrated, a deviation of only 11 µm for a defect size of 728 µm and 12 µm for a defect size of 134 µm is observed.
- The previously developed methodology using a probabilistic Kitagawa–Takahasi diagram was extended using defect distributions of computed tomography enabling a non-destructive determination of the fatigue strength.
- The layer-based assessment methodology leads to a sound estimation of the thick-walled specimen fatigue strength at strongly varying casting conditions with deviations in a range of −2.6% up to 12.9%. The introduced methodology enables the probabilistic calculation of the most damaged layer, both dependent on cyclic loading and local casting conditions.
Author Contributions
Conceptualisation, M.O., M.S., and S.F.; methodology, M.O. and M.S.; software, M.O., M.S., and S.F.; validation, M.O. and M.S.; formal analysis, M.O. and M.S.; investigation, M.O.; resources, M.S.; data curation, M.O.; writing–original draft preparation, M.O.; writing–review and editing, M.O., M.L., and M.S.; visualisation, M.O.; supervision, M.S. and M.L.; project administration, M.S.; funding acquisition, M.S. All authors have read and agreed to the published version of the manuscript.
Funding
This research was funded by the Austrian Federal Ministry for Digital and Economic Affairs and the National Foundation for Research, Technology, and Development.
Data Availability Statement
Not applicable.
Acknowledgments
The financial support by the Austrian Federal Ministry for Digital and Economic Affairs and the National Foundation for Research, Technology, and Development is gratefully acknowledged.
Conflicts of Interest
The authors declare that there is no conflict of interest. The funders had no role in the design of the study, in the collection, analyses, or interpretation of data, in the writing of the manuscript, or in the decision to publish the results.
Abbreviations
The following abbreviations are used in this manuscript:
| Defect size of Murakami’s approach | |
| Return period of the highly stressed volume | |
| Weibull factor | |
| long-life fatigue strength | |
| long-life fatigue strength of the reference volume | |
| long-life fatigue strength of the -times enlarged volume | |
| Deviation of model to experiment | |
| Fatigue range of near-defect-free material | |
| Bending stress | |
| Scale parameter of the GEV distribution | |
| Scale parameter of the GEV distribution for the -times enlarged volume | |
| Location parameter of the GEV distribution | |
| Location parameter of the GEV distribution for the -times enlarged volume | |
| Shape parameter of the GEV distribution | |
| Shape parameter of the GEV distribution for the -times enlarged volume | |
| Weighting factor for crack closure effect i | |
| Crack elongation, where the crack closure effect is completely developed | |
| Long crack threshold range | |
| Crack threshold range in respect to the crack extension | |
| Surface layer thickness | |
| h | Specimen height |
| Bending moment | |
| Effective crack threshold range |
| Crack extension | |
| a | Crack length |
| Crack length of the reference volume for a probability of occurrence of 50% | |
| Crack length of the reference volume for a probability of occurrence of 50% | |
| P | Probability |
| Probability of occurrence | |
| Probability of survival | |
| Defect distribution of -times enlarged volume | |
| , | 90% highly stressed volumes |
| -times enlarged highly stressed volume | |
| p-value of the Kolmogorov–Smirnov test | |
| Y | Geometry factor |
| Inverse slope of the S/N curve in finite life region | |
| Fatigue scatter band of the S/N-curve | |
| Transition knee point of the S/N-curve | |
| Sphericity | |
| Surface area of pore | |
| R | Load ratio |
| R-curve | Cyclic crack resistance curve |
| HSV | Highly stressed volume |
| SDAS | Secondary dendrite arm spacing |
| GEV | Generalized extreme value distribution |
| CDF | Cumulative distribution function |
| FEM | Finite element method |
| HCF | High cycle fatigue |
| HIP | Hot isostatic pressing |
| CT | Micro-computed tomography |
| CP | Local casting process conditions |
| CL | Clustering of defects |
| GEV | Generalize extreme value distribution |
| LP | Low porosity layer |
| HP | High porosity layer |
| SL | Surface layer |
| LEVD | Largest extreme value distribution |
| KTD | Kitagawa–Takahasi diagram |
| HT | Heat treatment |
| E | Young’s modulus |
| TS | Tensile strength |
| YS | Yield strength |
| A | Elongation at fracture |
| BM | Base material strength of near-defect-free material |
| FDD | Focus detector distance |
| FOD | Focus object distance |
References
- Yang, Q.; Xia, C.; Deng, Y.; Li, X.; Wang, H. Microstructure and Mechanical Properties of AlSi7Mg0.6 Aluminum Alloy Fabricated by Wire and Arc Additive Manufacturing Based on Cold Metal Transfer (WAAM-CMT). Materials 2019, 12, 2525. [Google Scholar] [CrossRef] [PubMed] [Green Version]
- Feikus, F.J.; Bernsteiner, P.; Gutiérrez, R.F.; uszczak, M. Weiterentwicklungen bei Gehäusen von Elektromotoren. MTZ—Mot. Z. 2020, 81, 42–47. [Google Scholar] [CrossRef]
- Berlanga-Labari, C.; Biezma-Moraleda, M.V.; Rivero, P.J. Corrosion of Cast Aluminum Alloys: A Review. Metals 2020, 10, 1384. [Google Scholar] [CrossRef]
- Zerbst, U.; Madia, M.; Klinger, C.; Bettge, D.; Murakami, Y. Defects as a root cause of fatigue failure of metallic components. III: Cavities, dents, corrosion pits, scratches. Eng. Fail. Anal. 2019, 97, 759–776. [Google Scholar] [CrossRef]
- Boileau, J.M.; Allison, J.E. The effect of solidification time and heat treatment on the fatigue properties of a cast 319 aluminum alloy. Metall. Trans. 2003, 34, 1807–1820. [Google Scholar] [CrossRef]
- Zhang, L.Y.; Jiang, Y.H.; Ma, Z.; Shan, S.F.; Jia, Y.Z.; Fan, C.Z.; Wang, W.K. Effect of cooling rate on solidified microstructure and mechanical properties of aluminium-A356 alloy. J. Mater. Process. Technol. 2008, 207, 107–111. [Google Scholar] [CrossRef]
- Savaş, Ö.; Kayikci, R. Application of Taguchi’s methods to investigate some factors affecting microporosity formation in A360 aluminium alloy casting. Mater. Des. 2007, 28, 2224–2228. [Google Scholar] [CrossRef]
- Zhang, B.; Chen, W.; Poirier, D.R. Effect of solidification cooling rate on the fatigue life of A356.2-T6 cast aluminium alloy. Fatigue Fract. Eng. Mater. Struct. 2000, 23, 417–423. [Google Scholar] [CrossRef]
- Felberbaum, M.; Rappaz, M. Curvature of micropores in Al–Cu alloys: An X-ray tomography study. Acta Mater. 2011, 59, 6849–6860. [Google Scholar] [CrossRef] [Green Version]
- Rotella, A.; Nadot, Y.; Piellard, M.; Augustin, R.; Fleuriot, M. Fatigue limit of a cast Al-Si-Mg alloy (A357-T6) with natural casting shrinkages using ASTM standard X-ray inspection. Int. J. Fatigue 2018, 114, 177–188. [Google Scholar] [CrossRef]
- Serrano-Munoz, I.; Buffière, J.Y.; Verdu, C.; Gaillard, Y.; Mu, P.; Nadot, Y. Influence of surface and internal casting defects on the fatigue behaviour of A357-T6 cast aluminium alloy. Int. J. Fatigue 2016, 82, 361–370. [Google Scholar] [CrossRef]
- Leitner, M.; Stoschka, M.; Fröschl, J.; Wiebesiek, J. Surface Topography Effects on the Fatigue Strength of Cast Aluminum Alloy AlSi8Cu3. Mater. Perform. Charact. 2018, 7, 20170127. [Google Scholar] [CrossRef]
- Pomberger, S.; Oberreiter, M.; Leitner, M.; Stoschka, M.; Thuswaldner, J. Probabilistic Surface Layer Fatigue Strength Assessment of EN AC-46200 Sand Castings. Metals 2020, 10, 616. [Google Scholar] [CrossRef]
- DIN EN ISO 4287:2010-07; Geometrical Product Specifications (GPS)—Surface Texture: Profile Method—Terms, Definitions and Surface Texture Parameters. Beuth Verlag GmbH: Berlin, Germany, 2010.
- DIN EN ISO 4288:1998-04; Geometrical Product Specifications (GPS)—Surface Texture: Profile method—Rules and Procedures for the Assessment of Surface Texture. Beuth Verlag GmbH: Berlin, Germany, 1998.
- ISO 25178; Geometrical Product Specifications (GPS)—Surface Texture: Areal. Beuth Verlag GmbH: Berlin, Germany, 2012.
- Murakami, Y. Metal Fatigue: Effects of Small Defects and Nonmetallic Inclusions; Elsevier: Amsterdam, The Netherlands, 2002. [Google Scholar]
- Nourian-Avval, A.; Fatemi, A. Characterization and Analysis of Porosities in High Pressure Die Cast Aluminum by Using Metallography, X-ray Radiography, and Micro-Computed Tomography. Materials 2020, 13, 3068. [Google Scholar] [CrossRef]
- Nudelis, N.; Mayr, P. A Novel Classification Method for Pores in Laser Powder Bed Fusion. Metals 2021, 11, 1912. [Google Scholar] [CrossRef]
- ASTM E155-15; Standard Reference Radiographs for Inspection of Aluminum and Magnesium Castings. ASTM International: West Conshohocken, PA, USA, 2015.
- Aigner, R.; Pusterhofer, S.; Pomberger, S.; Leitner, M.; Stoschka, M. A probabilistic Kitagawa-Takahashi diagram for fatigue strength assessment of cast aluminium alloys. Mater. Sci. Eng. A 2019, 745, 326–334. [Google Scholar] [CrossRef]
- Beretta, S.; Romano, S. A comparison of fatigue strength sensitivity to defects for materials manufactured by AM or traditional processes. Int. J. Fatigue 2017, 94, 178–191. [Google Scholar] [CrossRef]
- Murakami, Y. Material defects as the basis of fatigue design. Int. J. Fatigue 2012, 41, 2–10. [Google Scholar] [CrossRef]
- Leitner, M.; Garb, C.; Remes, H.; Stoschka, M. Microporosity and statistical size effect on the fatigue strength of cast aluminium alloys EN AC-45500 and 46200. Mater. Sci. Eng. A 2017, 707, 567–575. [Google Scholar] [CrossRef]
- Romano, S.; Abel, A.; Gumpinger, J.; Brandão, A.D.; Beretta, S. Quality control of AlSi10Mg produced by SLM: Metallography versus CT scans for critical defect size assessment. Addit. Manuf. 2019, 28, 394–405. [Google Scholar] [CrossRef]
- Romano, S.; Nezhadfar, P.D.; Shamsaei, N.; Seifi, M.; Beretta, S. High cycle fatigue behavior and life prediction for additively manufactured 17-4 PH stainless steel: Effect of sub-surface porosity and surface roughness. Theor. Appl. Fract. Mech. 2020, 106, 102477. [Google Scholar] [CrossRef]
- Romano, S.; Brückner-Foit, A.; Brandão, A.; Gumpinger, J.; Ghidini, T.; Beretta, S. Fatigue properties of AlSi10Mg obtained by additive manufacturing: Defect-based modelling and prediction of fatigue strength. Eng. Fract. Mech. 2018, 187, 165–189. [Google Scholar] [CrossRef]
- Beretta, S.; Murakami, Y. Statistical analysis of defects for fatigue strength prediction and quality control of materials. Fatigue Fract. Eng. Mater. Struct. 1998, 21, 1049–1065. [Google Scholar] [CrossRef]
- Oberreiter, M.; Pomberger, S.; Leitner, M.; Stoschka, M. Validation Study on the Statistical Size Effect in Cast Aluminium. Metals 2020, 10, 710. [Google Scholar] [CrossRef]
- Aigner, R.; Pomberger, S.; Leitner, M.; Stoschka, M. On the Statistical Size Effect of Cast Aluminium. Materials 2019, 12, 1578. [Google Scholar] [CrossRef] [Green Version]
- Tiryakioğlu, M. Statistical distributions for the size of fatigue-initiating defects in Al–7%Si–0.3%Mg alloy castings: A comparative study. Mater. Sci. Eng. A 2008, 497, 119–125. [Google Scholar] [CrossRef]
- Tiryakioğlu, M. On the relationship between statistical distributions of defect size and fatigue life in 7050-T7451 thick plate and A356-T6 castings. Mater. Sci. Eng. A 2009, 520, 114–120. [Google Scholar] [CrossRef]
- Tenkamp, J.; Koch, A.; Knorre, S.; Krupp, U.; Michels, W.; Walther, F. Defect-correlated fatigue assessment of A356-T6 aluminum cast alloy using computed tomography based Kitagawa-Takahashi diagrams. Int. J. Fatigue 2018, 108, 25–34. [Google Scholar] [CrossRef]
- Beretta, S. More than 25 years of extreme value statistics for defects: Fundamentals, historical developments, recent applications. Int. J. Fatigue 2021, 151, 106407. [Google Scholar] [CrossRef]
- Mahdi, S.; Myrtene, C. Estimating Parameters of Gumbel Distribution using the Methods of Moments, probability weighted moments and maximum likelihood. Rev. Mat. Teor. Apl. 2005, 12, 151–156. [Google Scholar] [CrossRef] [Green Version]
- Lawless, J.F. Statistical Models and Methods for Lifetime Data; John Wiley & Sons, Inc.: Hoboken, NJ, USA, 2002. [Google Scholar] [CrossRef]
- Kotz, S.; Nadarajah, S. Extreme Value Distributions: Theory and Applicaitons; Imperial College Press and Distributed by World Scientific Publishing Co.: Covent Garden, London, 2000. [Google Scholar] [CrossRef]
- Gumbel, E.J. Statistics of Extremes; Columbia University Press: New York Chichester, West Sussex, 1958. [Google Scholar]
- Kitagawa, H.; Takahashi, S. (Eds.) Applicability of Fracture Mechanics to Very Small Cracks or the Cracks in the Early Stage; American Society for Metals: Cleveland, 1976. [Google Scholar]
- Radaj, D. Geometry correction for stress intesity at elliptical cracks. Weld. Cut. 1977, 29, 198–402. [Google Scholar]
- El Haddad, M.H.; Smith, K.N.; Topper, T.H. Fatigue Crack Propagation of Short Cracks. J. Eng. Mater. Technol. 1979, 101, 42. [Google Scholar] [CrossRef]
- El Haddad, M.H.; Topper, T.H.; Smith, K.N. Prediction of non propagating cracks. Eng. Fract. Mech. 1979, 11, 573–584. [Google Scholar] [CrossRef]
- Chapetti, M.D. Fatigue propagation threshold of short cracks under constant amplitude loading. Int. J. Fatigue 2003, 25, 1319–1326. [Google Scholar] [CrossRef]
- Pippan, R.; Hohenwarter, A. Fatigue crack closure: A review of the physical phenomena. Fatigue Fract. Eng. Mater. Struct. 2017, 40, 471–495. [Google Scholar] [CrossRef]
- Maierhofer, J.; Pippan, R.; Gänser, H.P. Modified NASGRO equation for physically short cracks. Int. J. Fatigue 2014, 59, 200–207. [Google Scholar] [CrossRef] [Green Version]
- Maierhofer, J.; Kolitsch, S.; Pippan, R.; Gänser, H.P.; Madia, M.; Zerbst, U. The cyclic R-curve—Determination, problems, limitations and application. Eng. Fract. Mech. 2018, 198, 45–64. [Google Scholar] [CrossRef]
- Sonsino, C.M. Zur Bewertung des Schwingfestigkeitsverhaltens von Bauteilen mit Hilfe örtlicher Beanspruchungen. Konstruktion 1993, 45, 25–33. [Google Scholar]
- Rechnerischer Festigkeitsnachweis für Maschinenbauteile aus Stahl, Eisenguss- und Aluminiumwerkstoffen, 6th ed.; FKM-Richtlinie, VDMA-Verl.: Frankfurt am Main, Germany, 2012.
- Ai, Y.; Zhu, S.P.; Liao, D.; Correia, J.; Souto, C.; de Jesus, A.; Keshtegar, B. Probabilistic modeling of fatigue life distribution and size effect of components with random defects. Int. J. Fatigue 2019, 126, 165–173. [Google Scholar] [CrossRef]
- Zhu, S.P.; Ai, Y.; Liao, D.; Correia, J.A.F.O.; De Jesus, A.M.P.; Wang, Q. Recent advances on size effect in metal fatigue under defects: A review. Int. J. Fract. 2021, 1–23. [Google Scholar] [CrossRef]
- Léopold, G.; Nadot, Y.; Billaudeau, T.; Mendez, J. Influence of artificial and casting defects on fatigue strength of moulded components in Ti-6Al-4V alloy. Fatigue Fract. Eng. Mater. Struct. 2015, 38, 1026–1041. [Google Scholar] [CrossRef]
- Iben Houria, M.; Nadot, Y.; Fathallah, R.; Roy, M.; Maijer, D.M. Influence of casting defect and SDAS on the multiaxial fatigue behaviour of A356-T6 alloy including mean stress effect. Int. J. Fatigue 2015, 80, 90–102. [Google Scholar] [CrossRef]
- Romano, S.; Brandão, A.; Gumpinger, J.; Gschweitl, M.; Beretta, S. Qualification of AM parts: Extreme value statistics applied to tomographic measurements. Mater. Des. 2017, 131, 32–48. [Google Scholar] [CrossRef] [Green Version]
- Nadot, Y.; Nadot-Martin, C.; Kan, W.H.; Boufadene, S.; Foley, M.; Cairney, J.; Proust, G.; Ridosz, L. Predicting the fatigue life of an AlSi10Mg alloy manufactured via laser powder bed fusion by using data from computed tomography. Addit. Manuf. 2020, 32, 100899. [Google Scholar] [CrossRef]
- Rotella, A.; Nadot, Y.; Piellard, M.; Augustin, R.; Fleuriot, M. Influence of defect morphology and position on the fatigue limit of cast Al alloy: 3D characterization by X-ray microtomography of natural and artificial defects. Mater. Sci. Eng. A 2020, 785, 139347. [Google Scholar] [CrossRef]
- Nadot, Y. Fatigue from Defect: Influence of Size, Type, Position, Morphology and Loading. Int. J. Fatigue 2022, 154, 106531. [Google Scholar] [CrossRef]
- Åman, M.; Okazaki, S.; Matsunaga, H.; Marquis, G.B.; Remes, H. Interaction effect of adjacent small defects on the fatigue limit of a medium carbon steel. Fatigue Fract. Eng. Mater. Struct. 2017, 40, 130–144. [Google Scholar] [CrossRef]
- Åman, M.; Okazaki, S.; Matsunaga, H.; Marquis, G.B.; Remes, H. The effect of interacting small defects on the fatigue limit of a medium carbon steel. Procedia Struct. Integr. 2016, 2, 3322–3329. [Google Scholar] [CrossRef]
- Li, P.; Lee, P.D.; Maijer, D.M.; Lindley, T.C. Quantification of the interaction within defect populations on fatigue behavior in an aluminum alloy. Acta Mater. 2009, 57, 3539–3548. [Google Scholar] [CrossRef]
- Bidhar, S.; Kuwazuru, O.; Shiihara, Y.; Utsunomiya, T.; Hangai, Y.; Nomura, M.; Watanabe, I.; Yoshikawa, N. Empirical formulation of stress concentration factor around an arbitrary-sized spherical dual-cavity system and its application to aluminum die castings. Appl. Math. Model. 2015, 39, 5707–5723. [Google Scholar] [CrossRef]
- Ben Ahmed, A.; Houria, M.I.; Fathallah, R.; Sidhom, H. The effect of interacting defects on the HCF behavior of Al-Si-Mg aluminum alloys. J. Alloy. Compd. 2019, 779, 618–629. [Google Scholar] [CrossRef]
- Campbell, J. Complete Casting Handbook: Metal Casting Processes, Techniques and Design; Elsevier Butterworth-Heinemann: Oxford, UK, 2011. [Google Scholar]
- Ernst, F.; Kube, D.; Klaus, G.; Nemak Dillingen GmbH. Al-Kurbelgehäuse mit thermisch gespritzter Eisenbasisbeschichtung: Gießtechnische Anforderungen. Giesserei 2013, 100, 44–51. [Google Scholar]
- DIN EN 1706; Aluminium and Aluminium Alloys—Castings—Chemical Composition and Mechanical Properties; German version EN 1706:2010. Beuth Verlag GmbH: Berlin, Germany, 2013.
- Pomberger, S.; Stoschka, M.; Aigner, R.; Leitner, M.; Ehart, R. Areal fatigue strength assessment of cast aluminium surface layers. Int. J. Fatigue 2020, 133, 105423. [Google Scholar] [CrossRef]
- Canals, L.; Badreddine, J.; McGillivray, B.; Miao, H.Y.; Levesque, M. Effect of vibratory peening on the sub-surface layer of aerospace materials Ti-6Al-4V and E-16NiCrMo13. J. Mater. Process. Technol. 2019, 264, 91–106. [Google Scholar] [CrossRef]
- Alcaraz, J.Y.; Zhang, J.; Nagalingam, A.P.; Gopasetty, S.K.; Toh, B.L.; Gopinath, A.; Ahluwalia, K.; Ang, M.G.W.; Yeo, S.H. Numerical modeling of residual stresses during vibratory peening of a 3-stage Blisk—A multi-scale discrete element and finite element approach. J. Mater. Process. Technol. 2022, 299, 117383. [Google Scholar] [CrossRef]
- Kumar, D.; Idapalapati, S.; Wang, W.; Child, D.J.; Haubold, T.; Wong, C.C. Microstructure-mechanical property correlation in shot peened and vibro-peened Ni-based superalloy. J. Mater. Process. Technol. 2019, 267, 215–229. [Google Scholar] [CrossRef]
- Kumar, D.; Idapalapati, S.; Wang, W.; Narasimalu, S. Effect of Surface Mechanical Treatments on the Microstructure-Property-Performance of Engineering Alloys. Materials 2019, 12, 2503. [Google Scholar] [CrossRef] [Green Version]
- van der Walt, S.; Schönberger, J.L.; Nunez-Iglesias, J.; Boulogne, F.; Warner, J.D.; Yager, N.; Gouillart, E.; Yu, T. scikit-image: image processing in Python. PeerJ 2014, 2, e453. [Google Scholar] [CrossRef]
- Buades, A.; Coll, B.; Morel, J.M. A Non-Local Algorithm for Image Denoising. In Proceedings of the 2005 IEEE Computer Society Conference on Computer Vision and Pattern Recognition (CVPR’05), San Diego, CA, USA, 20–25 June 2005; pp. 60–65. [Google Scholar] [CrossRef]
- Darbon, J.; Cunha, A.; Chan, T.F.; Osher, S.; Jensen, G.J. Fast nonlocal filtering applied to electron cryomicroscopy. In Proceedings of the 2008 5th IEEE International Symposium on Biomedical Imaging: From Nano to Macro, Paris, France, 14–17 May 2008; pp. 1331–1334. [Google Scholar] [CrossRef]
- Buades, A.; Coll, B.; Morel, J.M. Non-Local Means Denoising. Image Process. Line 2011, 1, 208–212. [Google Scholar] [CrossRef] [Green Version]
- Froment, J. Parameter-Free Fast Pixelwise Non-Local Means Denoising. Image Process. Line 2014, 4, 300–326. [Google Scholar] [CrossRef] [Green Version]
- Schneller, W.; Leitner, M.; Leuders, S.; Sprauel, J.M.; Grün, F.; Pfeifer, T.; Jantschner, O. Fatigue strength estimation methodology of additively manufactured metallic bulk material. Addit. Manuf. 2020, 39. [Google Scholar] [CrossRef]
- Massey, F.J. The Kolmogorov-Smirnov Test for Goodness of Fit. J. Am. Stat. Assoc. 1951, 46, 68–78. [Google Scholar] [CrossRef]
- Gänser, H.P.; Maierhofer, J.; Christiner, T. Statistical correction for reinserted runouts in fatigue testing. Int. J. Fatigue 2015, 80, 76–80. [Google Scholar] [CrossRef]
- Leitner, H. Simulation des Ermüdungsverhaltens von Aluminiumgusslegierungen. Ph.D. Thesis, Montanuniversität Leoben, Leoben, Austria, 2001. [Google Scholar]
- ASTM International E 739; Standard Practice for Statistical Analysis of Linear or Linearized Stress-Life (S-N) and Strain Life (E-N) Fatigue Data. ASTM International: West Conshohocken, PA, USA, 1998.
- Dengel, D.; Harig, H. Estimation of the fatigue limit by progressively-increasing load tests. Fatigue Fract. Eng. Mater. Struct. 1980, 3, 113–128. [Google Scholar] [CrossRef]
- Solberg, K.; Guan, S.; Razavi, S.M.J.; Welo, T.; Chan, K.C.; Berto, F. Fatigue of additively manufactured 316L stainless steel: The influence of porosity and surface roughness. Fatigue Fract. Eng. Mater. Struct. 2019, 42, 2043–2052. [Google Scholar] [CrossRef] [Green Version]
- Oberreiter, M.; Aigner, R.; Pomberger, S.; Leitner, M.; Stoschka, M. Impact of microstructural properties on the crack threshold of aluminium castings. Eng. Fract. Mech. 2021, 241, 107431. [Google Scholar] [CrossRef]
Figure 1.
Setup of the Kitagawa diagram incorporating size effect (applying modification of El-Haddad).
Figure 1.
Setup of the Kitagawa diagram incorporating size effect (applying modification of El-Haddad).

Figure 2.
Comparison of SDAS values at Positions A–D for high-porosity (HP) and low-porosity (LP) regions in each specimen.
Figure 2.
Comparison of SDAS values at Positions A–D for high-porosity (HP) and low-porosity (LP) regions in each specimen.

Figure 3.
Initial specimen geometry with tested layers (dimensions in millimetres).

Figure 4.
Thin-walled specimen for fatigue testing with a plate thickness of 1.5 mm. (a) Illustration of the thin-walled specimen geometry with main dimensions in millimetres. (b) Numerical analysis of stress concentration factor depicted as the maximum principal stress.
Figure 4.
Thin-walled specimen for fatigue testing with a plate thickness of 1.5 mm. (a) Illustration of the thin-walled specimen geometry with main dimensions in millimetres. (b) Numerical analysis of stress concentration factor depicted as the maximum principal stress.

Figure 5.
Comparison of AlSi-cast specimen cross sections in machined and vibratory finished conditions.
Figure 5.
Comparison of AlSi-cast specimen cross sections in machined and vibratory finished conditions.

Figure 6.
Highly stressed volume of investigated samples.

Figure 7.
Representation of an exemplary CT scan. (a) CT scan of a thick-walled specimen. (b) Projection of clustered pore.
Figure 7.
Representation of an exemplary CT scan. (a) CT scan of a thick-walled specimen. (b) Projection of clustered pore.

Figure 8.
Sphericity over the projected perpendicular to the load direction of the investigated positions evaluated by CT analysis. (a) CT results of thick-walled specimen Pos. A and C. (b) CT results of thick-walled specimen Pos. B.
Figure 8.
Sphericity over the projected perpendicular to the load direction of the investigated positions evaluated by CT analysis. (a) CT results of thick-walled specimen Pos. A and C. (b) CT results of thick-walled specimen Pos. B.

Figure 9.
Distribution of the porosity size in a cross section of the thick-walled specimen geometry for extracting Positions A to C.
Figure 9.
Distribution of the porosity size in a cross section of the thick-walled specimen geometry for extracting Positions A to C.

Figure 10.
CDF of perpendicular to the load direction for all layers of the thick-walled specimen.

Figure 11.
Comparison of normalized S/N-curves for experimentally determined within the framework of this study.
Figure 11.
Comparison of normalized S/N-curves for experimentally determined within the framework of this study.

Figure 12.
Schematic representation of nominal stress in the surface layer.

Figure 13.
SEM fracture surface analysis in the HP and LP specimens. (a) Fracture initiating defect in the HP specimen. (b) Fracture initiating defect at specimen LP.
Figure 13.
SEM fracture surface analysis in the HP and LP specimens. (a) Fracture initiating defect in the HP specimen. (b) Fracture initiating defect at specimen LP.

Figure 14.
Comparison of cumulative defect distribution by fractography with CT results.

Figure 15.
Relation between measured and calculated cumulative defect distributions. (a) Cumulative defect distributions of LP samples. (b) Cumulative defect distributions of HP samples.
Figure 15.
Relation between measured and calculated cumulative defect distributions. (a) Cumulative defect distributions of LP samples. (b) Cumulative defect distributions of HP samples.

Figure 16.
Flowchart of setting up the layer-based assessment methodology.

Figure 17.
Calculated course of the fatigue strength over the cross section of the thick-walled cast specimen.
Figure 17.
Calculated course of the fatigue strength over the cross section of the thick-walled cast specimen.


Table 1.
Nominal chemical composition of the investigated cast alloy EN AC-46200 in weight percent.
| Alloy | Si [%] | Cu [%] | Fe [%] | Mn [%] | Mg [%] | Ti [%] | Al [-] |
|---|---|---|---|---|---|---|---|
| Standard [64] | 7.5–8.5 | 2.0–3.5 | max. 0.8 | 0.15–0.65 | 0.05–0.55 | max. 0.25 | balance |
| Experiment | 7.96 | 3.13 | 0.43 | 0.32 | 0.25 | 0.13 | balance |
Table 2.
Quasistatic properties of the investigated material.
| HT | E [GPa] | TS [MPa] | YS0.1 [%] | A [%] |
|---|---|---|---|---|
| T6 | 73.6 | 272 | 258 | 0.19 |
| HIP + T6 | 74.7 | 319 | 244 | 1.78 |
Table 3.
CT parameters used for computed tomography.
| Parameter | Value |
|---|---|
| Voltage [kV] | 111 |
| Intensity of current [µA] | 142 |
| Number of images [-] | 785 |
| FDD [mm] | 1000 |
| FOD [mm] | 75 |
| Exposure time [ms] | 1000 |
| Voxel size [µm] | 15 |
Table 4.
The effect of clustering for high and low porosity sections.
| Pos. | Clustered | [µm] | [µm] | [µm] |
|---|---|---|---|---|
| LP | no | 131 | 191 | 108 |
| LP | yes | 134 | 190 | 120 |
| HP | no | 626 | 858 | 459 |
| HP | yes | 728 | 1117 | 523 |
Table 5.
Results of the fatigue tests of the investigated layers.
| Position | HT | Loading Type | [-] | [-] | [-] | [-] |
|---|---|---|---|---|---|---|
| LP | T6 | tension | 4.6 | 0.49 | 920,000 | 1:1.3 |
| HP | T6 | tension | 3.7 | 0.35 | 530,000 | 1:1.19 |
| SL | T6 | bending | 4.8 | 0.47 | 1,300,000 | 1:1.24 |
| BM | HIP + T6 | tension | 1.01 | 1.00 | 330,000 | 1:1.06 |
Table 6.
Comparison of fractography and computed tomography.
| Pos. | Investigation | [µm] | [µm] | [µm] |
|---|---|---|---|---|
| LP | Frac. | 173 | 275 | 101 |
| LP | CT | 134 | 190 | 120 |
| HP | Frac. | 740 | 977 | 512 |
| HP | CT | 728 | 1117 | 523 |
Table 7.
Comparison of statistically evaluated -parameters for 50% probability of occurrence considering the effect of HSV.
Table 7.
Comparison of statistically evaluated -parameters for 50% probability of occurrence considering the effect of HSV.
| Pos. | [µm] | [µm] | [µm] | [µm] | [%] |
|---|---|---|---|---|---|
| LP | 104 | 134 | 122 | −12 | −9.8 |
| HP | 522 | 728 | 716 | −11 | −1.7 |
Table 8.
Comparison of the normalized fatigue strength based on the model and the experiment.
| Pos. | Model [-] | Experiment [-] | [%] |
|---|---|---|---|
| SL | 0.42 | 0.47 | 11.9 |
| HP | 0.3 | 0.34 | 12.9 |
| LP | 0.5 | 0.49 | −2.6 |
Publisher’s Note: MDPI stays neutral with regard to jurisdictional claims in published maps and institutional affiliations. |
© 2022 by the authors. Licensee MDPI, Basel, Switzerland. This article is an open access article distributed under the terms and conditions of the Creative Commons Attribution (CC BY) license (https://creativecommons.org/licenses/by/4.0/).
Share and Cite
MDPI and ACS Style
Oberreiter, M.; Fladischer, S.; Stoschka, M.; Leitner, M. A Probabilistic Fatigue Strength Assessment in AlSi-Cast Material by a Layer-Based Approach. Metals 2022, 12, 784. https://0-doi-org.brum.beds.ac.uk/10.3390/met12050784
AMA Style
Oberreiter M, Fladischer S, Stoschka M, Leitner M. A Probabilistic Fatigue Strength Assessment in AlSi-Cast Material by a Layer-Based Approach. Metals. 2022; 12(5):784. https://0-doi-org.brum.beds.ac.uk/10.3390/met12050784
Chicago/Turabian StyleOberreiter, Matthias, Stefan Fladischer, Michael Stoschka, and Martin Leitner. 2022. "A Probabilistic Fatigue Strength Assessment in AlSi-Cast Material by a Layer-Based Approach" Metals 12, no. 5: 784. https://0-doi-org.brum.beds.ac.uk/10.3390/met12050784
Note that from the first issue of 2016, this journal uses article numbers instead of page numbers. See further details here.